Headlines
|
|
Bond sentiment has bottomed after a bout of panic:
Sentiment on bonds troughed at a very low level in late November. It has rebounded since then, suggesting sentiment has troughed. Other indicators show heavy pessimism against the idea that bond prices can rise substantially. This is usually a good sign.
Bottom Line:
STOCKS: Hold By early October, sentiment had reset. Several important momentum streaks ended, which has brought in buyers in the past, and seasonality turned positive. We're now seeing signs that sentiment has quickly shifted, especially among options traders. It's gotten to an extreme that has preceded weaker-than-average returns.
BONDS: Hold In late October, sentiment on bonds - from Treasuries to corporates - entered pessimistic territory. It's now starting to recover, with some quick moves in corporate bonds. We'll see if those bonds, in particular, can hold recent gains.
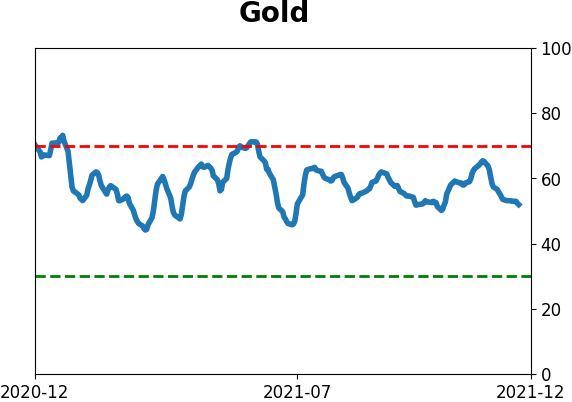
GOLD: Hold
Gold and miners were rejected after trying to recover above their 200-day averages in May. Some oversold extremes in breadth measures among miners triggered in late September, and they've recovered a bit since then. The group still has some proving to do.
|
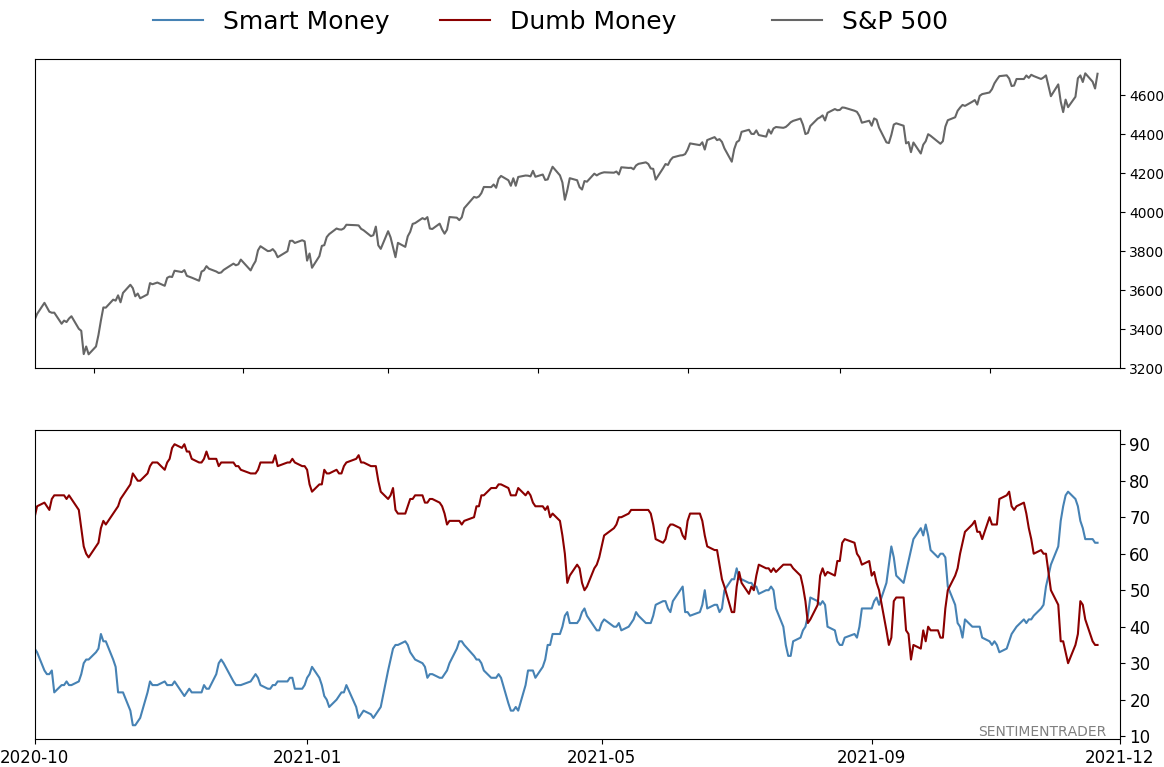
Smart / Dumb Money Confidence
|
Smart Money Confidence: 63%
Dumb Money Confidence: 35%
|
|
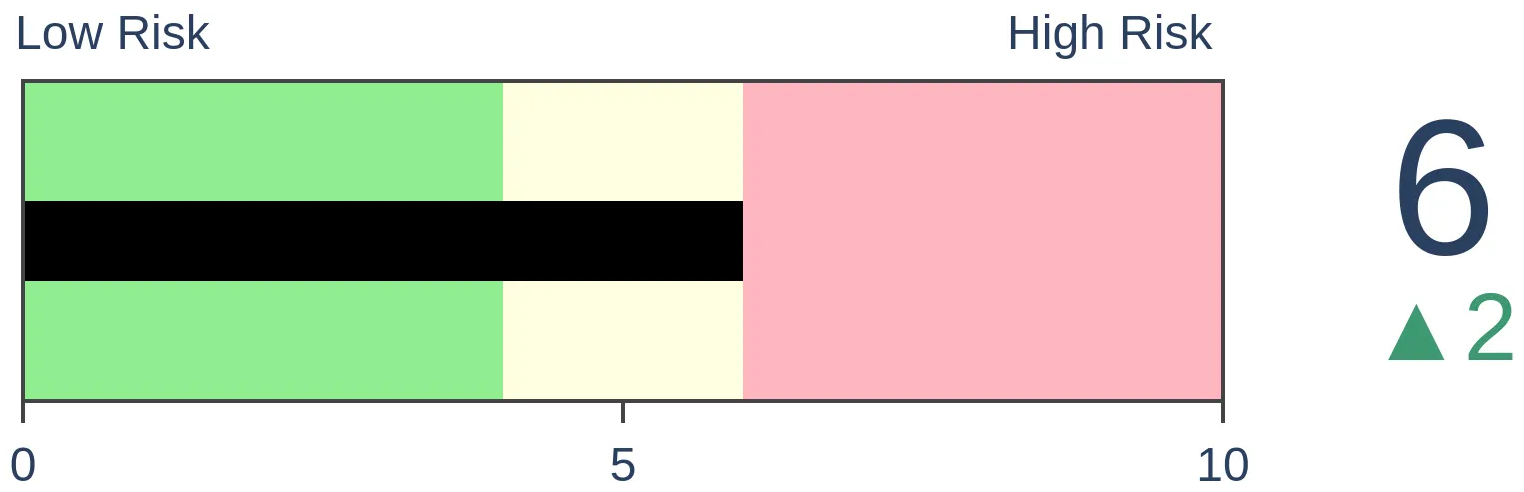
Risk Levels
Stocks Short-Term
|
Stocks Medium-Term
|
|
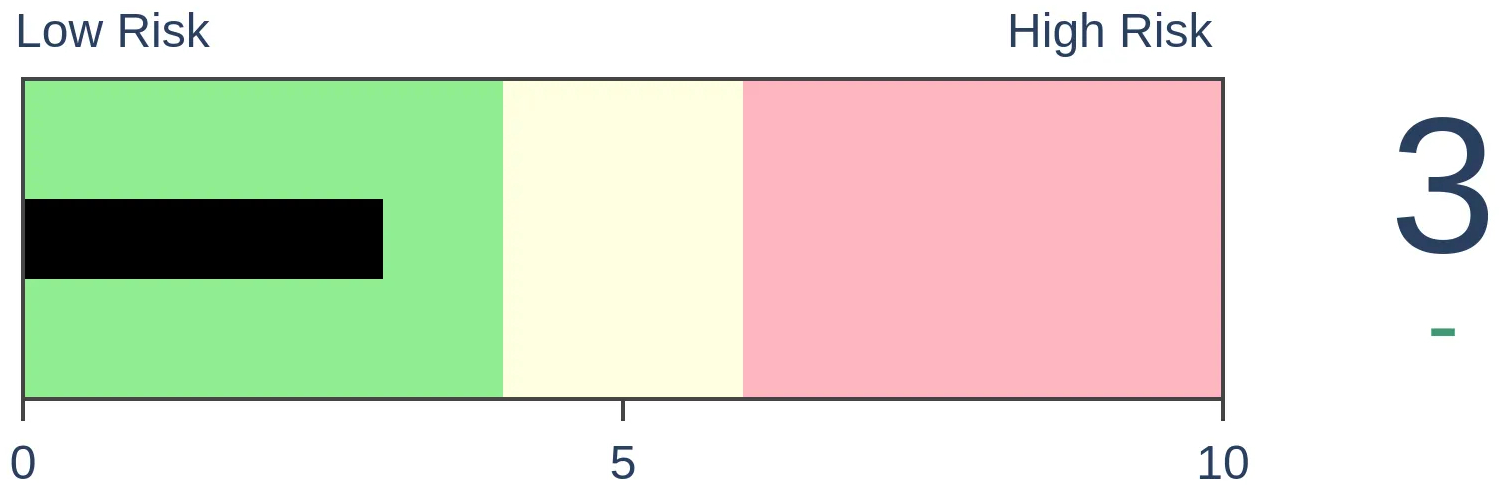
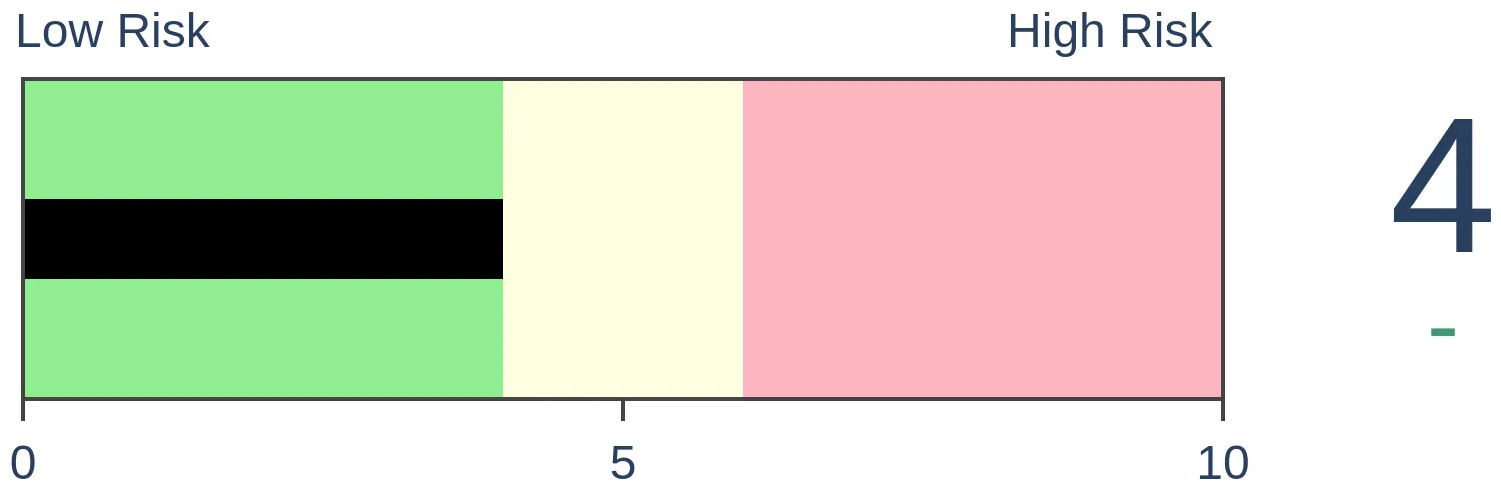
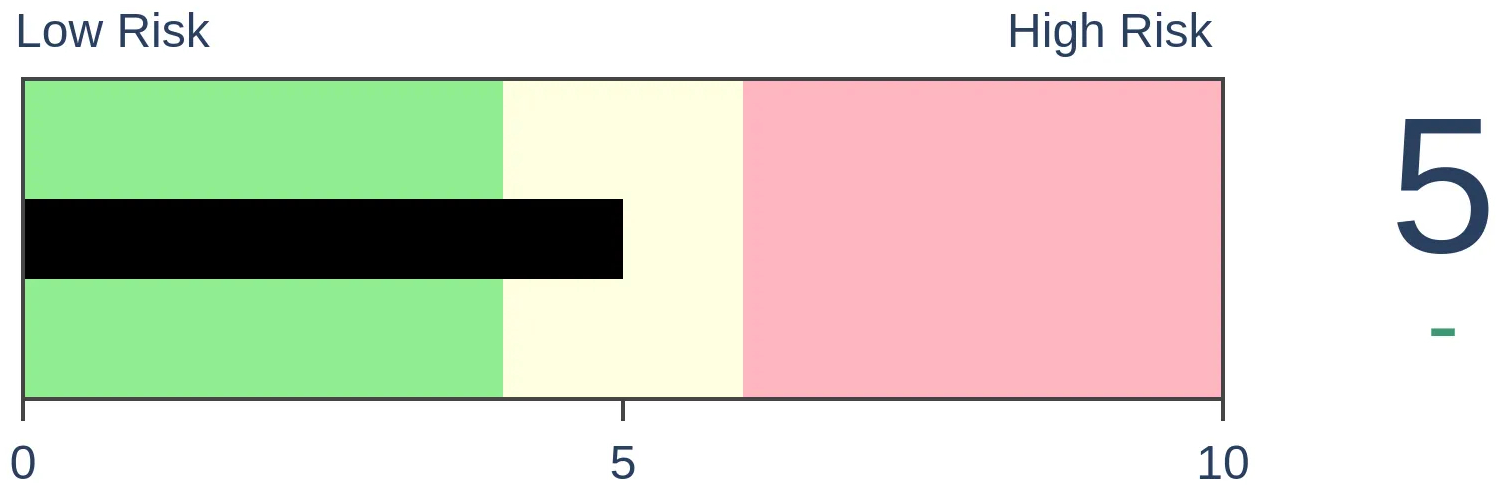
Bonds

|
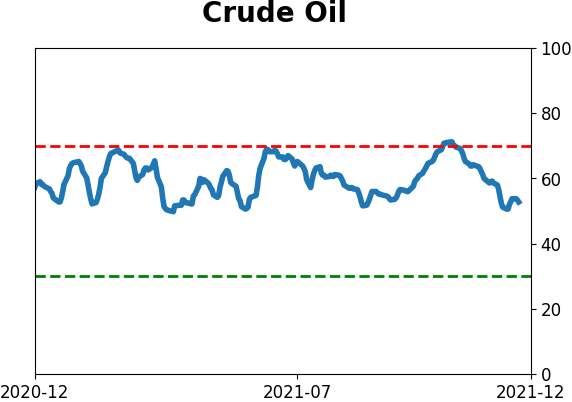
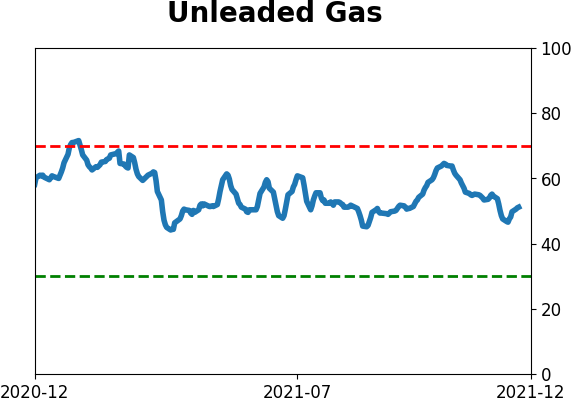
Crude Oil
|
|
Gold
|
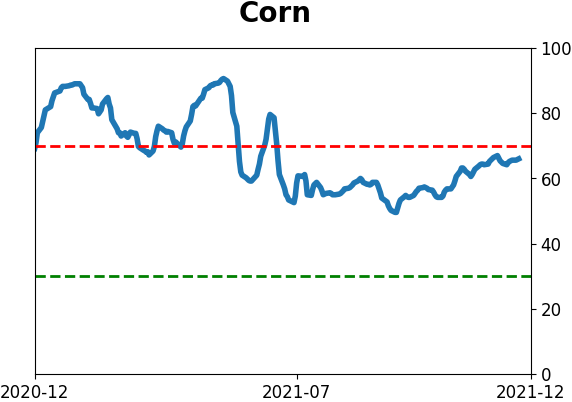
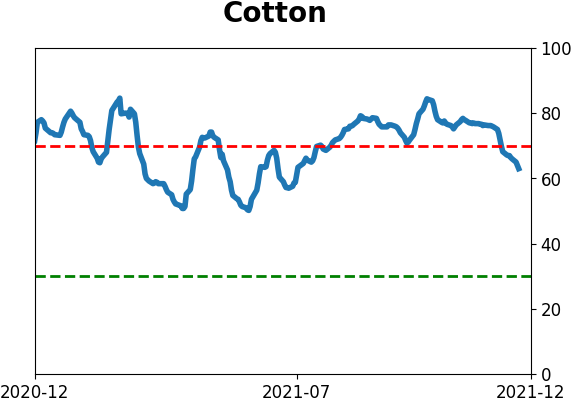
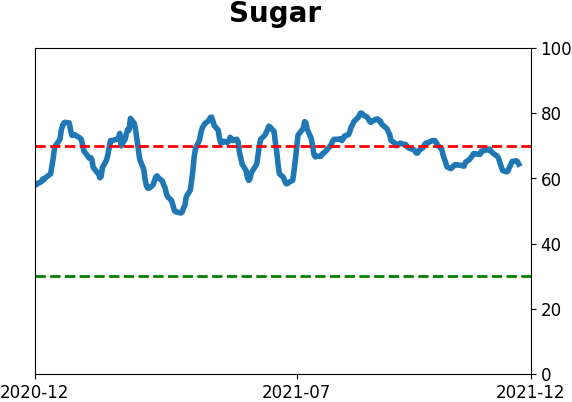
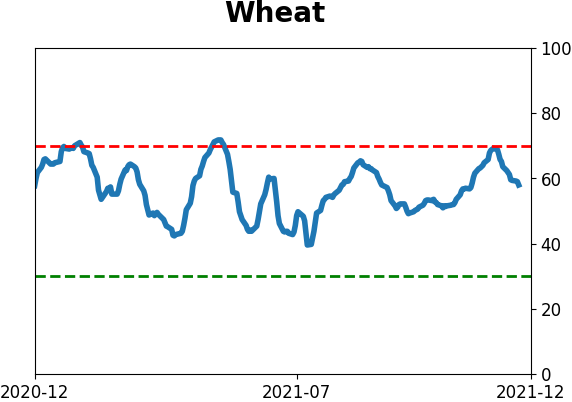
Agriculture

|
|
Research
By Jason Goepfert
BOTTOM LINE
Sentiment on bonds troughed at a very low level in late November. It has rebounded since then, suggesting sentiment has troughed. Other indicators show heavy pessimism against the idea that bond prices can rise substantially. This is usually a good sign.
FORECAST / TIMEFRAME
None
|
Key points:
- Sentiment on bonds reached a pessimistic extreme in November and has potentially troughed
- Other indicators show extreme skepticism that bond prices can rise substantially
- These signs have a decent record of delivering positive returns for Treasury bond prices
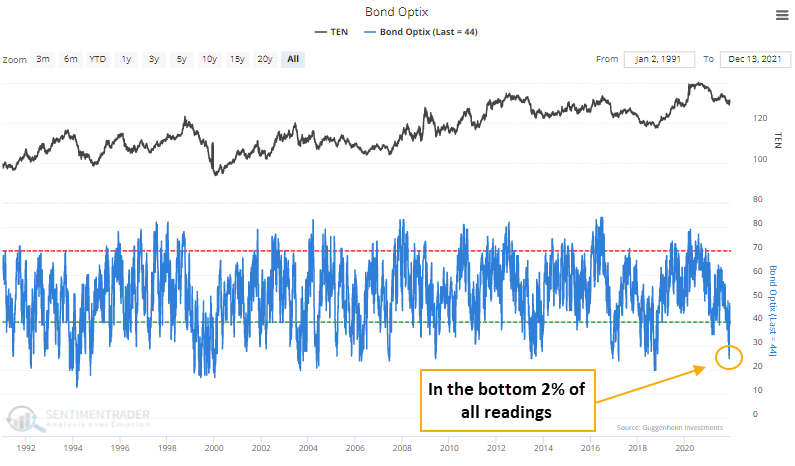
Recent optimism was in the bottom 2% of days
Investors ditched bonds a few weeks ago, and now they're gingerly coming back.
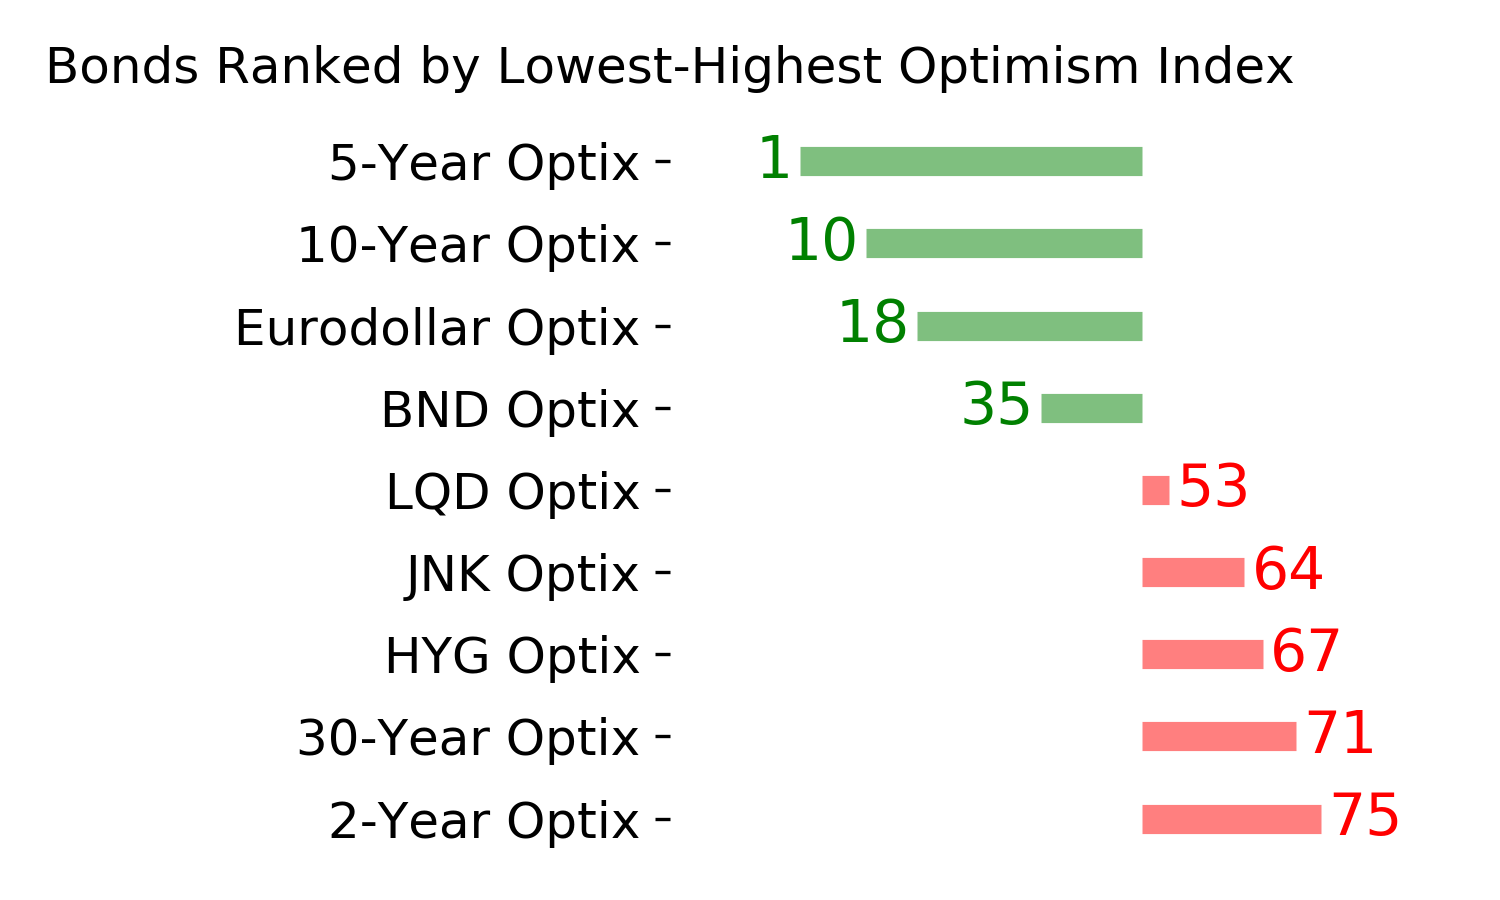
The Optimism Index (Optix) for bonds plunged to 25% in late November. Since then, it has rebounded and not set another low, raising the possibility that sentiment has troughed.
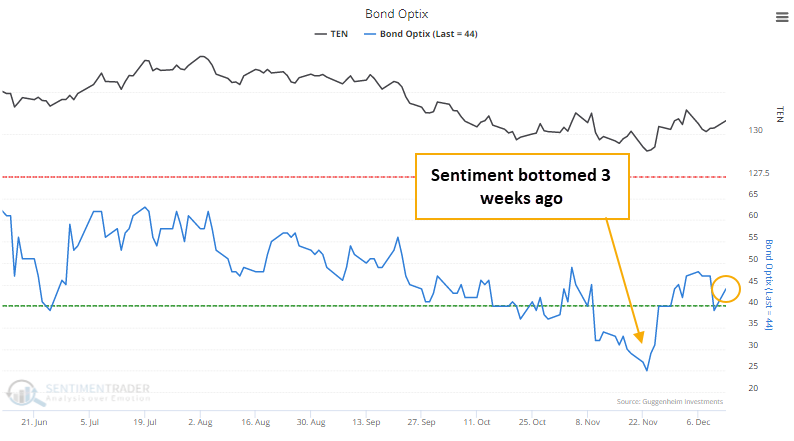
That heavy pessimism from before Thanksgiving was in the bottom 2% of all days in the past 30 years.
Let's make the assumption that not setting a lower low in sentiment for 15 consecutive days, after recording a reading below 30%, suggests that investors have finished panicking. Then we can see if that improved forward returns. For 10-year Treasury futures, it did, but only modestly.
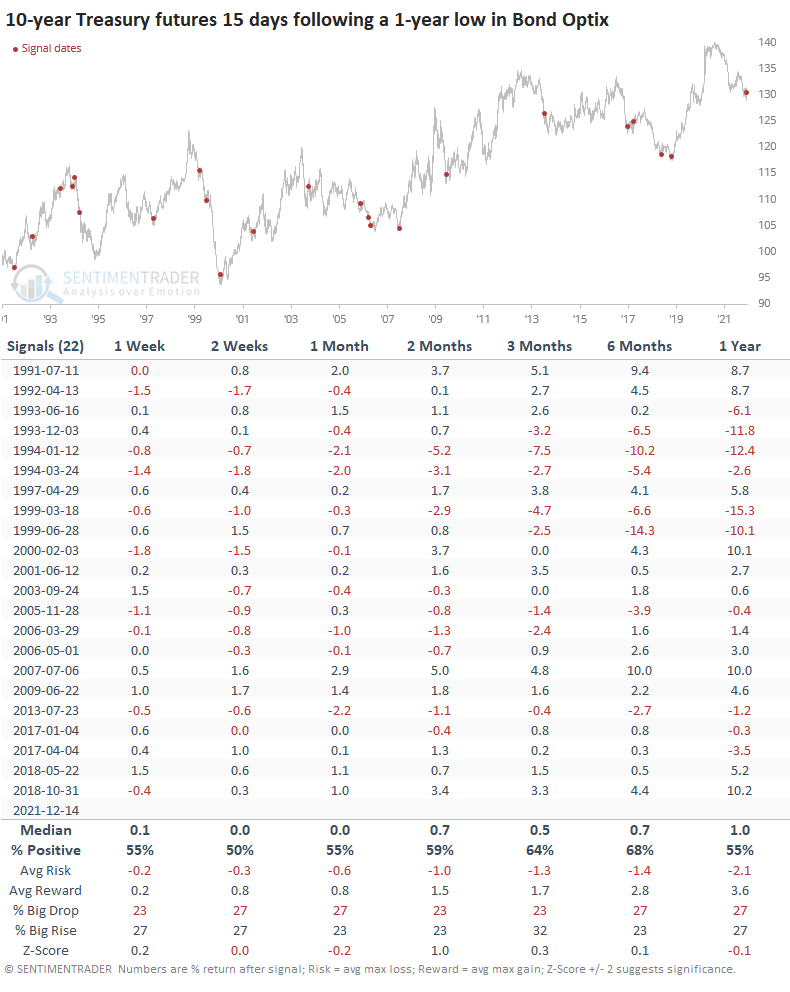
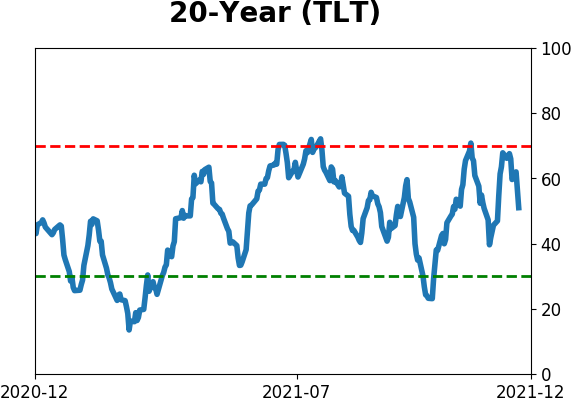
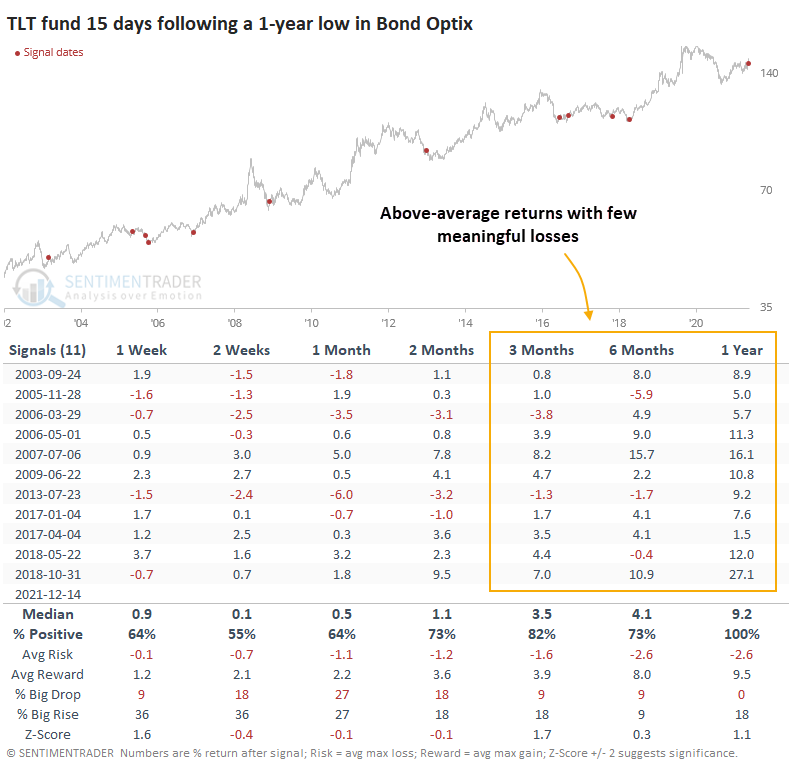
The problem was multiple false positives during a couple of big drops in bonds in the mid-and late-1990s. When we switch to the TLT fund, returns were excellent in large part because it avoided those ugly episodes.
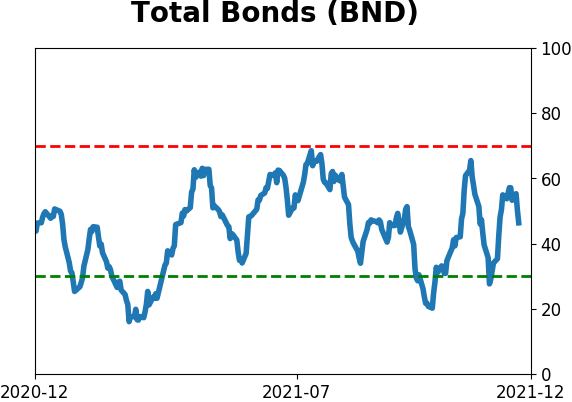
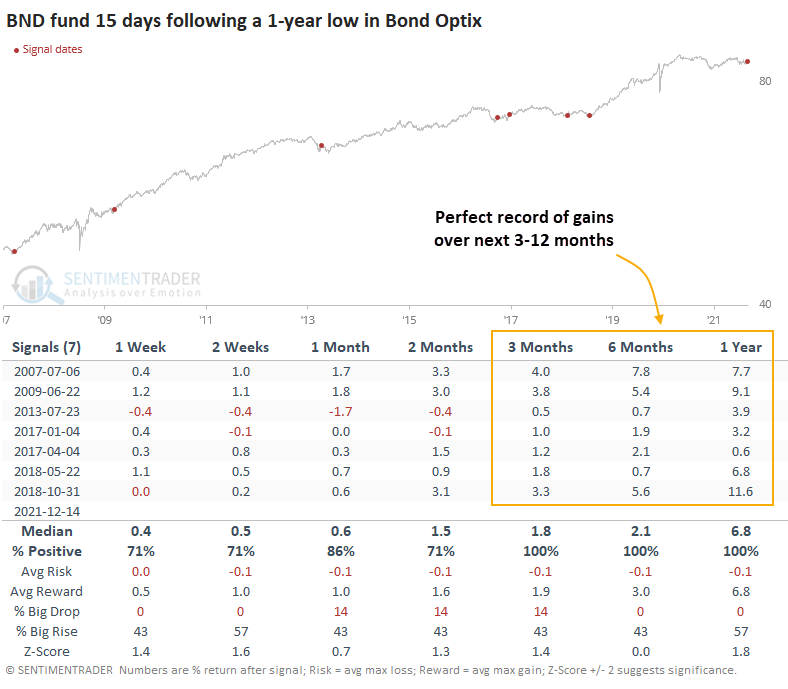
The BND fund has even less history but is a broader fund though still heavily influenced by the action in Treasuries.
Other measures show skepticism
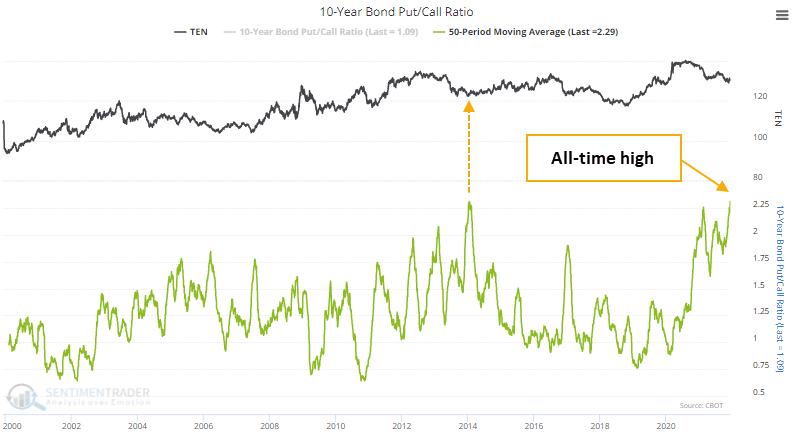
Looking at some other measures of sentiment toward bonds, a 50-day average of the put/call ratio on 10-year Treasury futures just ticked up to an all-time high. That exceeds the prior record from January 2014, which preceded a 2.5-year run in Treasuries.
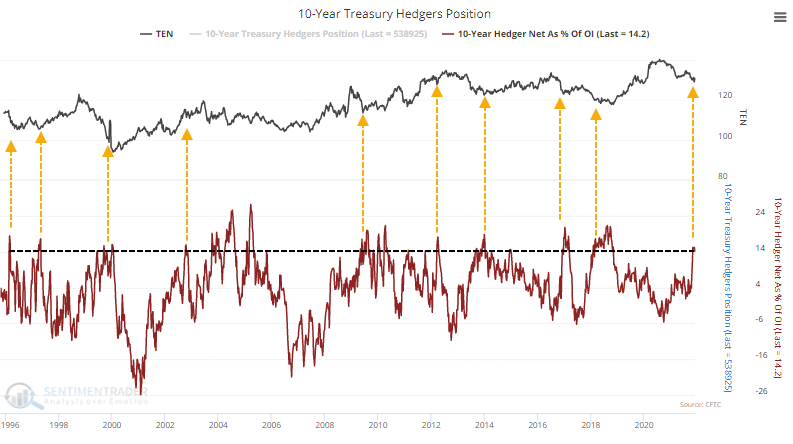
At the same time, "smart money" commercial hedgers are holding more than 14% of open interest in 10-year Treasury futures net long, among their most significant exposures ever.
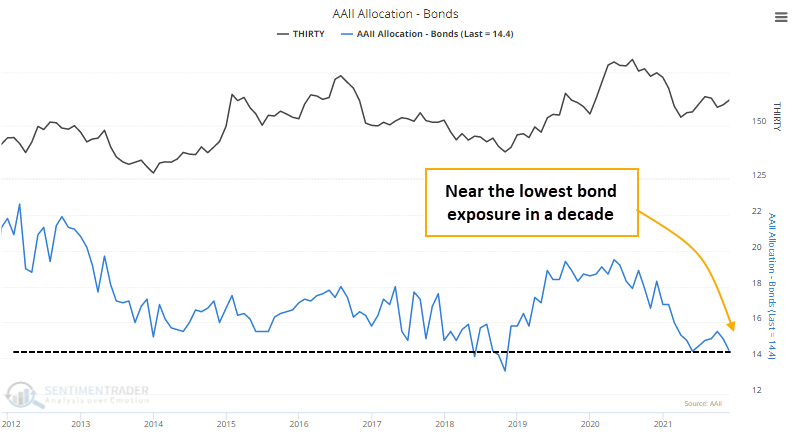
Surveys show little appetite for bonds, as investors are bombarded with the narrative about the dangers of holding fixed income securities during a period of high inflation. Individual investors are holding nearly a decade-low exposure to bonds at 14.4% of their portfolios. Before the last decade, they sometimes held less than 10% of their portfolios in bonds, so it can get quite a bit lower.
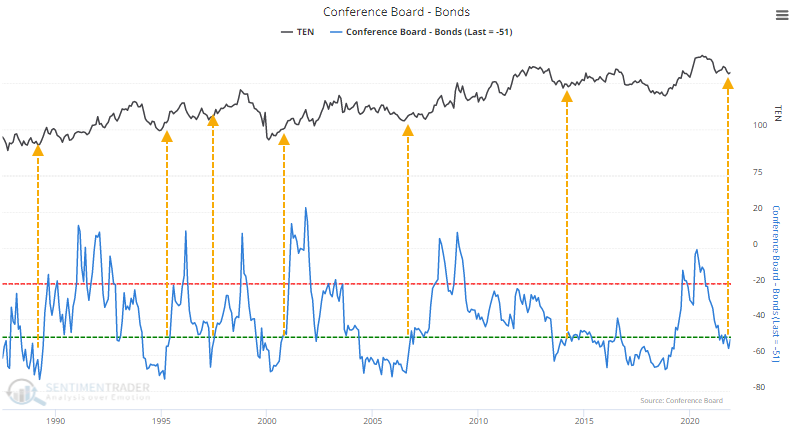
Similarly, U.S. consumers are pessimistic on bonds. More than 62% of consumers expect interest rates to rise (bond prices fall), while only 11% expect rates to drop (bond prices rise). Recent readings have been in the bottom 25% of all months since 1988.
None of these are perfect but generally precede rising bond prices after similar readings. The biggest challenge, as usual, is whether the environment we face now is anything like any other period in history, much less just the past 30 years.
What the research tells us...
We don't try to guess future macroeconomic conditions or their likely impact on markets. Instead, we focus on what's happening right now and how investors react to it. And those indications are that investors are anxious about the potential for rising rates, as they hold few bonds relative to other assets and are hedging against further declines in bond prices. Sentiment has recovered from the extreme pessimism of a few weeks ago, suggesting the latest mini-panic has subsided. While fundamental forces can always overwhelm any technical extremes, the past 20 years of similar behavior preceded medium-term gains for broad bond funds.
Active Studies
| Time Frame | Bullish | Bearish | | Short-Term | 2 | 3 | | Medium-Term | 13 | 2 | | Long-Term | 16 | 8 |
|
Indicators at Extremes
Portfolio
| Position | Description | Weight % | Added / Reduced | Date | | Stocks | RSP | 10.7 | Added 6.4% | 2021-10-01 | | Bonds | 32.7% BND, 7.1% SCHP | 39.8 | Added 8.3% | 2021-10-26 | | Commodities | GCC | 2.4 | Reduced 2.1%
| 2020-09-04 | | Precious Metals | GDX | 4.6 | Reduced 4.2% | 2021-05-19 | | Special Situations | 9.8% KWEB, 4.7% XLE, 2.9% PSCE | 17.3 | Added 9.78% | 2021-10-01 | | Cash | | 24.1 | | |
|
Updates (Changes made today are underlined)
Much of our momentum and trend work has remained positive for several months, with some scattered exceptions. Almost all sentiment-related work has shown a poor risk/reward ratio for stocks, especially as speculation drove to record highs in exuberance in February. Much of that has worn off, and most of our models are back toward neutral levels. There isn't much to be excited about here. The same goes for bonds and even gold. Gold has been performing well lately and is back above long-term trend lines. The issue is that it has a poor record of holding onto gains when attempting a long-term trend change like this, so we'll take a wait-and-see approach. Momentum has ebbed quickly in recent weeks, and nearing oversold levels in some indicators. This can be a dangerous area, with a lot of short-term volatility, but we'd be more inclined to add medium- to long-term exposure rather than sell on much more of a decline, thanks to already rock-bottom exposure. Other areas look more attractive, including some overseas markets. RETURN YTD: 8.0% 2020: 8.1%, 2019: 12.6%, 2018: 0.6%, 2017: 3.8%, 2016: 17.1%, 2015: 9.2%, 2014: 14.5%, 2013: 2.2%, 2012: 10.8%, 2011: 16.5%, 2010: 15.3%, 2009: 23.9%, 2008: 16.2%, 2007: 7.8%
|
|
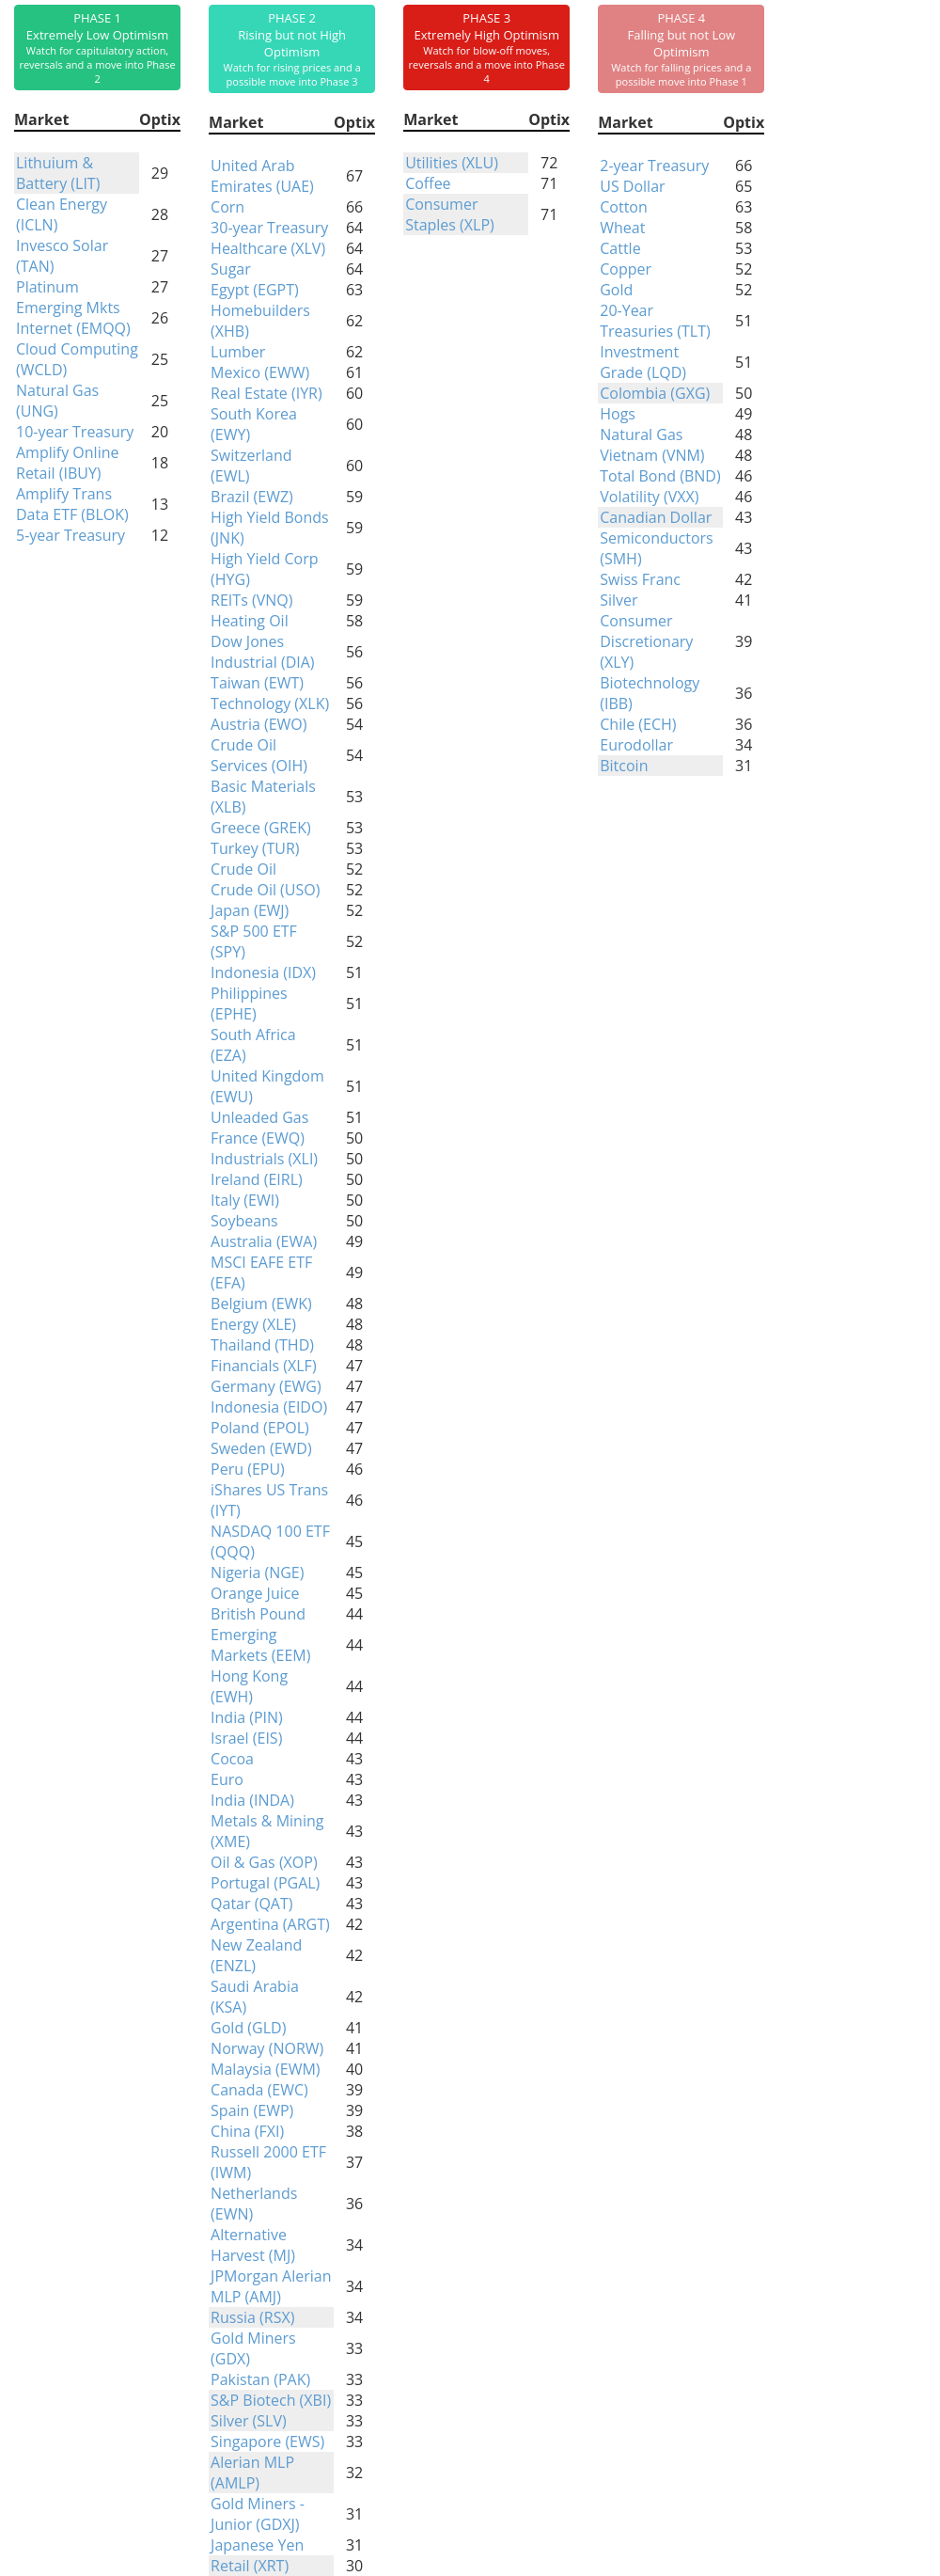
Phase Table
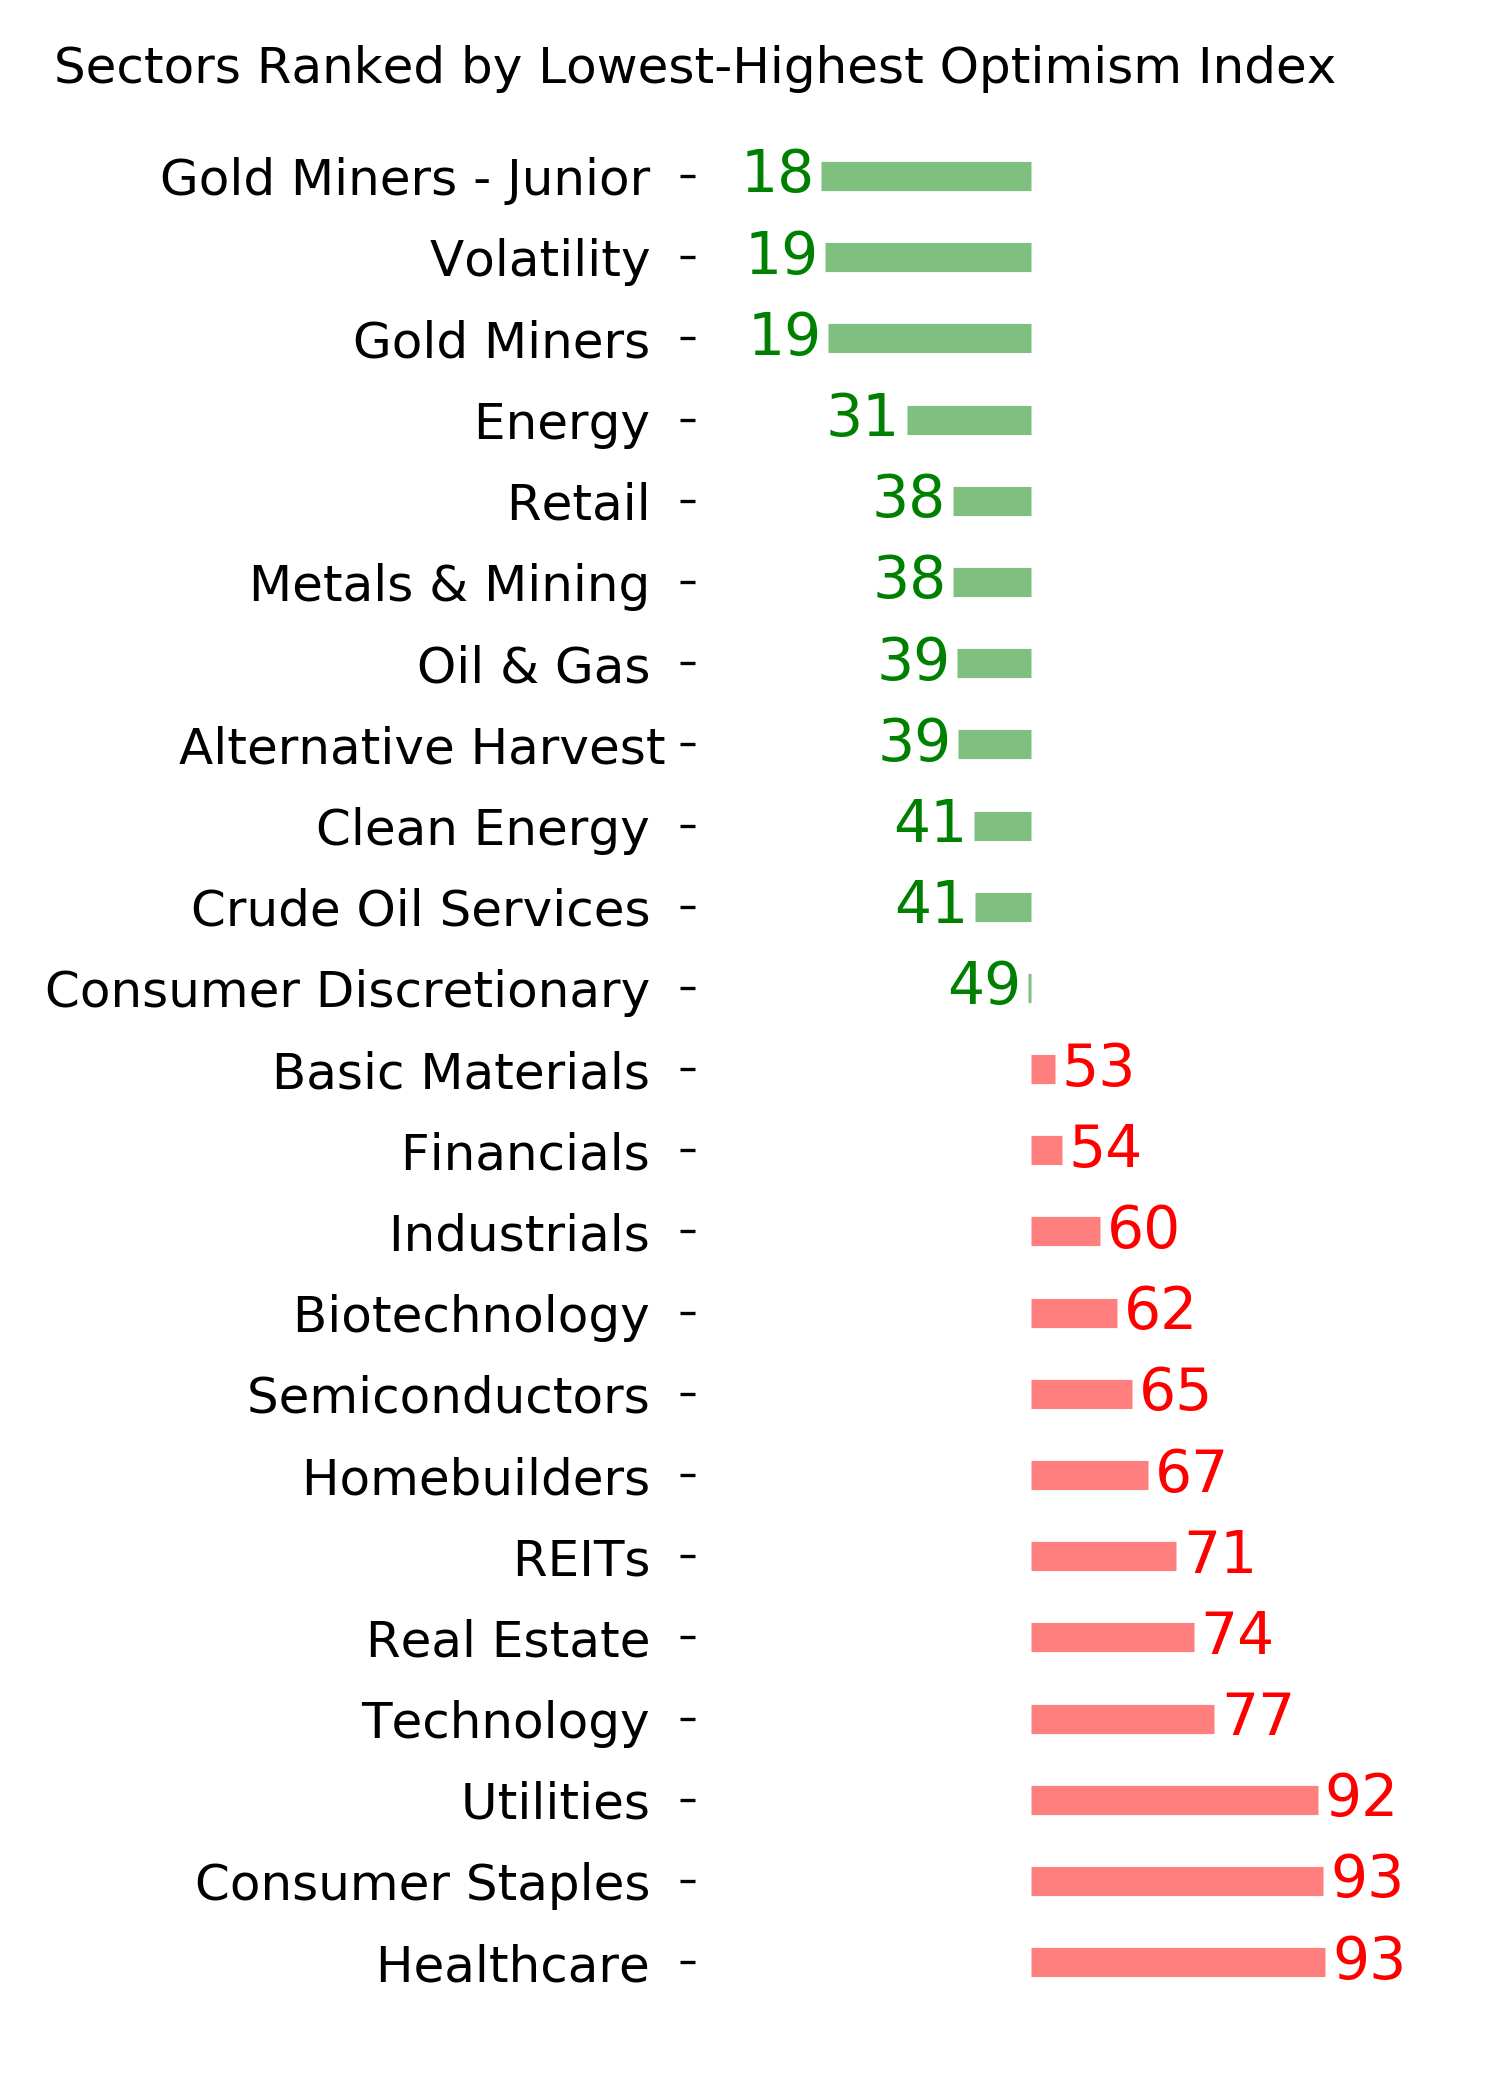
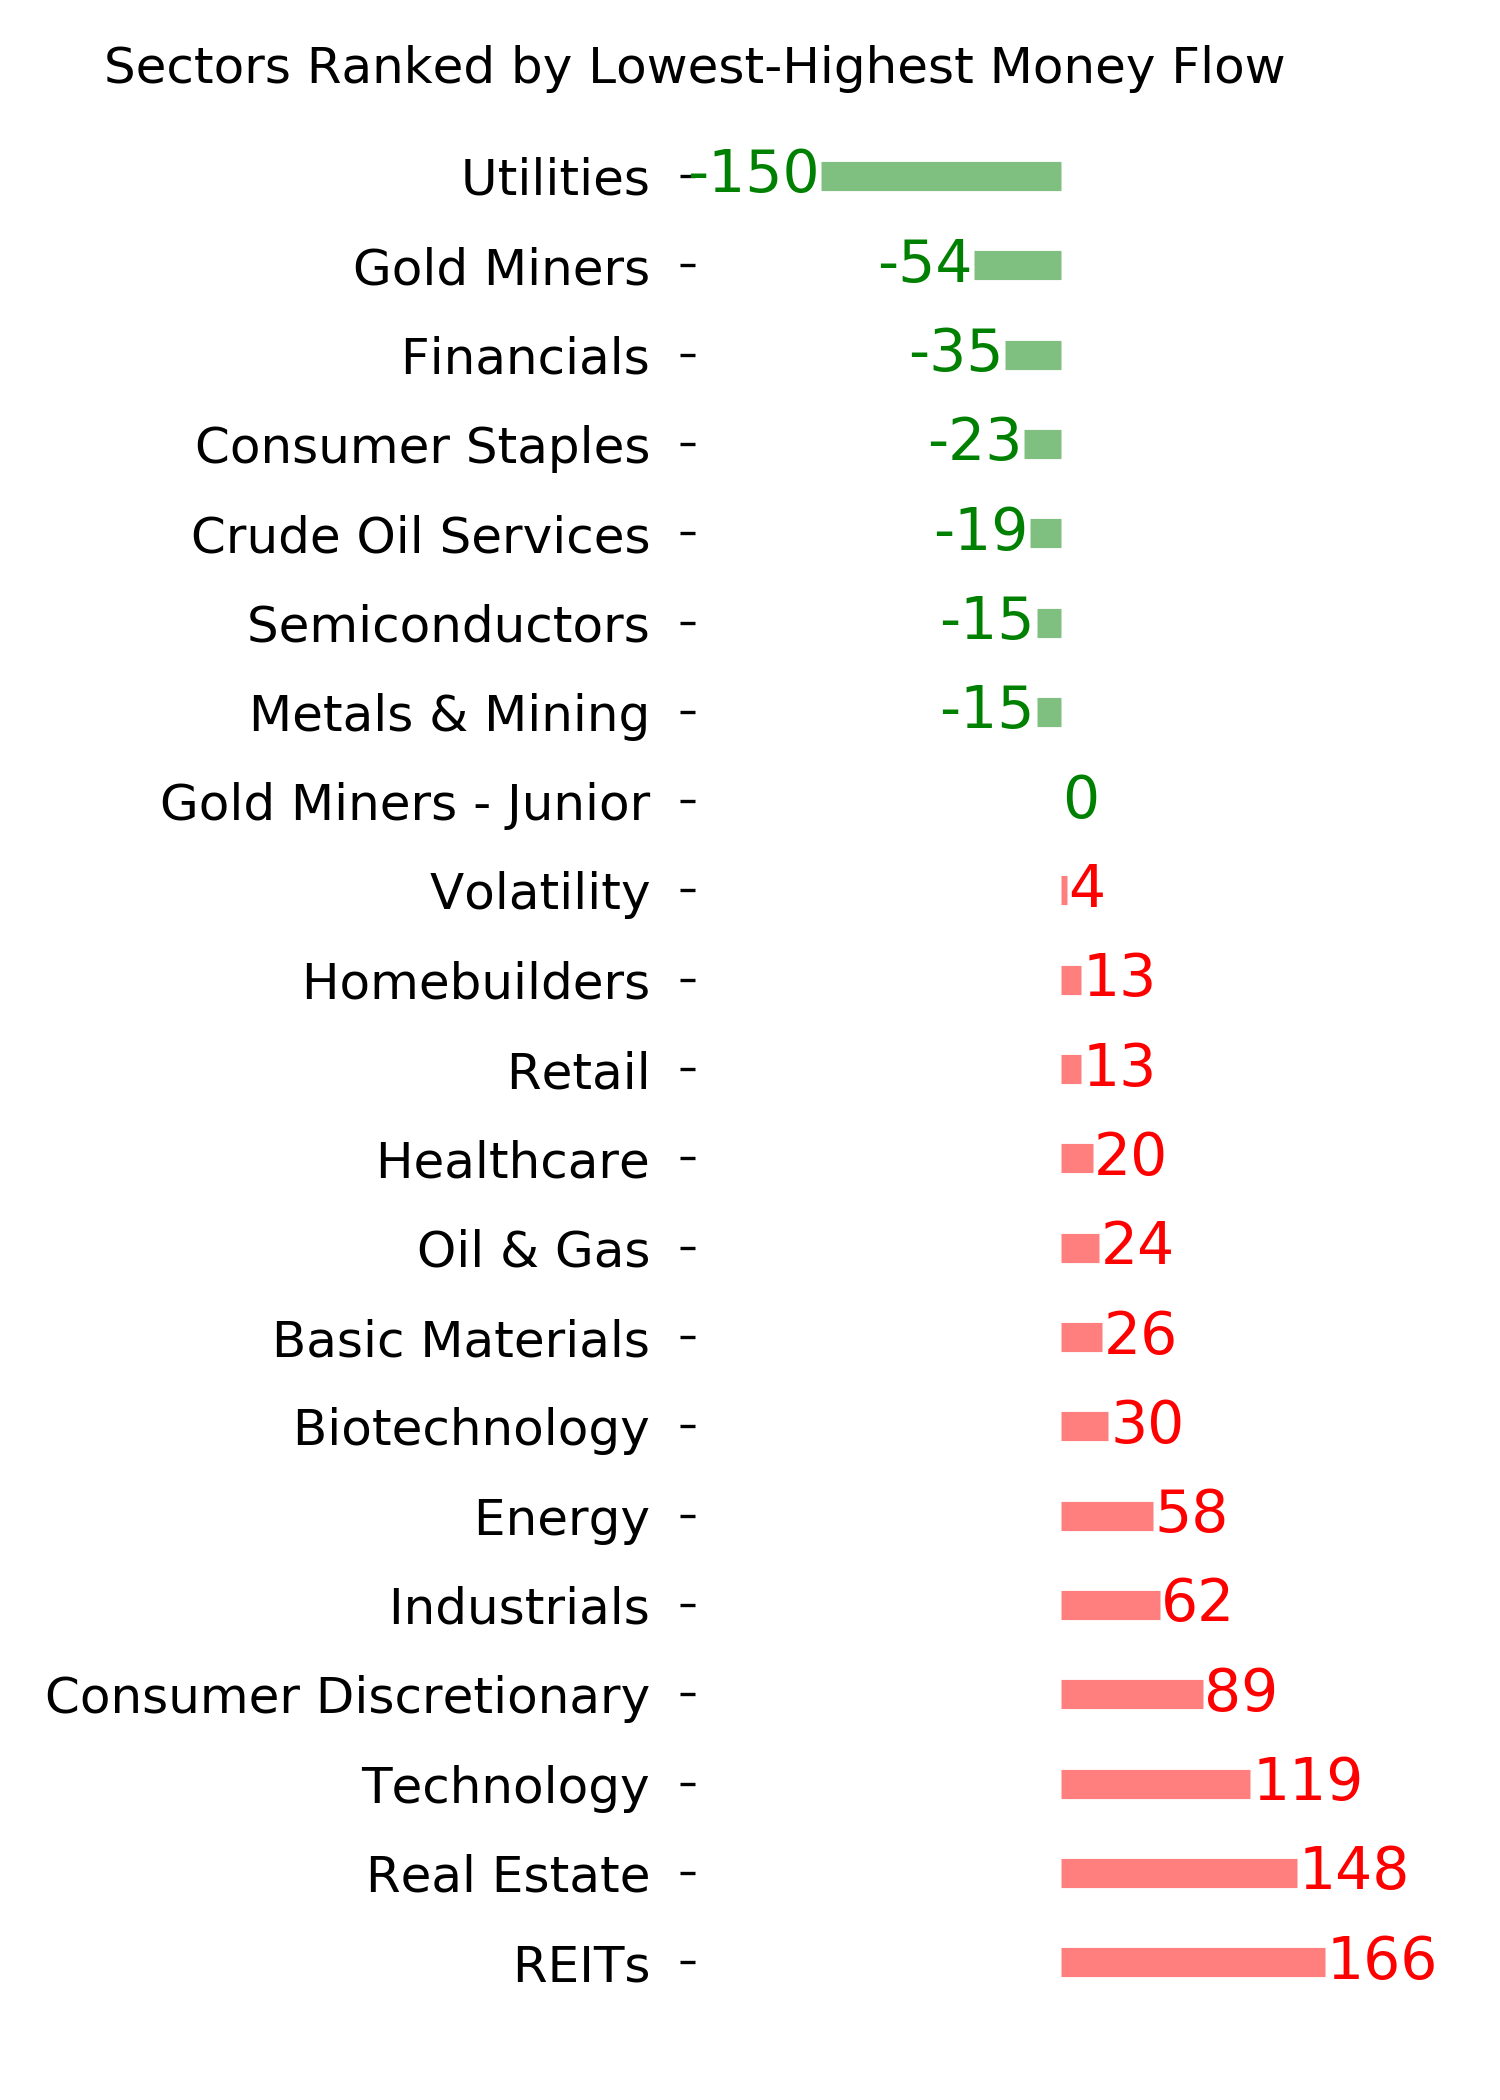
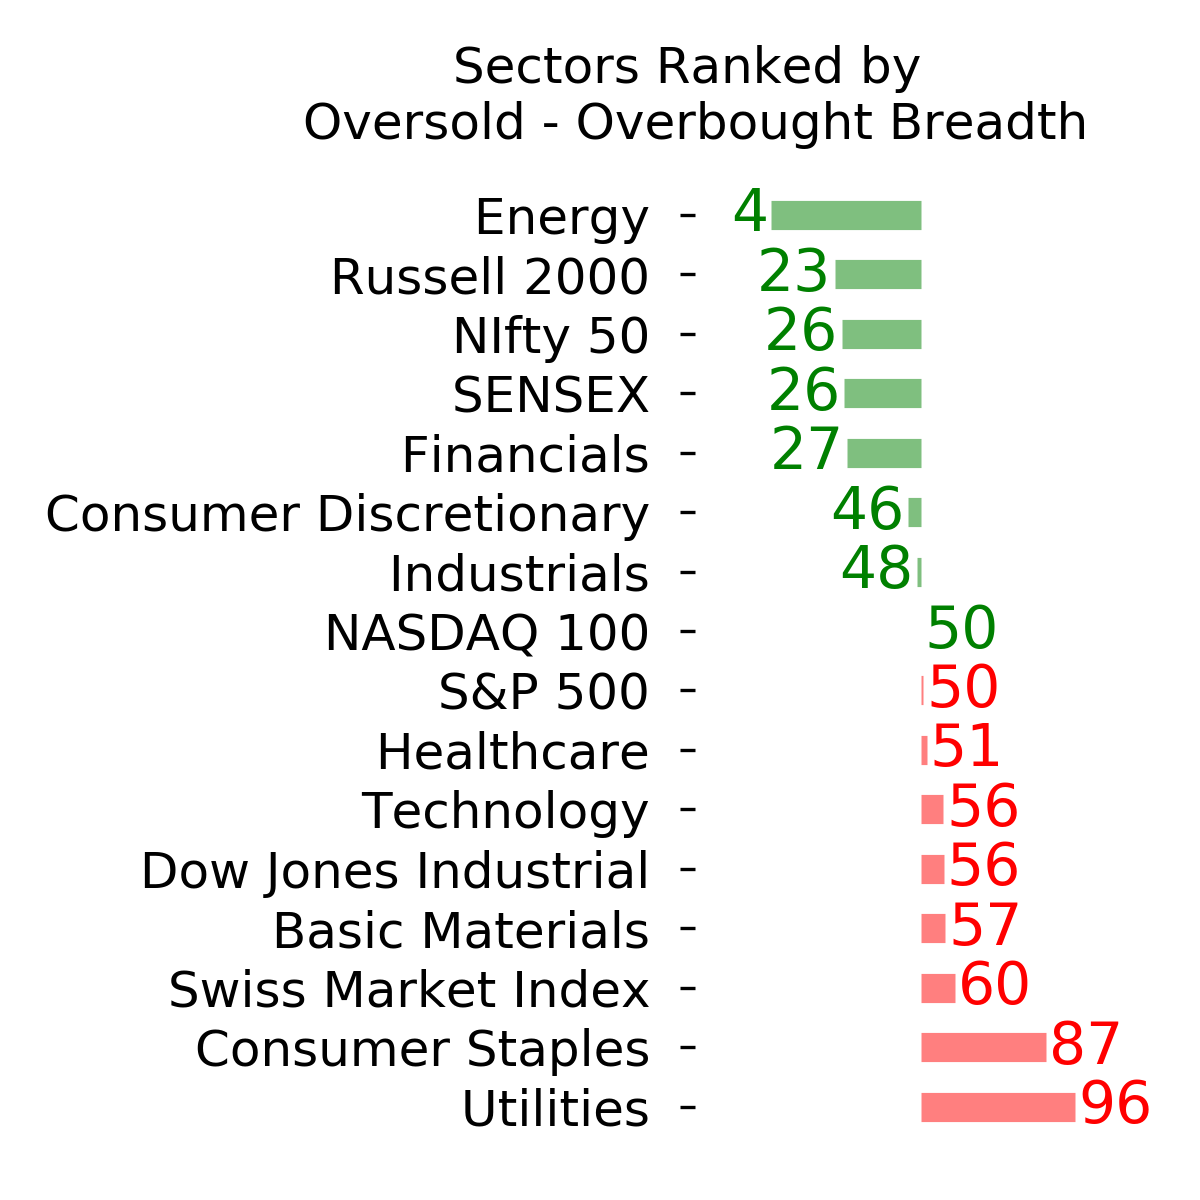
Ranks
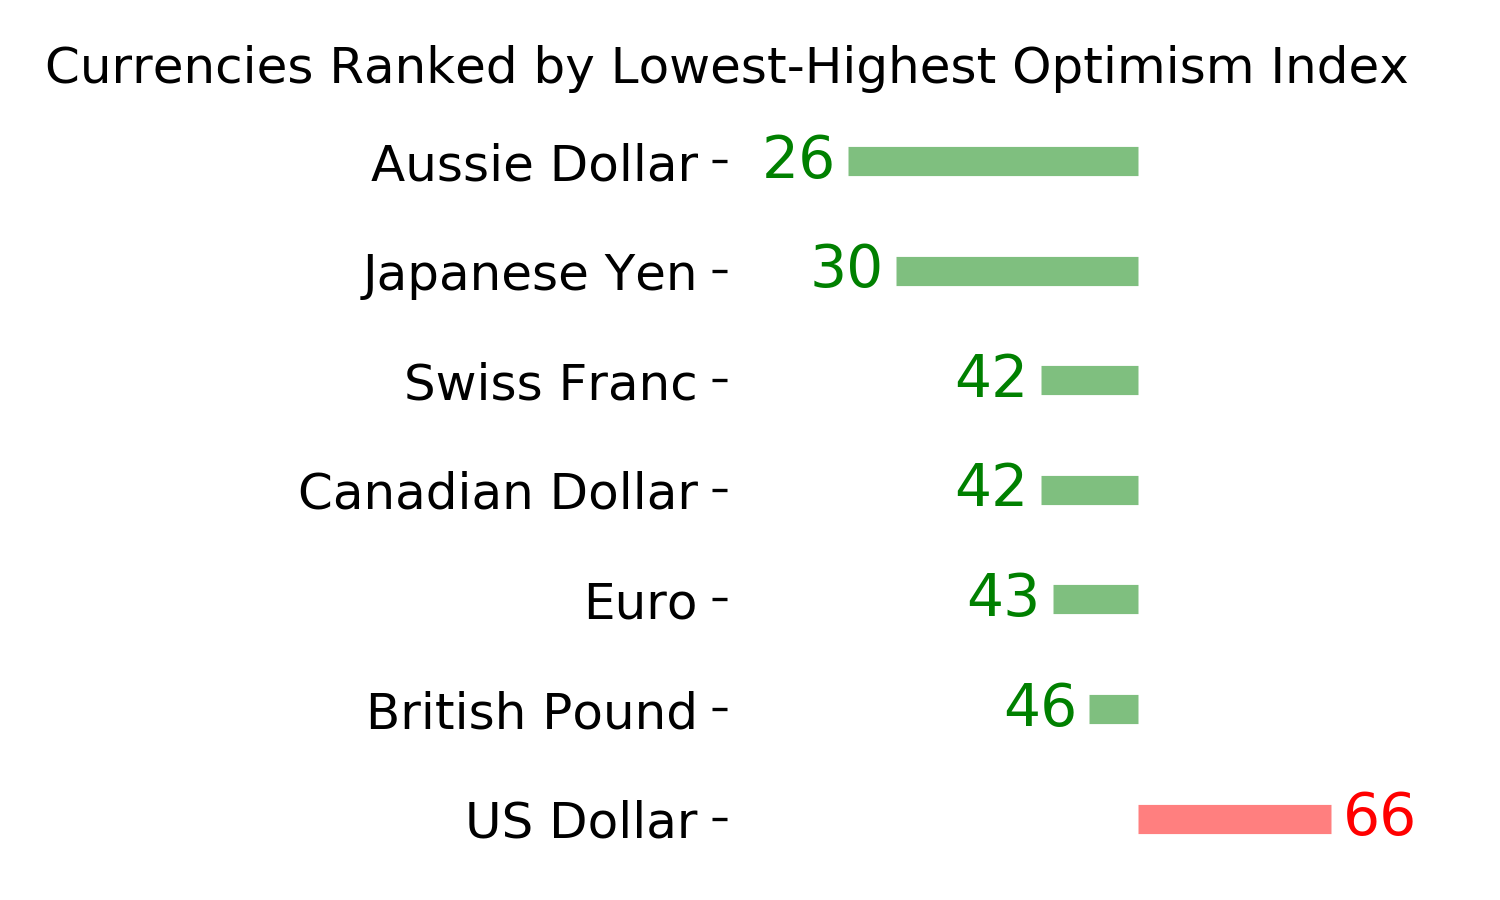
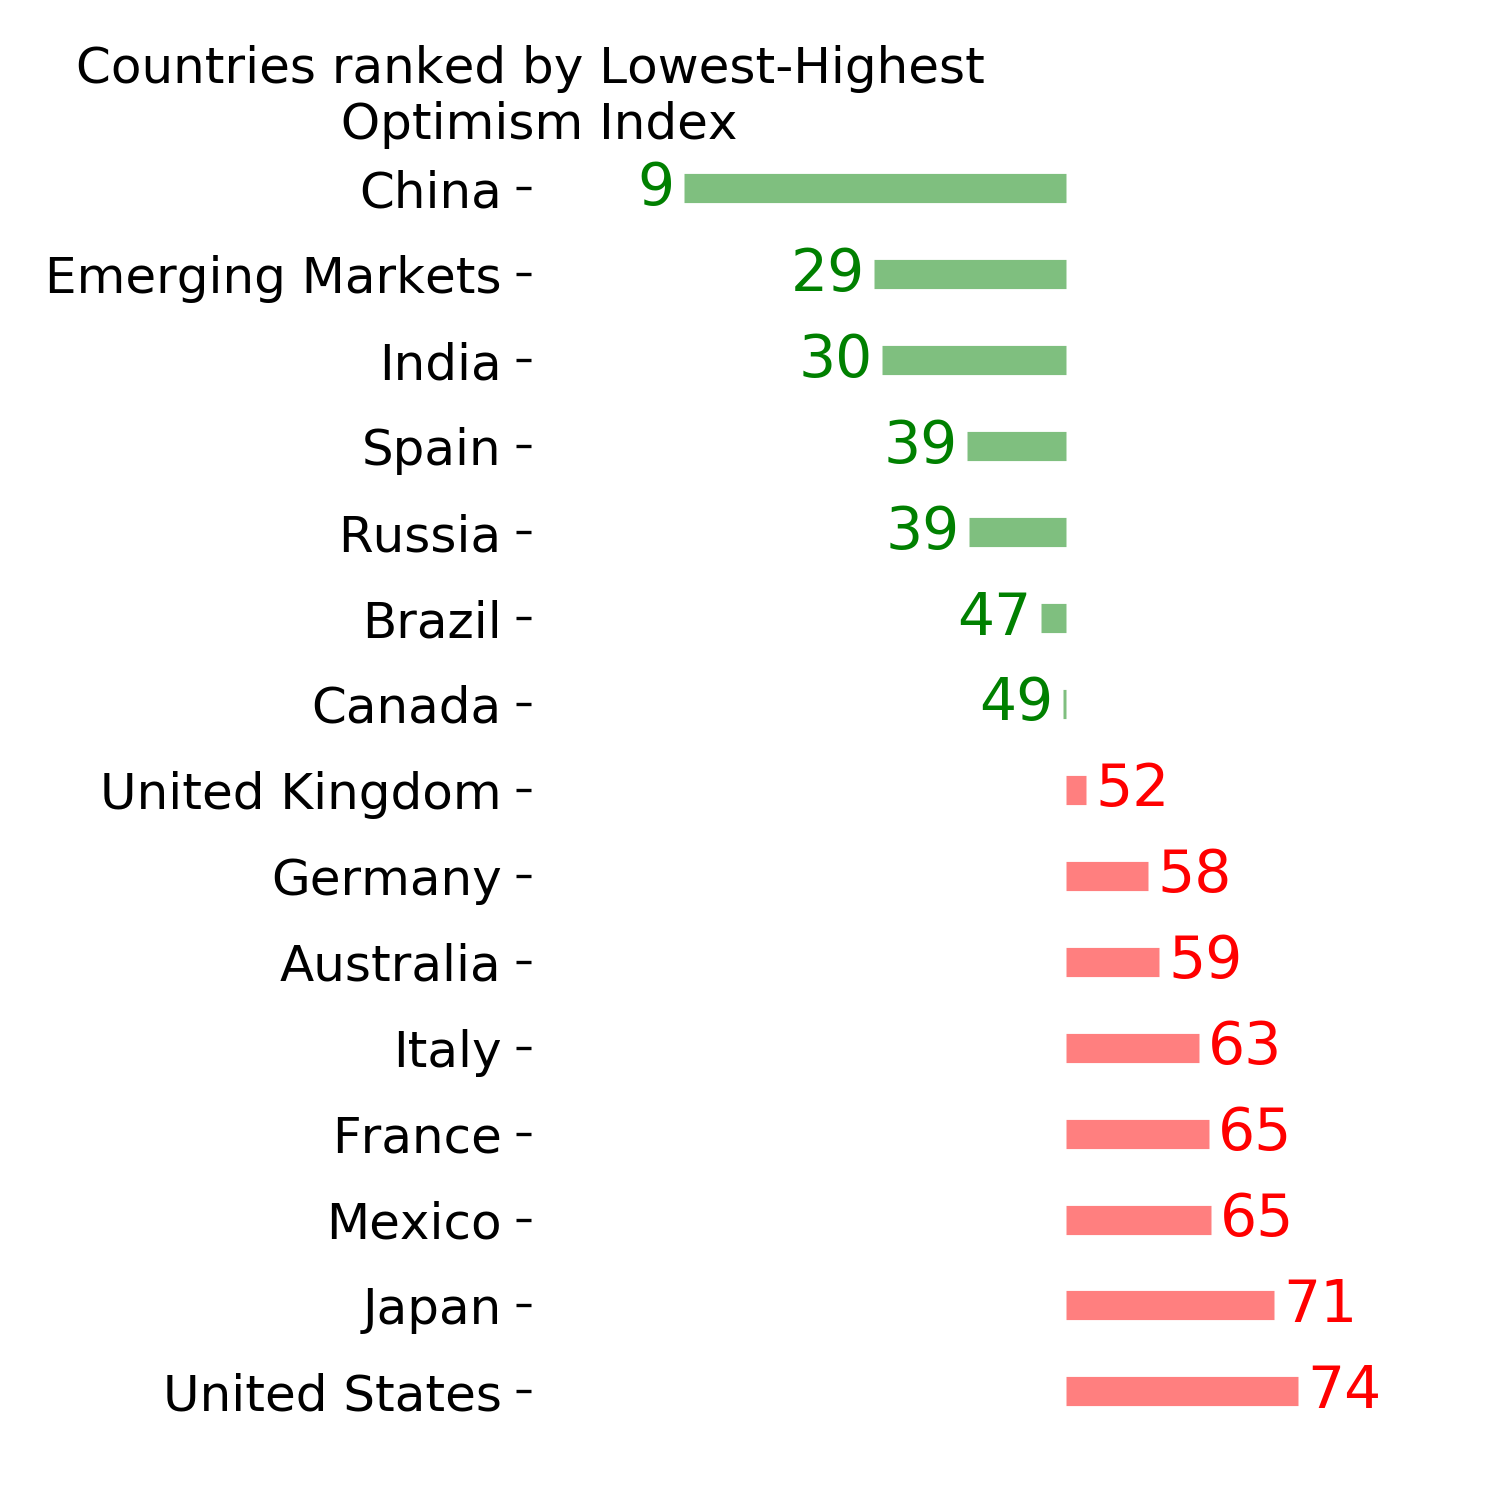
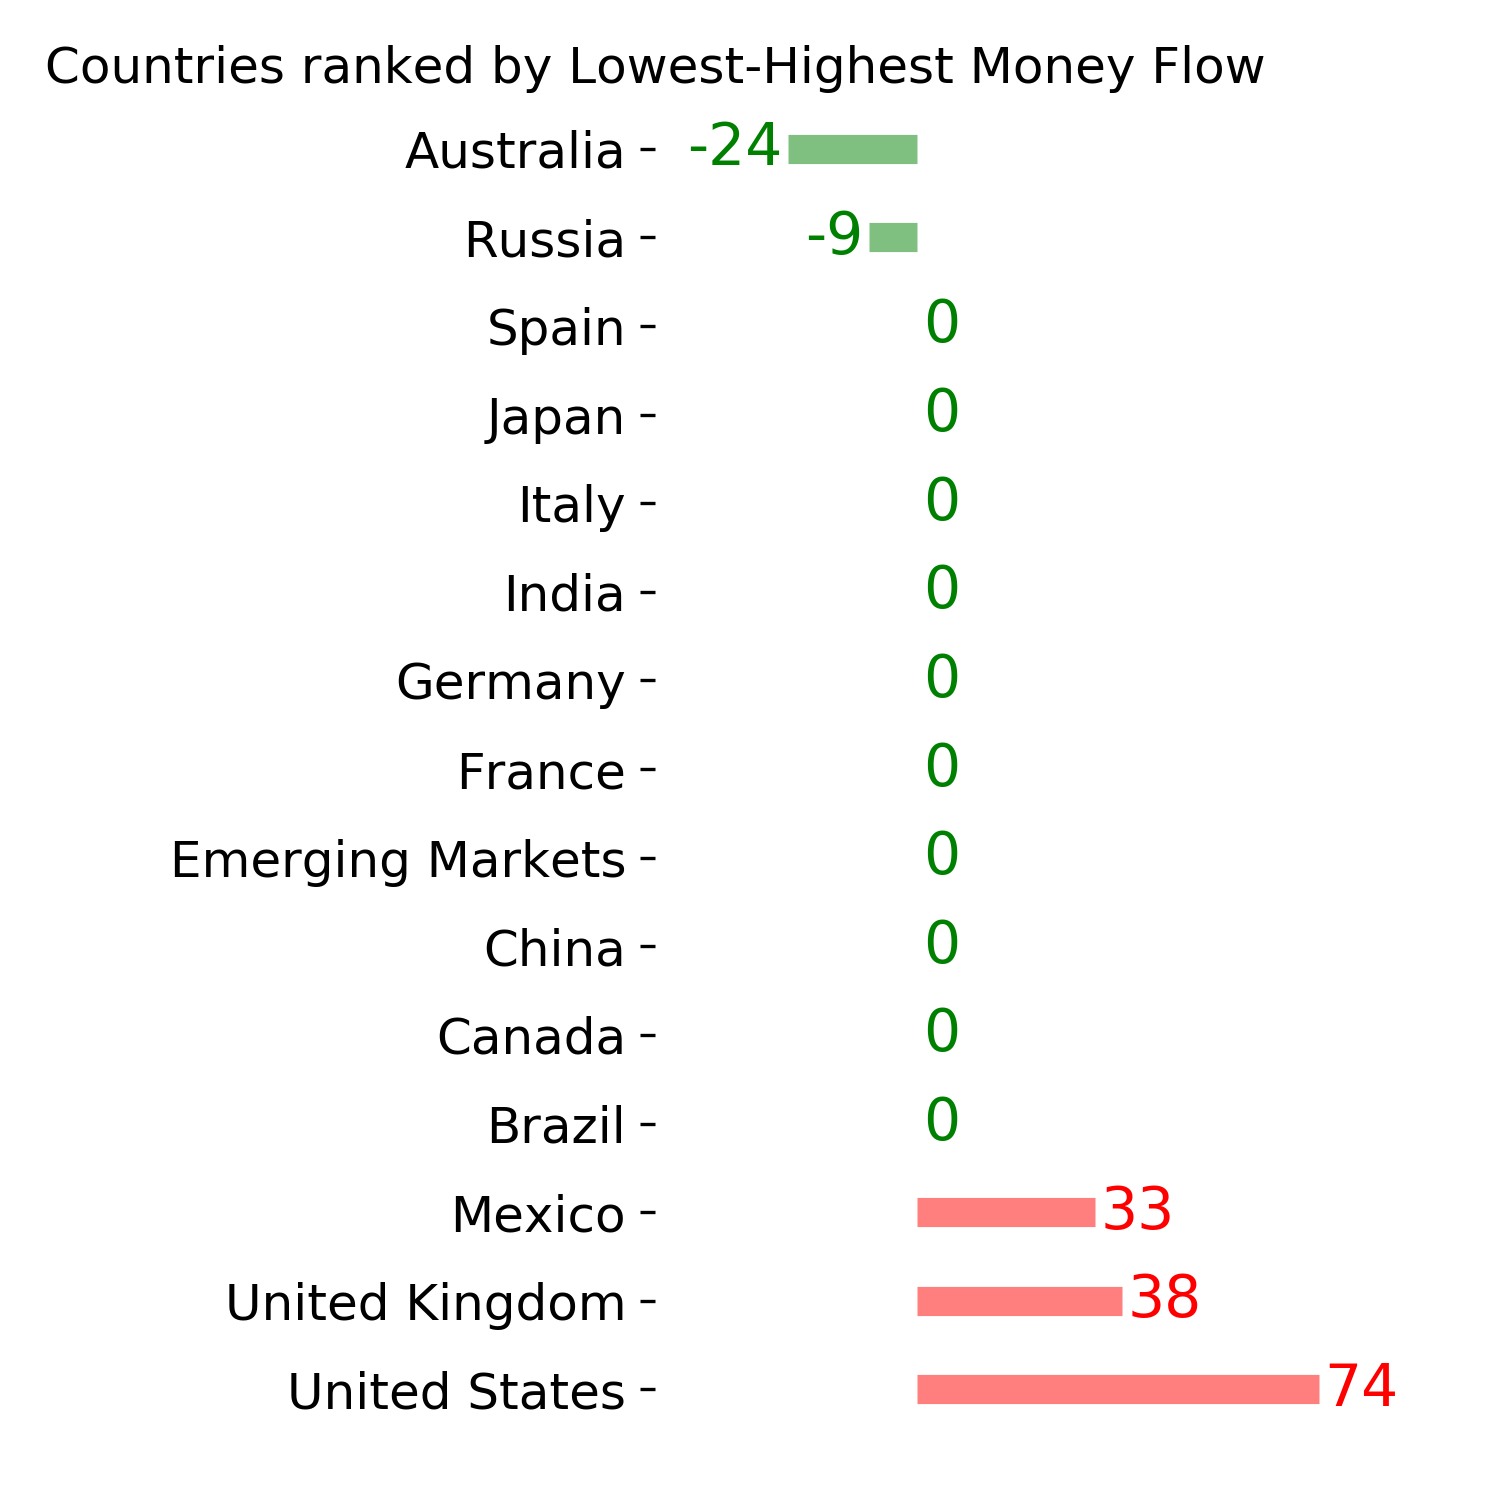
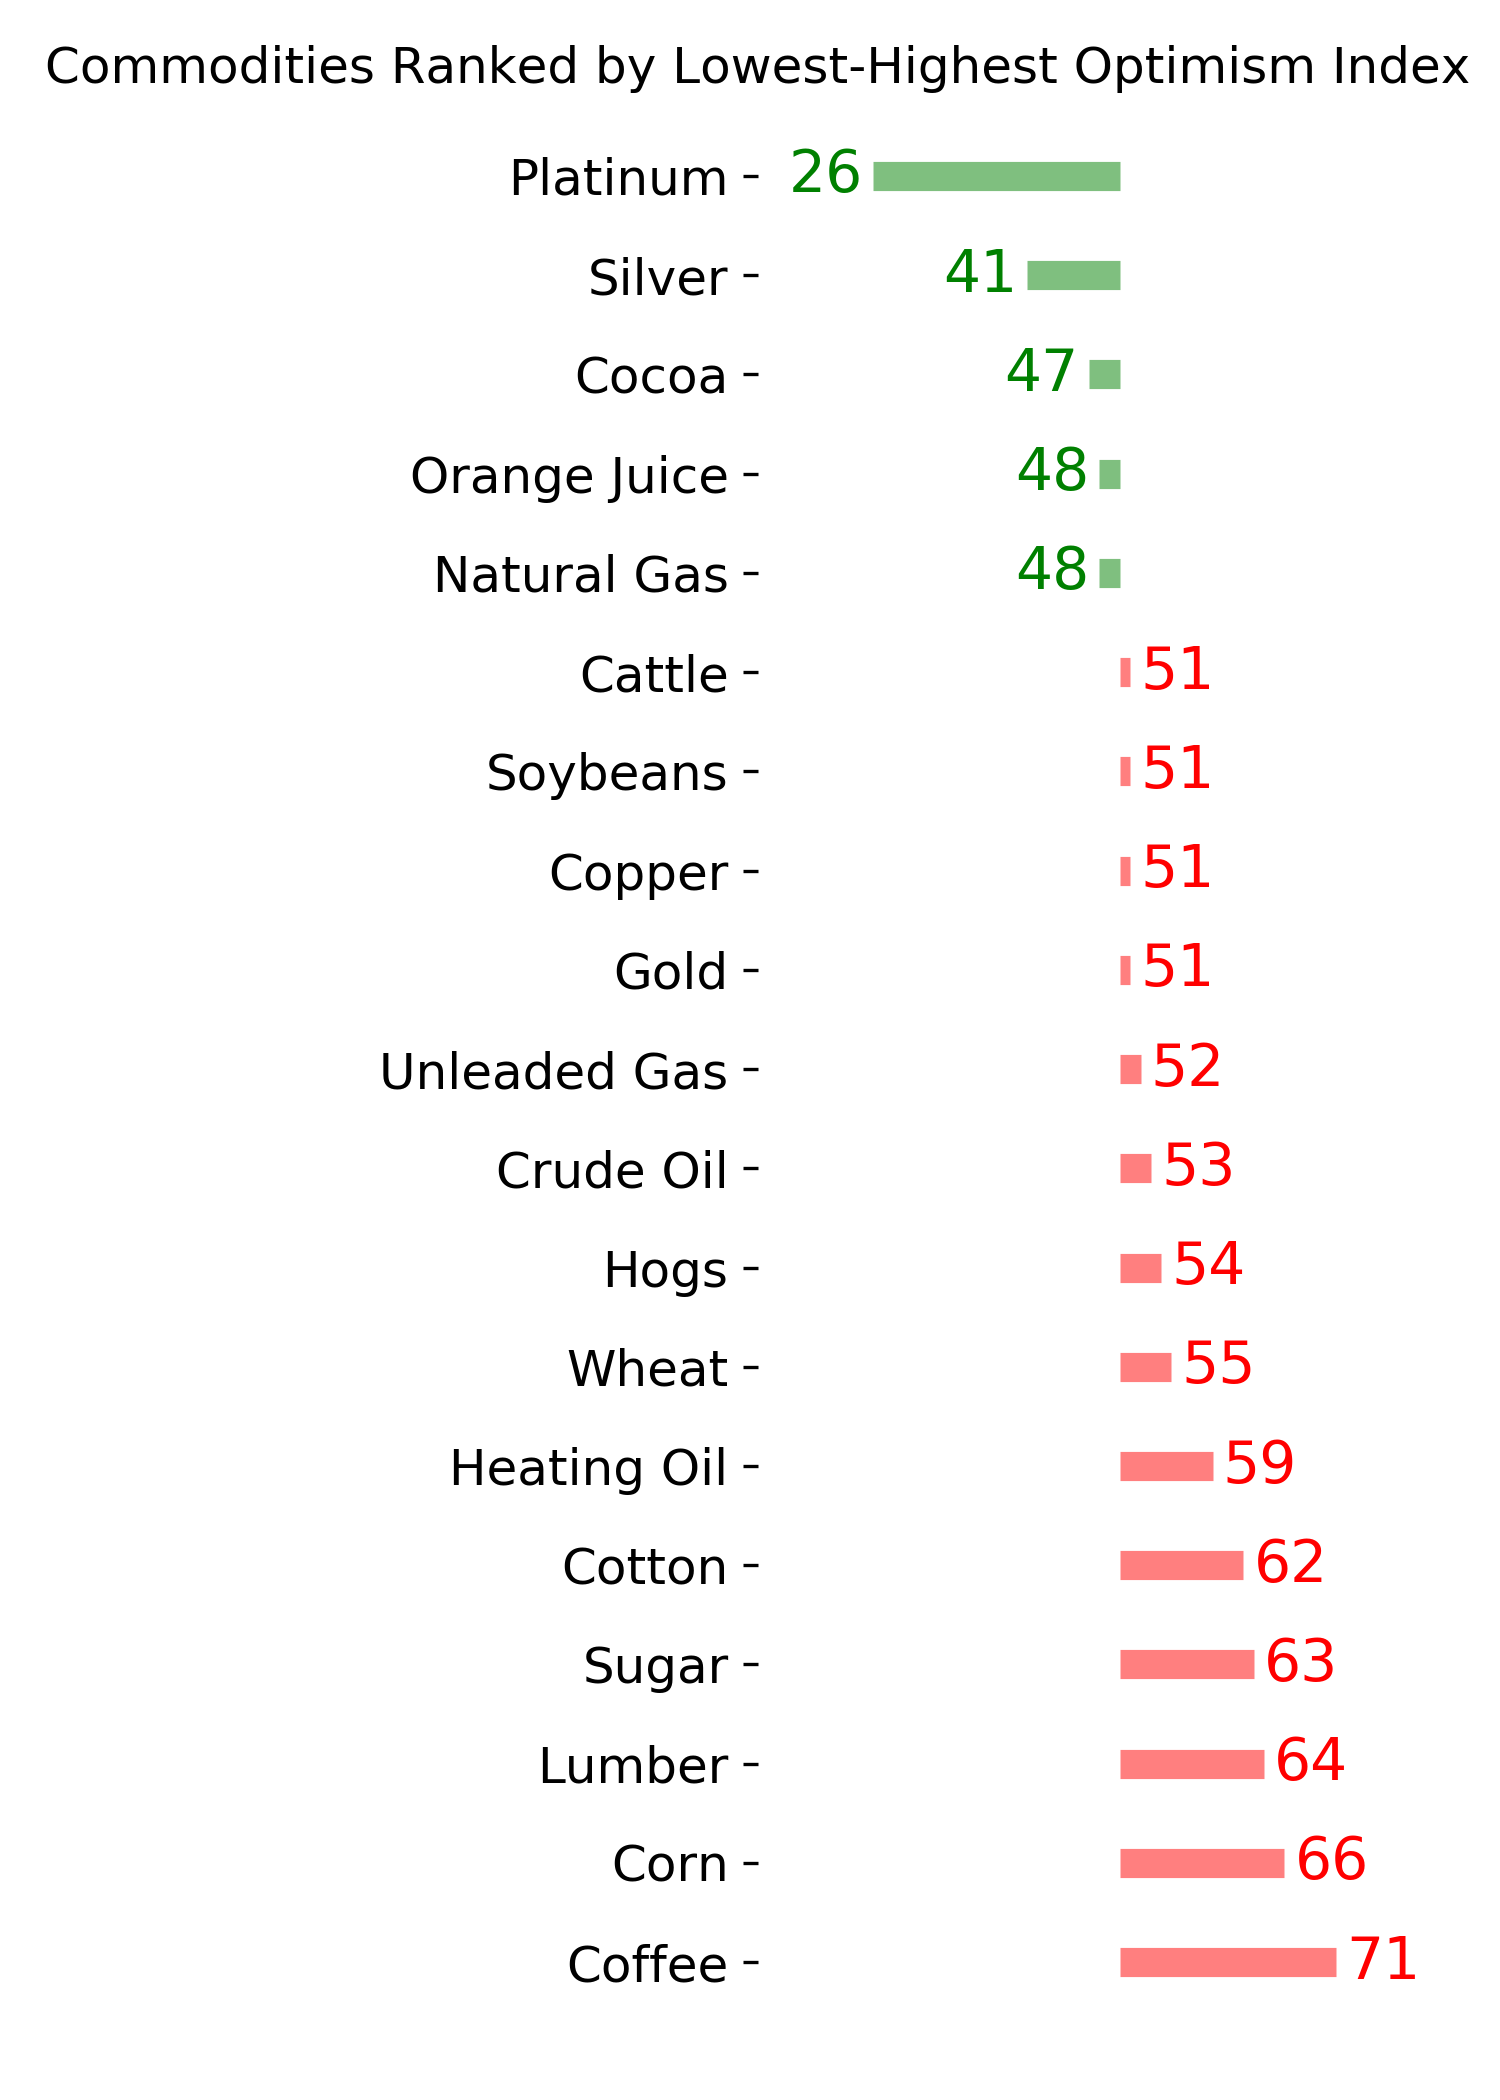
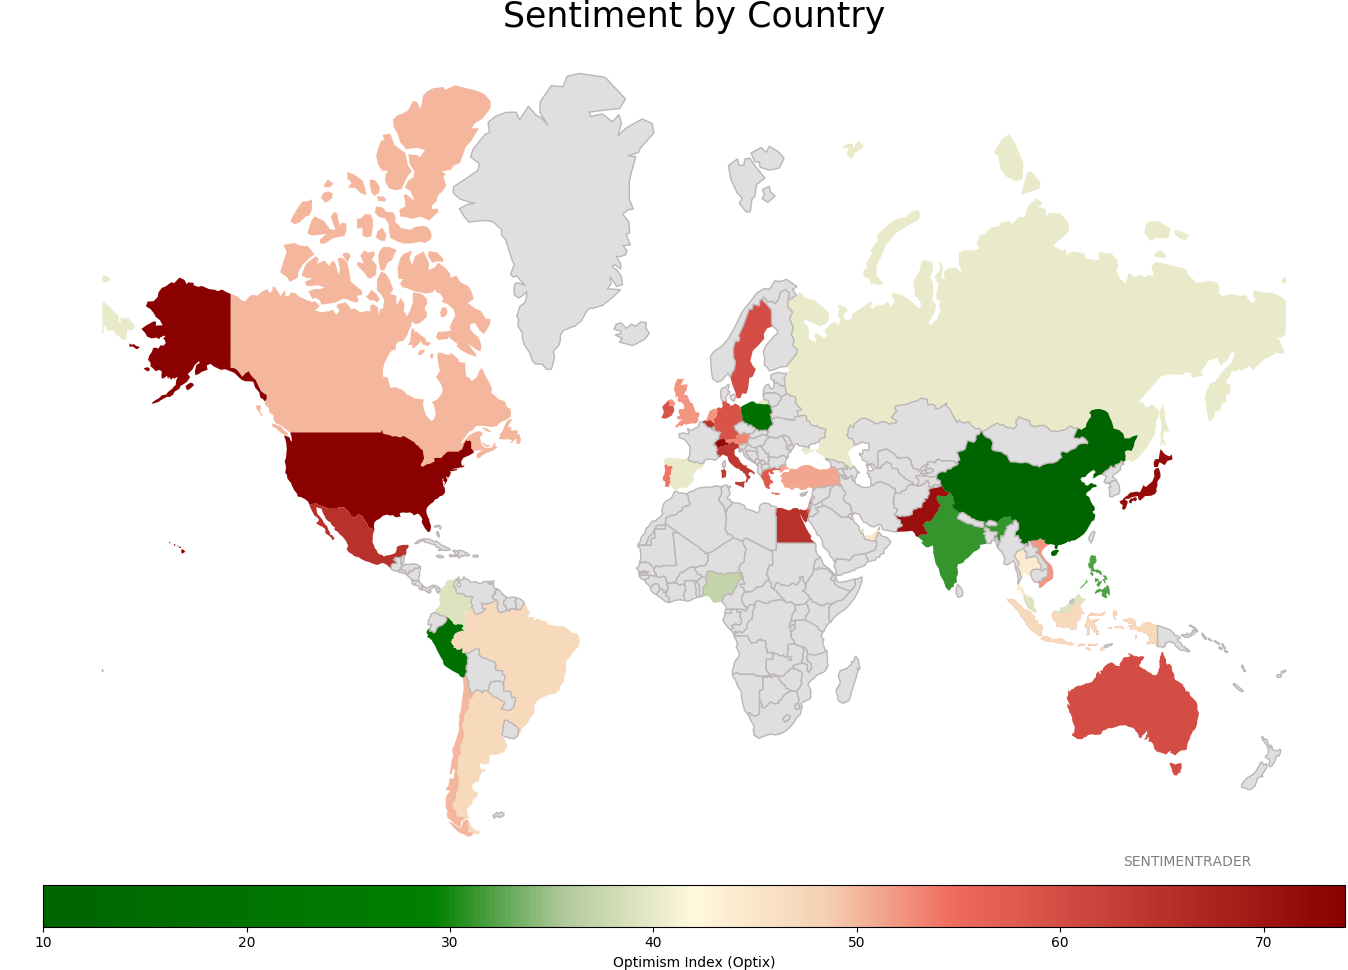
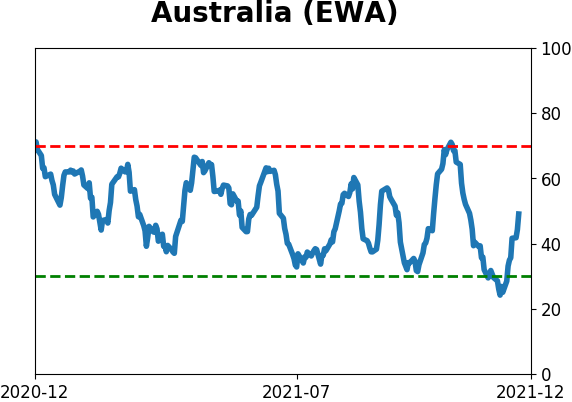
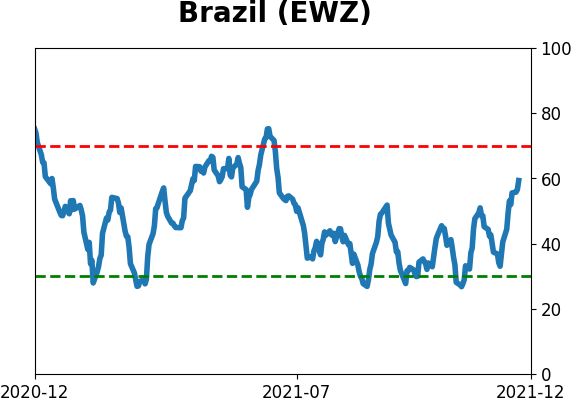
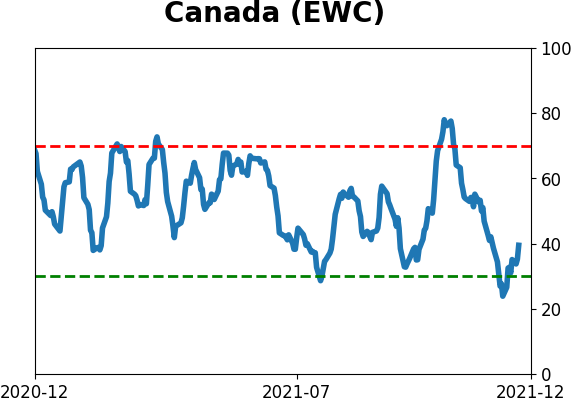
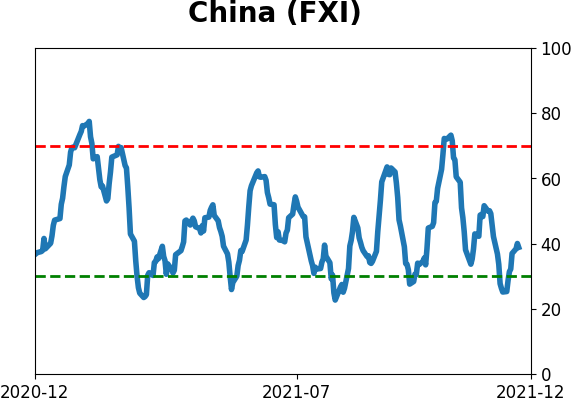
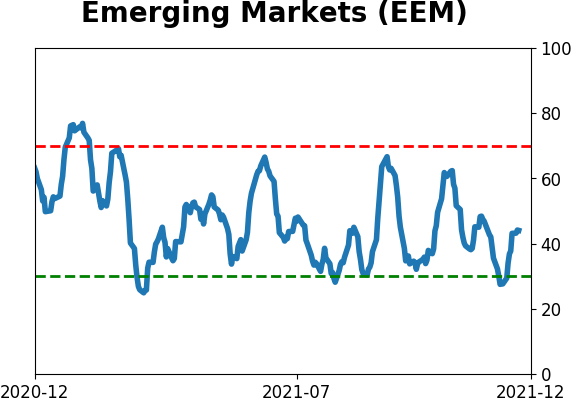
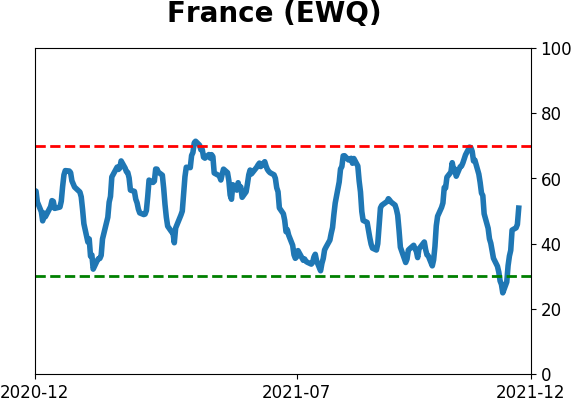
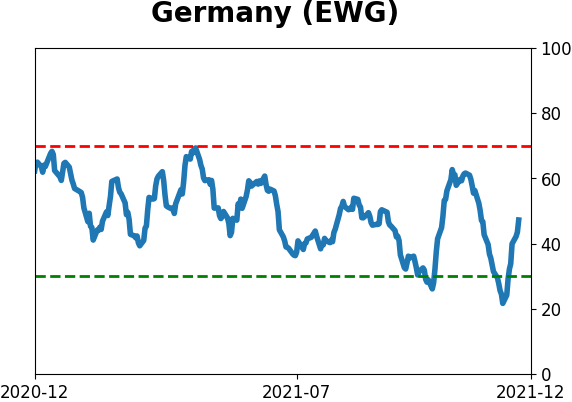
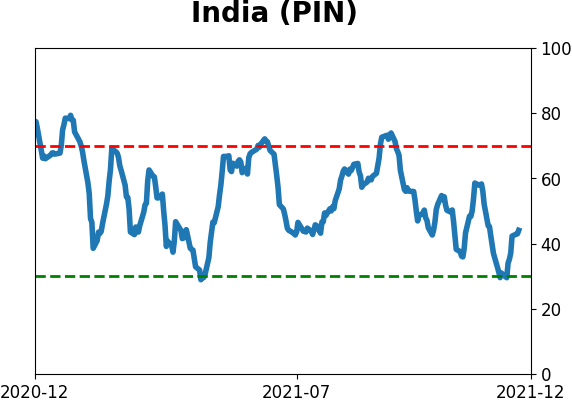
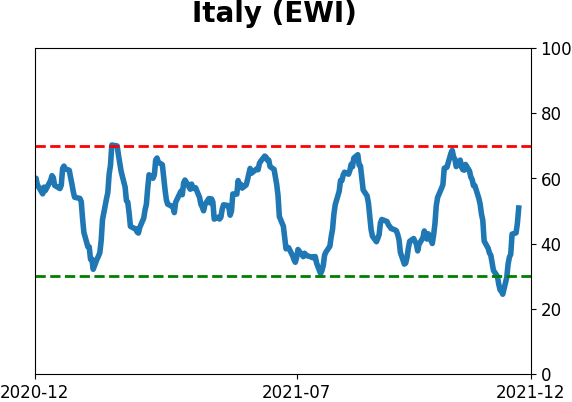
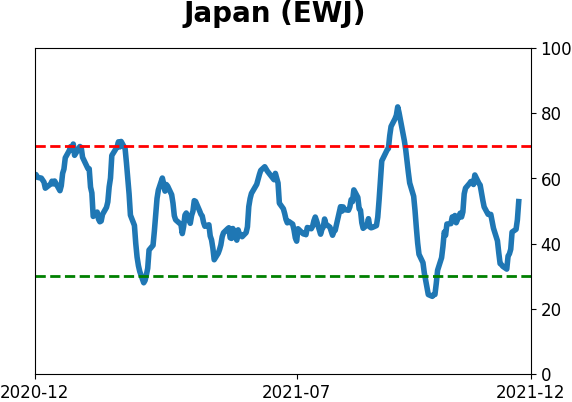
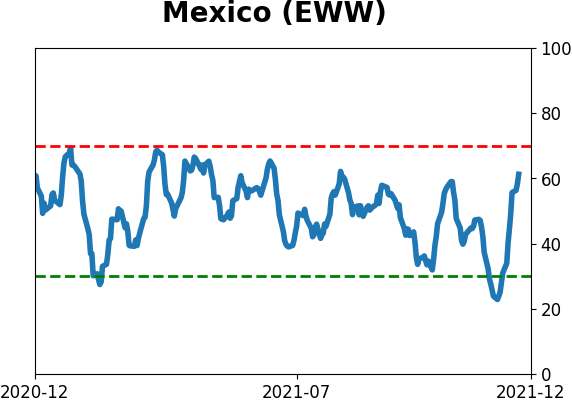
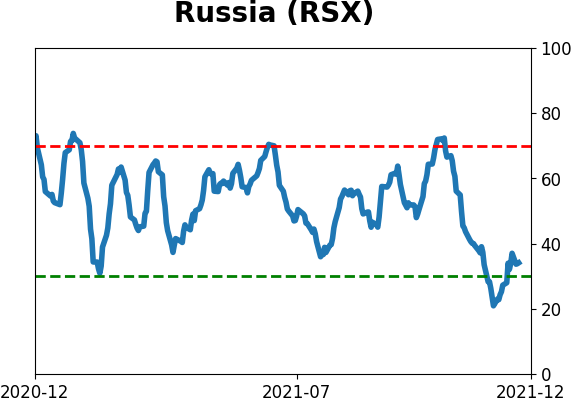
Sentiment Around The World
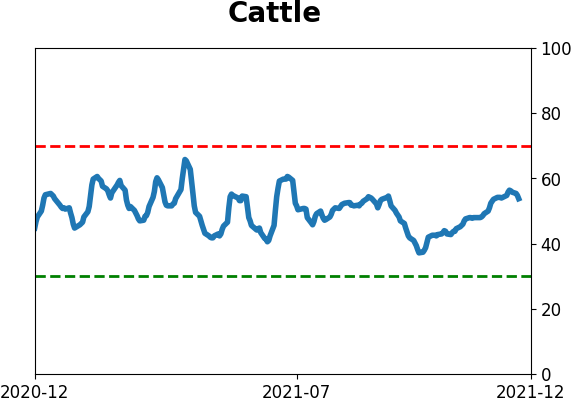
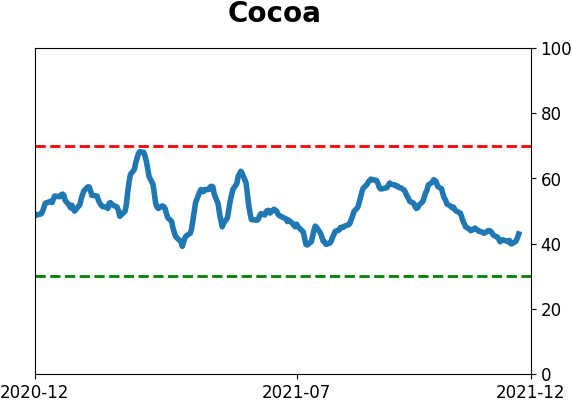
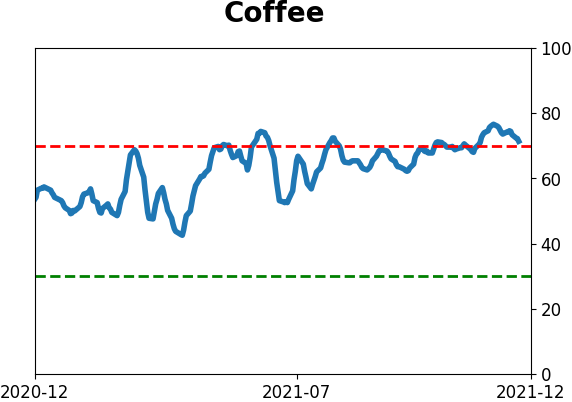
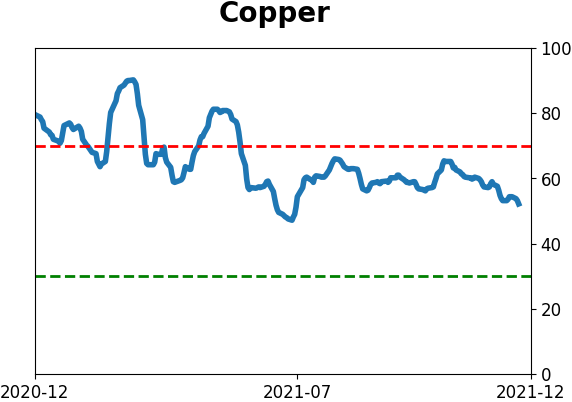
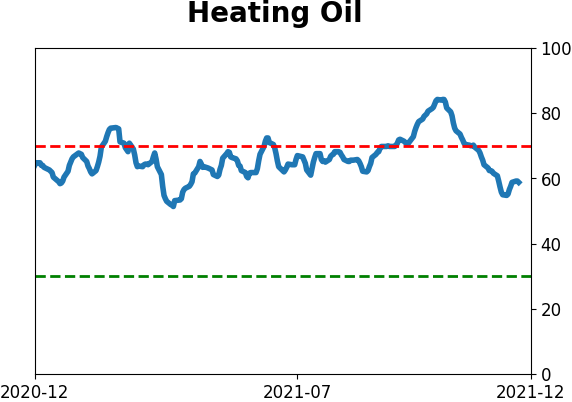
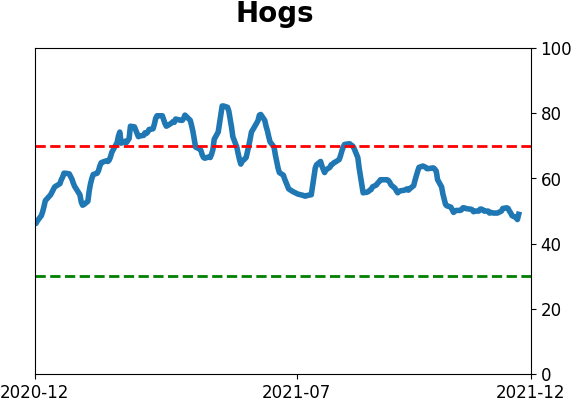
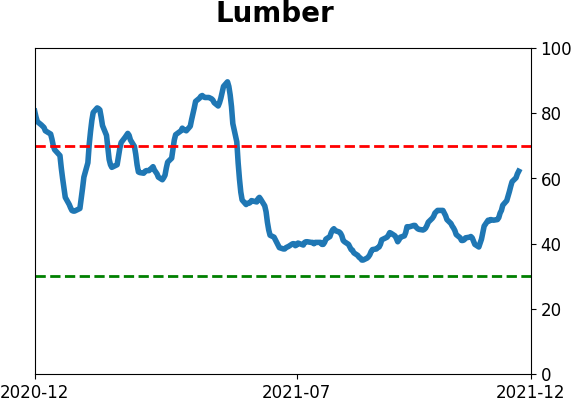
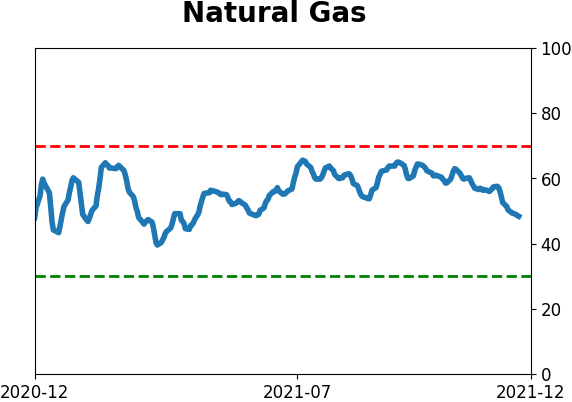
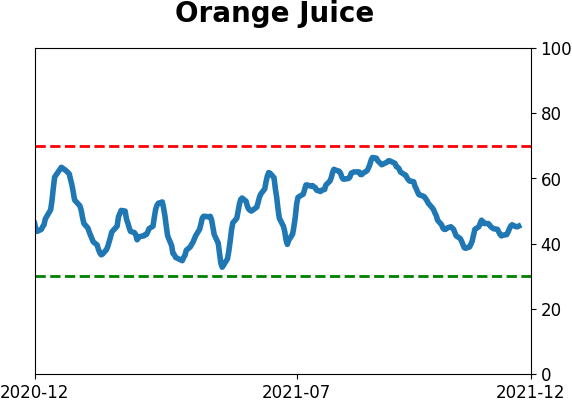
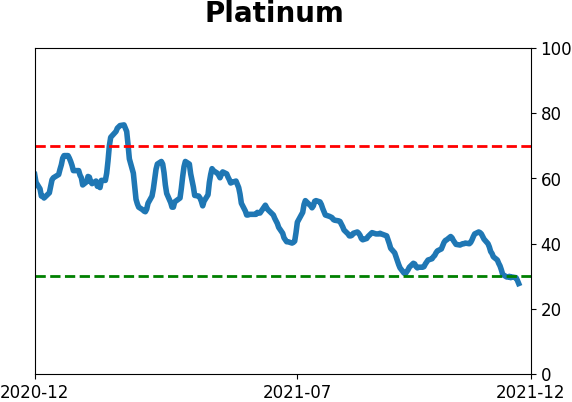
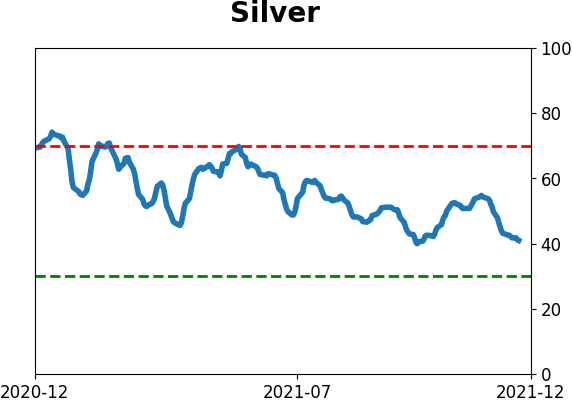
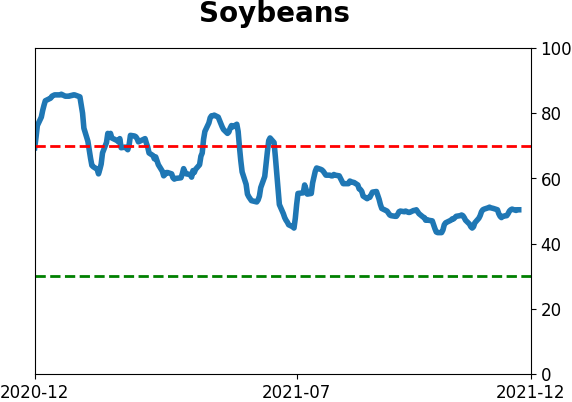
Optimism Index Thumbnails
|
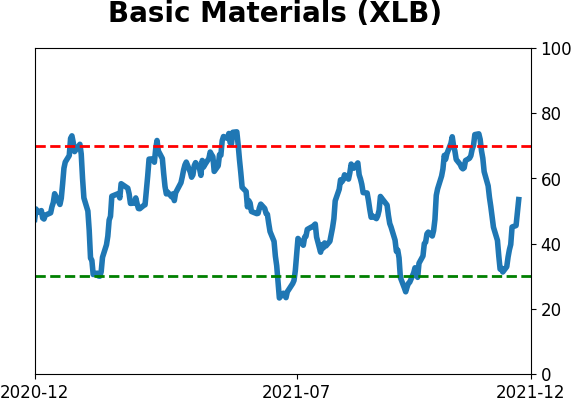
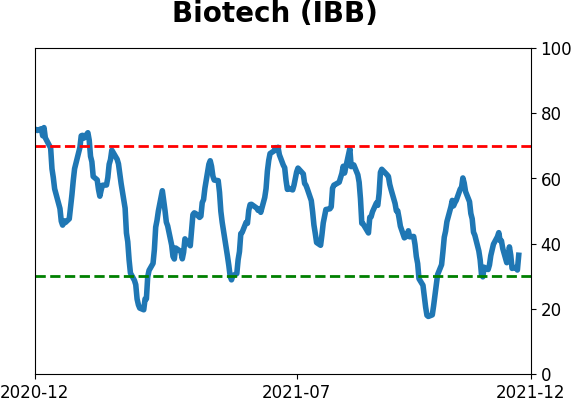
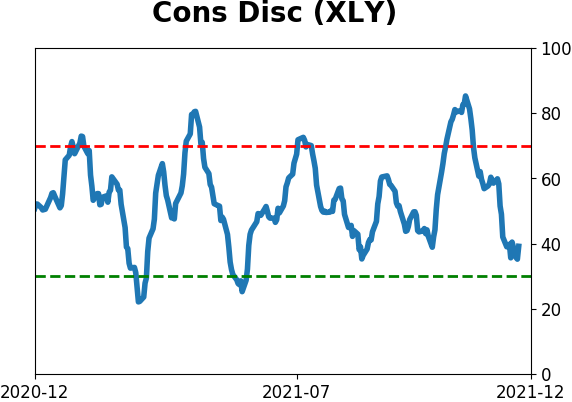
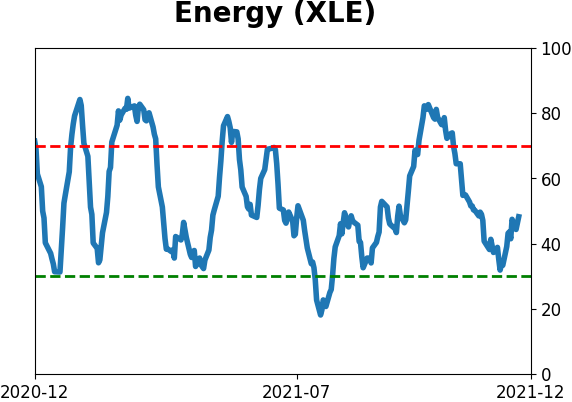
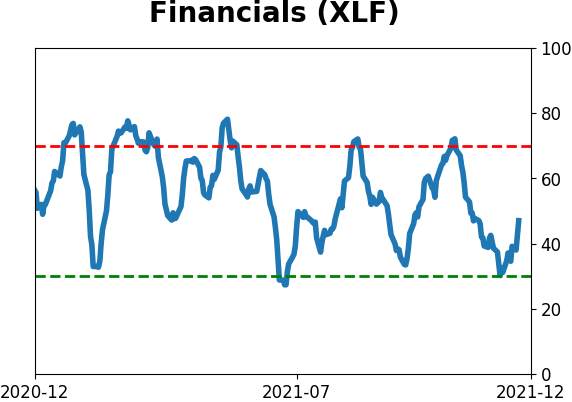
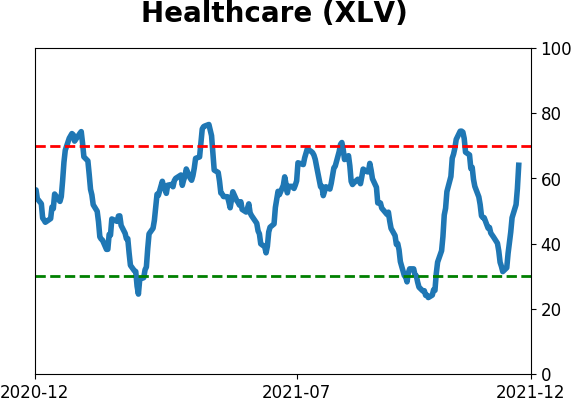
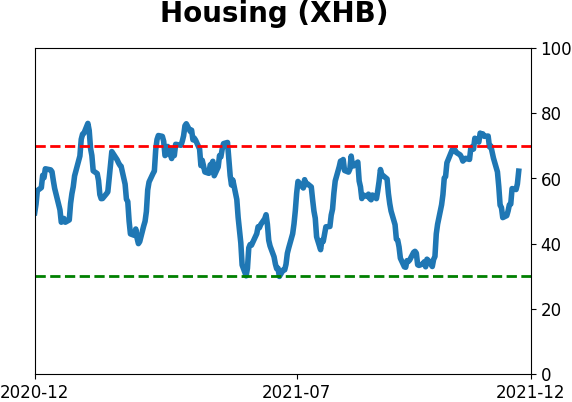
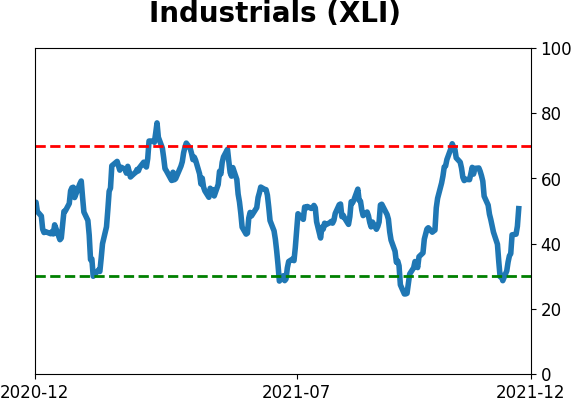
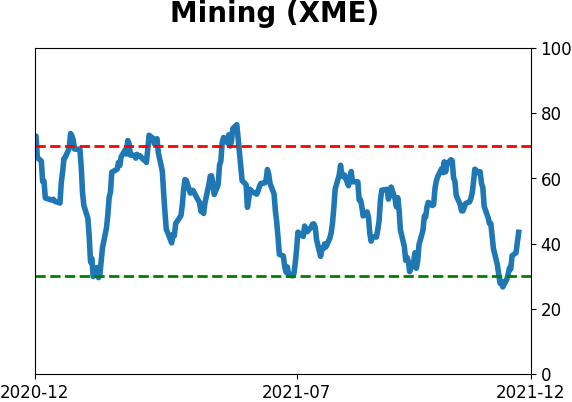
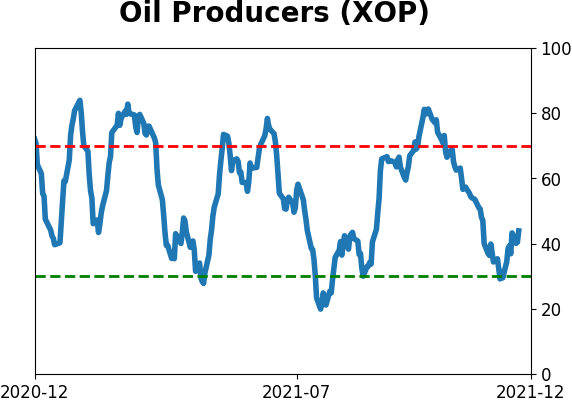
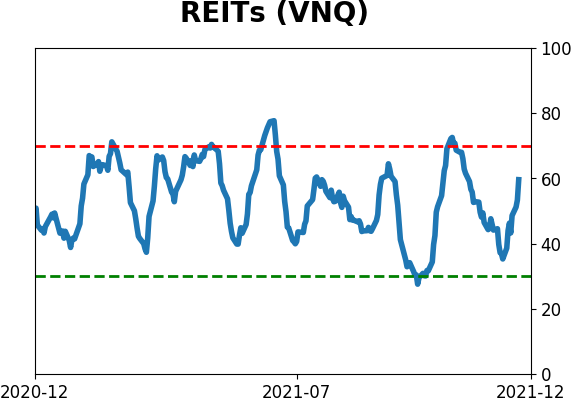
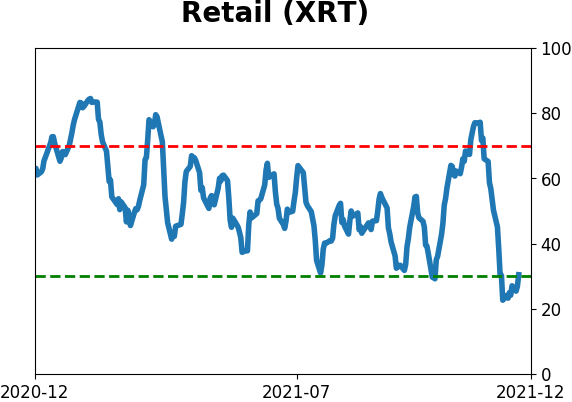
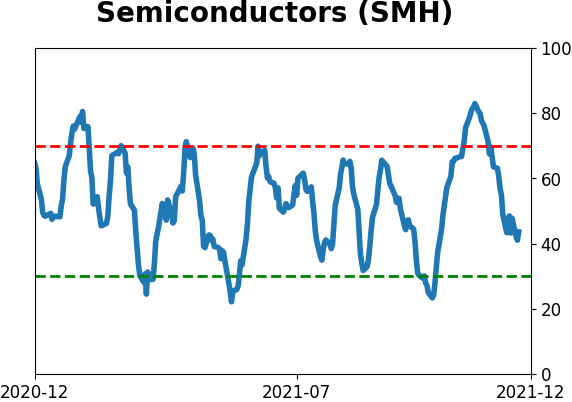
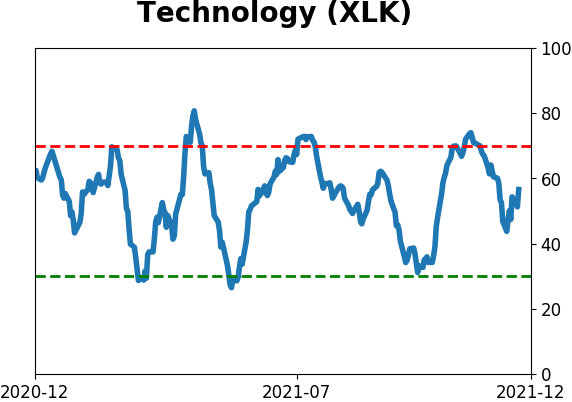
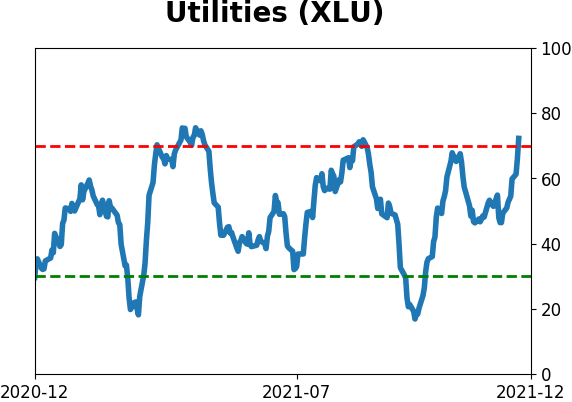
Sector ETF's - 10-Day Moving Average
|
|
|
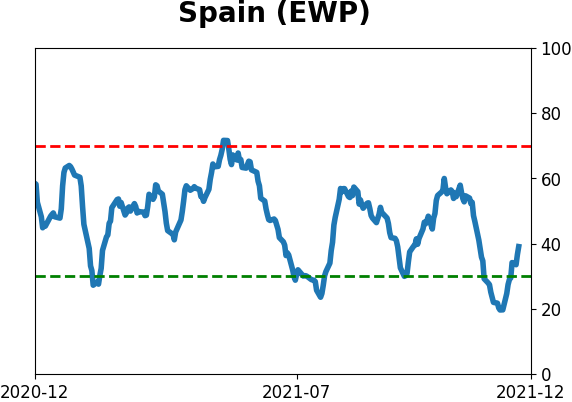
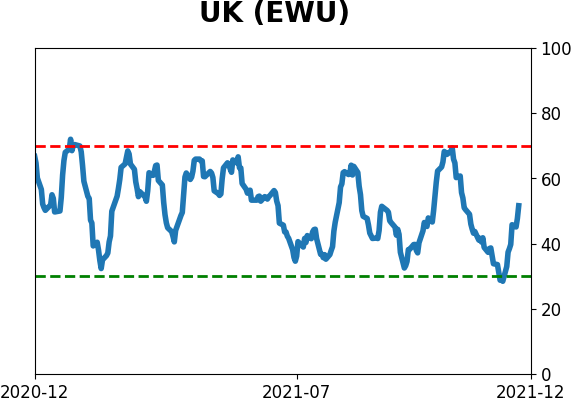
Country ETF's - 10-Day Moving Average
|
|
|
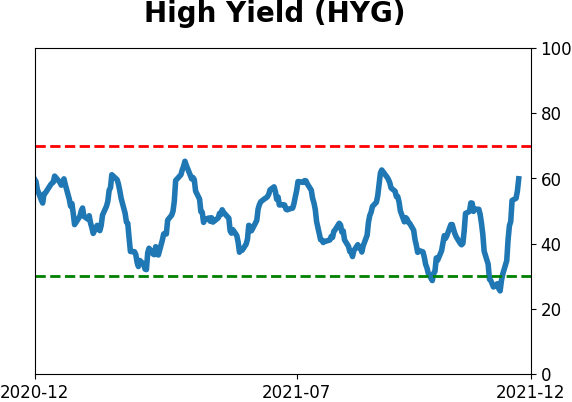
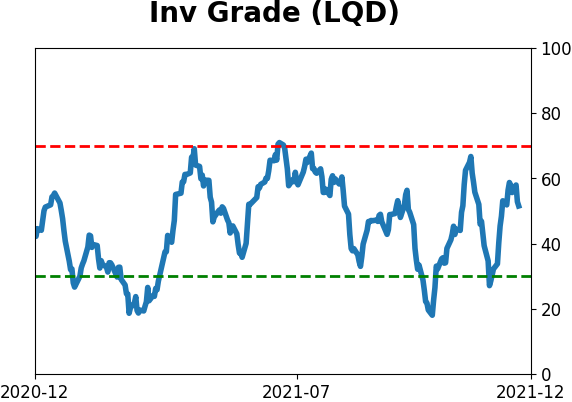
Bond ETF's - 10-Day Moving Average
|
|
|
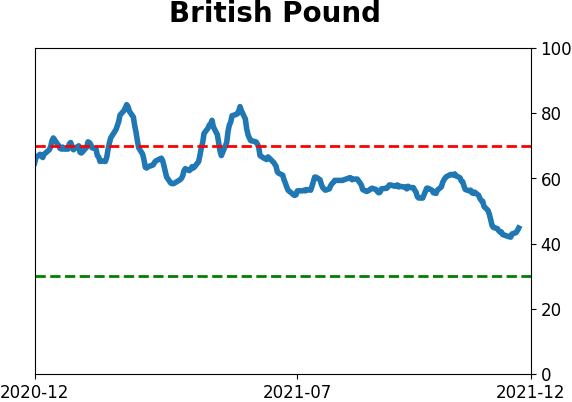
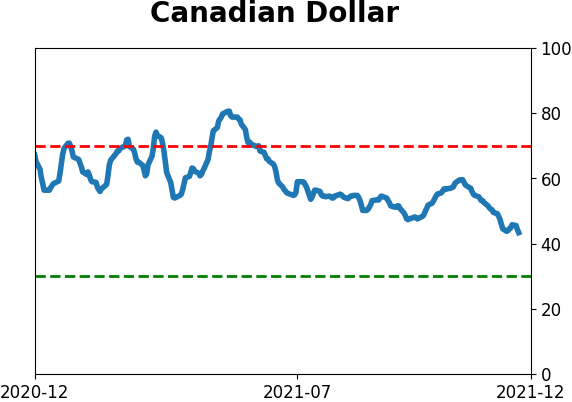
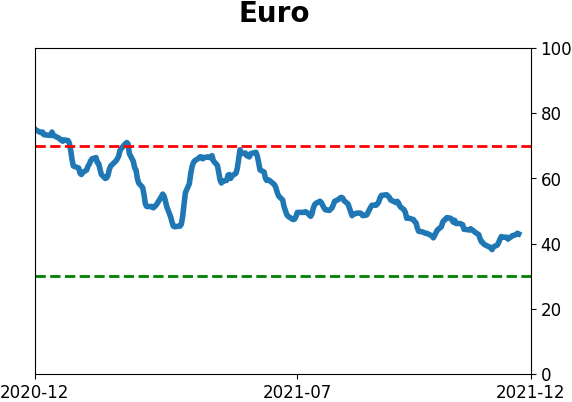
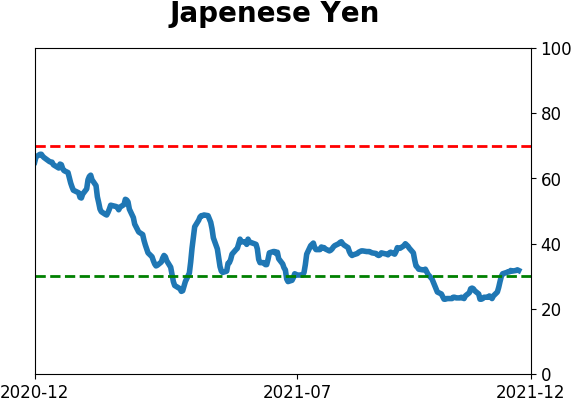
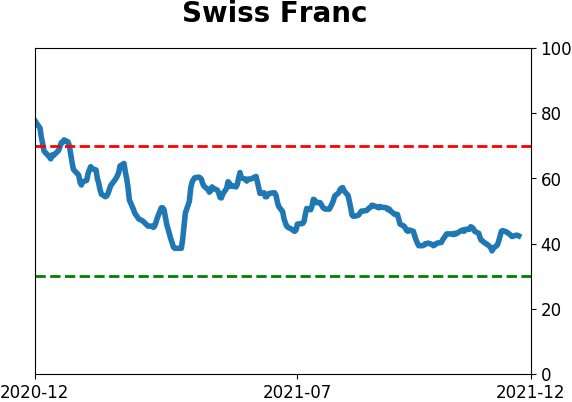
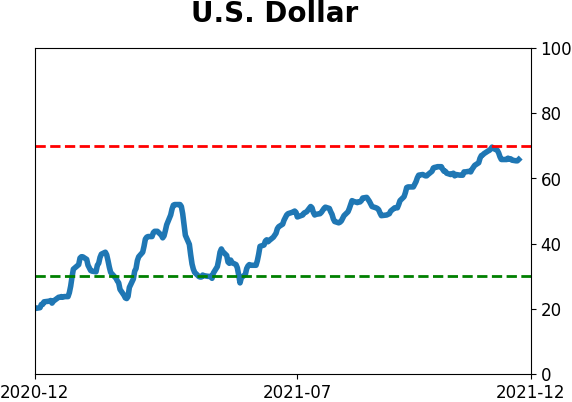
Currency ETF's - 5-Day Moving Average
|
|
|
Commodity ETF's - 5-Day Moving Average
|
|