Headlines
|
|
Why the recovery in Consumer Staples looks promising:
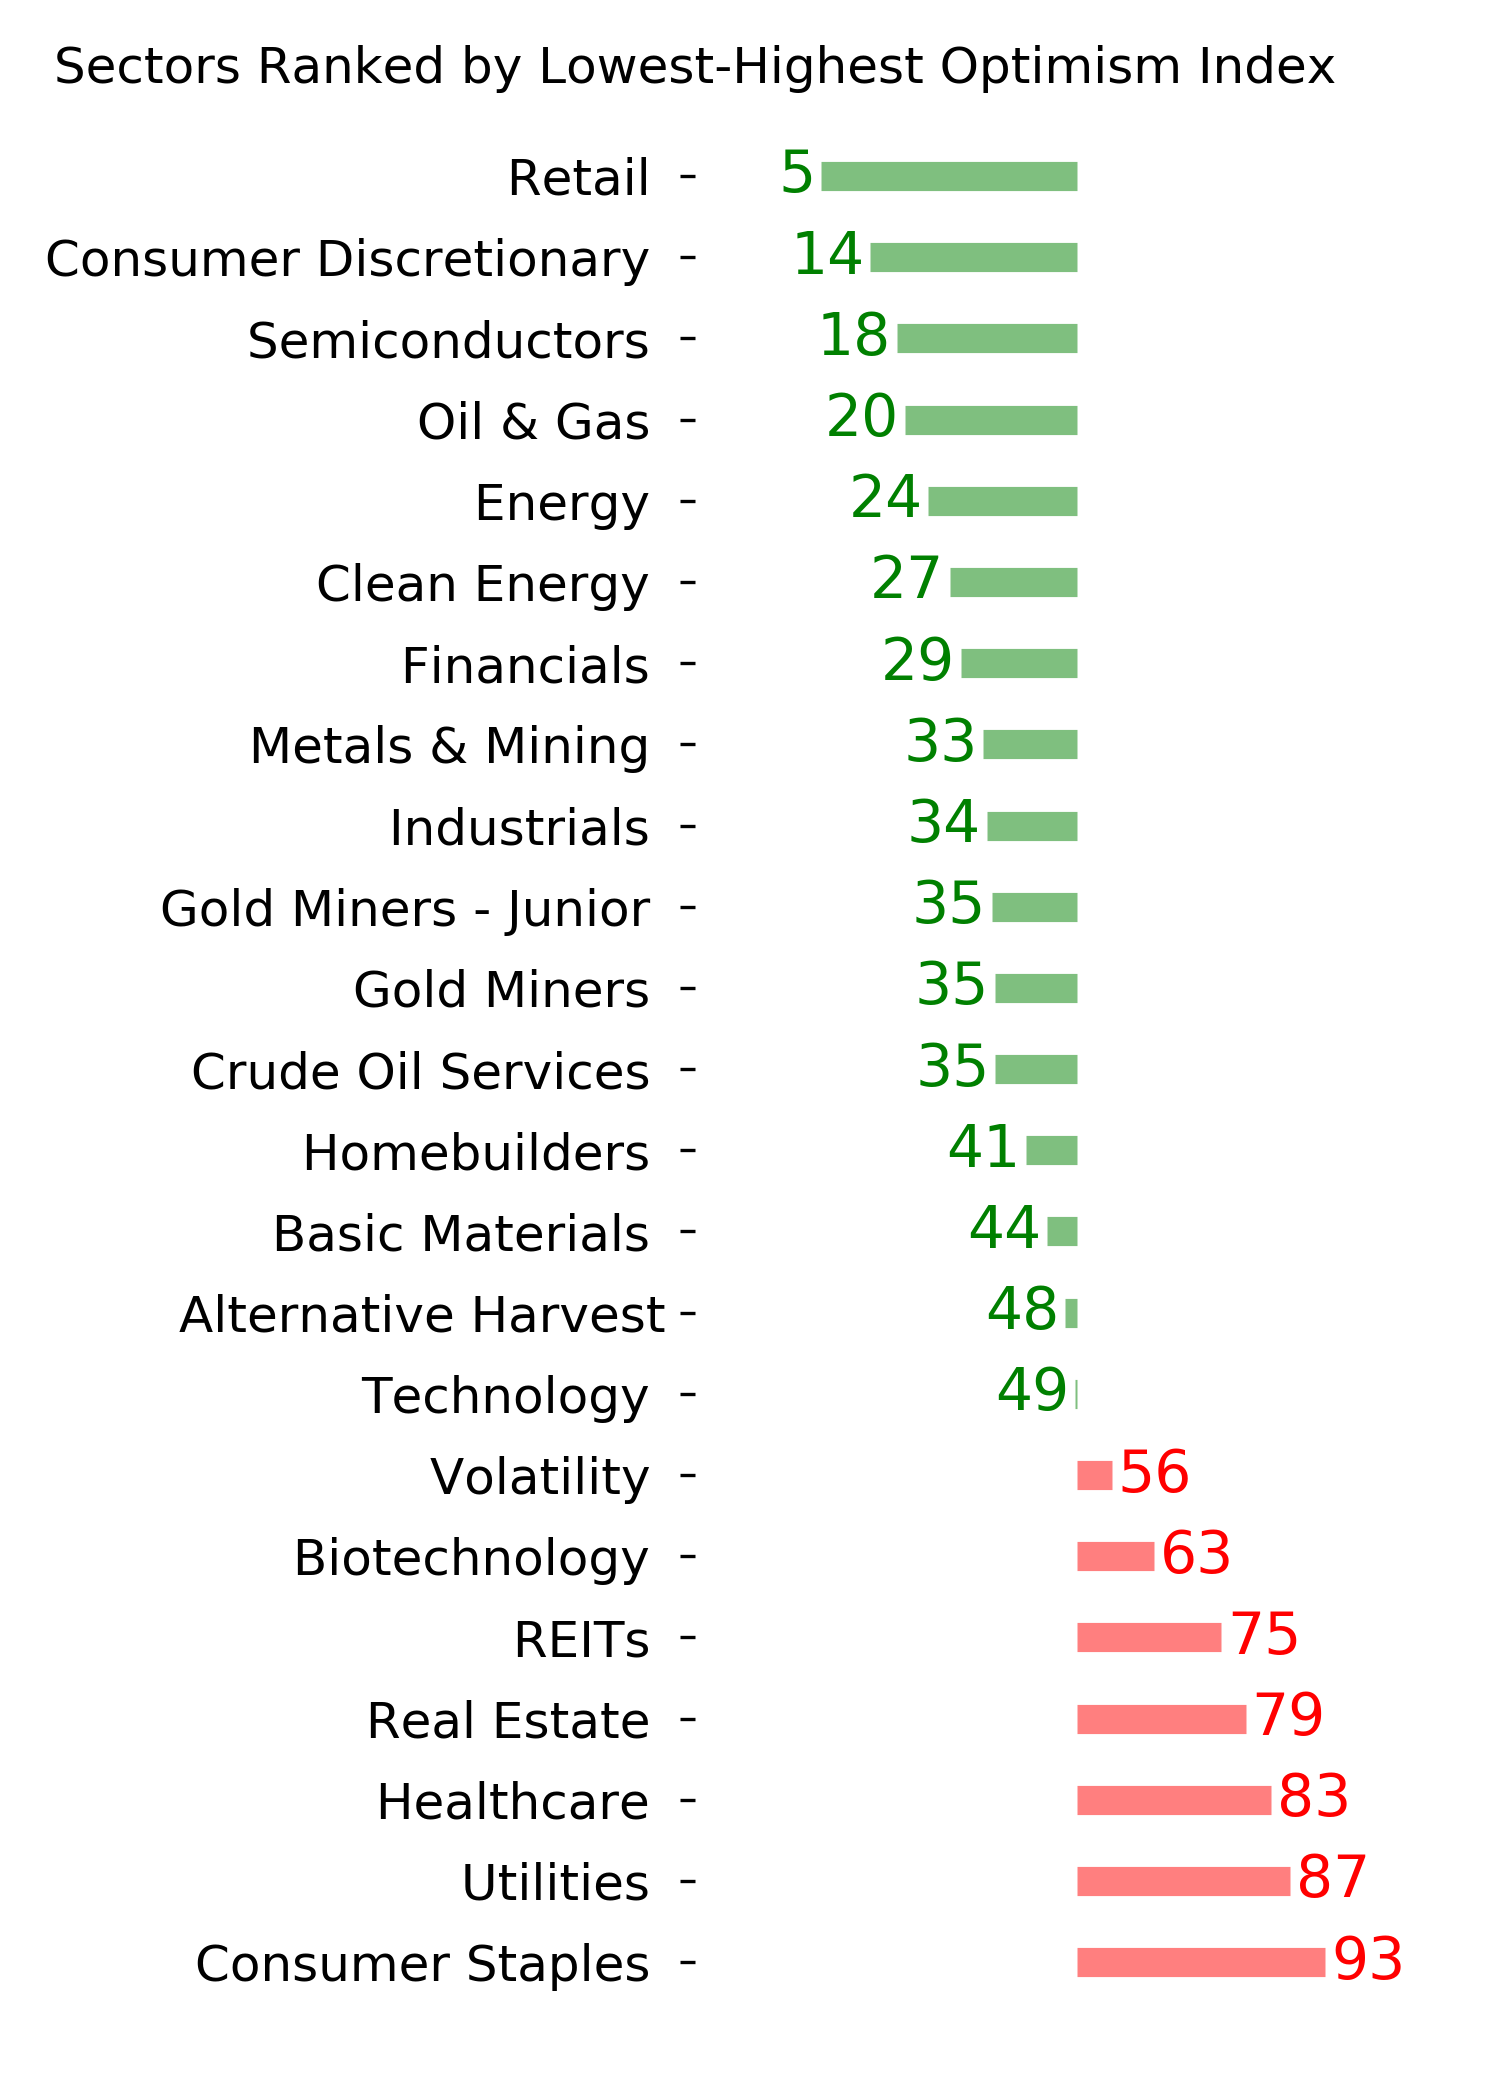
There has been a quick shift in buying interest in Consumer Staples stocks. The percentage of them trading above their 10-day averages has swung from a deep oversold to high overbought extreme within days. It has pushed the McClellan Summation Index above 500. These have been good signs for the sector.
Bottom Line:
STOCKS: Hold By early October, sentiment had reset. Several important momentum streaks ended, which has brought in buyers in the past, and seasonality turned positive. We're now seeing signs that sentiment has quickly shifted, especially among options traders. It's gotten to an extreme that has preceded weaker-than-average returns.
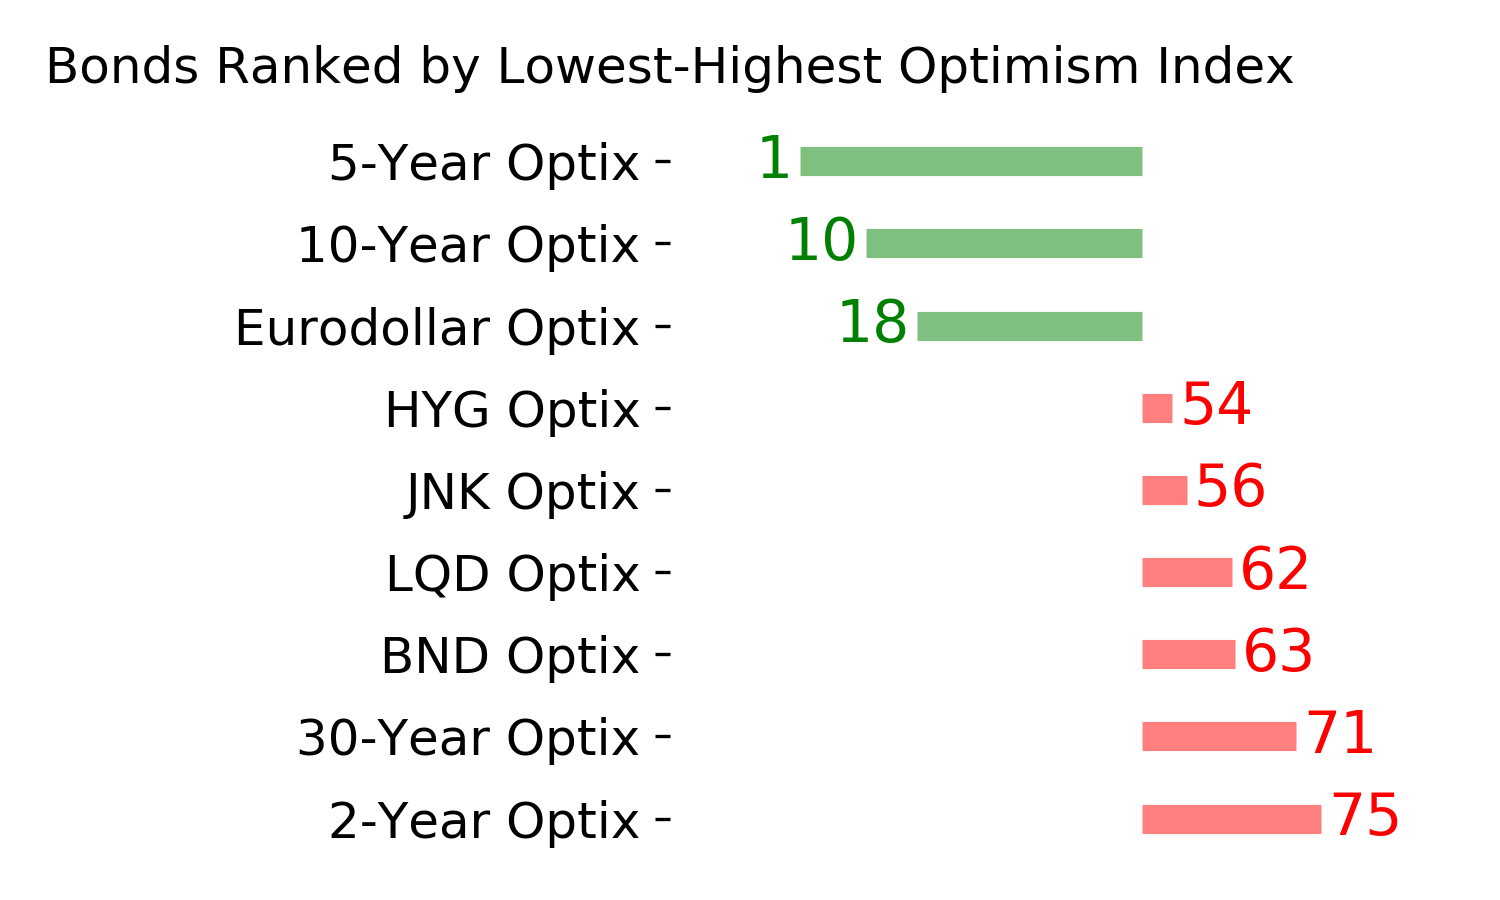
BONDS: Hold In late October, sentiment on bonds - from Treasuries to corporates - entered pessimistic territory. It's now starting to recover, with some quick moves in corporate bonds. We'll see if those bonds, in particular, can hold recent gains.
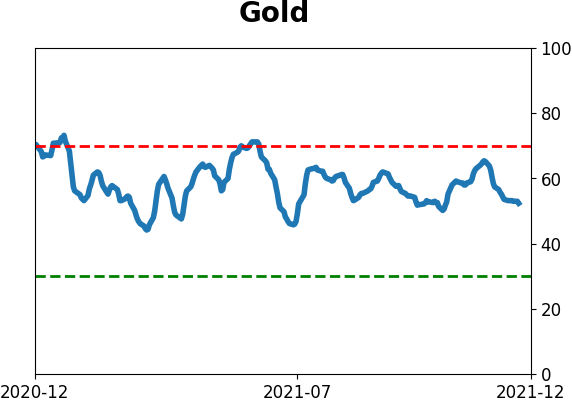
GOLD: Hold
Gold and miners were rejected after trying to recover above their 200-day averages in May. Some oversold extremes in breadth measures among miners triggered in late September, and they've recovered a bit since then. The group still has some proving to do.
|
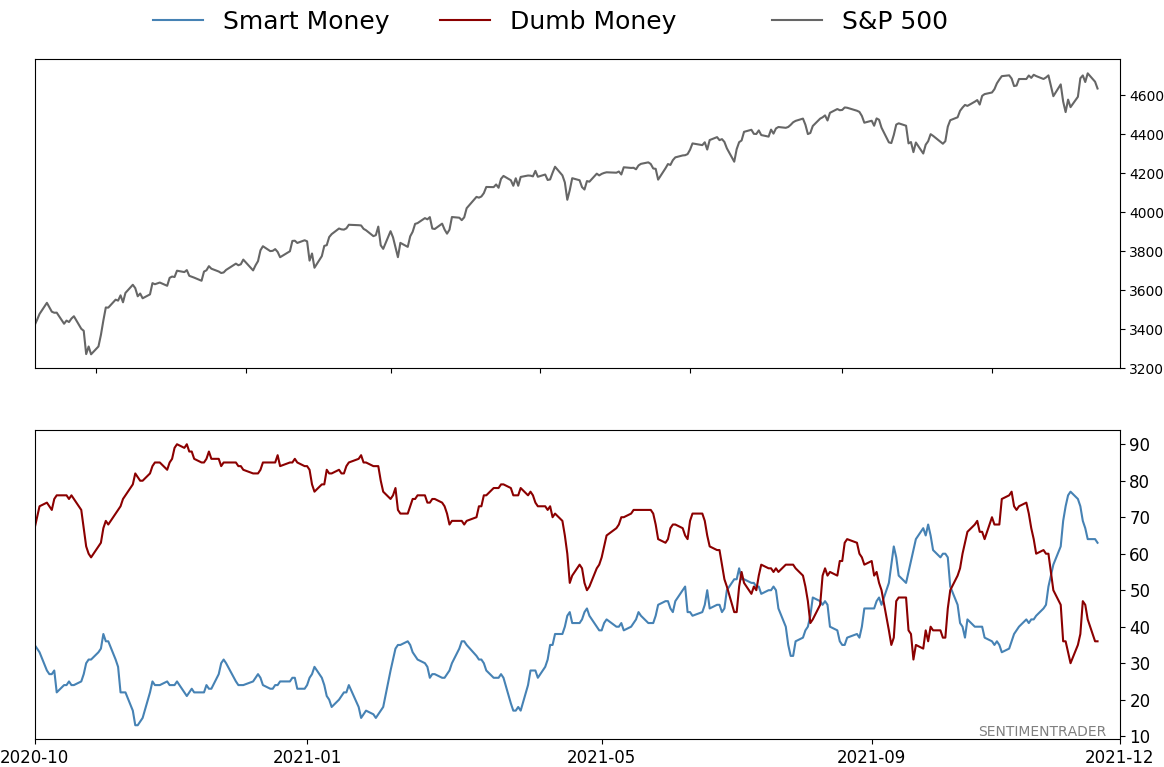
Smart / Dumb Money Confidence
|
Smart Money Confidence: 63%
Dumb Money Confidence: 36%
|
|
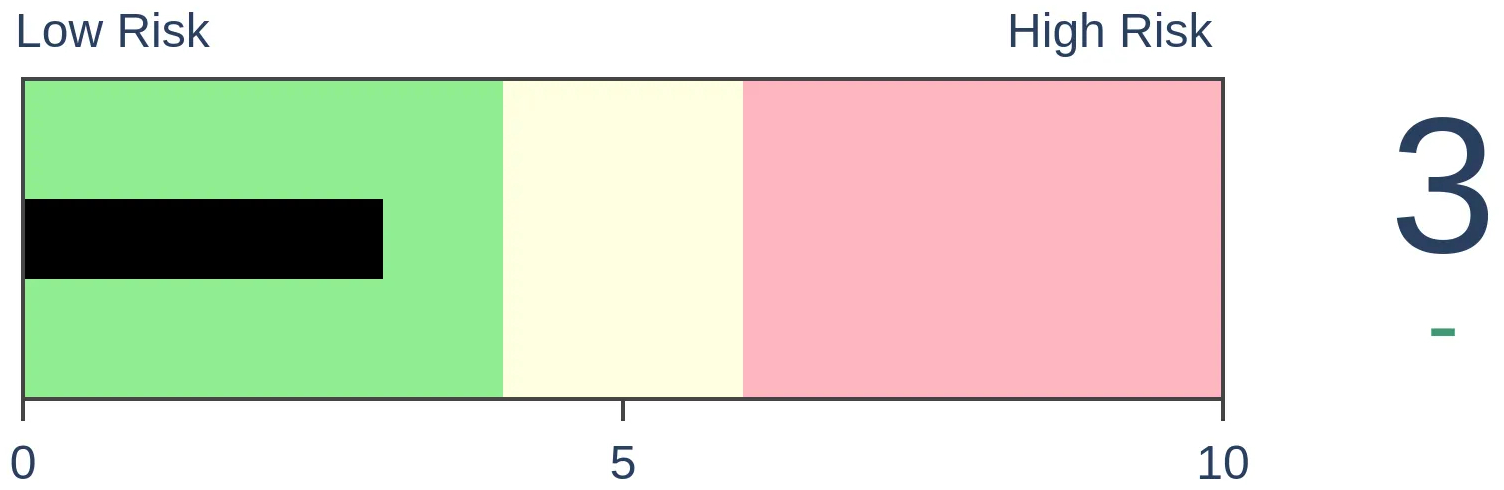
Risk Levels
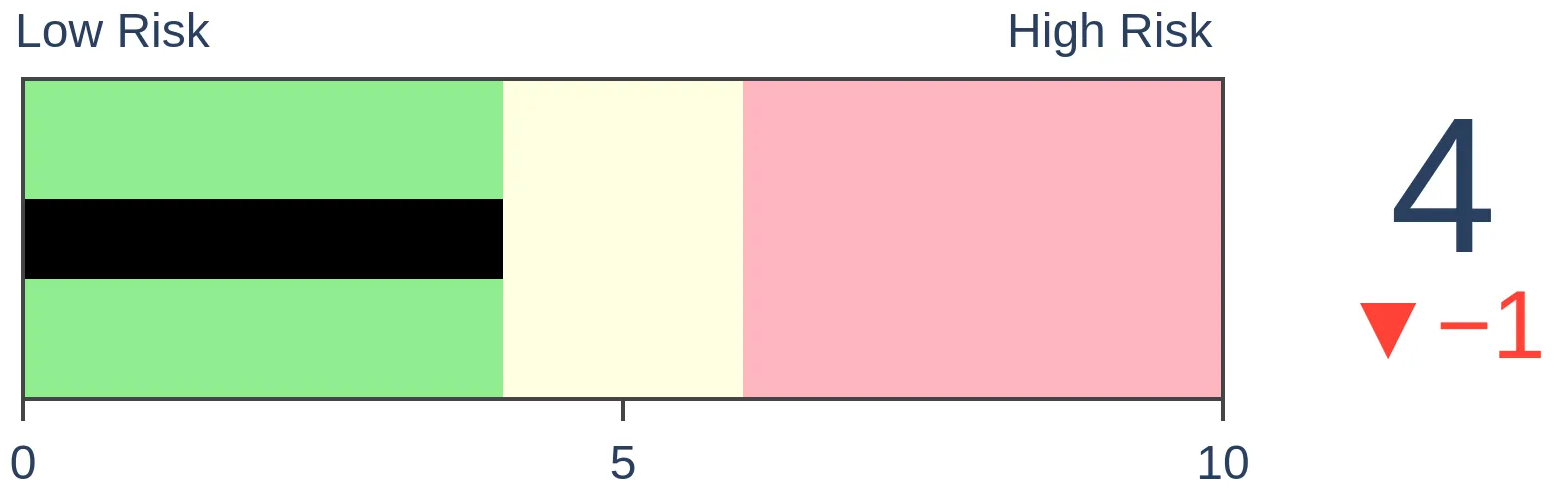
Stocks Short-Term

|
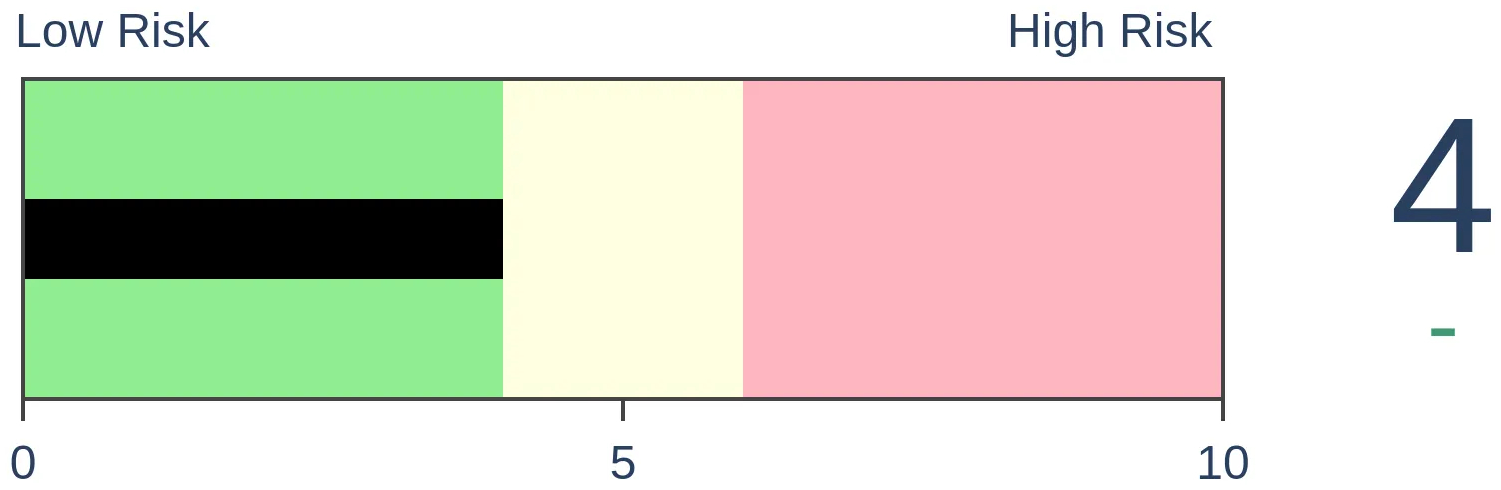
Stocks Medium-Term
|
|
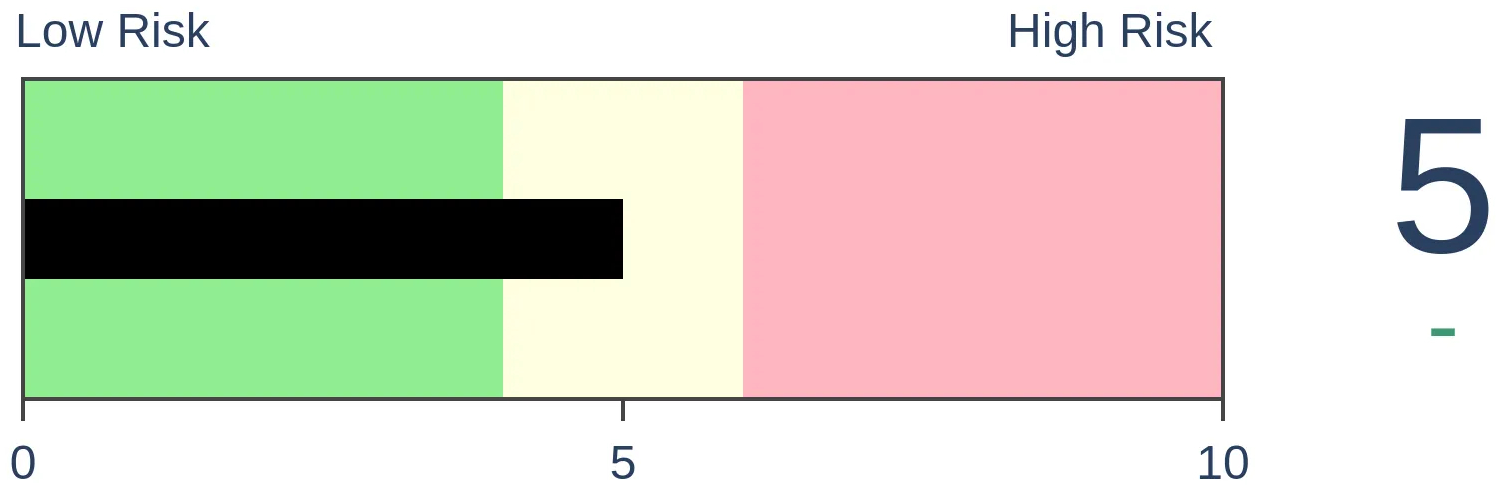
Bonds
|
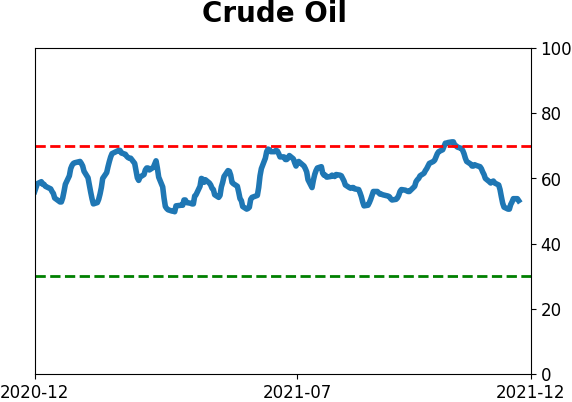
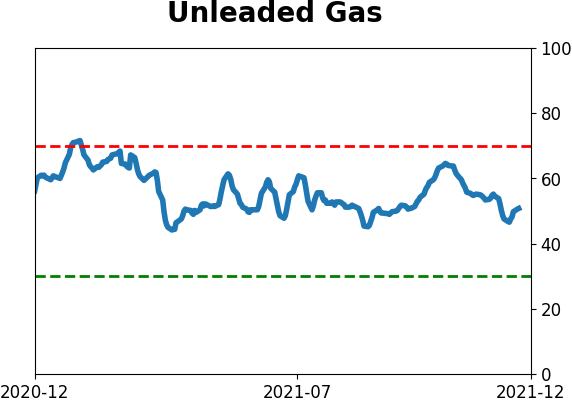
Crude Oil
|
|
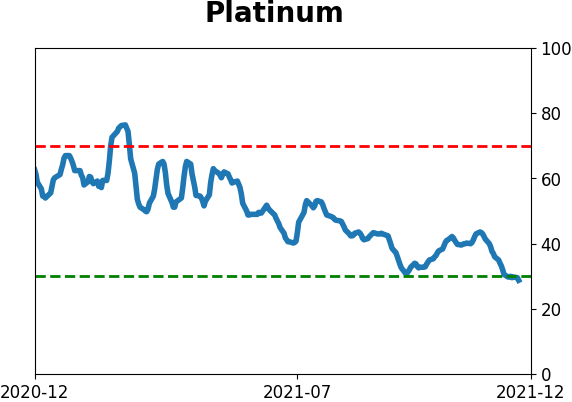
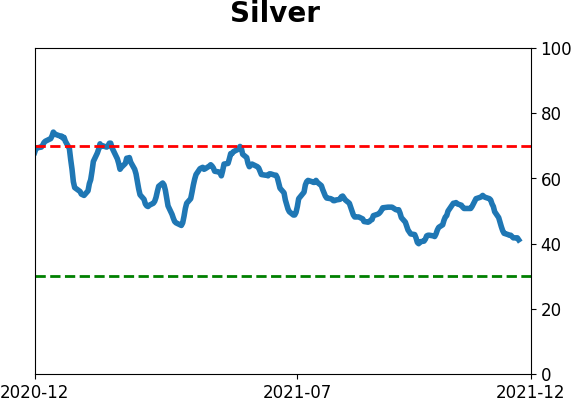
Gold
|
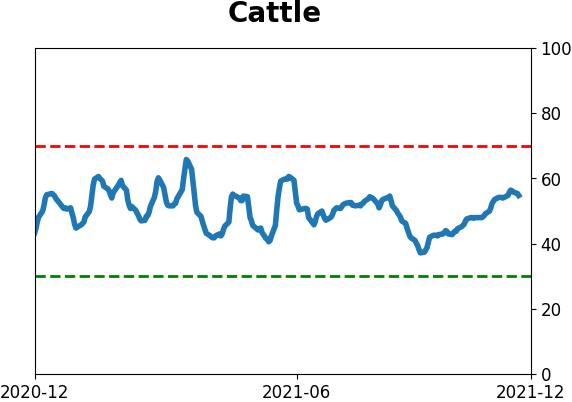
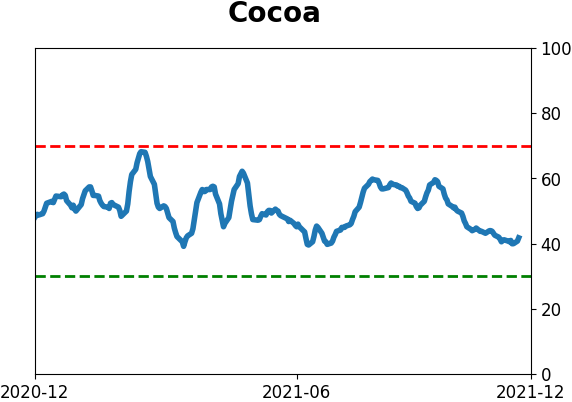
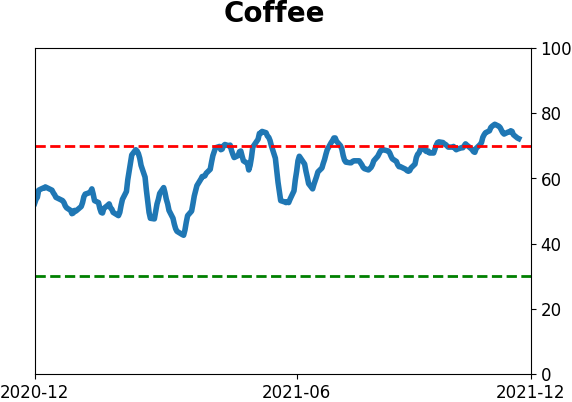
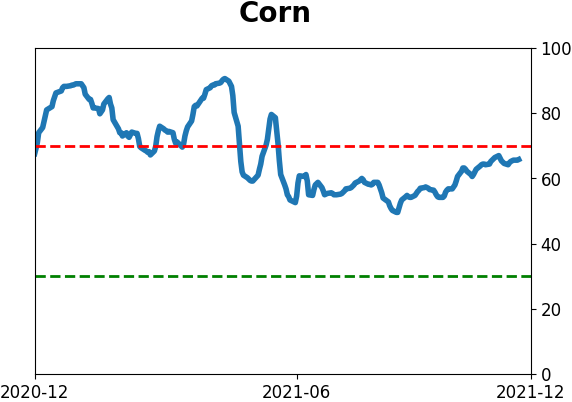
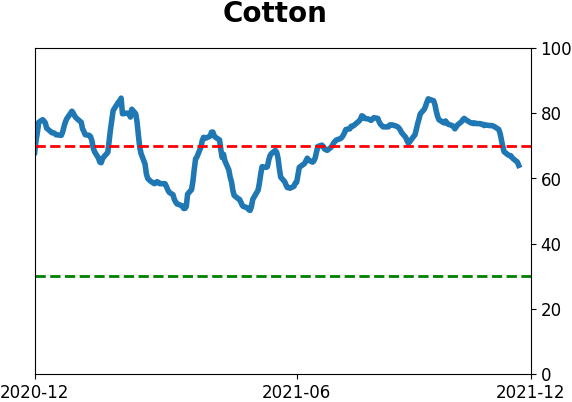
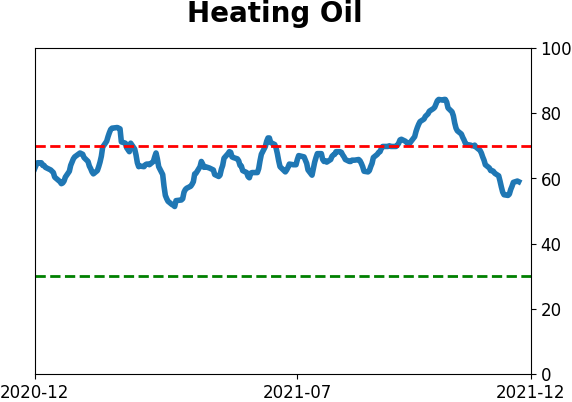
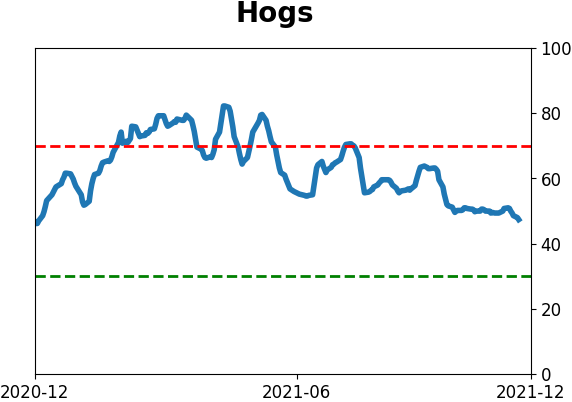
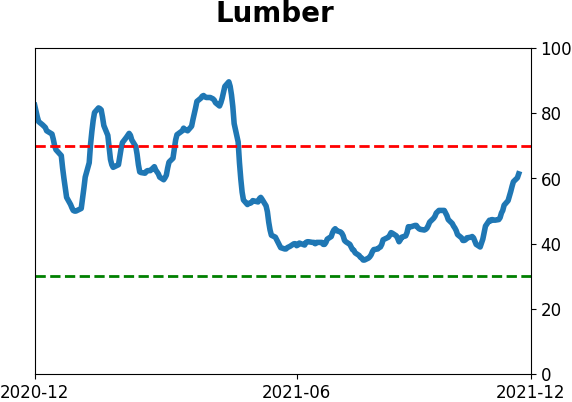
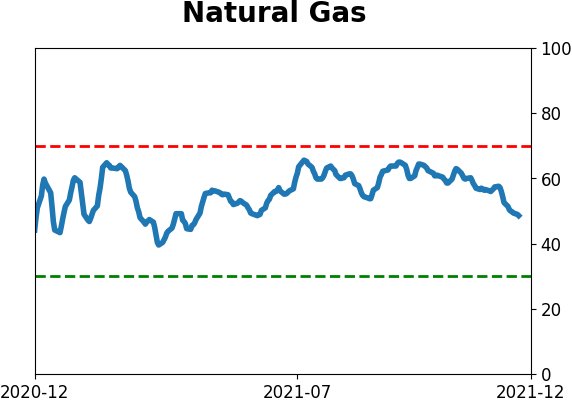
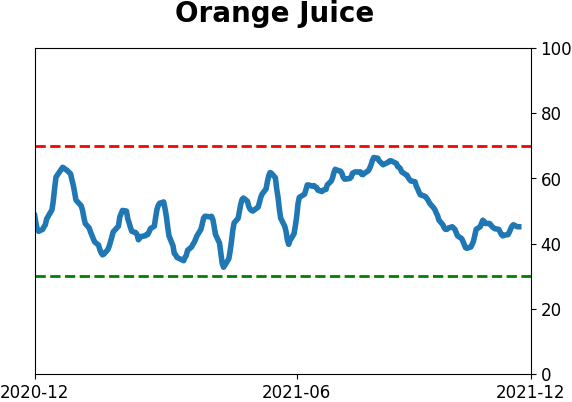
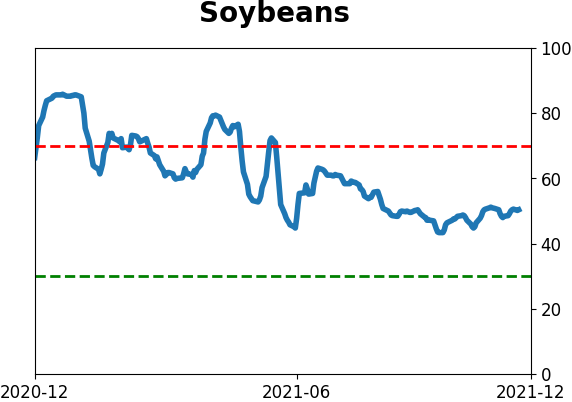
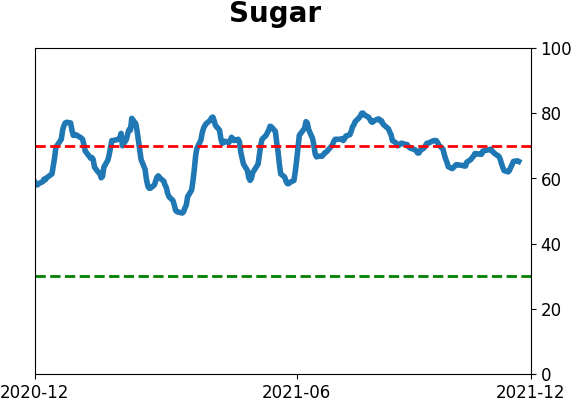
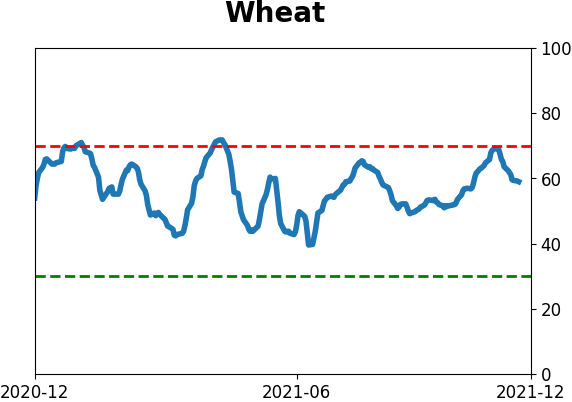
Agriculture

|
|
Research
By Jason Goepfert
BOTTOM LINE
There has been a quick shift in buying interest in Consumer Staples stocks. The percentage of them trading above their 10-day averages has swung from a deep oversold to high overbought extreme within days. It has pushed the McClellan Summation Index above 500. These have been good signs for the sector.
FORECAST / TIMEFRAME
XLP -- Up, Long-Term
|
Key points:
- Consumer Staples stocks have enjoyed a quick thrust in short-term breadth
- There is also a long-term recovery in internal momentum
- Corporate insiders have pulled back on selling
- Each of those factors has typically led to solid medium- to long-term gains for Staples
Short-term thrust in Staples
While breadth in more speculative areas is struggling, it most certainly isn't among more defensive names. On Monday, we saw how internals on the Nasdaq 100 are lagging the index. Broader breadth has been pretty good, even thrusty, and that's thanks to other sectors like Consumer Staples.
Heading into this week, there was a massive and sudden shift in short-term trends in Staples. Within a little over a week, fewer than 5% of stocks in the sector were trading above their 10-day moving averages, and then every single one of them was.
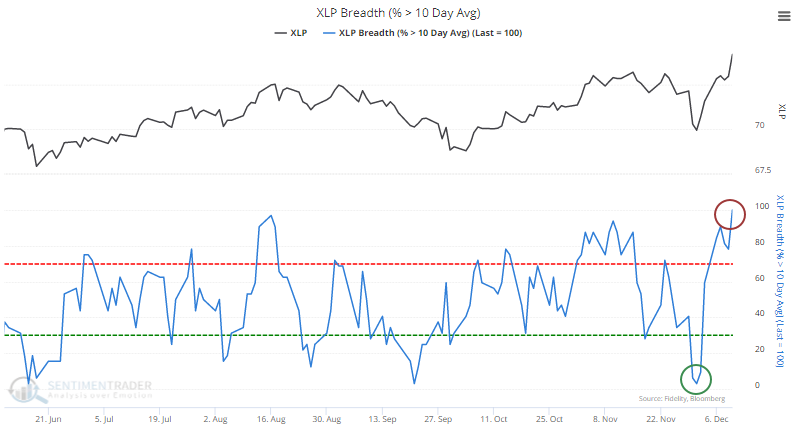
Even though it's a shorter-term gauge, we've seen that quick shifts suggest a reliable change in sentiment in prior years. That has been the case for Staples as well. Out of 15 signals, there were few losses after a month and beyond.
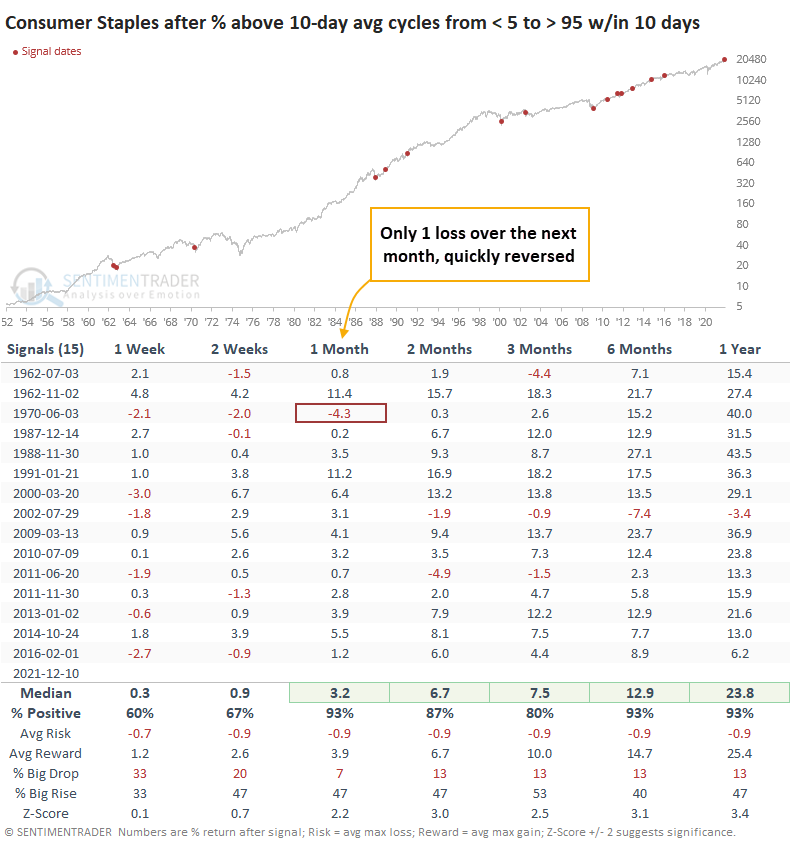
The precedents showed an excellent risk/reward profile and probability of a big rise versus a big drop. While a couple of the signals ended up giving back the early gains, the sector continued to enjoy large and consistent gains in the months ahead overall.
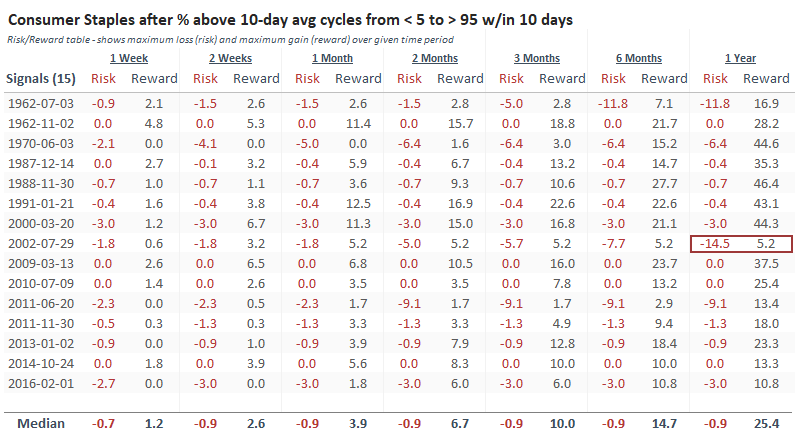
Looking at the Risk/Reward Table, only 1 of them showed more risk than reward during the following year; the others were heavily skewed to "reward."
Staples' longer-term recovery
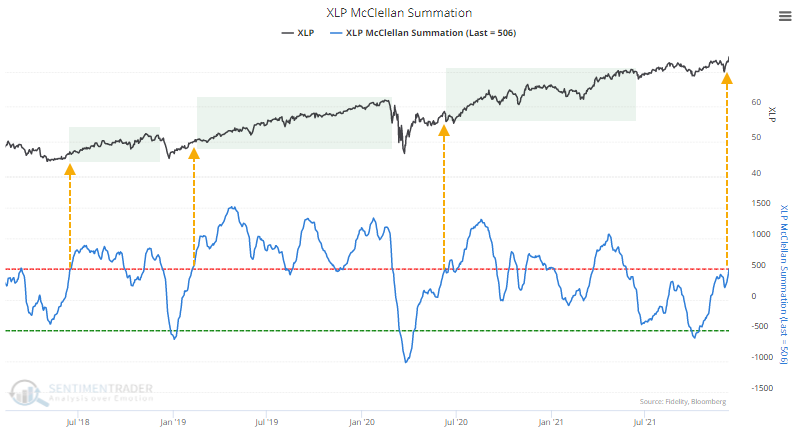
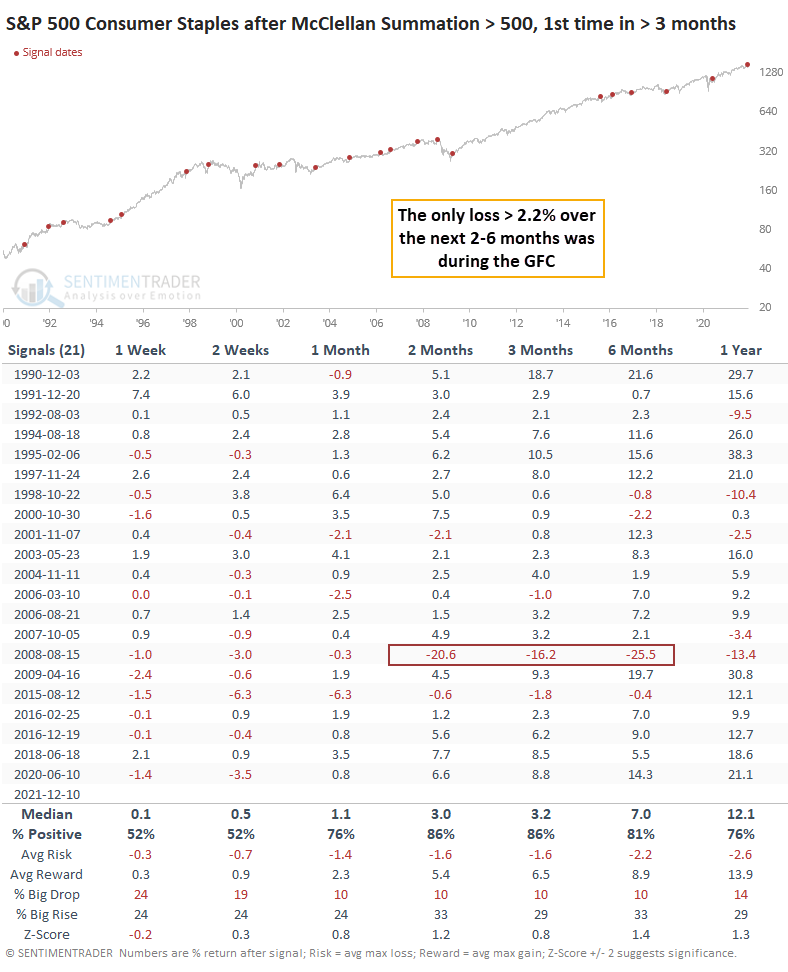
The short-term reversals in many stocks have helped push the long-term McClellan Summation Index for Staples above +500 for the first time in more than 6 months. In recent years, a move above +500 was the kick-off before significant, sustained gains in the sector.
Looking back more than 30 years, the first reading above +500 in several months preceded consistent gains. The only loss of more than 2.2% during the next 2-6 months was during the Great Financial Crisis.
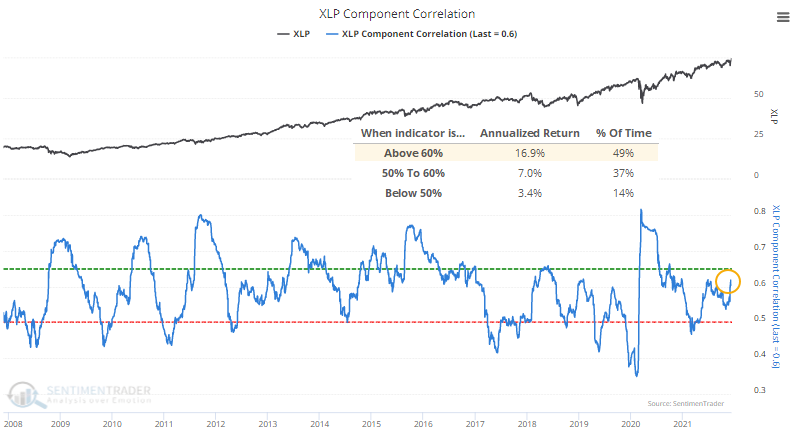
Dispersion is high as the smart money pulls back on selling
Even though Staples stocks have been doing well, there is still some dispersion within the stocks in the sector.
The component correlation between the average stock and the index is still relatively high. That's a good thing; it suggests a healthy amount of investor skepticism. We should worry more when correlation among the stocks is low because it highlights periods of group-think.
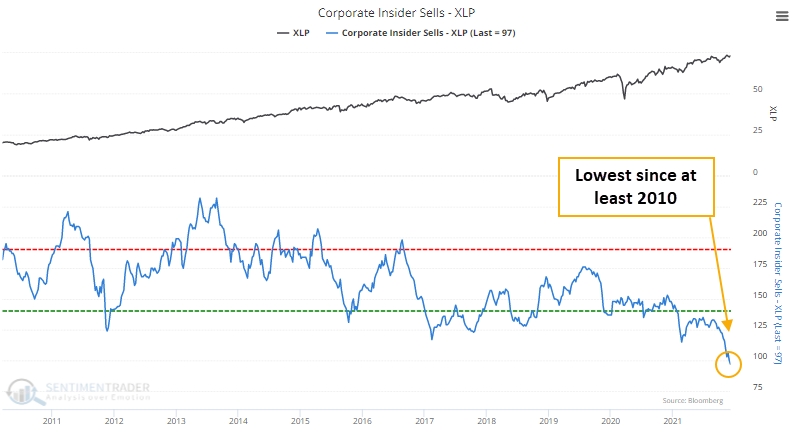
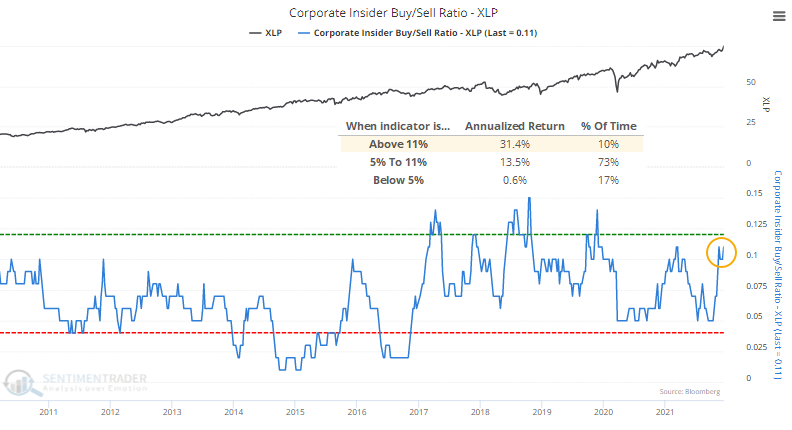
Buying activity hasn't been very inspiring among corporate insiders, but selling transactions have dropped off to a decade low.
That dynamic has kept the Corporate Insider Buy/Sell Ratio for the sector on the upper end of its range. Annualized returns were impressive when the ratio was high, well above returns at the opposite end of the spectrum.
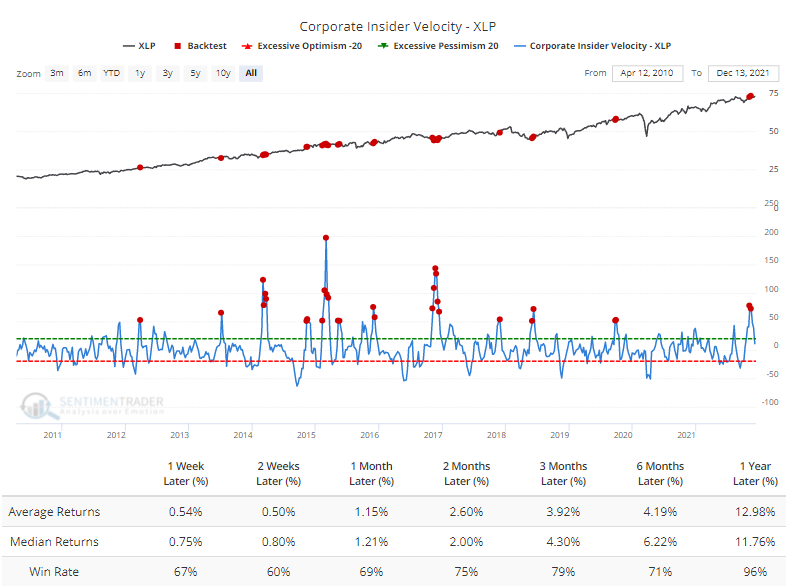
The recent jump in insider buying versus selling transactions pushed Insider Velocity above 50%, which the Backtest Engine shows was a good sign for future returns, especially over the next year.
What the research tells us...
From a broader market perspective, it's curious that we see negative thrusts and divergences in higher-risk areas like the Nasdaq 100 and the opposite in defensive sectors like Consumer Staples. That's not a big vote of confidence in stocks in aggregate.
For Staples themselves, this kind of activity has been a good sign for the medium- to long-term. Staples have a poor seasonal window during January-February, and other indicators are mostly neutral. But the combination of a positive short-term thrust under the surface, improving long-term internal momentum, and a lack of insider selling suggests higher prices.
Active Studies
| Time Frame | Bullish | Bearish | | Short-Term | 2 | 3 | | Medium-Term | 13 | 2 | | Long-Term | 16 | 8 |
|
Indicators at Extremes
Portfolio
| Position | Description | Weight % | Added / Reduced | Date | | Stocks | RSP | 10.7 | Added 6.4% | 2021-10-01 | | Bonds | 32.7% BND, 7.1% SCHP | 39.8 | Added 8.3% | 2021-10-26 | | Commodities | GCC | 2.4 | Reduced 2.1%
| 2020-09-04 | | Precious Metals | GDX | 4.6 | Reduced 4.2% | 2021-05-19 | | Special Situations | 9.8% KWEB, 4.7% XLE, 2.9% PSCE | 17.3 | Added 9.78% | 2021-10-01 | | Cash | | 24.1 | | |
|
Updates (Changes made today are underlined)
Much of our momentum and trend work has remained positive for several months, with some scattered exceptions. Almost all sentiment-related work has shown a poor risk/reward ratio for stocks, especially as speculation drove to record highs in exuberance in February. Much of that has worn off, and most of our models are back toward neutral levels. There isn't much to be excited about here. The same goes for bonds and even gold. Gold has been performing well lately and is back above long-term trend lines. The issue is that it has a poor record of holding onto gains when attempting a long-term trend change like this, so we'll take a wait-and-see approach. Momentum has ebbed quickly in recent weeks, and nearing oversold levels in some indicators. This can be a dangerous area, with a lot of short-term volatility, but we'd be more inclined to add medium- to long-term exposure rather than sell on much more of a decline, thanks to already rock-bottom exposure. Other areas look more attractive, including some overseas markets. RETURN YTD: 8.1% 2020: 8.1%, 2019: 12.6%, 2018: 0.6%, 2017: 3.8%, 2016: 17.1%, 2015: 9.2%, 2014: 14.5%, 2013: 2.2%, 2012: 10.8%, 2011: 16.5%, 2010: 15.3%, 2009: 23.9%, 2008: 16.2%, 2007: 7.8%
|
|
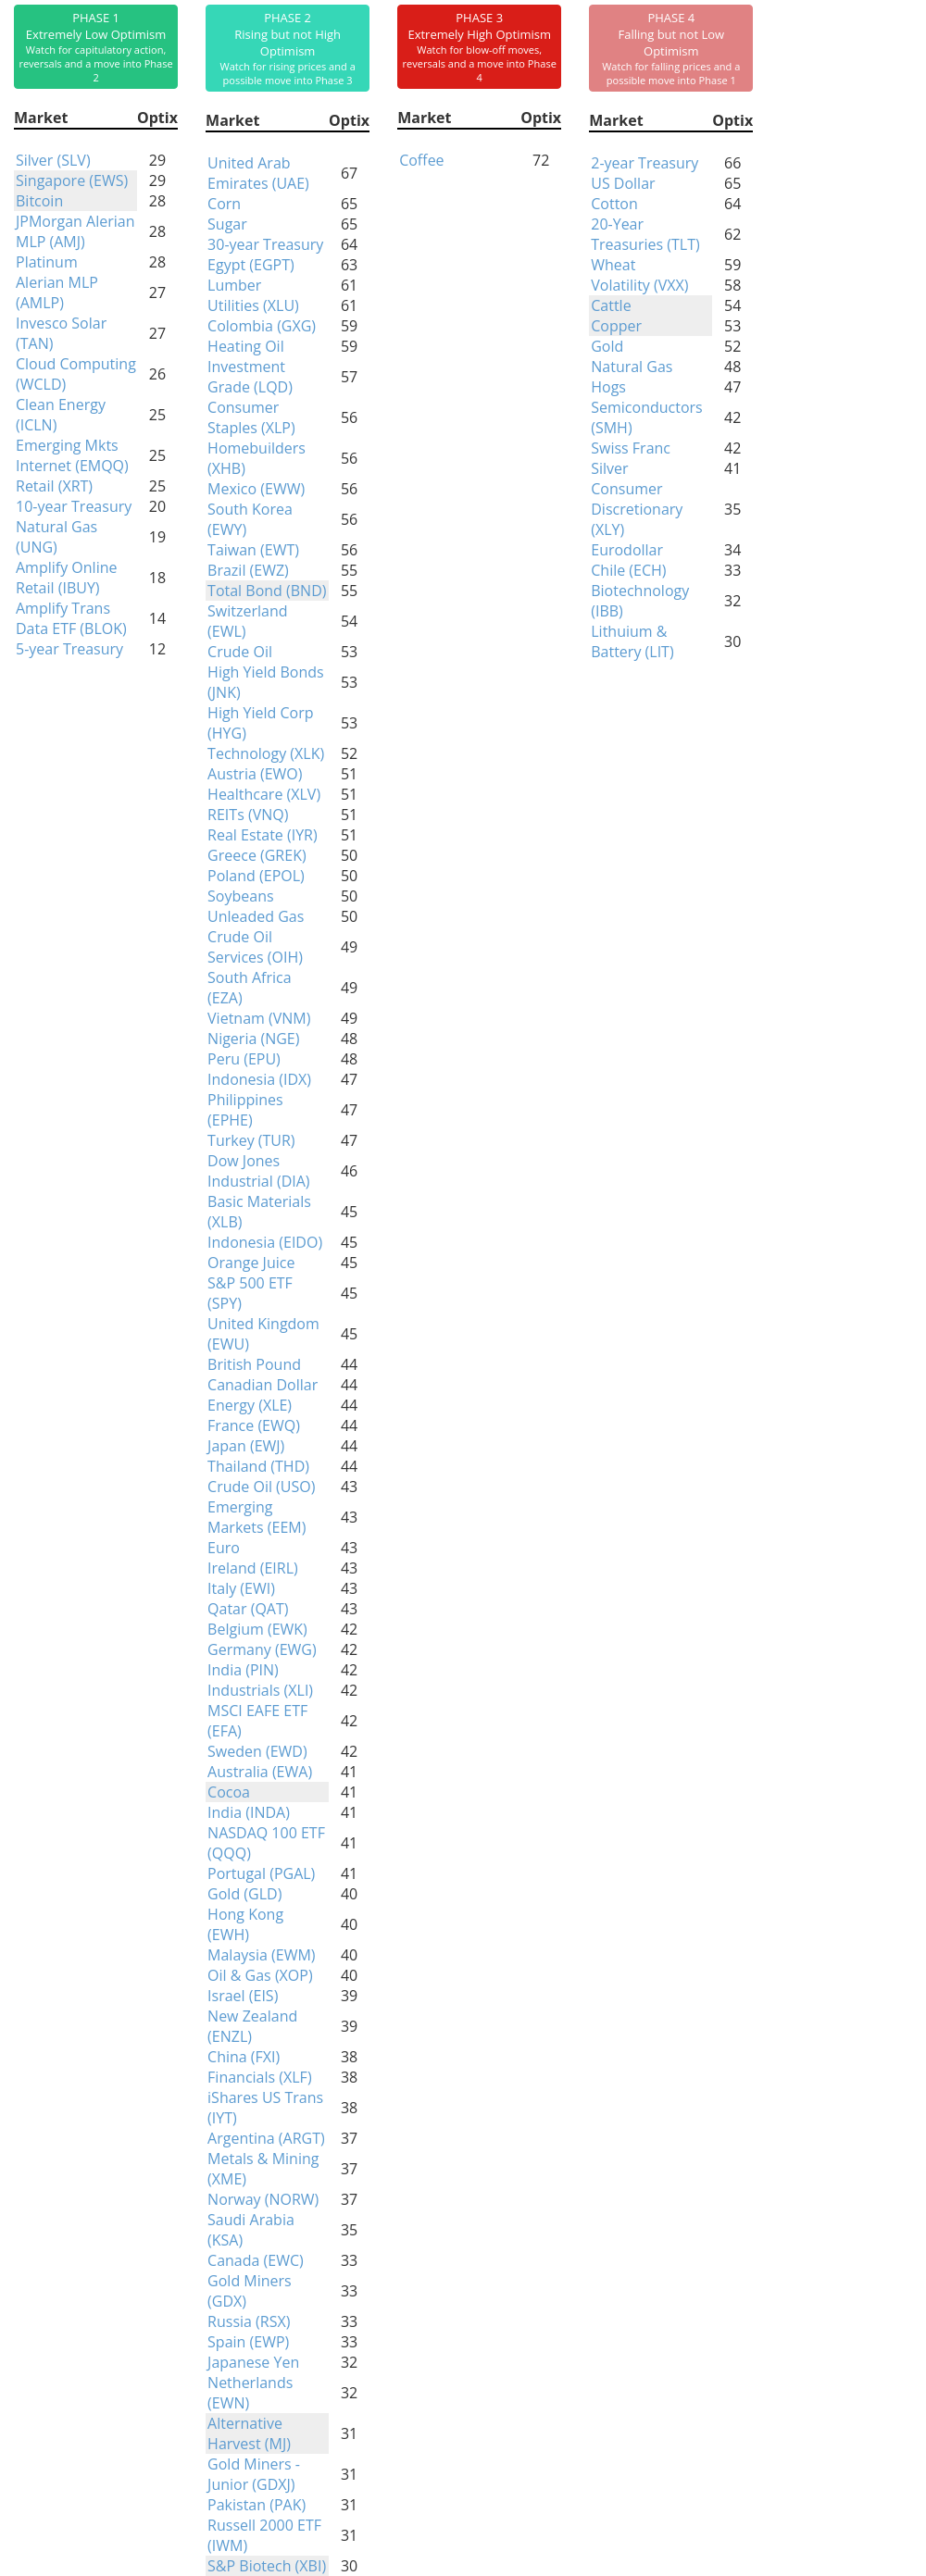
Phase Table
Ranks
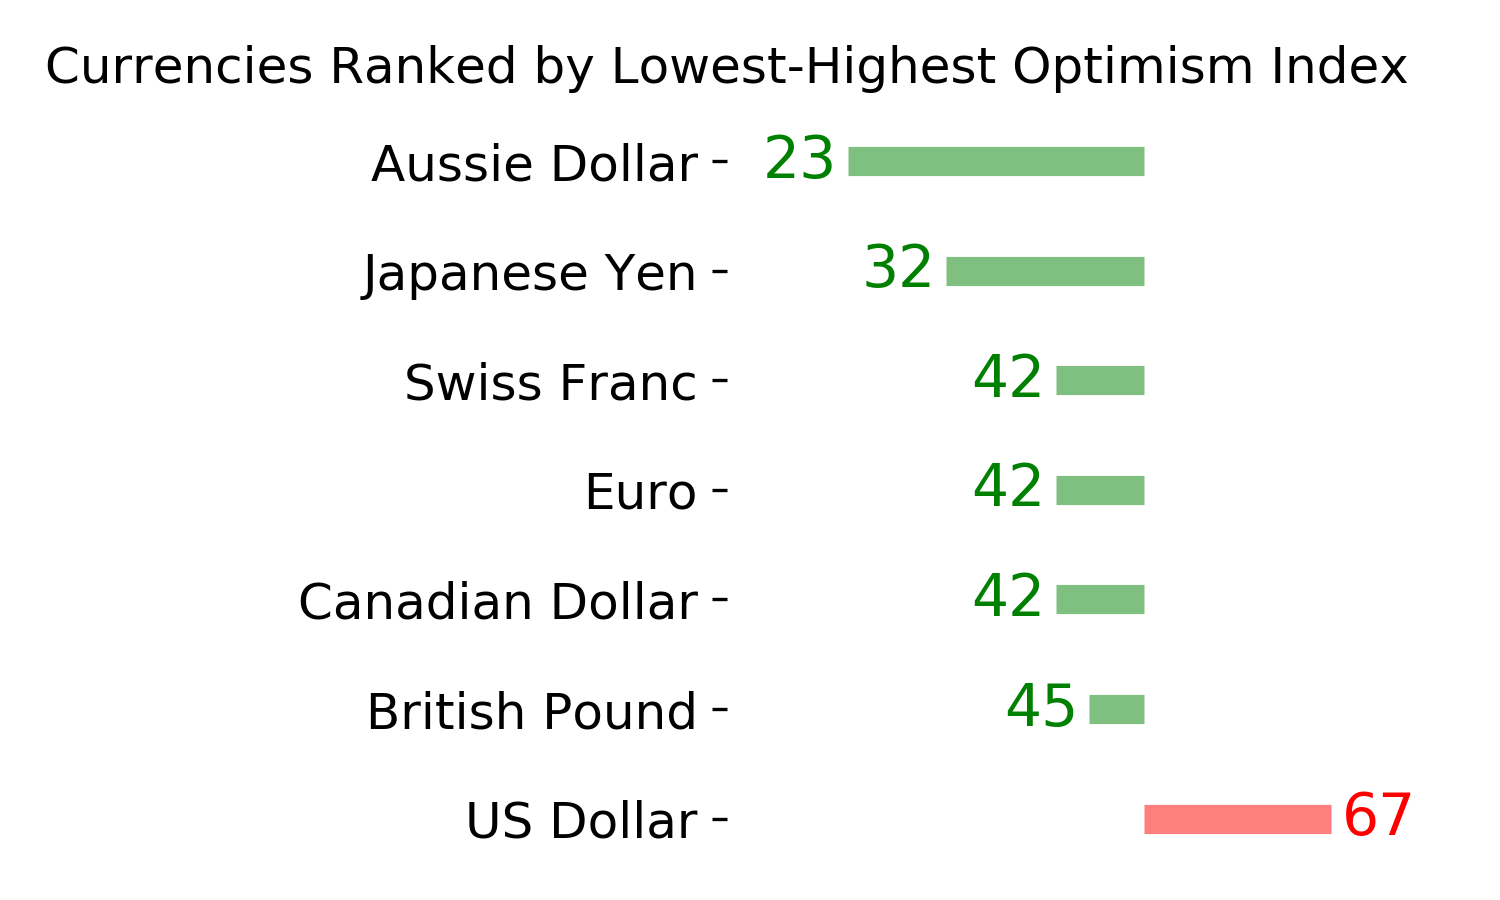
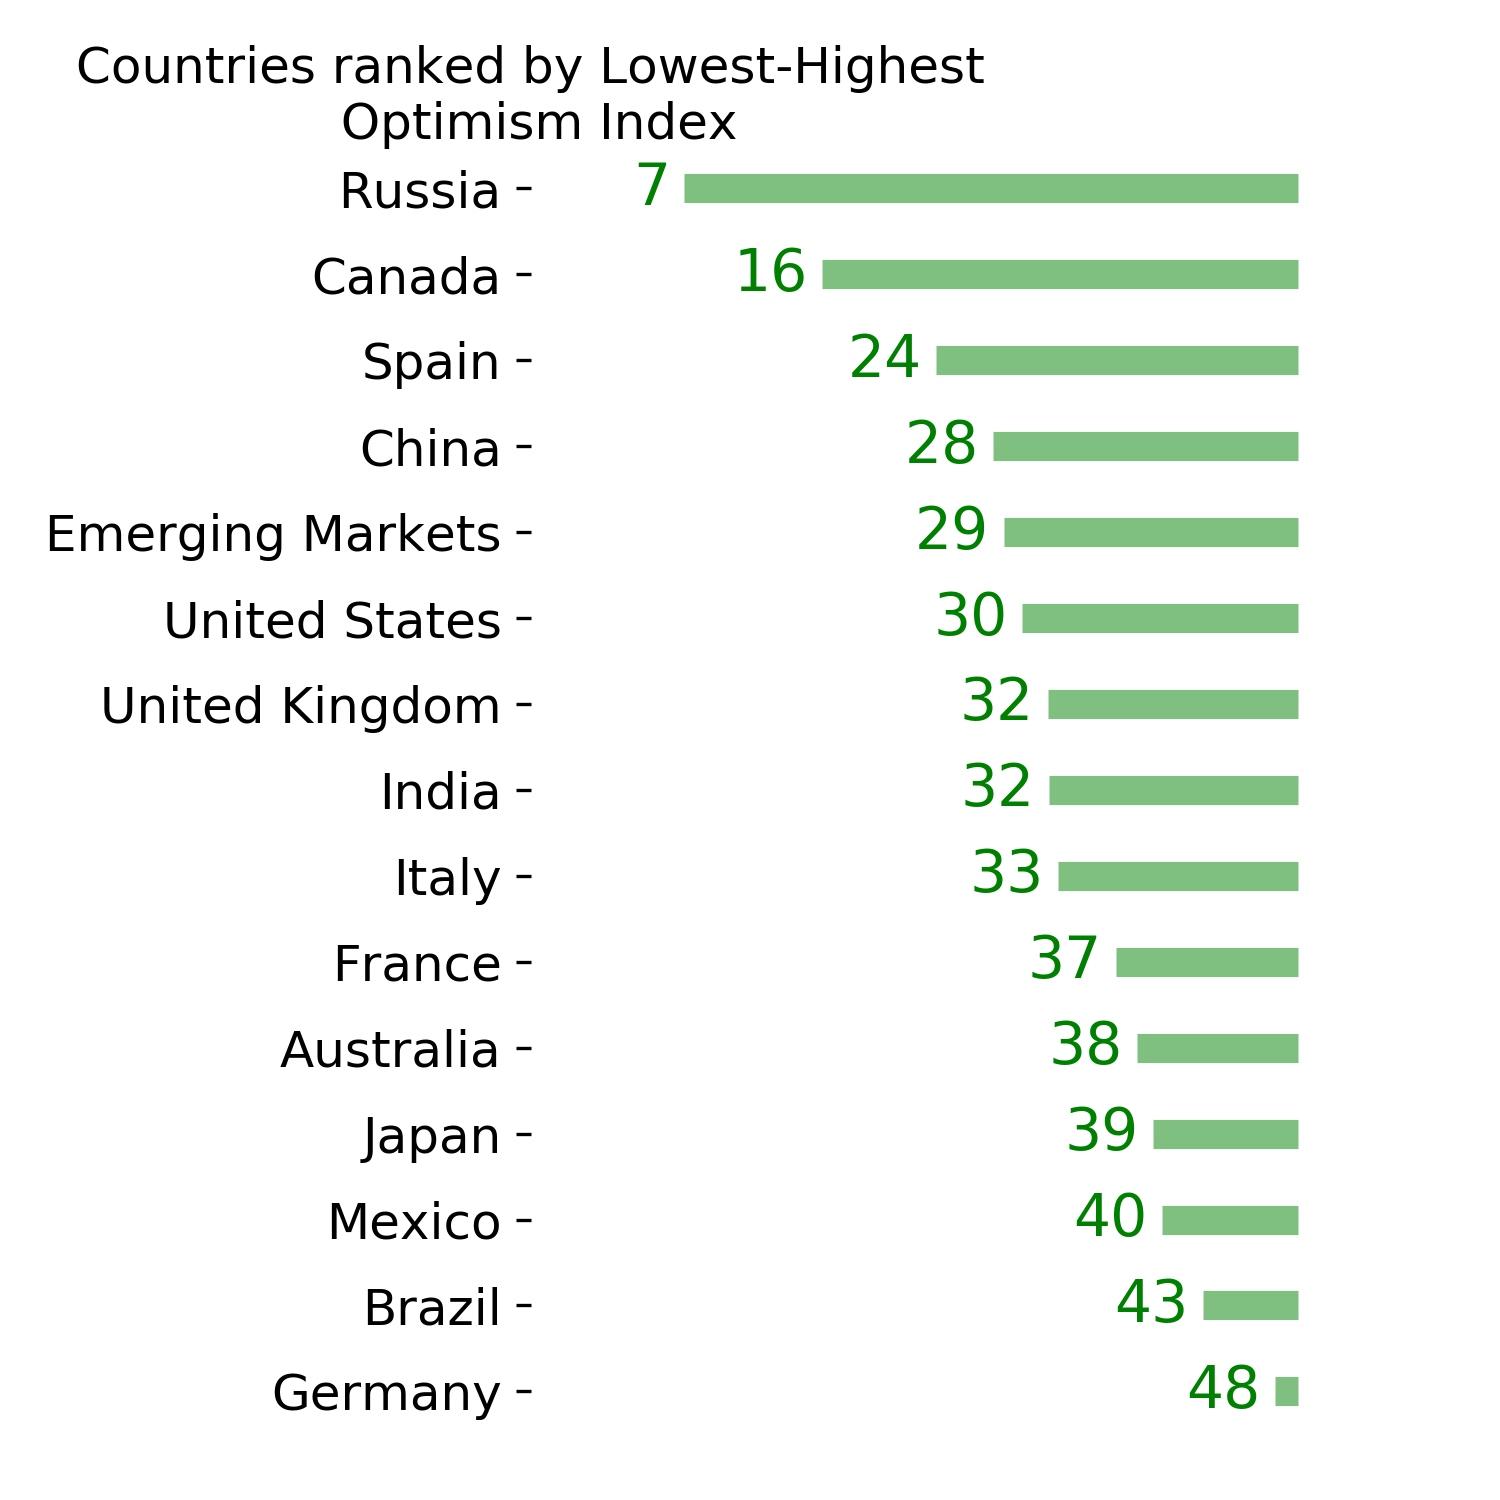
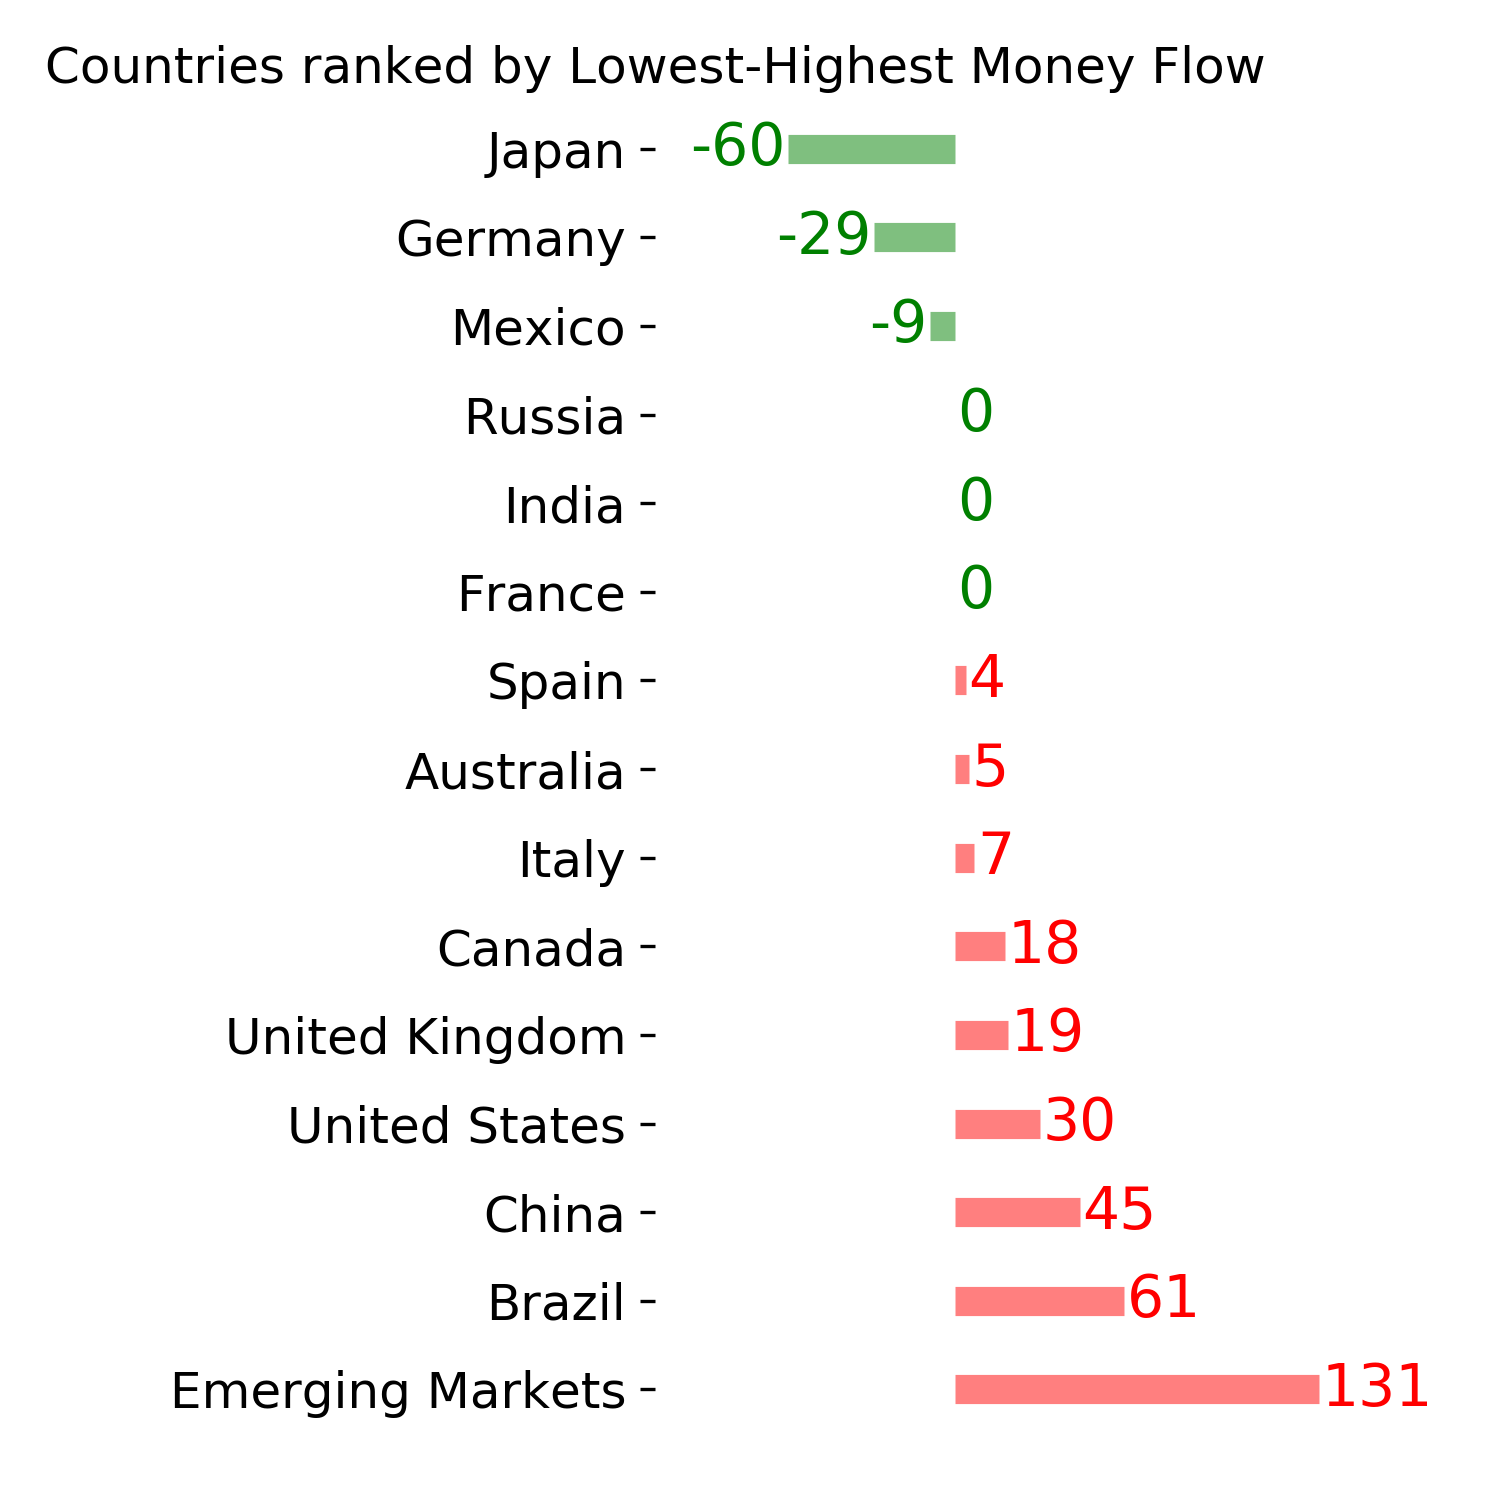
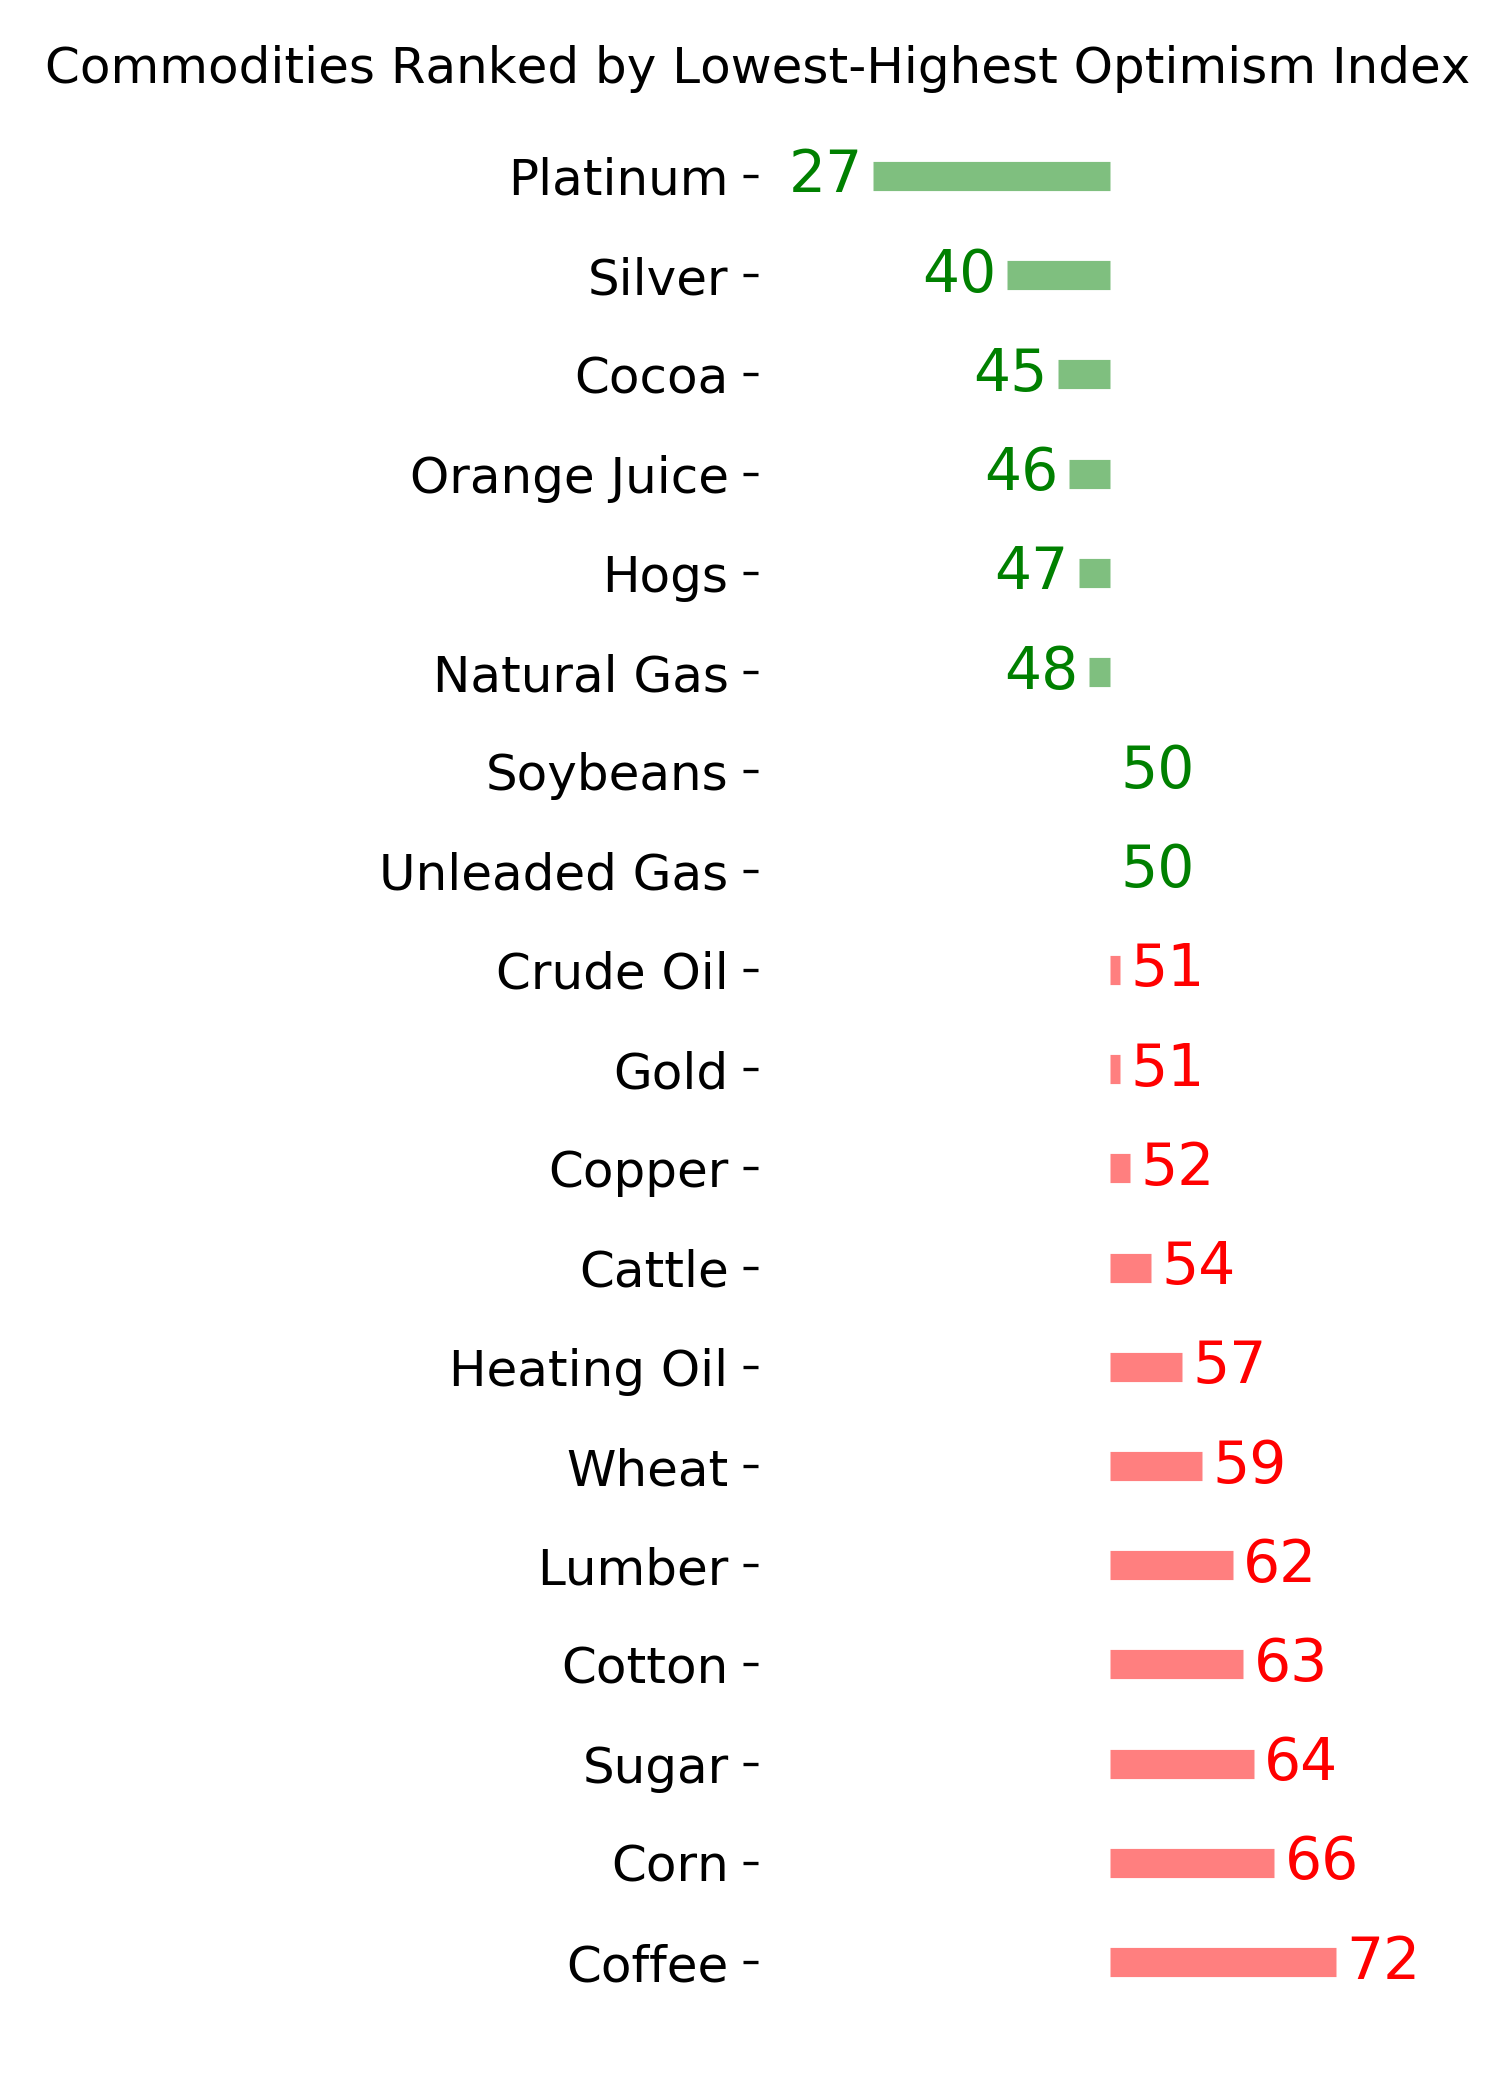
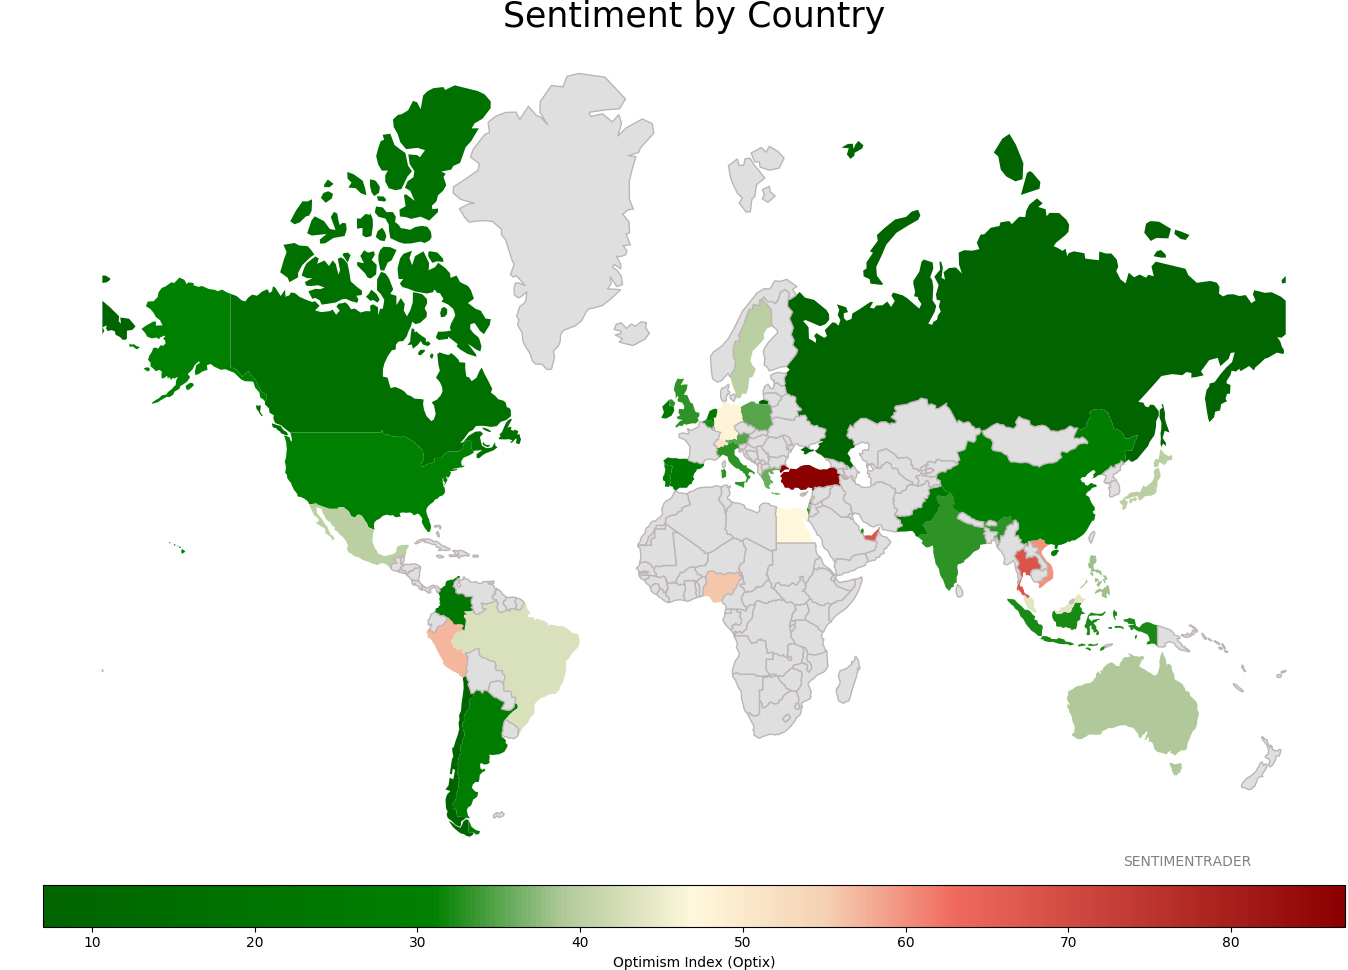
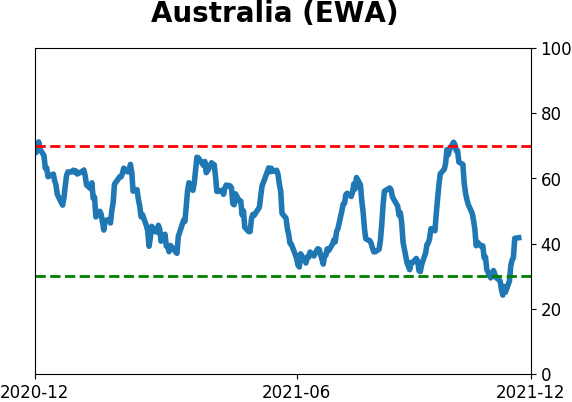
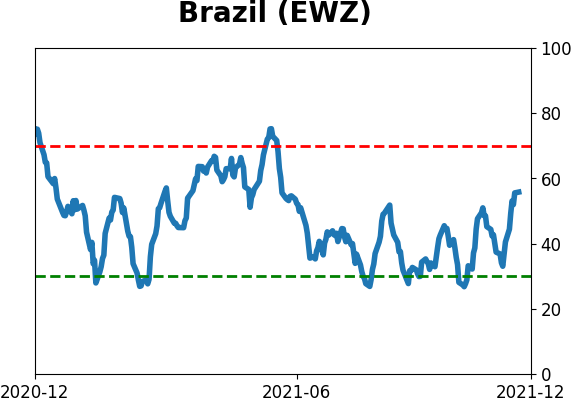
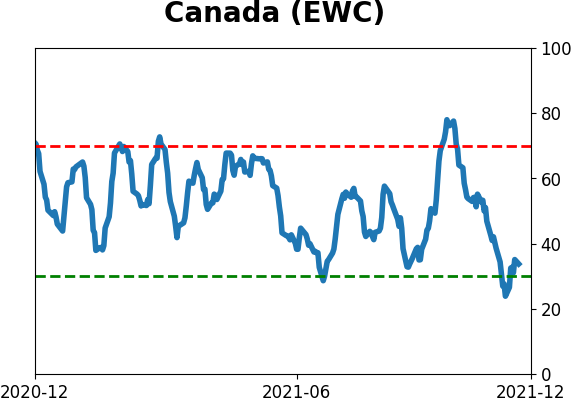
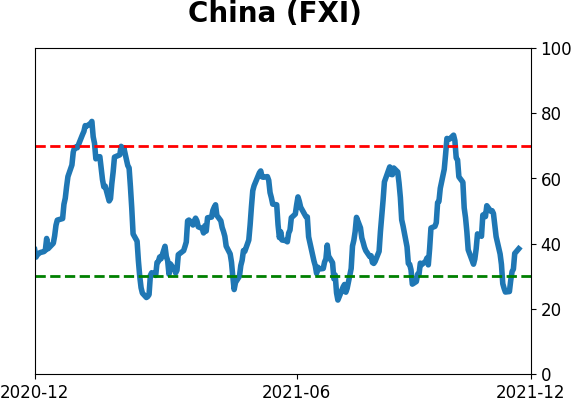
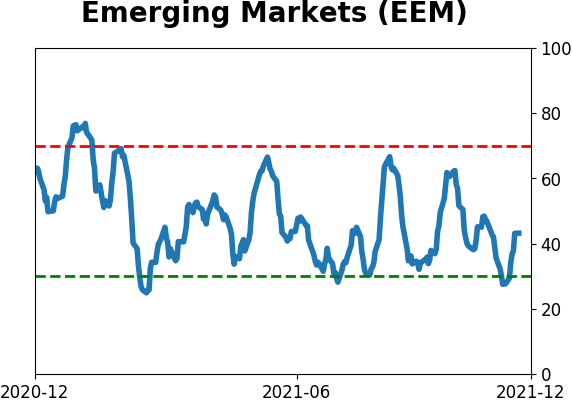
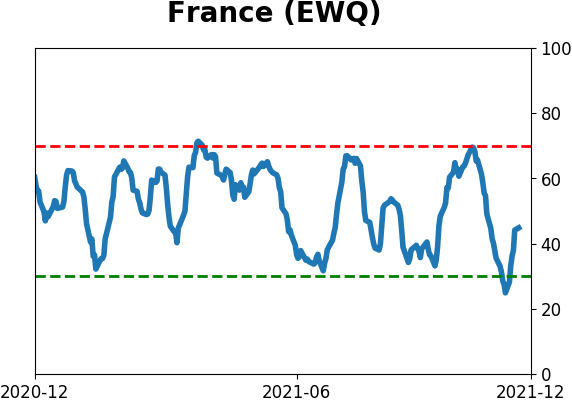
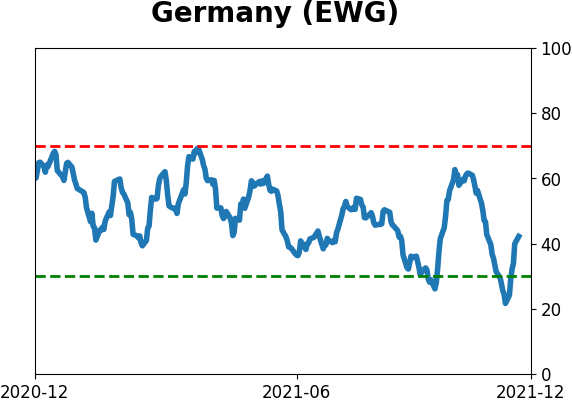
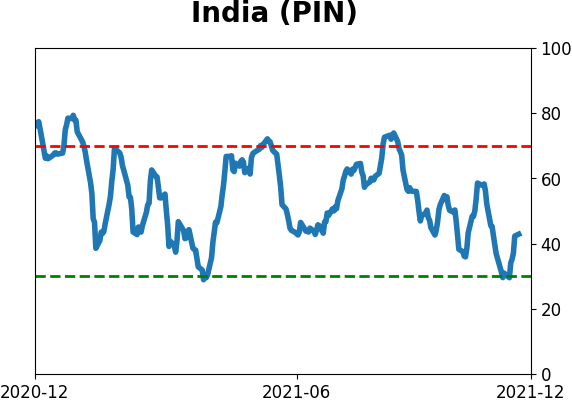
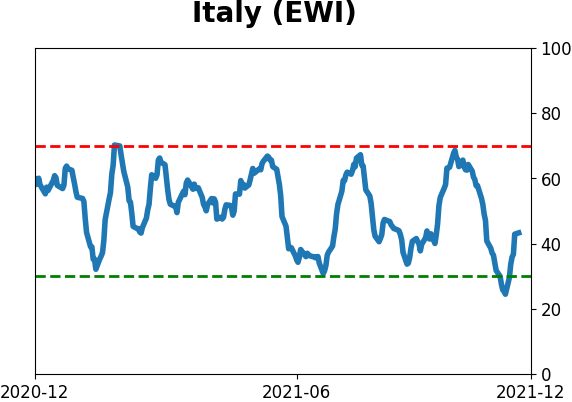
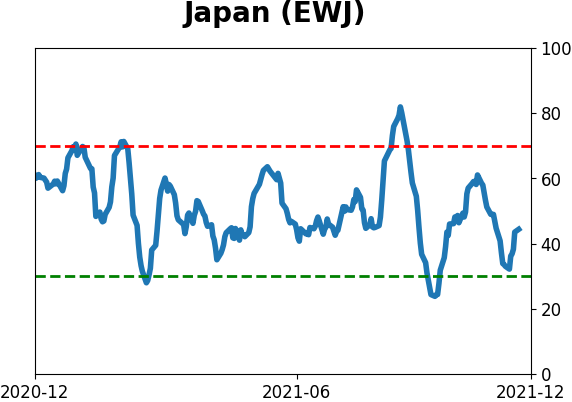
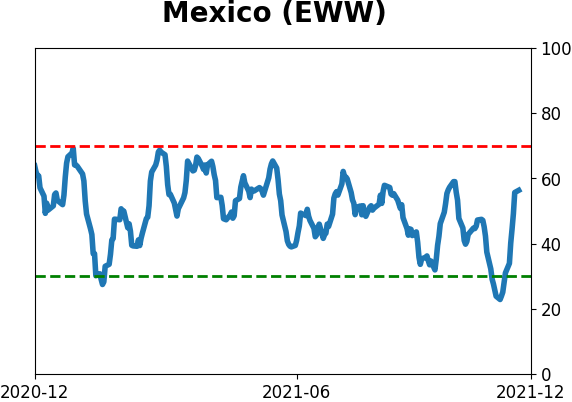
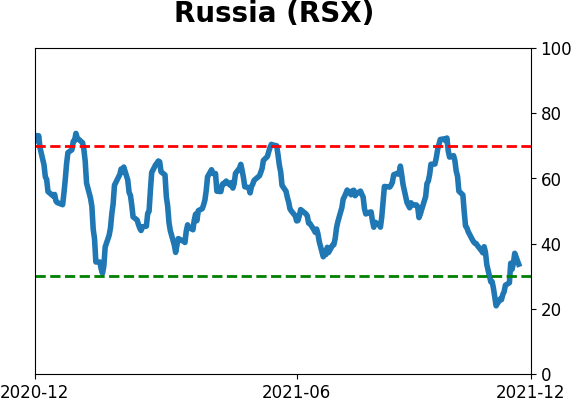
Sentiment Around The World
Optimism Index Thumbnails
|
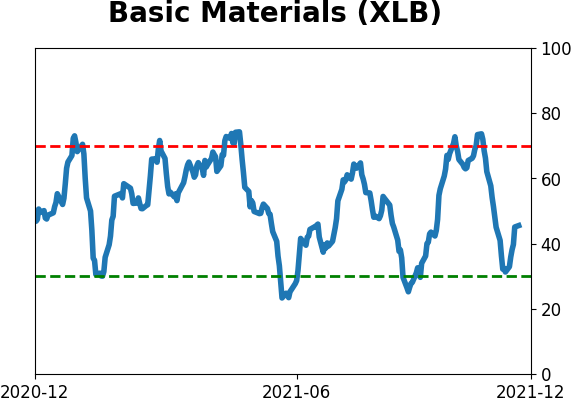
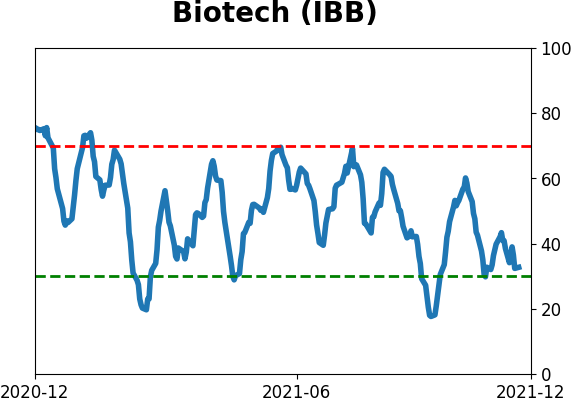
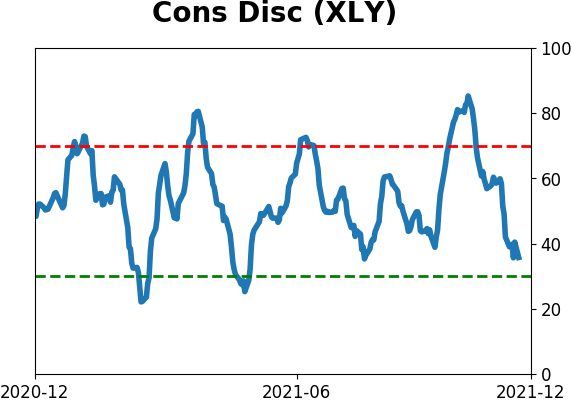
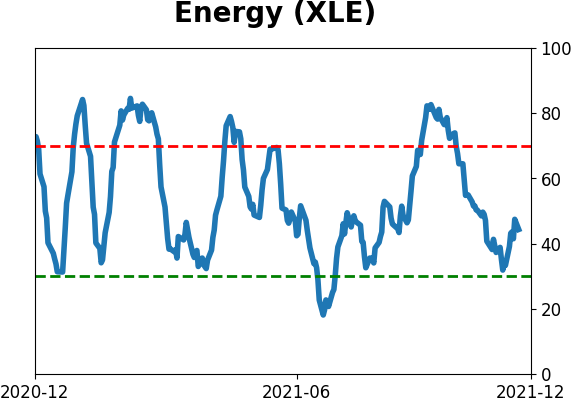
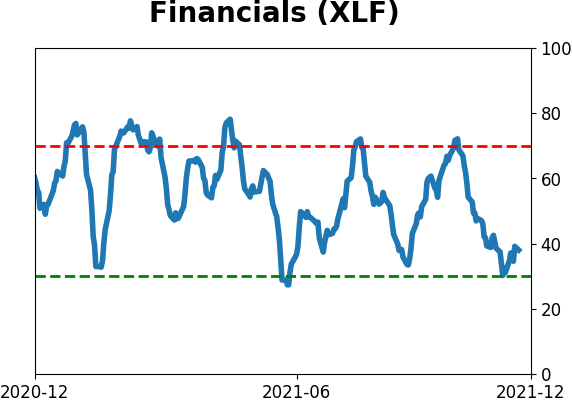
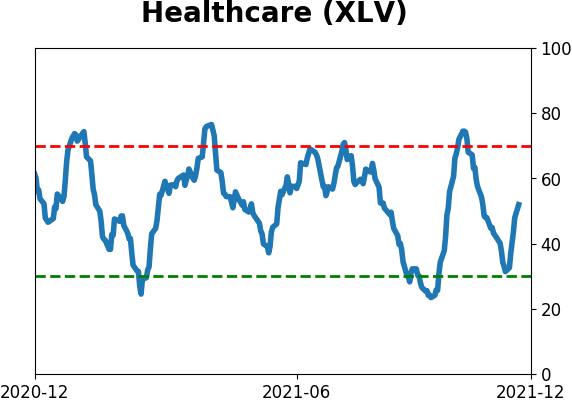
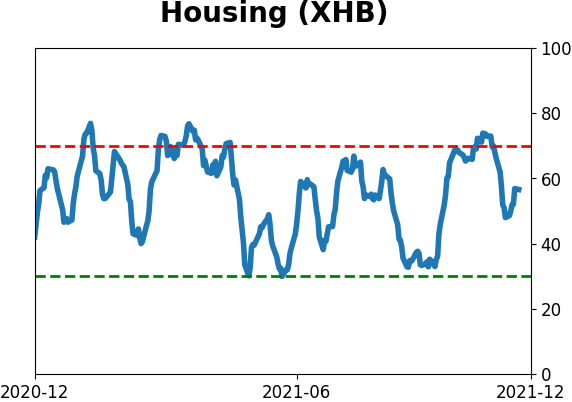
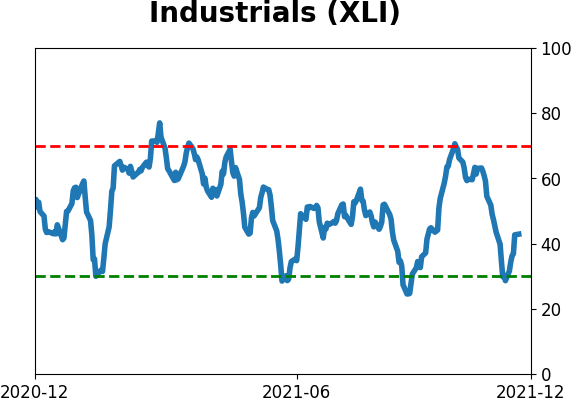
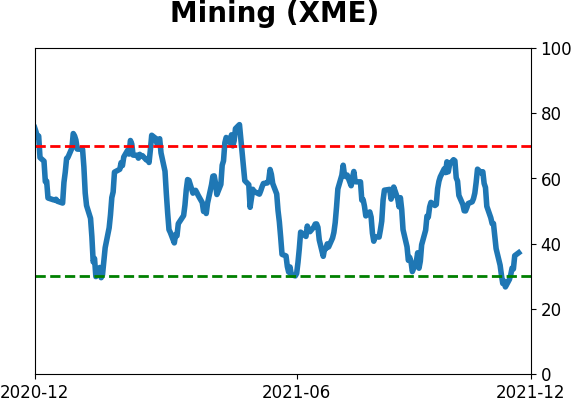
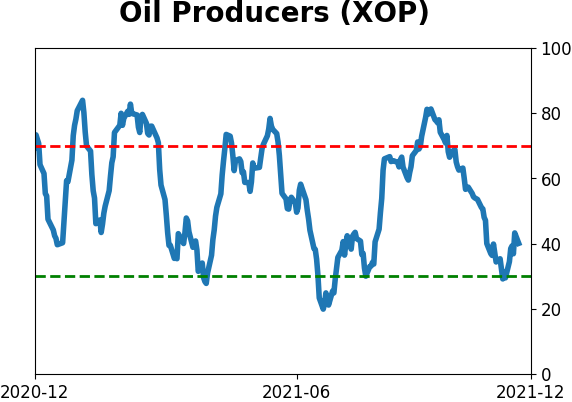
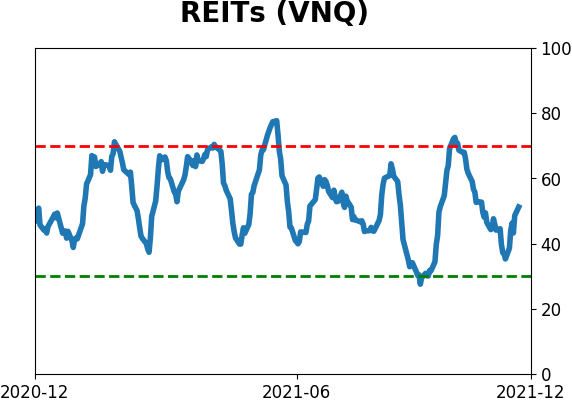
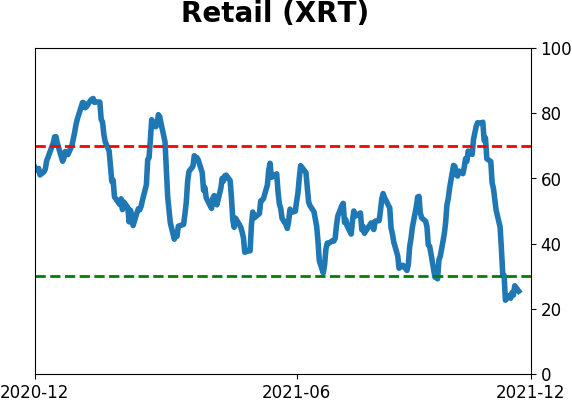
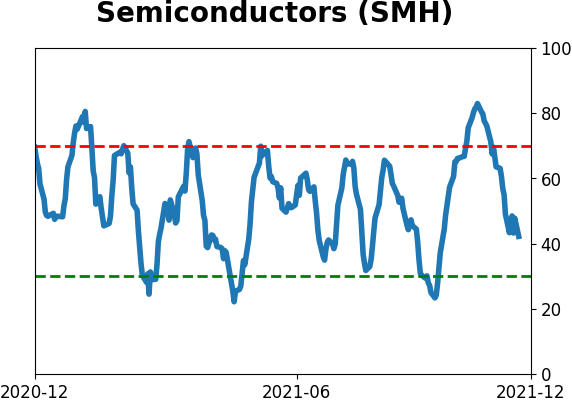
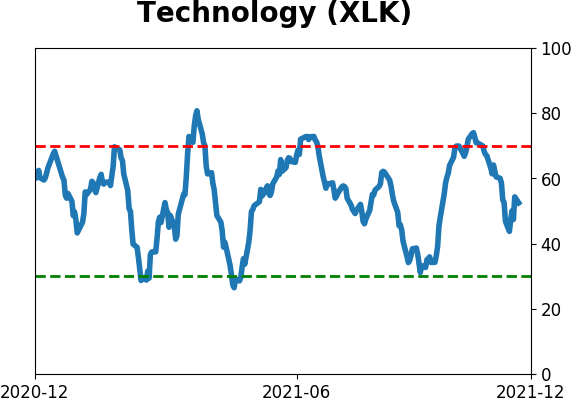
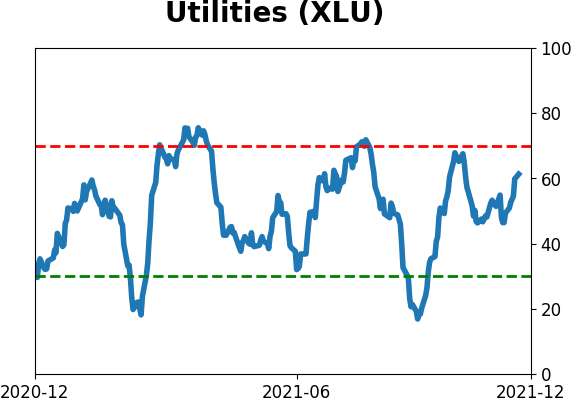
Sector ETF's - 10-Day Moving Average
|
|
|
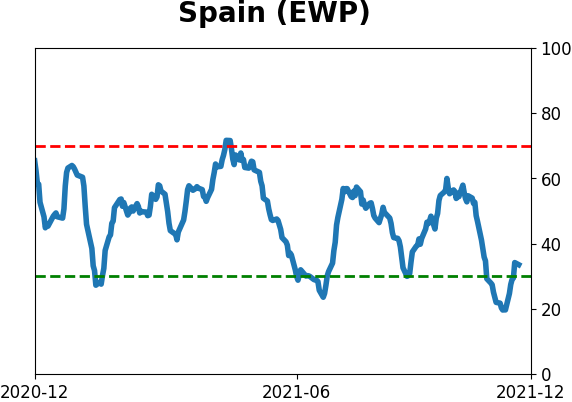
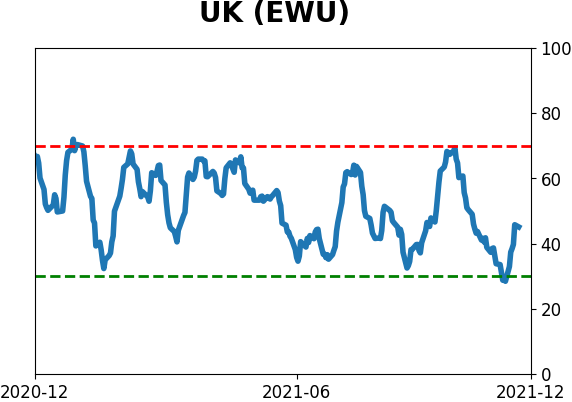
Country ETF's - 10-Day Moving Average
|
|
|
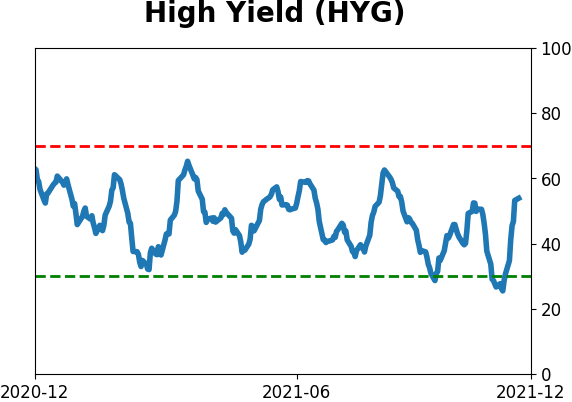
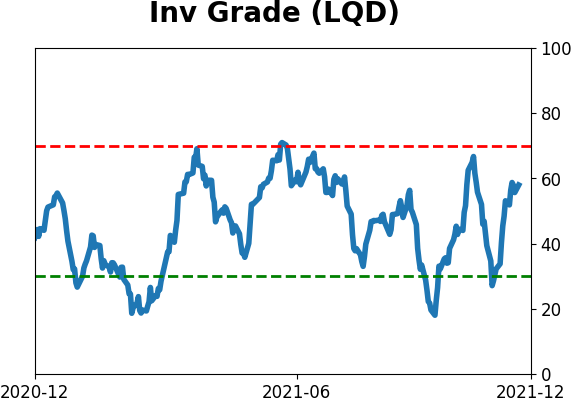
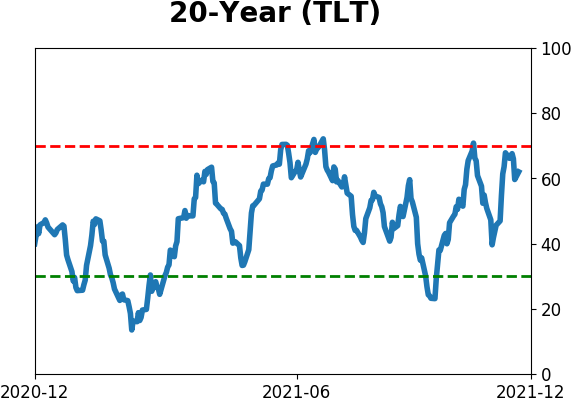
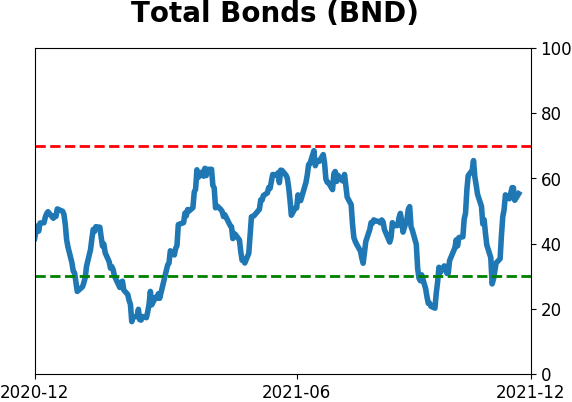
Bond ETF's - 10-Day Moving Average
|
|
|
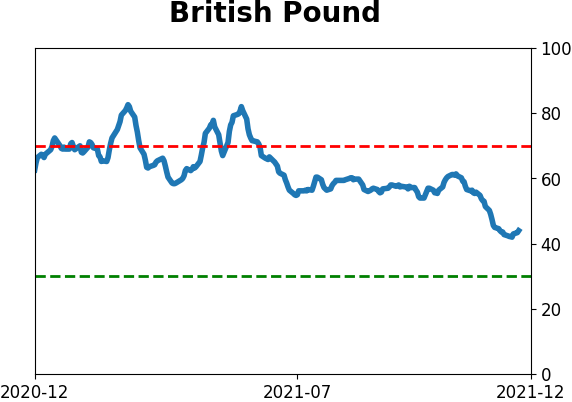
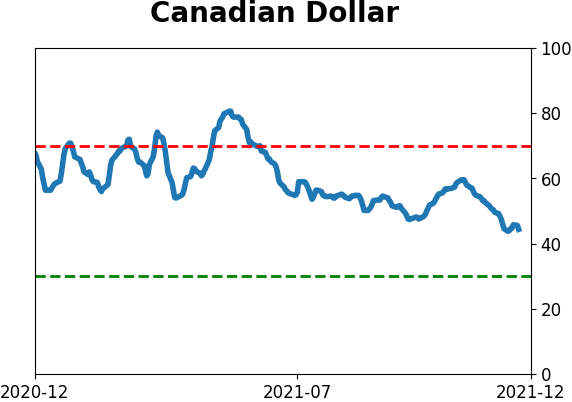
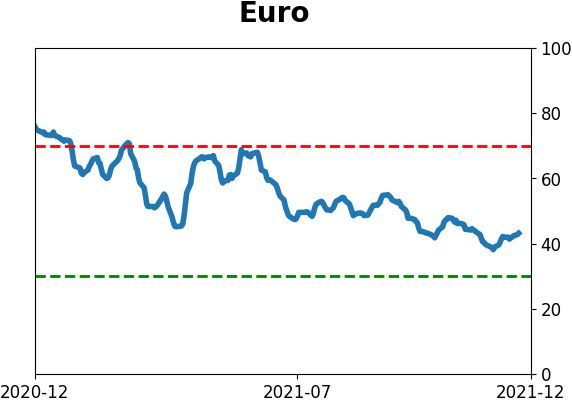
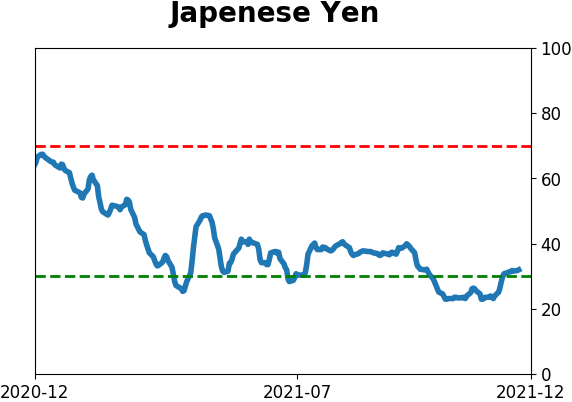
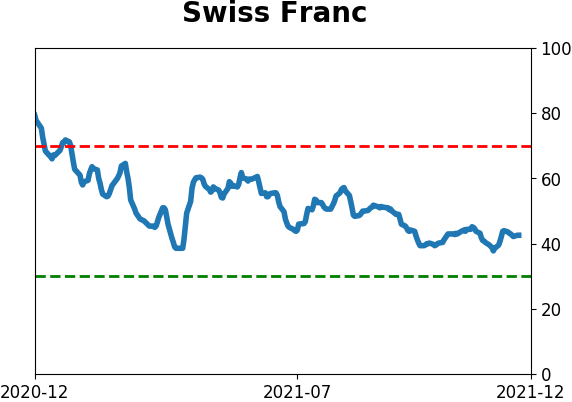
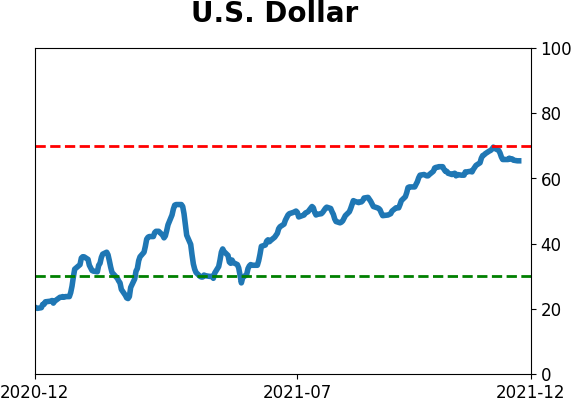
Currency ETF's - 5-Day Moving Average
|
|
|
Commodity ETF's - 5-Day Moving Average
|
|