Headlines
|
|
Why the Nasdaq 100 looks vulnerable:
As the Nasdaq 100 marches higher, driven by a few gigantic stocks, fewer of its members are participating. There has been a cluster of negative divergences over the past 30 days, arguing for limited gains in the index.
Bottom Line:
STOCKS: Hold By early October, sentiment had reset. Several important momentum streaks ended, which has brought in buyers in the past, and seasonality turned positive. We're now seeing signs that sentiment has quickly shifted, especially among options traders. It's gotten to an extreme that has preceded weaker-than-average returns.
BONDS: Hold In late October, sentiment on bonds - from Treasuries to corporates - entered pessimistic territory. It's now starting to recover, with some quick moves in corporate bonds. We'll see if those bonds, in particular, can hold recent gains.
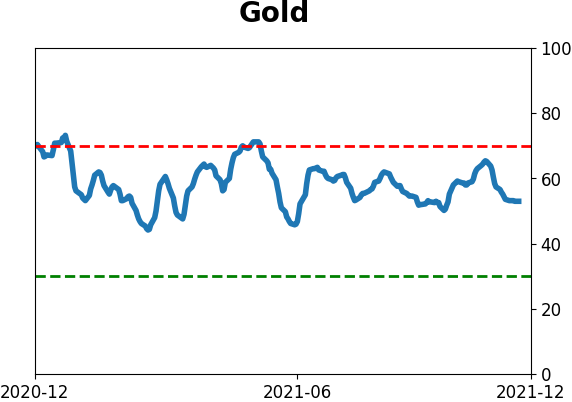
GOLD: Hold
Gold and miners were rejected after trying to recover above their 200-day averages in May. Some oversold extremes in breadth measures among miners triggered in late September, and they've recovered a bit since then. The group still has some proving to do.
|
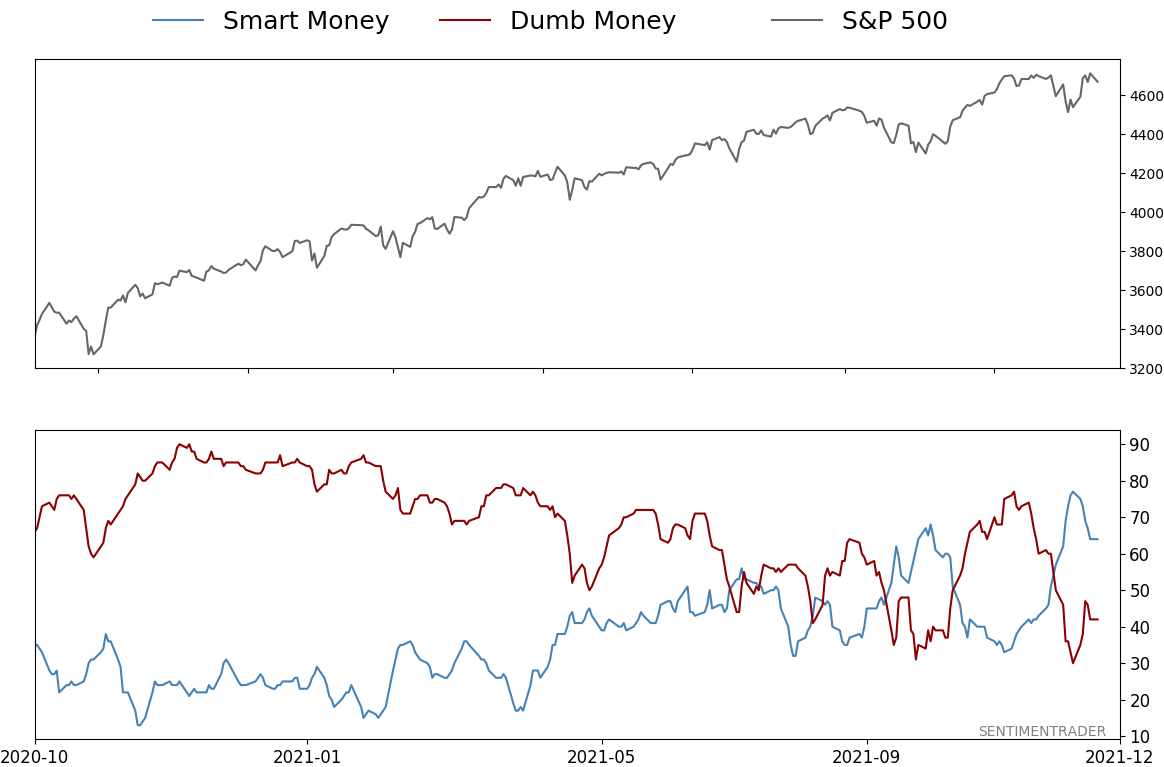
Smart / Dumb Money Confidence
|
Smart Money Confidence: 64%
Dumb Money Confidence: 42%
|
|
Risk Levels
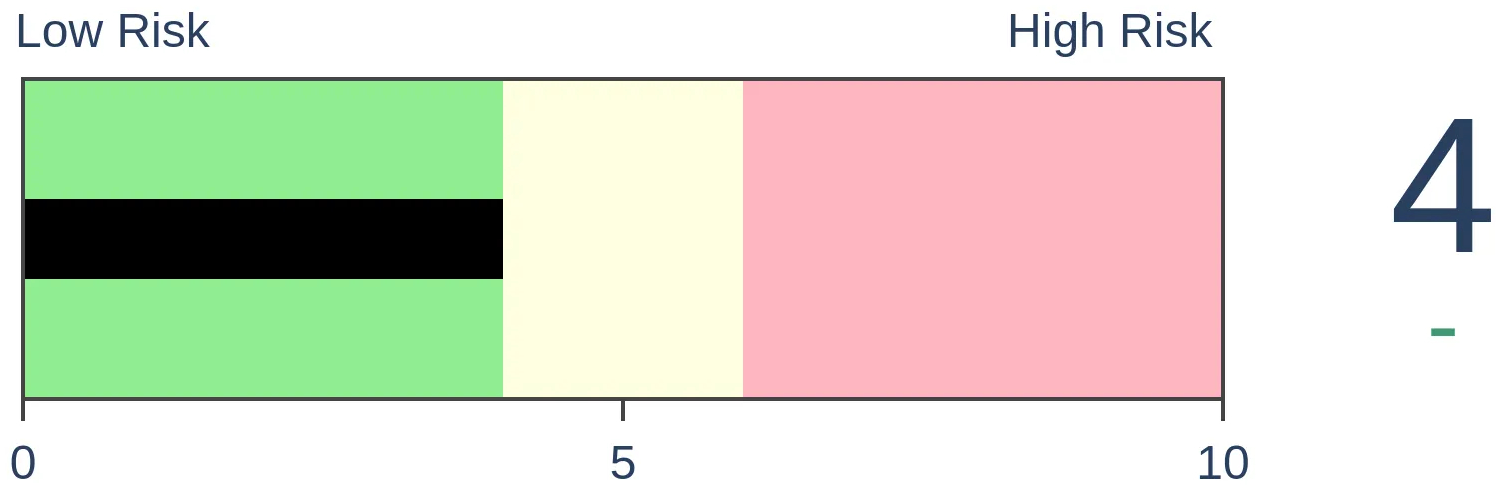
Stocks Short-Term
|
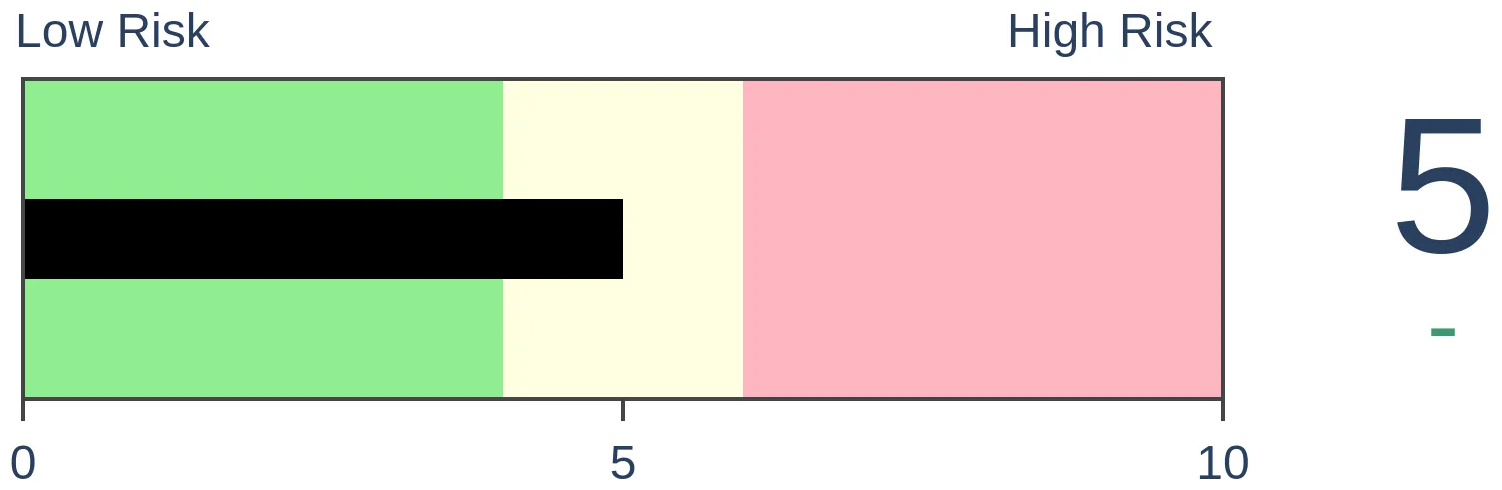
Stocks Medium-Term

|
|
Bonds
|
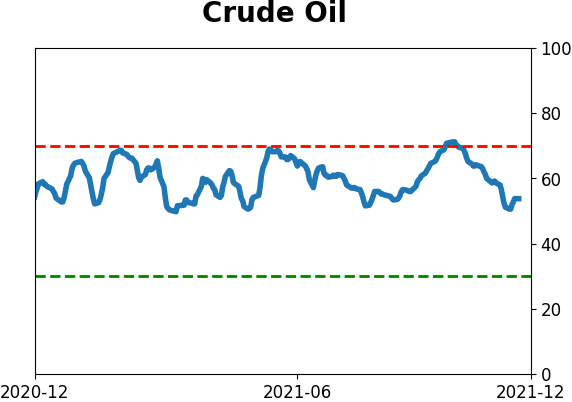
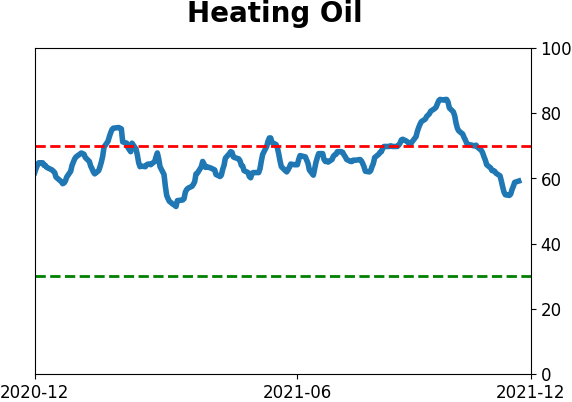
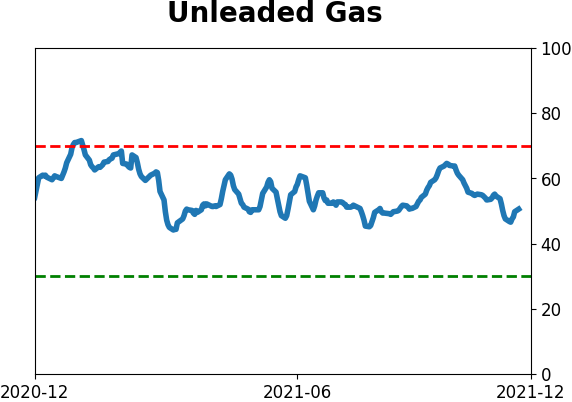
Crude Oil
|
|
Gold
|
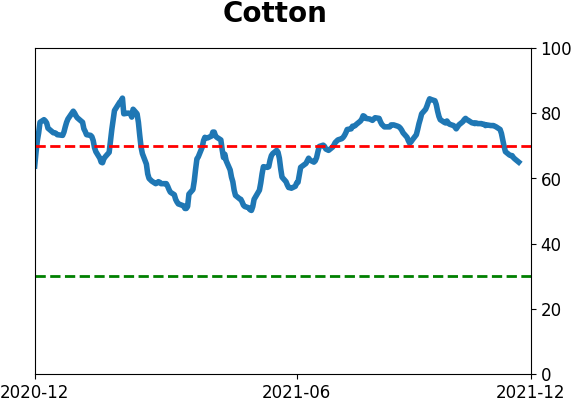
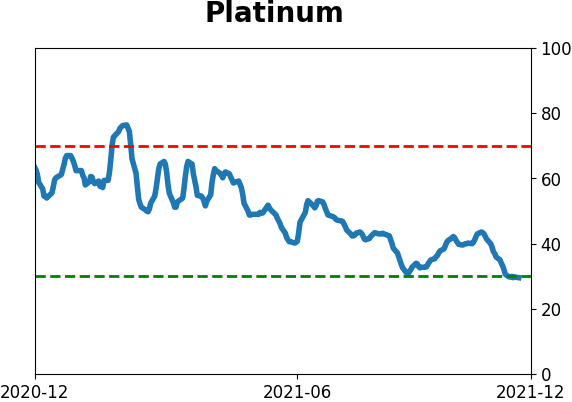
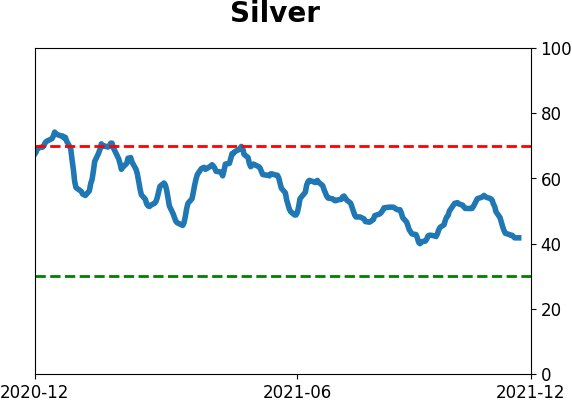
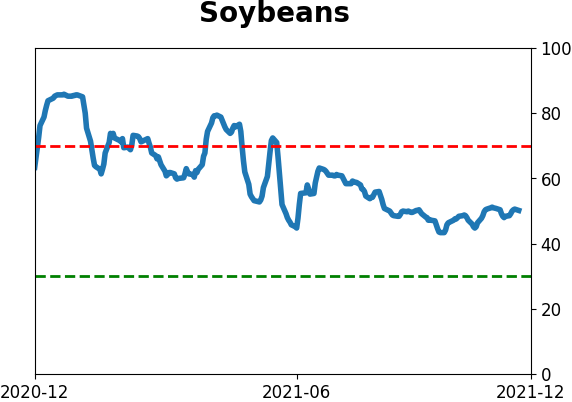
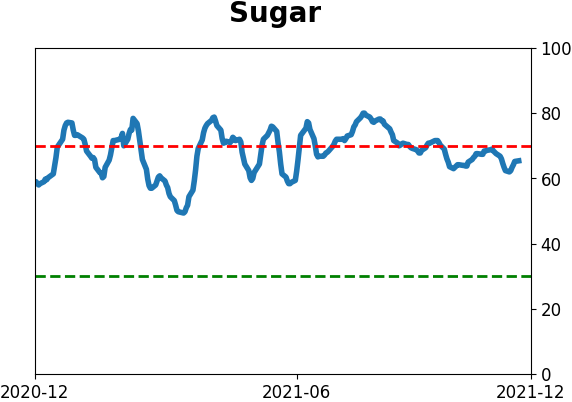
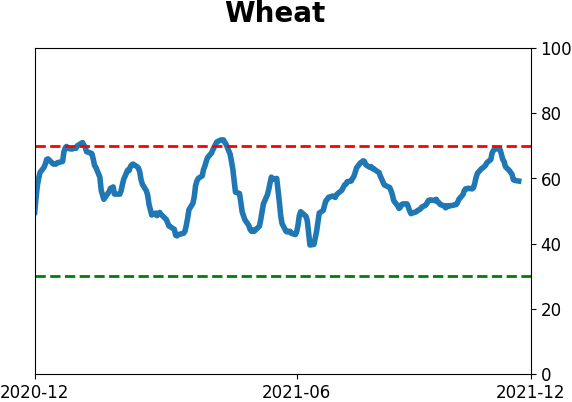
Agriculture

|
|
Research
By Jason Goepfert
BOTTOM LINE
As the Nasdaq 100 marches higher, driven by a few gigantic stocks, fewer of its members are participating. There has been a cluster of negative divergences over the past 30 days, arguing for limited gains in the index.
FORECAST / TIMEFRAME
QQQ -- Down, Medium-Term
|
Key points:
- Within the Nasdaq 100, fewer stocks are participating in recent gains
- That has triggered a cluster of negative divergences
- Divergences are less reliable than thrusts, but it argues for limited gains in riskier stocks
As Big Tech marches higher, fewer come along for the ride
Last week, we saw an impressive thrust in buying interest among a broad swath of stocks. That kind of behavior has been almost universally positive for future returns, and those are among the most consistent signals we study.
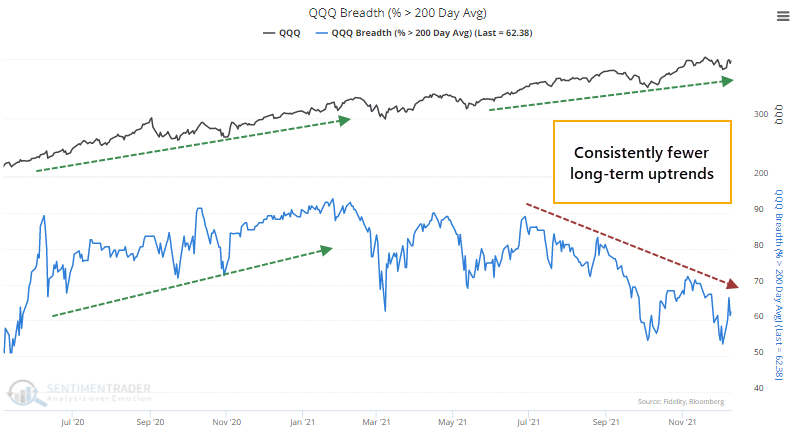
Not all is hunky-dory. Among the primary drivers of sentiment has been the resilience of American Big Tech, and many of them are stumbling. Not the companies that grab all the headlines; it's the smaller stocks that make up the rest of the Nasdaq 100 (NDX).
Within the NDX, there has been a protracted divergence that's getting more profound. Fewer than 65% of NDX stocks are currently trading above their 200-day moving averages. That is a stark change from a year ago when internal trends improved as the NDX marched steadily higher. The index is still doing its thing, but there have been fewer and fewer participants on each successive peak since the summer.
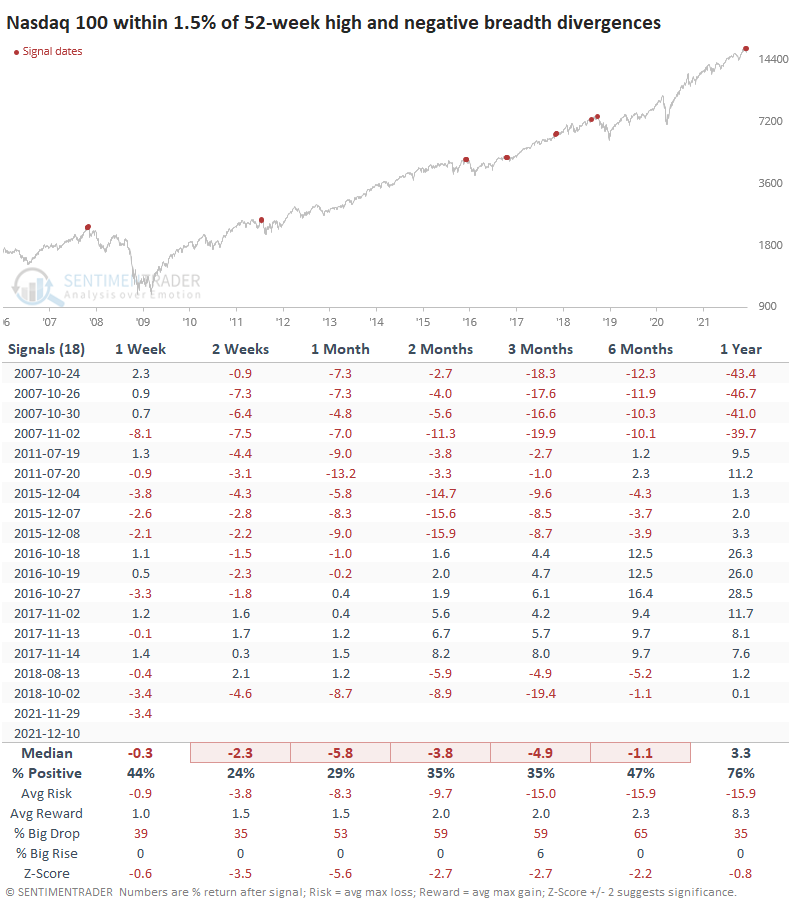
When we zoom out over the past 20 years, we can see that there have been 4 relatively similar periods. All preceded a tough market for the index over the next year or so.
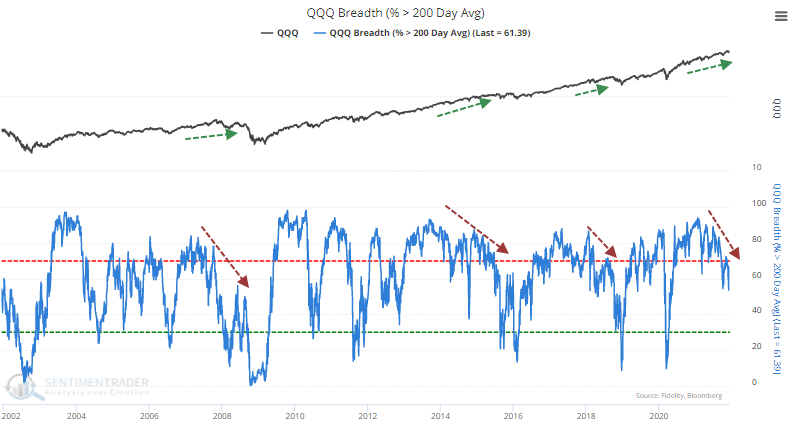
Within the past 30 sessions, there have been 7 days when the NDX was within 1.5% of high, yet fewer than two-thirds of its stocks were trading above their 200-day averages. Between 3-6 months later, the NDX showed a negative return after 7 of the 8 signals. Only the signal from late 2017 managed to escape much trouble, though those gains were ultimately (and temporarily) erased.
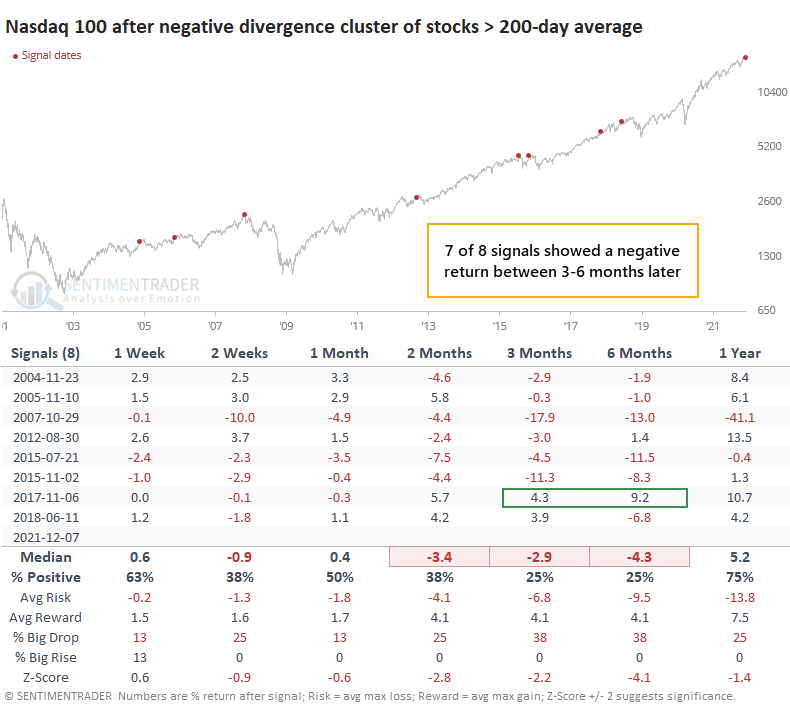
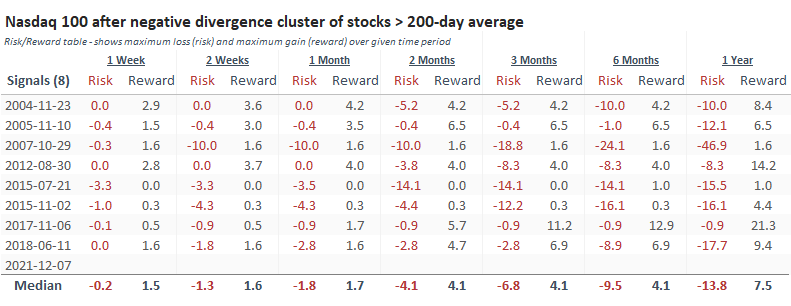
The Risk/Reward Table shows how risky the index was for buyers while proving relatively little reward across almost all the signals across nearly all time frames.
Other measures confirm internal disagreement
Relying on one measure can give a skewed picture. Looking at other views of what's going on under the surface confirms disagreement between the index and many of its stocks.
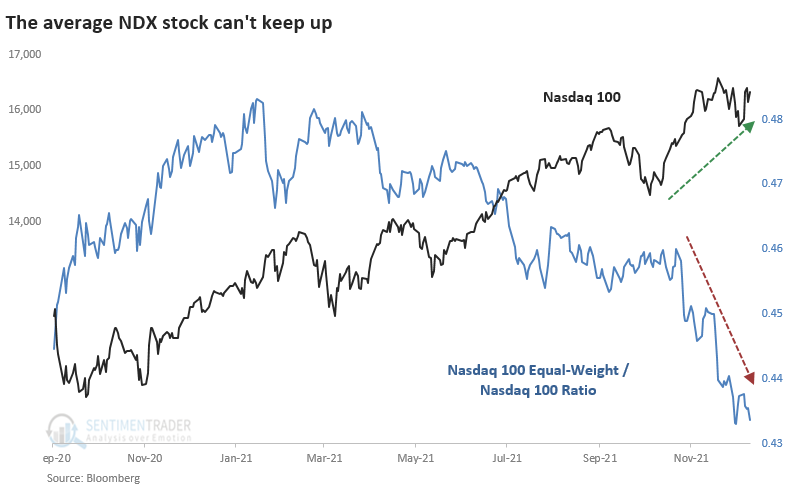
The ratio between the equal-weighted version of the NDX and its capitalization-weighted version is close to falling to an all-time low. A year ago, the average stock was helping to drive the index higher; the relationship plunged over the past two months.
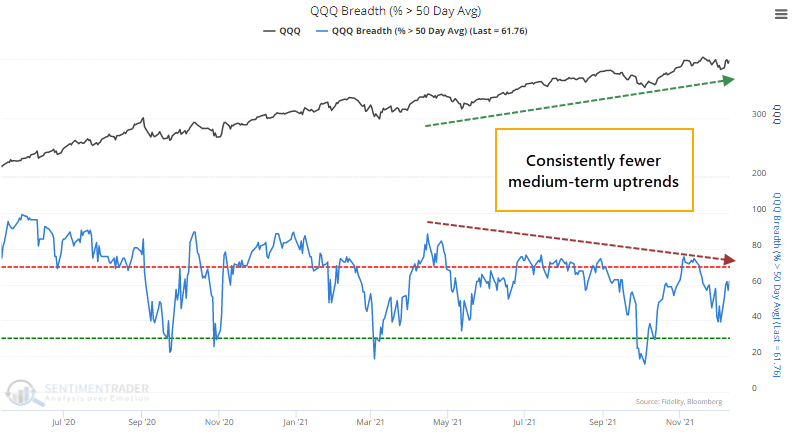
Similar to long-term trends, fewer and fewer NDX stocks are holding above their 50-day moving averages as the index marches higher.
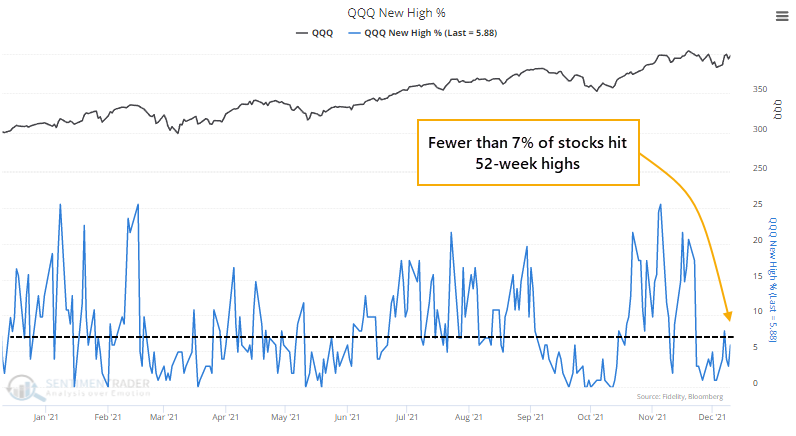
Despite last week's surge, no more than 7% of NDX stocks have hit a 52-week high.
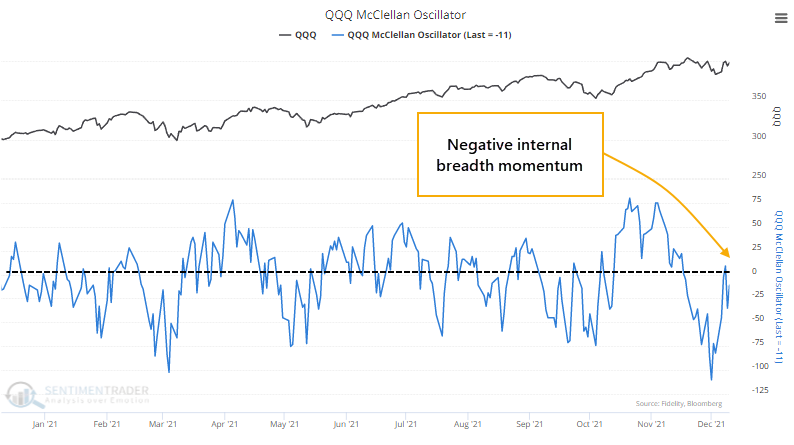
This behavior kept the McClellan Oscillator for the NDX below zero, which is unusual when the index is close to a new high.
When we combine all these metrics and look at their weakness when the index was within 1.5% of a new high, we see that it was tough for the NDX to hold much of a gain going forward. The only exception was the remarkable momentum market of 2017. The table below includes every date to show clusters, so some of them overlap.
There are some mild positives. The Cumulative Advance/Decline Line isn't diverging too severely, suggesting that many stocks are rising (but only modestly). The McClellan Summation Index is still solidly positive (but declining). Only 16% of Nasdaq 100 stocks are in a bear market, and fewer than 40% are in a correction. The index tends to be in the most trouble when these percentages hold above 20% and 40%, respectively. Corporate insiders have been buying, a good sign (but it didn't prevent declines in 2018 or 2020).
What the research tells us...
While breadth thrusts are among the most consistent signals, divergences are among the least consistent - especially in 2021. So, we'd tend to place more weight on the positive signs recorded last week than the negative ones in specific sectors, including many of the tech stocks in the Nasdaq 100.
When sentiment reached a speculative excess by the beginning of November, it suggested that riskier parts of the market were most vulnerable to a pullback. We see some of that in the poor performance among many members of the NDX. A few gigantic companies, perceived as safe havens, have been able to keep the index afloat. But if history is any guide here, the drag of many of the other stocks will help keep a lid on significant, sustained gains.
Active Studies
| Time Frame | Bullish | Bearish | | Short-Term | 2 | 3 | | Medium-Term | 13 | 2 | | Long-Term | 15 | 8 |
|
Indicators at Extremes
Portfolio
| Position | Description | Weight % | Added / Reduced | Date | | Stocks | RSP | 10.7 | Added 6.4% | 2021-10-01 | | Bonds | 32.7% BND, 7.1% SCHP | 39.8 | Added 8.3% | 2021-10-26 | | Commodities | GCC | 2.4 | Reduced 2.1%
| 2020-09-04 | | Precious Metals | GDX | 4.6 | Reduced 4.2% | 2021-05-19 | | Special Situations | 9.8% KWEB, 4.7% XLE, 2.9% PSCE | 17.3 | Added 9.78% | 2021-10-01 | | Cash | | 24.1 | | |
|
Updates (Changes made today are underlined)
Much of our momentum and trend work has remained positive for several months, with some scattered exceptions. Almost all sentiment-related work has shown a poor risk/reward ratio for stocks, especially as speculation drove to record highs in exuberance in February. Much of that has worn off, and most of our models are back toward neutral levels. There isn't much to be excited about here. The same goes for bonds and even gold. Gold has been performing well lately and is back above long-term trend lines. The issue is that it has a poor record of holding onto gains when attempting a long-term trend change like this, so we'll take a wait-and-see approach. Momentum has ebbed quickly in recent weeks, and nearing oversold levels in some indicators. This can be a dangerous area, with a lot of short-term volatility, but we'd be more inclined to add medium- to long-term exposure rather than sell on much more of a decline, thanks to already rock-bottom exposure. Other areas look more attractive, including some overseas markets. RETURN YTD: 8.6% 2020: 8.1%, 2019: 12.6%, 2018: 0.6%, 2017: 3.8%, 2016: 17.1%, 2015: 9.2%, 2014: 14.5%, 2013: 2.2%, 2012: 10.8%, 2011: 16.5%, 2010: 15.3%, 2009: 23.9%, 2008: 16.2%, 2007: 7.8%
|
|
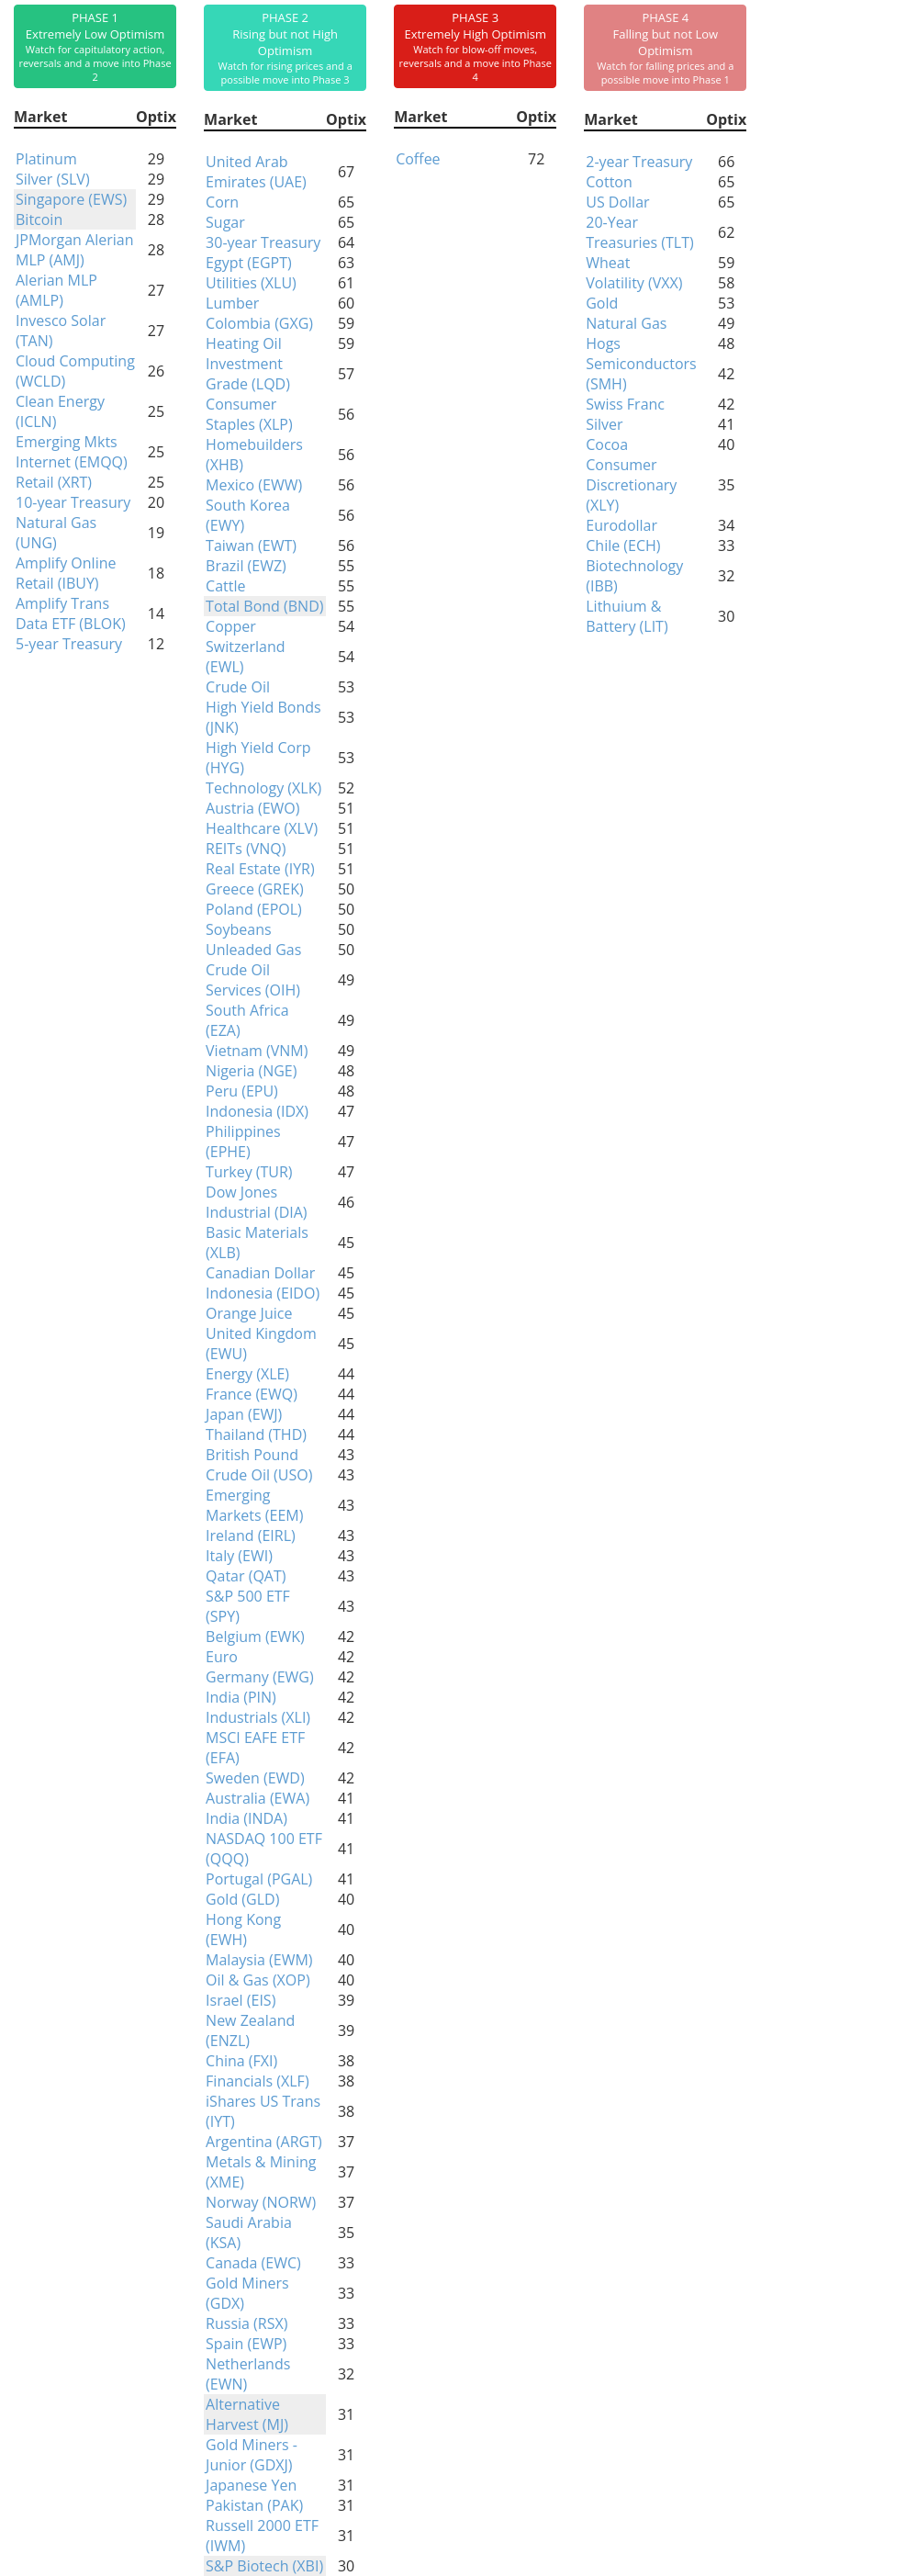
Phase Table
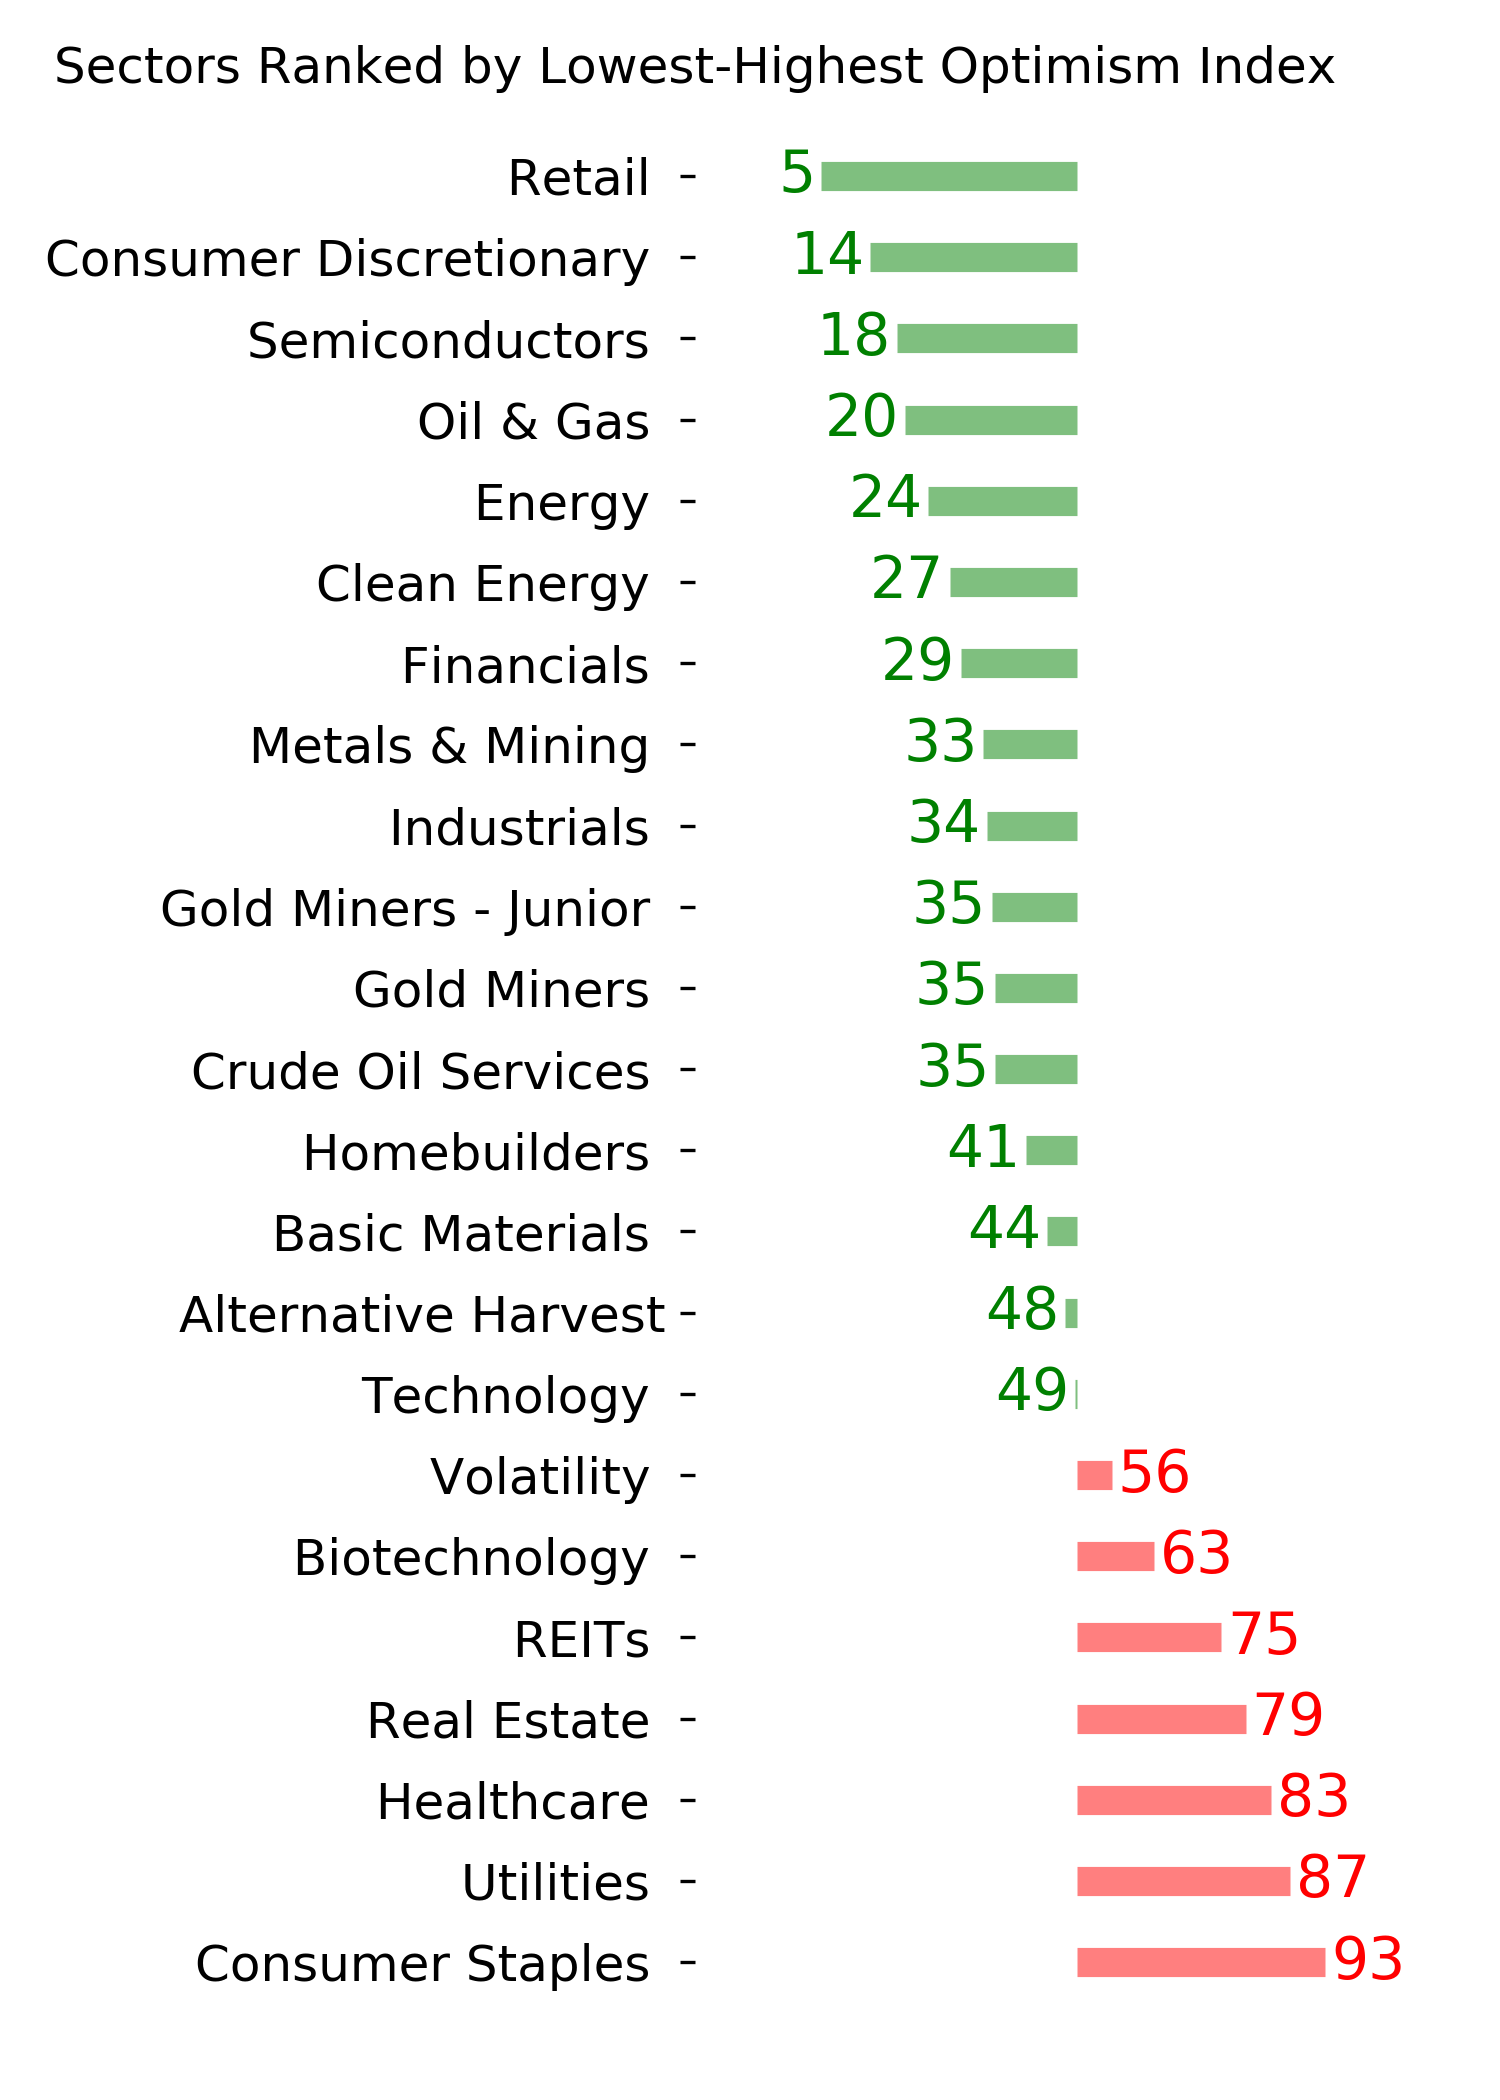
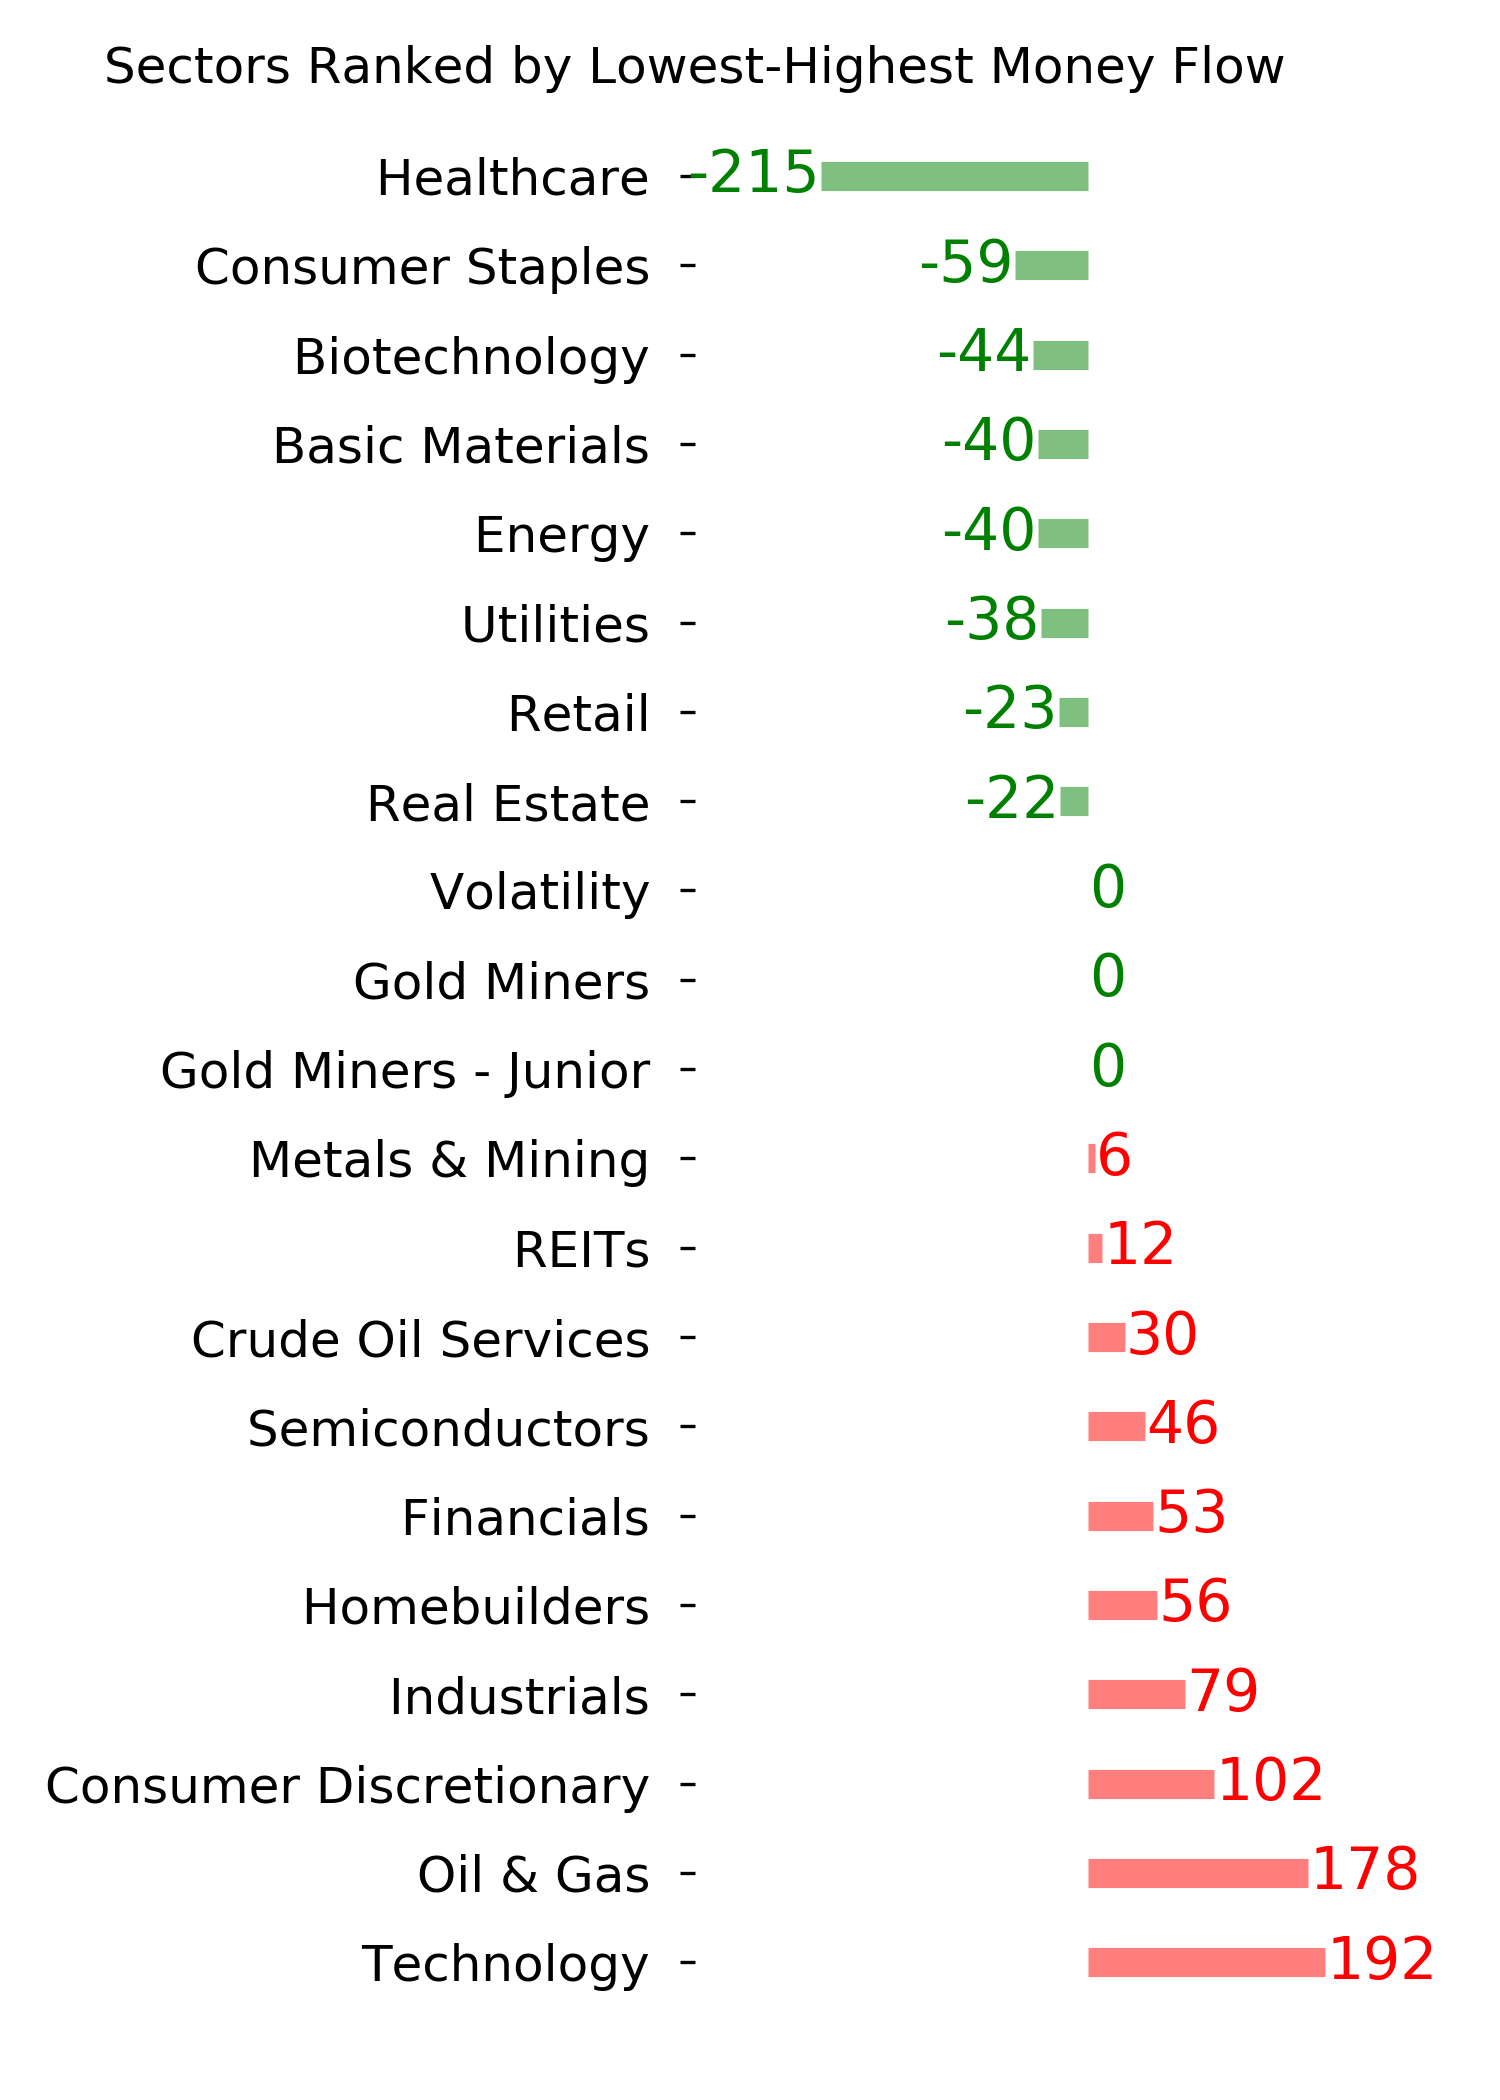
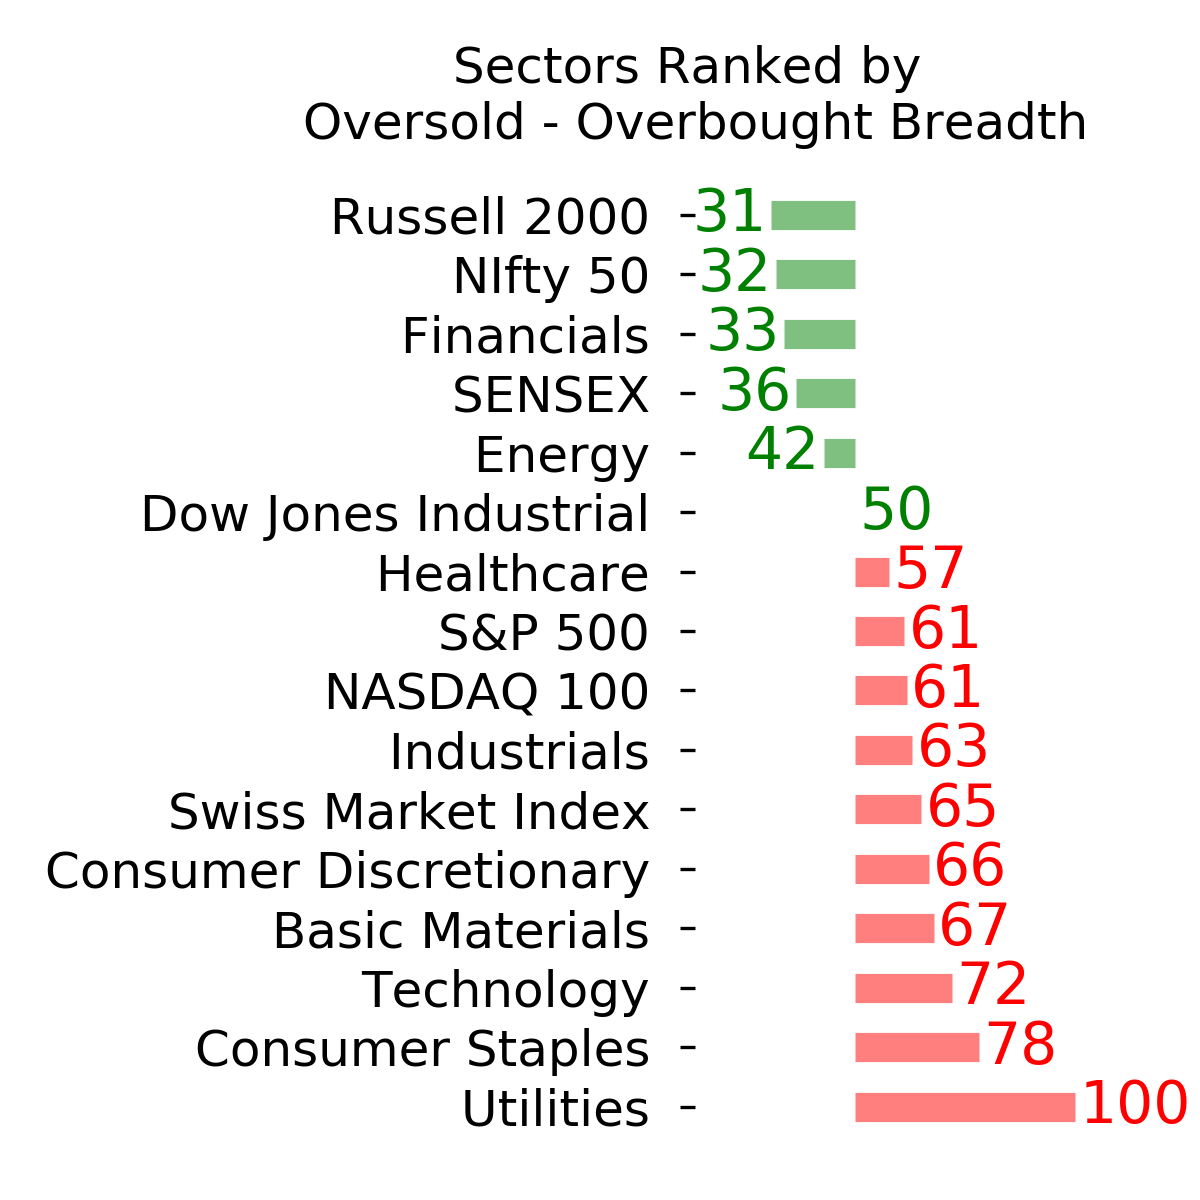
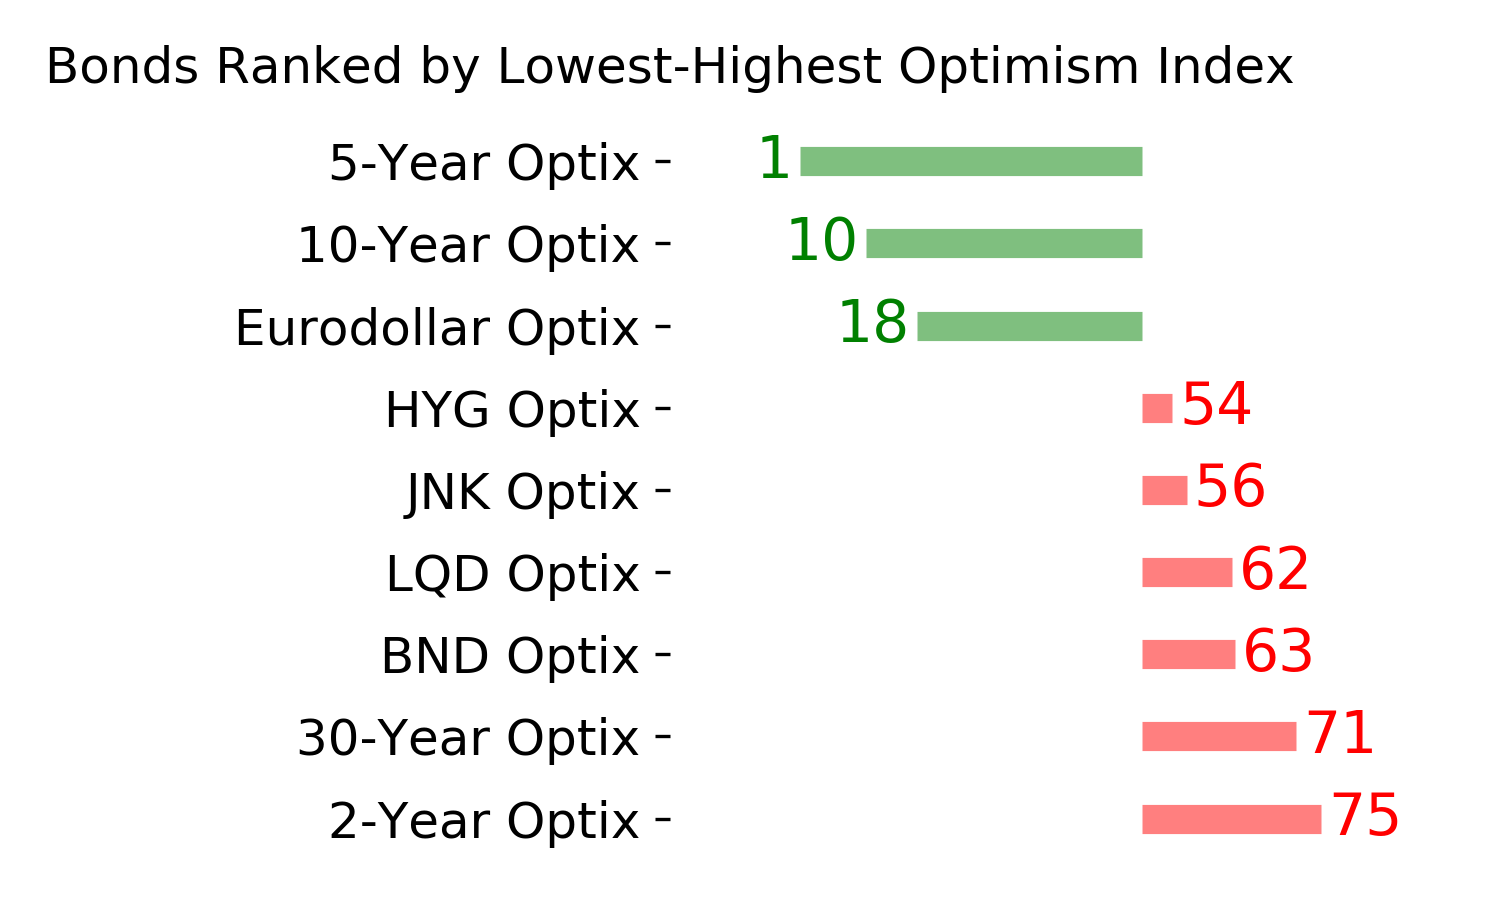
Ranks
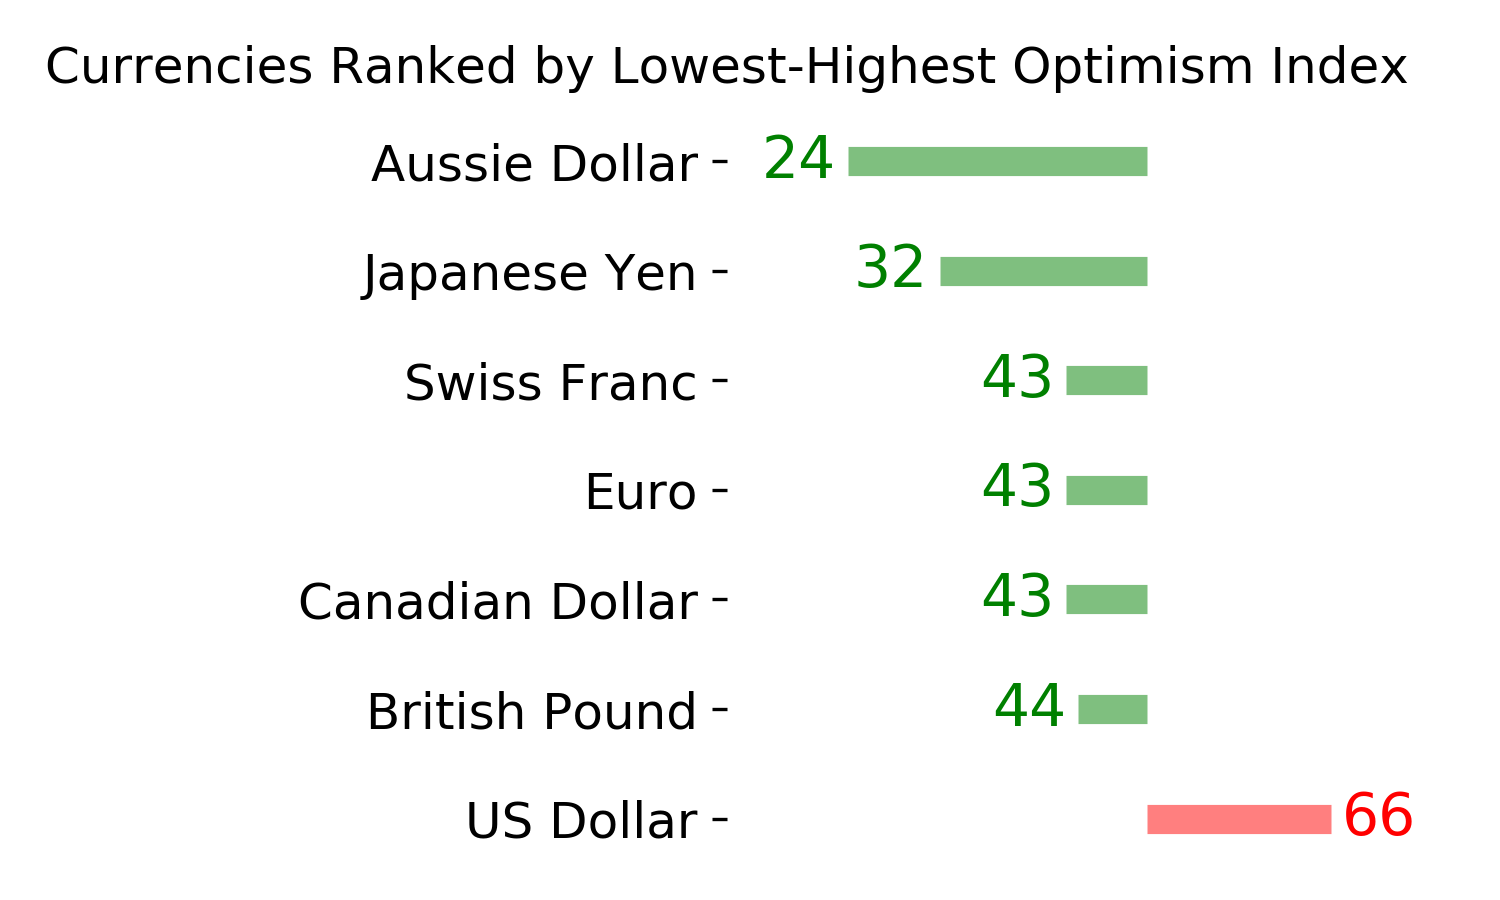
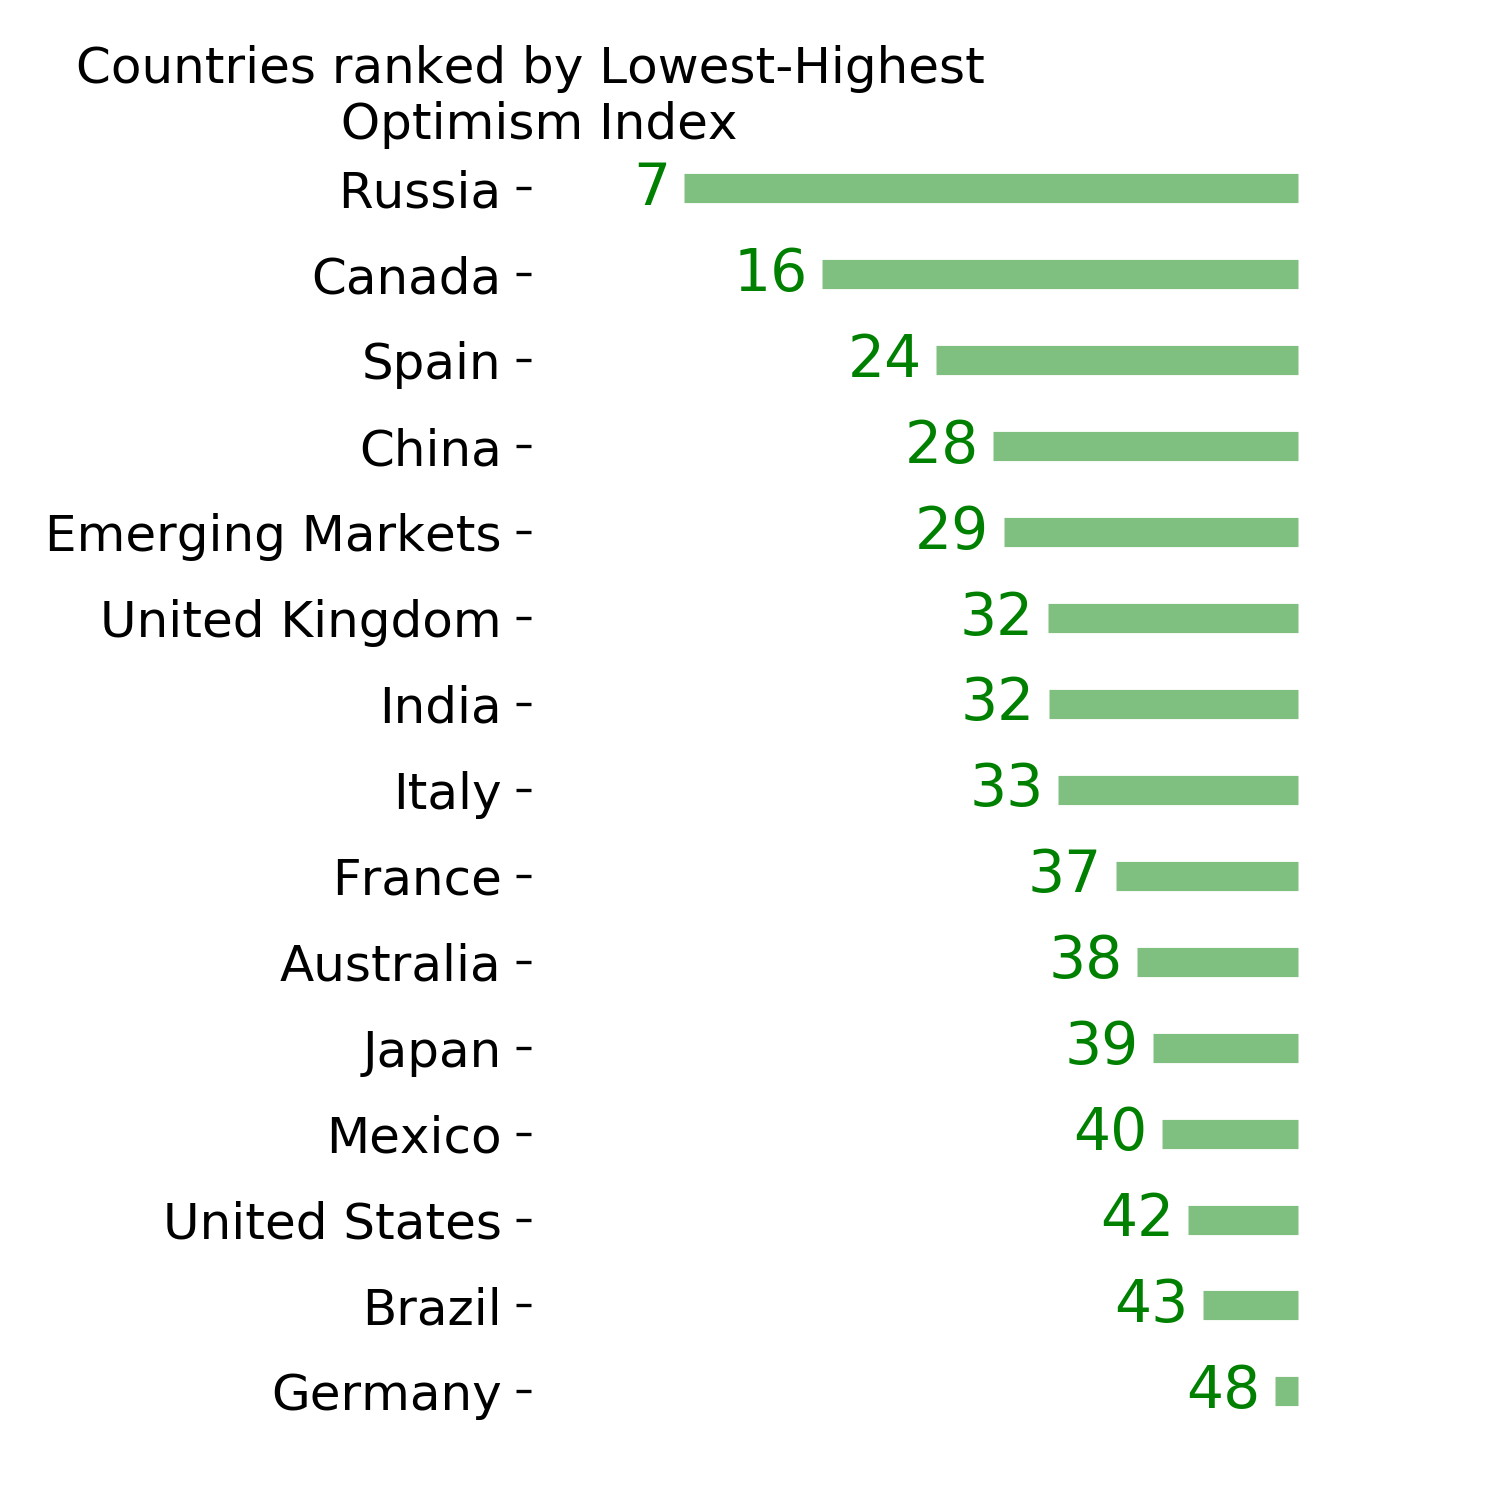
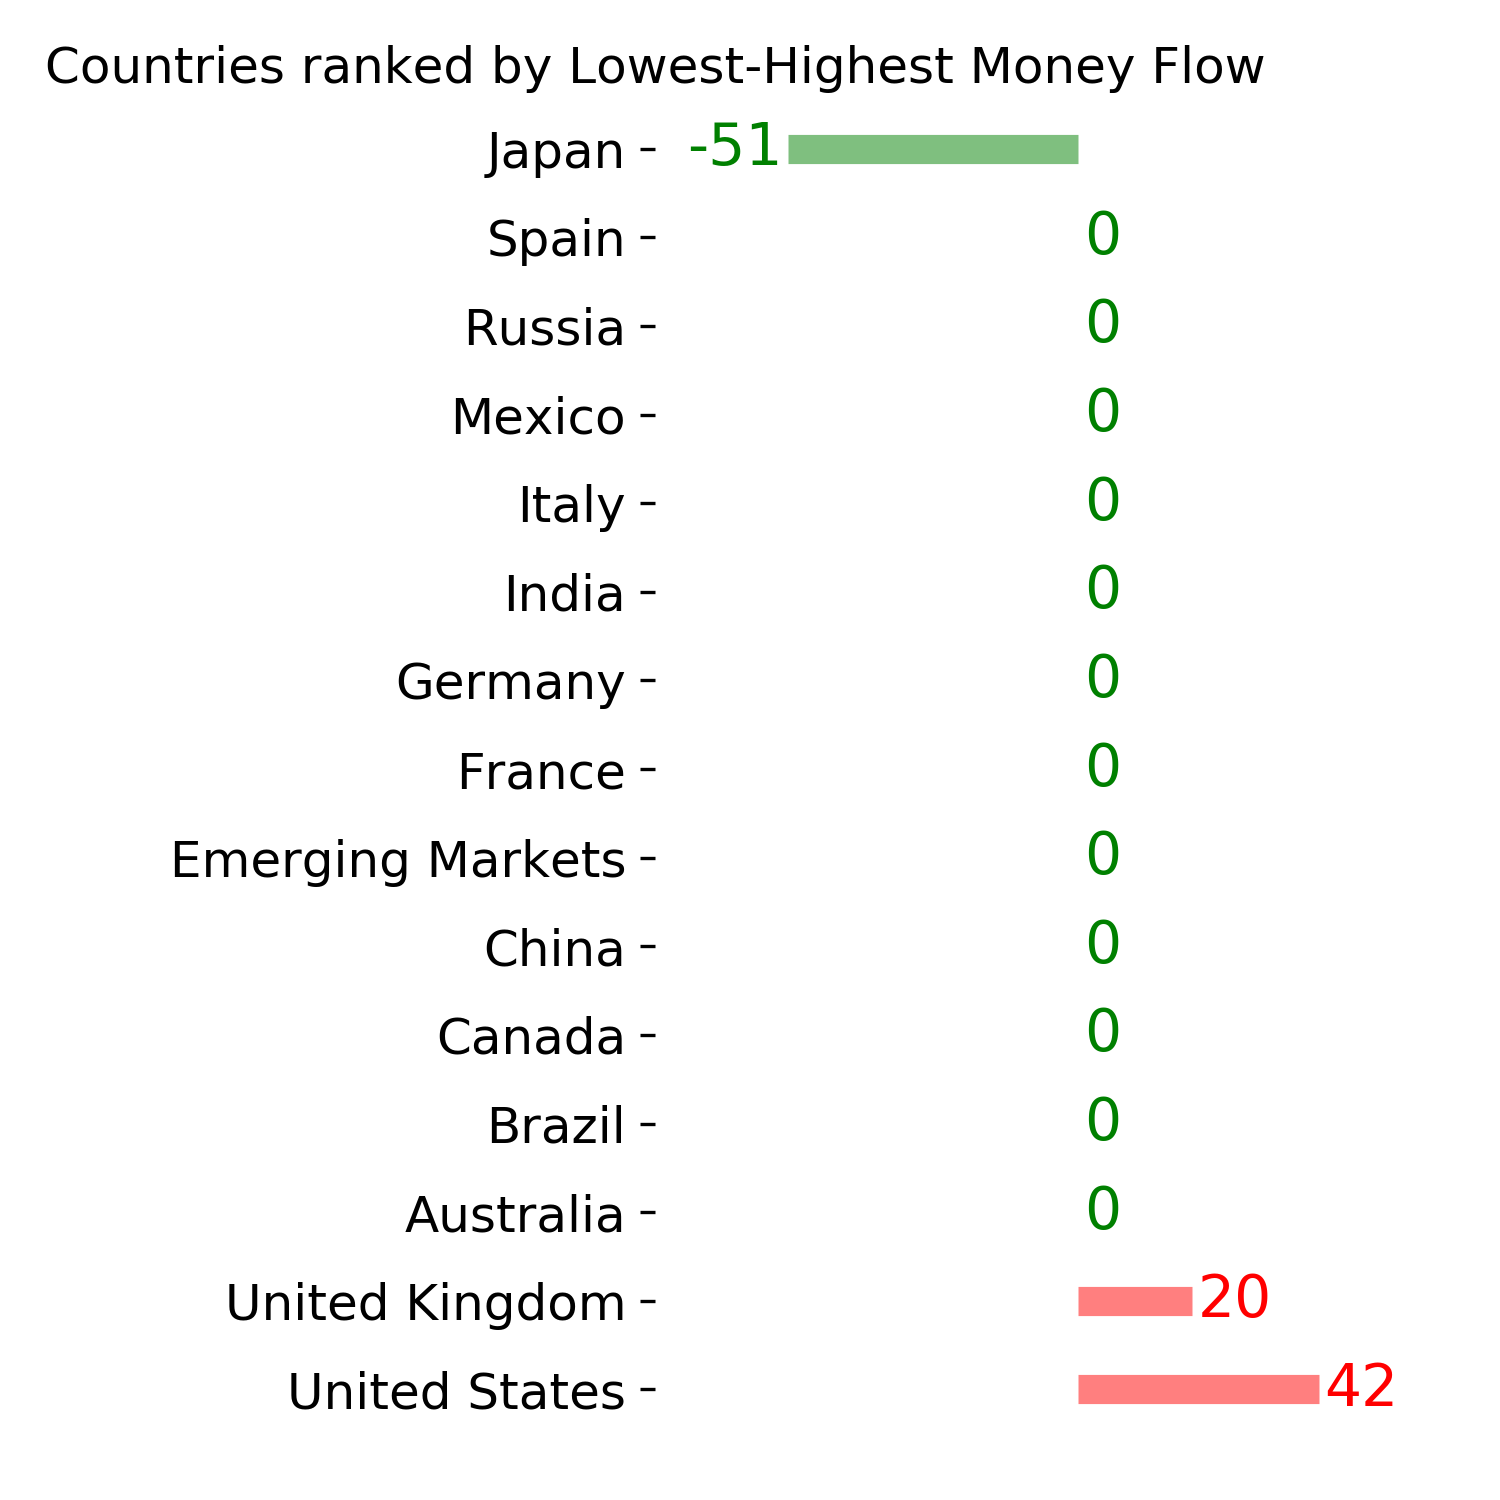
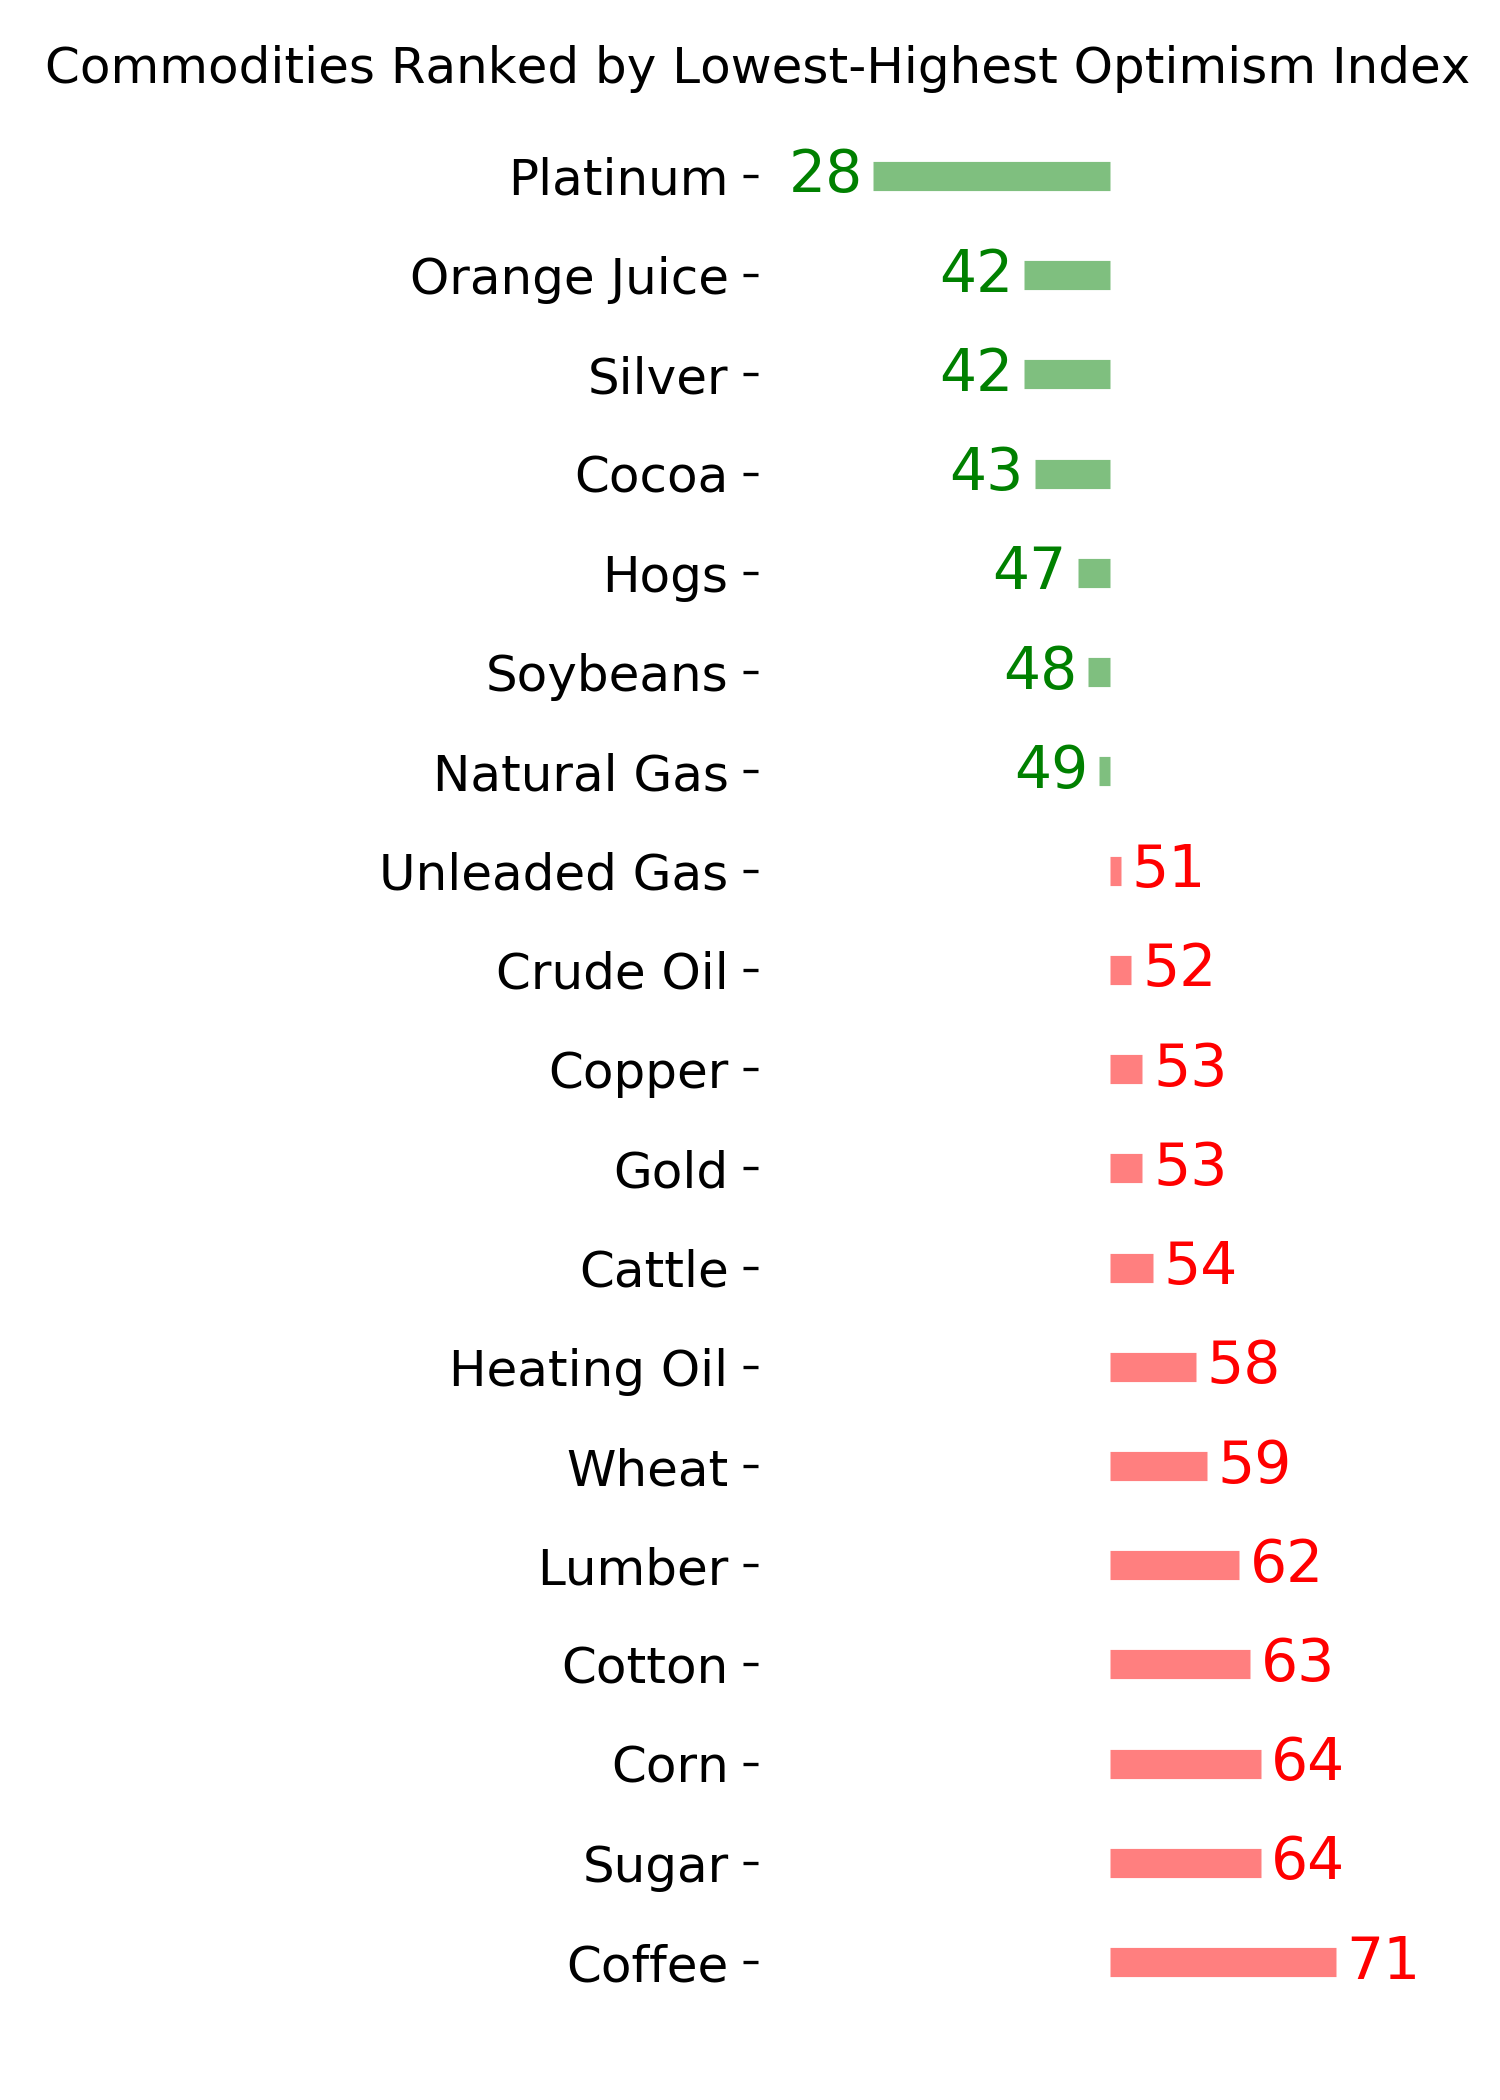
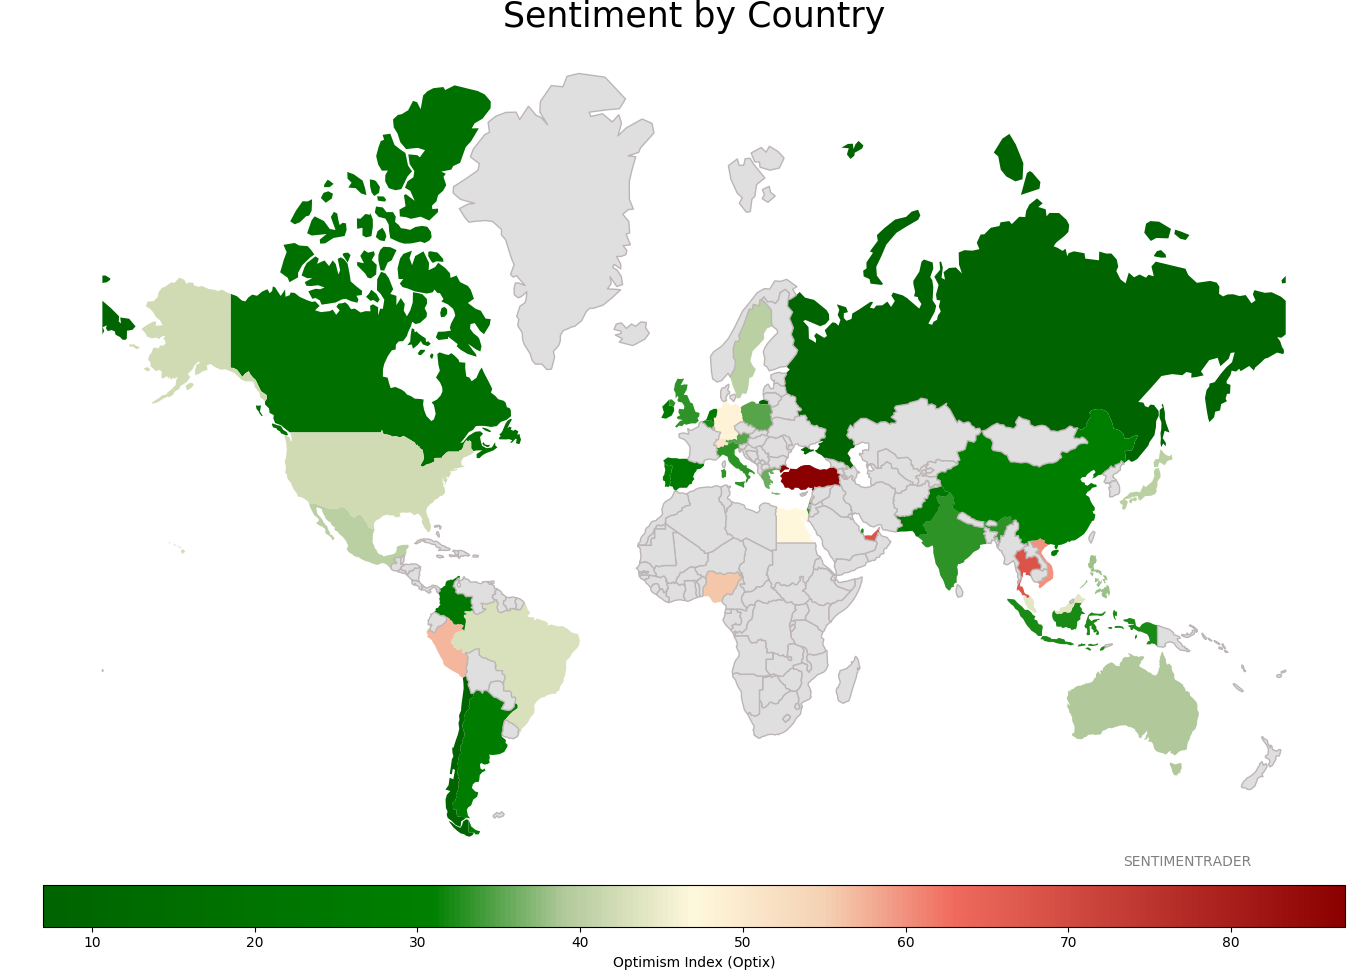
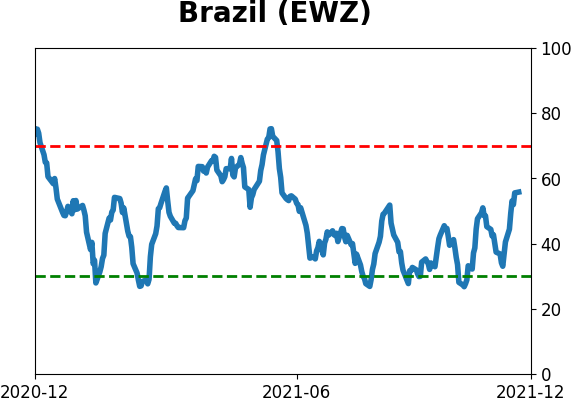
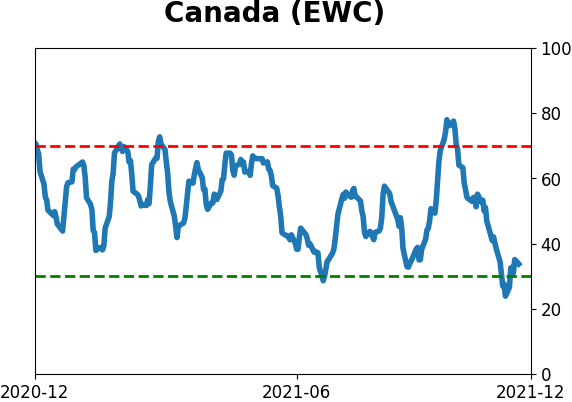
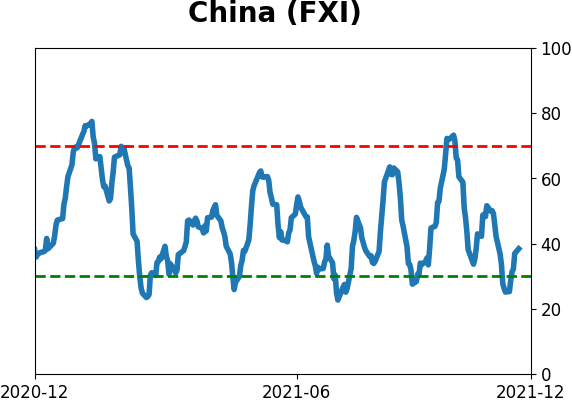
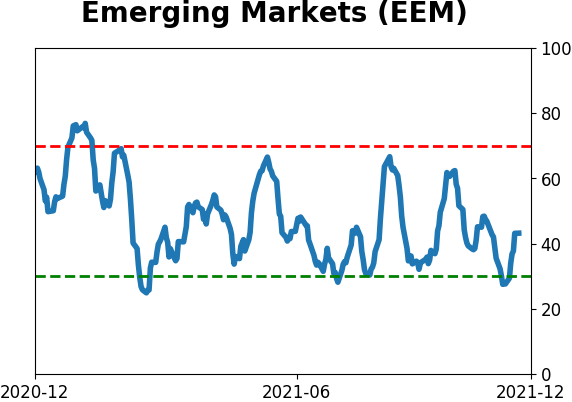
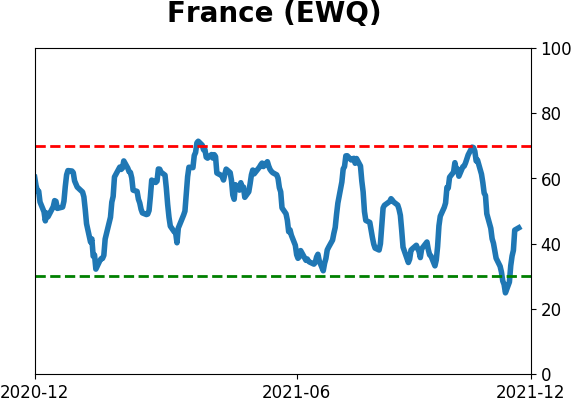
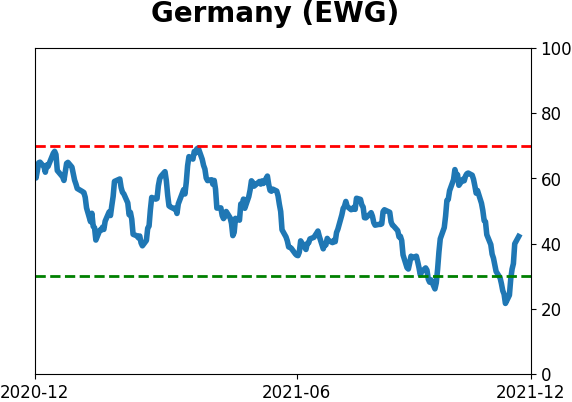
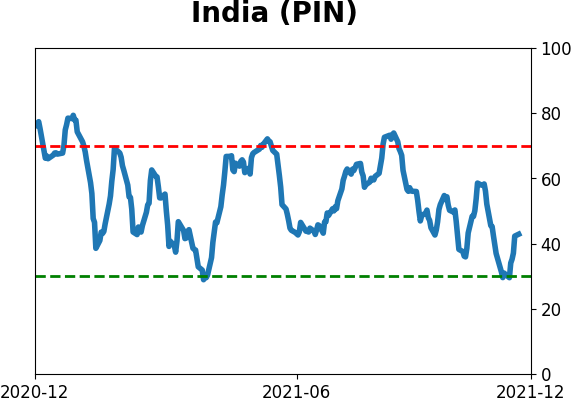
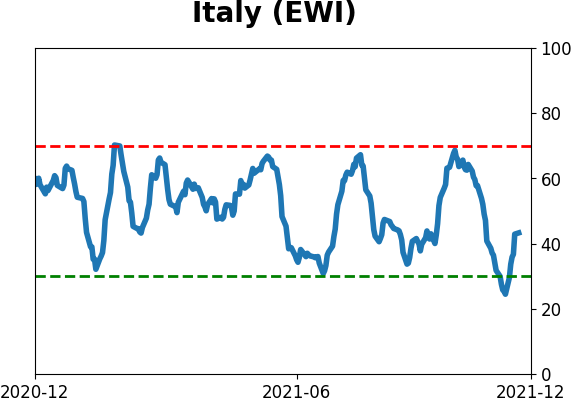
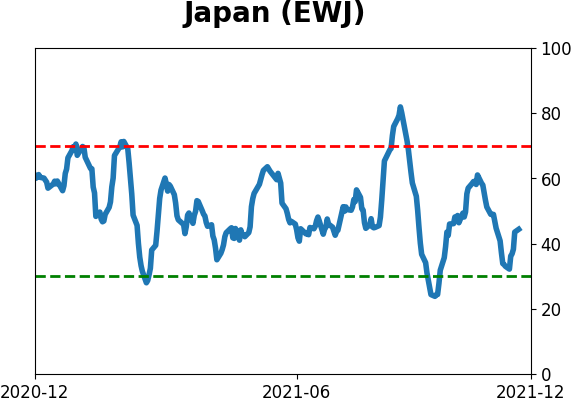
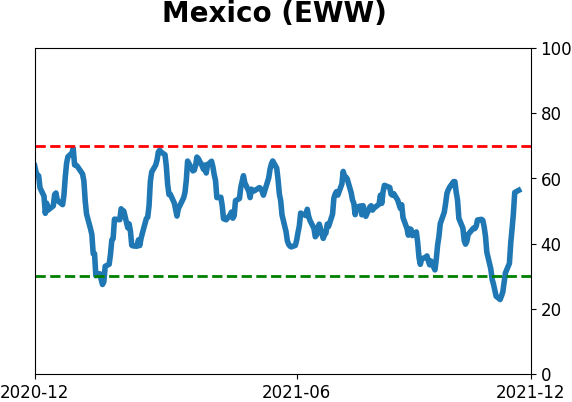
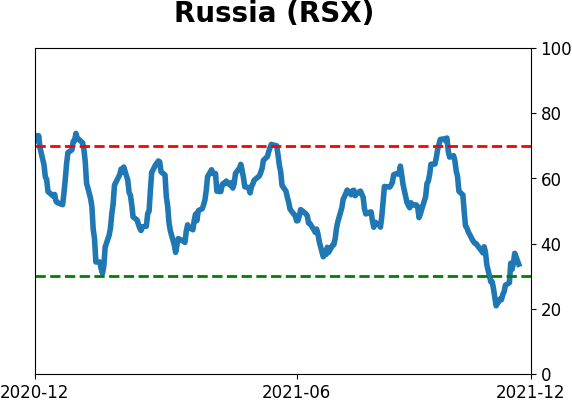
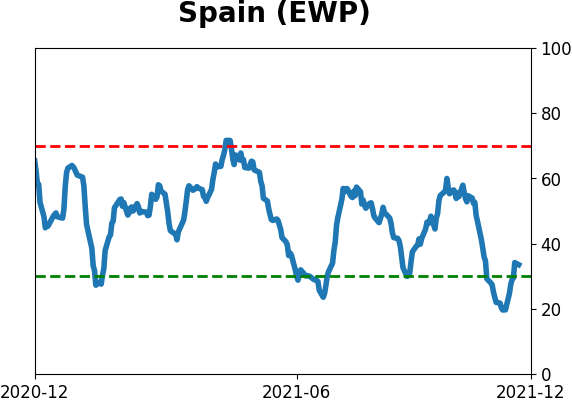
Sentiment Around The World
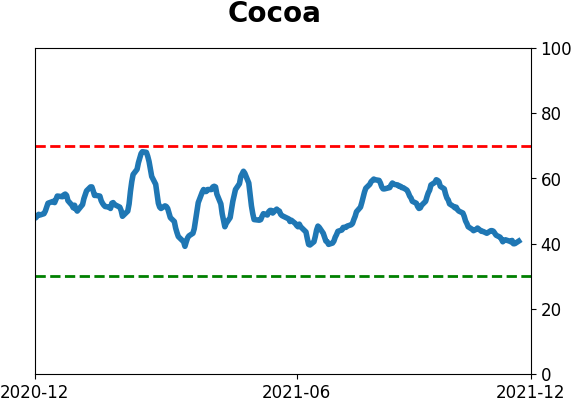
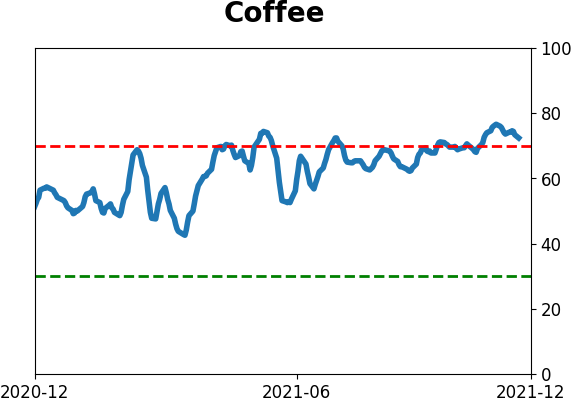
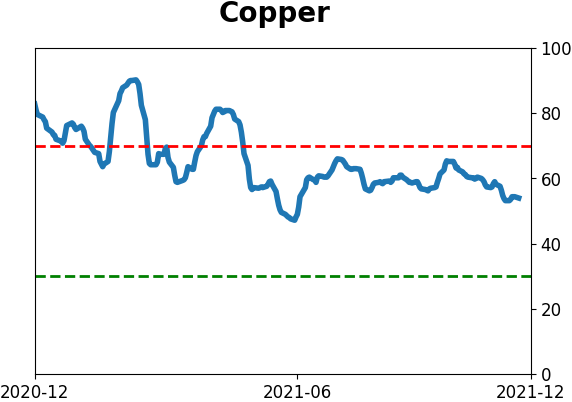
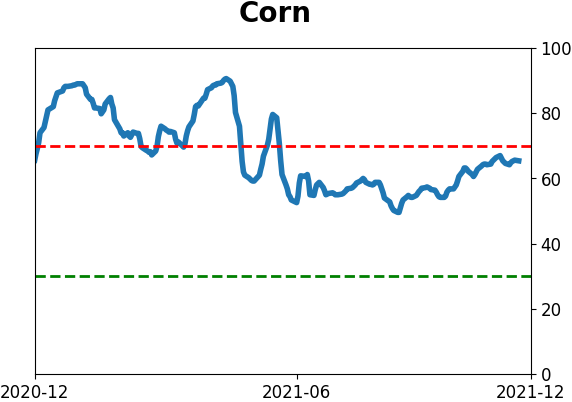
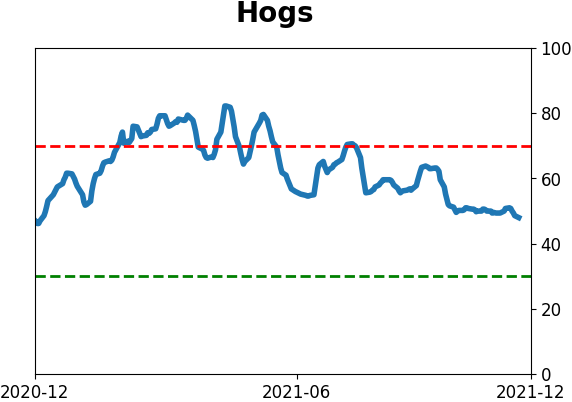
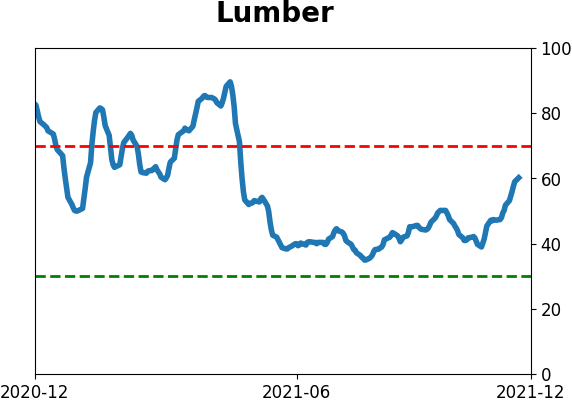
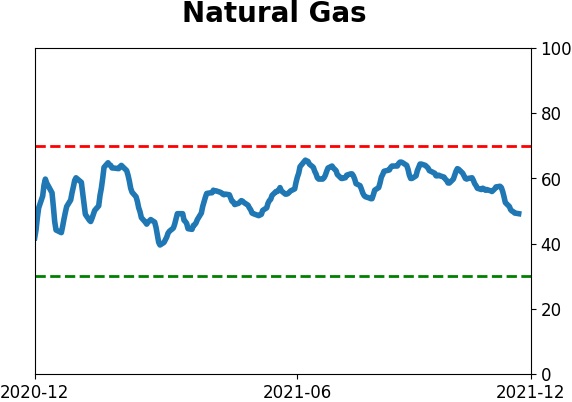
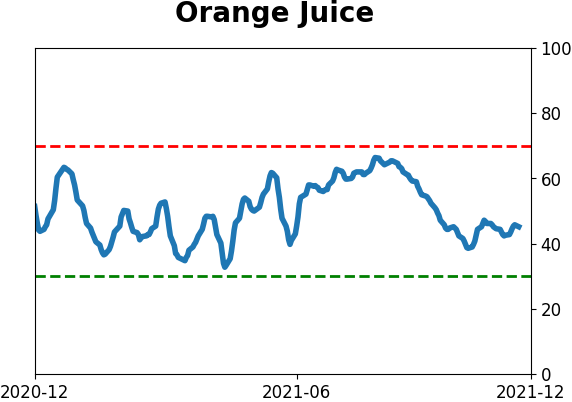
Optimism Index Thumbnails
|
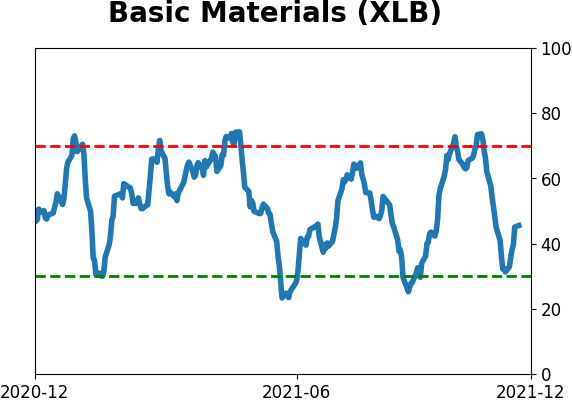
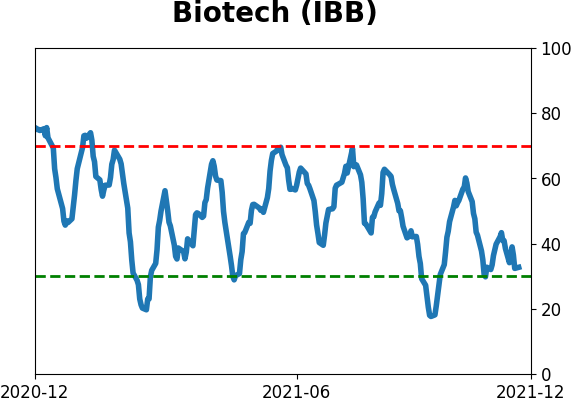
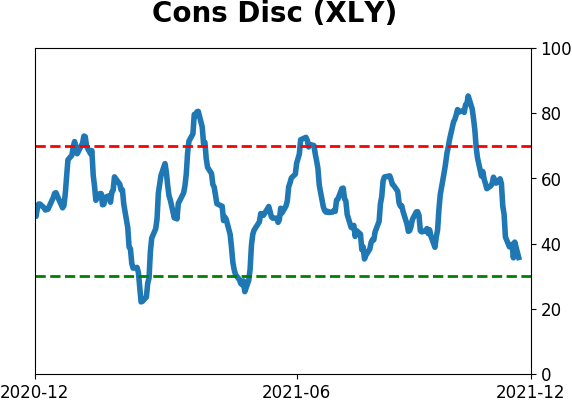
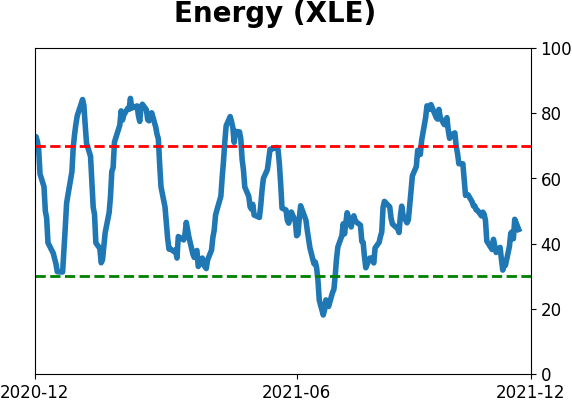
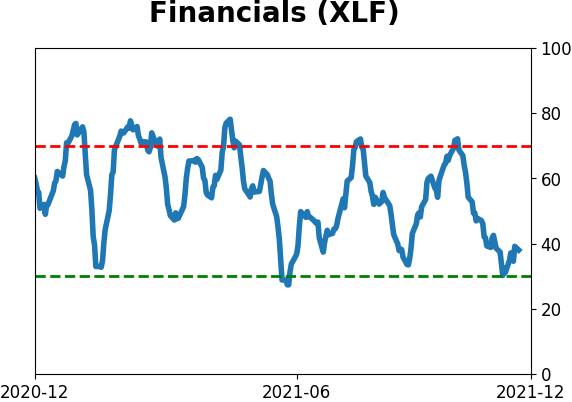
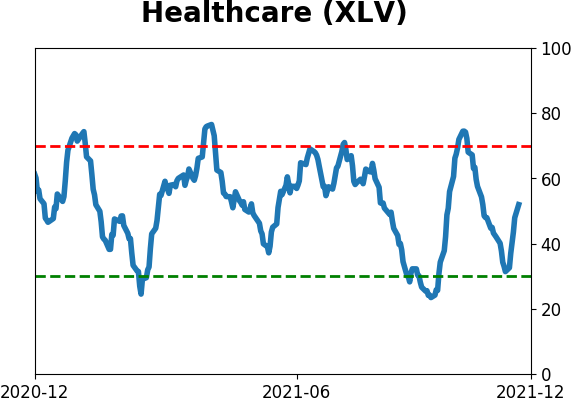
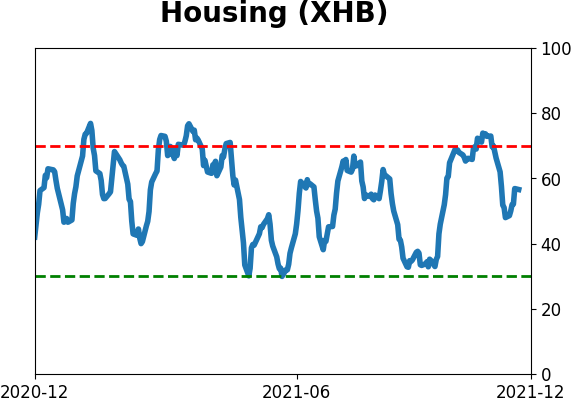
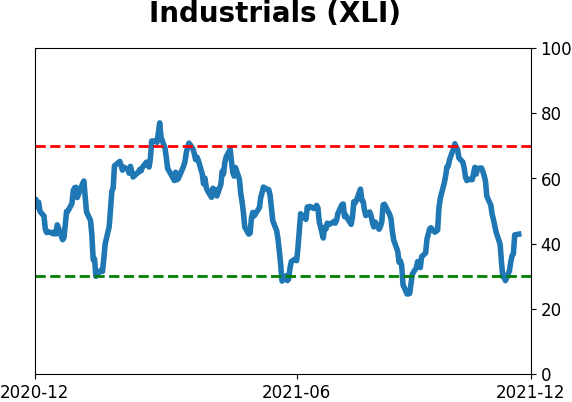
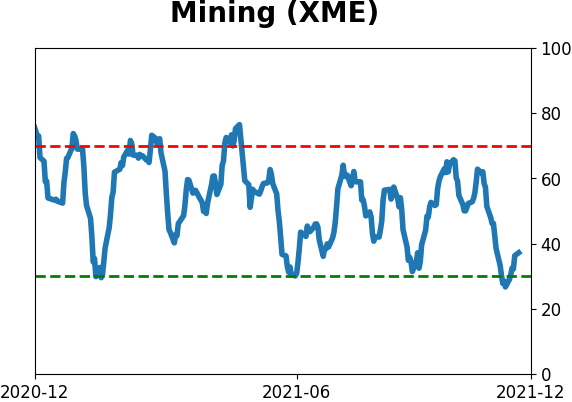
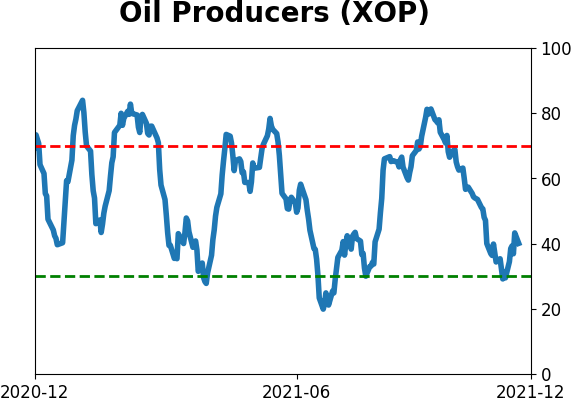
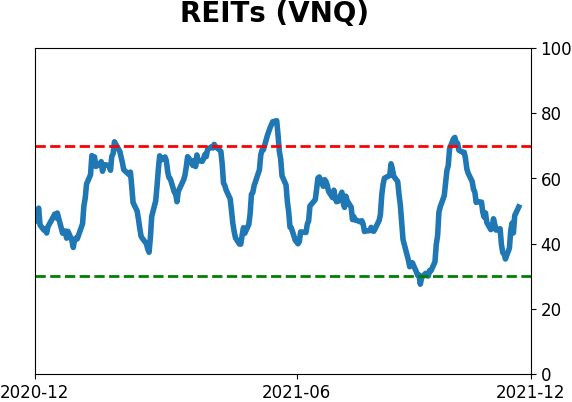
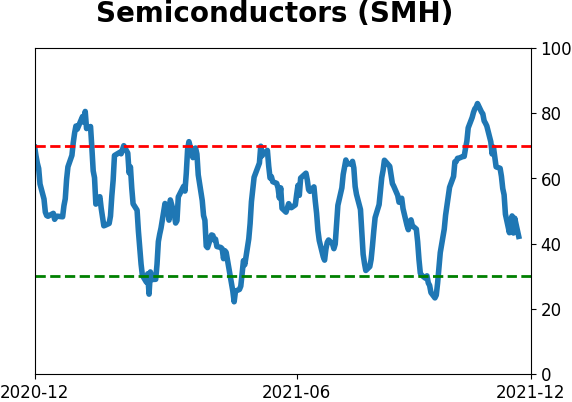
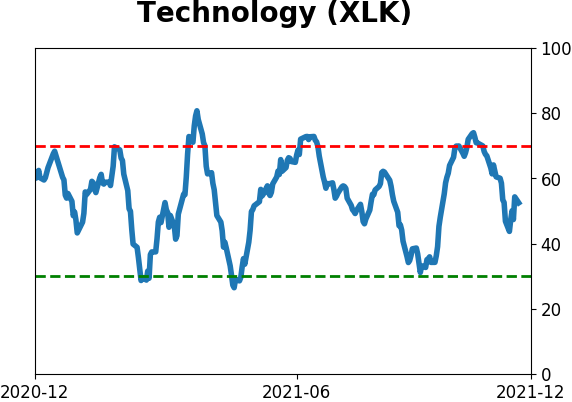
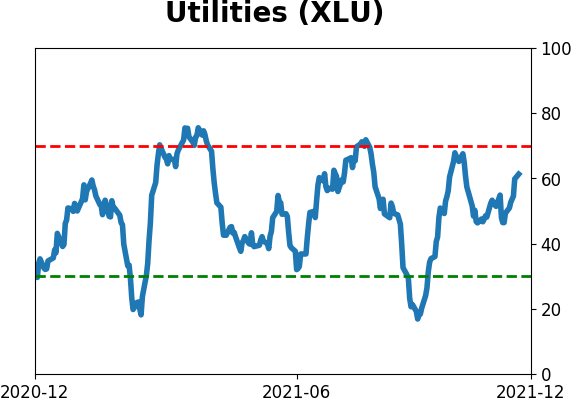
Sector ETF's - 10-Day Moving Average
|
|
|
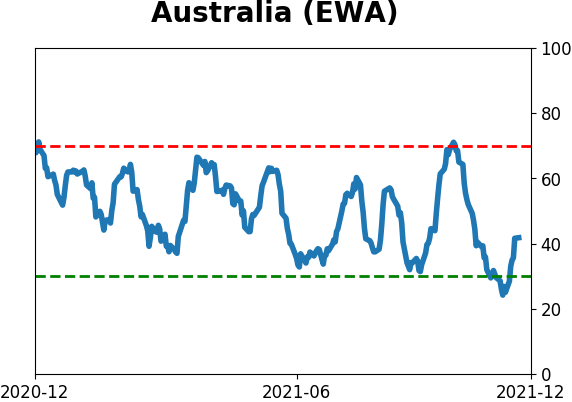
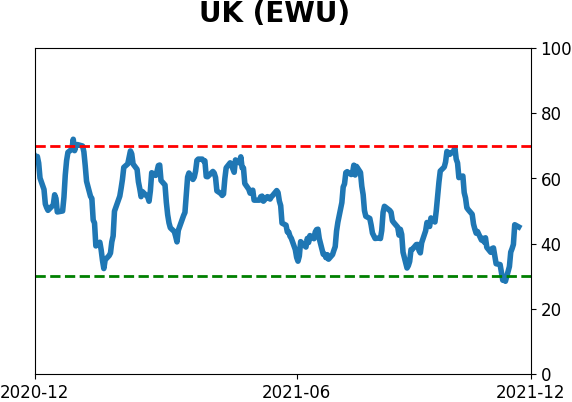
Country ETF's - 10-Day Moving Average
|
|
|
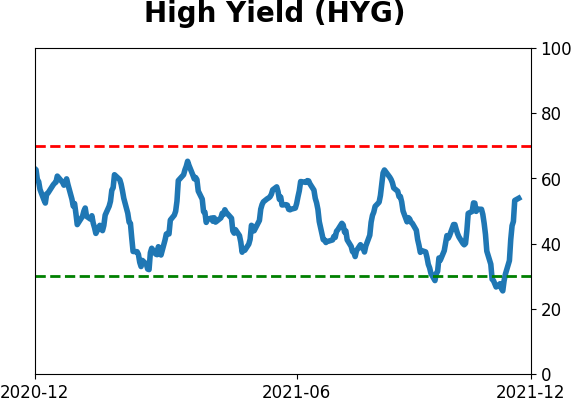
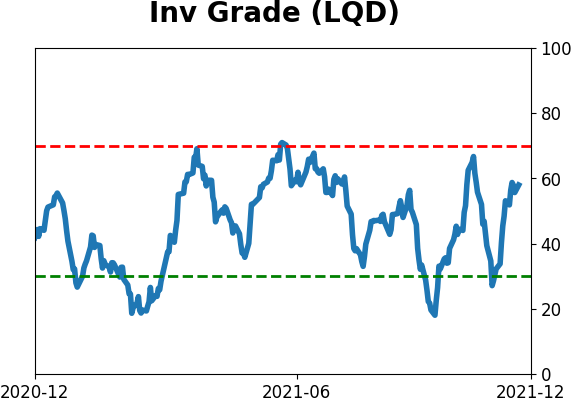
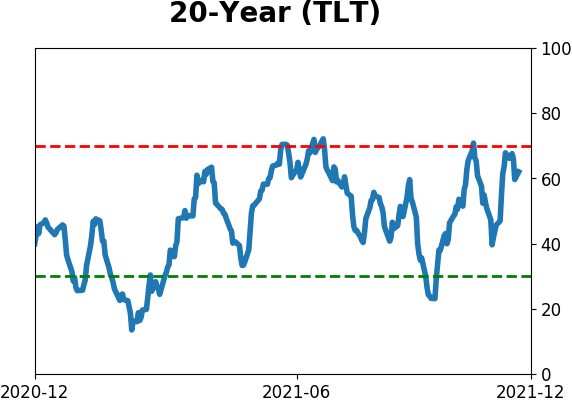
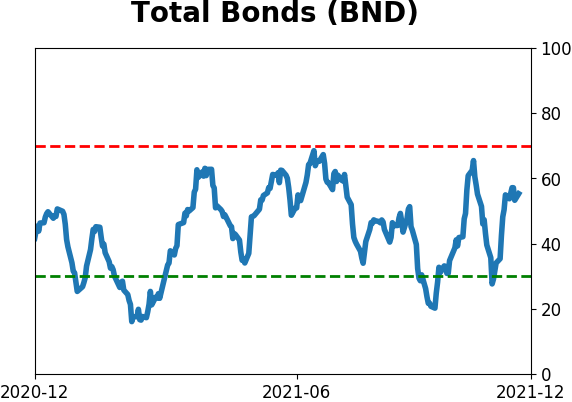
Bond ETF's - 10-Day Moving Average
|
|
|
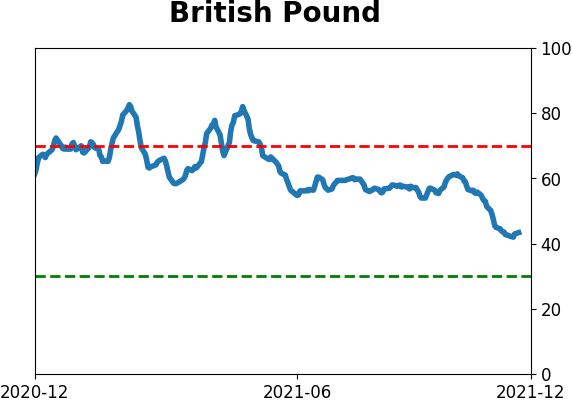
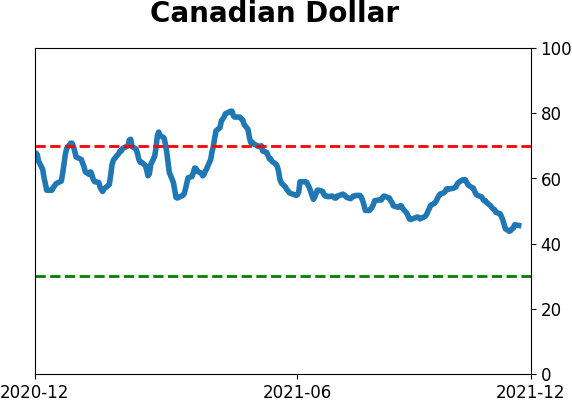
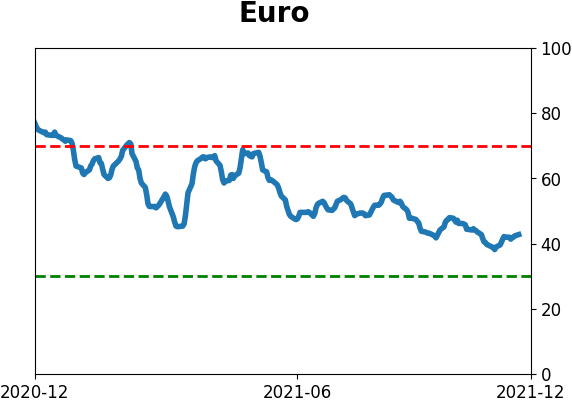
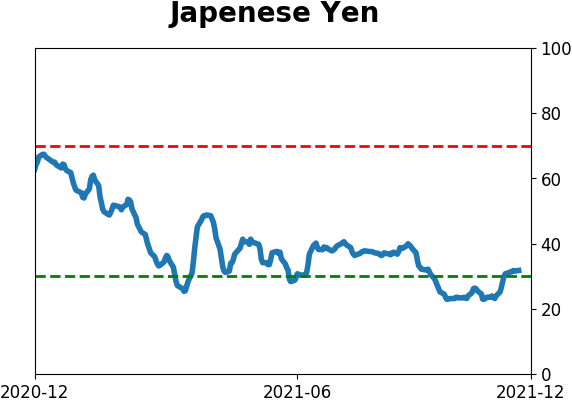
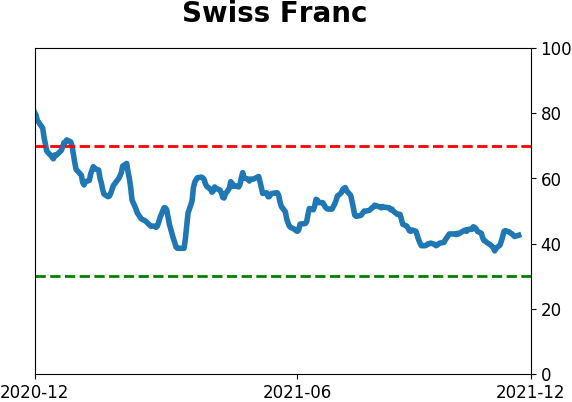
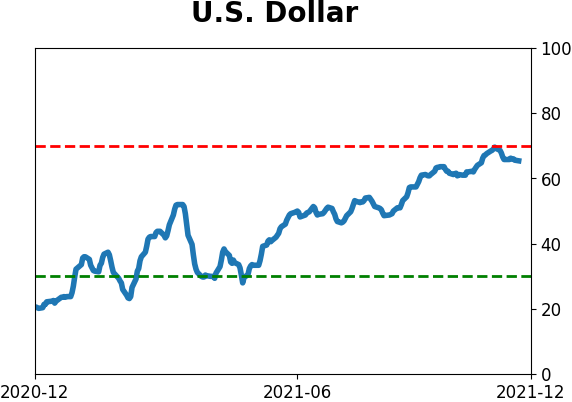
Currency ETF's - 5-Day Moving Average
|
|
|
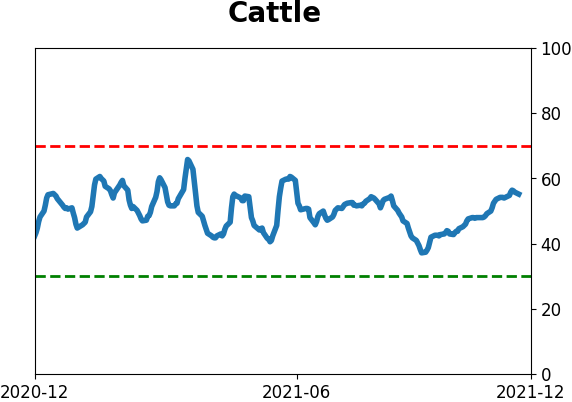
Commodity ETF's - 5-Day Moving Average
|
|