Headlines
|
|
Signs of a multi-year turnaround in Consumer Staples:
In October, investors panicked and sold Consumer Staples stocks en masse. Since then, they have returned in a big way, pushing many of the stocks back into medium-term uptrends. Similar behavior over the past 70 years only occurred around long-term bottoms in the sector.
|
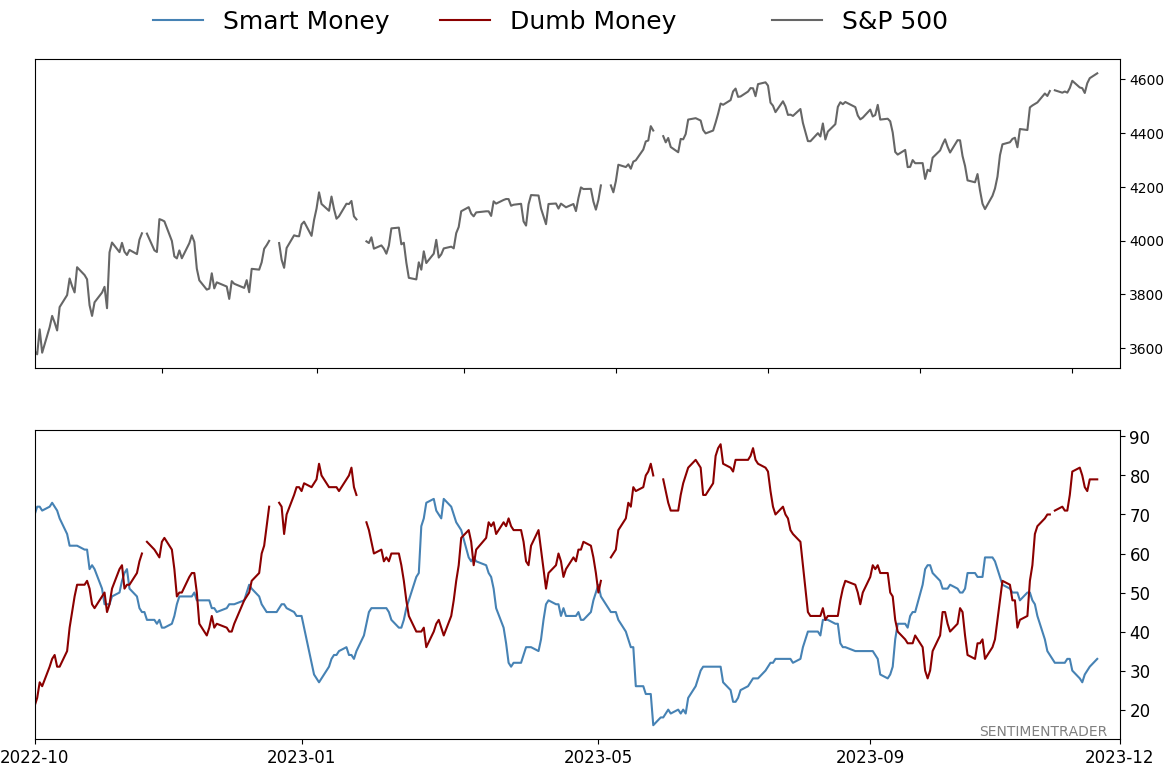
Smart / Dumb Money Confidence
|
Smart Money Confidence: 33%
Dumb Money Confidence: 79%
|
|
Risk Levels
Stocks Short-Term
|
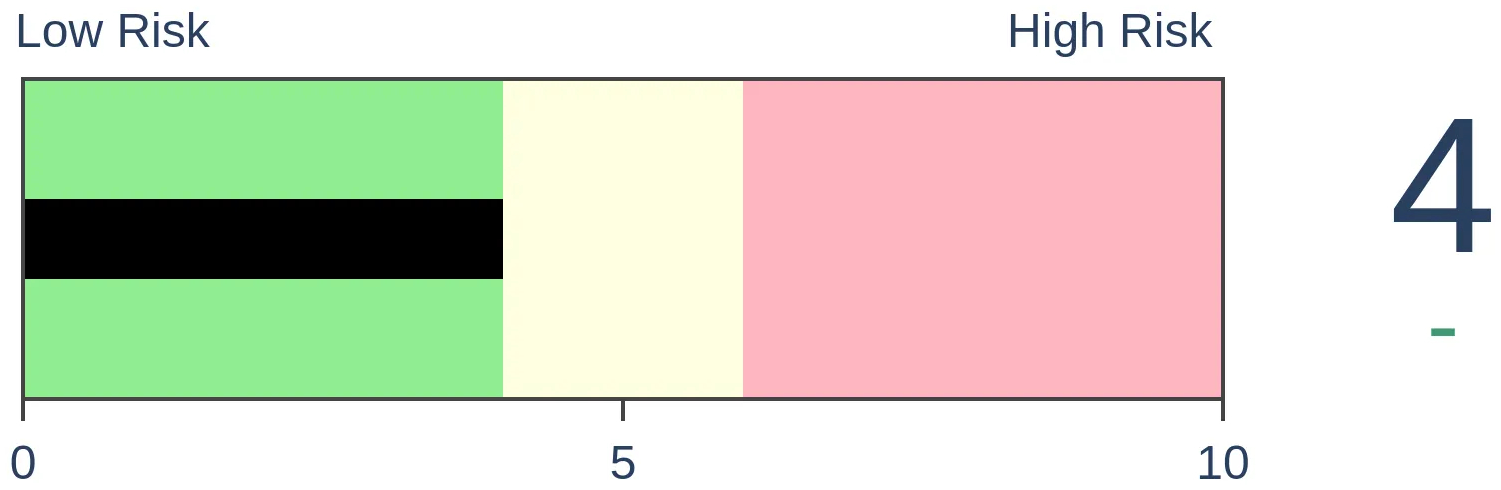
Stocks Medium-Term

|
|
Bonds
|
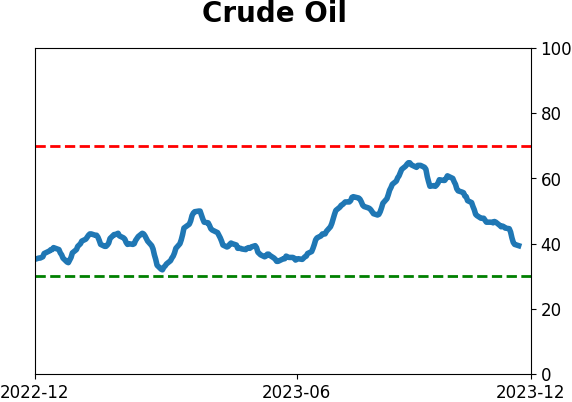
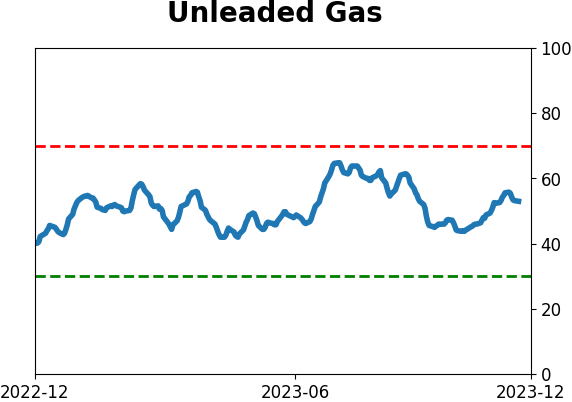
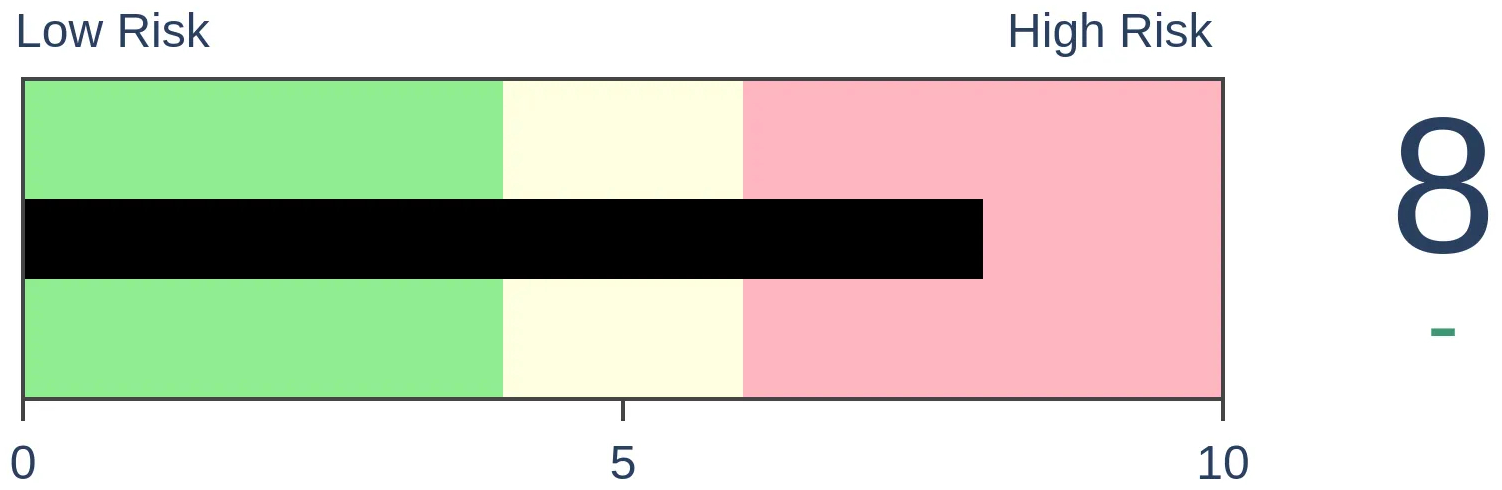
Crude Oil
|
|
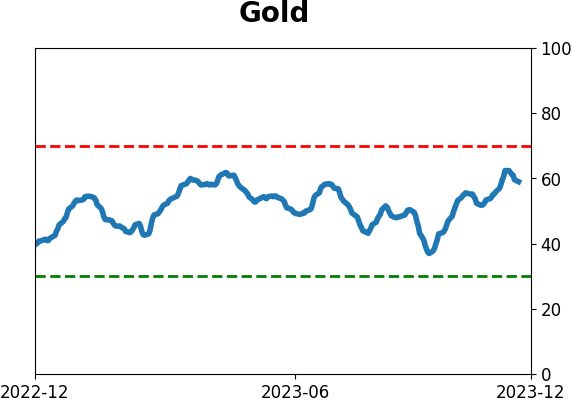
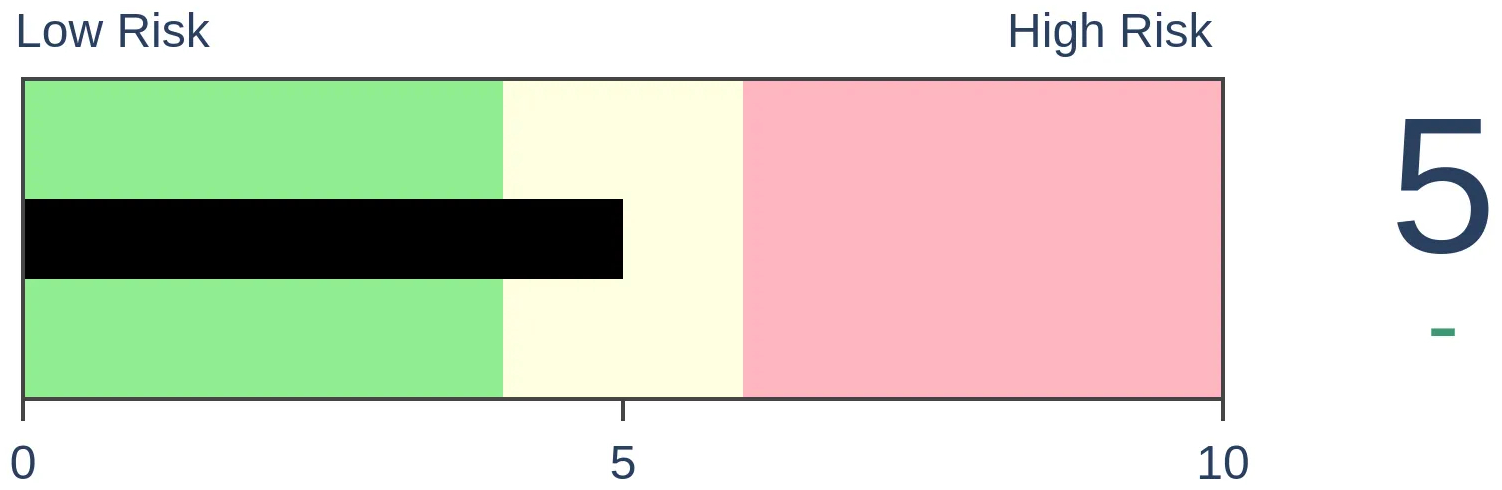
Gold

|
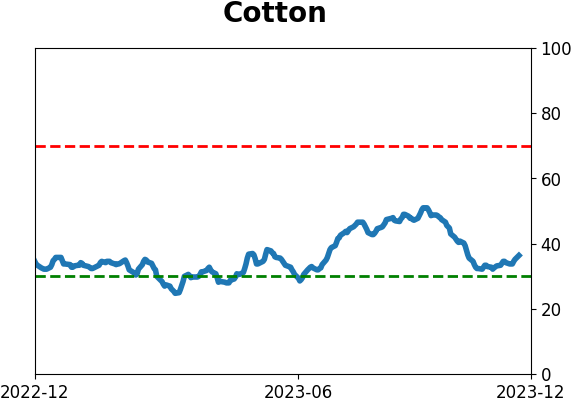
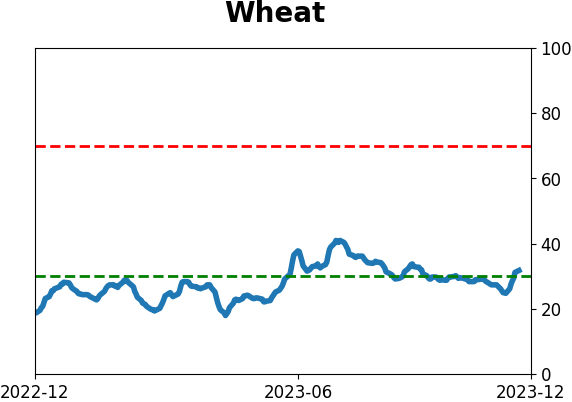
Agriculture

|
|
Research
By Jason Goepfert
BOTTOM LINE
In October, investors panicked and sold Consumer Staples stocks en masse. Since then, they have returned in a big way, pushing many of the stocks back into medium-term uptrends. Similar behavior over the past 70 years only occurred around long-term bottoms in the sector.
FORECAST / TIMEFRAME
None
|
Key points:
- Investors gave up on Consumer Staples in October but have returned in a big way
- There has been a remarkable surge in medium-term uptrends, even as most stocks remain in long-term downtrends
- Similar behavior preceded extremely strong long-term returns in the sector
Investors do an about-face within a defensive group of stocks
In October, signs of capitulation were piling up among Consumer Staples stocks. At the height of the selling pressure, nearly half of the stocks in the sector were trading at 52-week lows simultaneously, a reasonably reliable signal of total give-up among investors.
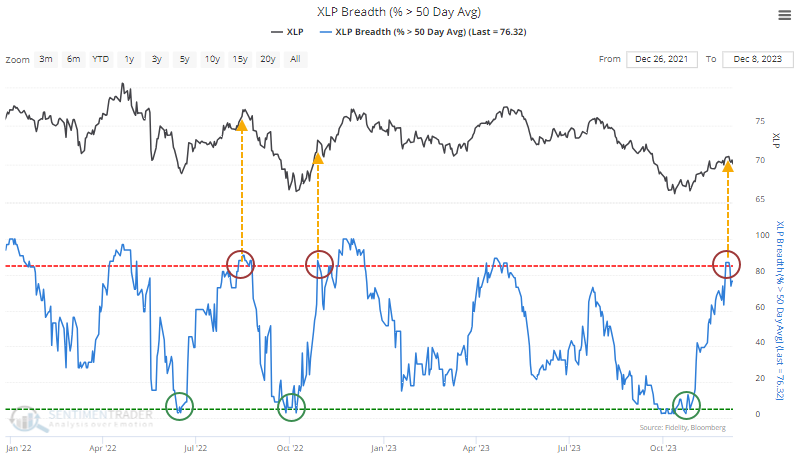
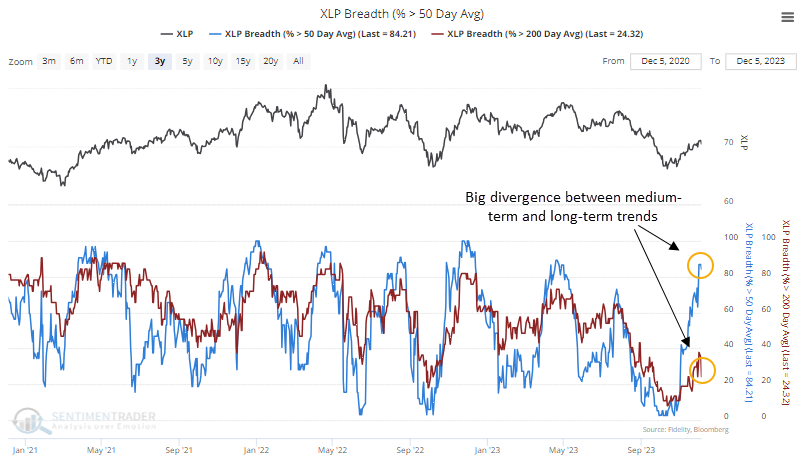
At the time, only a handful of Staples stocks were trading above their 50-day moving averages. In the robust rally since then, that has cycled to more than 85% of them, a rapid and impressive turnaround.
There were two similar washout-then-surge cycles since Staples peaked in April 2022. The first led to an immediate decline, the other lasted a bit, then gave up its gains.
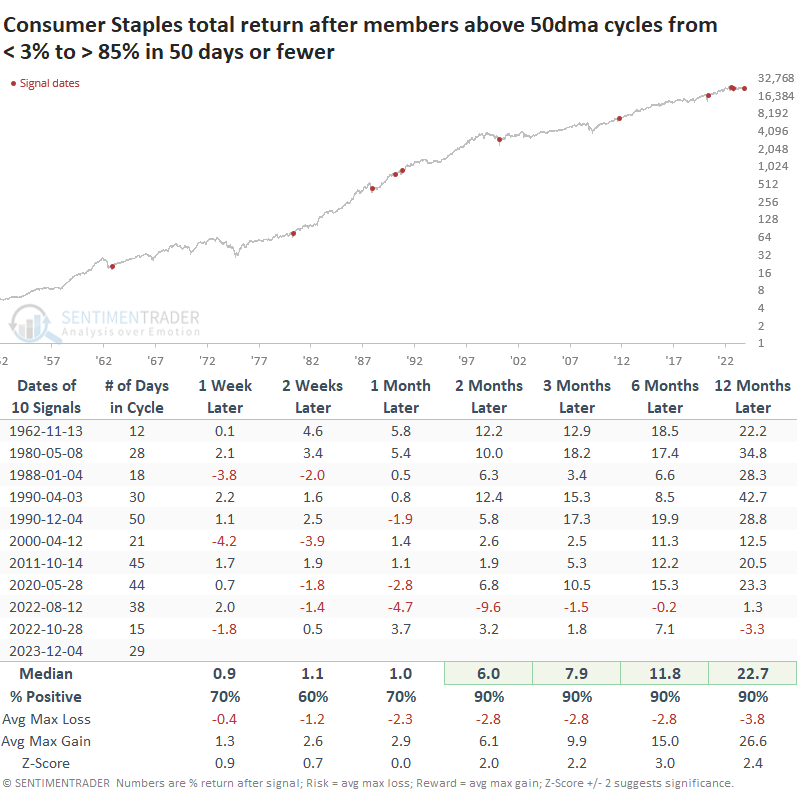
The table below shows all similar cycles over the past 70 years. These are times when fewer than 5% of Staples were trading above their 50-day average, then more than 85% of them were, all within 50 days or fewer.
We can see from the forward returns that this was an excellent sign of returning momentum, with a 90% win rate from two months and beyond. The last two signals have been less robust, so that's a bit of a concern.
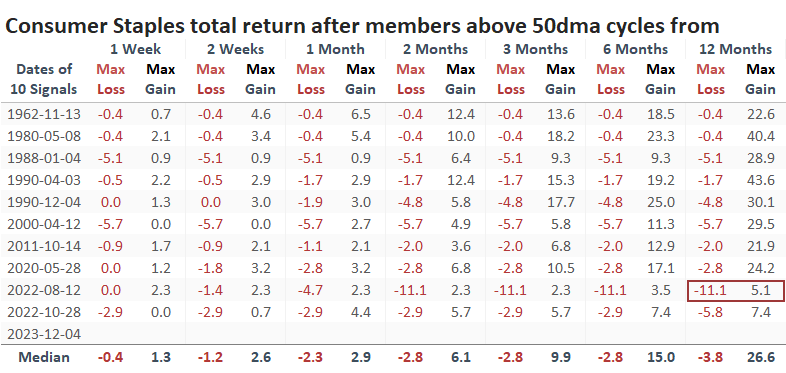
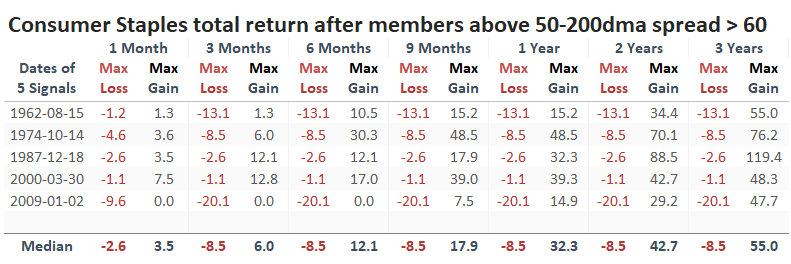
The table of maximum gains and losses shows that only one signal - the whoopsie-do from August 2022 - suffered more than a double-digit drawdown up to a year later. This is an impressive track record of low risk and high reward.
Medium-term surges within long-term downtrends
What's even more remarkable about the turnaround in medium-term trends is that it has occurred while most of the stocks are still mired within long-term downtrends; fewer than a quarter of Staples are trading above their 200-day moving averages.
Over the decades, we've witnessed this type of contextual surge quite a few times in various sectors. Almost invariably, they occur at long-term turning points.
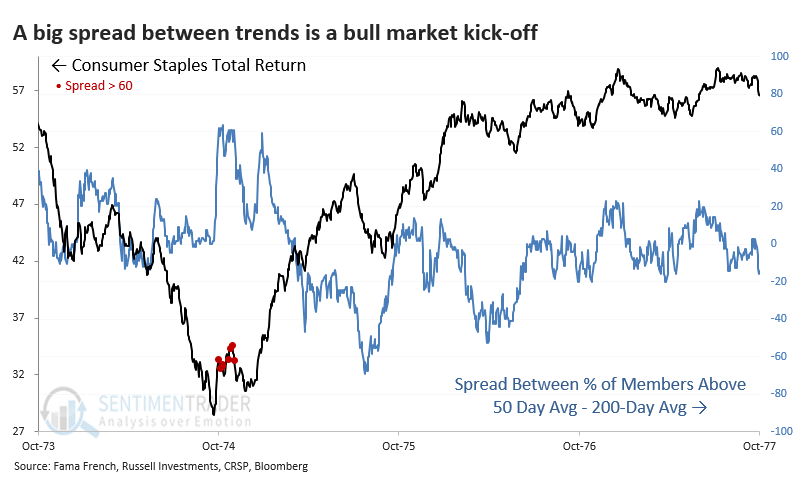
We can see this same phenomenon below. It shows each time there is more than a +60% spread between the percentage of Consumer Staples stocks trading above their 50-day versus 200-day moving averages. For example, it would trigger if more than 80% of stocks are above their 50-day average while fewer than 20% are trading above their 200-day.
Once again, it has a good track record of triggering near multi-year turning points.
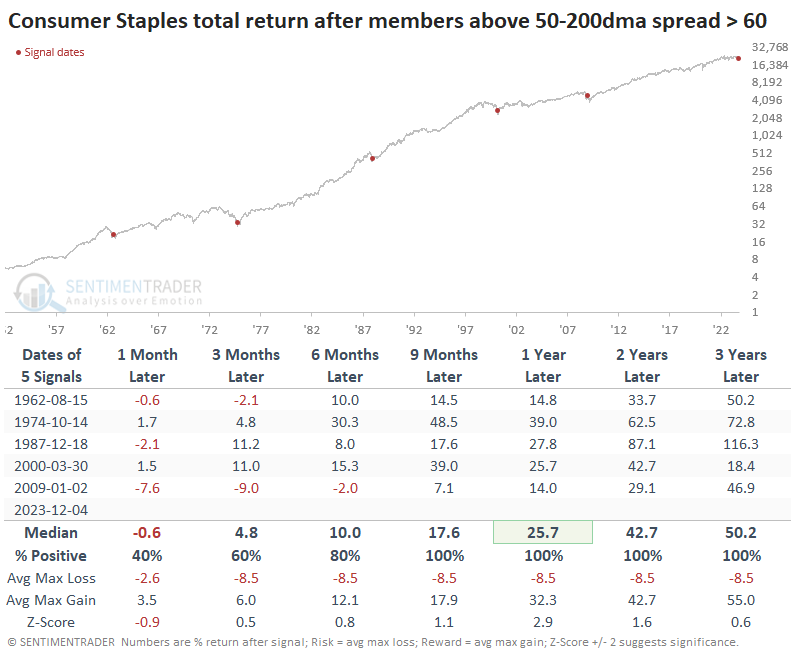
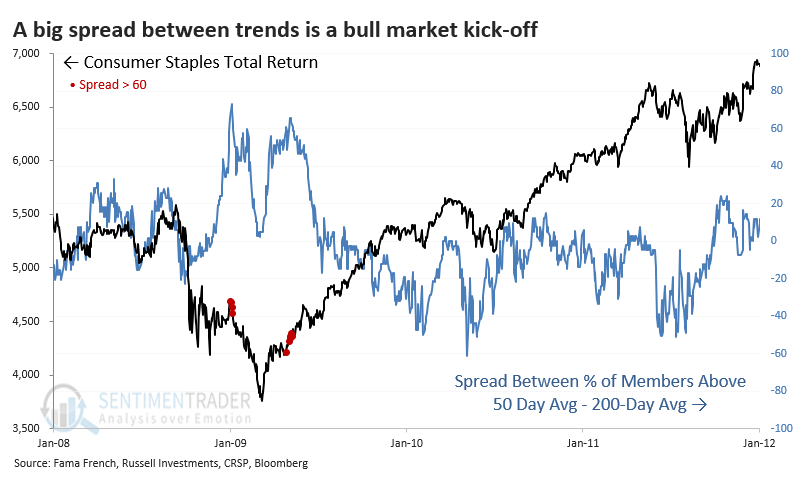
The biggest caveats are the usual ones regarding tiny sample sizes and the substantial drawdown an investor would have suffered as stocks were hammering out a bottom during the 2008 financial crisis.
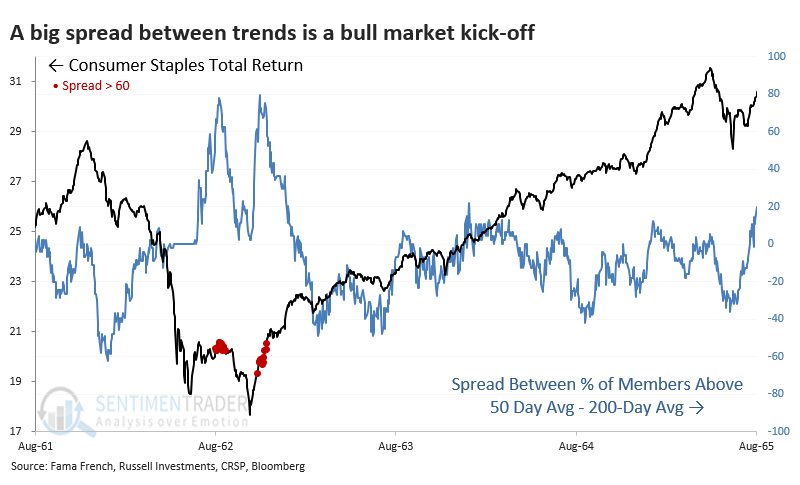
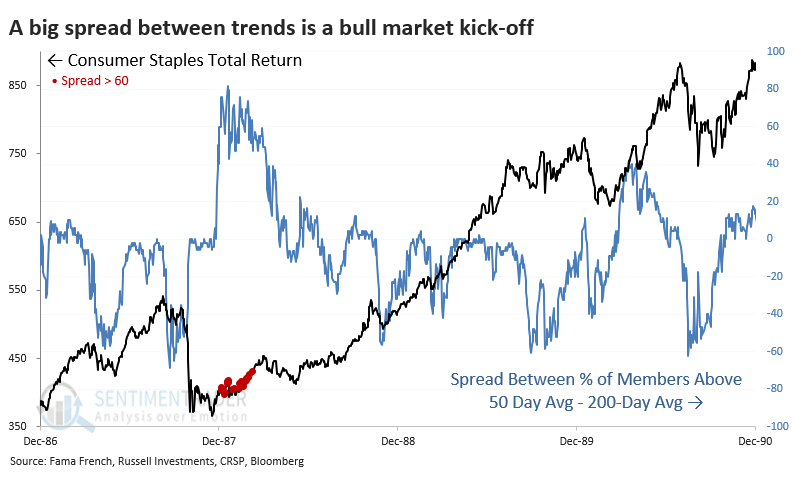
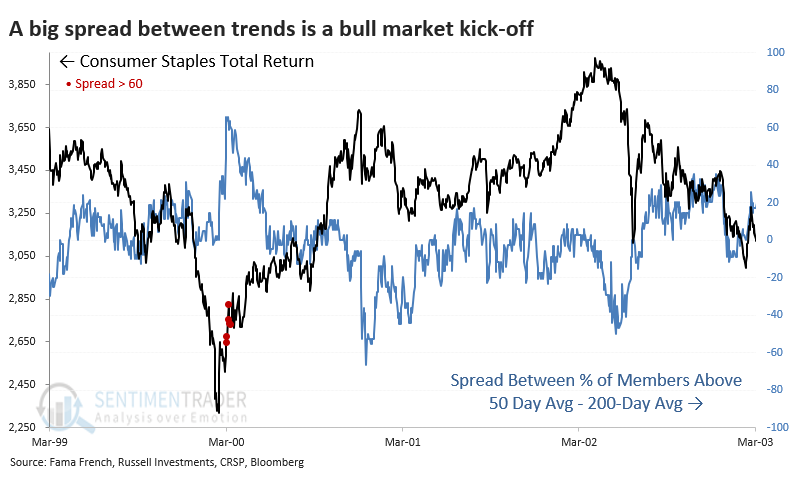
The charts below zoom in on each signal so we can see more clearly how the total return in Consumer Staples behaved around these wide spreads between medium- and long-term trends.
In 1962, this was initially triggered during the first push off the bottom, but investors then suffered a -13% drawdown as prices came back down to test the low and ultimately succeed. It triggered again during the initial phase of that second recovery.
In 1974, it was also triggered during the first push off the bottom, and again, there was a hefty drawdown, not quite -10%, as the initial enthusiasm faded. But the test of the lows didn't last long, and buyers soon rushed in for a sustained rally.
After the 1987 crash, the first push off the bottom triggered this wide spread between trends. The sector never really looked back after that.
The same could be said for the 2000 decline as the internet bubble in tech stocks burst. Investors rushed into Staples, and the rally just kept going.
The last signal, during the Great Financial Crisis, is similar to the 1962 period. The first signal triggered as stocks peaked, then fell again to test (and exceed) the low. That was the final v-bottom panic, and the returns following the second signal were phenomenal.
What the research tells us...
History is flooded with the tears of investors who relied too much on conclusions from tiny sample sizes. Markets are too complex, and inputs are constantly changing, so putting too much weight on any one thing is dangerous. But we have also learned that when small samples confirm other data and precede highly consistent behavior, we can put more weight on them.
That seems to be the case here - the washout metrics reached in October tended to precede solid long-term returns for Consumer Staples. The behavior of investors since then has further confirmed that we're seeing the type of activity that has consistently preceded long-term gains, not precluding some shorter-term losses.
Indicators at Extremes
Phase Table
Ranks
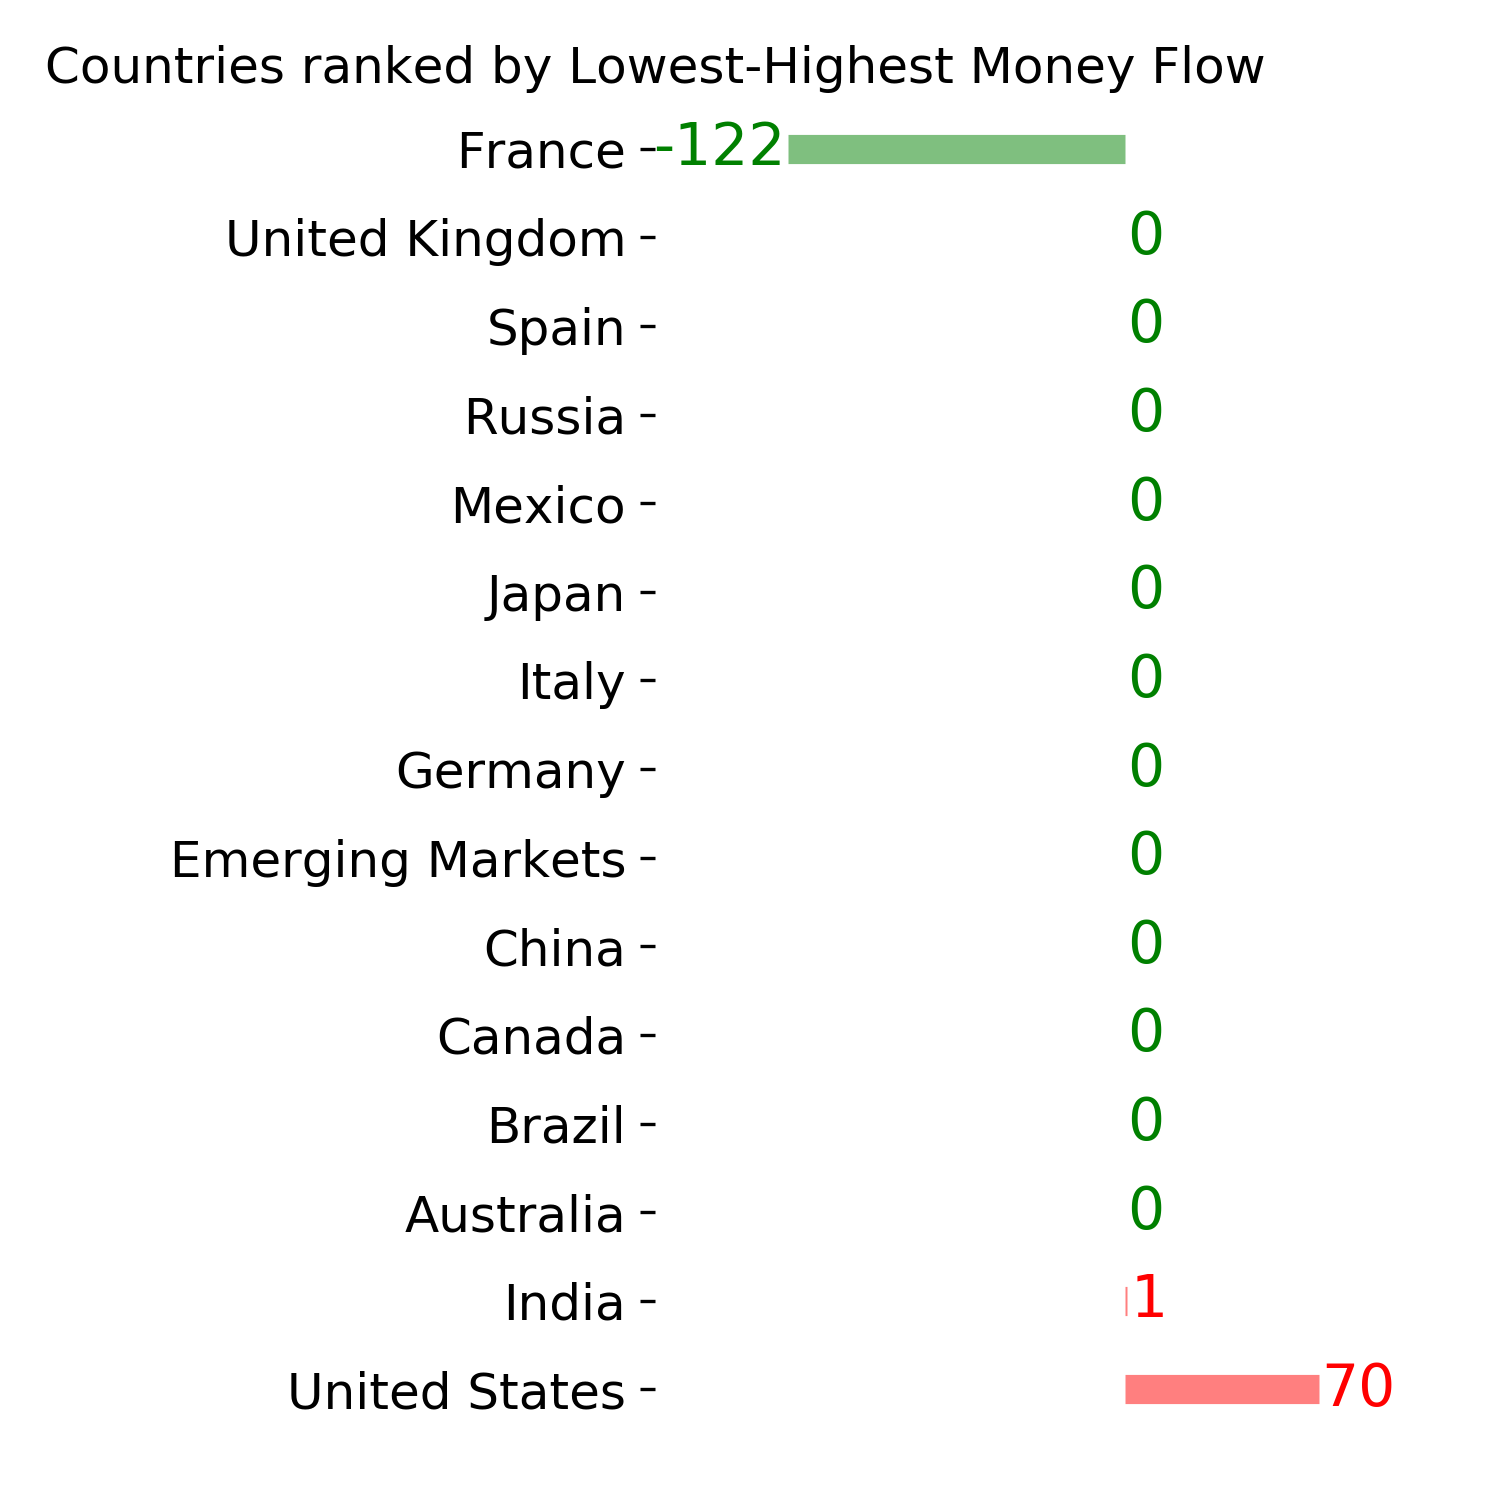
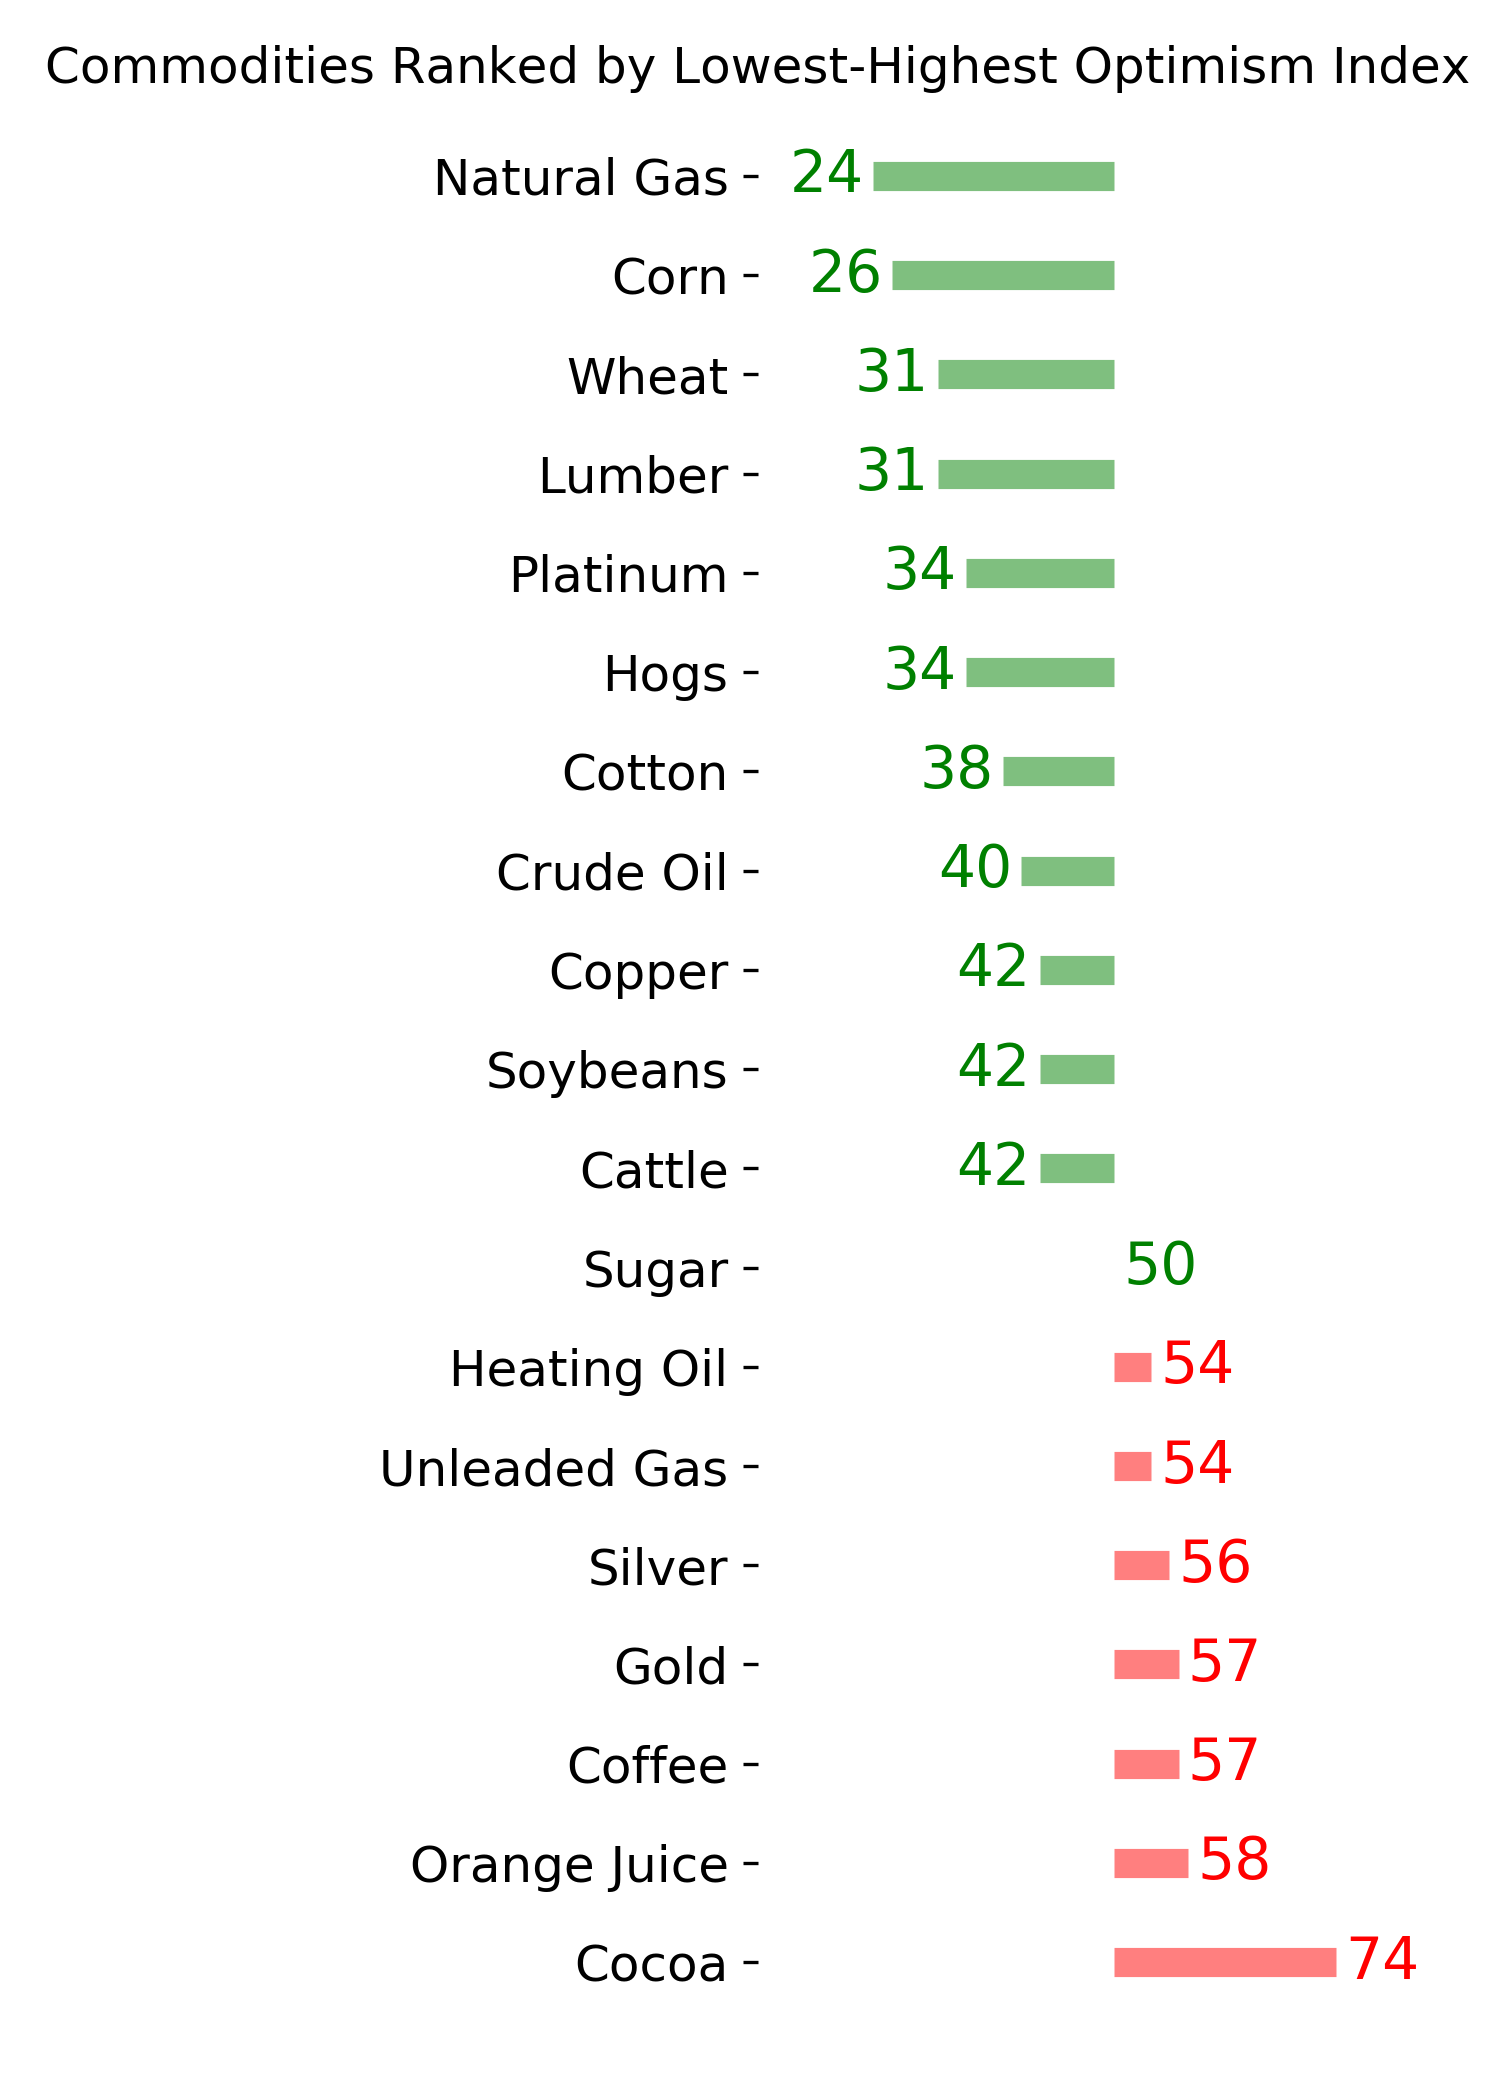
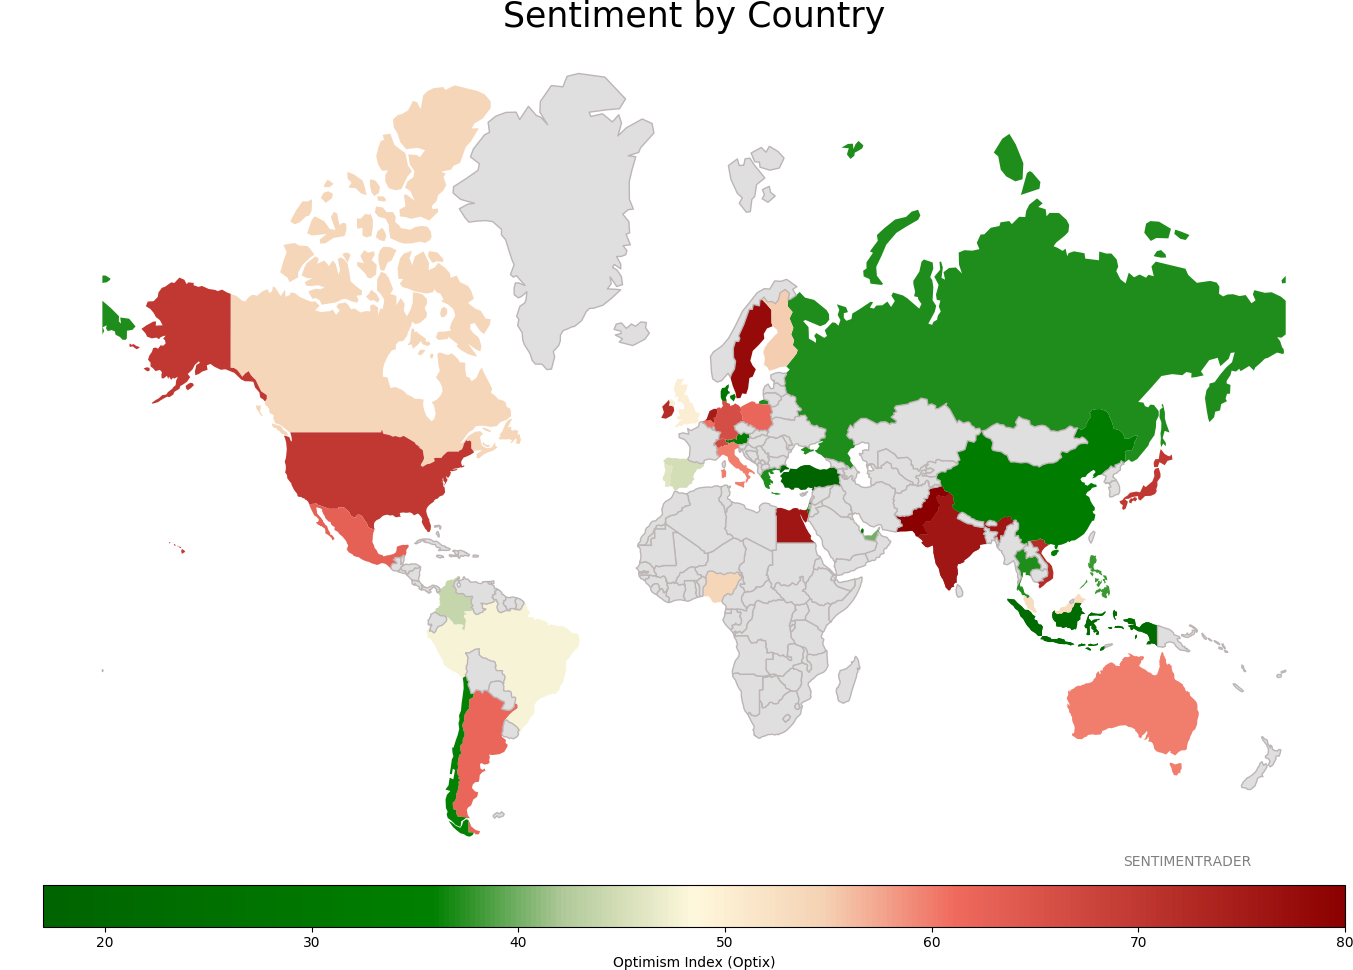
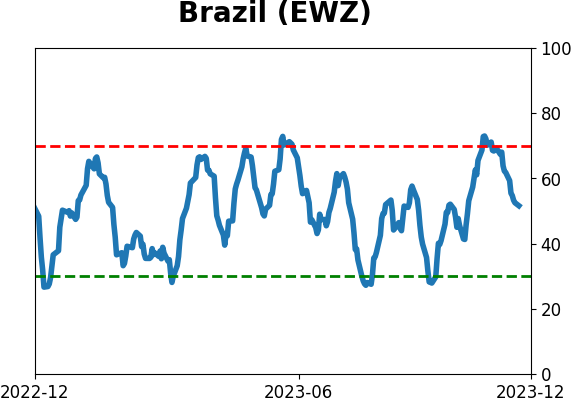
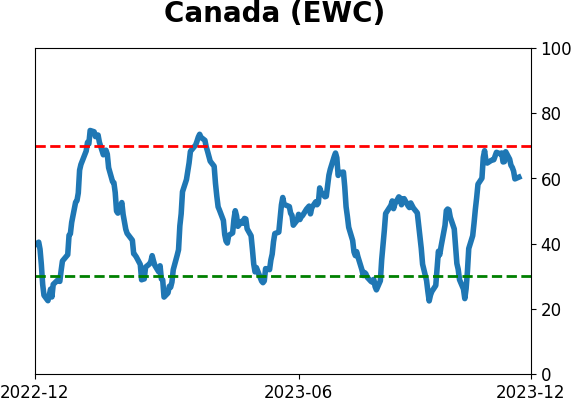
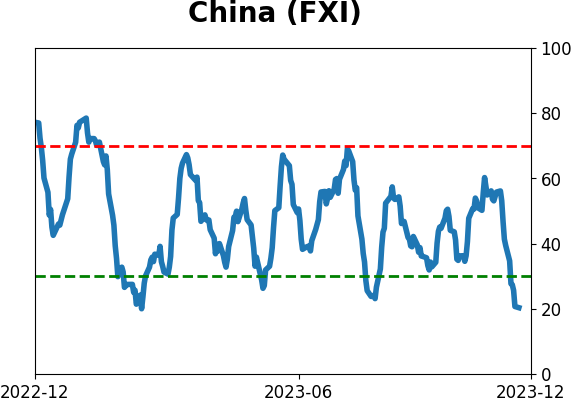
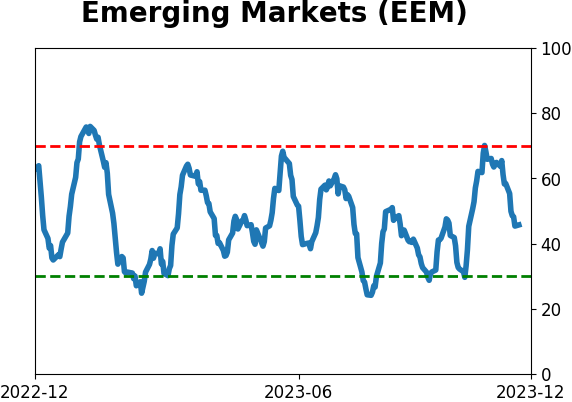
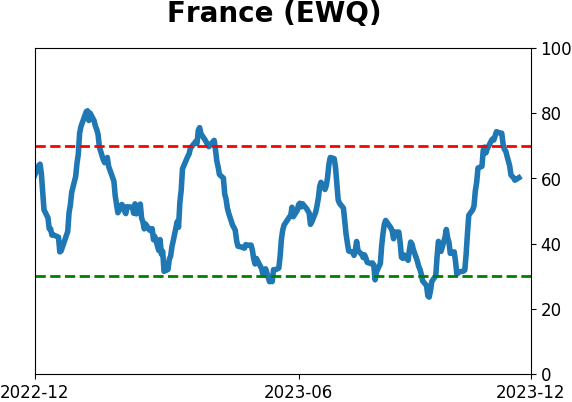
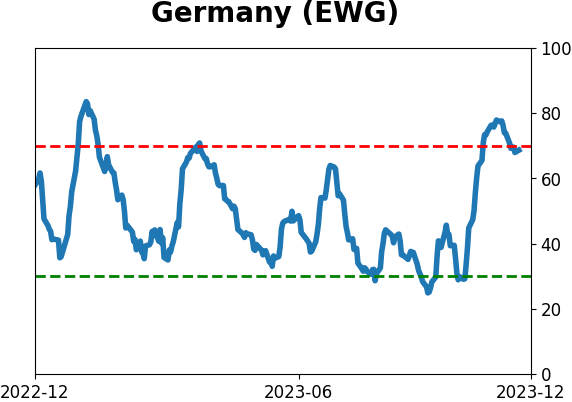
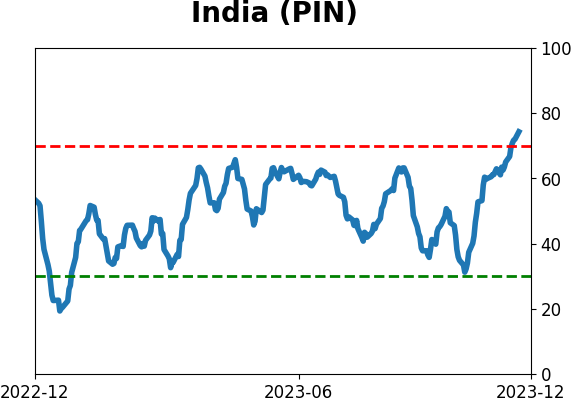
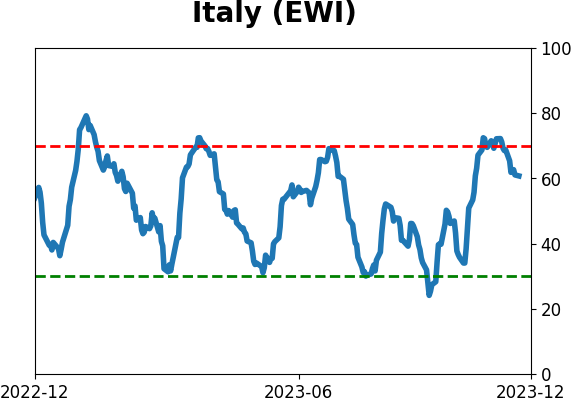
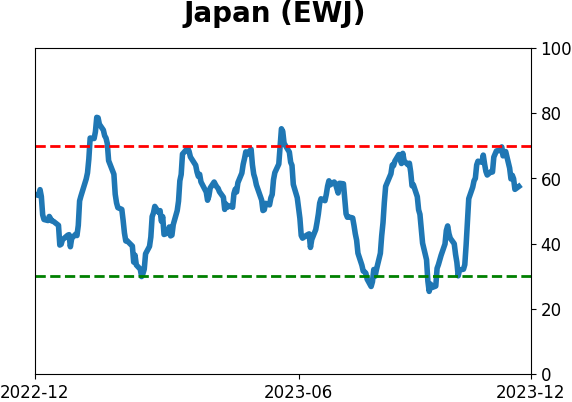
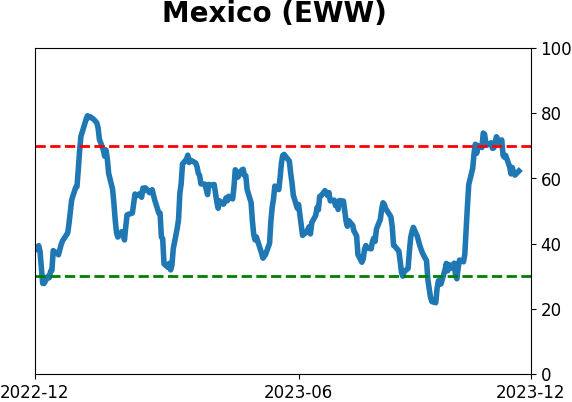
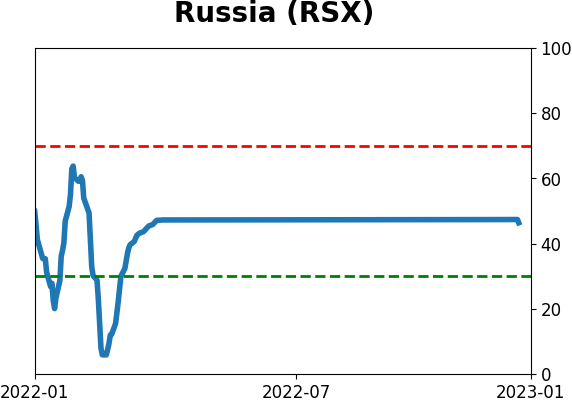
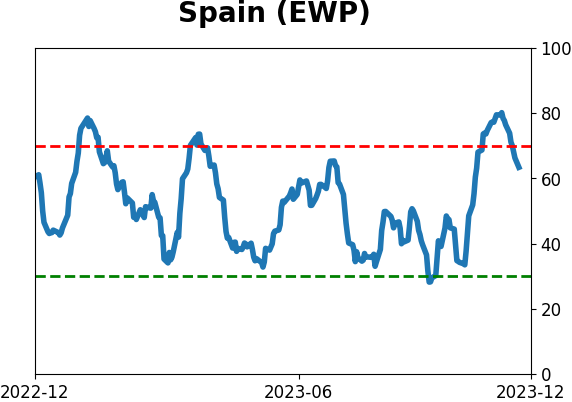
Sentiment Around The World
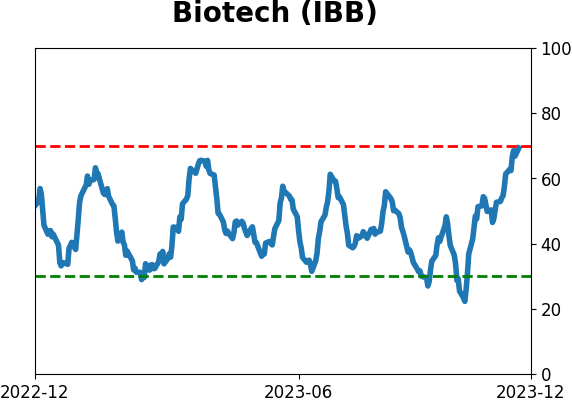
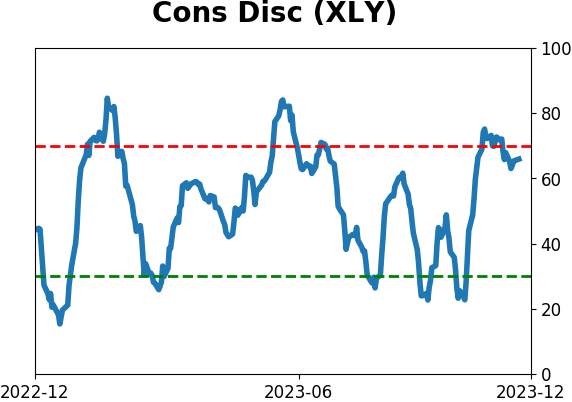
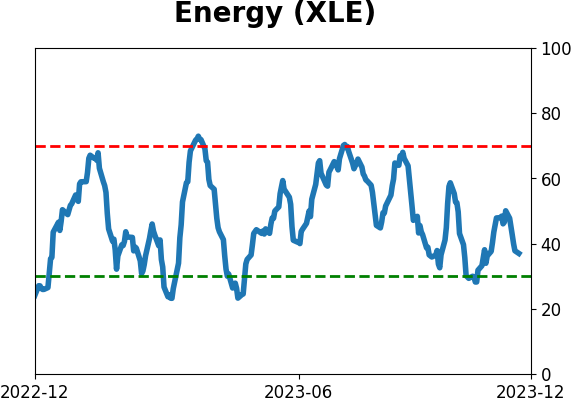
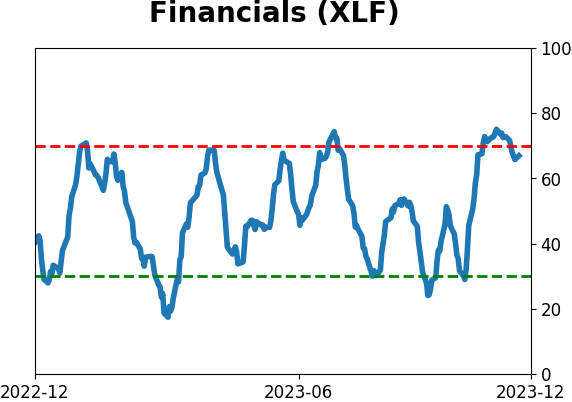
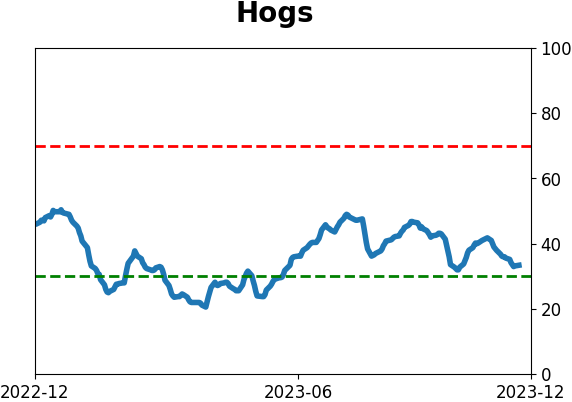
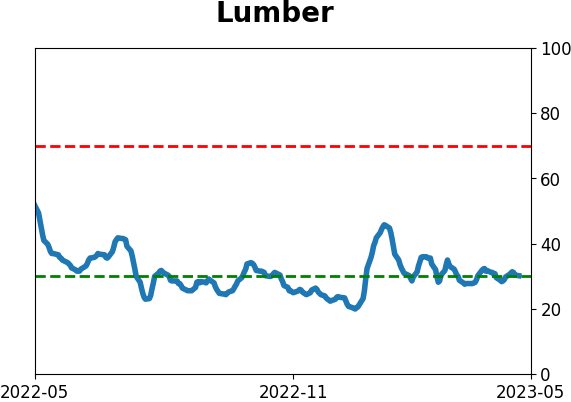
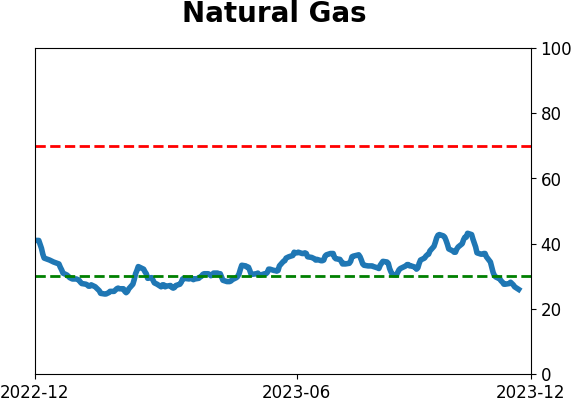
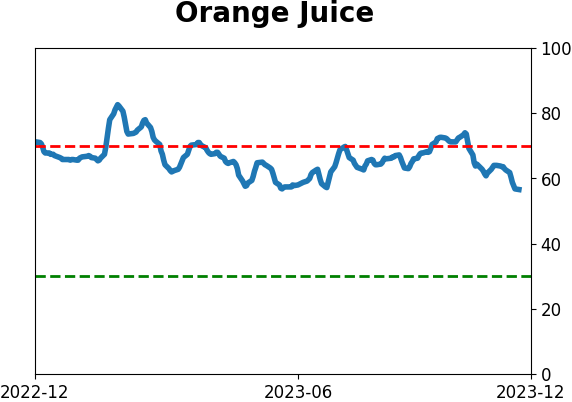
Optimism Index Thumbnails
|
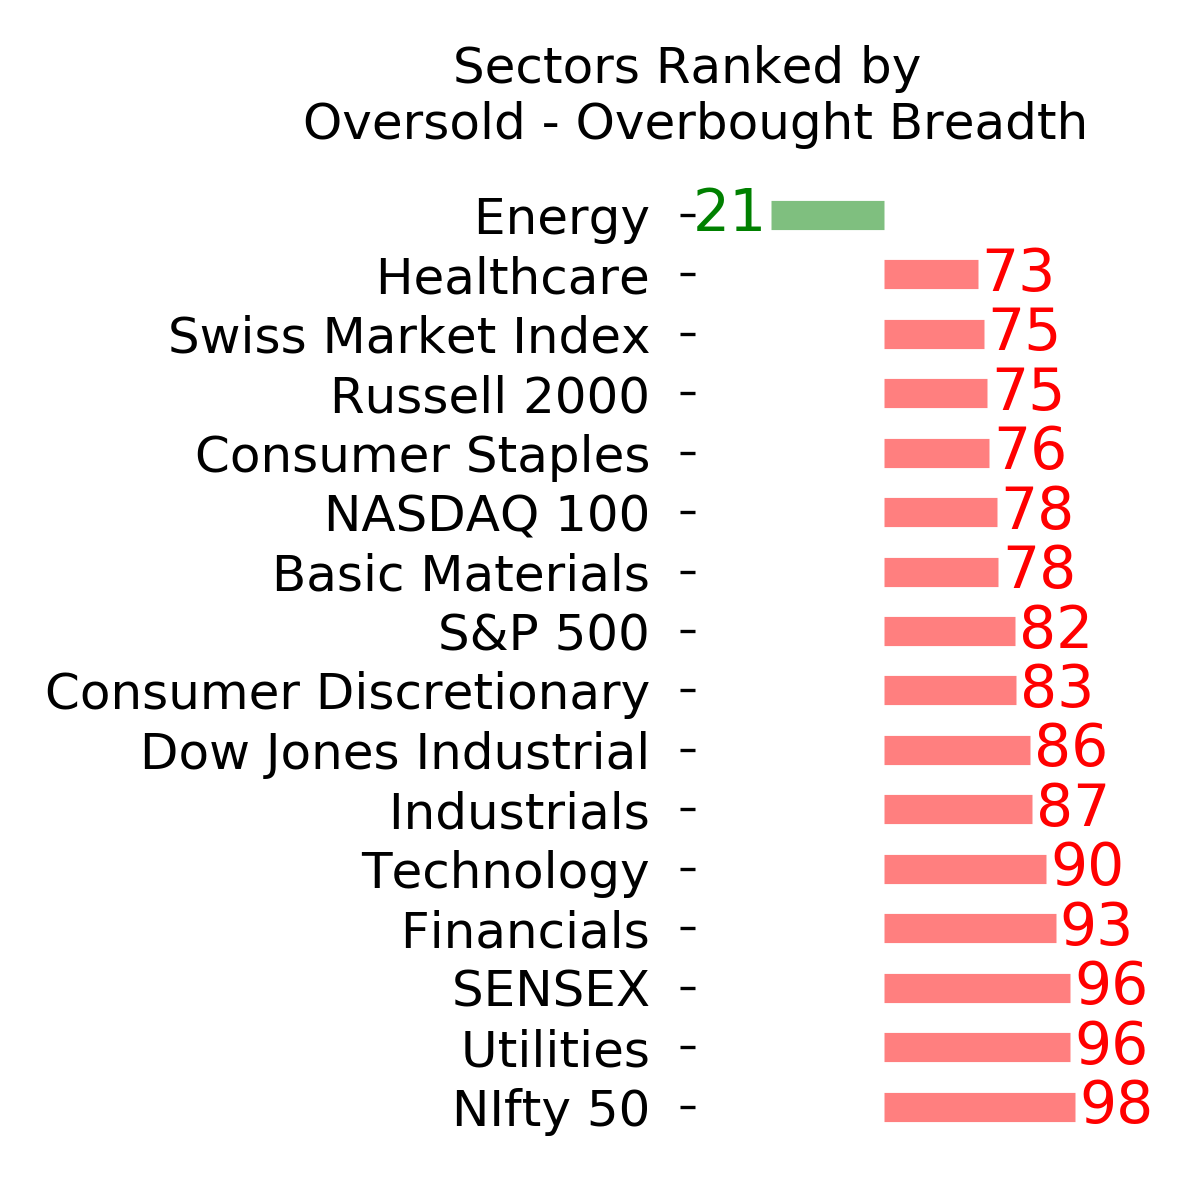
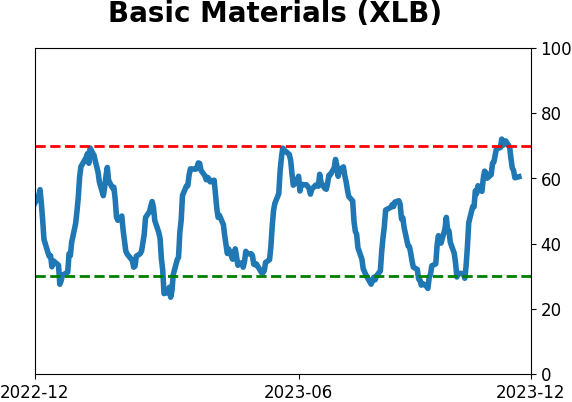
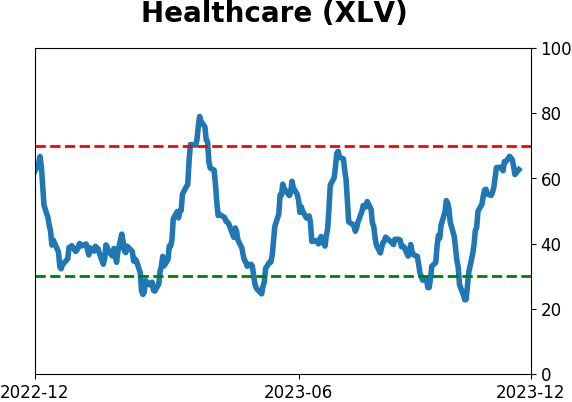
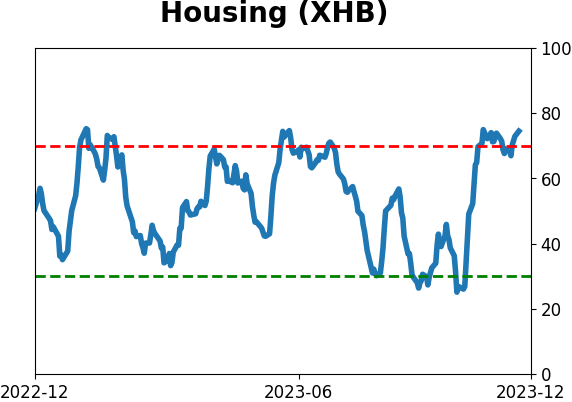
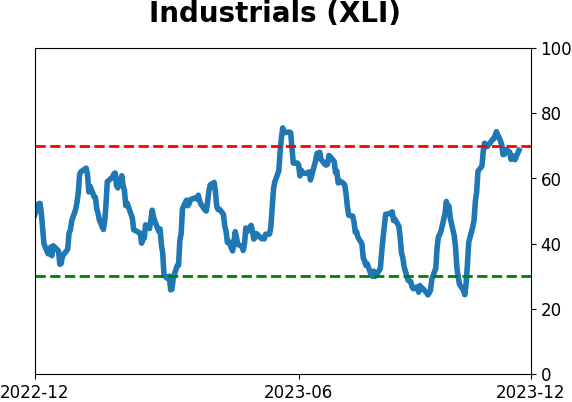
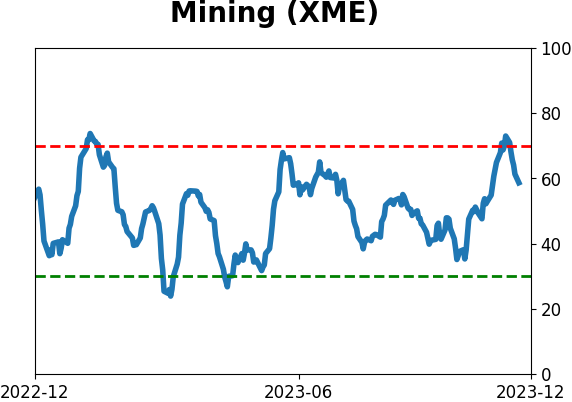
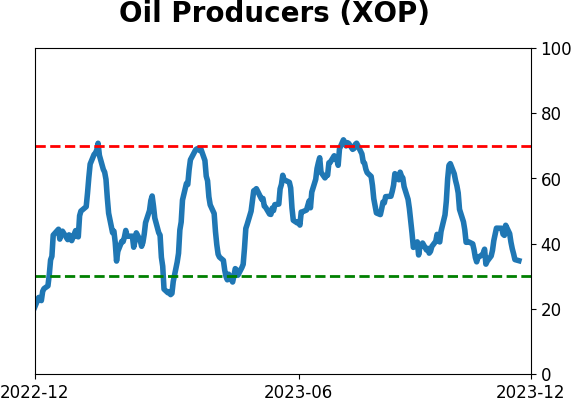
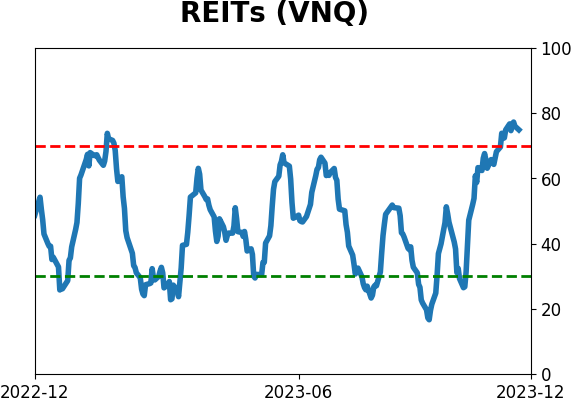
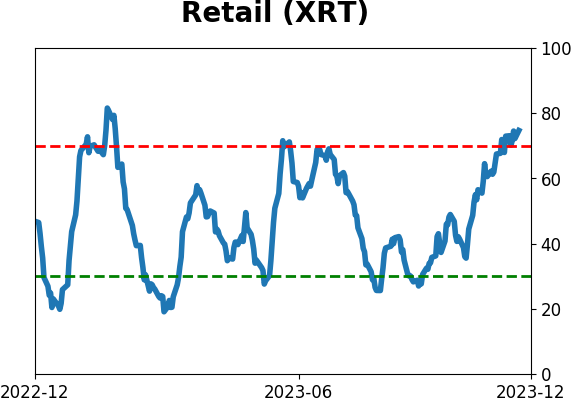
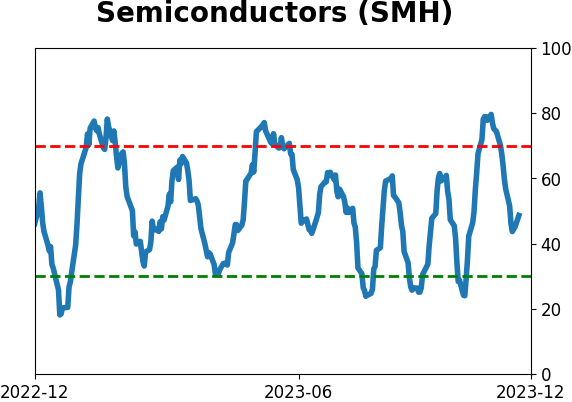
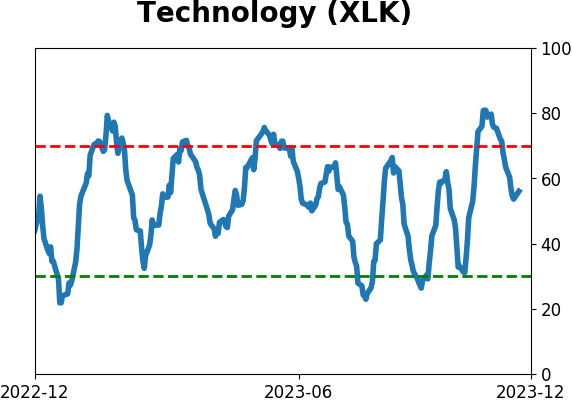
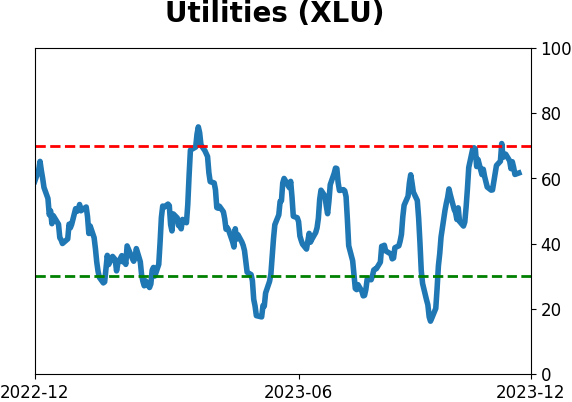
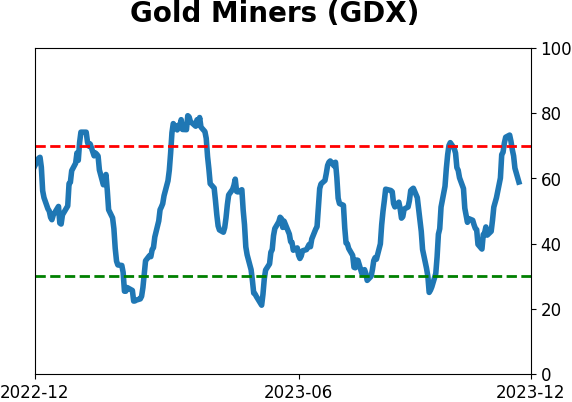
Sector ETF's - 10-Day Moving Average
|
|
|
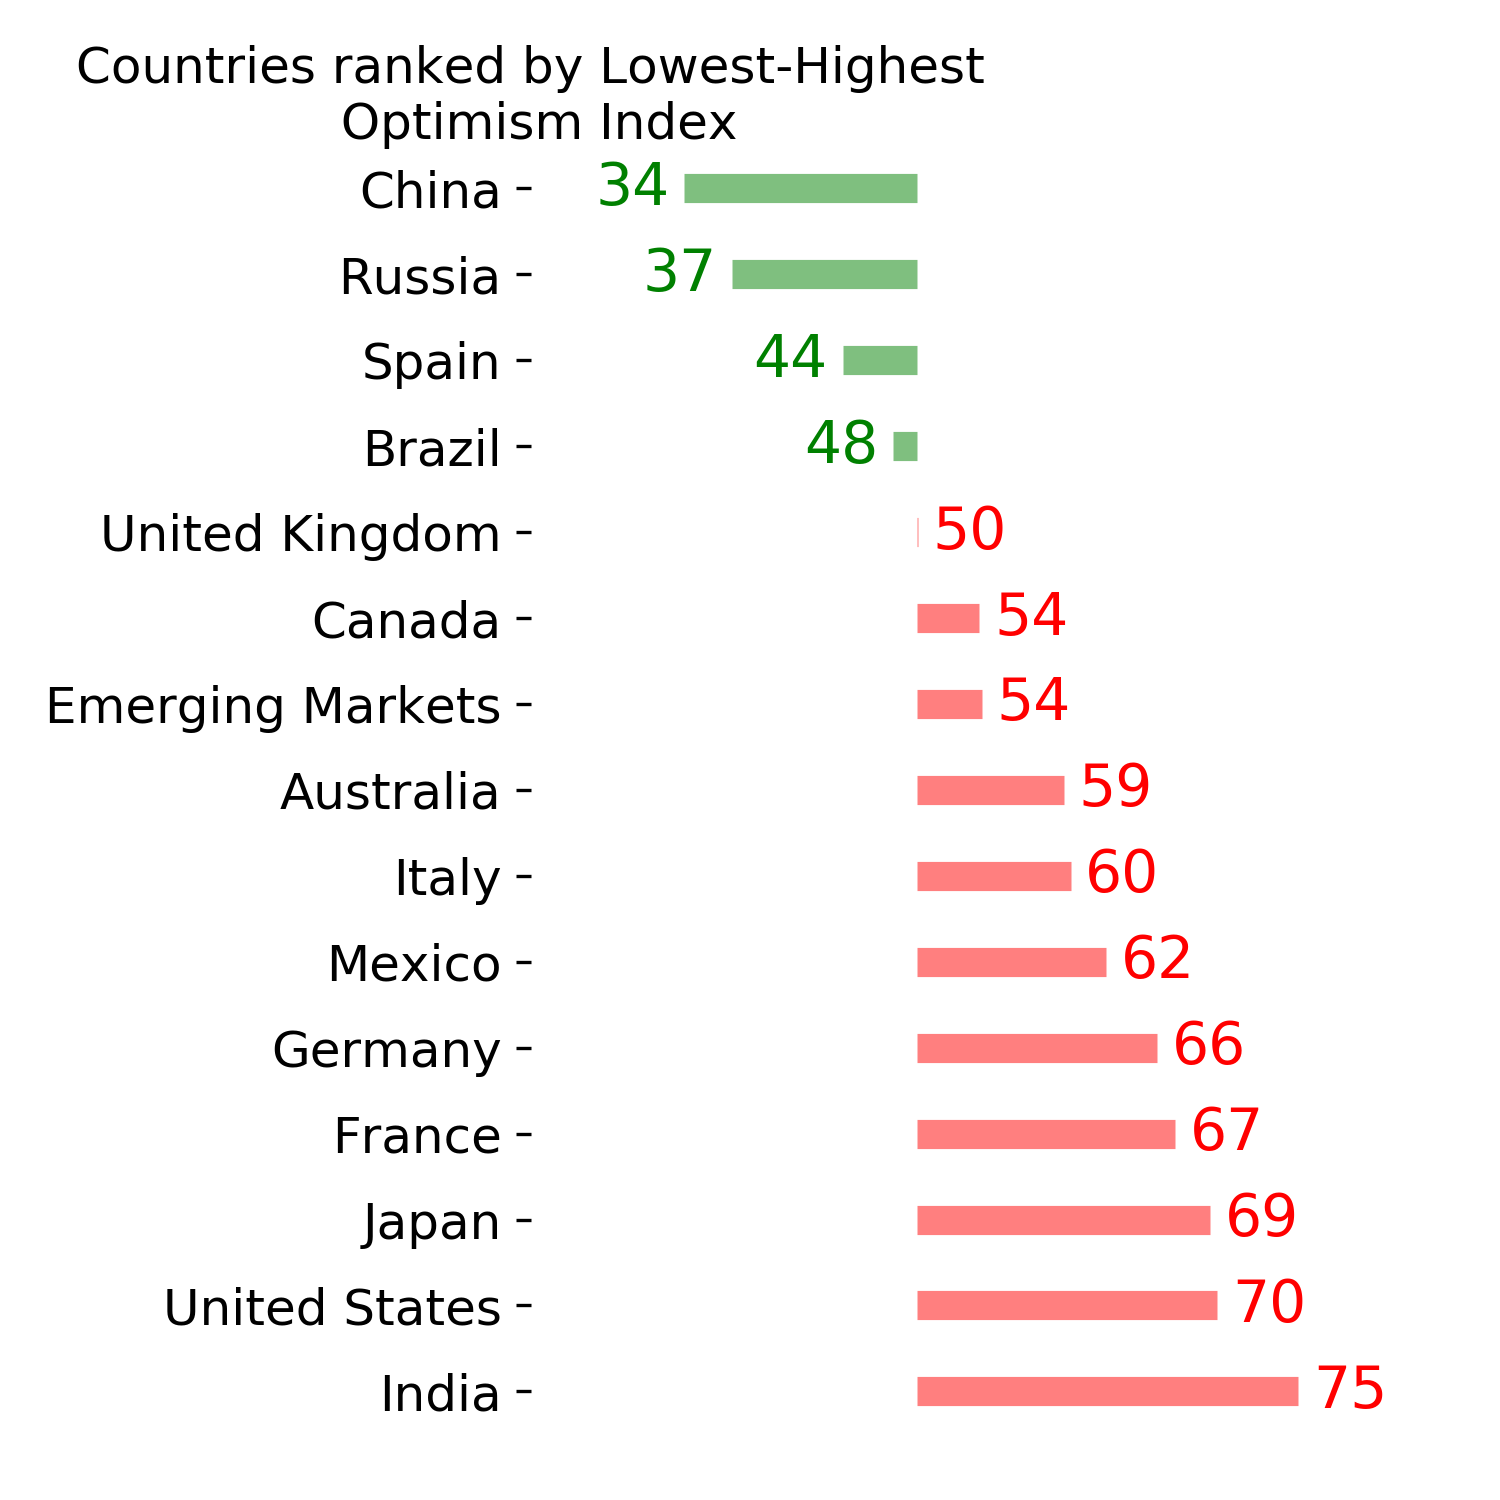
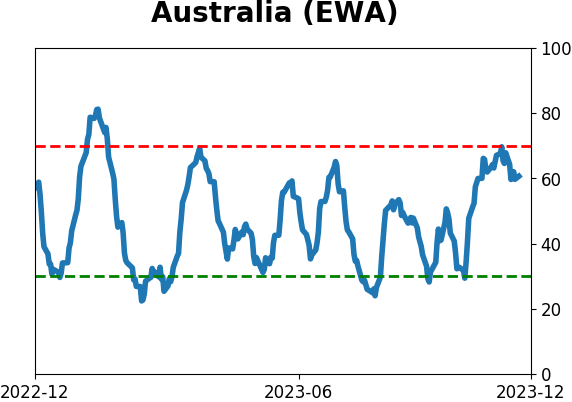
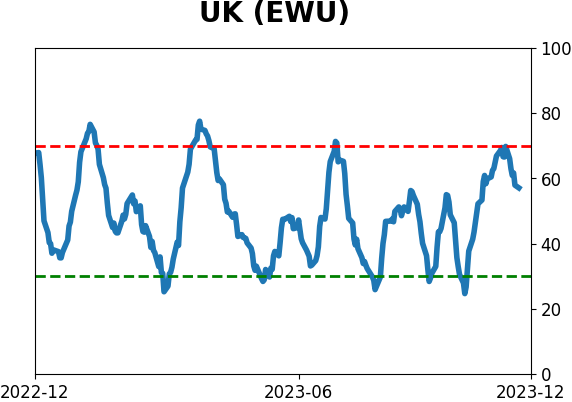
Country ETF's - 10-Day Moving Average
|
|
|
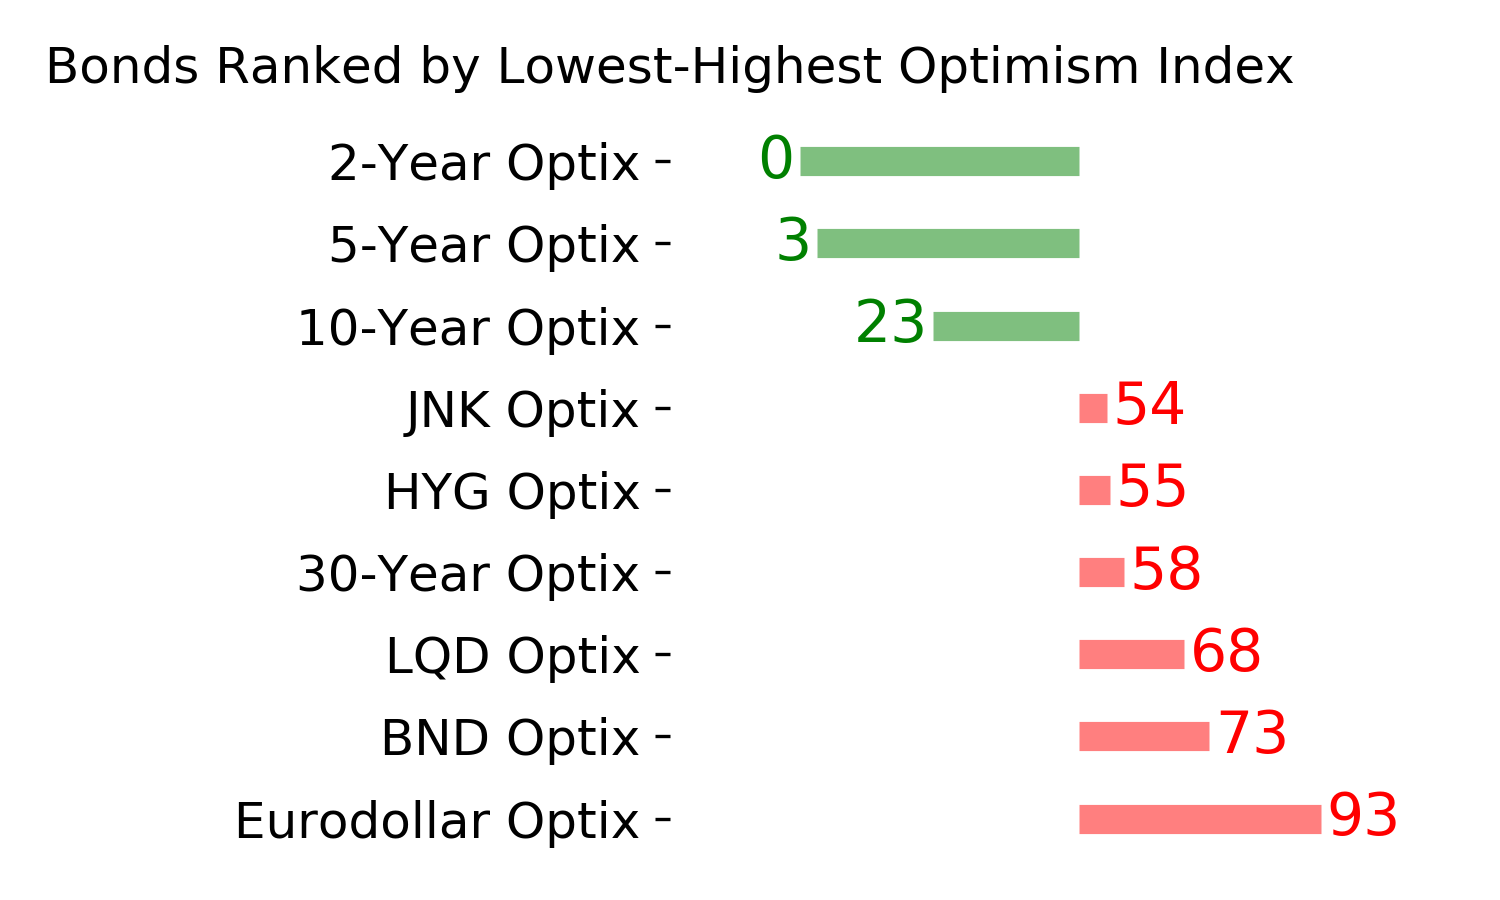
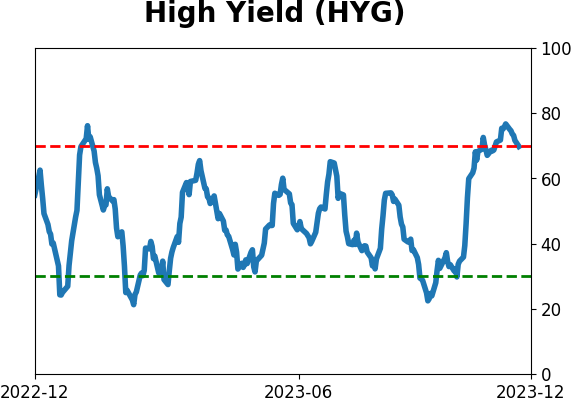
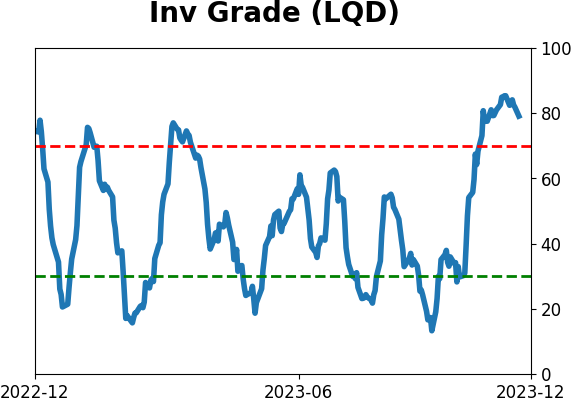
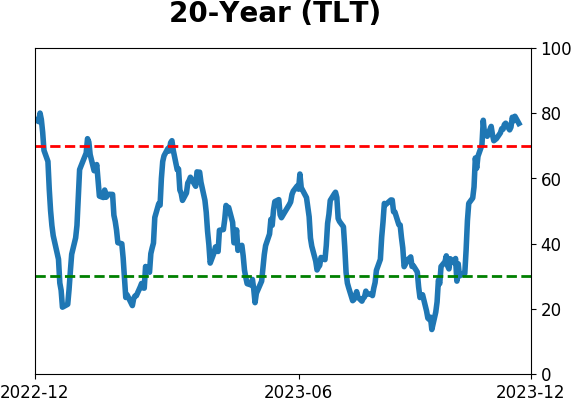
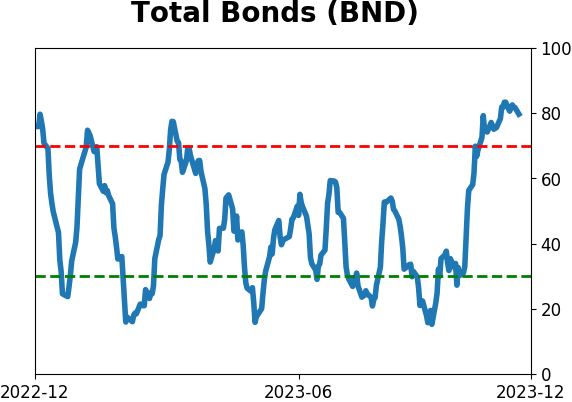
Bond ETF's - 10-Day Moving Average
|
|
|
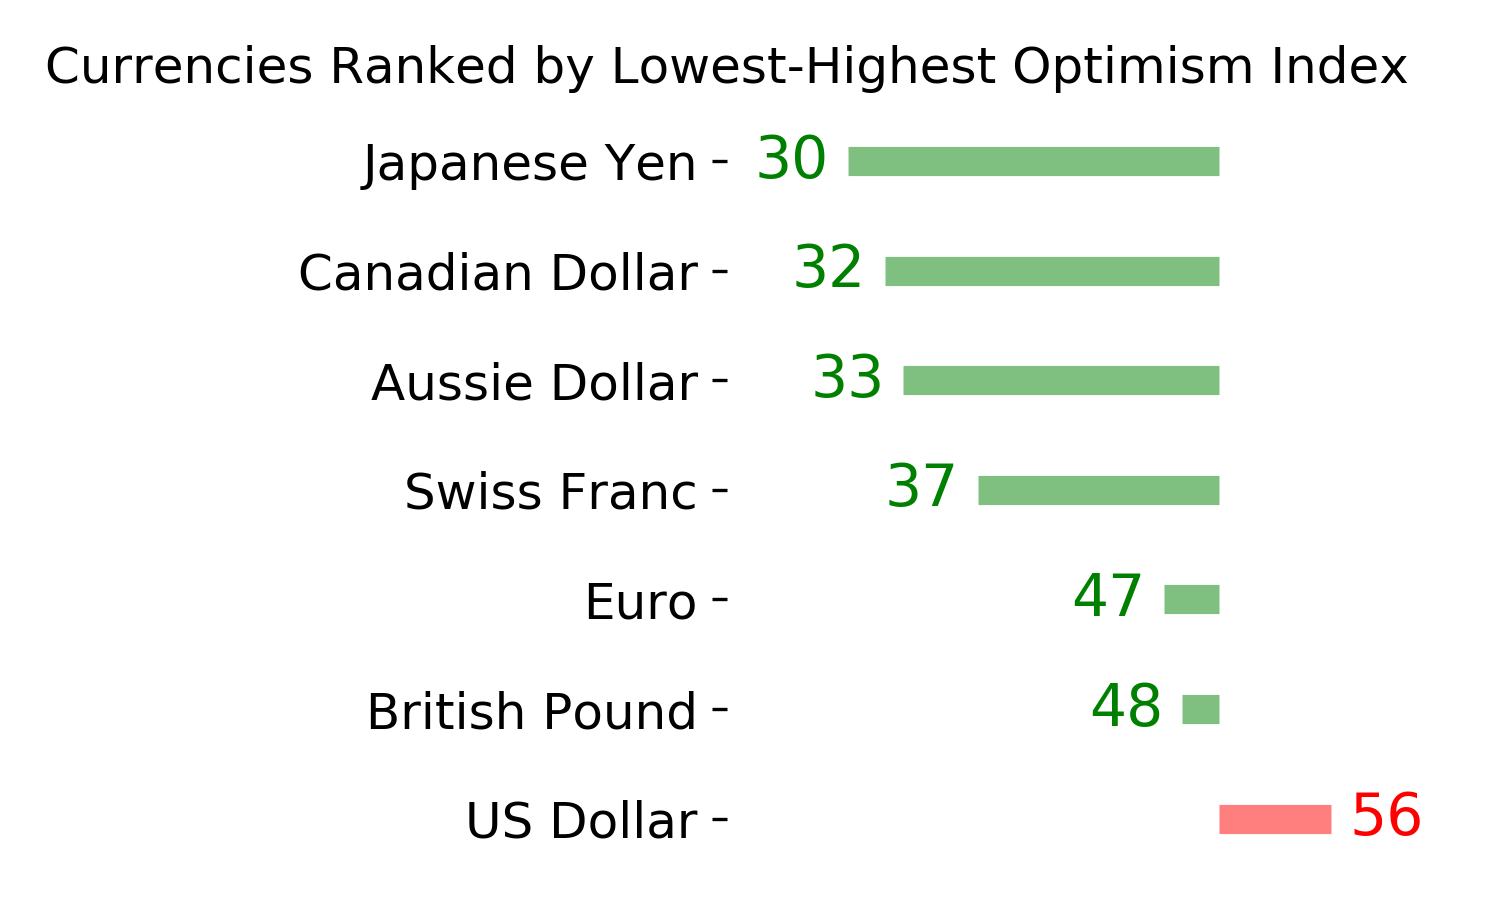
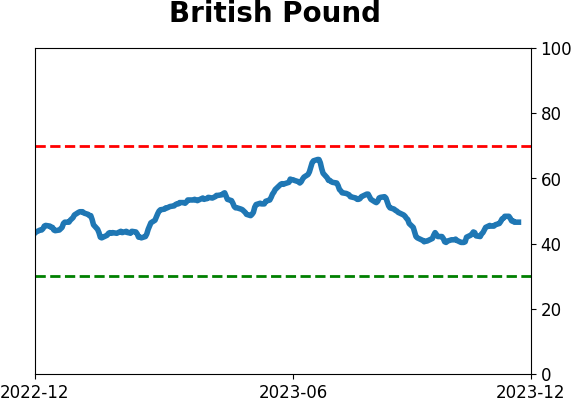
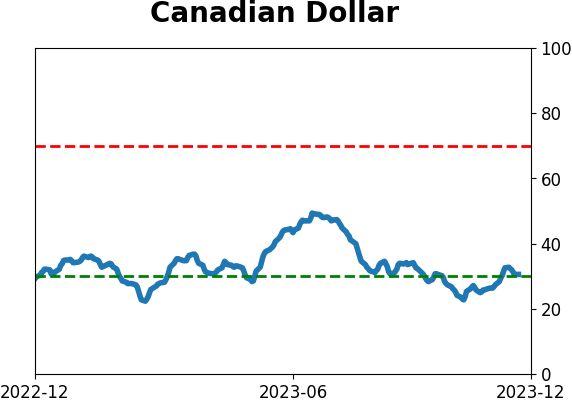
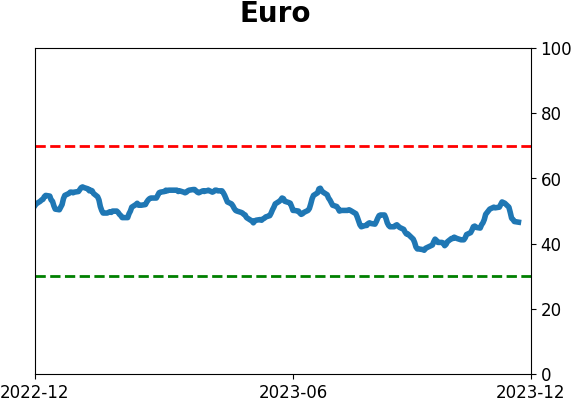
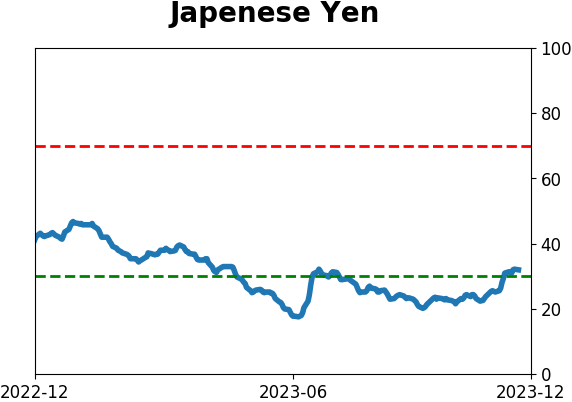
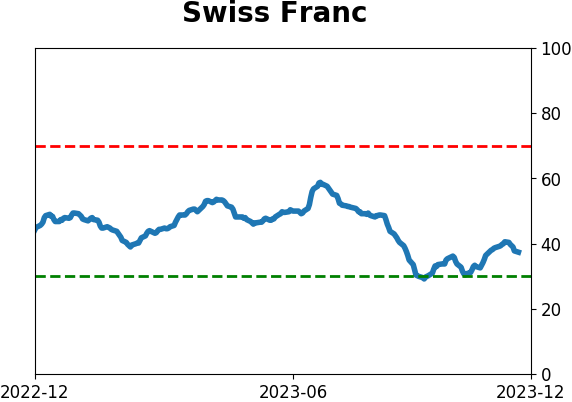
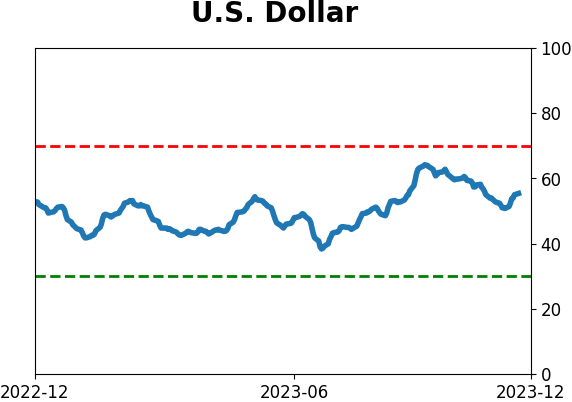
Currency ETF's - 5-Day Moving Average
|
|
|
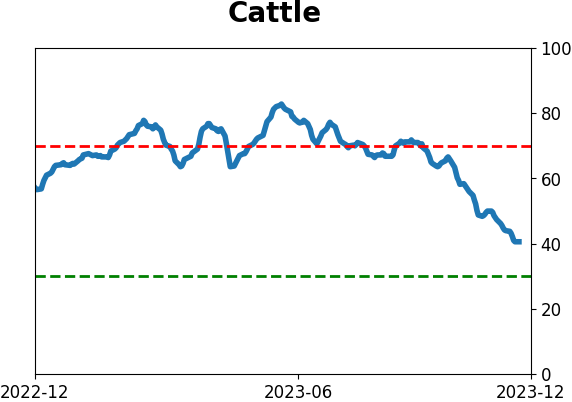
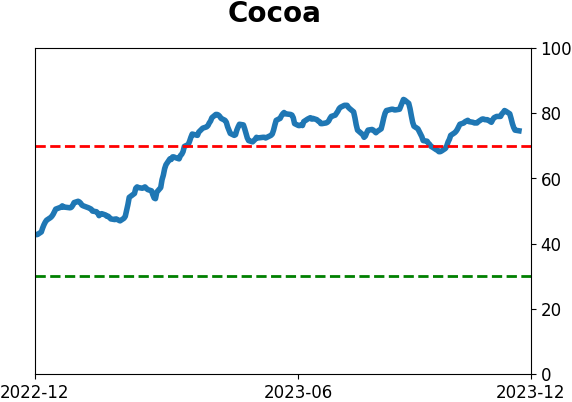
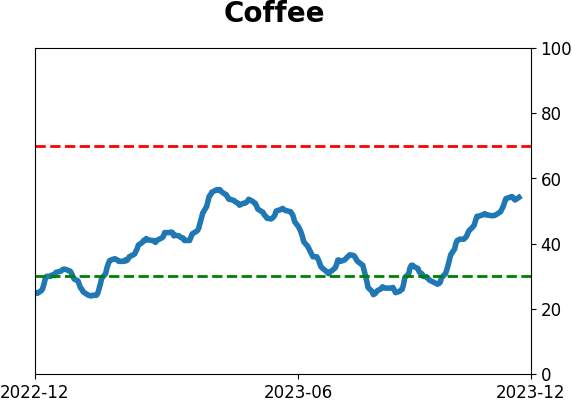
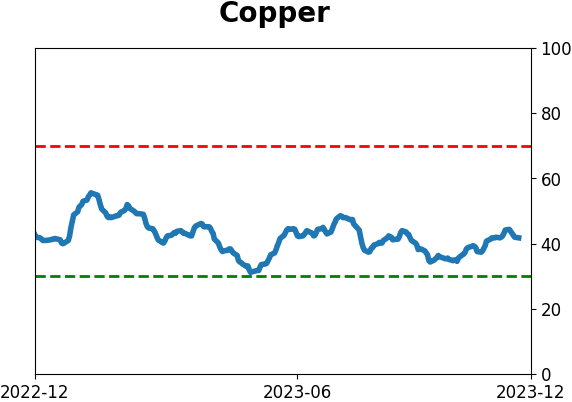
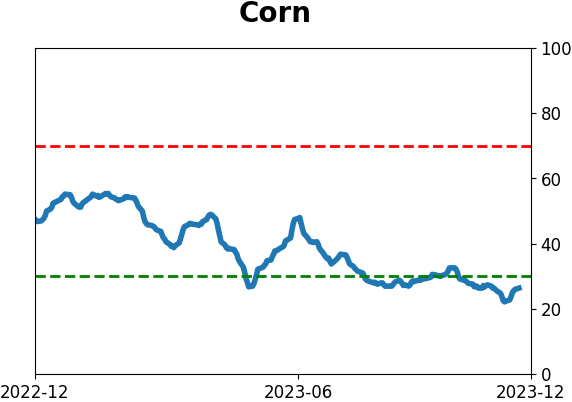
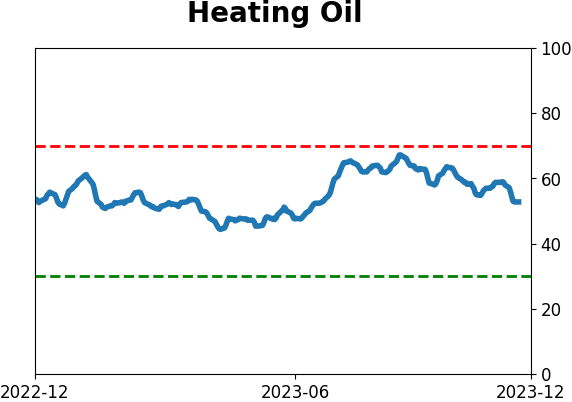
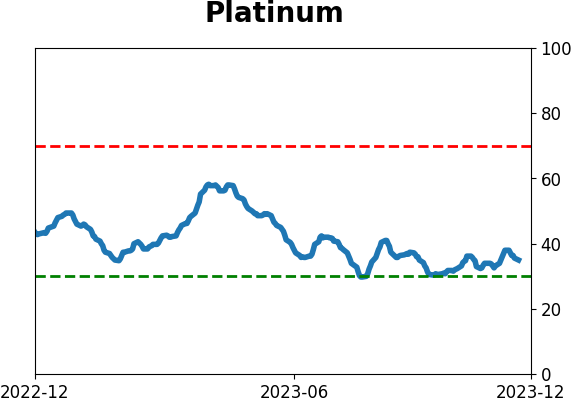
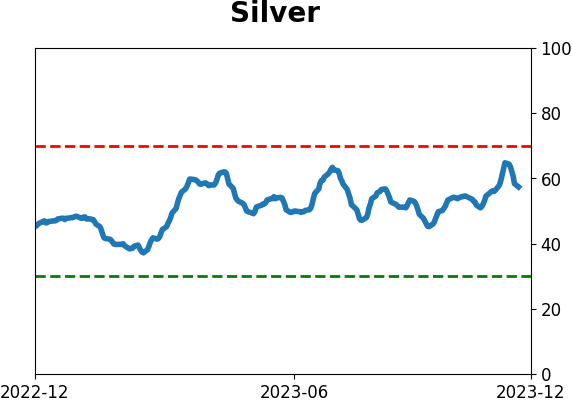
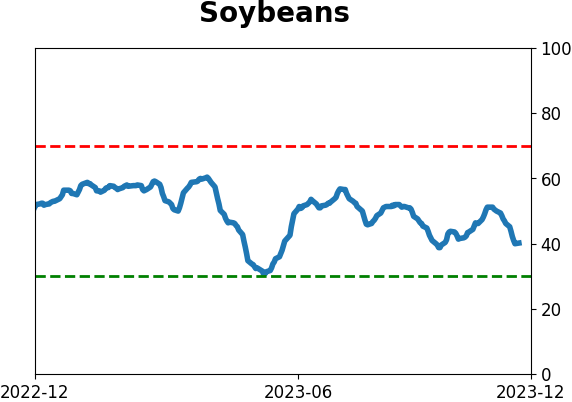
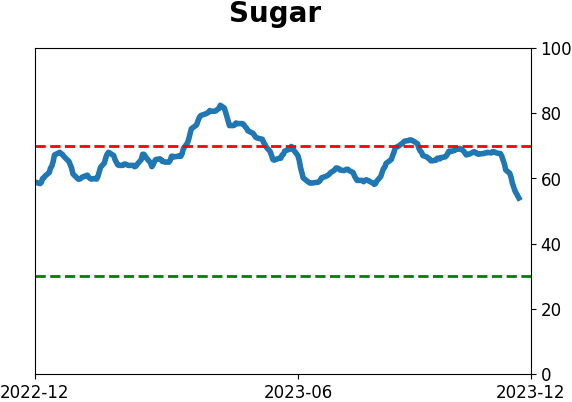
Commodity ETF's - 5-Day Moving Average
|
|