
Signs of capitulation in consumer staples are starting to pile up

Key points
- The consumer staples sector has been a bust so far in 2023
- However, numerous breadth indicators are firing off signals that have historically signaled capitulation
- Nevertheless, for investors, all of this may be less of a "buy signal" and more of a "be prepared to buy" signal
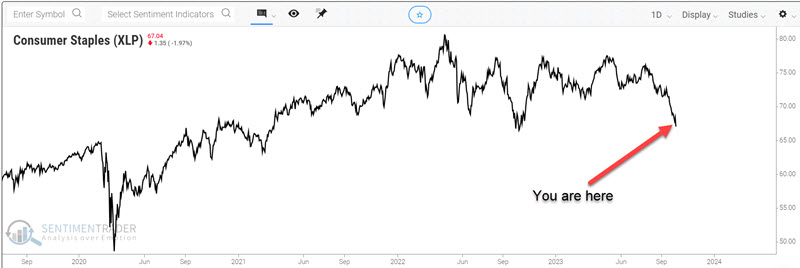
The consumer staples sector takes a dive
The Consumer Staples Select Sector SPDR Fund (ticker XLP) is the most heavily traded ETF that tracks the consumer staples sector. As you can see in the chart below, it has been an extremely poor performer in 2023, and its weakness has accelerated in recent weeks.
The potential good news is that several "similar but different" breadth indicators based on the action of this ETF and its member constituents have recently reached levels that have, in the past, often identified periods of capitulation. The bad news is that this action does not necessarily equate to an "all clear, buy with both hands" signal. Generally speaking, attempting to "pick a bottom" in anything is an exercise fraught with peril. Nevertheless, the level of oversold highlighted by the indicators below suggests that, at the very least, investors should be opening their minds to the possibility that - despite the current scary situation - the consumer staples sector may be shaping up as a buying opportunity.
The sections below will highlight recent noteworthy action in three breadth and three high/low indicators.
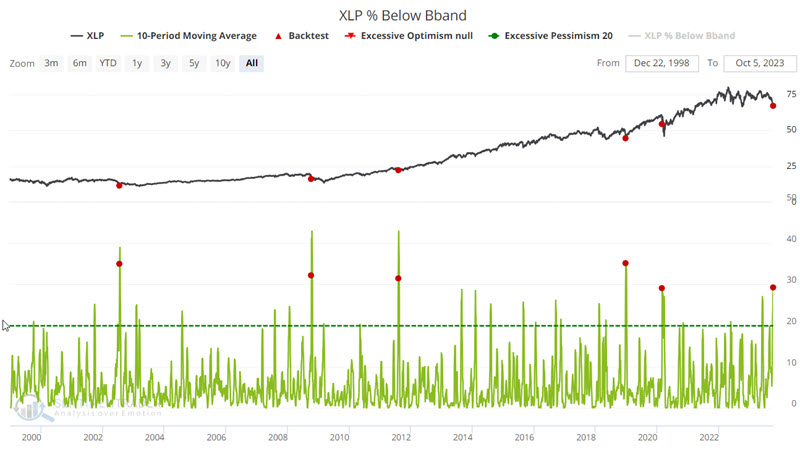
Breadth Indicator #1: XLP % Below BBand
The Consumer Staples Select Sector SPDR Fund (ticker XLP) is the most heavily traded ETF that tracks the consumer staples sector. This indicator shows the percentage of XLP constituent stocks currently trading below their lower Bollinger Band.
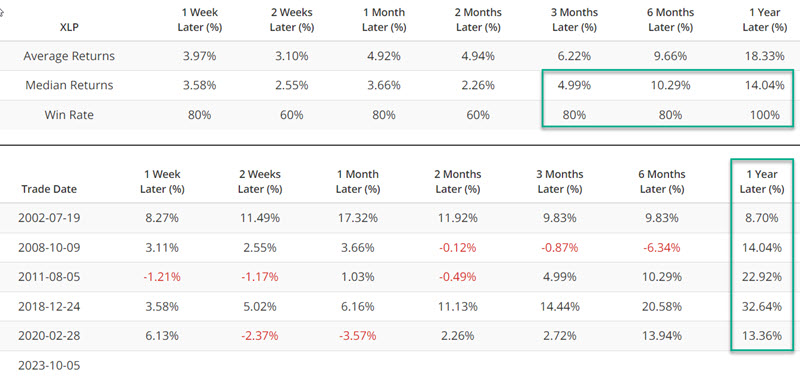
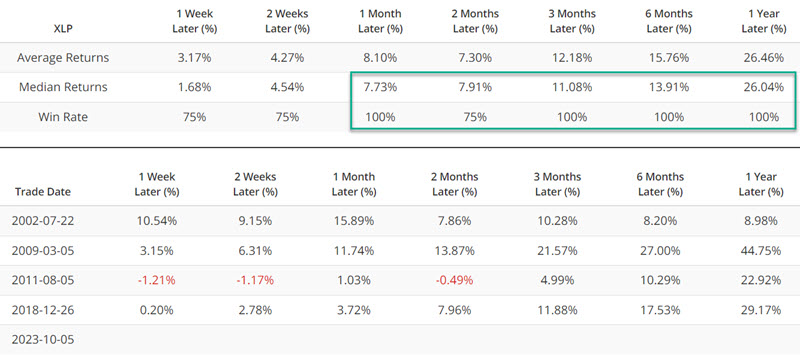
The chart below highlights those dates when the 10-day average for the XLP % Below BBand indicator crossed above 29%, and the table summarizes subsequent XLP performance. The latest signal occurred on 2023-10-05.
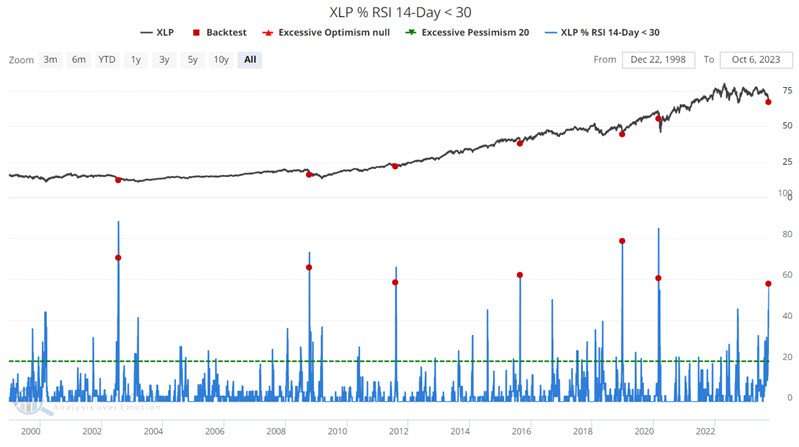
Breadth Indicator #2: XLP % RSI 14-Day < 30
This indicator shows the percentage of XLP constituent stocks showing a 14-day RSI below 30% (i.e., heavily oversold). The chart below highlights those dates when the 10-day average for the XLP % RSI 14-Day < 30 indicator crossed above 57% for the first time in three months. The table summarizes subsequent XLP performance. The latest signal occurred on 2023-10-05.
It is important to note that both the 2008 and 2020 signals were early and that the sector continued to fall hard for a period of time. Still, in each case twelve month returns showed a strong gain. This type of history is one reason why we view the current situation as a "open your mind and eyes to the possibility of a buying" opportunity and not necessarily a "buy immediately with both hands" situation. The latter approach is more of a high-risk, high reward play (i.e., an investor who jumps heavily into this sector right now may soon find themselves with a significant gain - OR a significant open loss. A plan to deal with the former possibility is needed before taking the plunge).
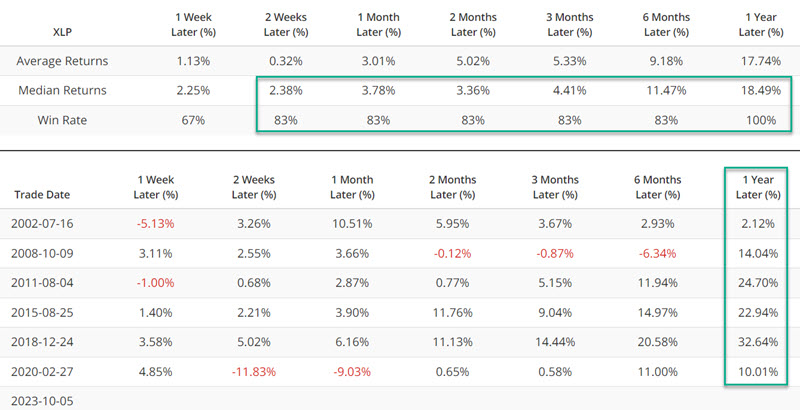
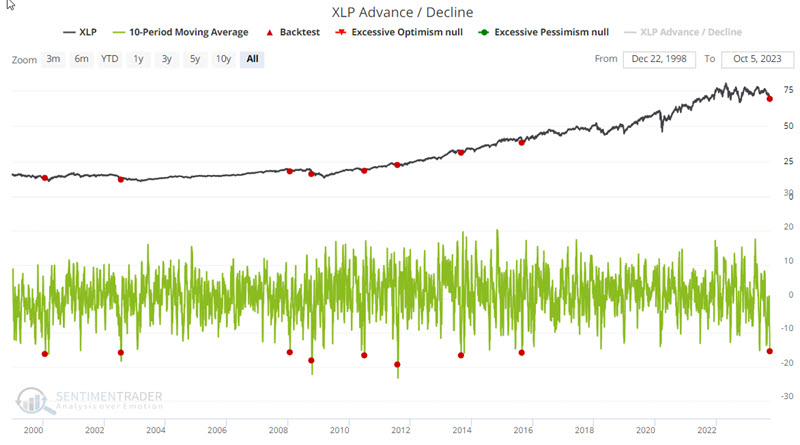
Breadth Indicator #3: XLP Advance/Decline
This indicator shows the percentage of XLP constituent stocks that advanced minus declined on the day. The chart below highlights those dates when the 10-day average for the XLP Advance/Decline indicator crossed below -15.4% for the first time in three months. The table summarizes subsequent XLP performance. The latest signal occurred on 2023-09-28.
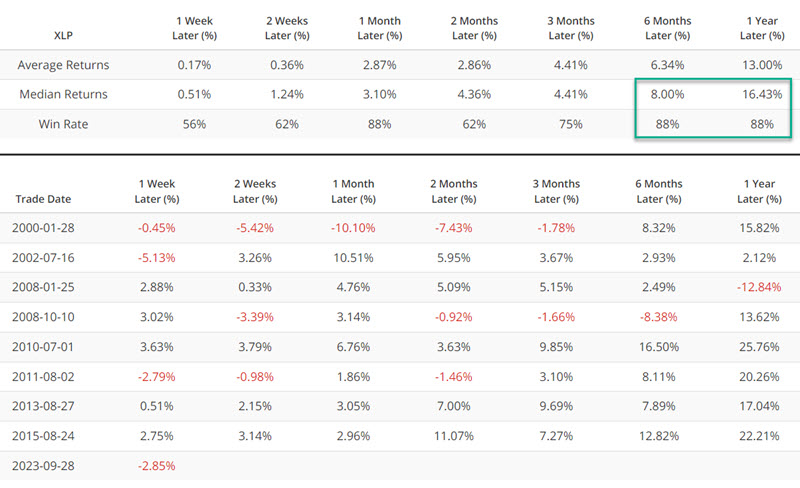
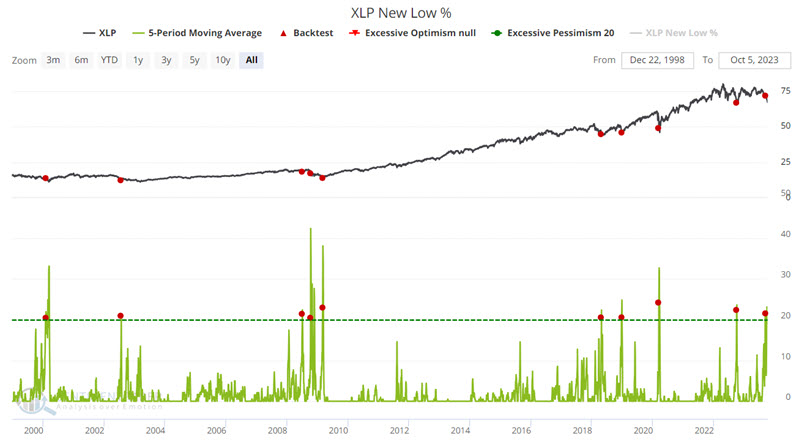
High/Low Indicator #1: XLP New Low %
This indicator shows the percentage of XLP constituent stocks trading at a 52-week low. The chart below highlights those dates when the 5-day average for the XLP New Low % indicator crossed above 20% for the first time in three months. The table summarizes subsequent XLP performance. The latest signal occurred on 2023-09-08.
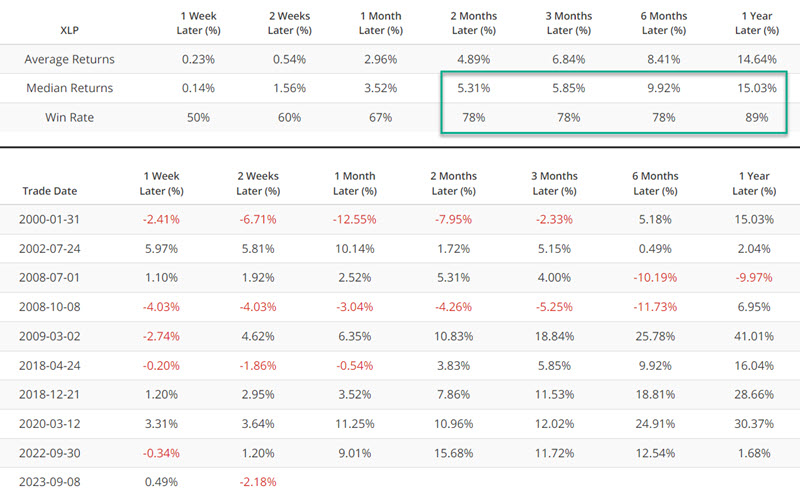
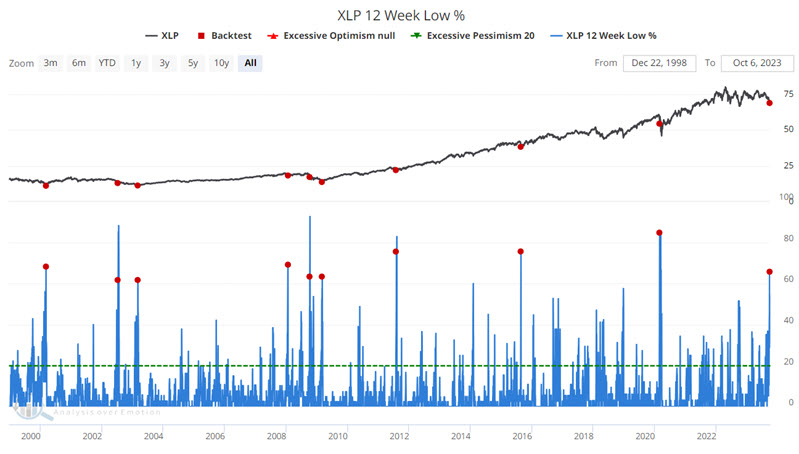
High/Low Indicator #2: XLP 12 Week Low %
This indicator shows the percentage of XLP constituent stocks trading at a 12-week low. The chart below highlights those dates when the XLP 12 Week Low % indicator crossed above 60% for the first time in three months. The table summarizes subsequent XLP performance. The latest signal occurred on 2023-09-27.
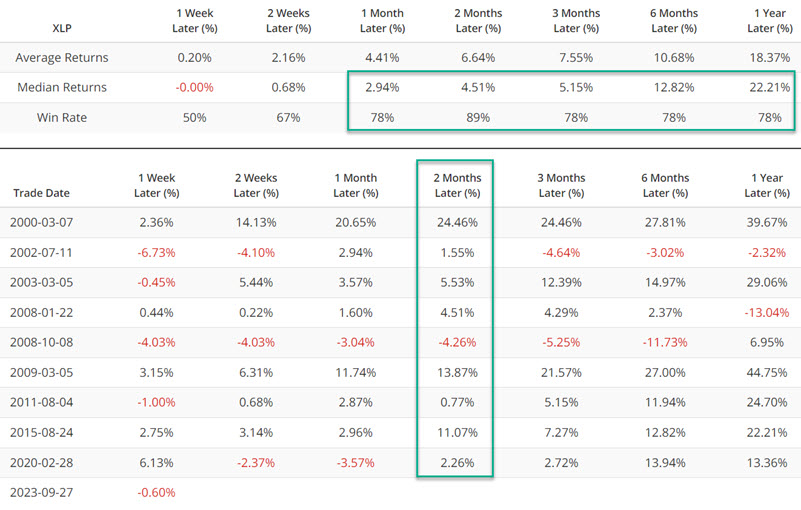
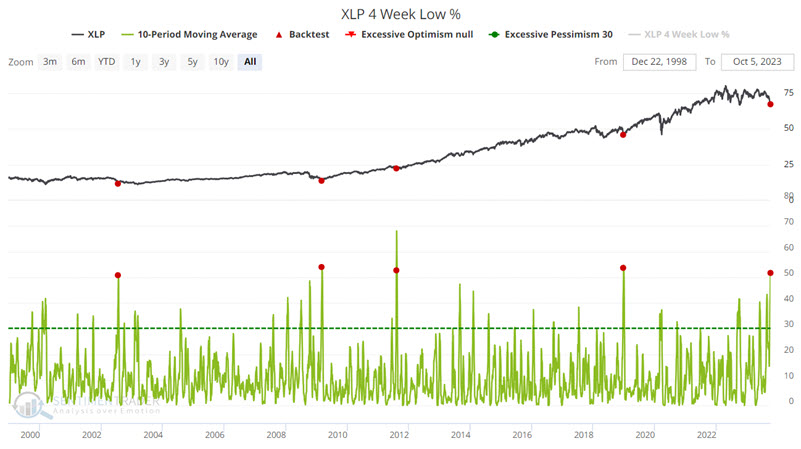
High/Low Indicator #3: XLP 4 Week Low %
This indicator shows the percentage of XLP constituent stocks trading at a 12-week low. The chart below highlights those dates when the 10-day average for the XLP 4 Week Low % indicator crossed above 50% for the first time in three months. The table summarizes subsequent XLP performance. The latest signal occurred on 2023-10-05.
Bonus Indicator: Seasonality
As always, seasonality is not a roadmap of what will happen. It is merely an average of what has happened in the past. The chart below displays the annual seasonal trend for ticker XLP.
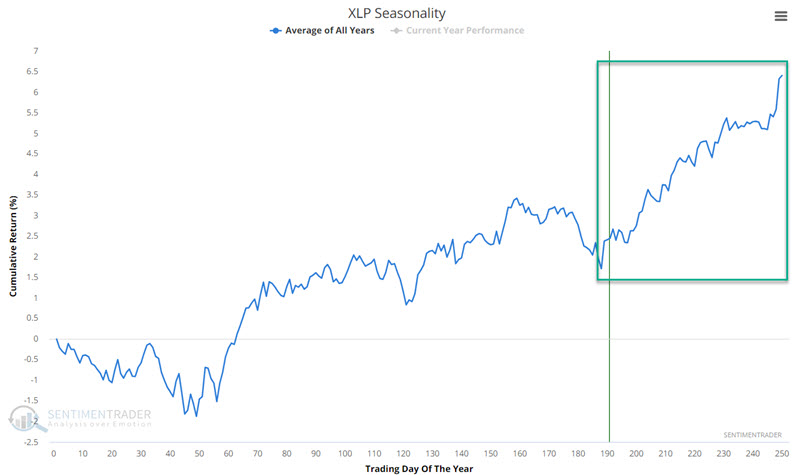
The period highlighted in the green box runs from Trading Day of the Year (TDY) #188 through the end of the year. The chart below displays the growth of $1 invested in the S&P 500 Consumer Sector Staples index (which is the index that ticker XLP is designed to track) only from the close of TDY #188 through the end of the year each year since 1953.
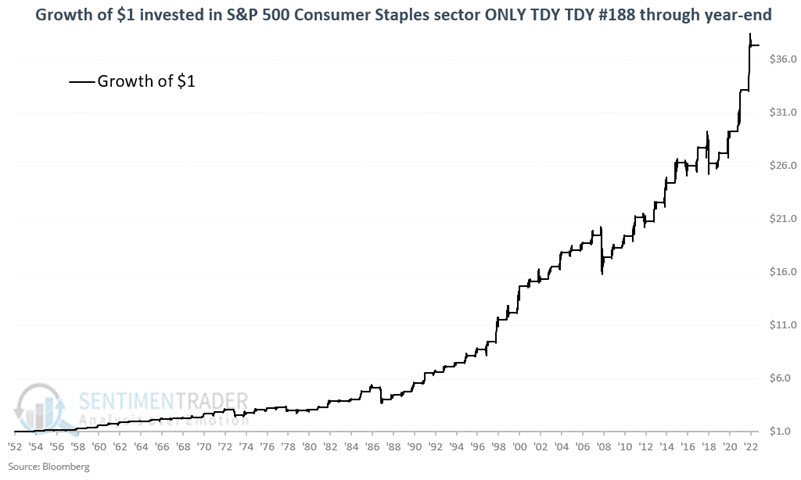
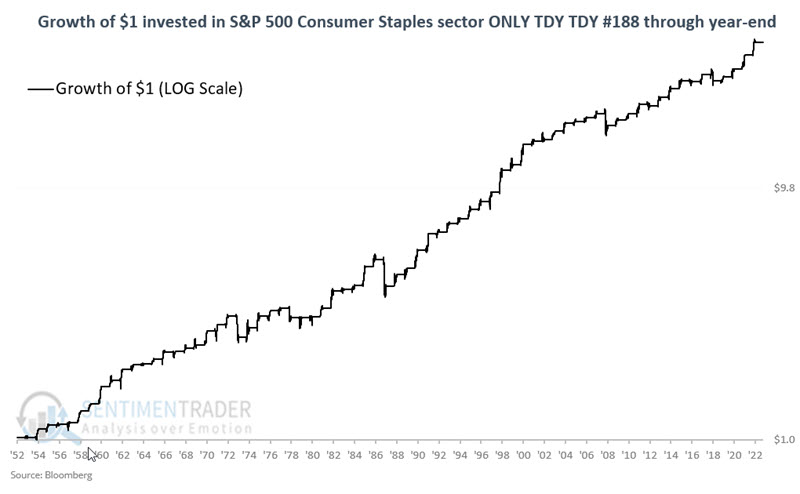
The chart below displays the same results on a logarithmic scale.
The table below summarizes performance.
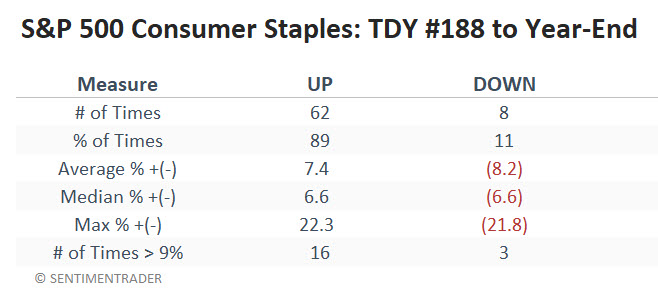 If consumer staples are going to turn around, the annual seasonal trend suggests that now is an excellent time to look for such a reversal. Though repeating, there are no guarantees with seasonality, which merely tells you "when to look where."
What the research tells us…
No matter how many indicators give similar oversold signals simultaneously, a sustainable reversal and rally is never guaranteed - particularly in the short-term. There is always danger involved in attempting to "catch a falling knife." That said, consumer staples are clearly at a significantly oversold level, which - with the notable exception of 2008 - has typically been followed by higher prices within the sector. Aggressive traders may immediately consider the information above and consider playing the long side of the consumer staples sector in hopes of a fast rebound. Longer-term investors may be wise to wait for signs of an actual reversal or new uptrend to unfold before committing capital. Regardless, each trader and investor is never relieved of their responsibility to allocate capital intelligently and to formulate a risk management strategy just in case it is 2008 all over again.