Headlines
|
|
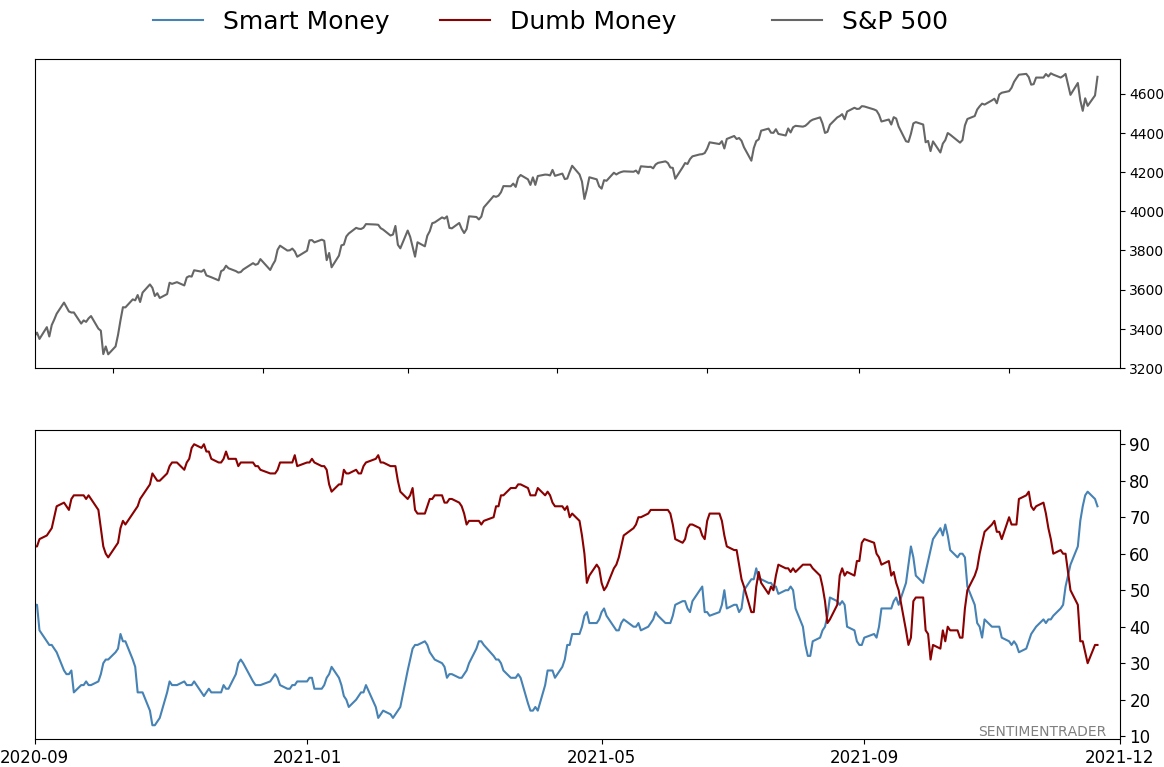
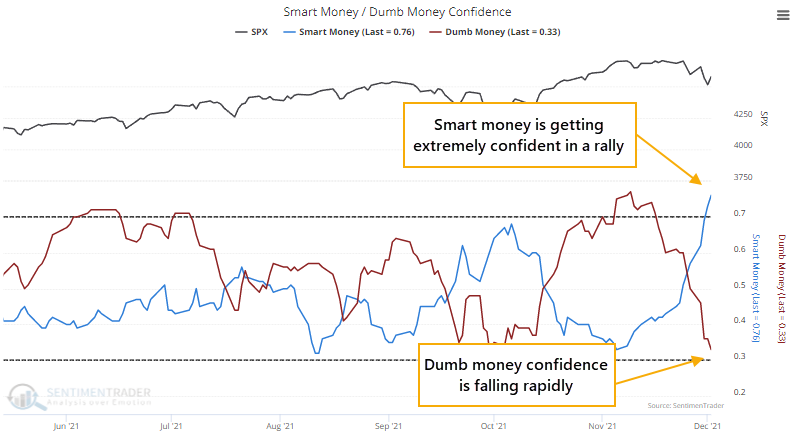
The spread between Smart and Dumb Money is the widest since the pandemic:
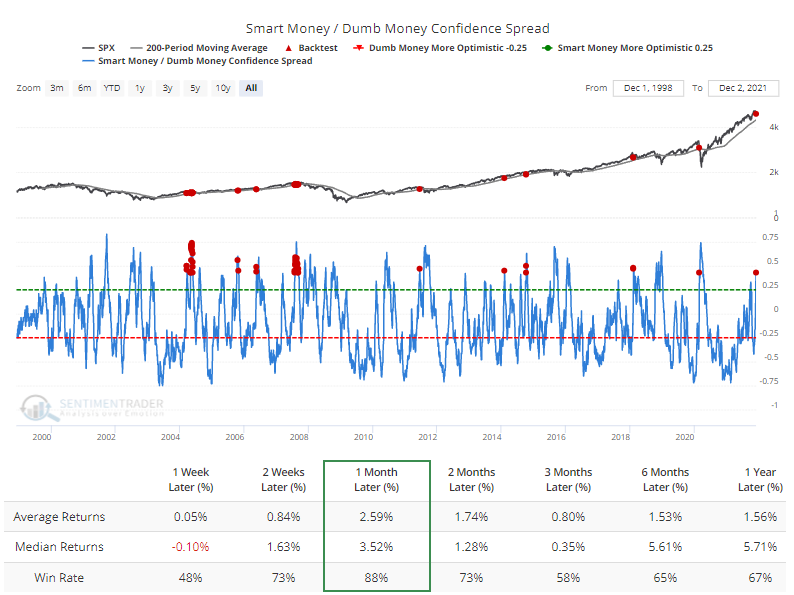
The spread between Smart Money and Dumb Money Confidence has widened to its most positive reading since April 2020. Such wide spreads tend to lead to positive returns, especially in uptrending markets.
Bottom Line:
STOCKS: Hold By early October, sentiment had reset. Several important momentum streaks ended, which has brought in buyers in the past, and seasonality turned positive. We're now seeing signs that sentiment has quickly shifted, especially among options traders. It's gotten to an extreme that has preceded weaker-than-average returns.
BONDS: Hold In late October, sentiment on bonds - from Treasuries to corporates - entered pessimistic territory. It's now starting to recover, with some quick moves in corporate bonds. We'll see if those bonds, in particular, can hold recent gains.
GOLD: Hold
Gold and miners were rejected after trying to recover above their 200-day averages in May. Some oversold extremes in breadth measures among miners triggered in late September, and they've recovered a bit since then. The group still has some proving to do.
|
Smart / Dumb Money Confidence
|
Smart Money Confidence: 73%
Dumb Money Confidence: 35%
|
|
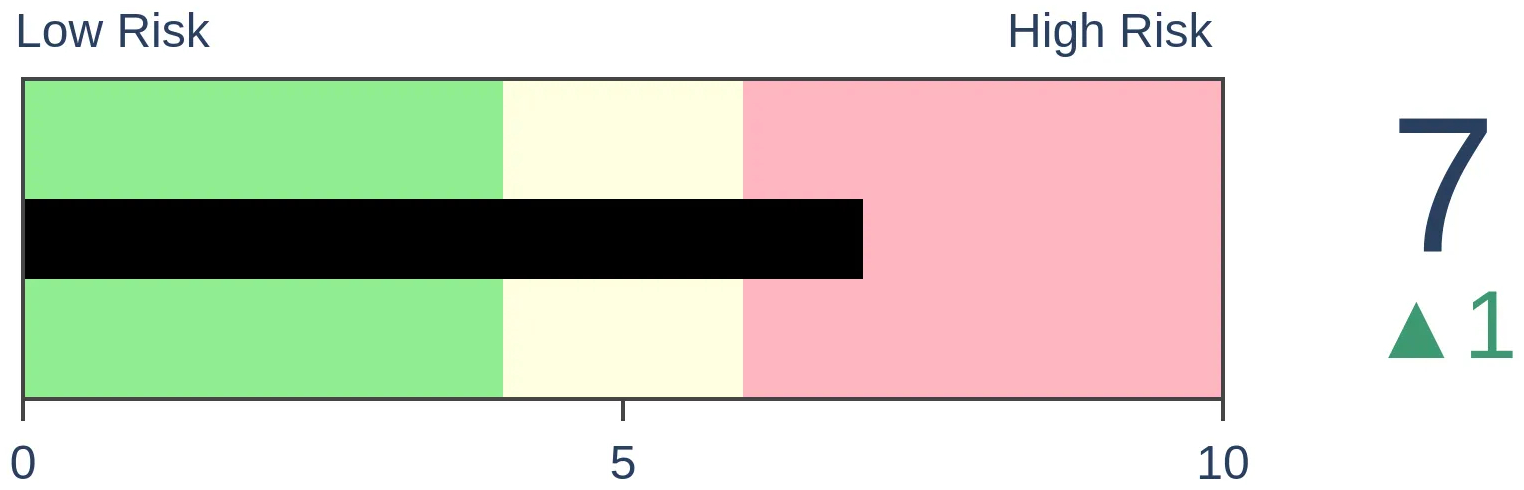
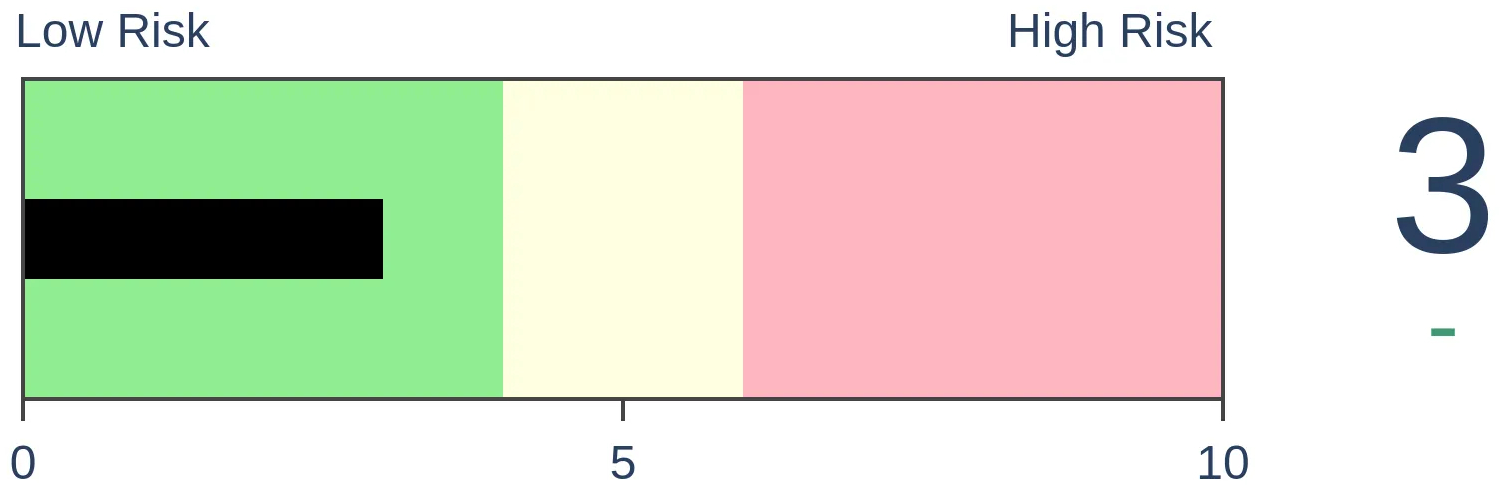
Risk Levels
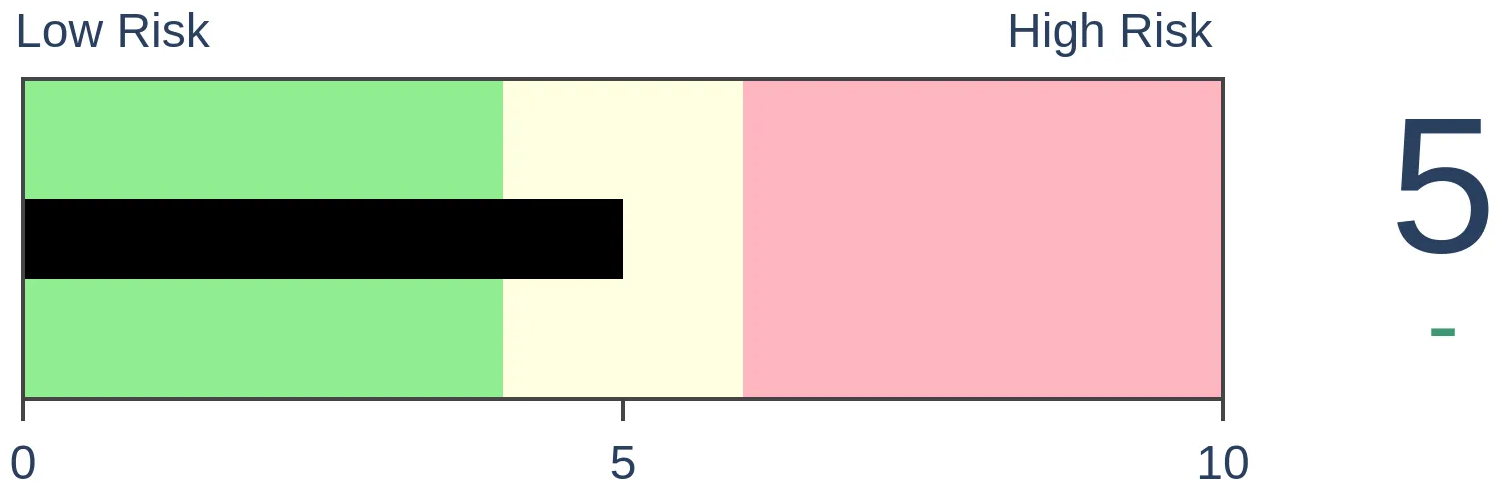
Stocks Short-Term
|
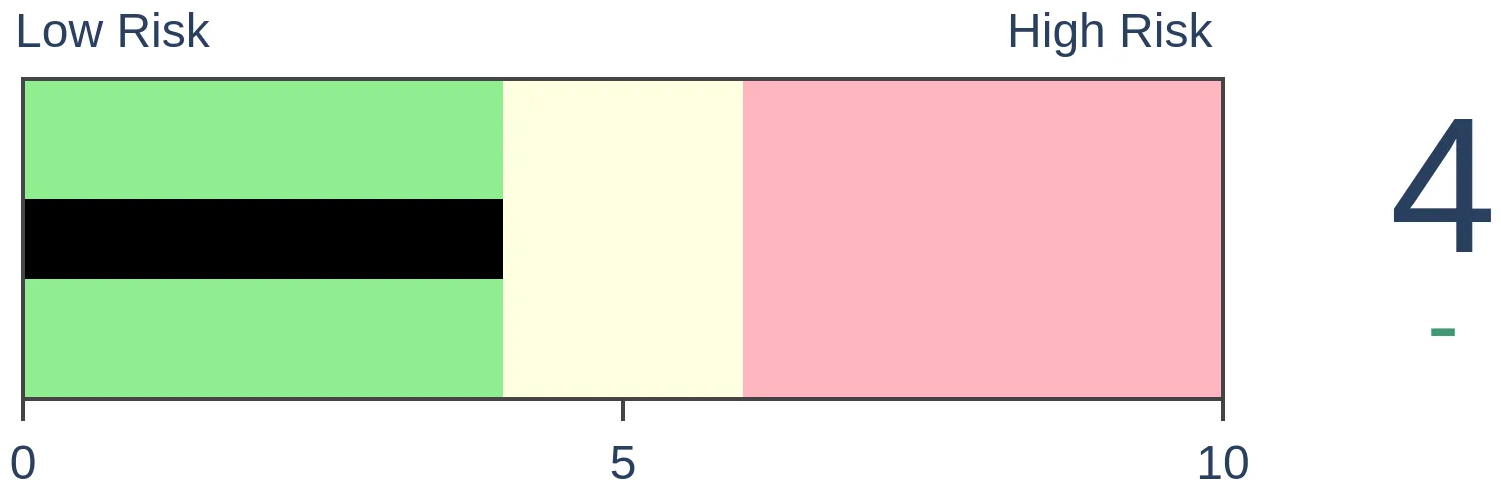
Stocks Medium-Term
|
|
Bonds
|
Crude Oil

|
|
Gold

|
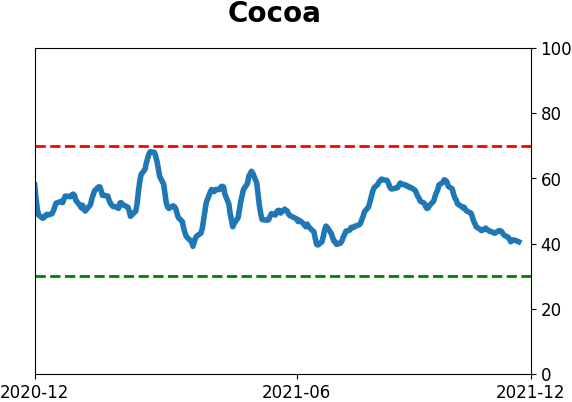
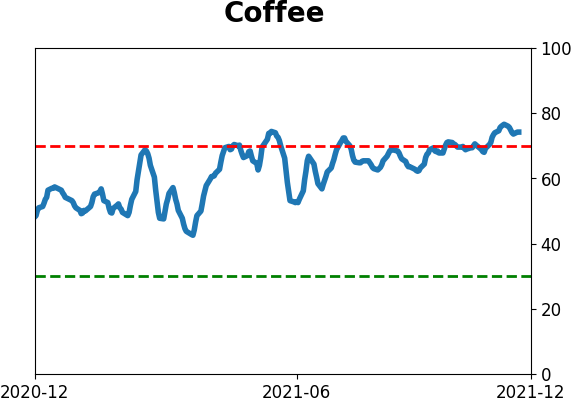
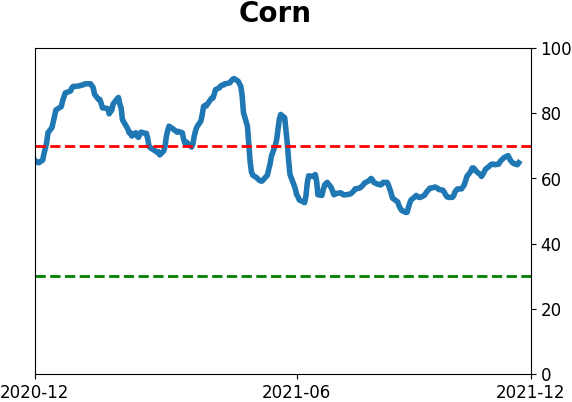
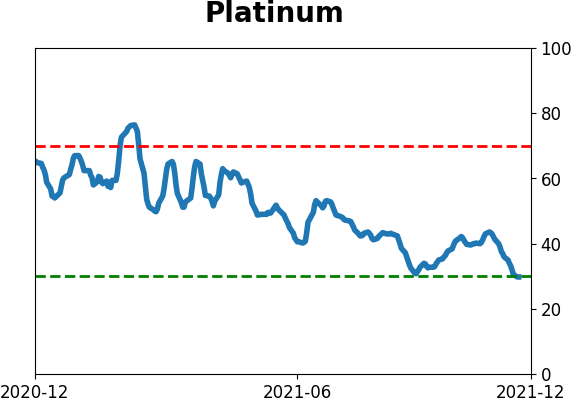
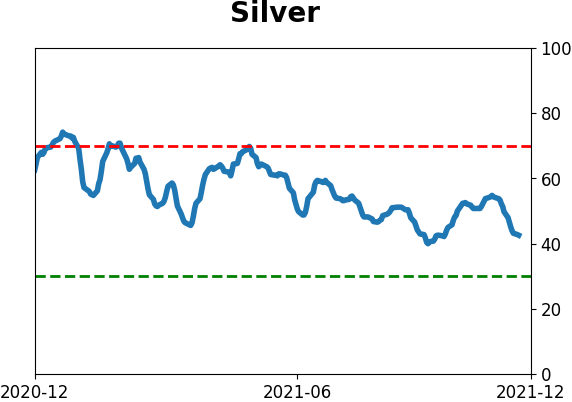
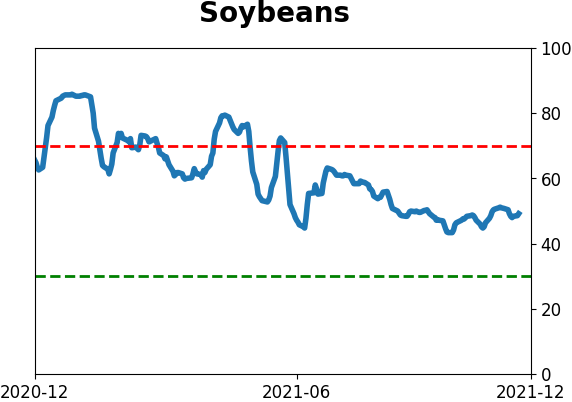
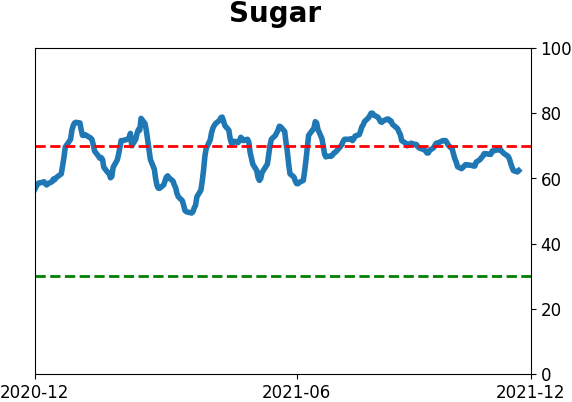
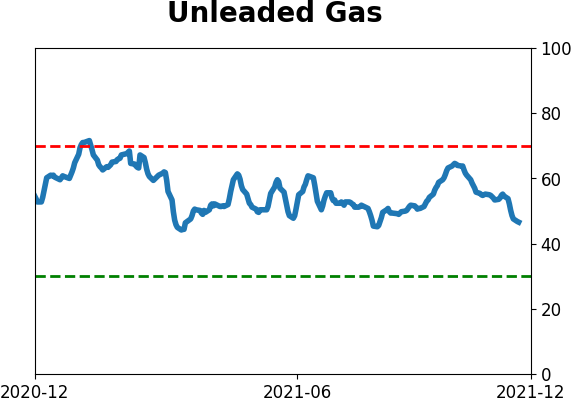
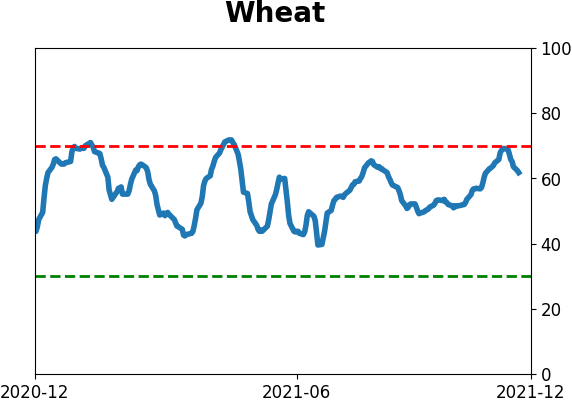
Agriculture
|
|
Research
By Jason Goepfert
BOTTOM LINE
The spread between Smart Money and Dumb Money Confidence has widened to its most positive reading since April 2020. Such wide spreads tend to lead to positive returns, especially in uptrending markets.
FORECAST / TIMEFRAME
SPY -- Up, Long-Term
|
Key points:
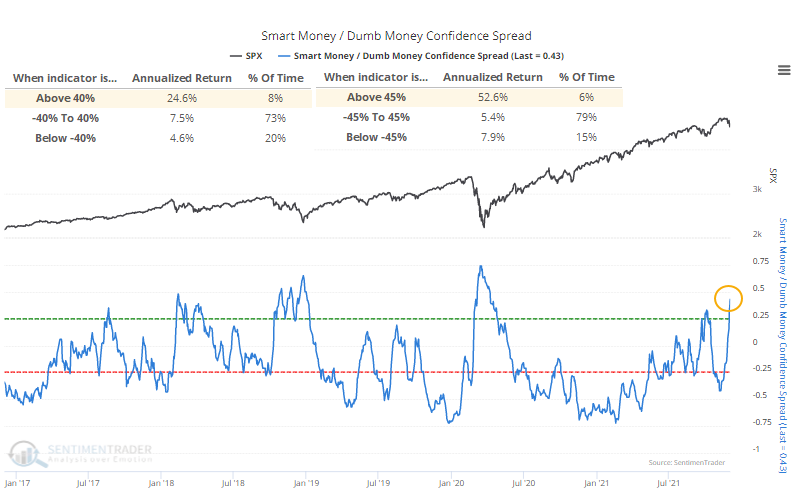
- The spread between Smart and Dumb Money Confidence has widened to an extreme
- The annualized return with such a wide spread is 10x a neutral-sentiment return
- Longer-term returns also tend to be positive...unless we're on the cusp of a new bear market
A big adjustment in sentiment
The past couple of weeks has triggered a drastic shift in sentiment. The confidence in a rally among Smart Money indicators has jumped. It would be even more extreme if there wasn't a curiously large plunge in "smart money" commercial hedger positions in equity index futures.
From the Knowledge Base:
Smart Money Confidence is a model that aggregates indicators reflecting sentiment among investors that tend to use the stock market to hedge underlying positions. Or, they're just contrarian investors who prefer to sell into a rising market and buy into a declining one.
For those reasons, you'll usually see Smart Money Confidence rise as stocks drop. They are the proverbial "knife-catchers" and it seems like they're always losing because it appears as though they're constantly fighting the trend. Which, in a way, they are.
As stocks rise, you'll usually see Smart Money decline. The more stocks rise, the less confidence these investors have that stocks will keep rising. They get the moniker "smart money" because these investors tend to have their largest long exposure near market bottoms, and their least exposure near peaks.
At the same time, Dumb Money confidence has plunged. Again, from the Knowledge Base:
The term "dumb" itself needs to be clarified. A more accurate description would simply be "trend-following." Most trend-followers are not dumb - they're positioned correctly during the meats of most major trends. That sounds pretty smart.
Where this term gets its meaning is that because trend-followers use different methodologies, some waiting until trends are well-established, by the time most trend-followers hop on a trend, and most aggressively, is about the time the trend is becoming exhausted. So, these traders tend to be the most net long near peaks and least net long (or most net short) near bottoms. Because most investors follow trends to some degree, these indicators tend to capture the behavior of most of the money flowing into and out of markets.
We can see the stark change in attitude below. Despite the weird increase in a net short position in index futures, Smart Money Confidence jumped to 77%, the highest since late April 2020. Dumb Money Confidence plunged to 30%, the lowest since early April 2020.
This adjustment in behavior has caused the spread between them to rise above 45%. The S&P 500's annualized return when the spread is above 45% was +52.6%, nearly 10x the return when sentiment was neutral.
Big positive spreads led to positive returns
The Backtest Engine shows that a reading this high when the S&P 500 is trading above its 200-day average preceded a rally over the next month after 42 out of 48 days. The pandemic crash was a big exception. When sentiment extremes fail, they tend to fail hard.
This also ended the 3rd-longest streak with a spread below 40% since 1998.
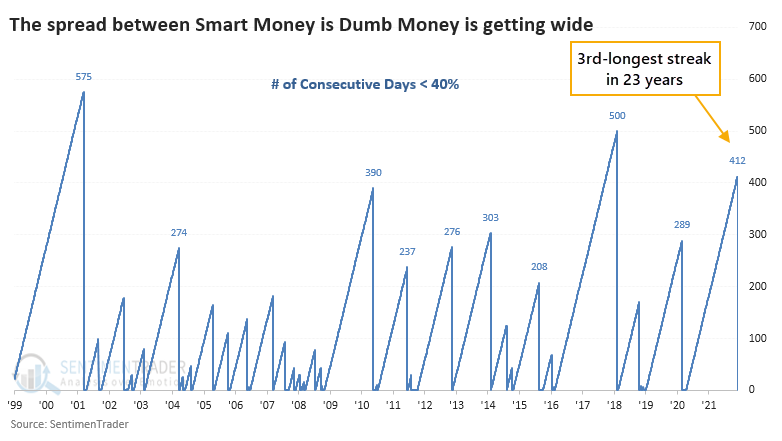
The ends of other long streaks preceded mostly good returns with that same big exception during the pandemic. Even including that extremely painful drawdown, at least it didn't last long, and by 3 months later, the S&P only showed one loss greater than -2%.
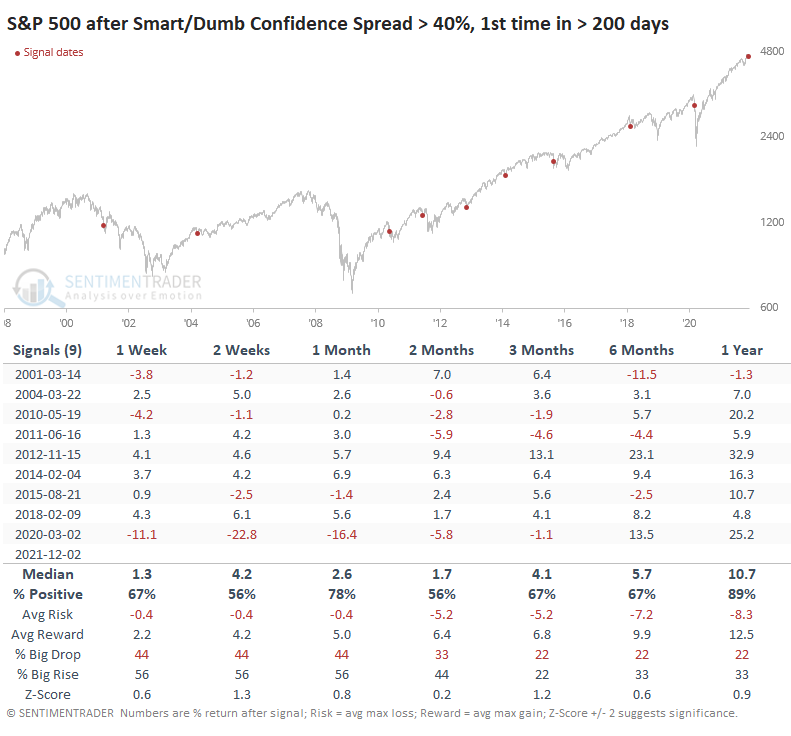
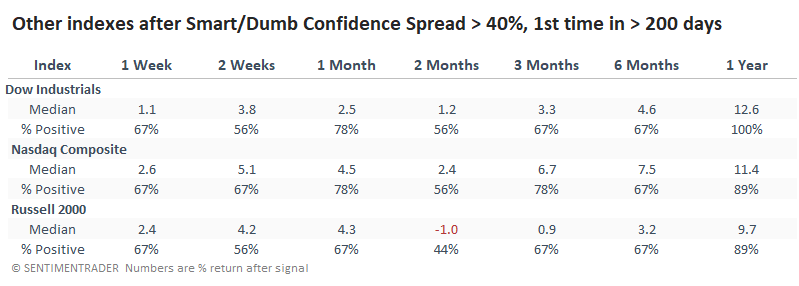
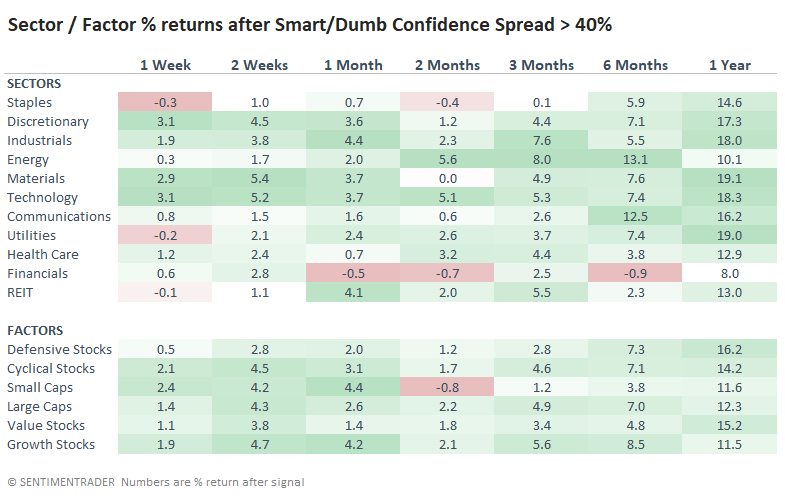
Looking at the other major indexes following these signals, returns favored the Dow. It showed a positive return after every signal a year later, though medium-term returns were only mediocre. The Russell 2000 was hit particularly hard over the next couple of months before (mostly) recovering.
It's not surprising, then, that defensive sectors were among the bigger beneficiaries after these wide spreads in sentiment.
What the research tells us...
On Monday, we saw that the market environment for the S&P 500 is still healthy. Signs of pessimism in healthy trends tend to be low-risk / high-reward setups for buyers. The issue is that the environment in the broader market is not nearly as healthy, and "pessimism" needs to be in quotes because sentiment is pessimistic only relative to the past 18 months, not anything longer than that. We've been in la-la land for a year-and-a-half.
Objectively, our core indicators have started to show modest extremes, and even in unhealthy markets, those have shown decent positive returns in the weeks ahead.
Active Studies
| Time Frame | Bullish | Bearish | | Short-Term | 2 | 3 | | Medium-Term | 11 | 1 | | Long-Term | 14 | 7 |
|
Indicators at Extremes
Portfolio
| Position | Description | Weight % | Added / Reduced | Date | | Stocks | RSP | 10.7 | Added 6.4% | 2021-10-01 | | Bonds | 32.7% BND, 7.1% SCHP | 39.8 | Added 8.3% | 2021-10-26 | | Commodities | GCC | 2.4 | Reduced 2.1%
| 2020-09-04 | | Precious Metals | GDX | 4.6 | Reduced 4.2% | 2021-05-19 | | Special Situations | 9.8% KWEB, 4.7% XLE, 2.9% PSCE | 17.3 | Added 9.78% | 2021-10-01 | | Cash | | 24.1 | | |
|
Updates (Changes made today are underlined)
Much of our momentum and trend work has remained positive for several months, with some scattered exceptions. Almost all sentiment-related work has shown a poor risk/reward ratio for stocks, especially as speculation drove to record highs in exuberance in February. Much of that has worn off, and most of our models are back toward neutral levels. There isn't much to be excited about here. The same goes for bonds and even gold. Gold has been performing well lately and is back above long-term trend lines. The issue is that it has a poor record of holding onto gains when attempting a long-term trend change like this, so we'll take a wait-and-see approach. Momentum has ebbed quickly in recent weeks, and nearing oversold levels in some indicators. This can be a dangerous area, with a lot of short-term volatility, but we'd be more inclined to add medium- to long-term exposure rather than sell on much more of a decline, thanks to already rock-bottom exposure. Other areas look more attractive, including some overseas markets. RETURN YTD: 9.5% 2020: 8.1%, 2019: 12.6%, 2018: 0.6%, 2017: 3.8%, 2016: 17.1%, 2015: 9.2%, 2014: 14.5%, 2013: 2.2%, 2012: 10.8%, 2011: 16.5%, 2010: 15.3%, 2009: 23.9%, 2008: 16.2%, 2007: 7.8%
|
|
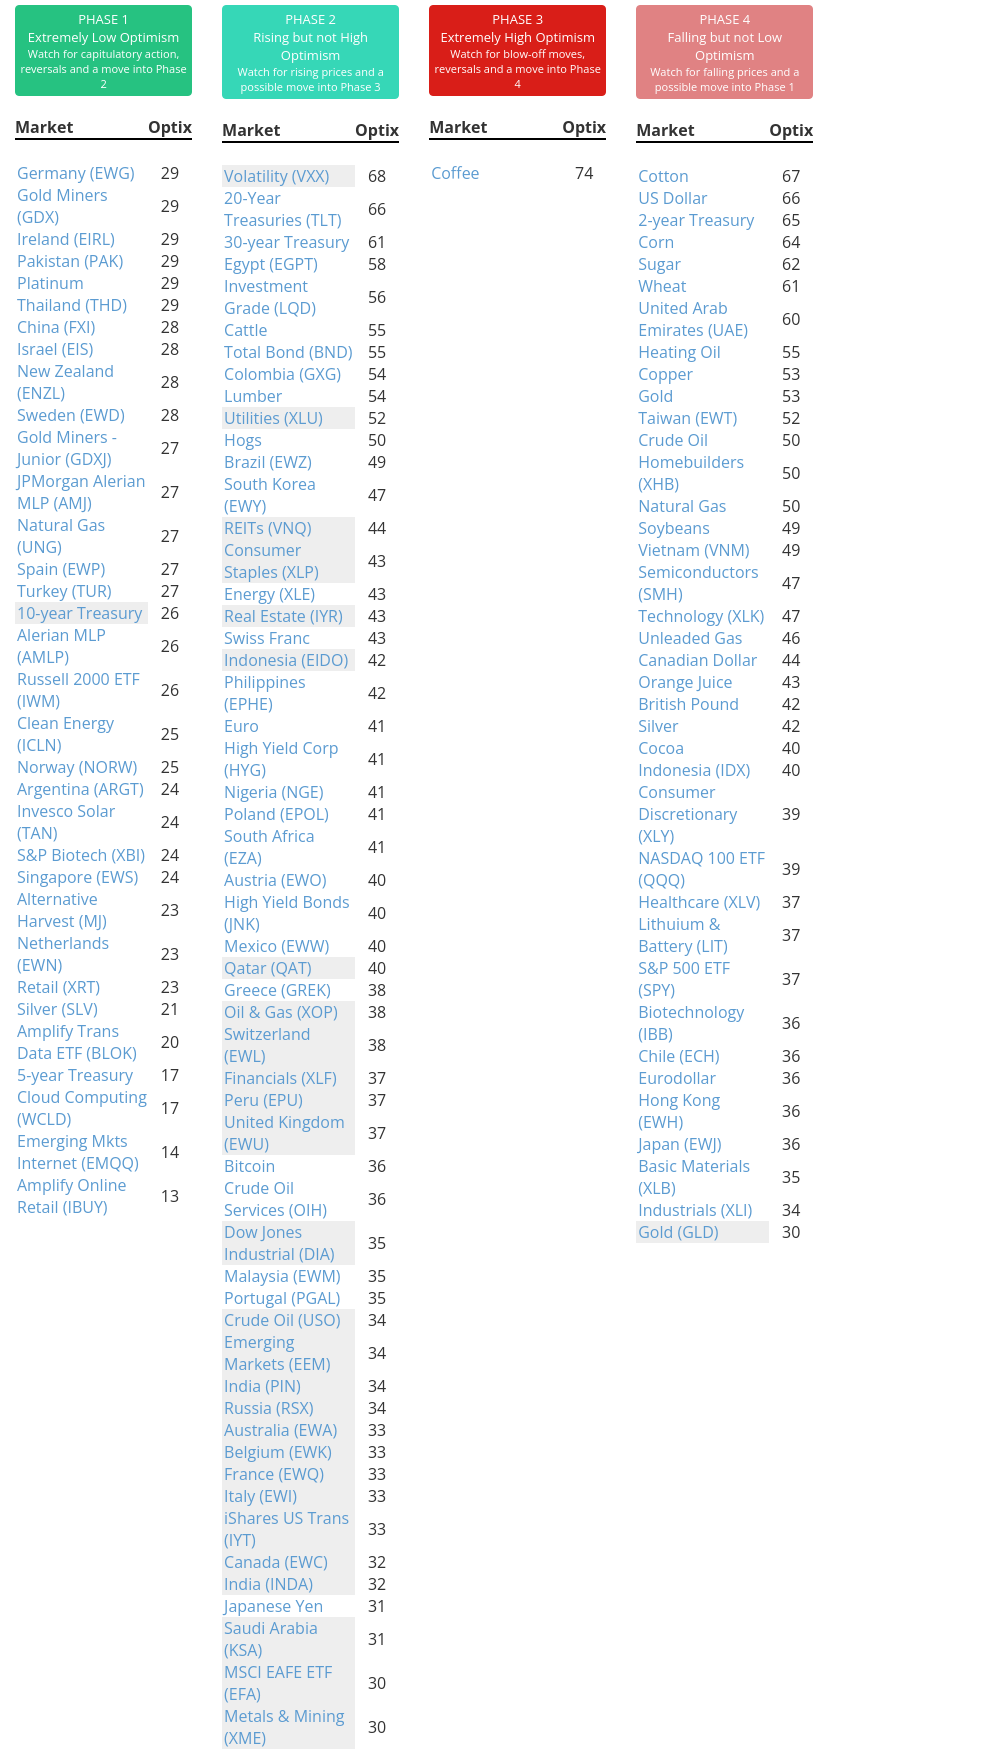
Phase Table
Ranks
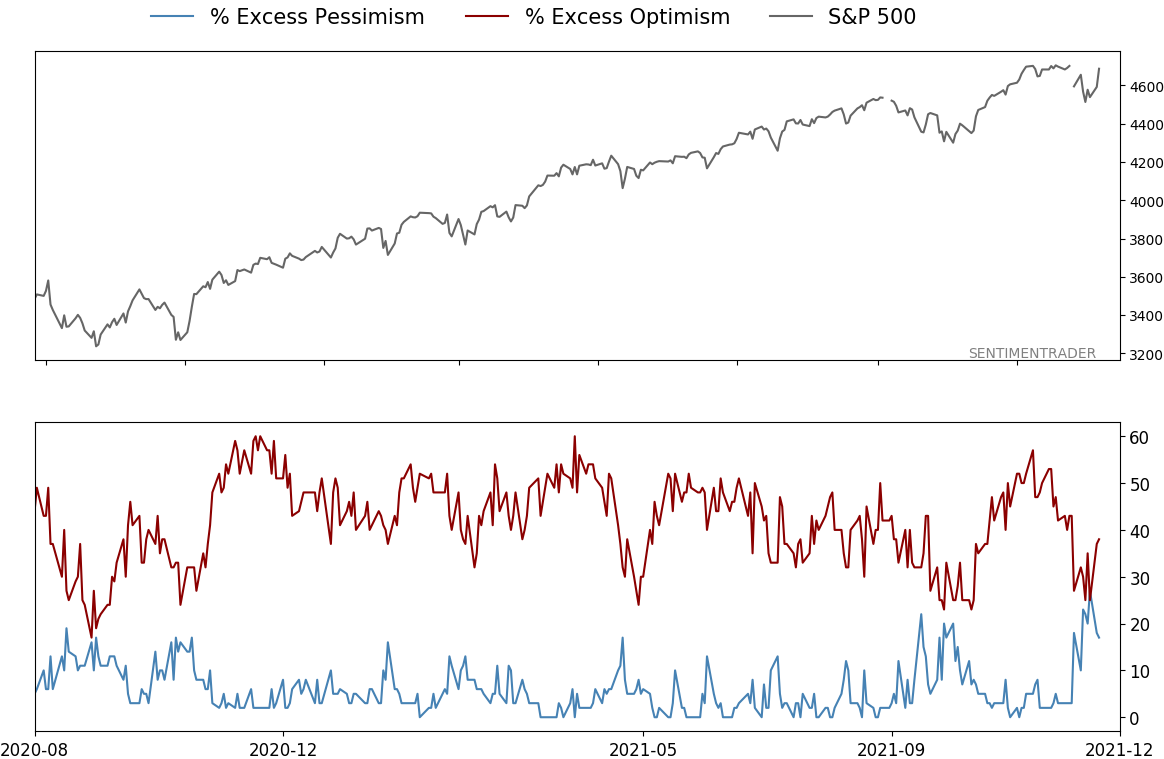
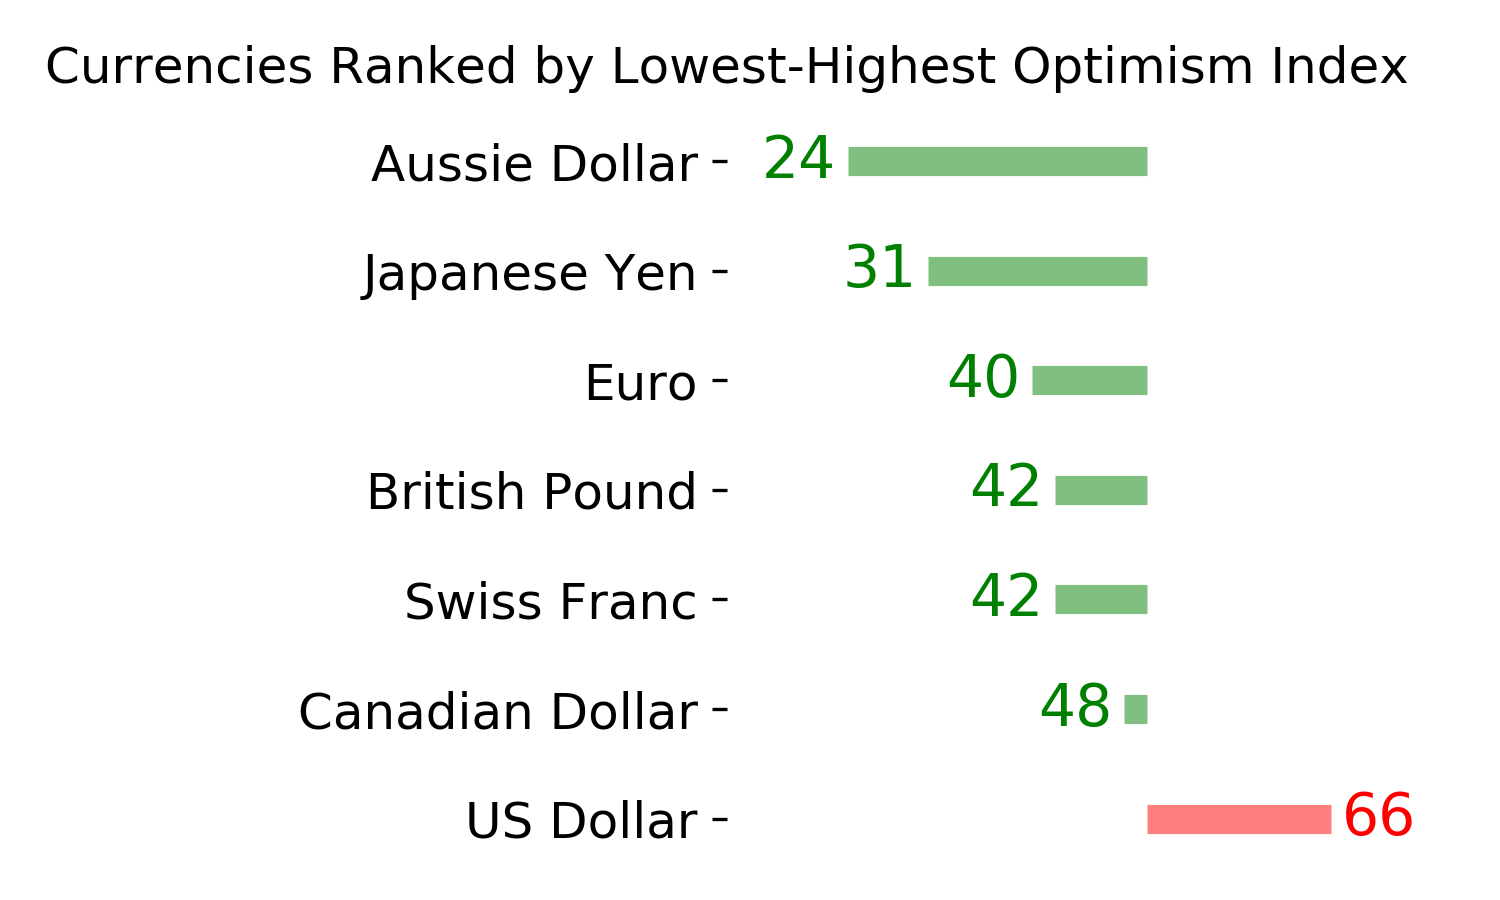
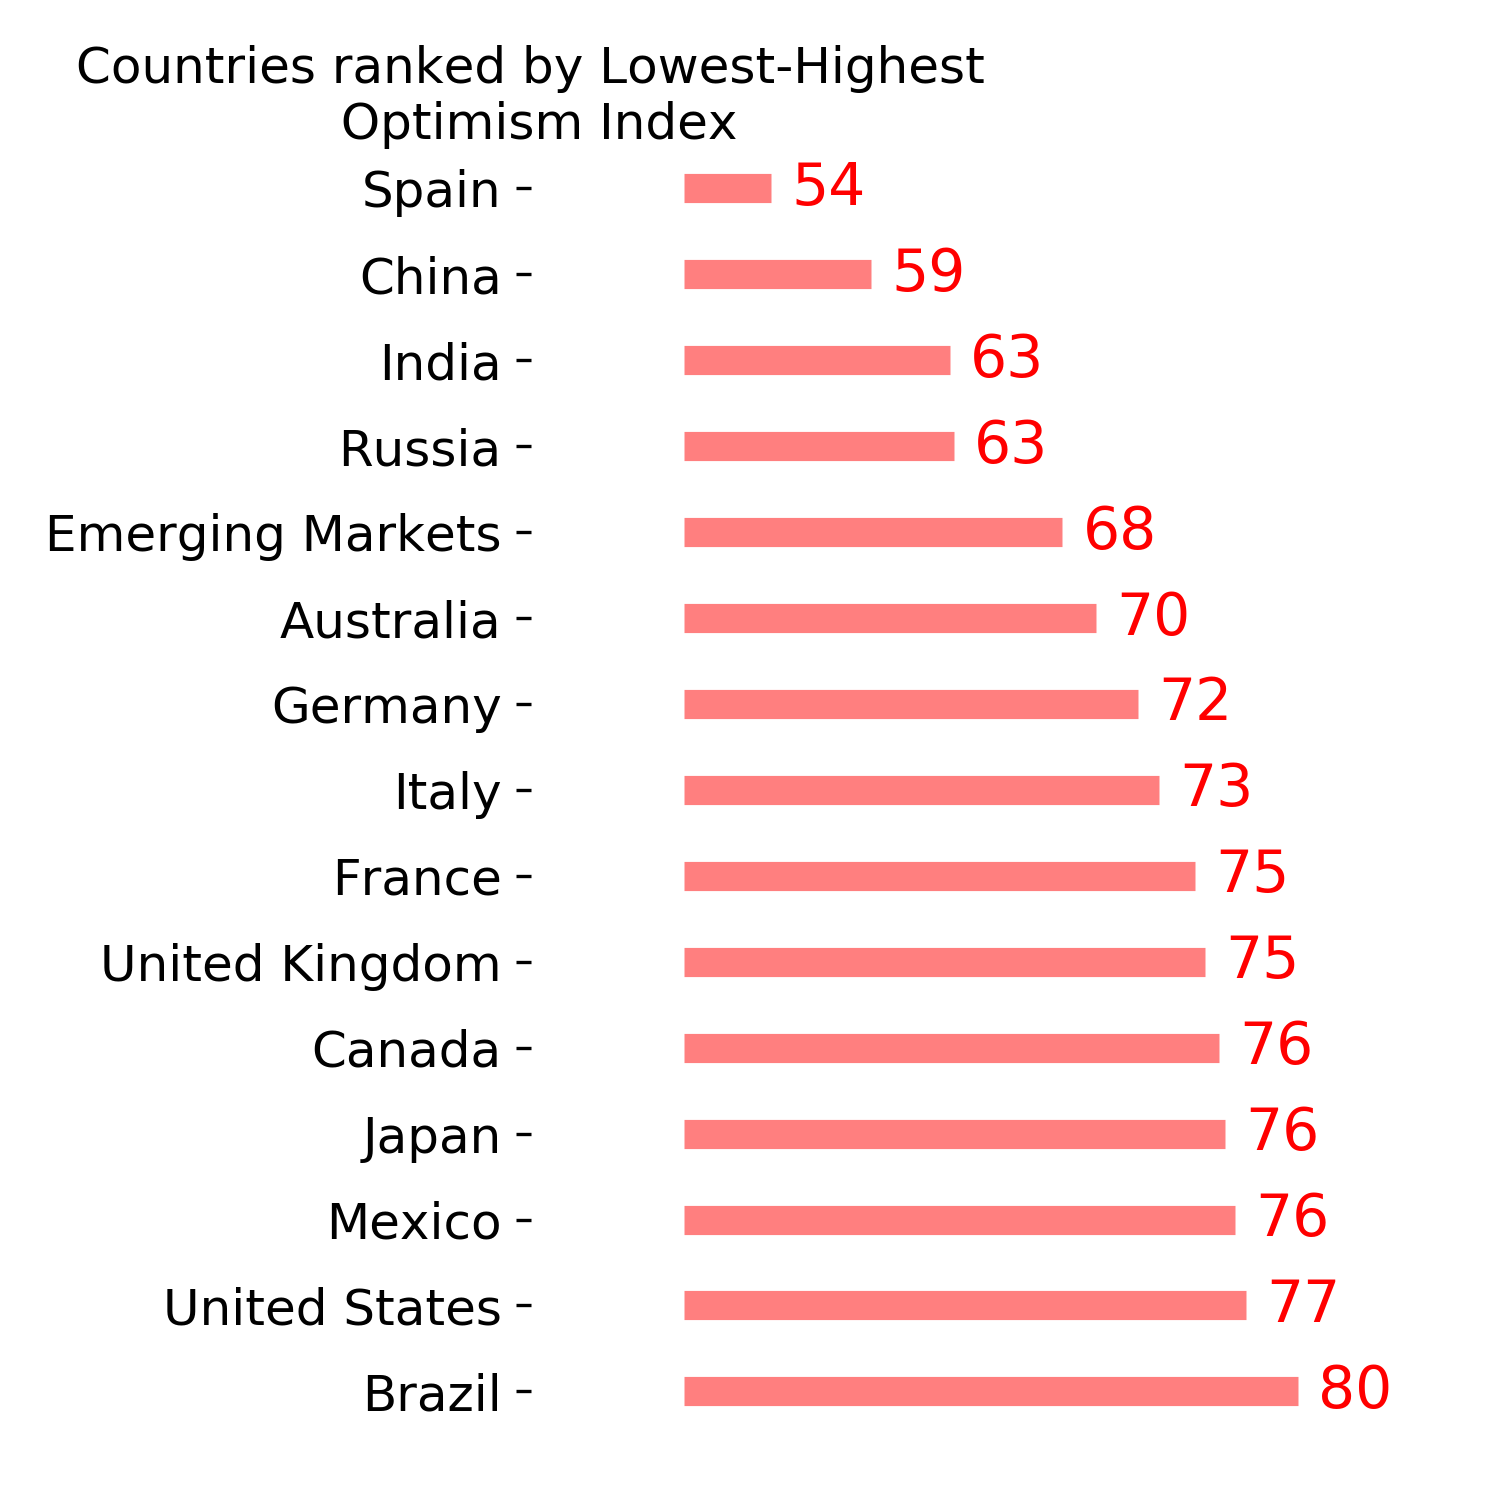
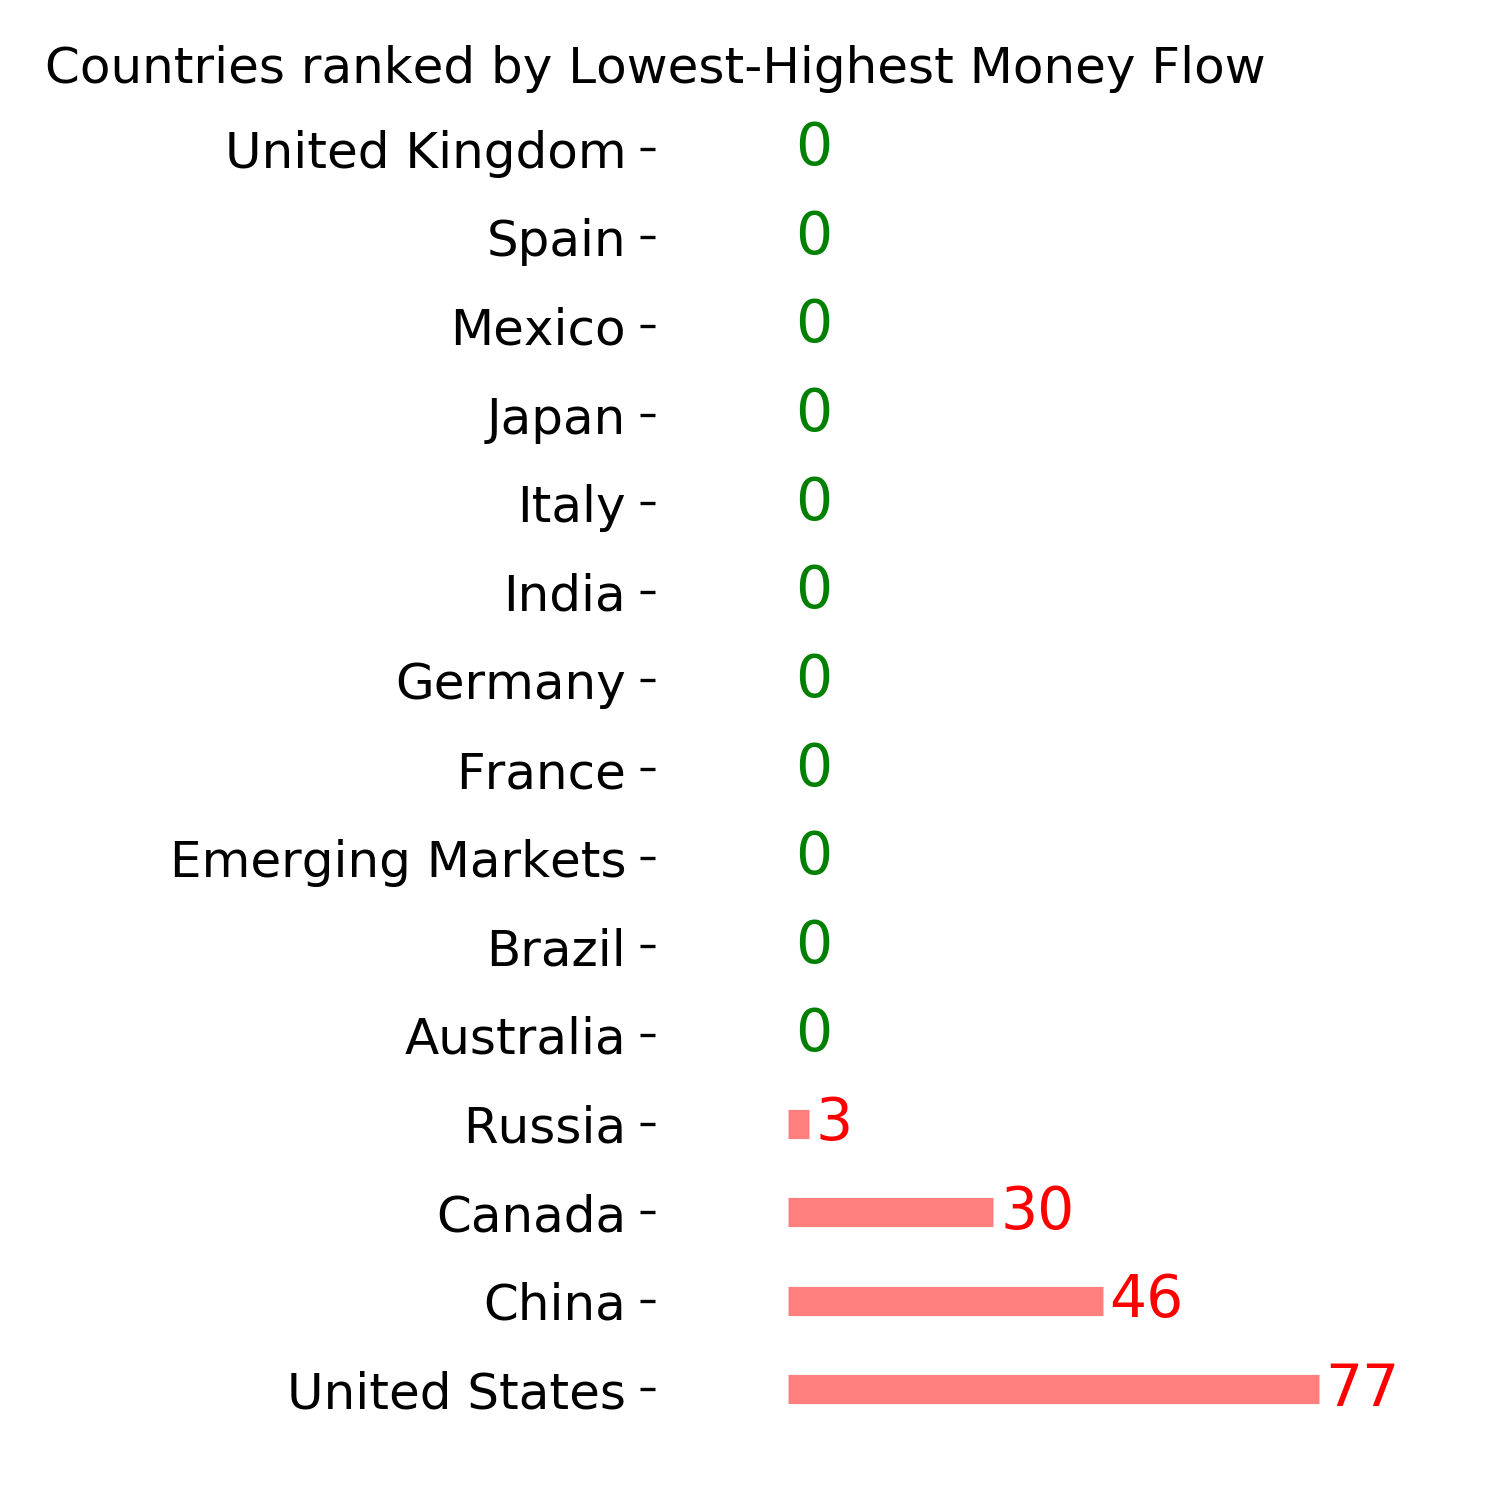
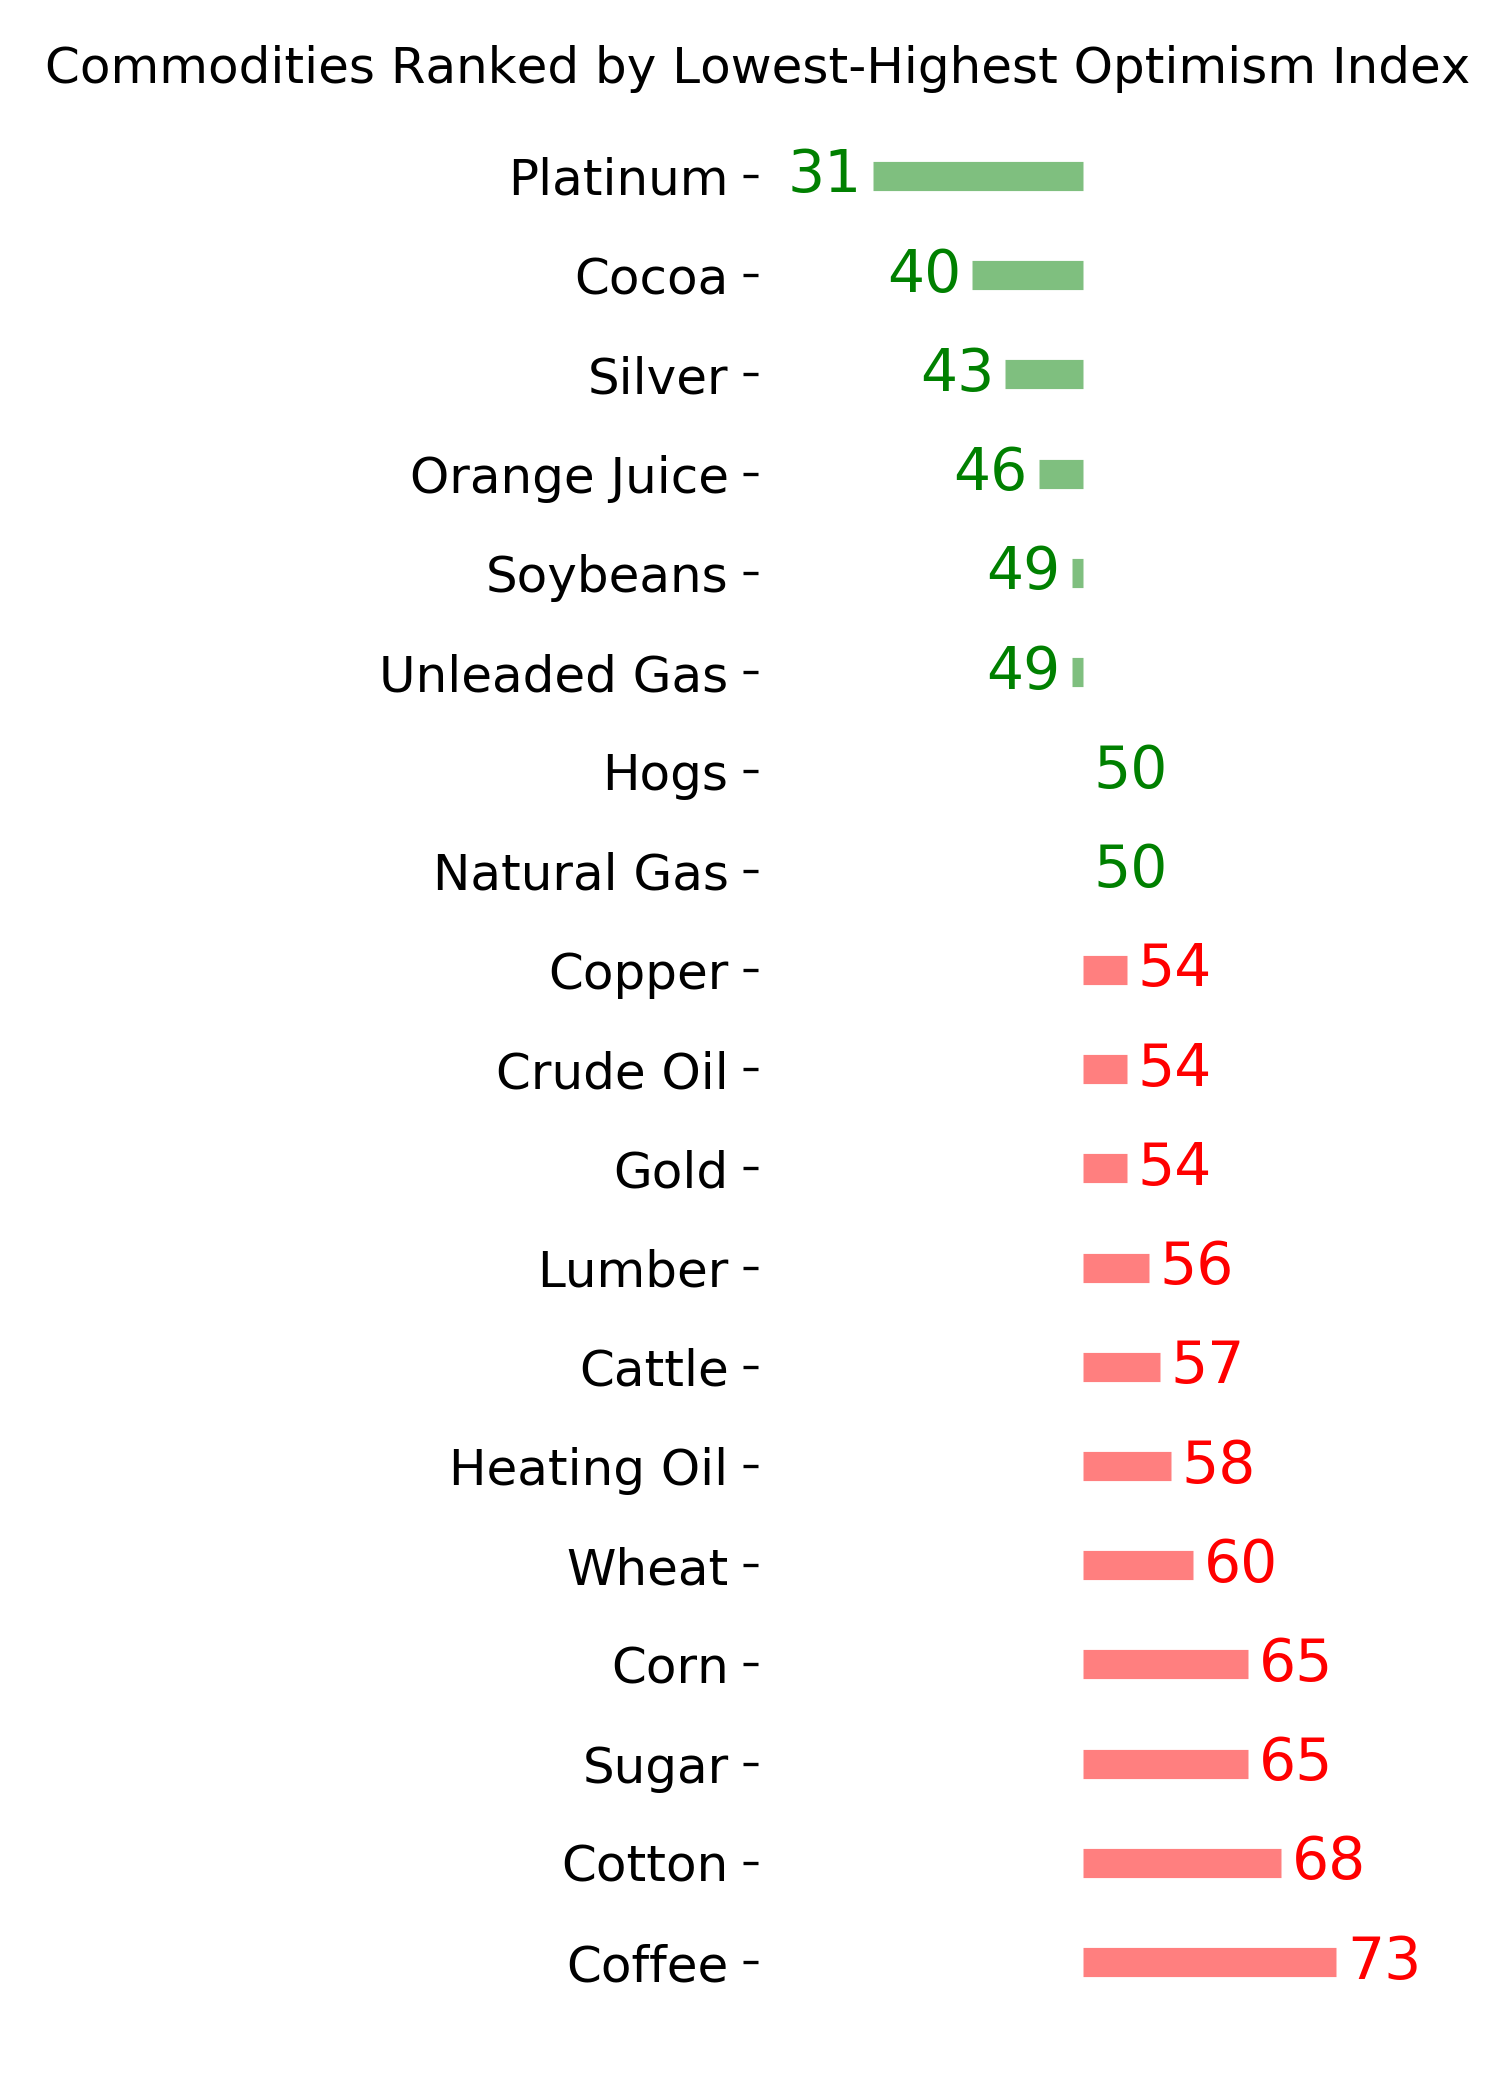
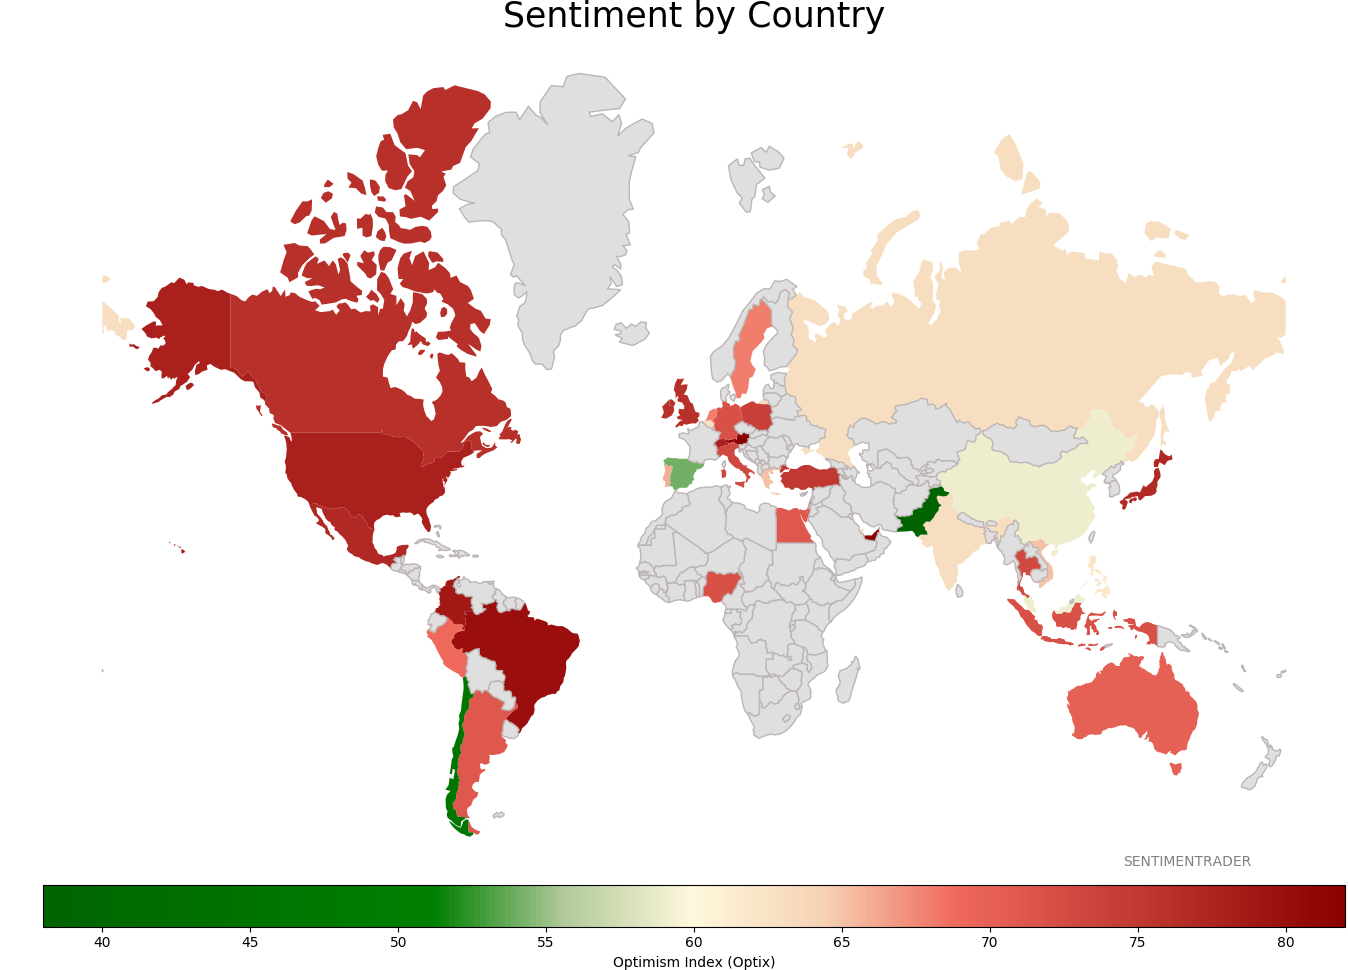
Sentiment Around The World
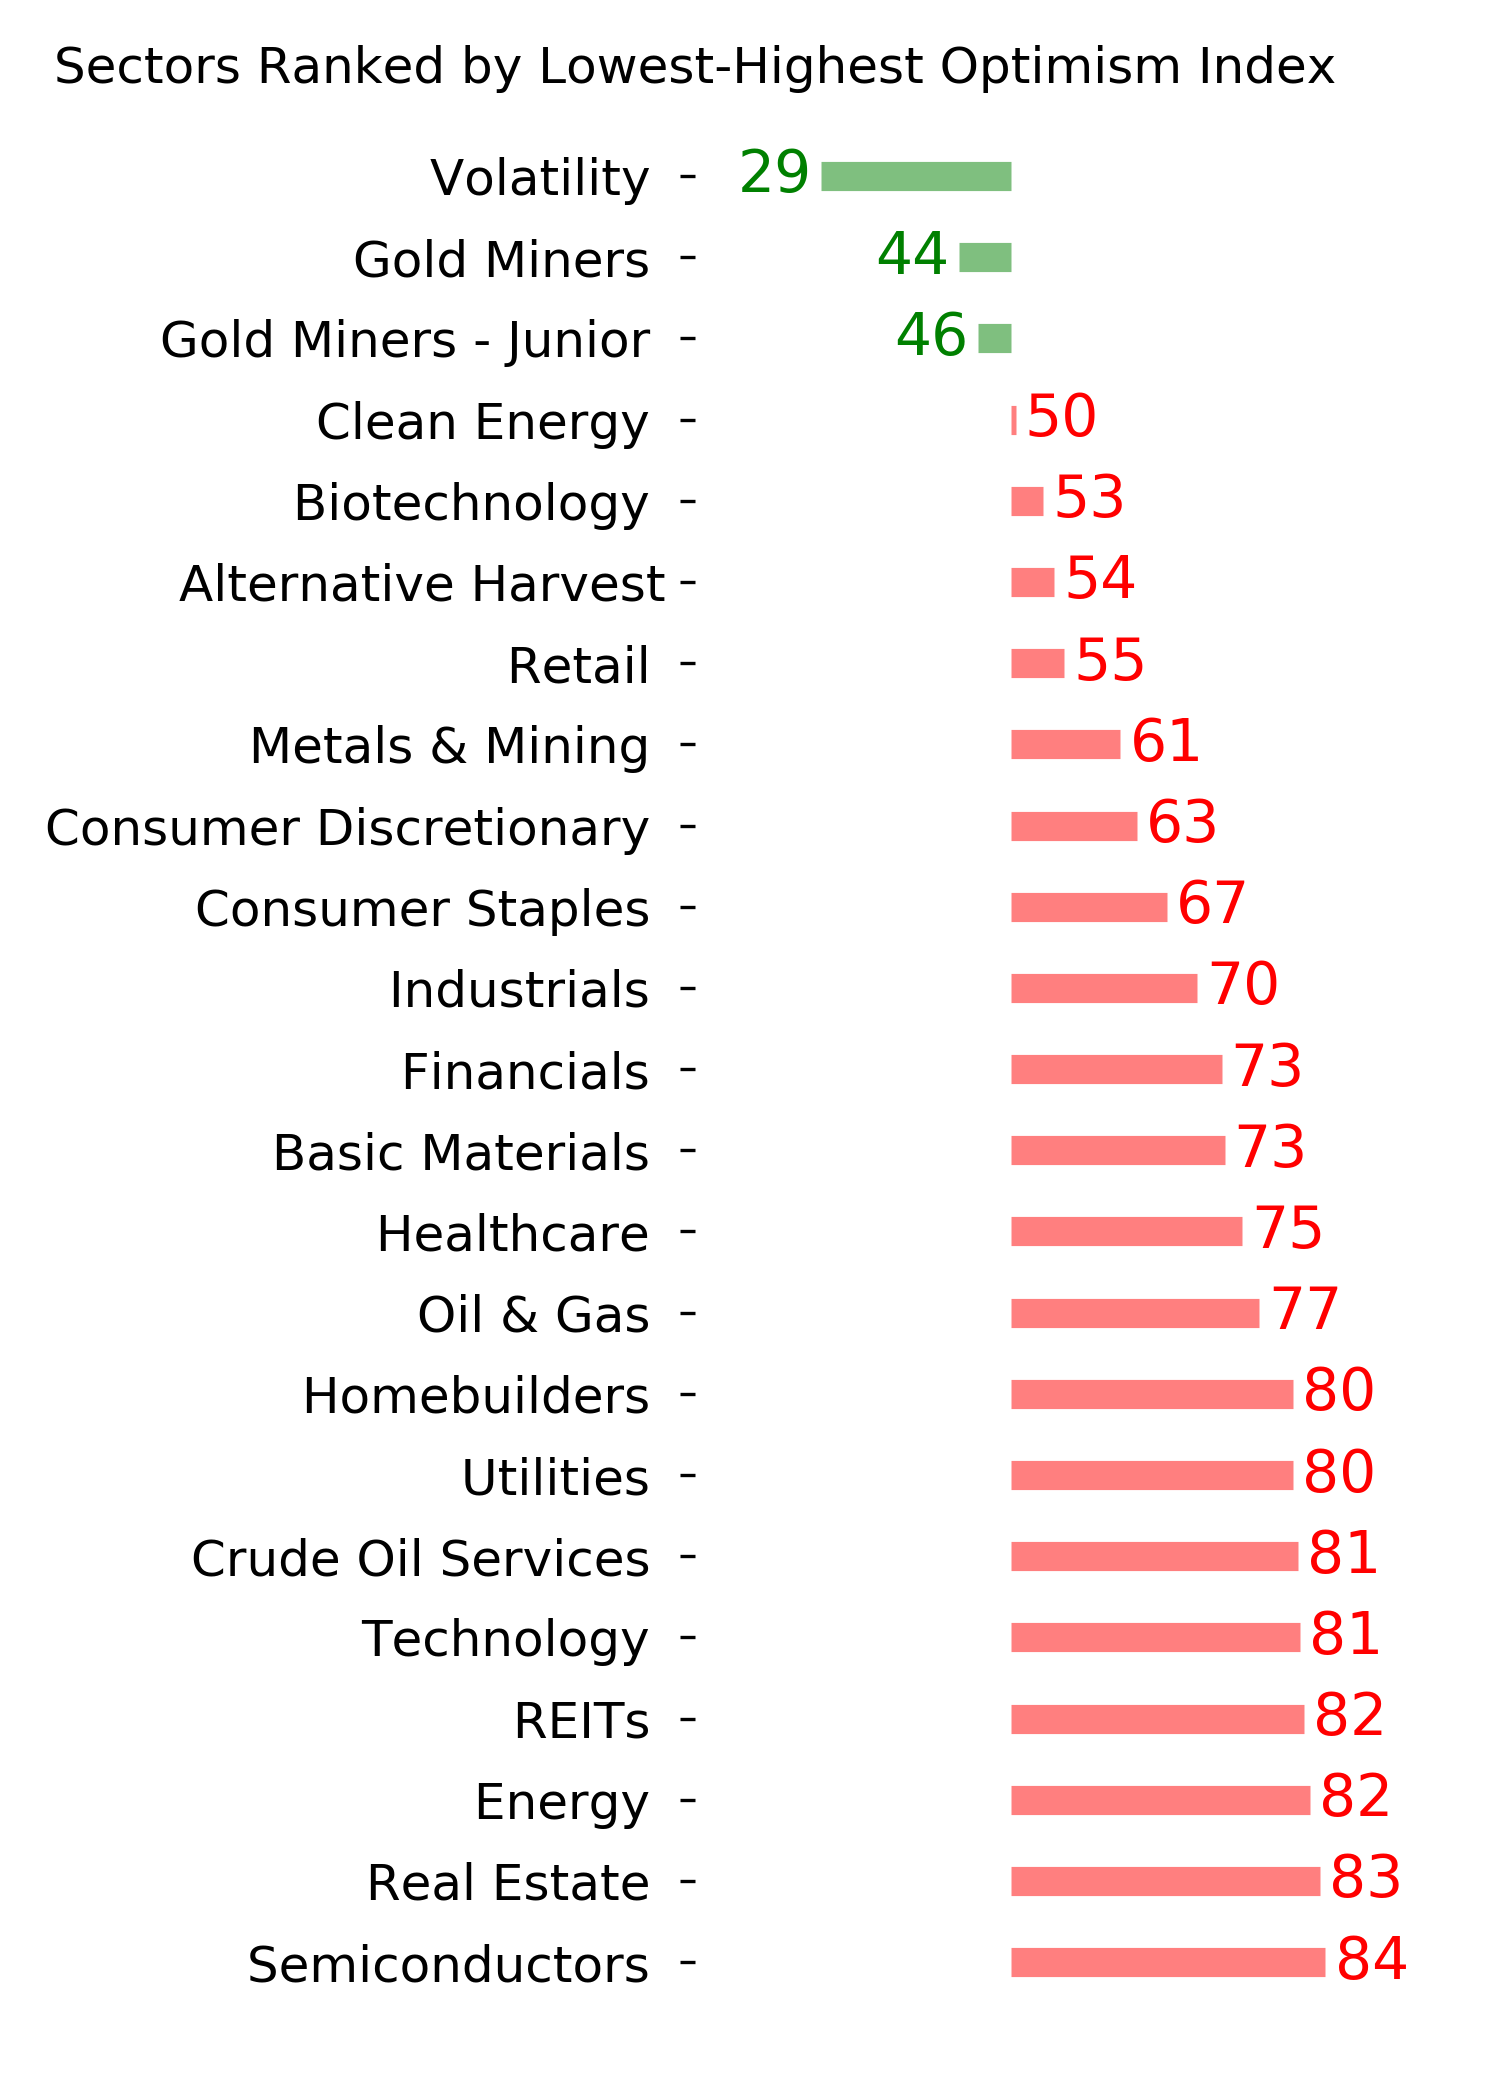
Optimism Index Thumbnails
|
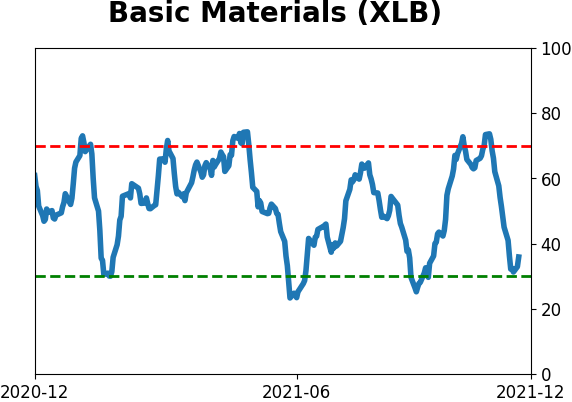
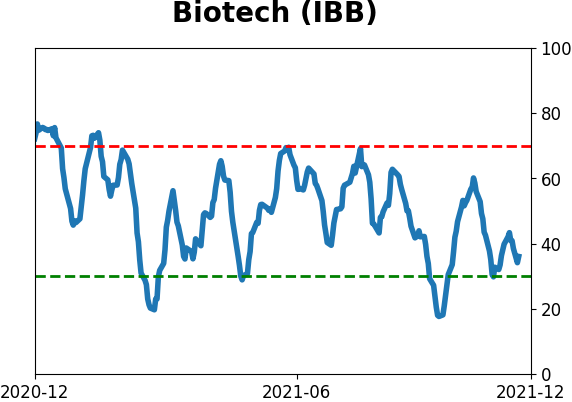
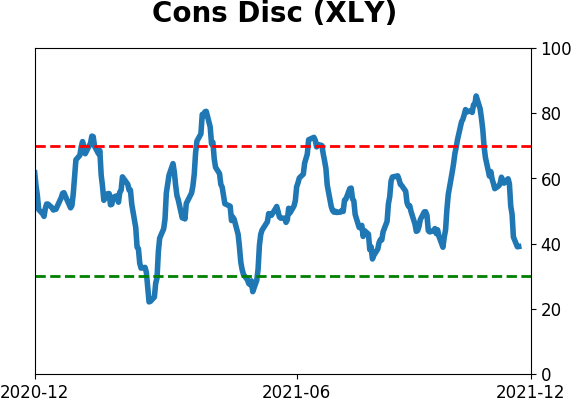
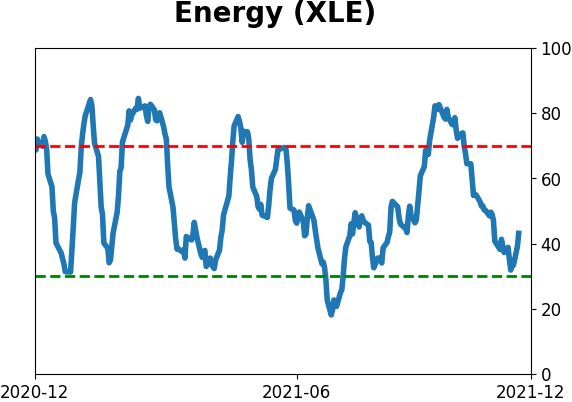
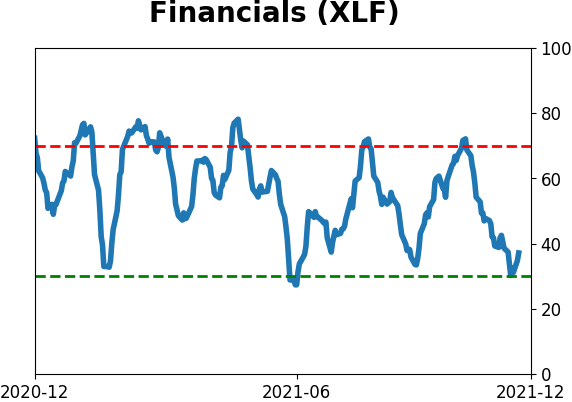
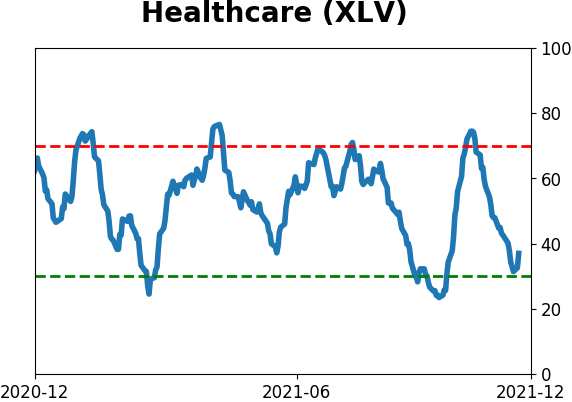
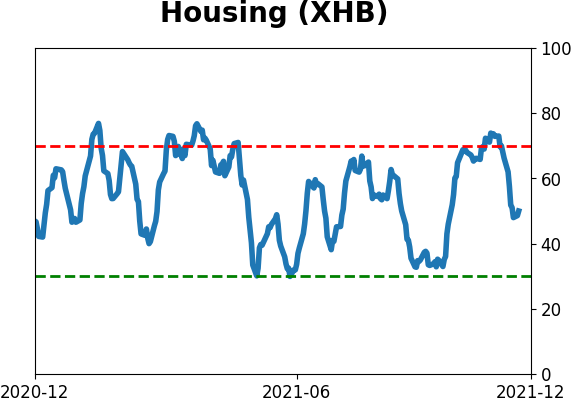
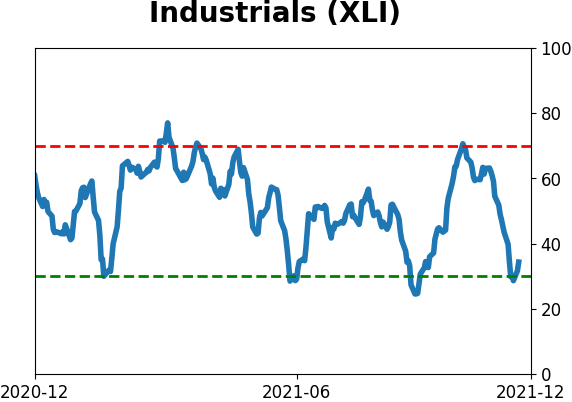
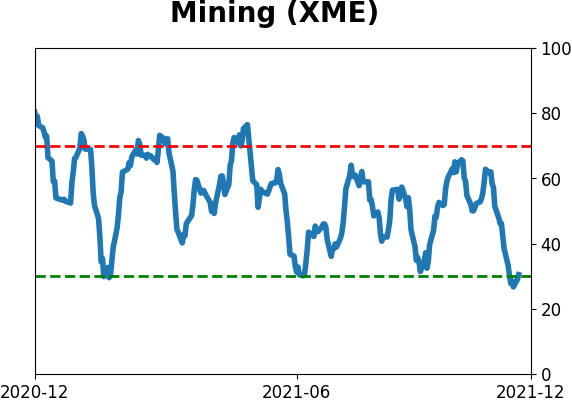
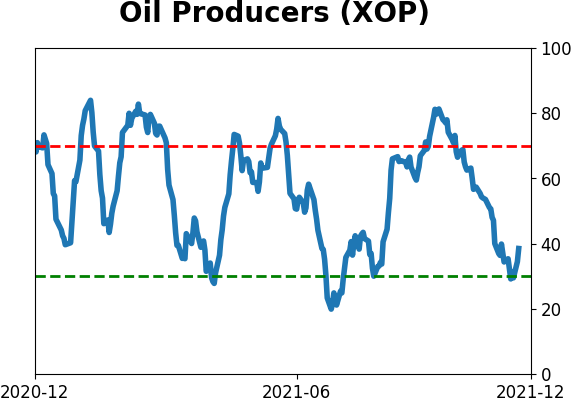
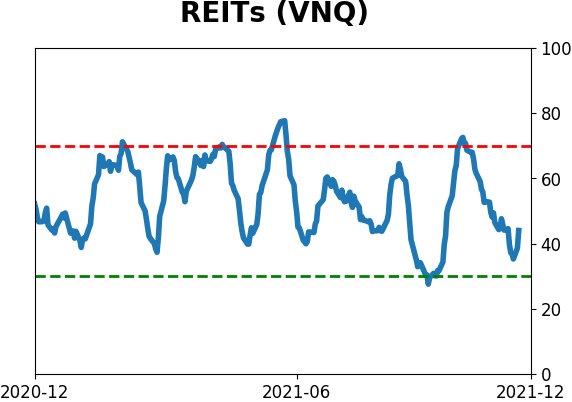
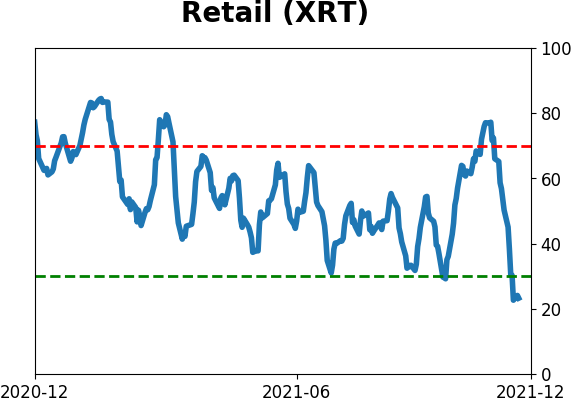
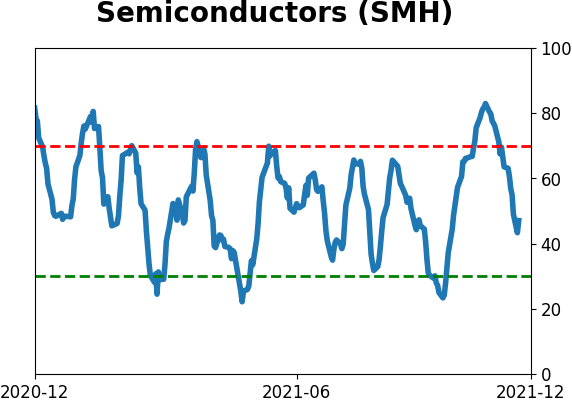
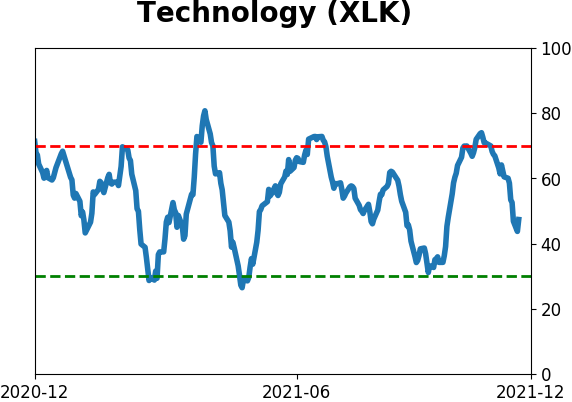
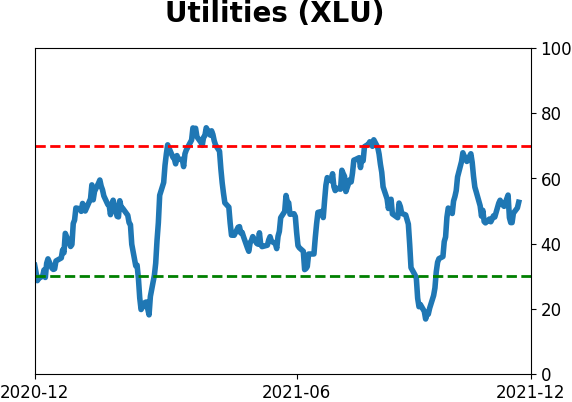
Sector ETF's - 10-Day Moving Average
|
|
|
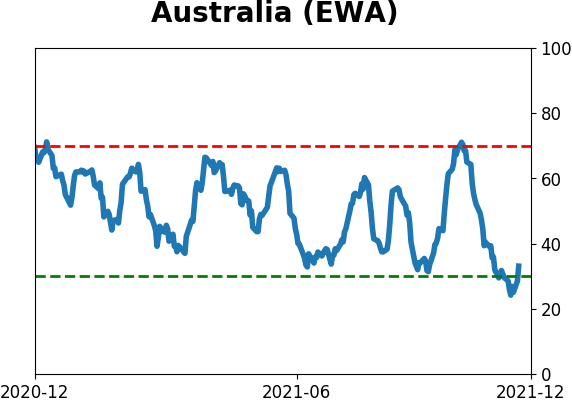
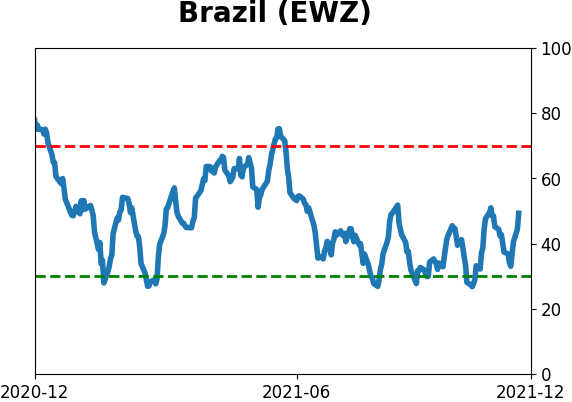
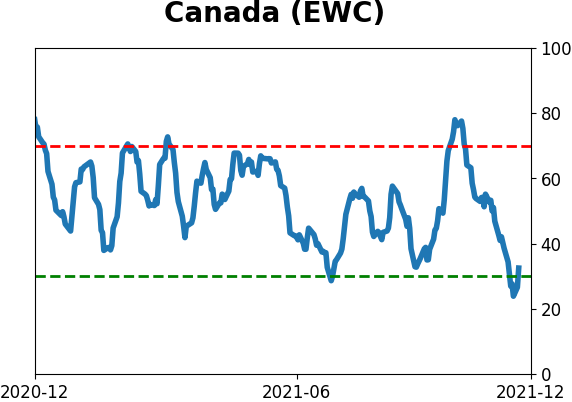
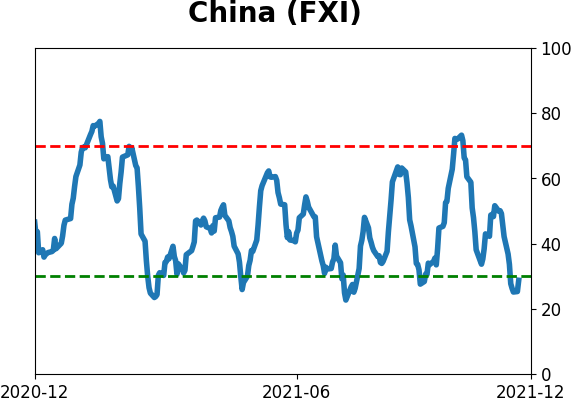
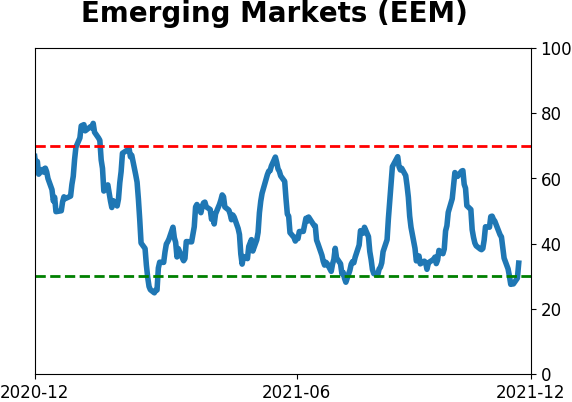
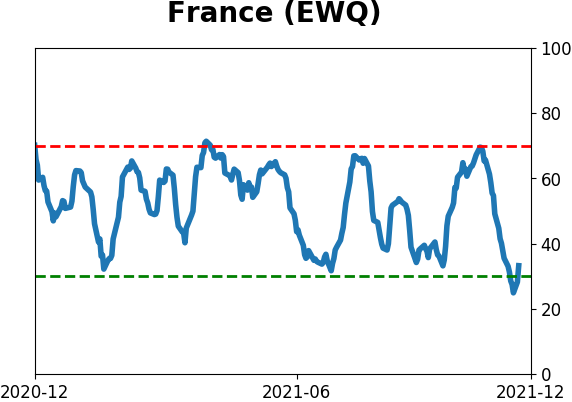
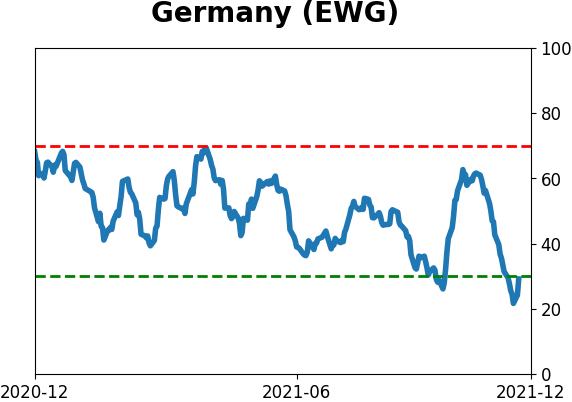
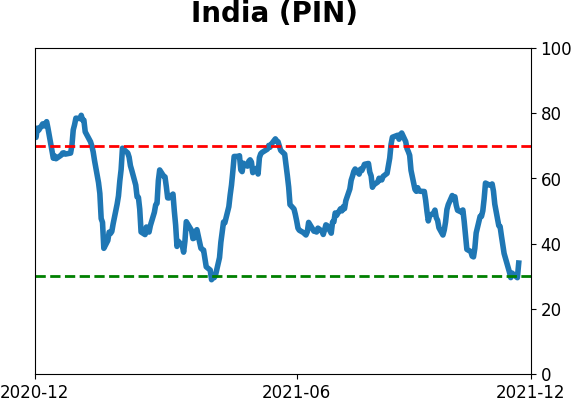
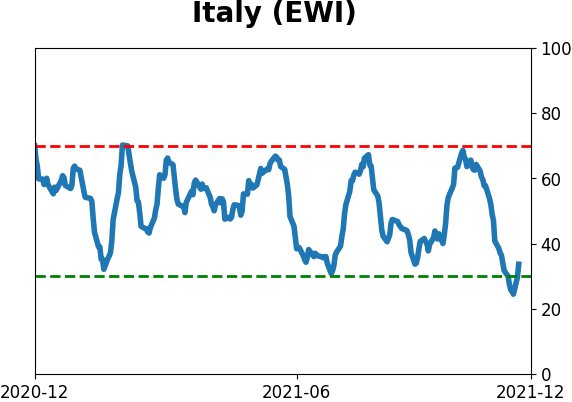
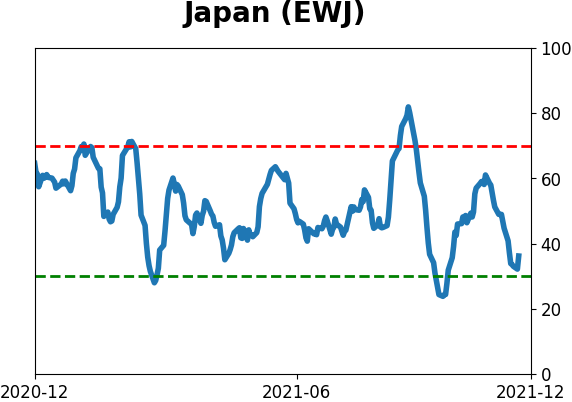
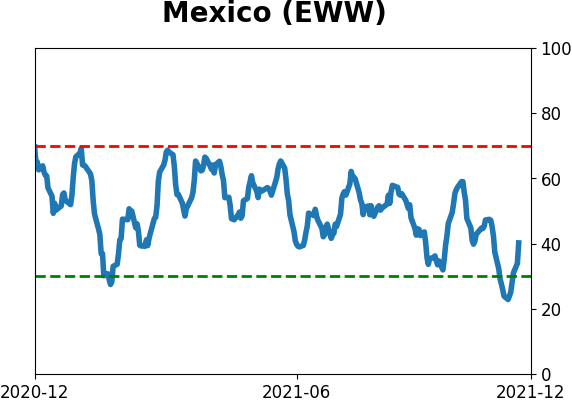
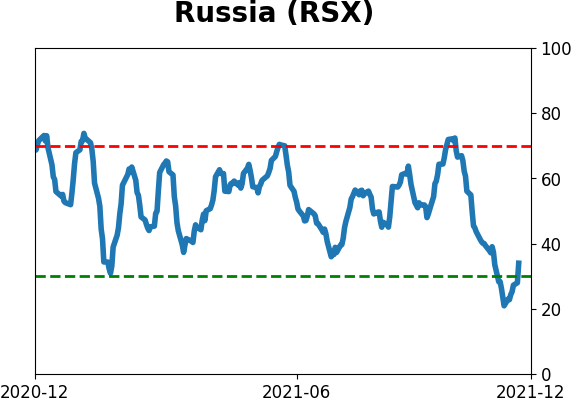
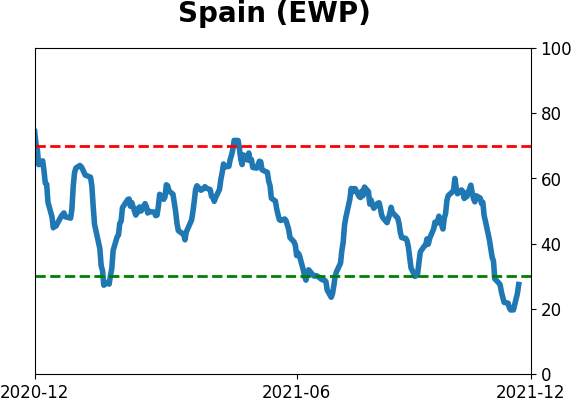
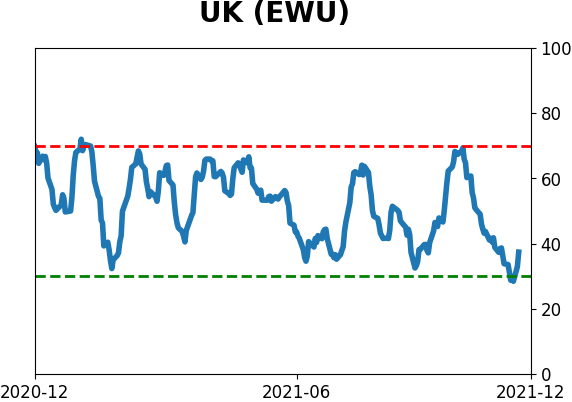
Country ETF's - 10-Day Moving Average
|
|
|
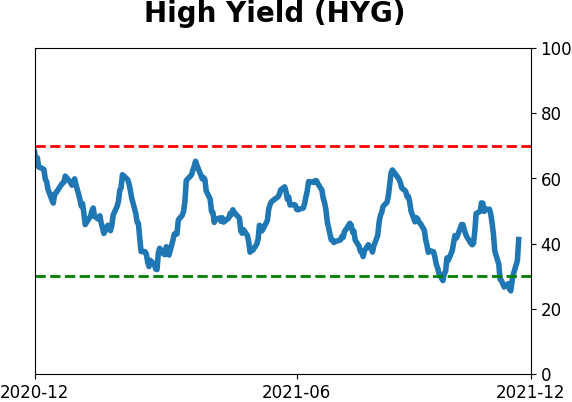
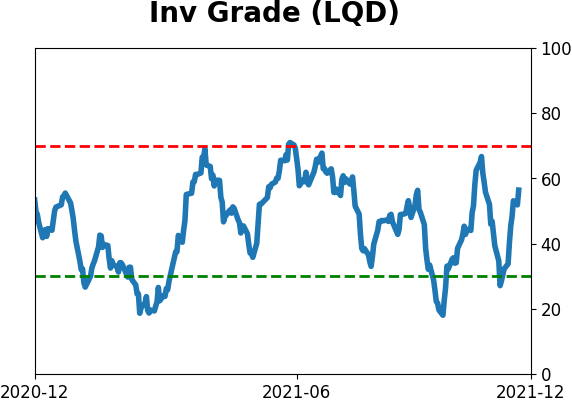
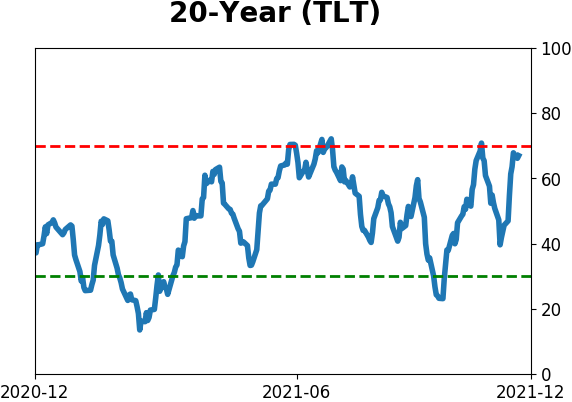
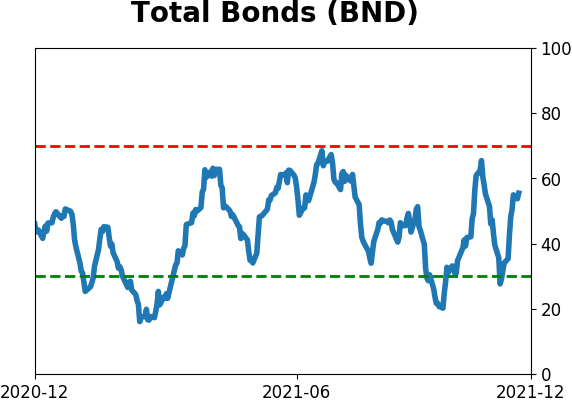
Bond ETF's - 10-Day Moving Average
|
|
|
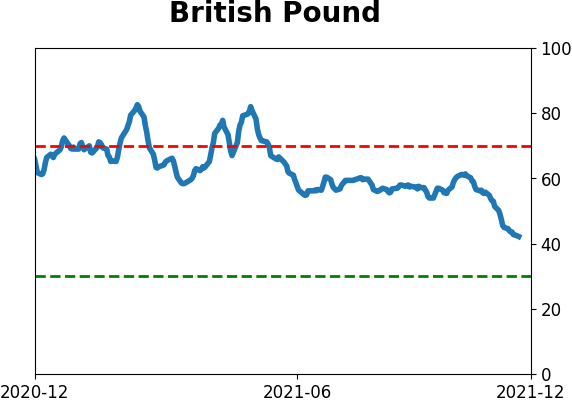
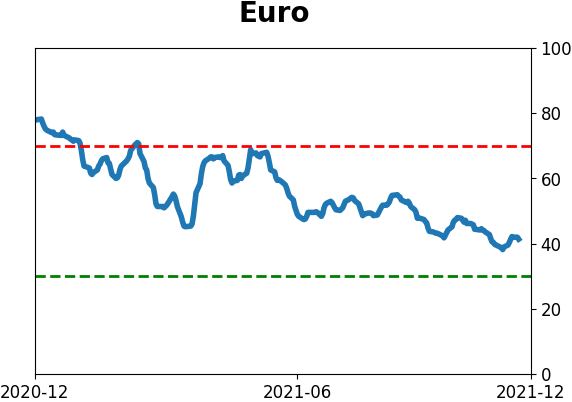
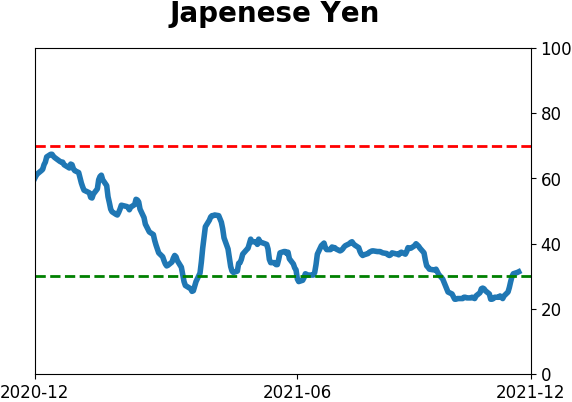
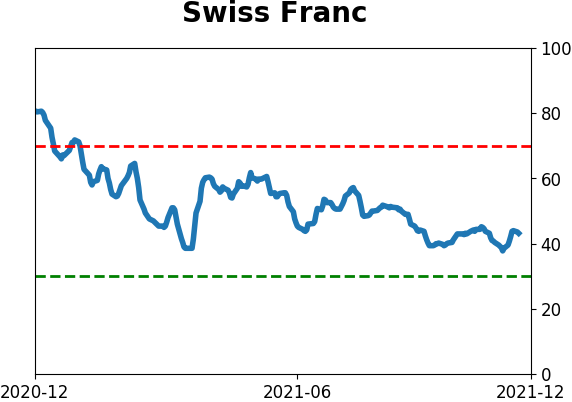
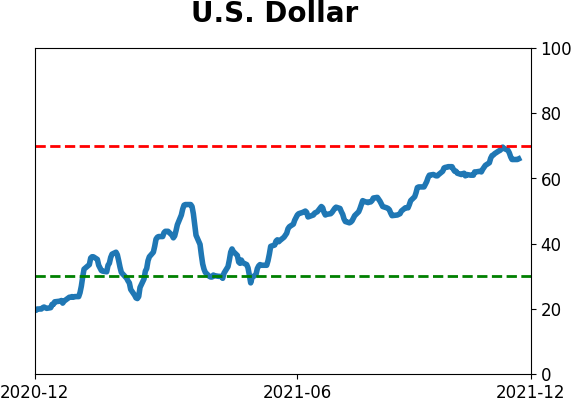
Currency ETF's - 5-Day Moving Average
|
|
|
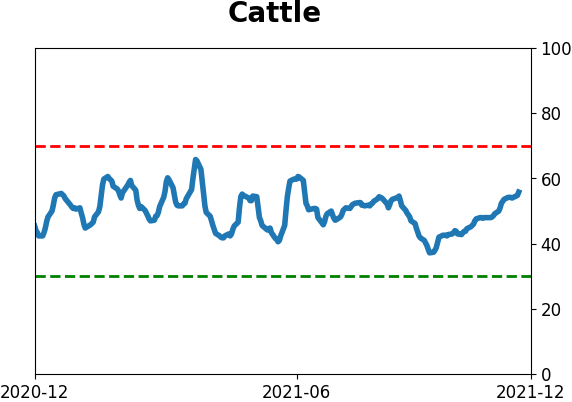
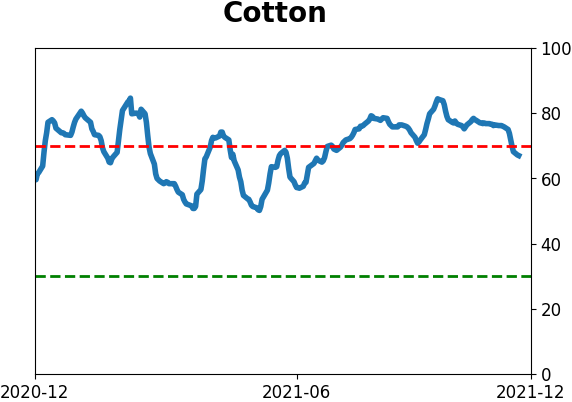
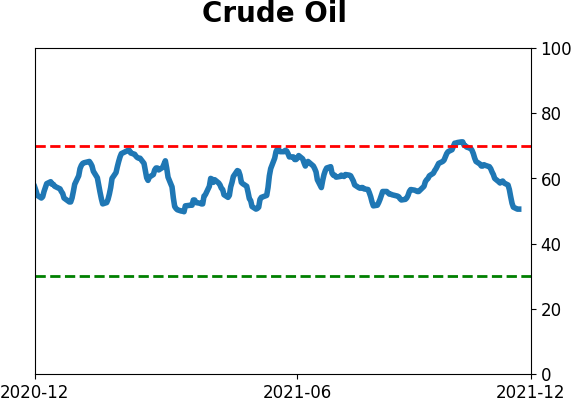
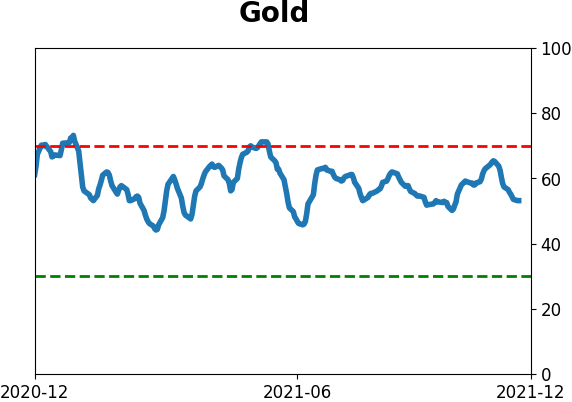
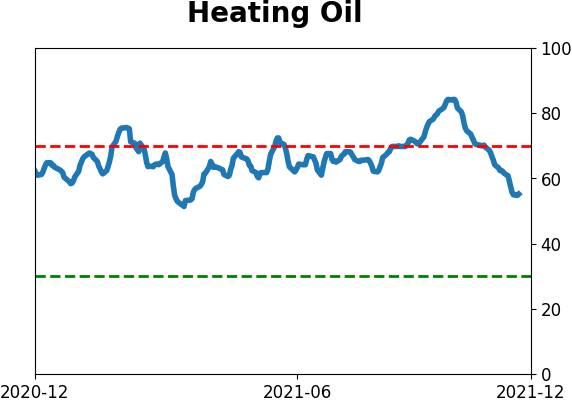
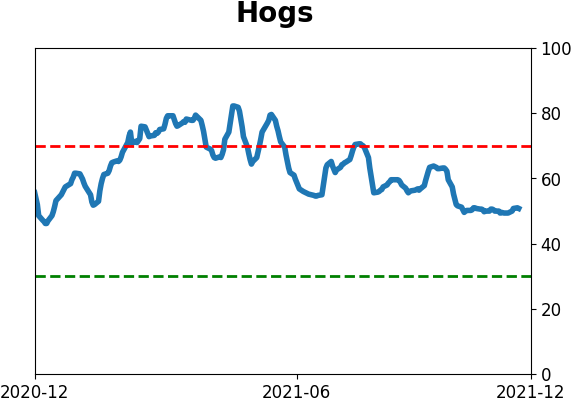
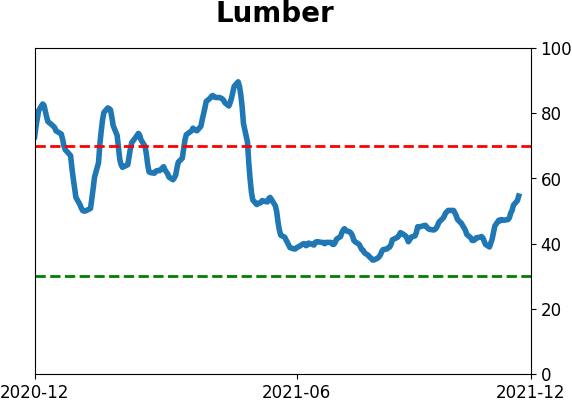
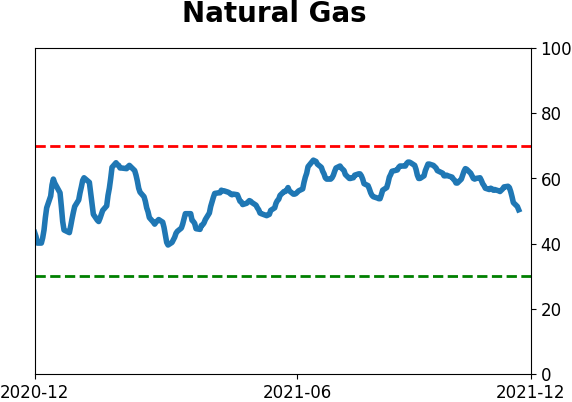
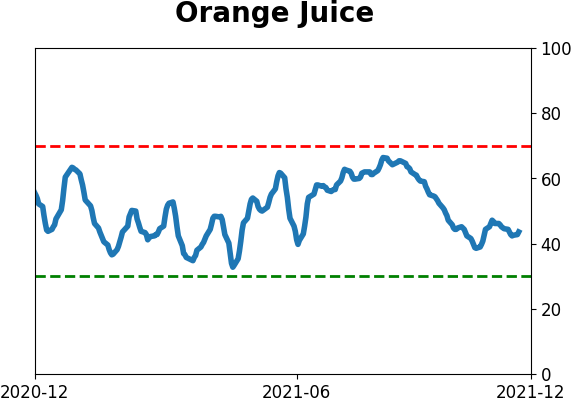
Commodity ETF's - 5-Day Moving Average
|
|