Headlines
|
|
As smart money sells, option speculation hits record high:
The Smart Money Index suggests that "smart money" investors are selling near the close. Insider buying has tapered off, too. At the same time, speculation among options traders is hitting record highs.
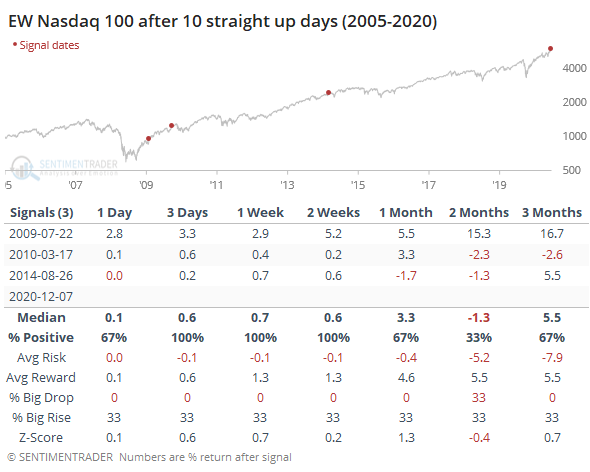
10 in a row: For only the 4th time since its 2005 inception, the equally-weighted Nasdaq 100 index has managed to string together 10 consecutive up days. All 3 of the others added to their gains over the short-term and then 2 of them gave those gains back during a temporary pullback.
Bottom Line:
- The market environment is pristine, but with near-historic optimism, gains tend to be muted, with a high probability of being reversed at some point over the ensuing weeks.
|
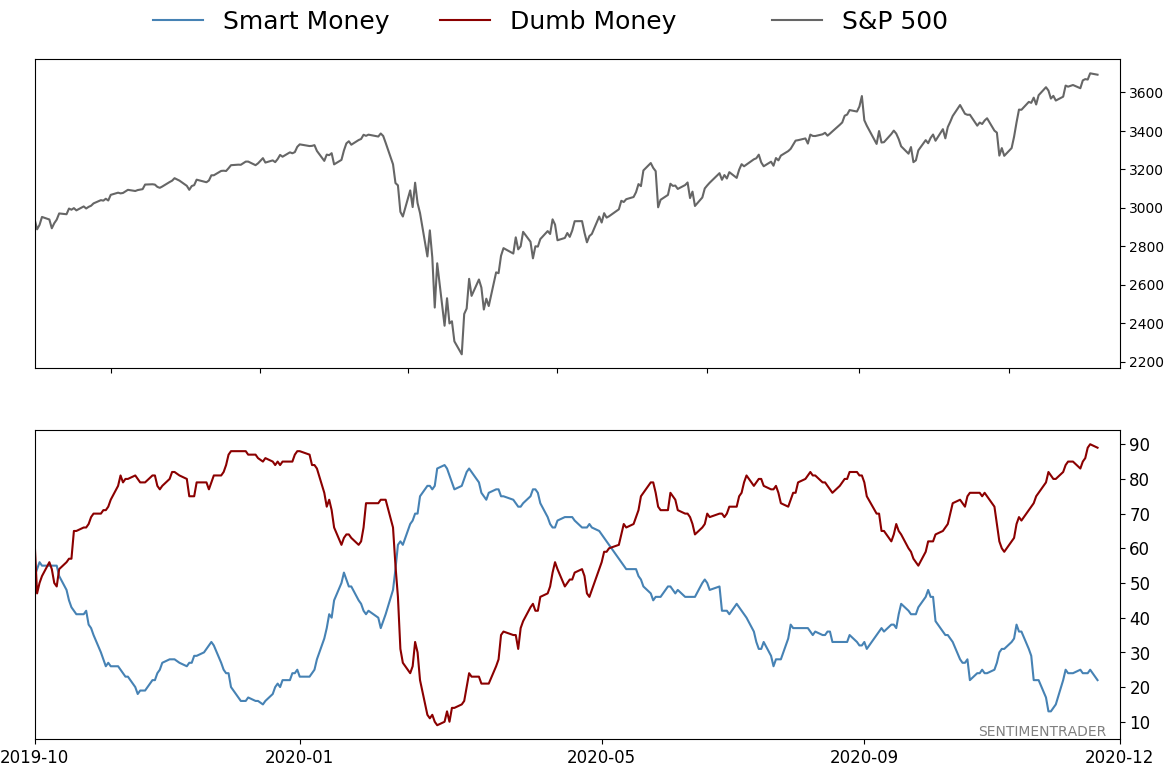
Smart / Dumb Money Confidence
|
Smart Money Confidence: 22%
Dumb Money Confidence: 89%
|
|
Risk Levels
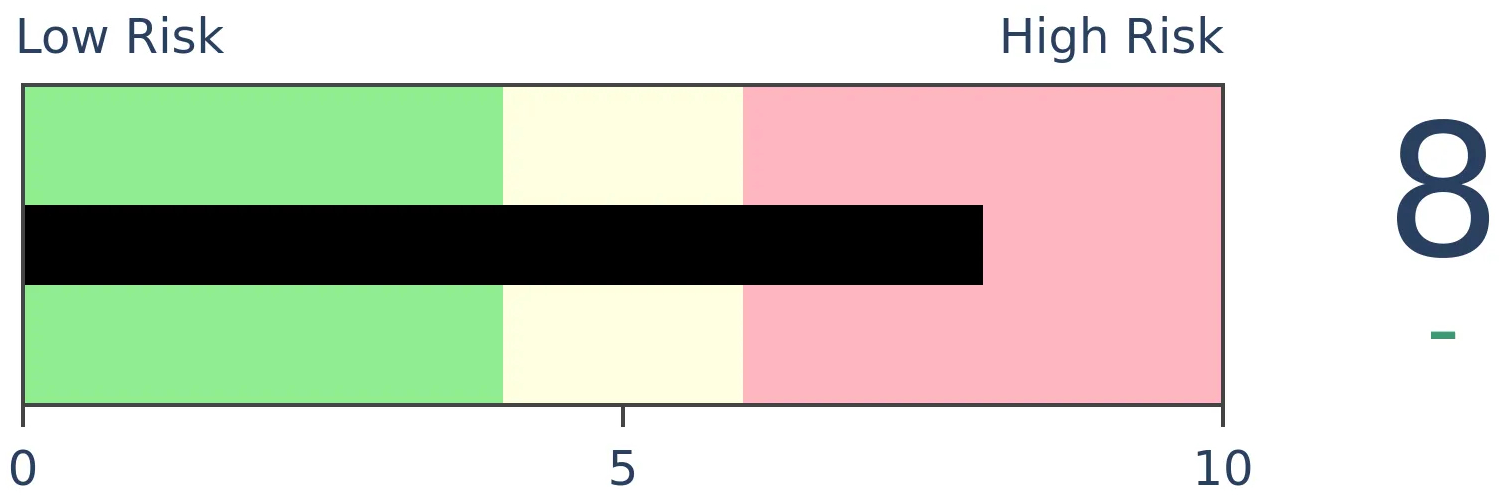
Stocks Short-Term
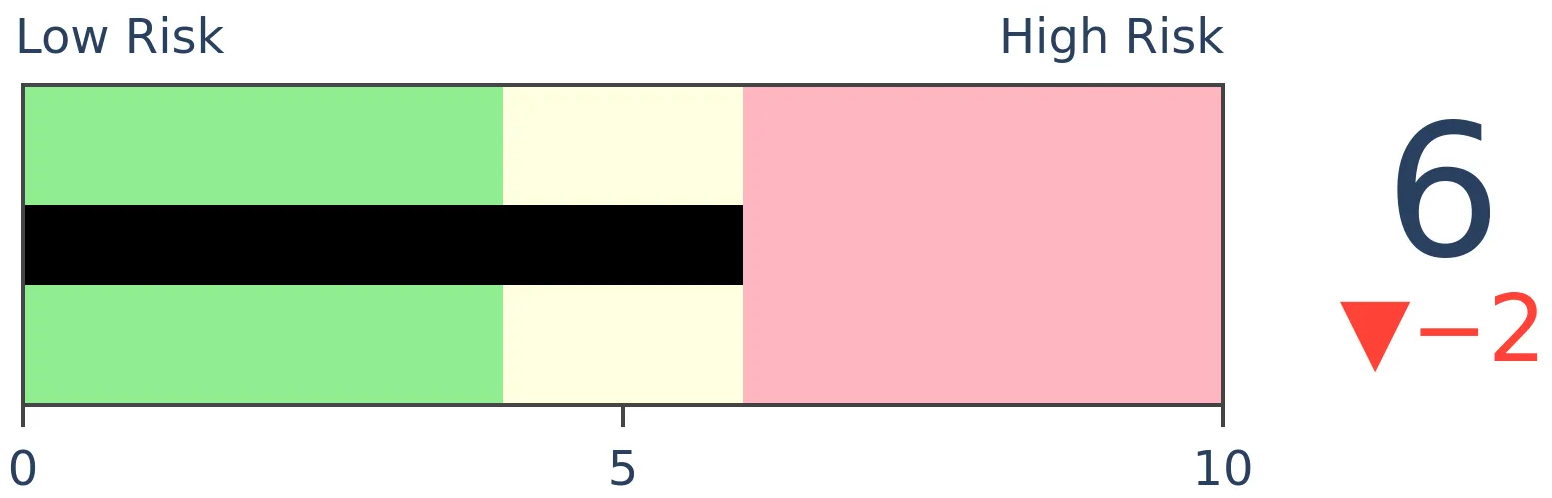
|
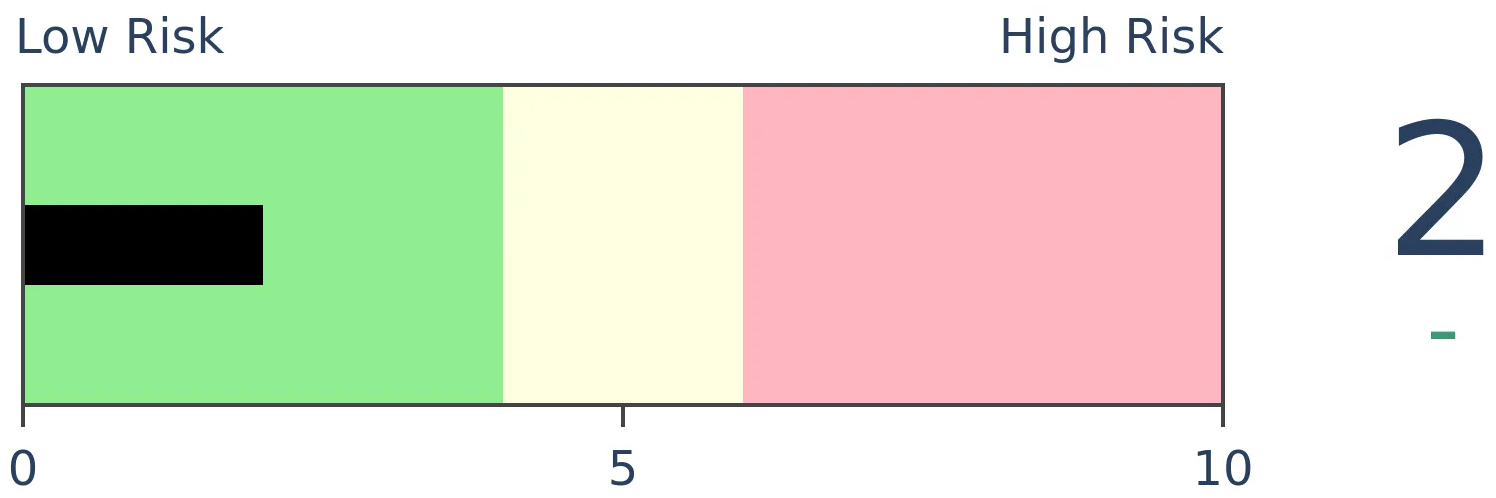
Stocks Medium-Term
|
|
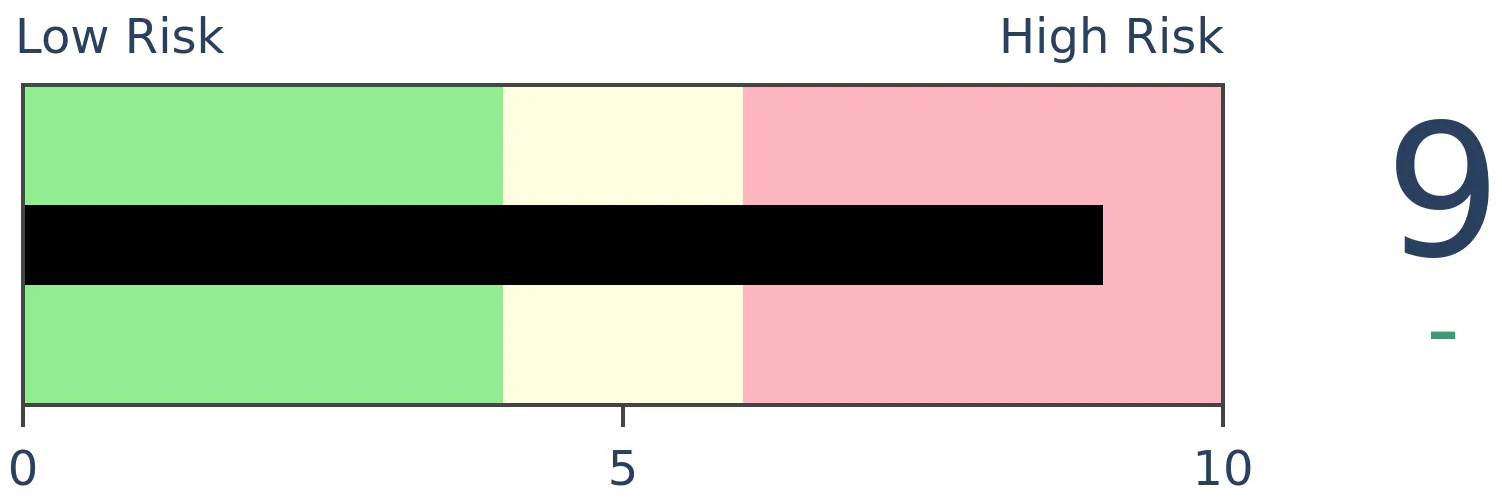
Bonds
|
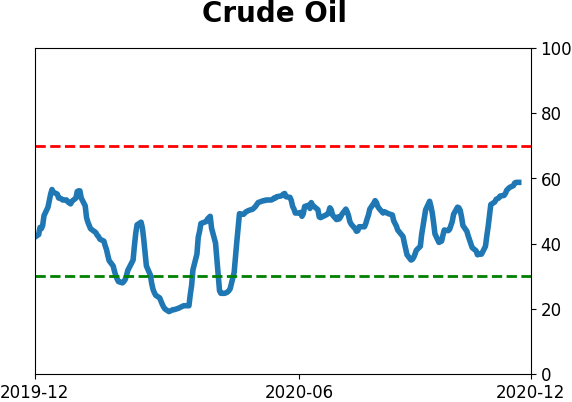
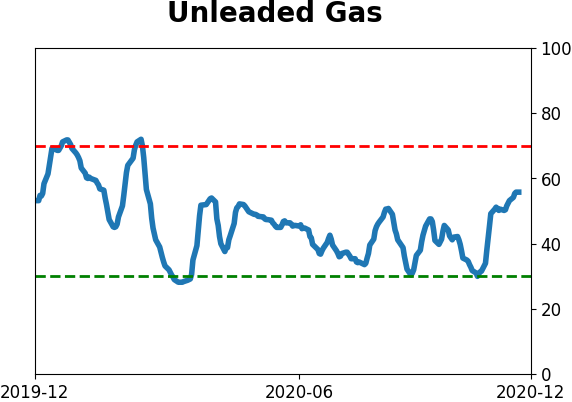
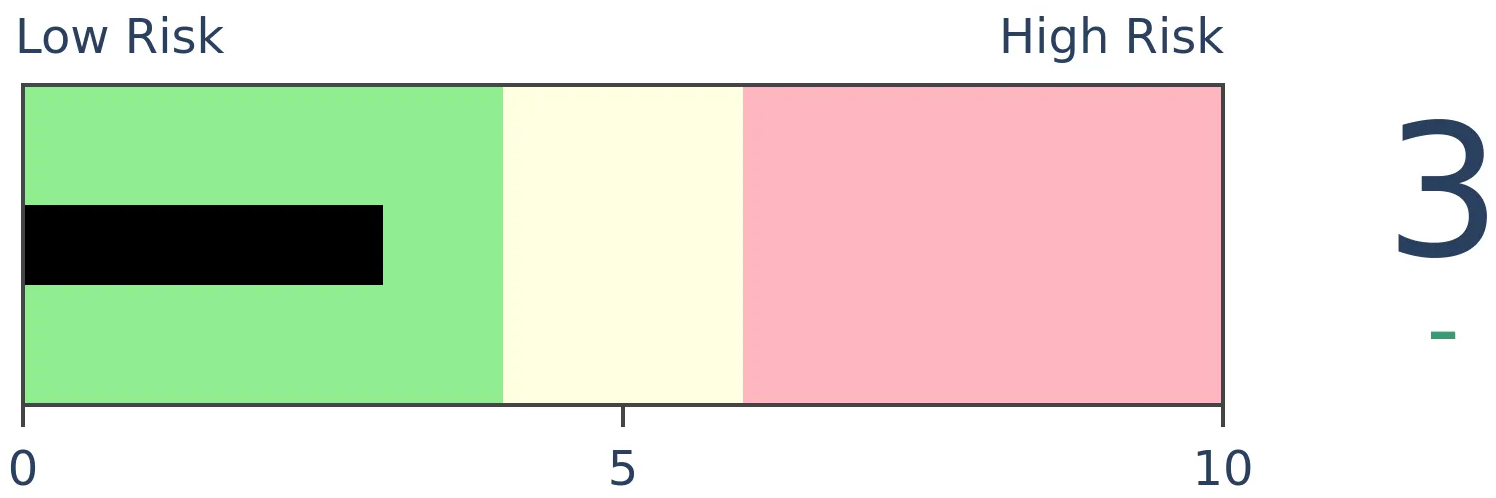
Crude Oil
|
|
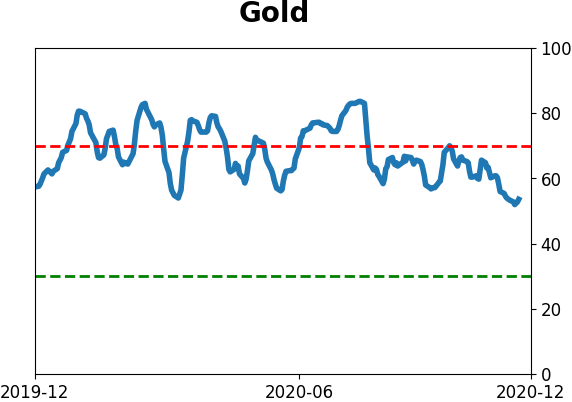
Gold
|
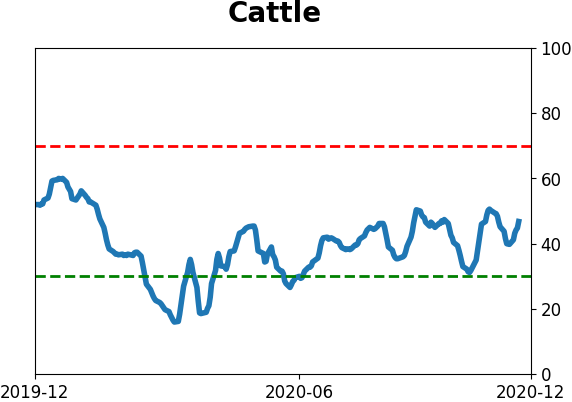
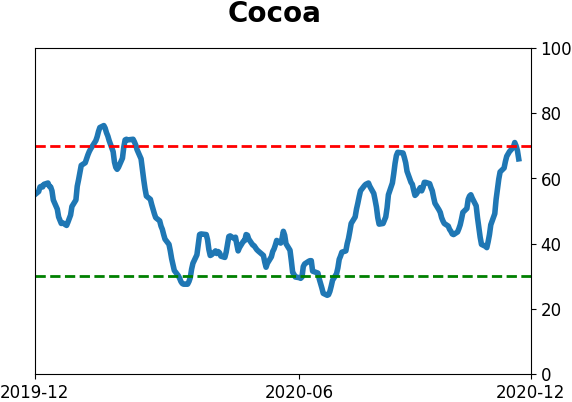
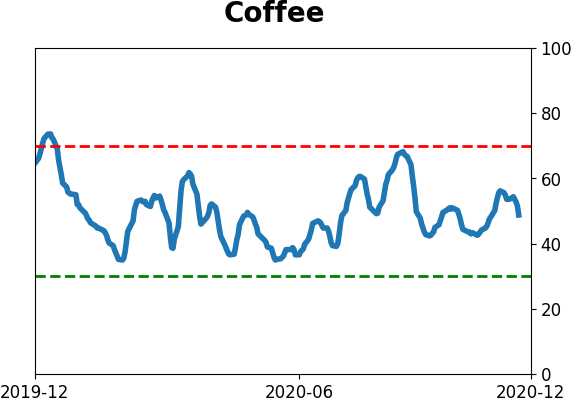
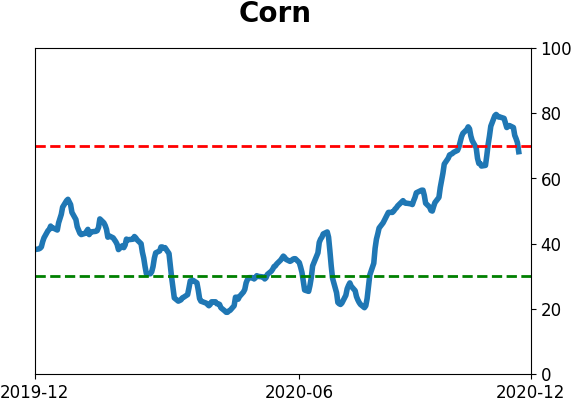
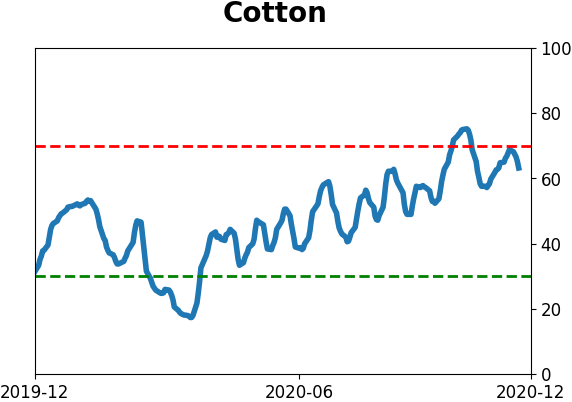
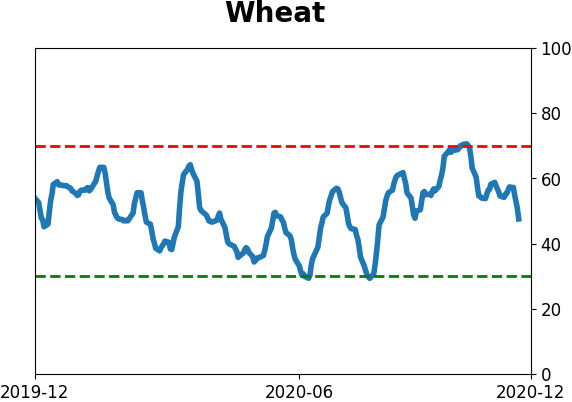
Agriculture

|
|
Research
BOTTOM LINE
The Smart Money Index suggests that "smart money" investors are selling near the close. Insider buying has tapered off, too. At the same time, speculation among options traders is hitting record highs.
FORECAST / TIMEFRAME
None
|
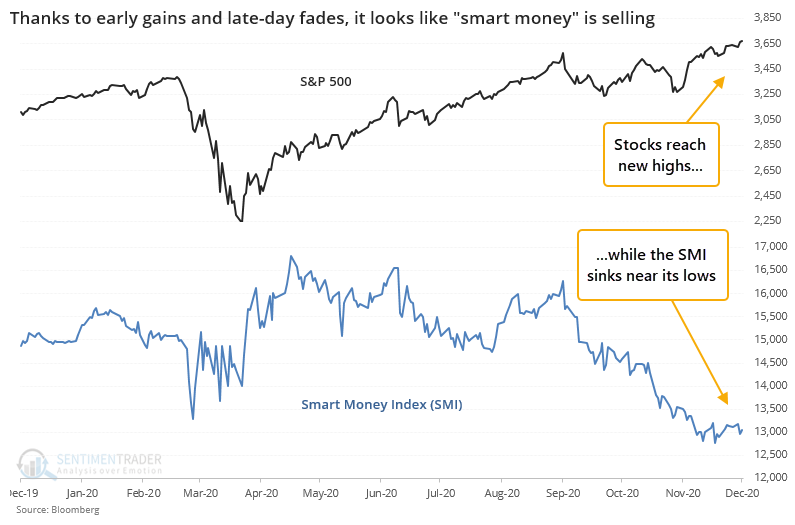
Stocks are hitting new highs, but there's one group that looks like it's sitting out - the smart money. Even as stocks ticked at records last week, the Smart Money Index (SMI) was languishing near its lowest level in a year.
The idea behind this indicator, popularized by money manager Don Hays and existing with many variations, is that emotional trading takes place at the beginning of the trading day (as traders react to overnight news events and economic releases) while the "smart money" takes the day to evaluate price action and input their orders before the market closes. That concept may seem quaint now in the era of passive funds overwhelming late-day volume, so perhaps this view is no longer accurate.
Regardless, it's unusual to see stocks rally so hard and the SMI sell off so drastically. Using Bloomberg's version of the index, we can see just how wide this disparity is now.
After any day when the S&P 500 hit a 52-week high and the SMI was in the bottom 5% of its range, future returns were poor.
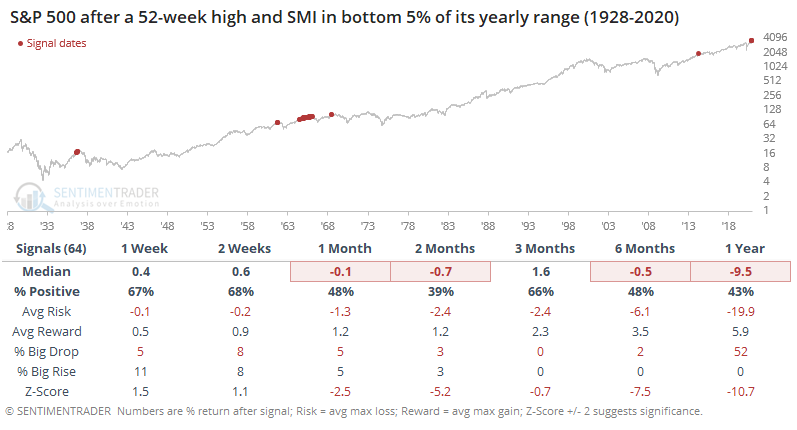
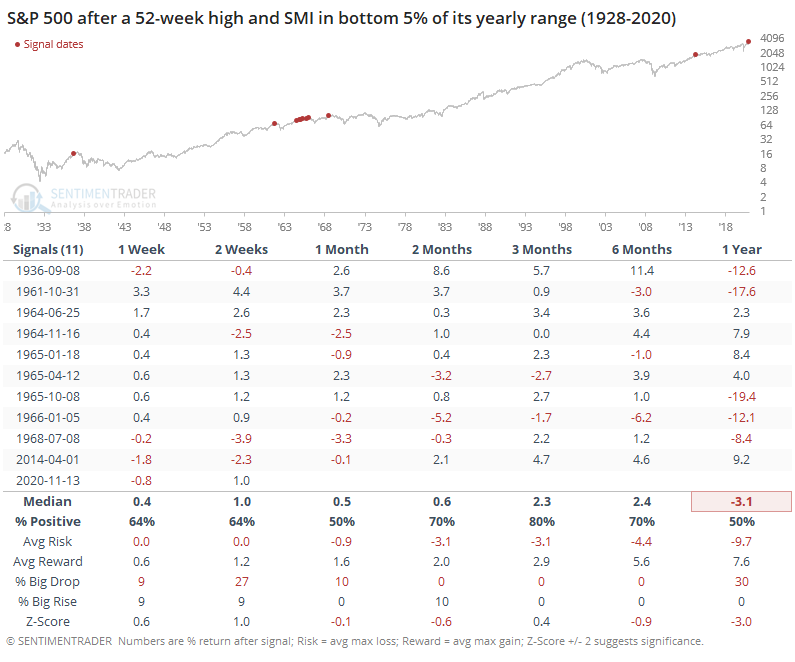
The poor returns were due in large part to a big cluster of days in 1965. When we isolate the signals to only the 1st one in at least a month, returns improve but were still "meh."
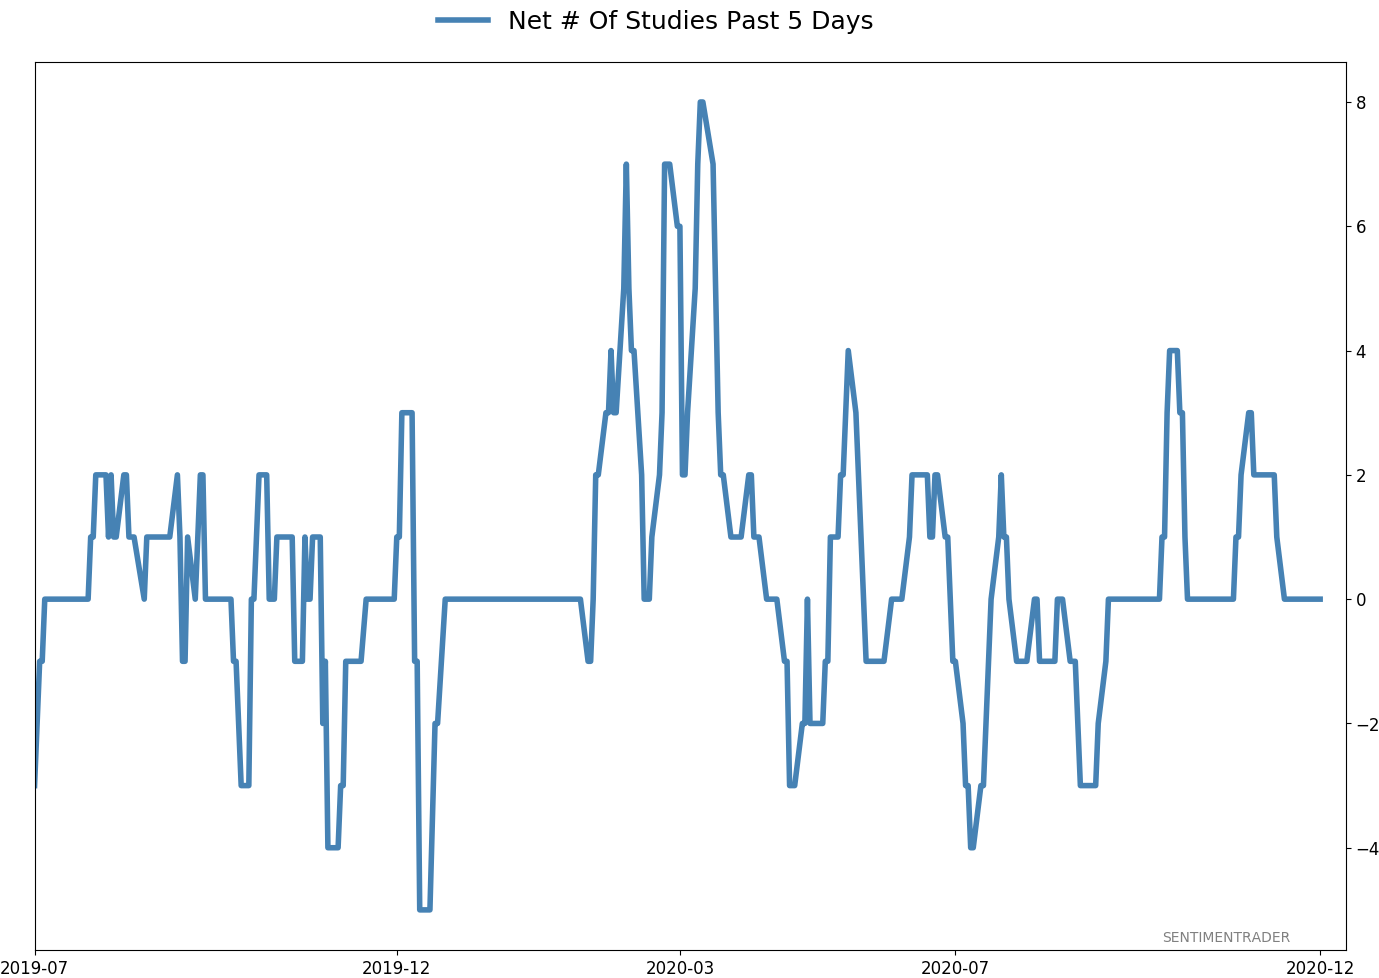
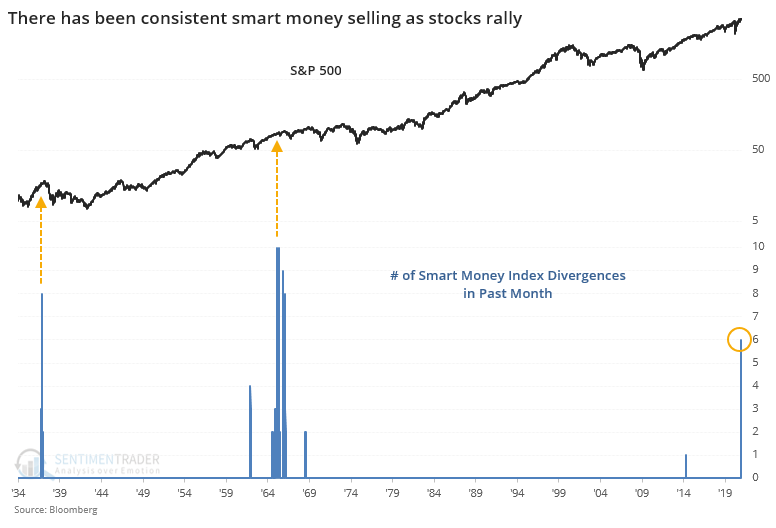
Going back more than 80 years, the past month has seen one of the biggest clusters of divergences between the S&P 500 and its Smart Money Index subset. The chart below shows a rolling one-month sum of days when the S&P was at a new high while the SMI was in the bottom 5% of its own range.
Among other "smart money" indicators, we can also see that insiders haven't been particularly interested in picking up more shares in their companies. While overall activity is low due to quiet periods surrounding earnings announcements, buying activity has dropped more than selling, and the Corporate Insider Buy/Sell Ratio has dropped to its lower threshold.
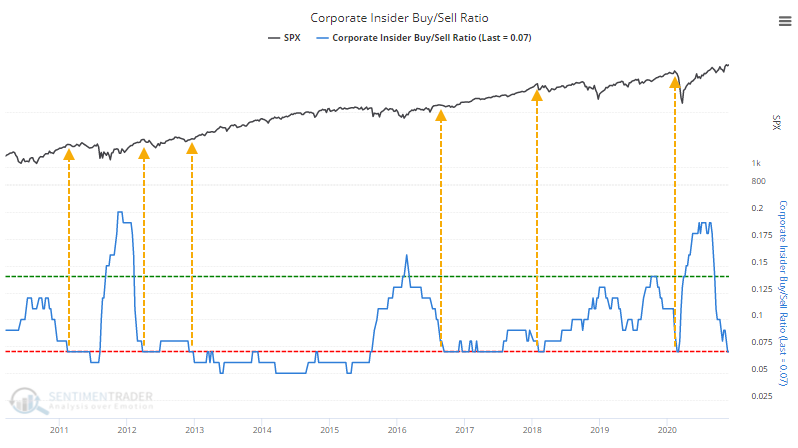
It's well-known that buy signals tend to be much more effective than sell signals, and we see that here. Stocks rallied universally after the ratio exceeded its upper threshold, but forays below the lower bound weren't as consistent of a contrary indicator. It's a worry, but only a minor one.
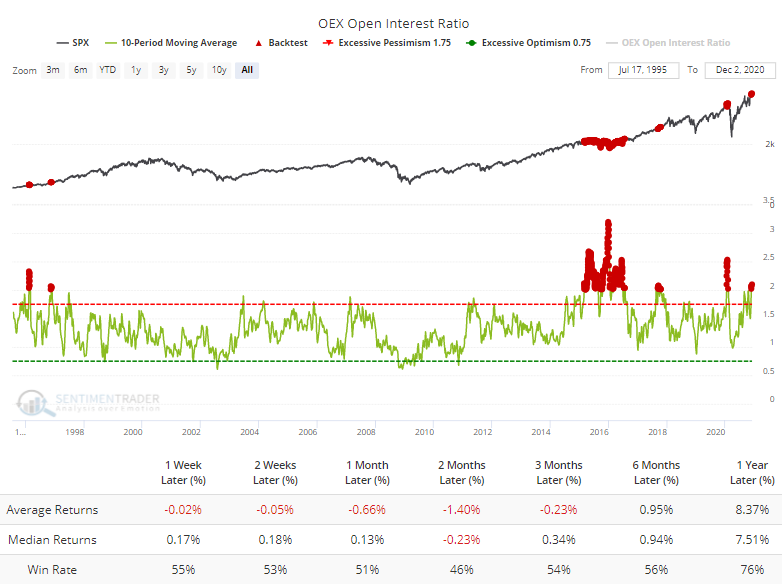
In the used-to-be-smart-but-is-probably-irrelevant category, holders of S&P 100 (OEX) options are holding puts at a 2-to-1 margin over calls over the past 10 days. We used to focus on this data quite a bit because in the 1990s, OEX options were the place to be. Volume has since died off to almost nothing. Still, returns have been below average when these traders so heavily favored puts over calls.
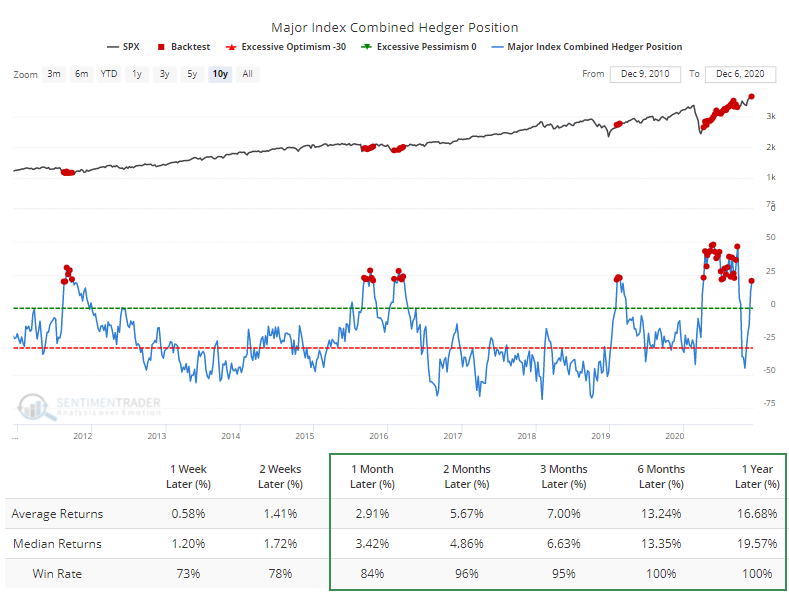
One place where "smart money" participants have not been active is in major equity index futures. As of last Tuesday, they were once again holding more than $20 billion of these contracts net long, which has preceded excellent returns during the past decade.
This data has acted quite oddly since May, not following the pattern we've seen over most of the past decade. At the danger of making excuses for indicators, part of the reason could be the explosion of activity in the options market, which we've discussed exhaustively since August.
It's worth noting this again. While options traders have been picking up their speculative activity since getting slapped in September, by some measures it's back to record levels. Last week, speculative call buying-to-open among the smallest of traders, those buying 10 or fewer contracts at a time, reached a record high relative to all opening transactions.
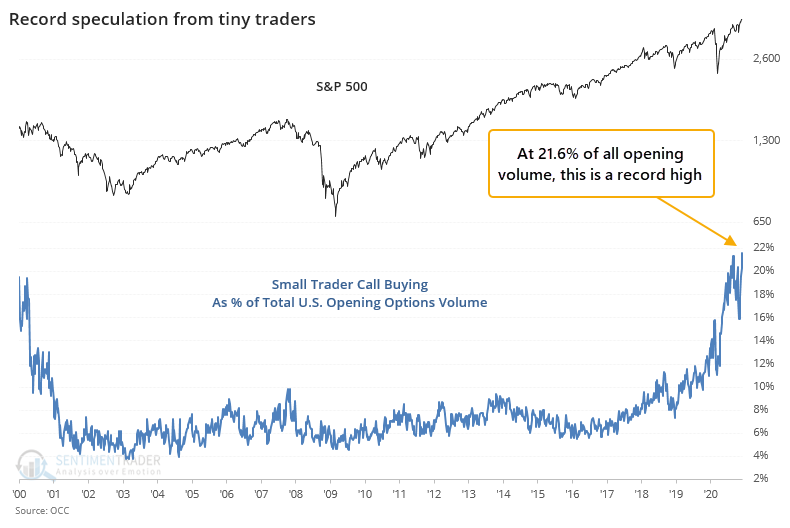
We spend a lot of time focusing on the smallest of traders because they've become the dominant force in the options market. Last week, opening call buys for 10 contracts of fewer accounted for 44% of all opening calls. That overwhelms the activity of larger traders. As late as 2016, the largest of traders were the biggest forces in the market, but 2020 flipped that on its head.
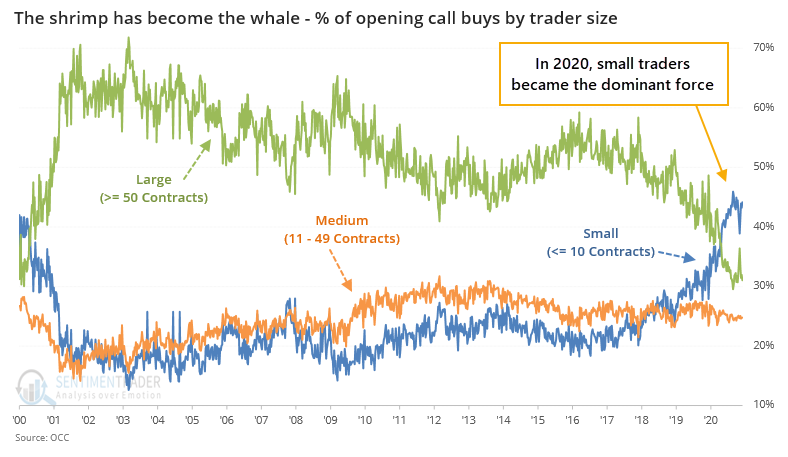
We've discussed previously that it's possible that "small traders" aren't really small traders. We automatically assume it's mom-and-pop buying lottery tickets, which is reinforced by the narratives we see about the popularity of Robinhood and commission-free brokerage activity. It's possible that some of these trades are simply bits and pieces of larger ones, broken up by algorithms to hide broader positioning and protect big funds from being front-run on their positions. It seems unlikely that this could suddenly account for most of the activity, but it's something to keep in mind.
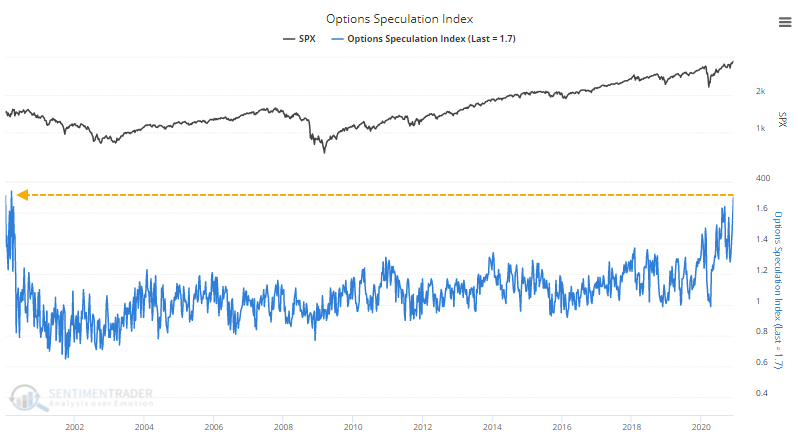
If we include all traders and all options activity on all U.S. exchanges, then the Options Speculation Index, the broadest measure of options activity that we track, soared to 1.7 last week. This means that among all traders and all strategy types, bullish strategy volume was 70% greater than bearish strategy volume.
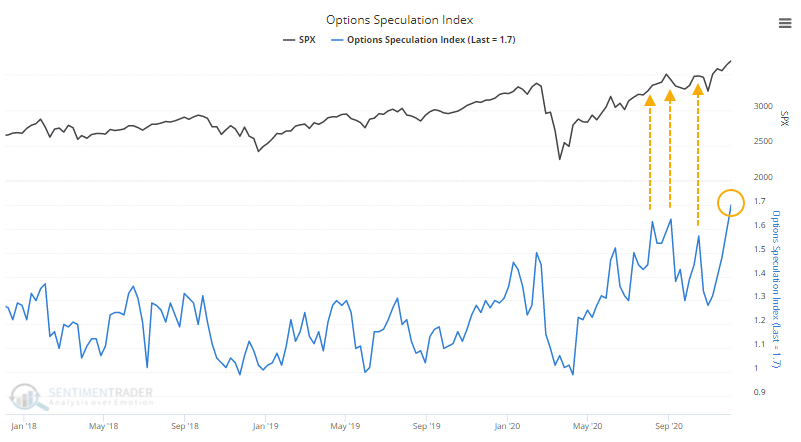
Like small trader activity, we haven't seen this kind of behavior since early 2000. That's where the data starts, unfortunately, so we don't know what it looked like leading up to 2000.
We already know that sentiment is stretched on a historic level. Dumb Money Confidence hit 90% on Friday which the Backtest Engine tells us is #N/A.
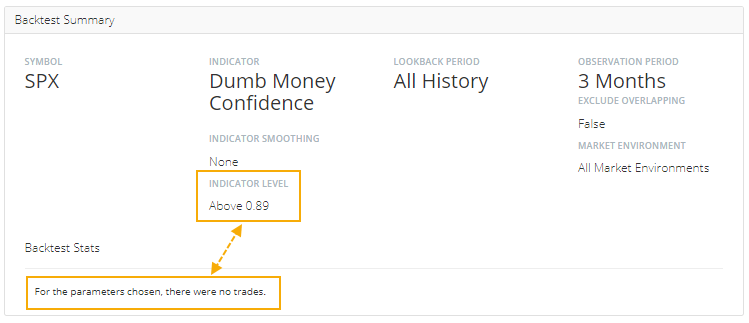
Since we began calculating this on December 1, 1998, the highest it had been previously was 88%.
That doesn't mean it's an automatic sell signal. Especially in recent years, stocks can morph into "creeper" uptrends with small and consistent daily gains that roll on for weeks or even months at a time. What happens in almost every instance, however, is that even if that happens, those gains are typically wiped out during a subsequent pullback of at least 5%-8%.
The positives that are outlined each day in the Bottom Line show that momentum has been incredibly strong, and when buyers have been this intense in the past, it has almost always led to gains over a 3-12 month time frame. So even if we do get the typical sentiment-induced pullback, it would be extremely rare if it led directly into a bear market, or even much beyond a 10% correction.
Active Studies
| Time Frame | Bullish | Bearish | | Short-Term | 0 | 0 | | Medium-Term | 5 | 8 | | Long-Term | 51 | 2 |
|
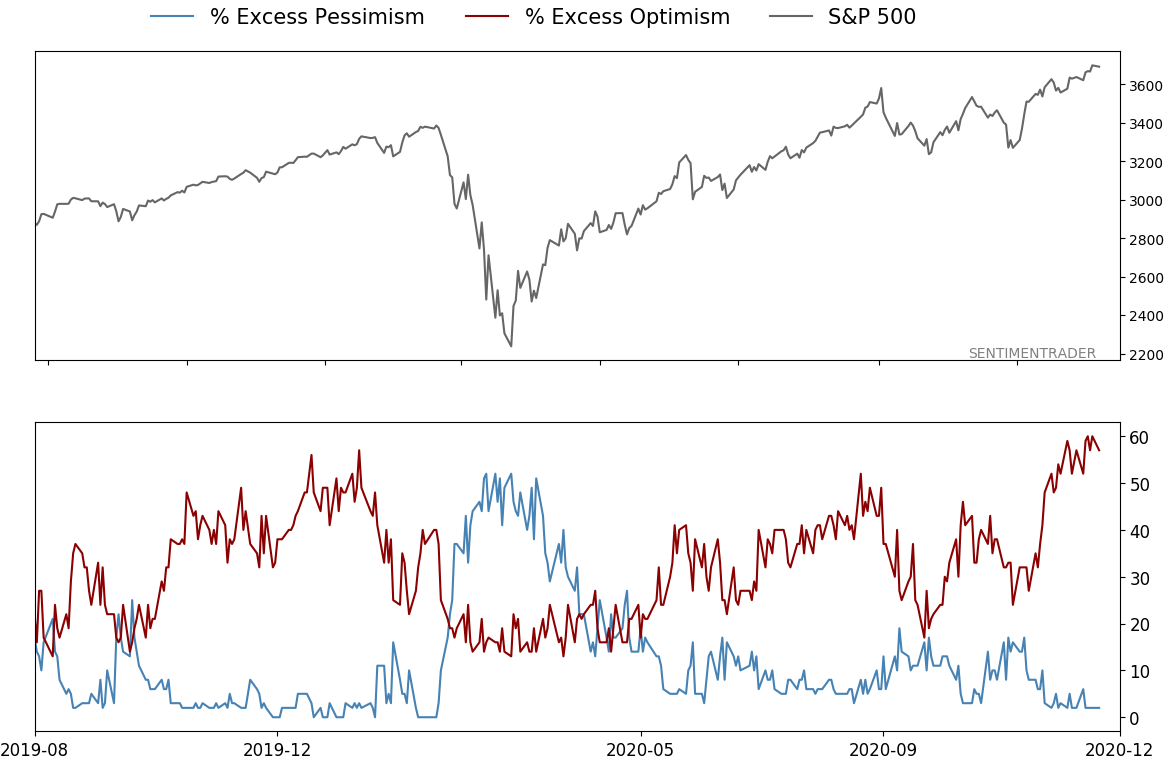
Indicators at Extremes
% Showing Pessimism: 2%
Bullish for Stocks
VIX
|
|
Portfolio
| Position | Description | Weight % | Added / Reduced | Date | | Stocks | 15.6% RSP, 10.1% VWO, 7.5% XLE, 5.1% PSCE | 41.2 | Added 5% | 2020-10-15 | | Bonds | 10% BND, 10% SCHP, 10% ANGL | 28.6 | Reduced 0.1% | 2020-10-02 | | Commodities | GCC | 2.4 | Reduced 2.1%
| 2020-09-04 | | Precious Metals | GDX | 9.5 | Added 4.8% | 2020-12-01 | | Special Situations | | 0.0 | Reduced 5% | 2020-10-02 | | Cash | | 18.3 | | |
|
Updates (Changes made today are underlined)
I've been quiet here because there hasn't been much to do. The things that were supposed to work have pretty much been doing so. With sentiment extremely stretched, I have no desire to add exposure there. About the only place I would add is energy, which has been following through exactly as it should. I did add back to my position in gold miners, due to the studies recently posted to the site. When gold (and miners) have pulled back after momentum like they enjoyed since March, the typical reaction is a resumption of the uptrend over the medium-term, and not a rollover into a bear phase. The continued weakness in the dollar certainly helps. RETURN YTD: 7.3% 2019: 12.6%, 2018: 0.6%, 2017: 3.8%, 2016: 17.1%, 2015: 9.2%, 2014: 14.5%, 2013: 2.2%, 2012: 10.8%, 2011: 16.5%, 2010: 15.3%, 2009: 23.9%, 2008: 16.2%, 2007: 7.8%
|
|
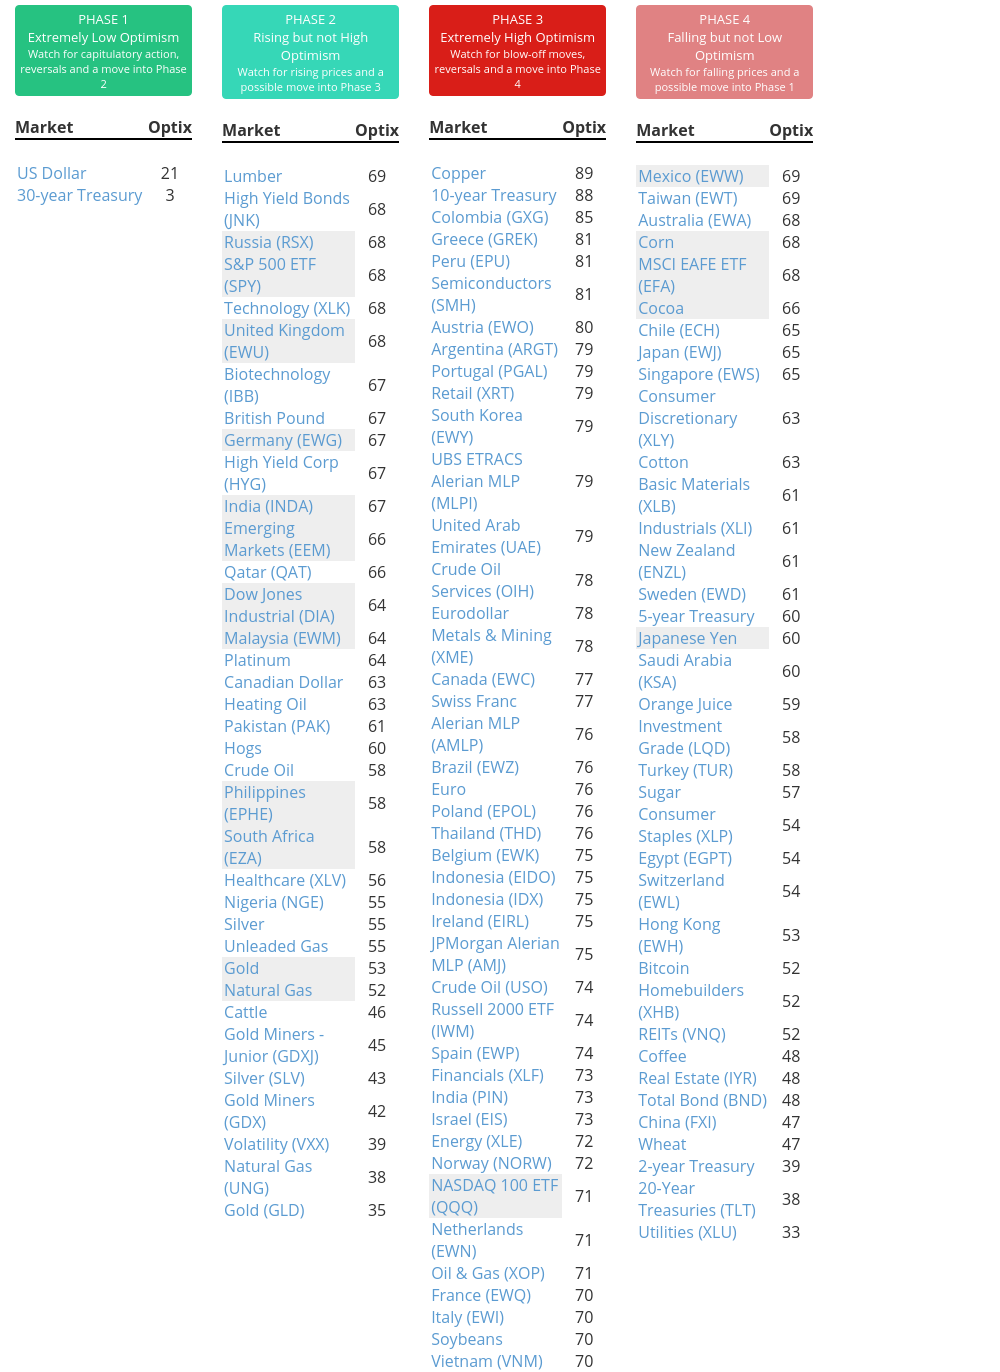
Phase Table
Ranks
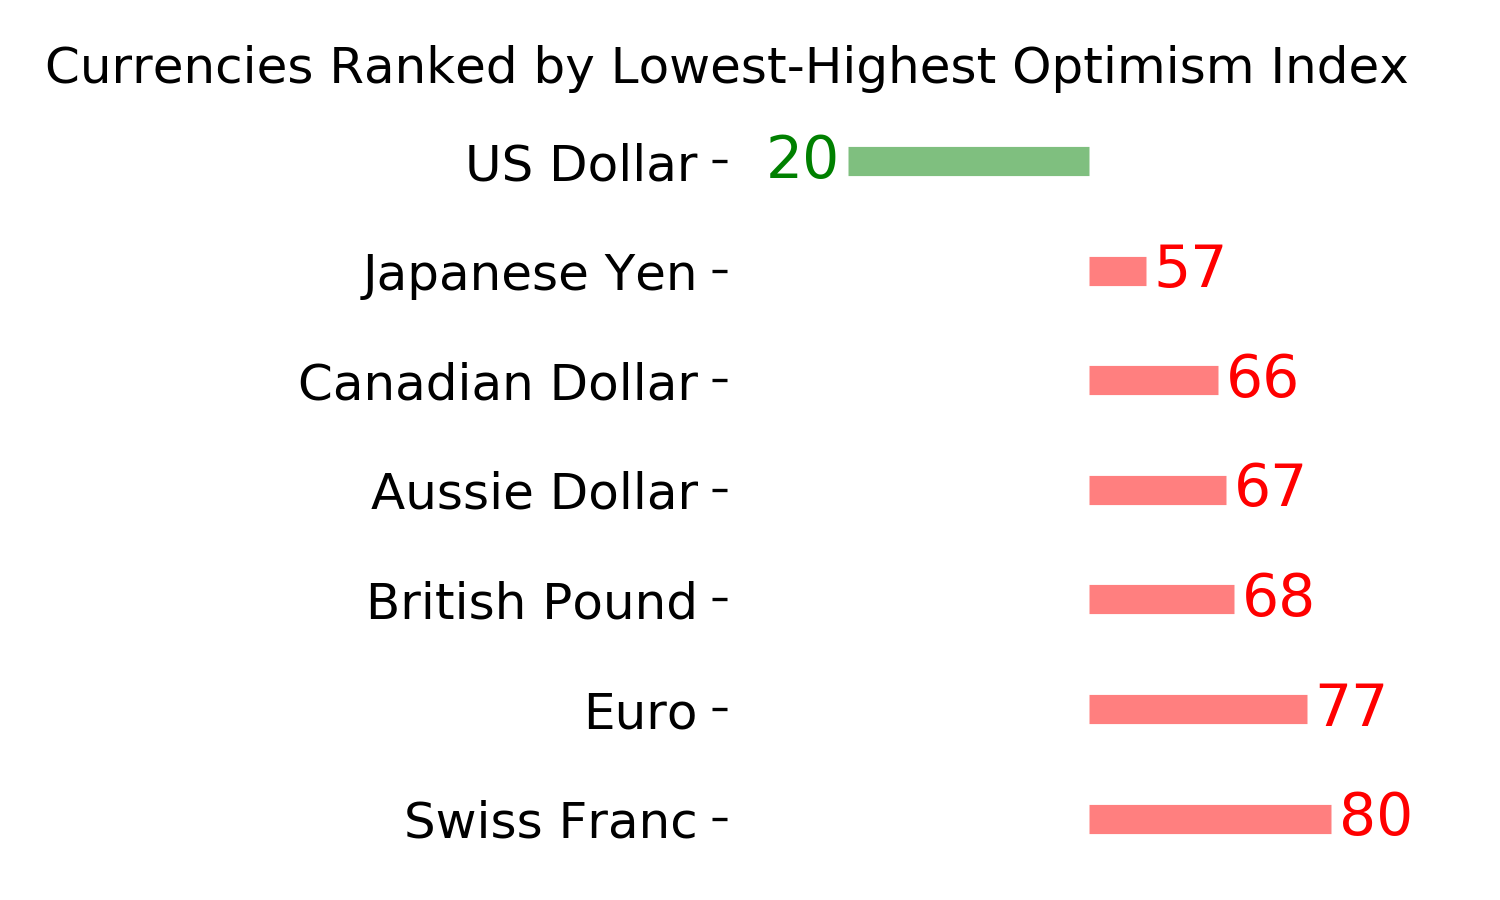
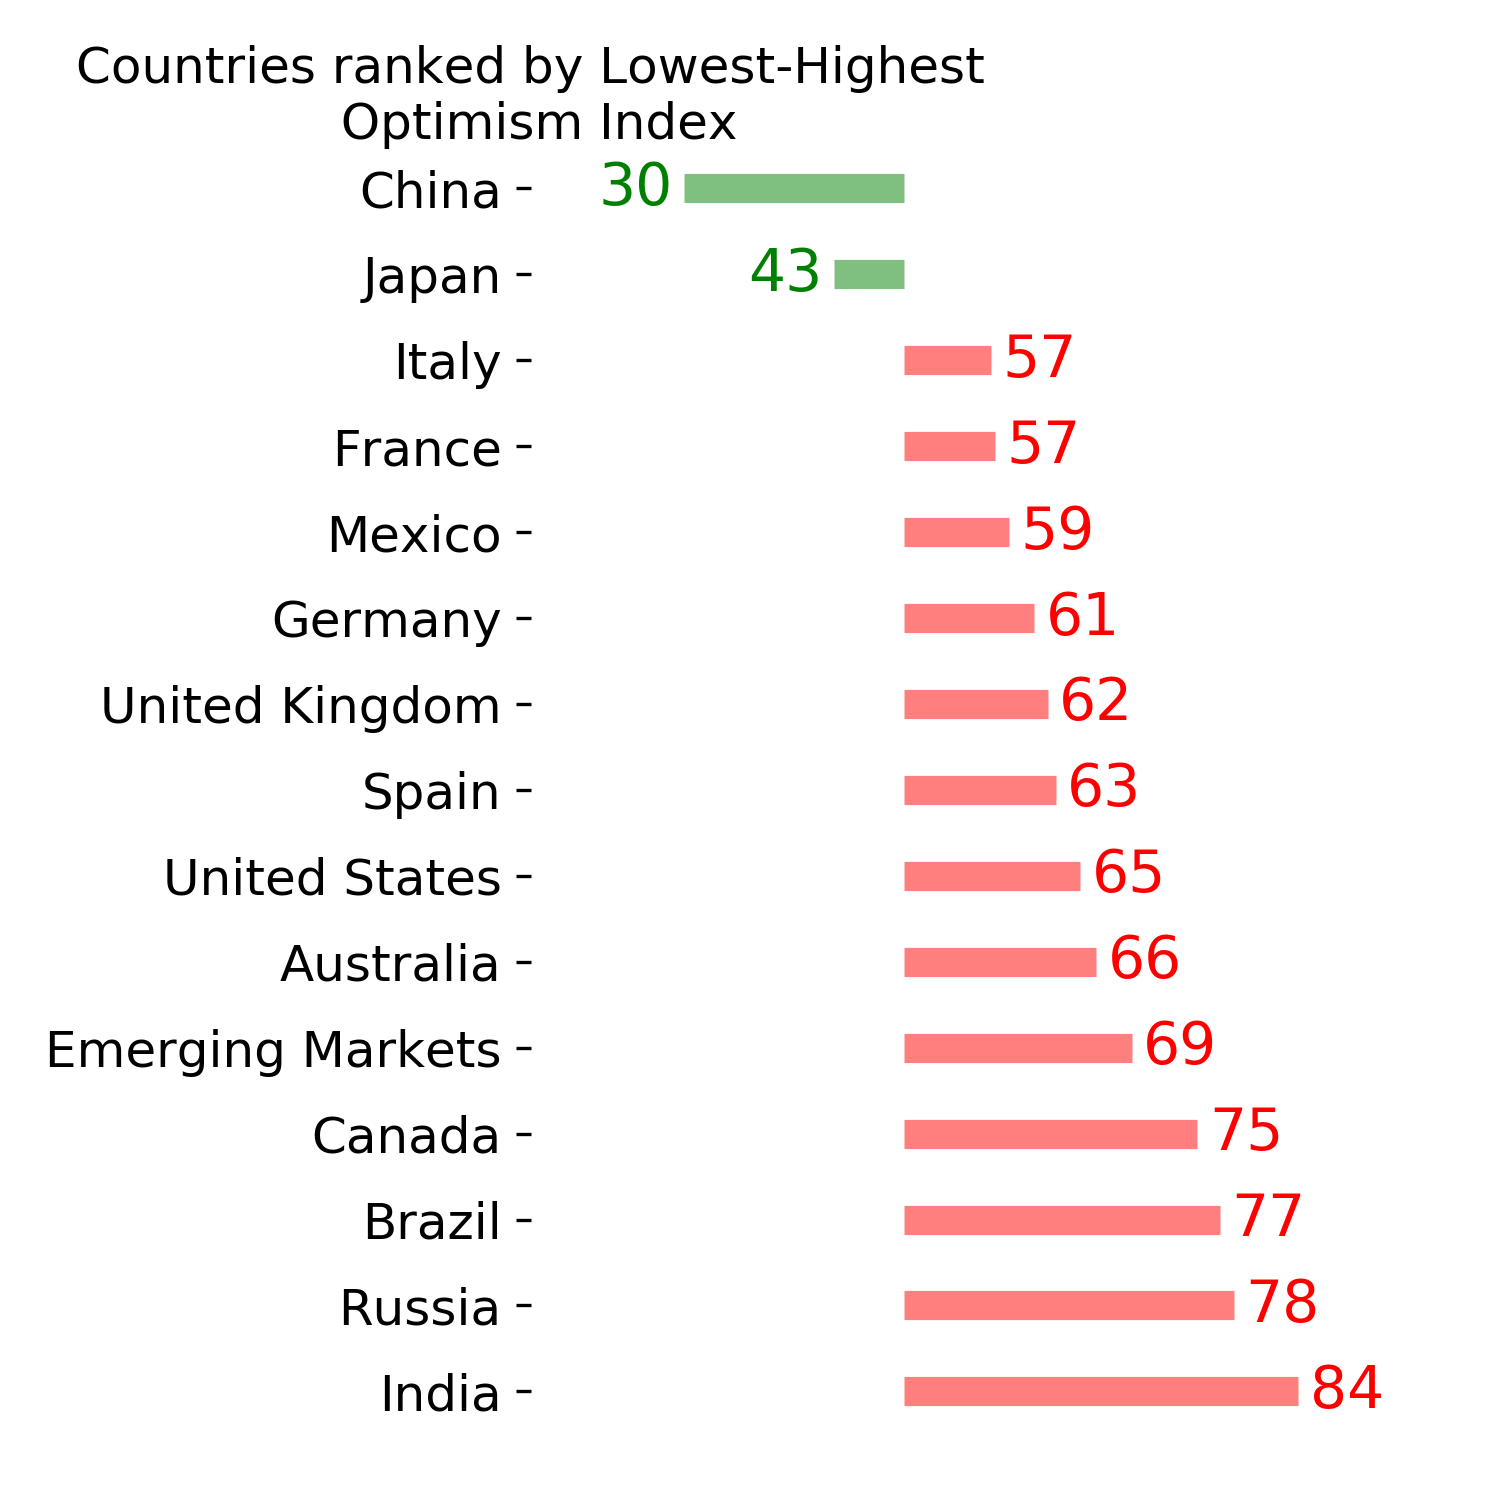
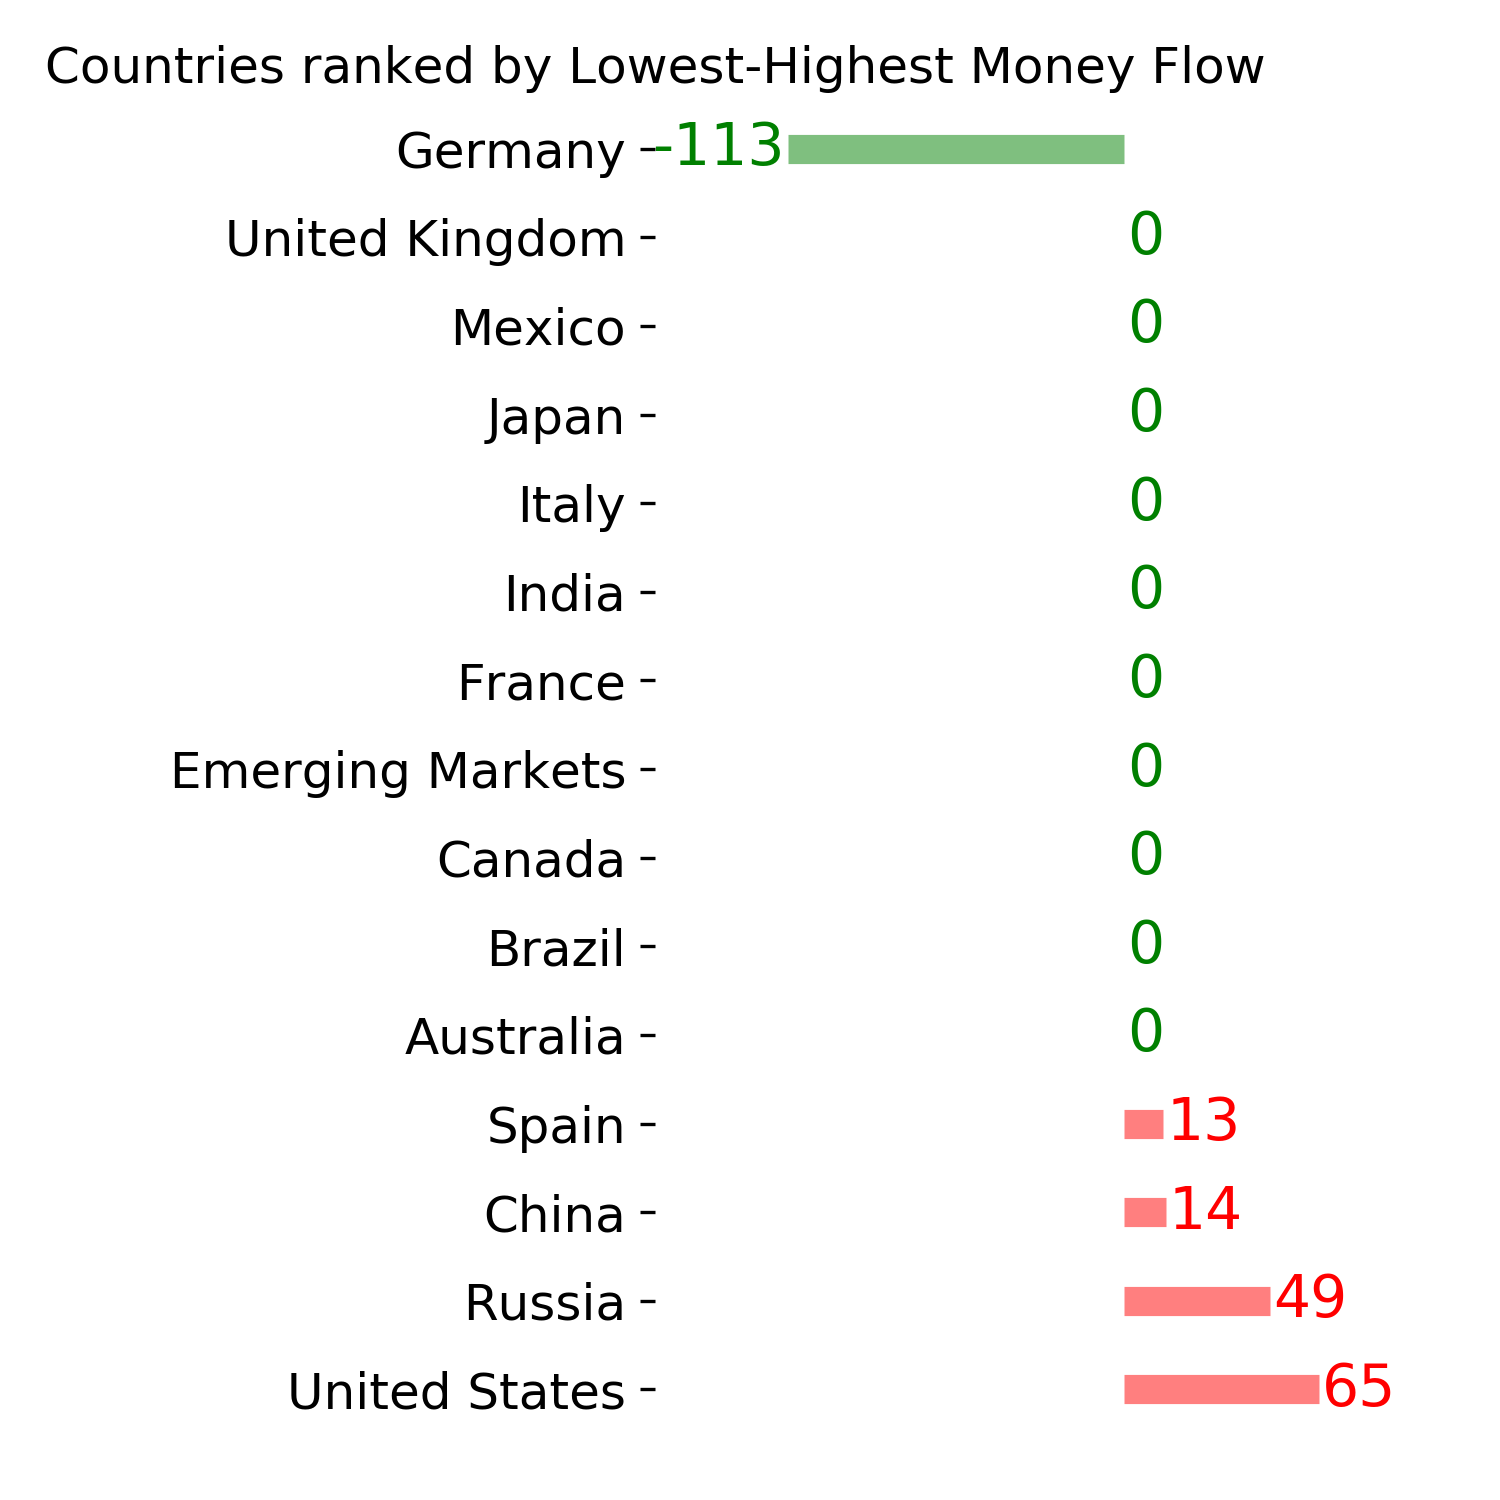
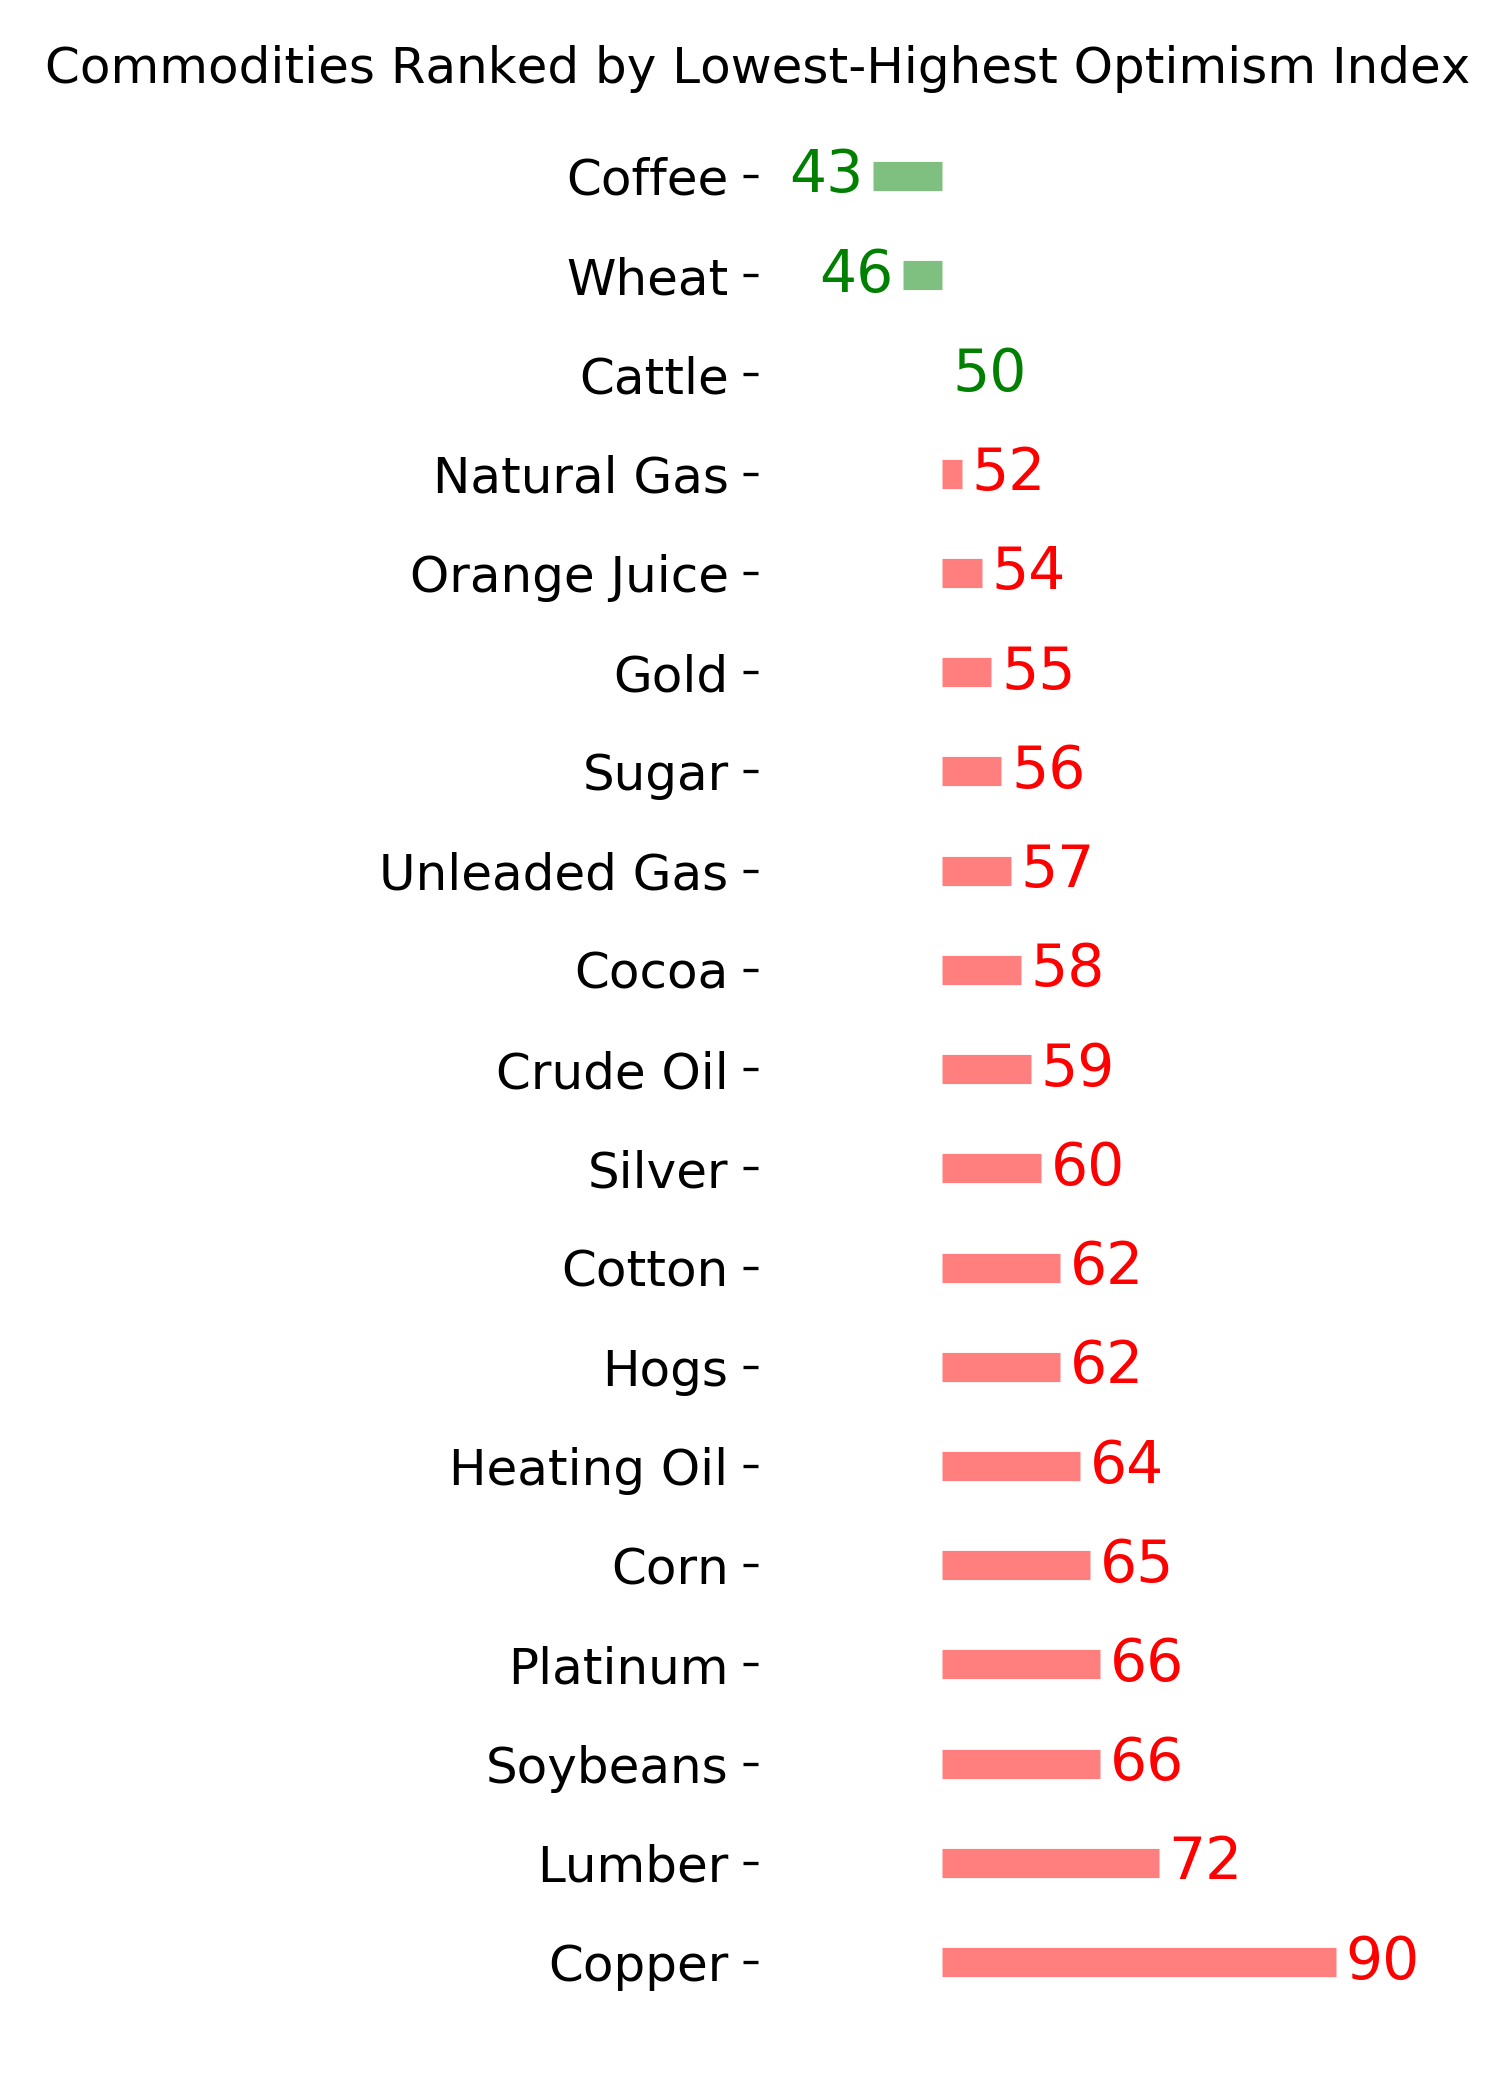
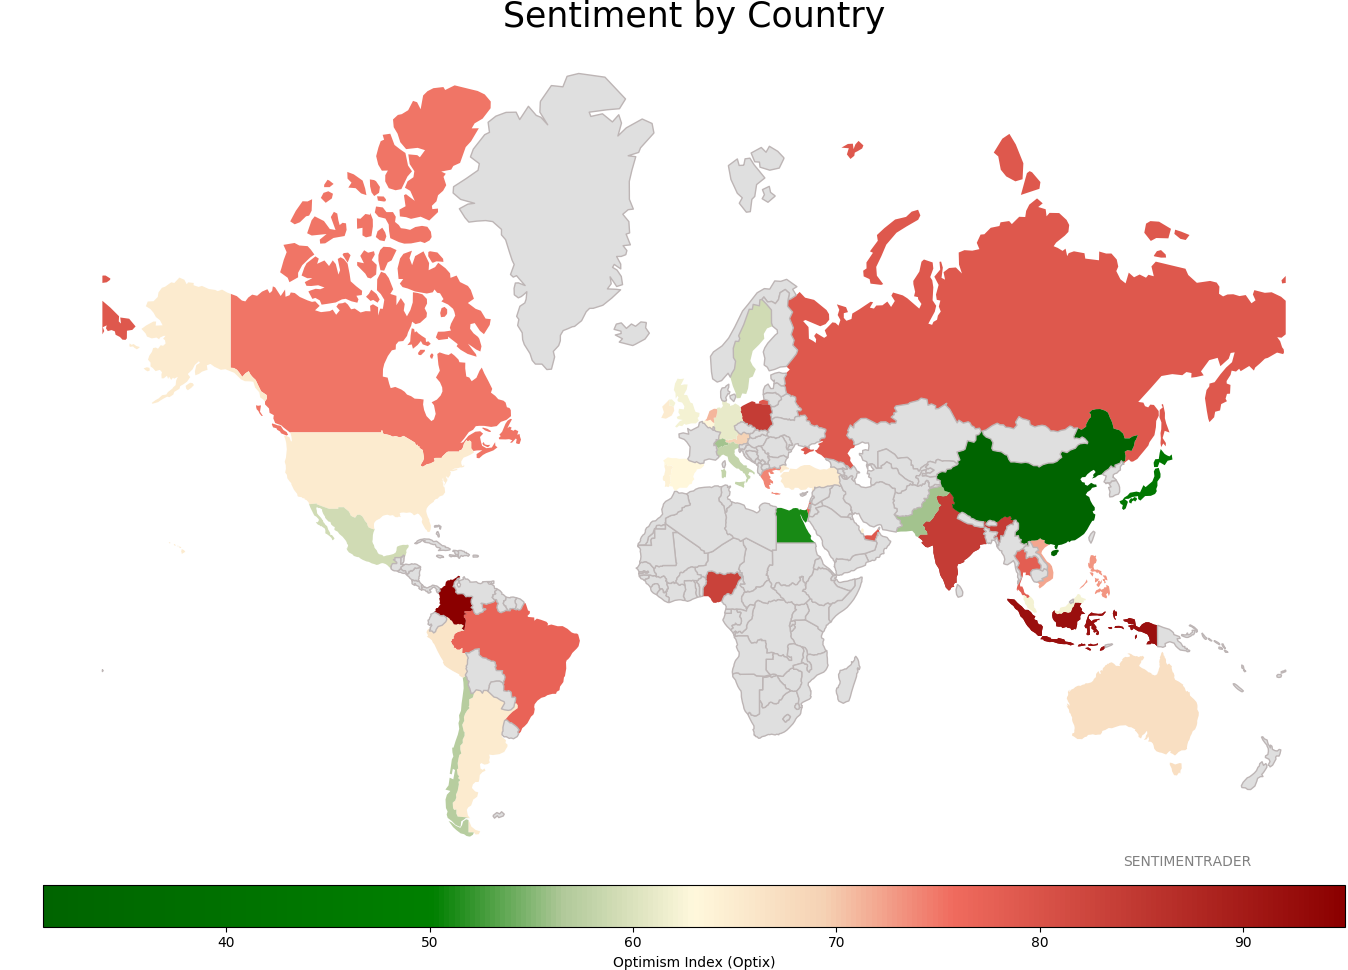
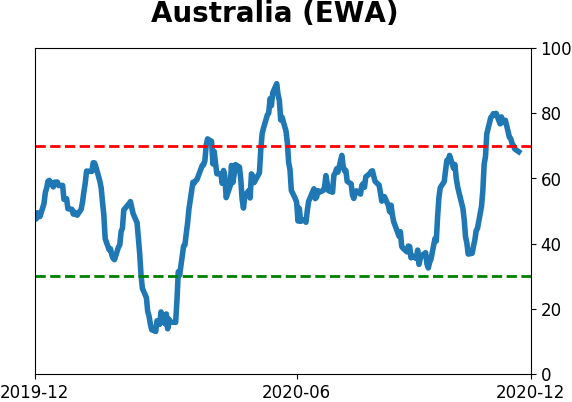
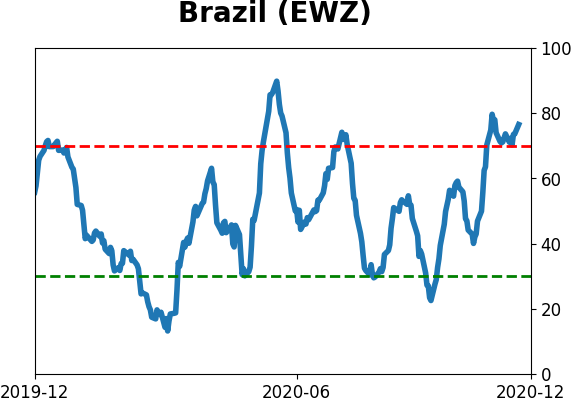
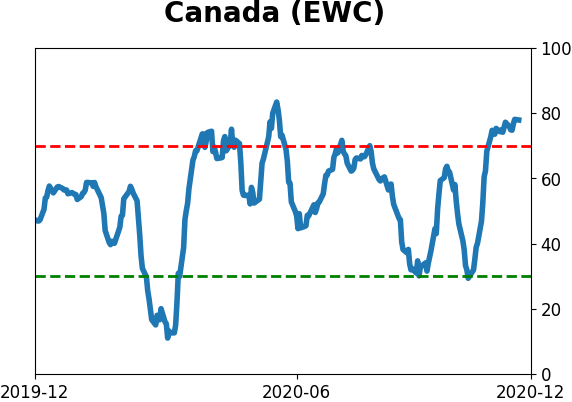
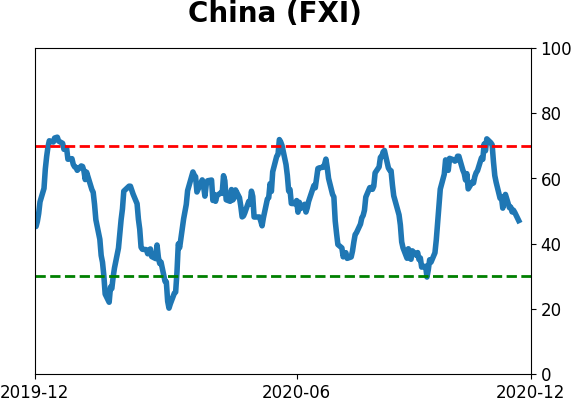
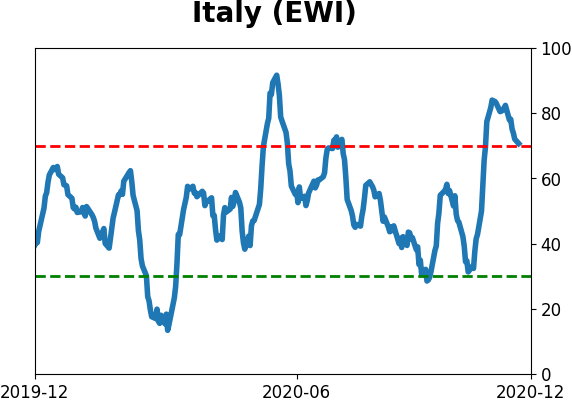
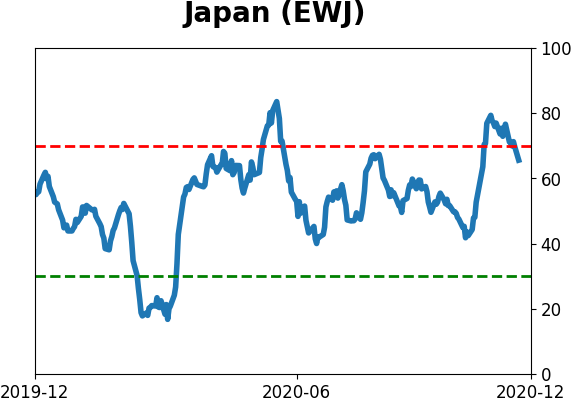
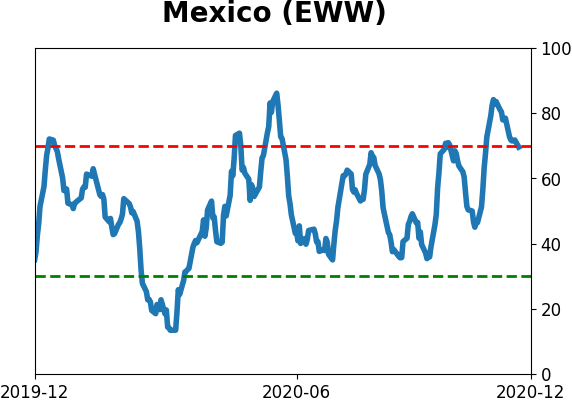
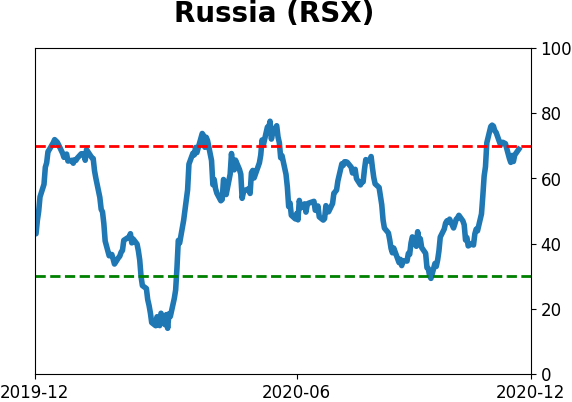
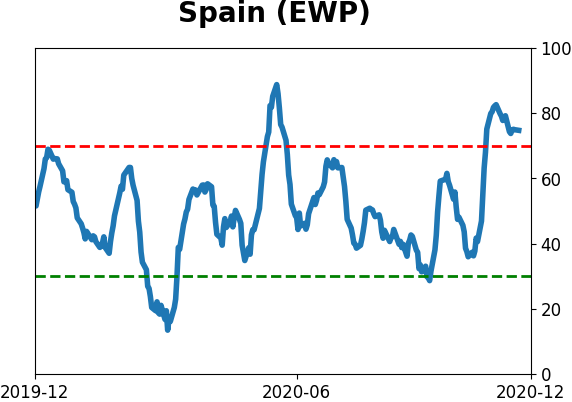
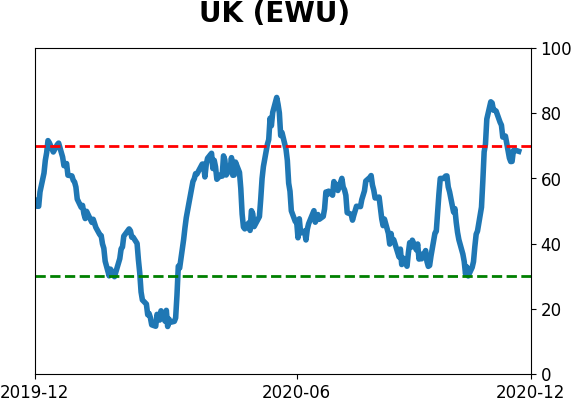
Sentiment Around The World
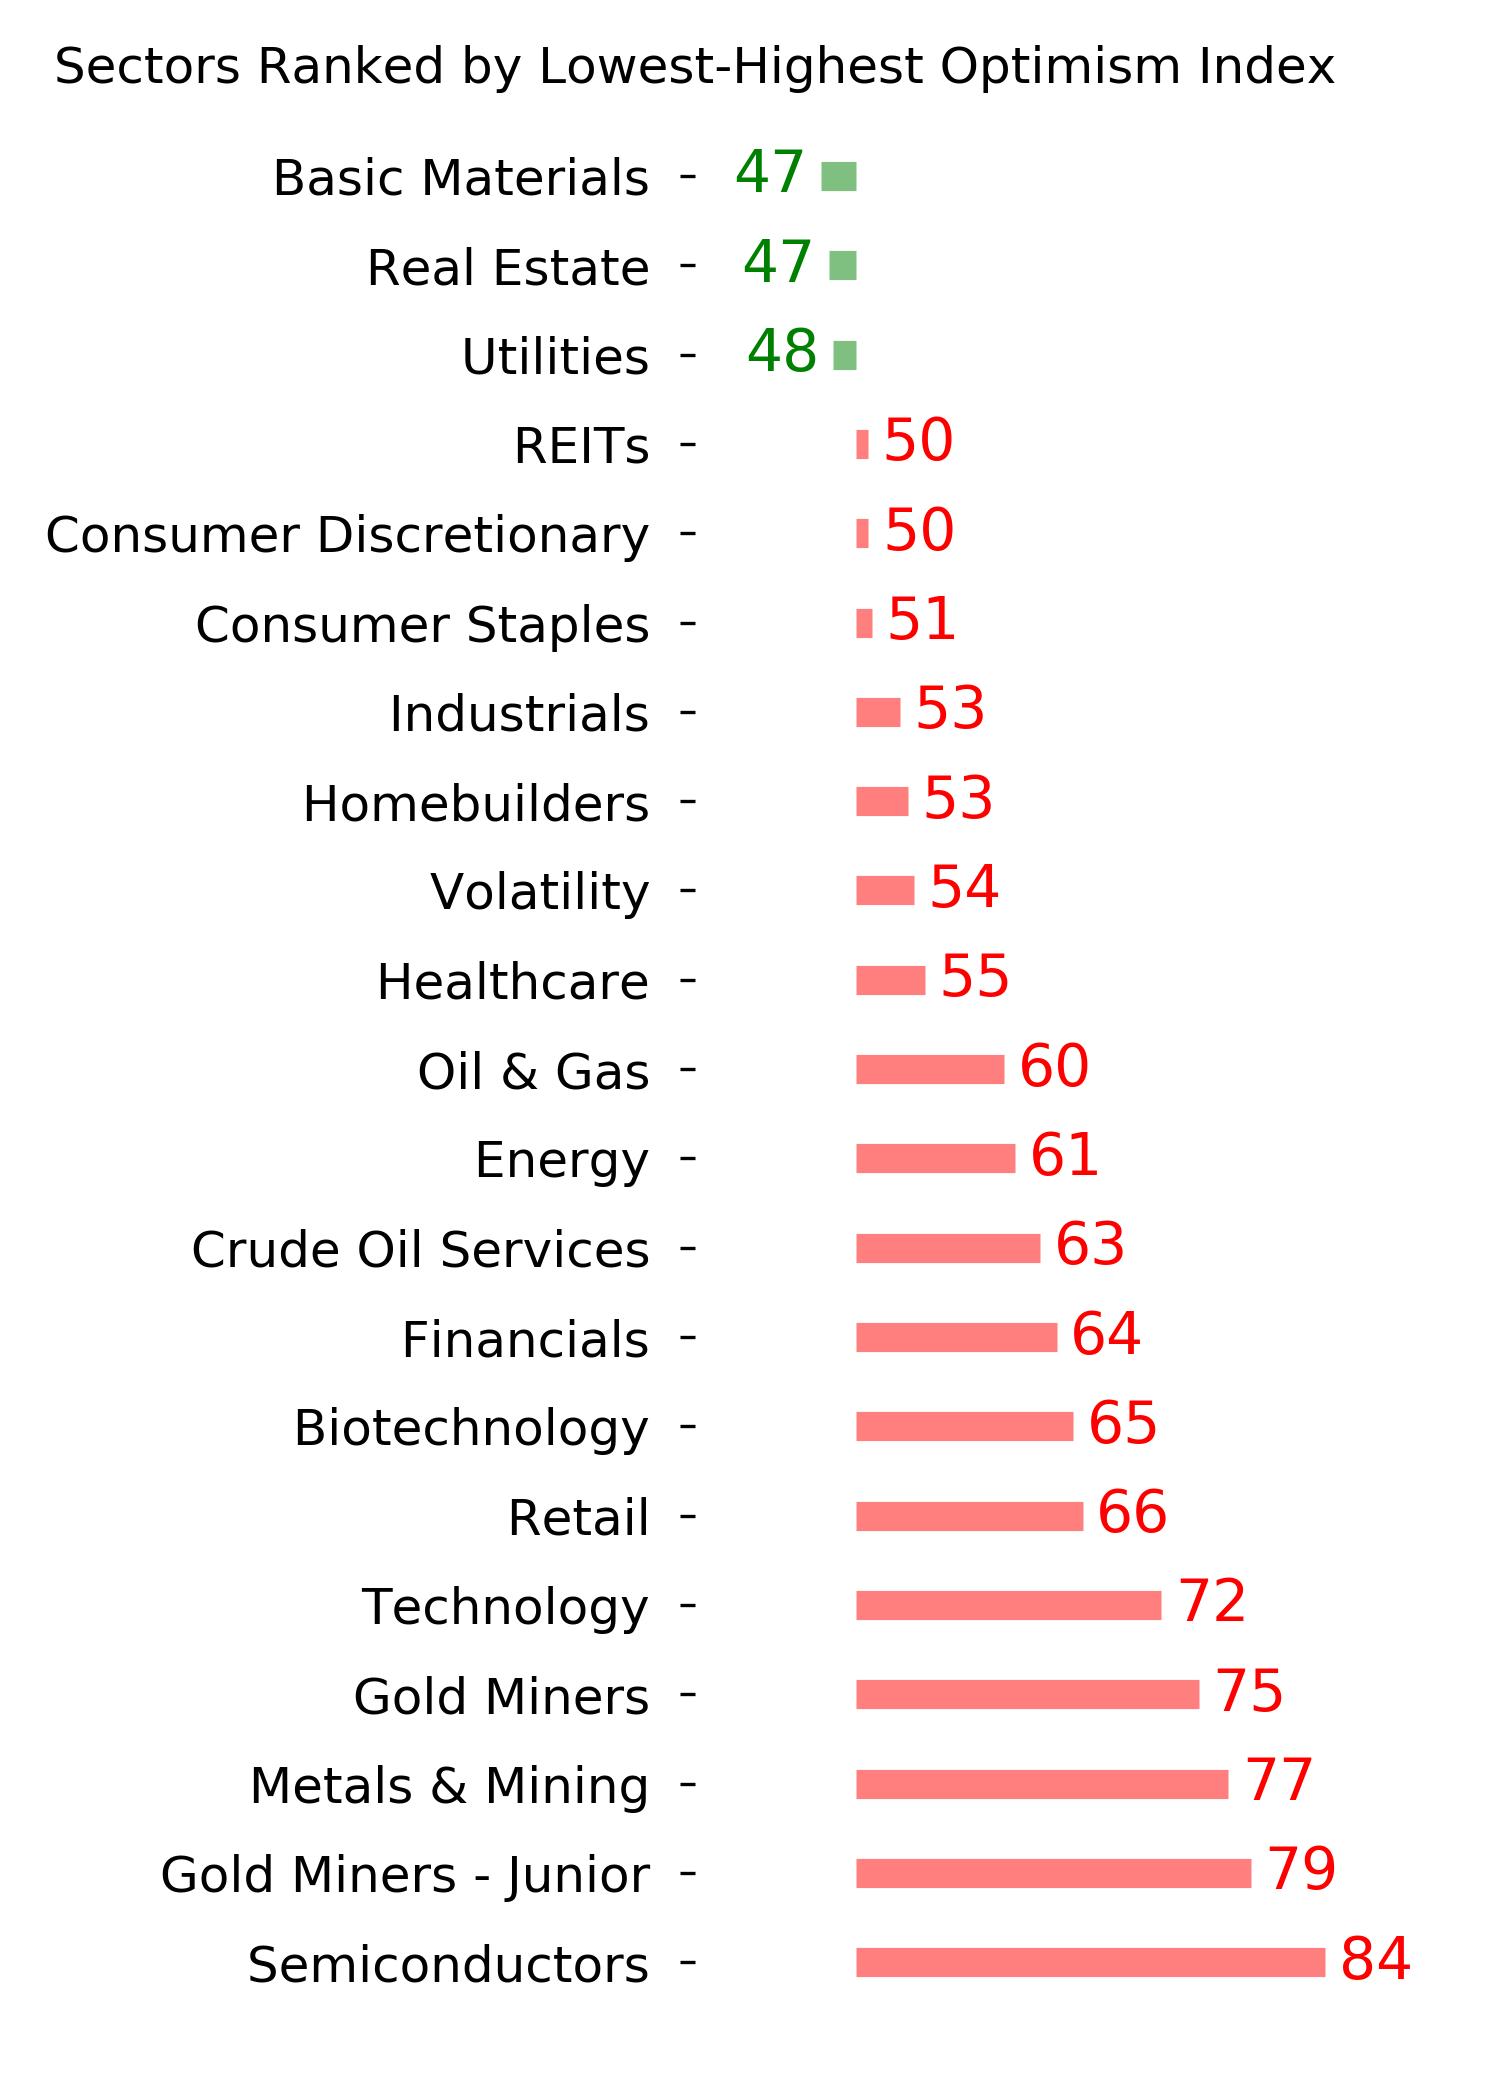
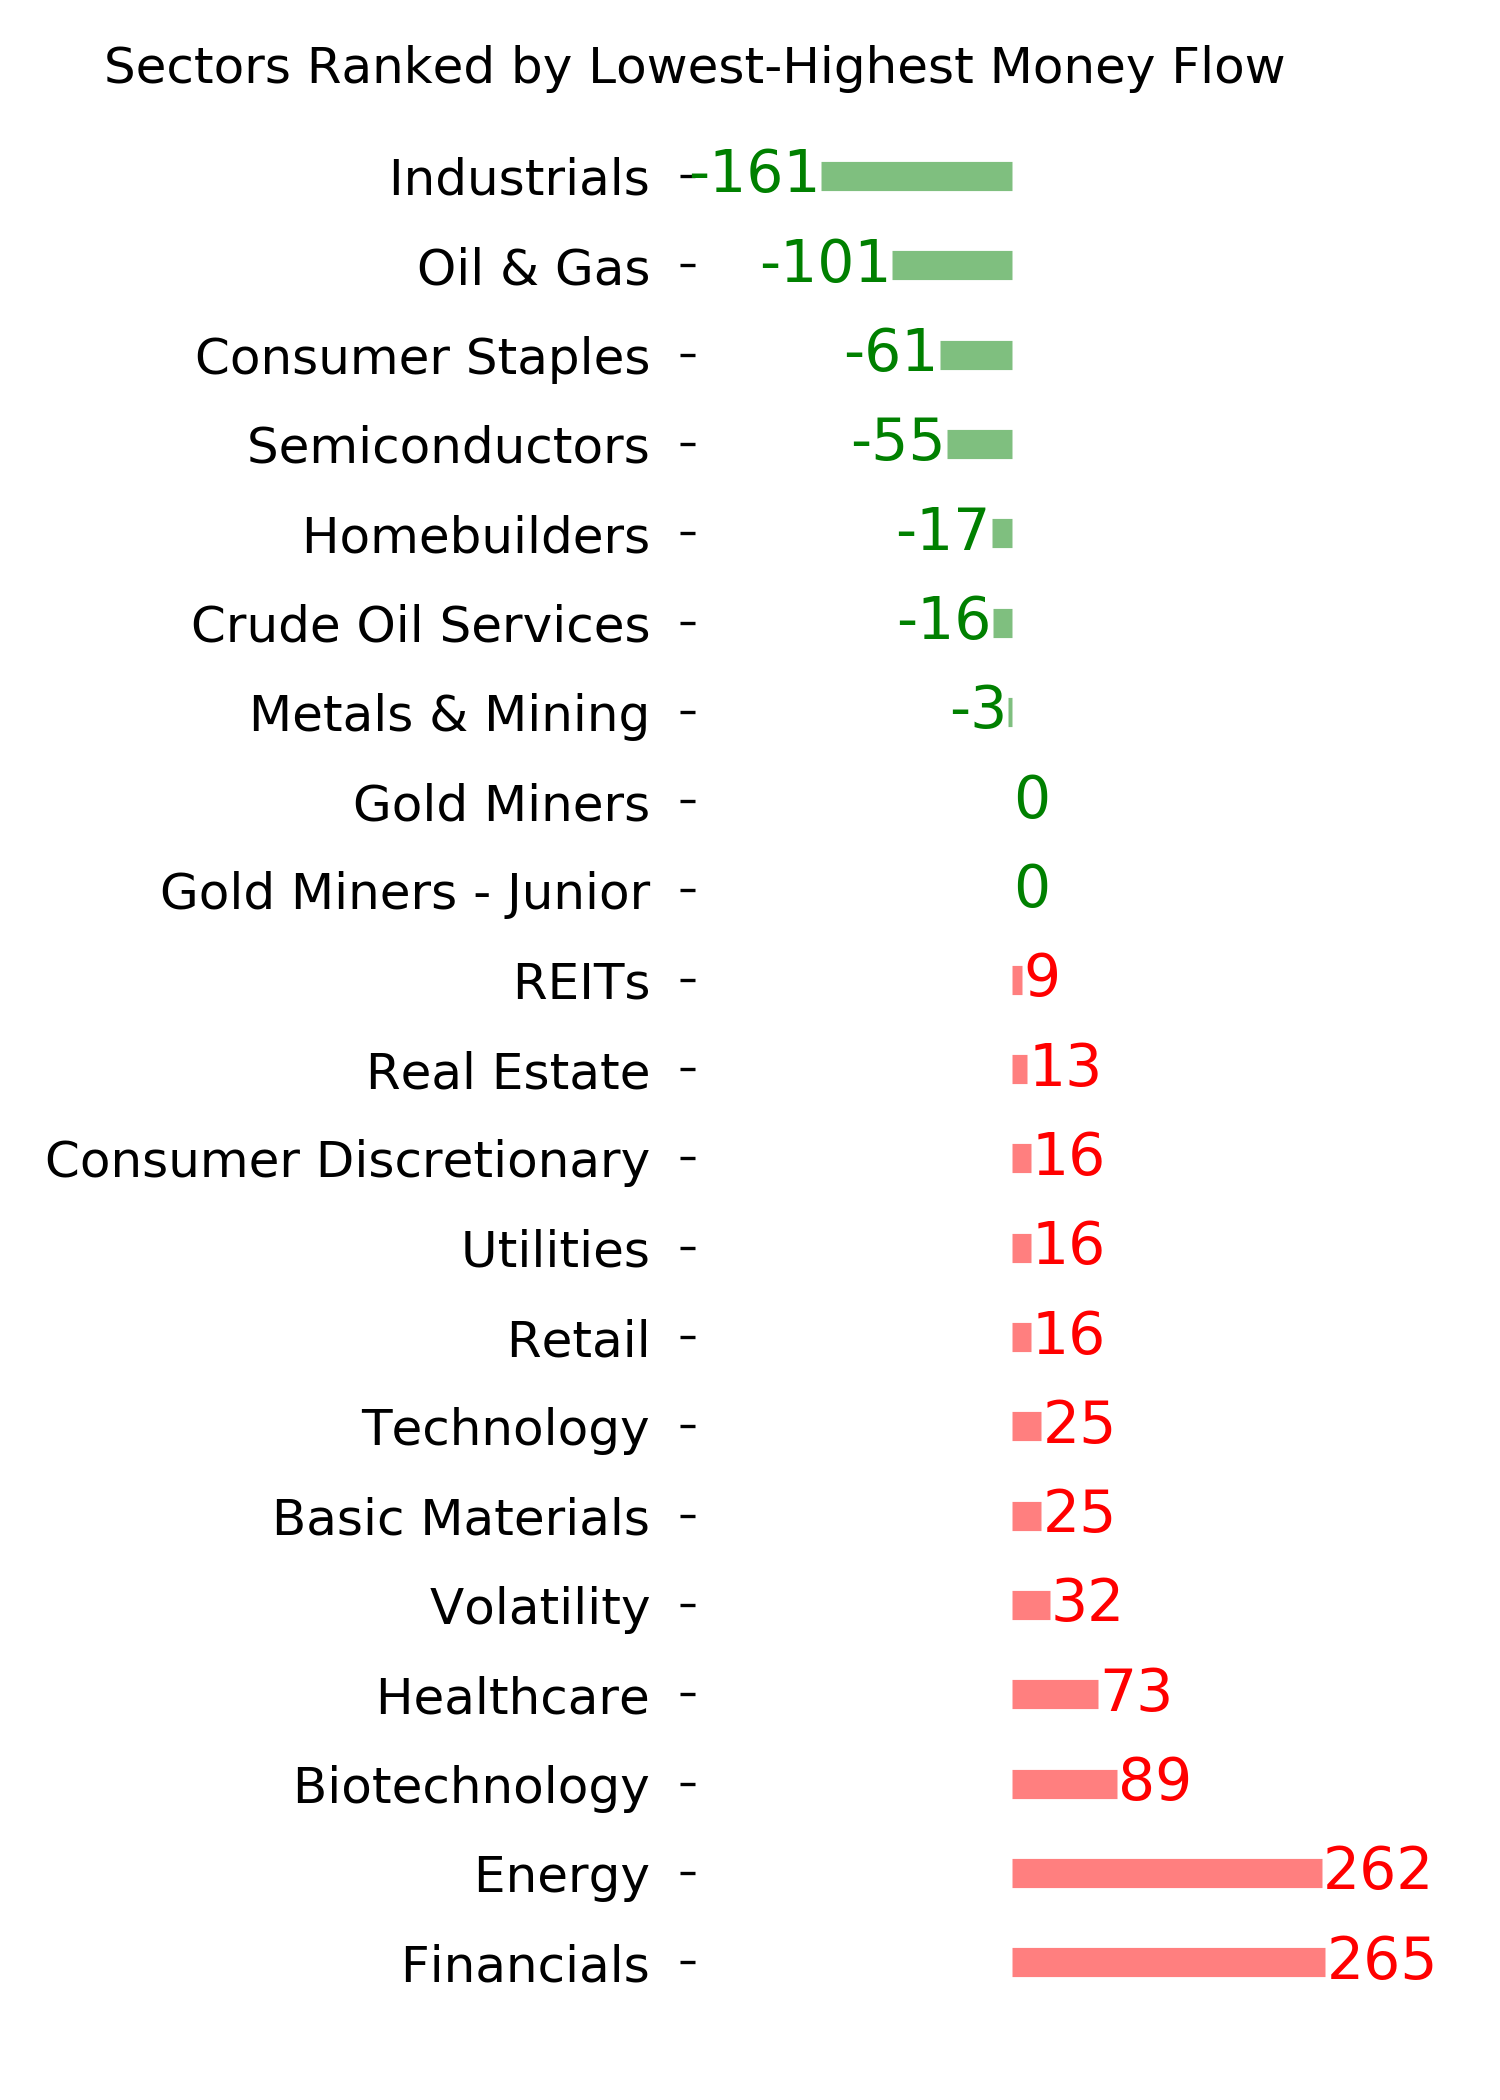
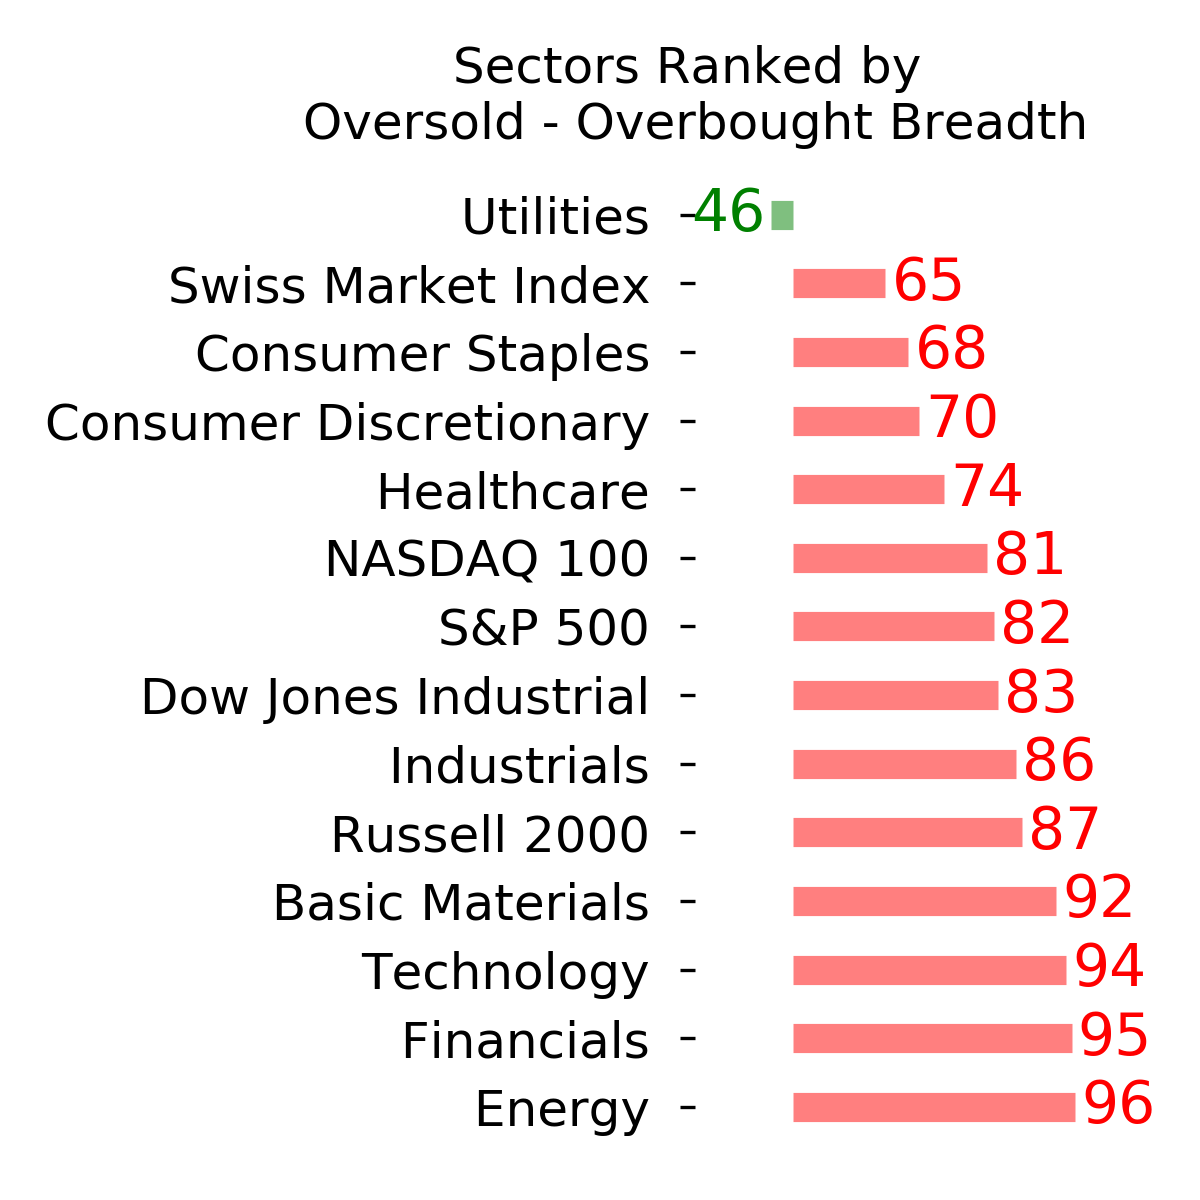
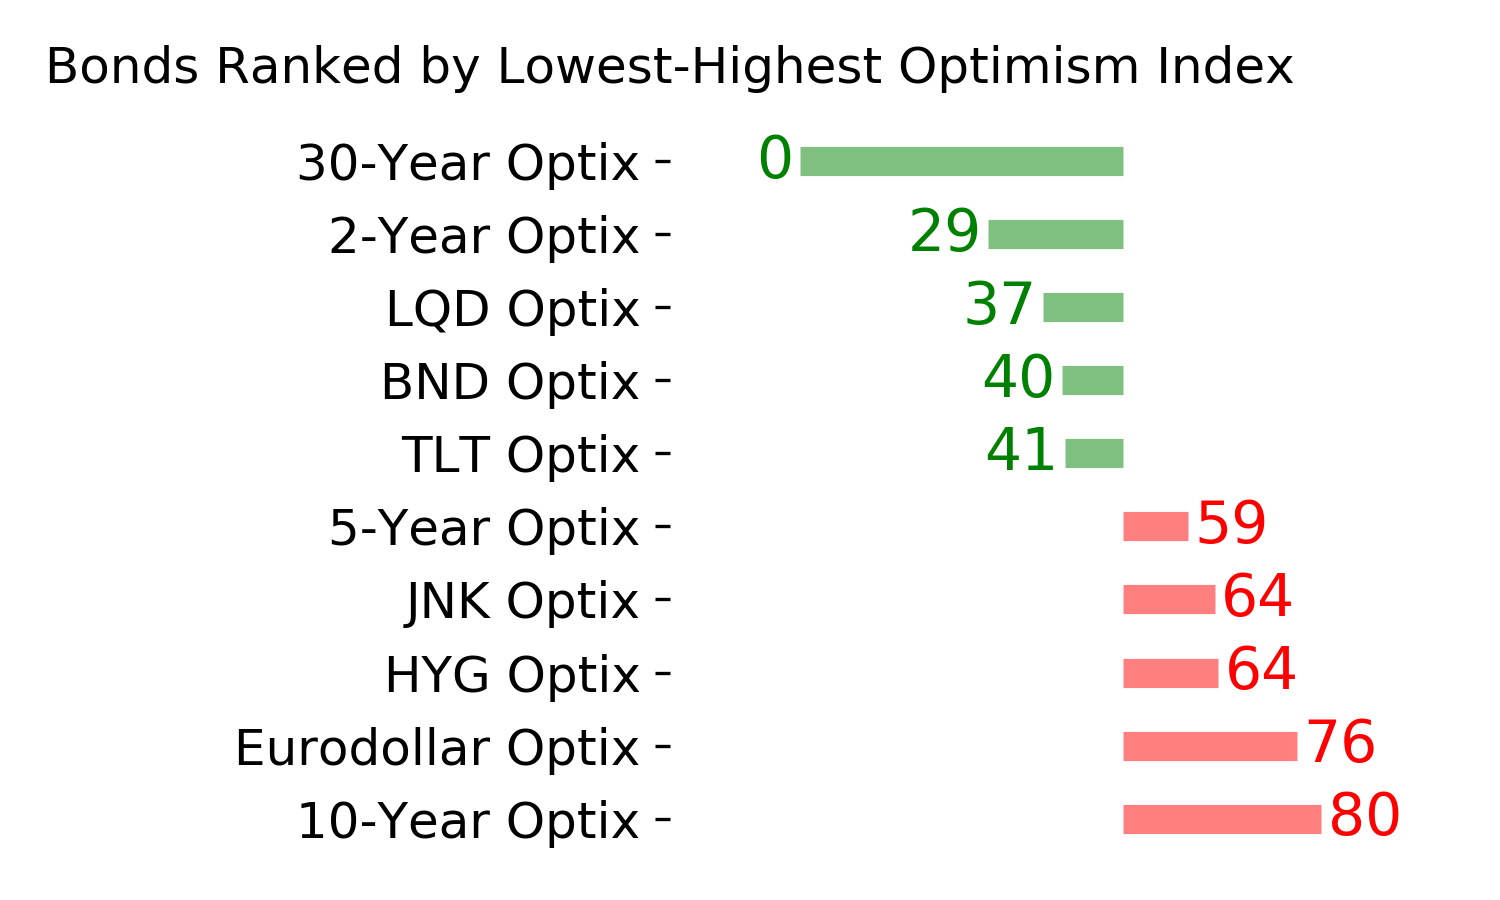
Optimism Index Thumbnails
|
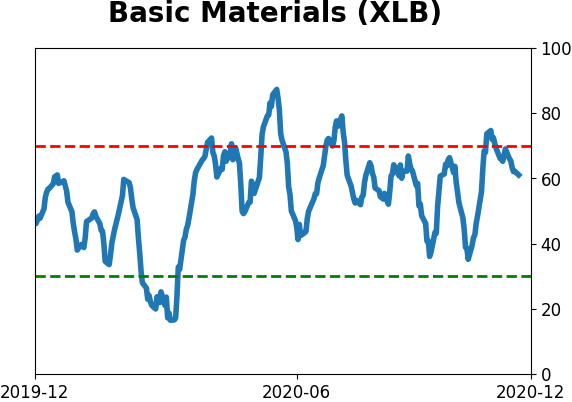
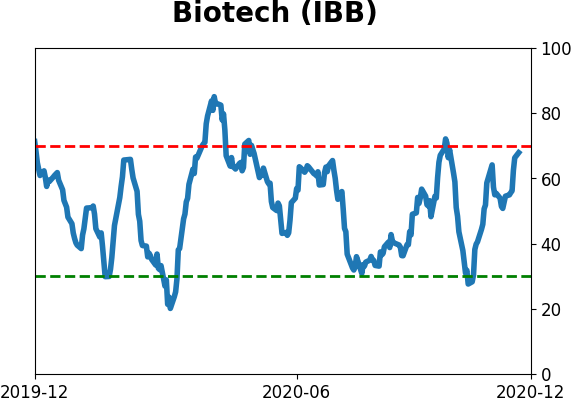
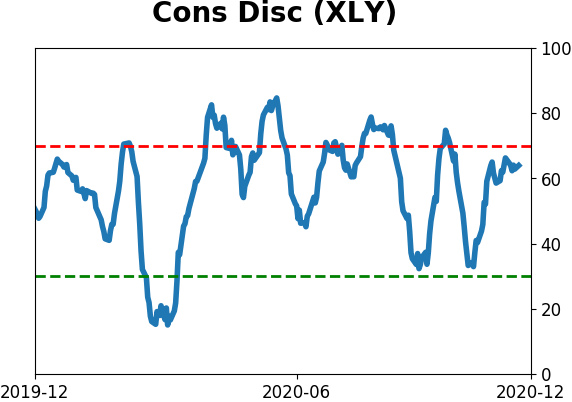
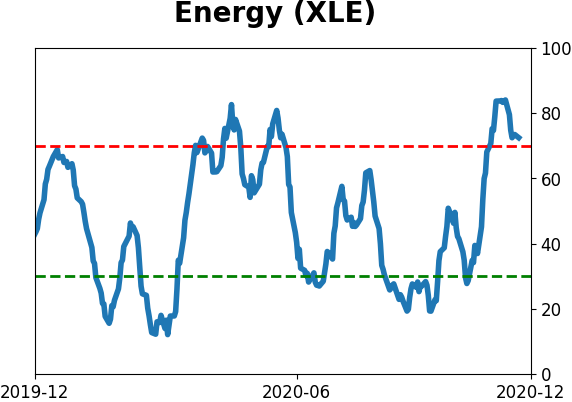
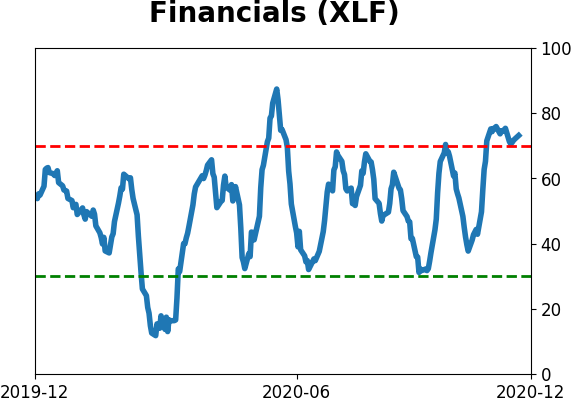
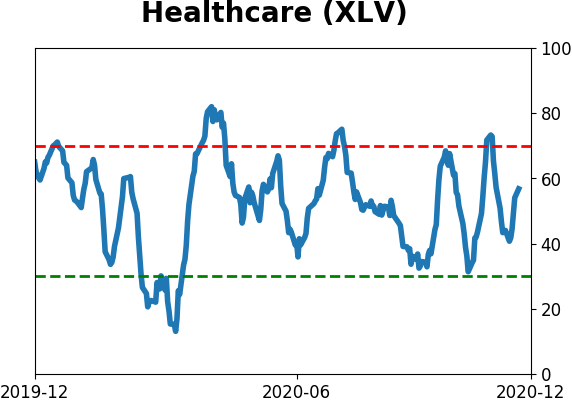
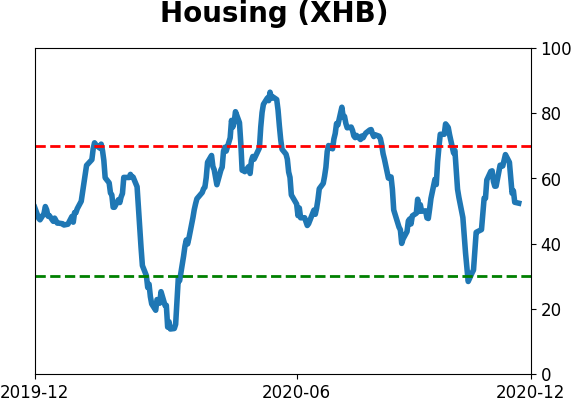
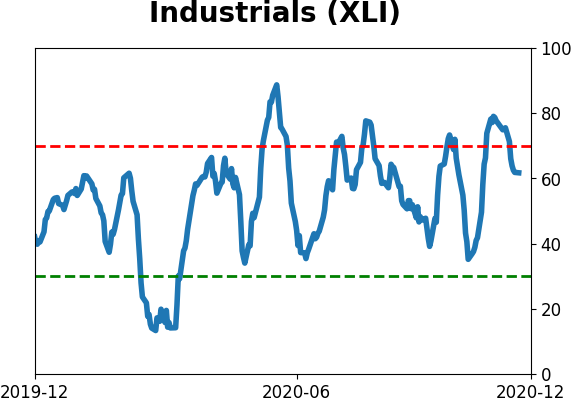
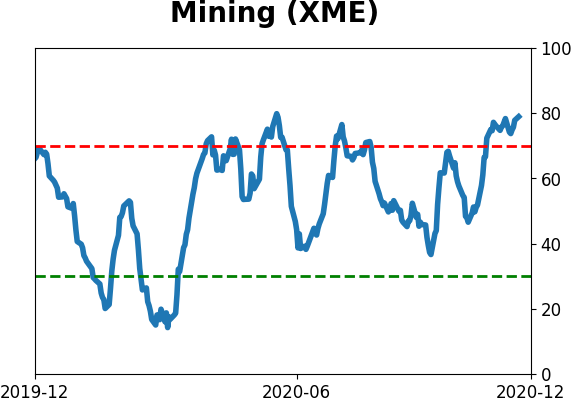
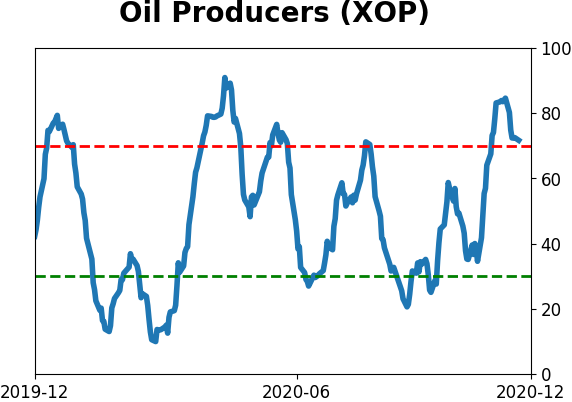
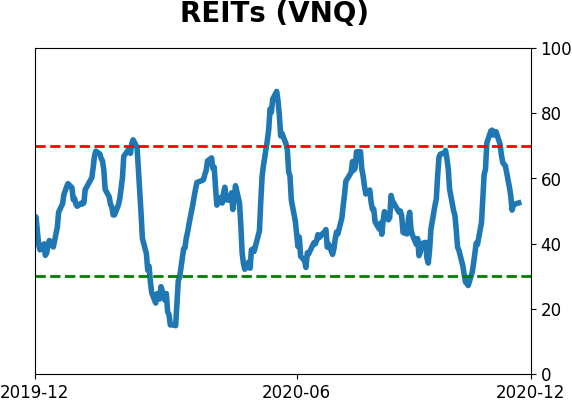
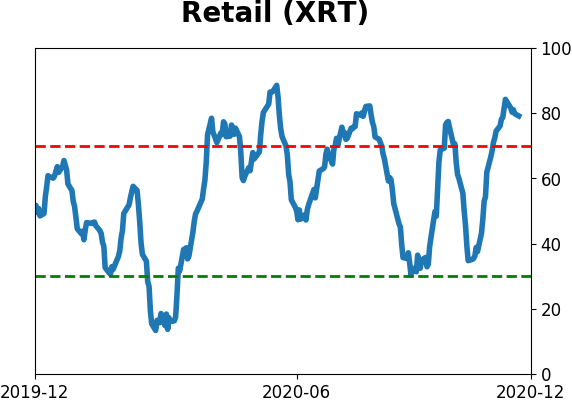
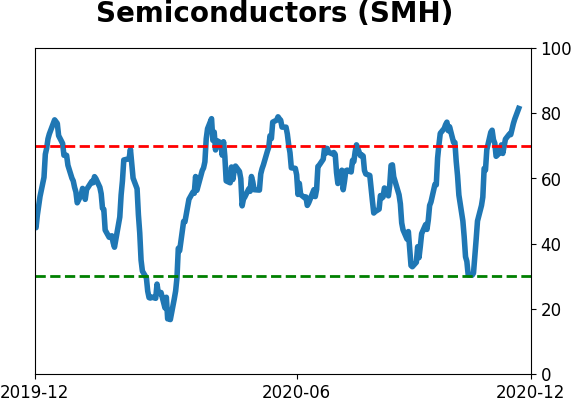
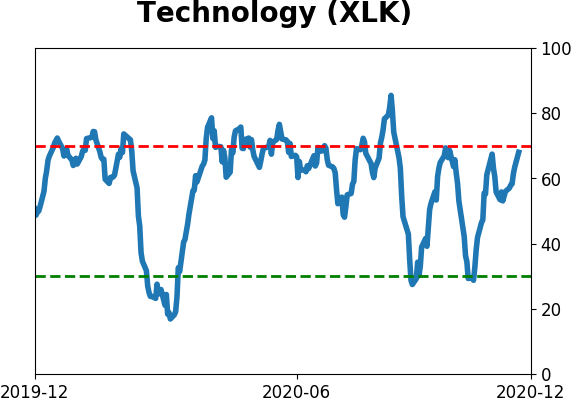
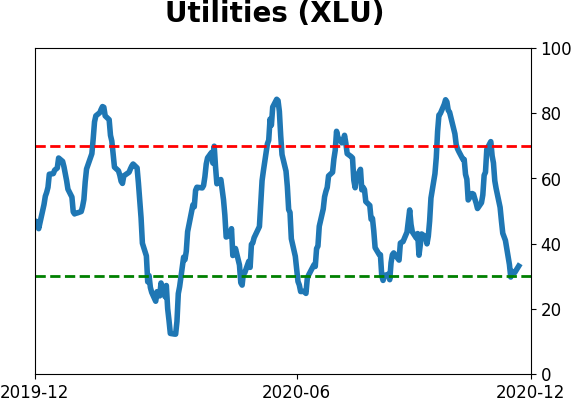
Sector ETF's - 10-Day Moving Average
|
|
|
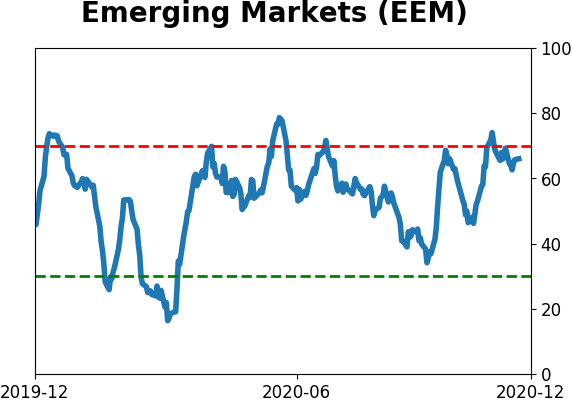
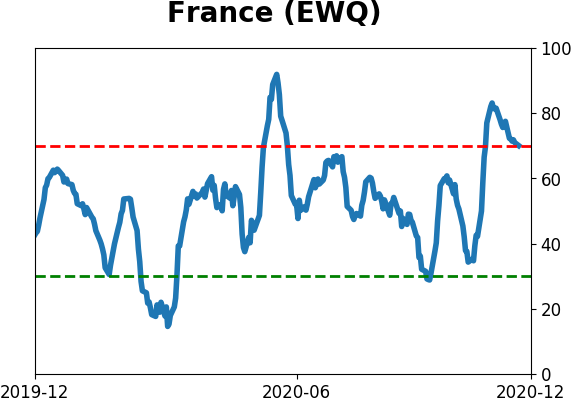
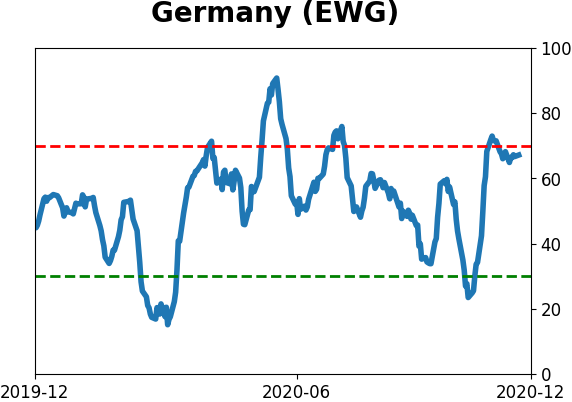
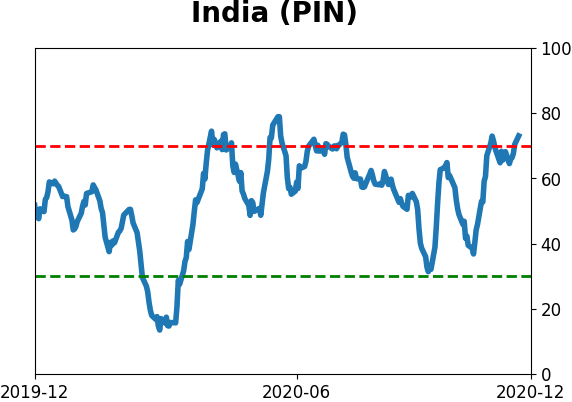
Country ETF's - 10-Day Moving Average
|
|
|
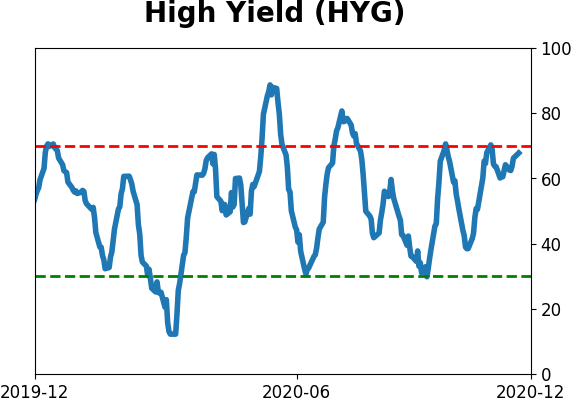
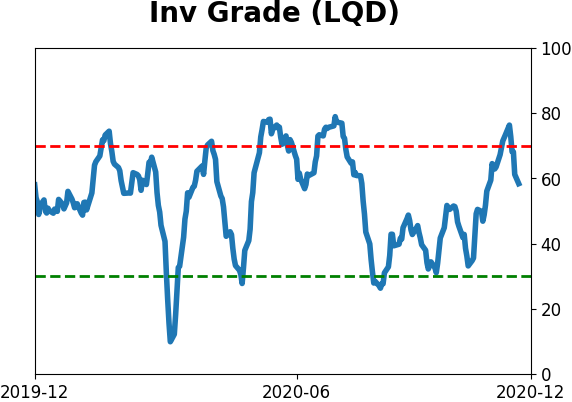
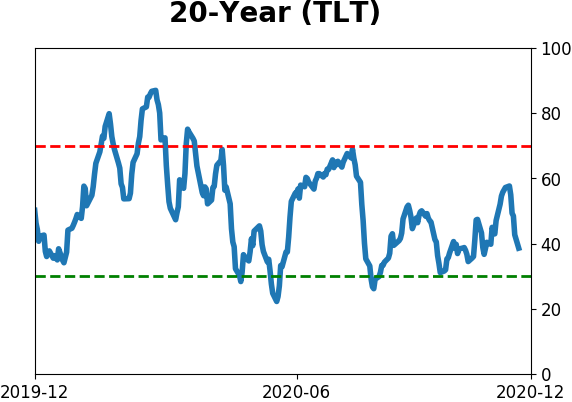
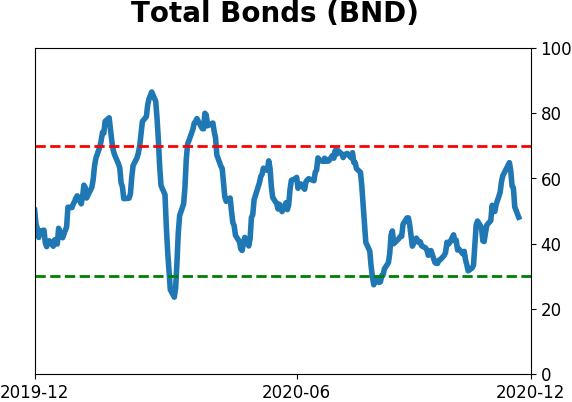
Bond ETF's - 10-Day Moving Average
|
|
|
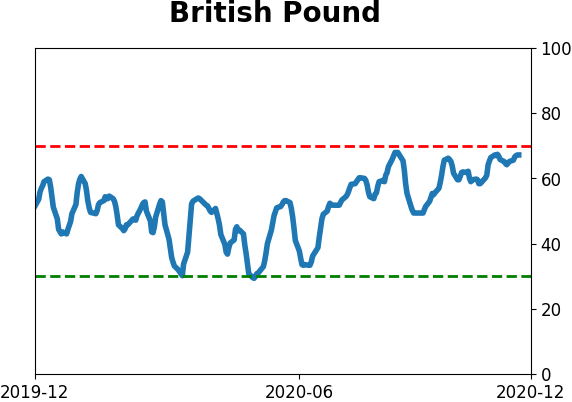
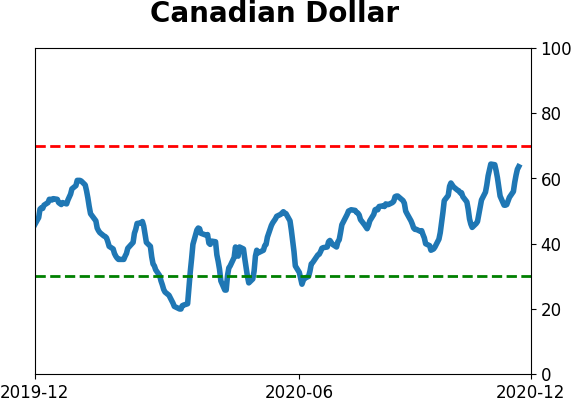
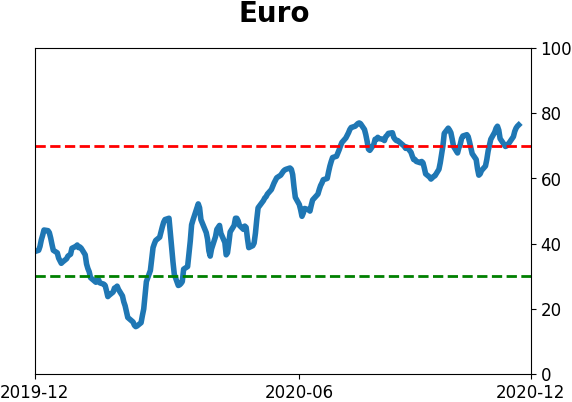
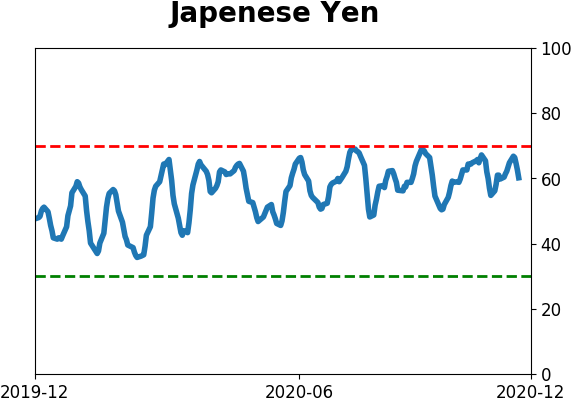
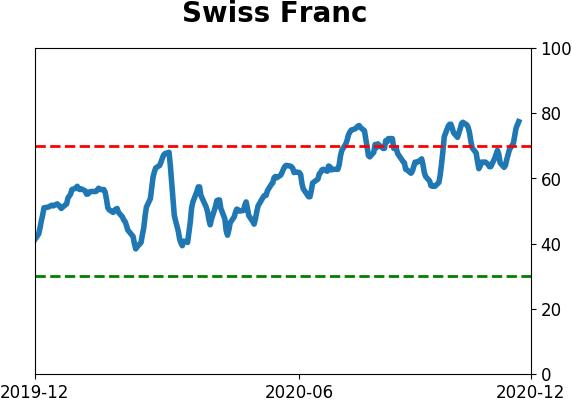
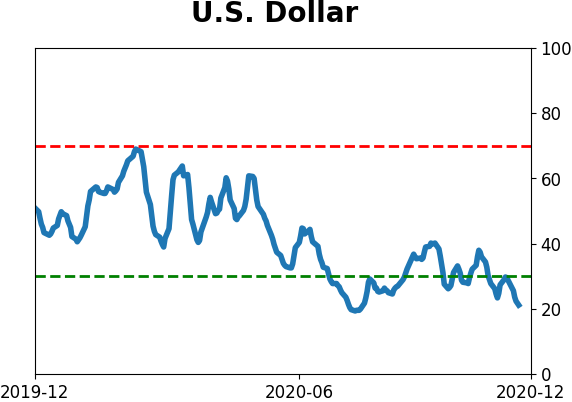
Currency ETF's - 5-Day Moving Average
|
|
|
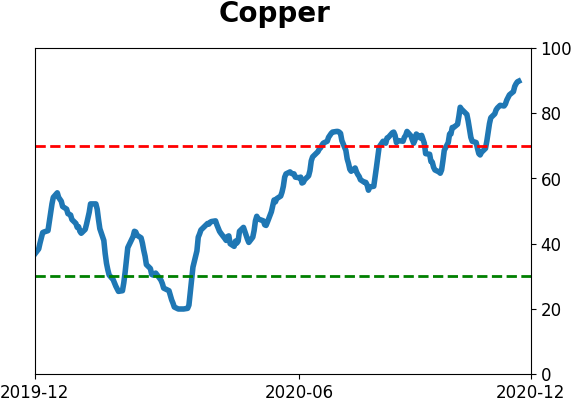
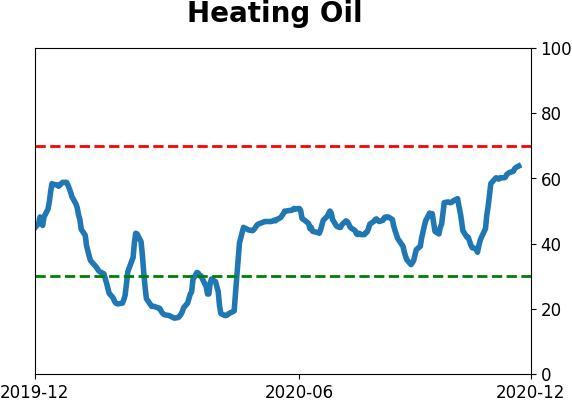
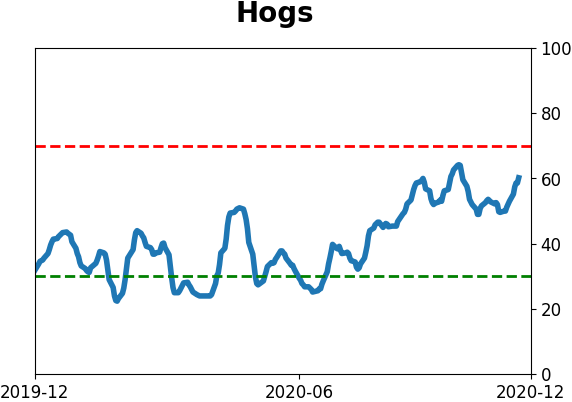
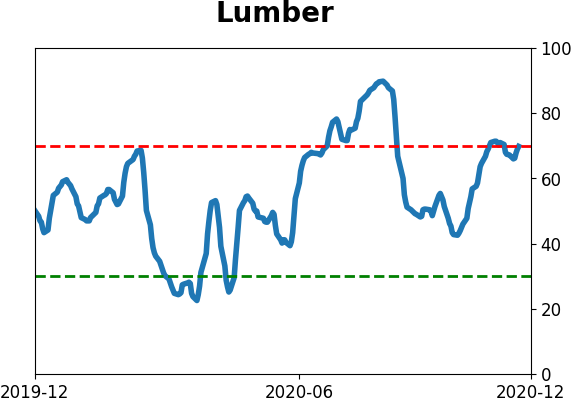
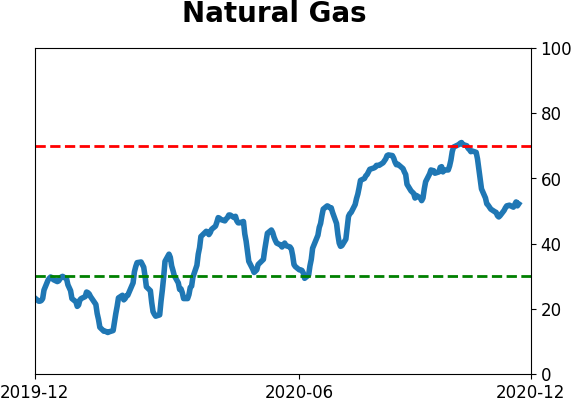
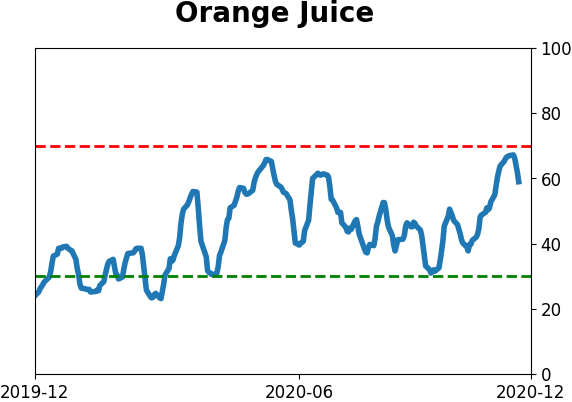
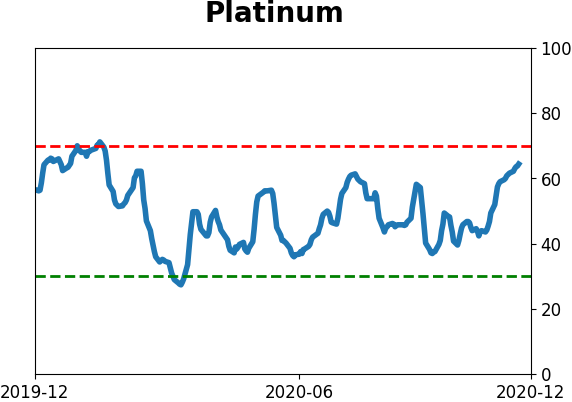
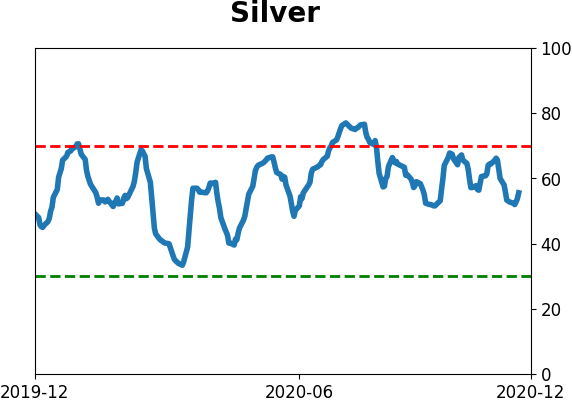
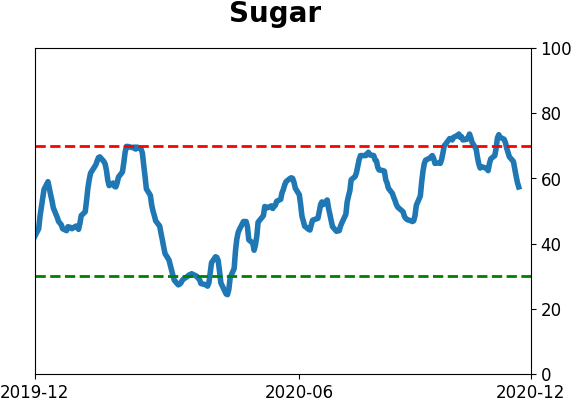
Commodity ETF's - 5-Day Moving Average
|
|