Headlines
|
|
Pessimism is rising as the market environment shifts:
The market environment in the S&P 500 is still mostly healthy but is not in the broader stock market. There are signs of pessimism relative to the past 18 months but still far from historic washout conditions. That suggests waiting for a return to Risk-On behavior.
Bottom Line:
STOCKS: Hold By early October, sentiment had reset. Several important momentum streaks ended, which has brought in buyers in the past, and seasonality turned positive. We're now seeing signs that sentiment has quickly shifted, especially among options traders. It's gotten to an extreme that has preceded weaker-than-average returns.
BONDS: Hold In late October, sentiment on bonds - from Treasuries to corporates - entered pessimistic territory. It's now starting to recover, with some quick moves in corporate bonds. We'll see if those bonds, in particular, can hold recent gains.
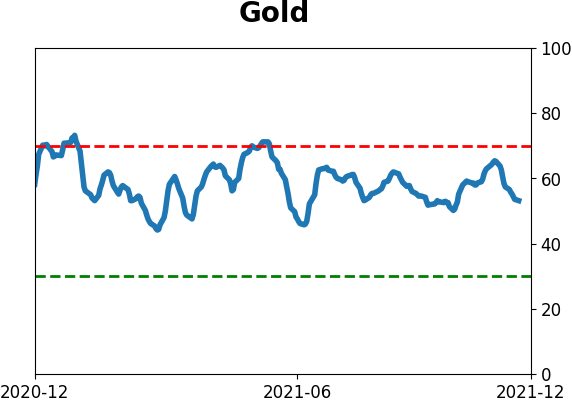
GOLD: Hold
Gold and miners were rejected after trying to recover above their 200-day averages in May. Some oversold extremes in breadth measures among miners triggered in late September, and they've recovered a bit since then. The group still has some proving to do.
|
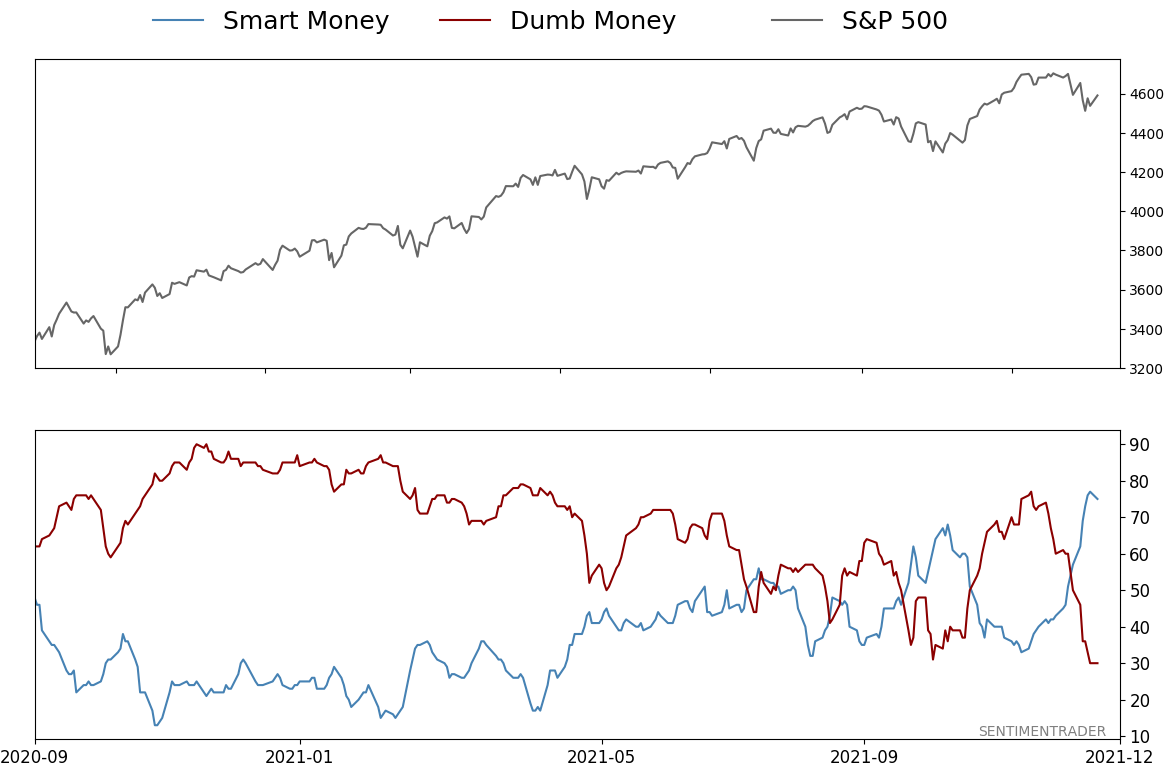
Smart / Dumb Money Confidence
|
Smart Money Confidence: 75%
Dumb Money Confidence: 30%
|
|
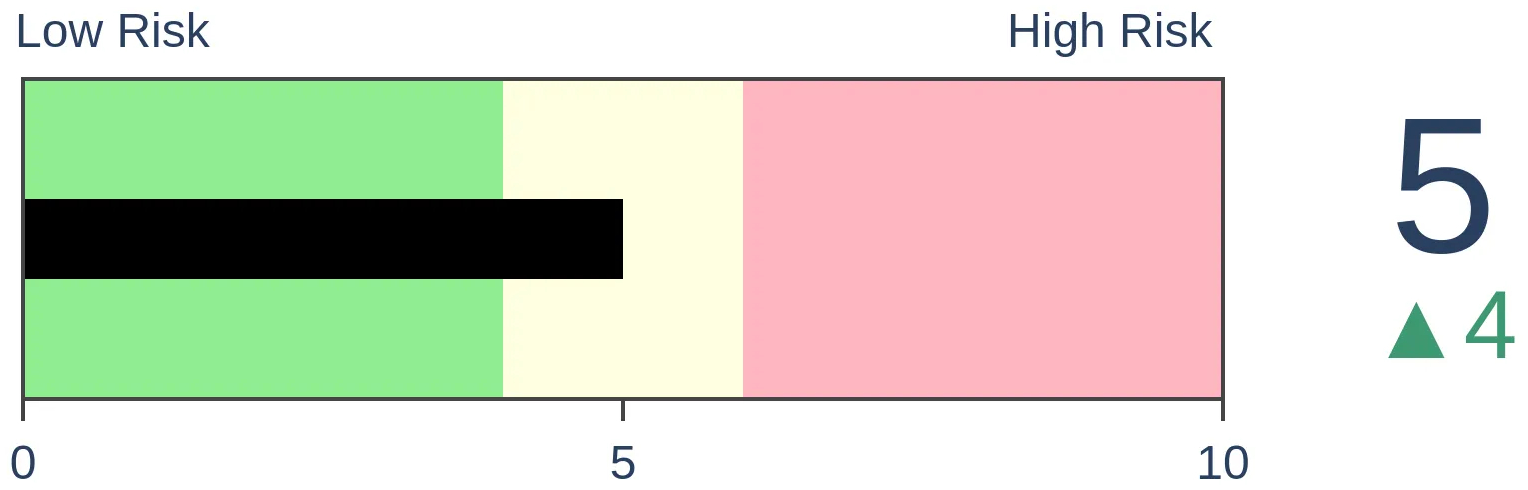
Risk Levels
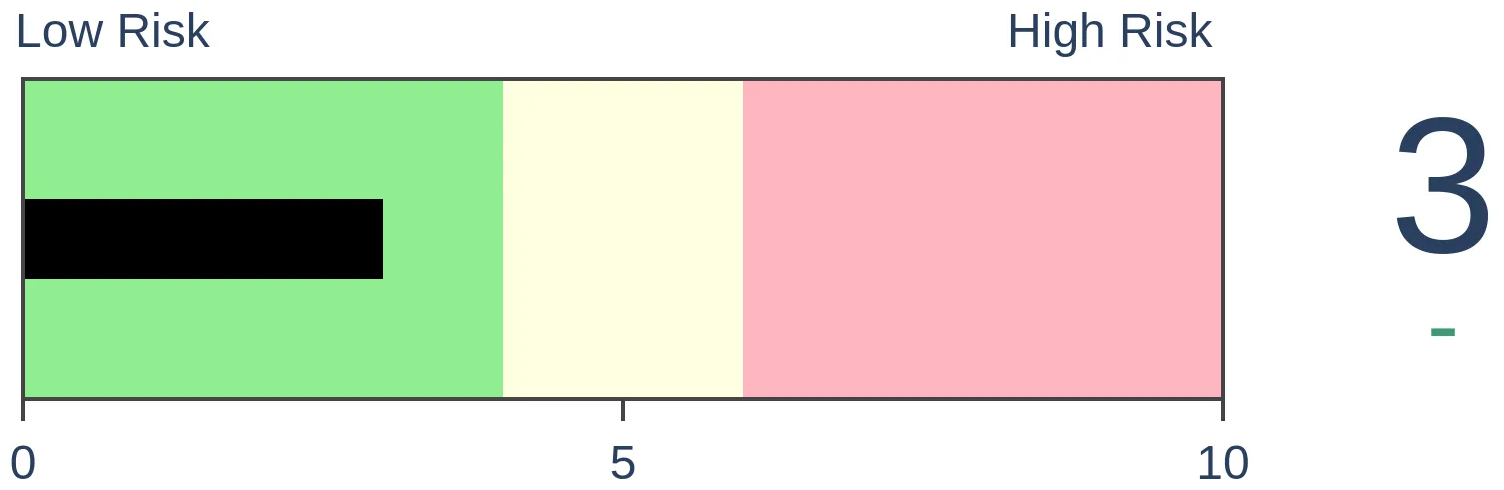
Stocks Short-Term
|
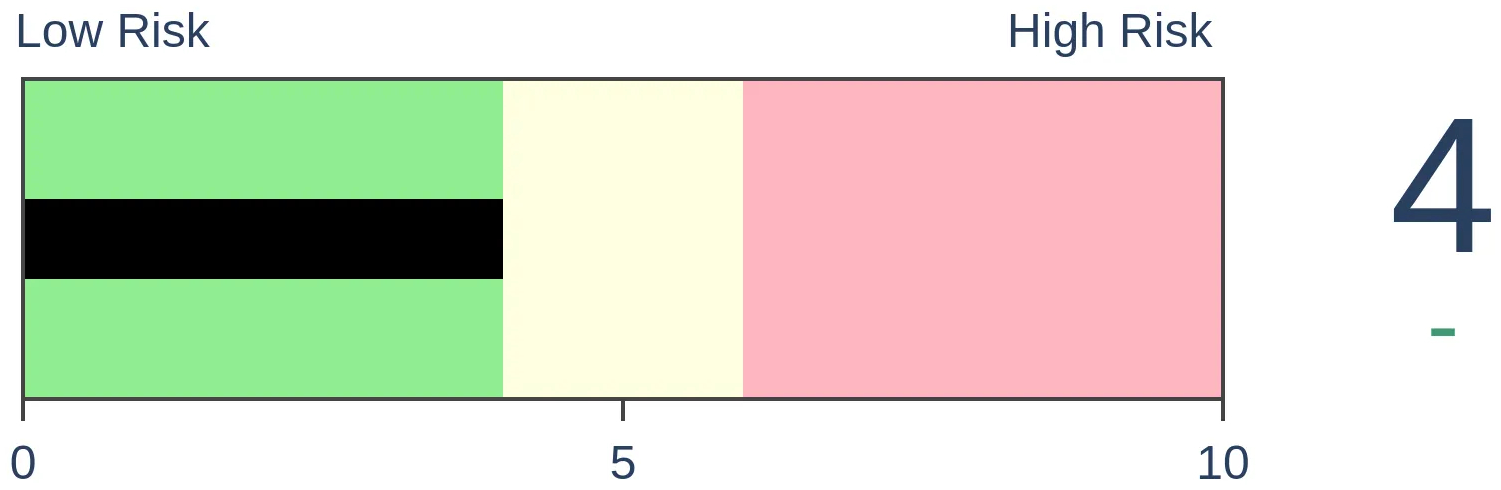
Stocks Medium-Term
|
|
Bonds
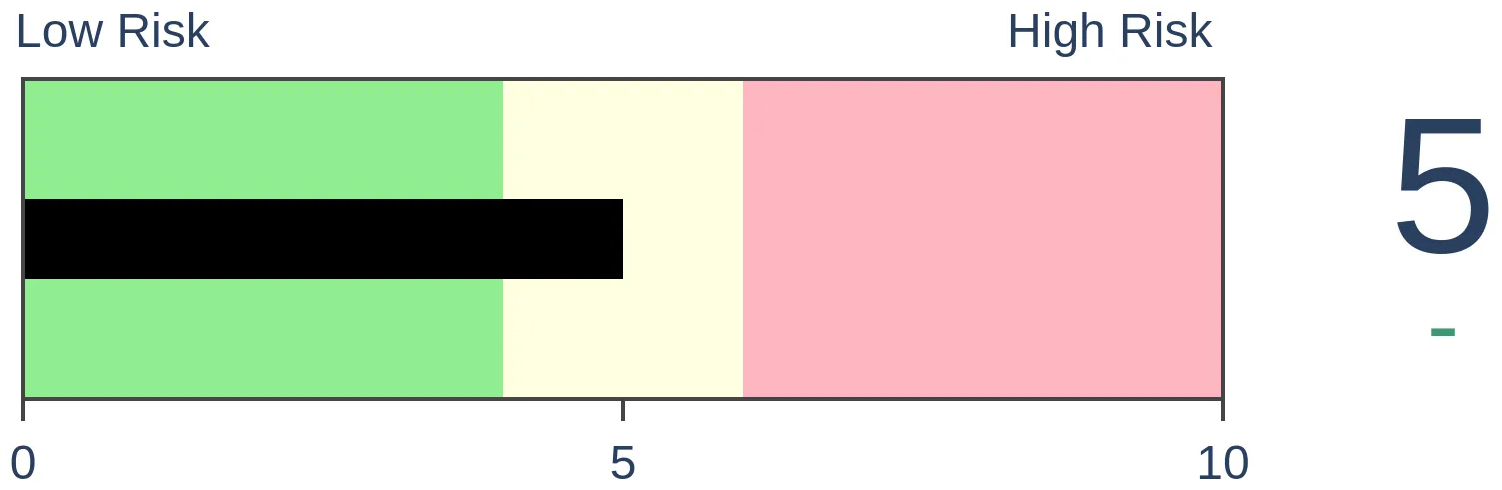
|
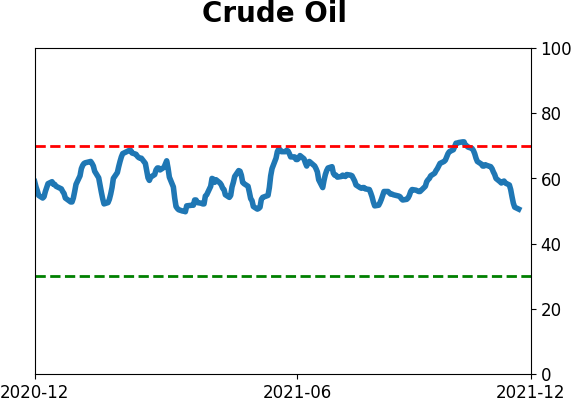
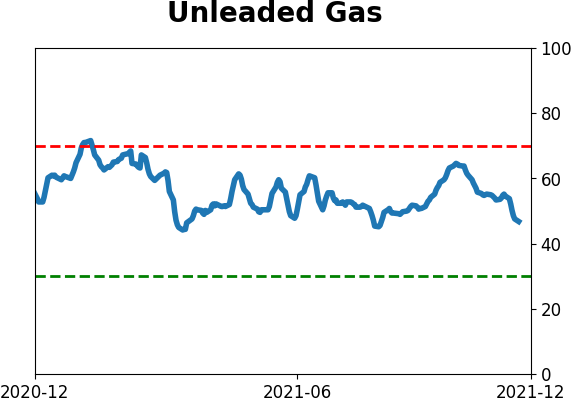
Crude Oil
|
|
Gold

|
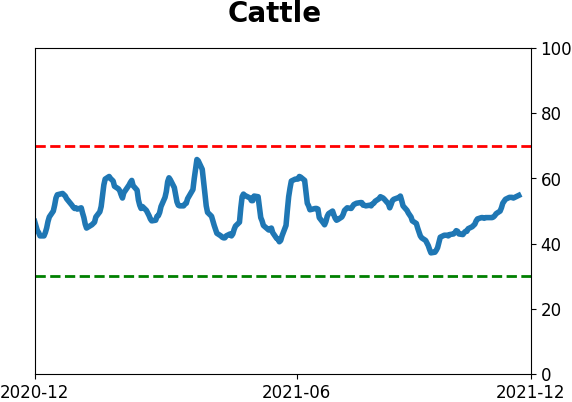
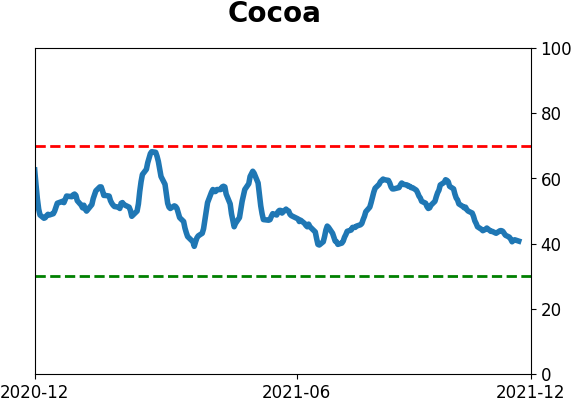
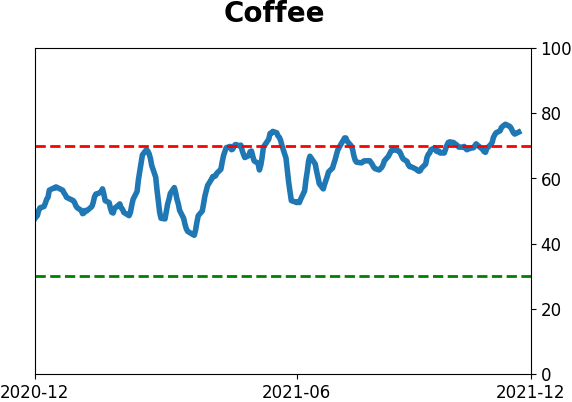
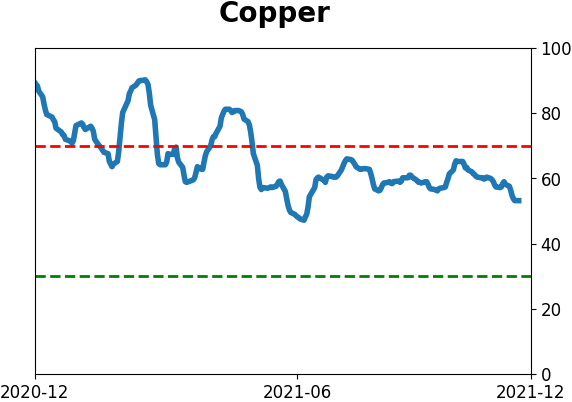
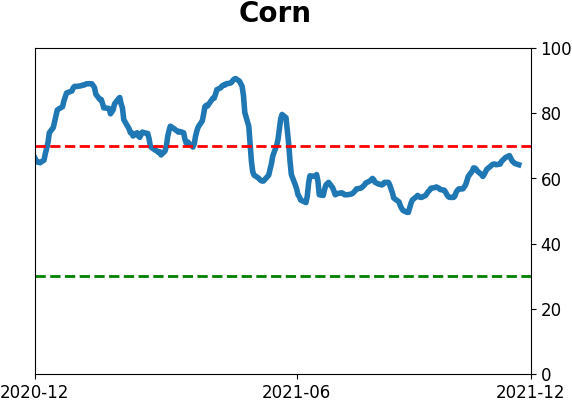
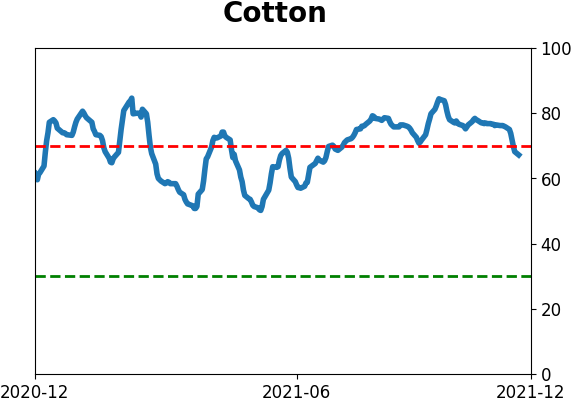
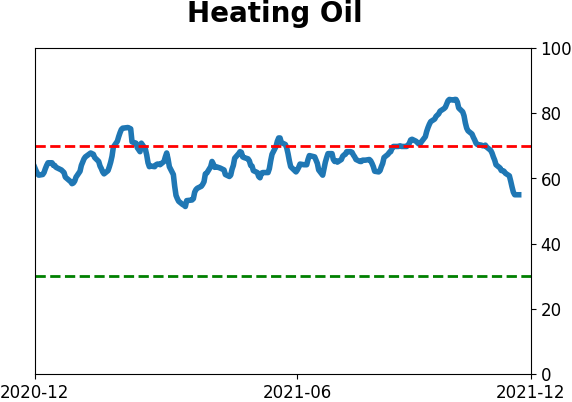
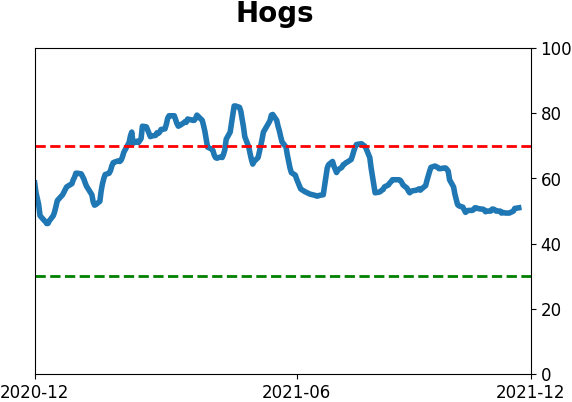
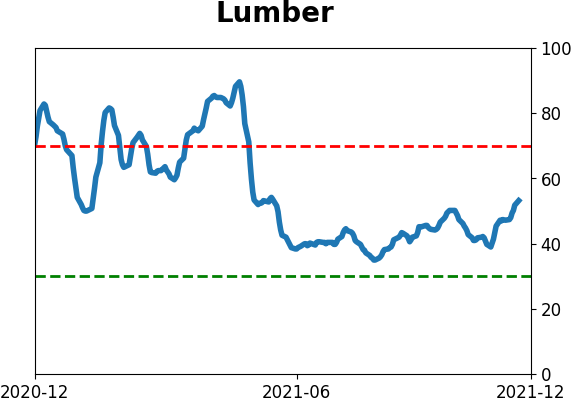
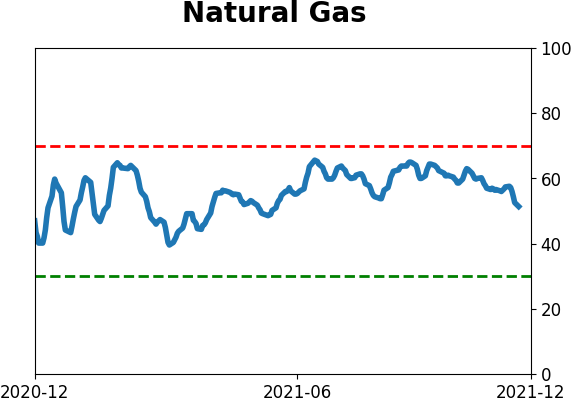
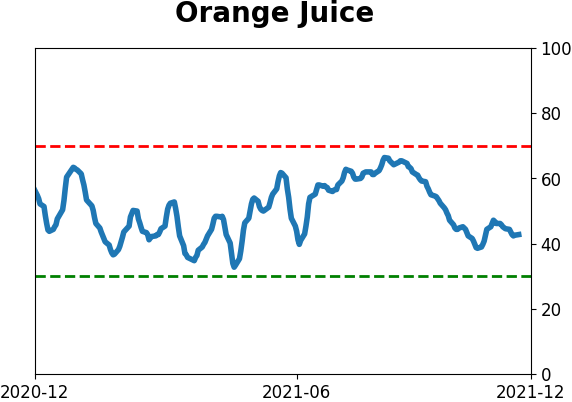
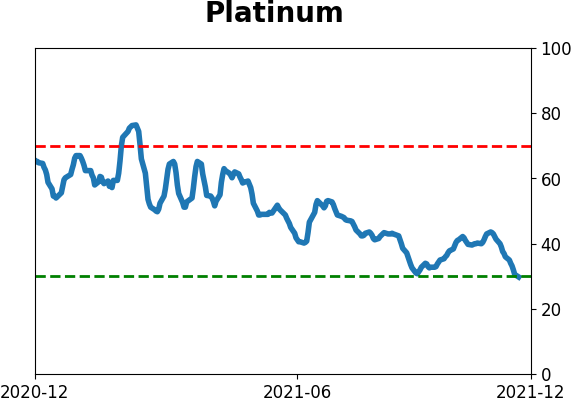
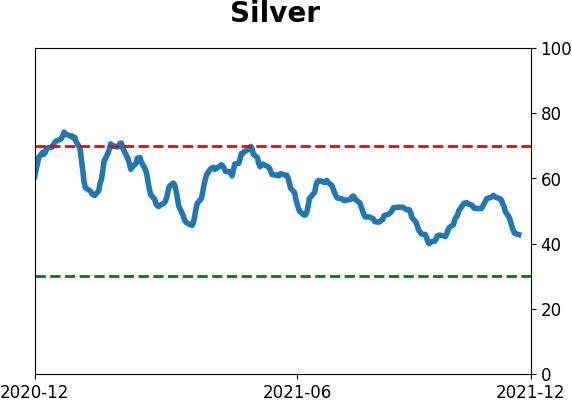
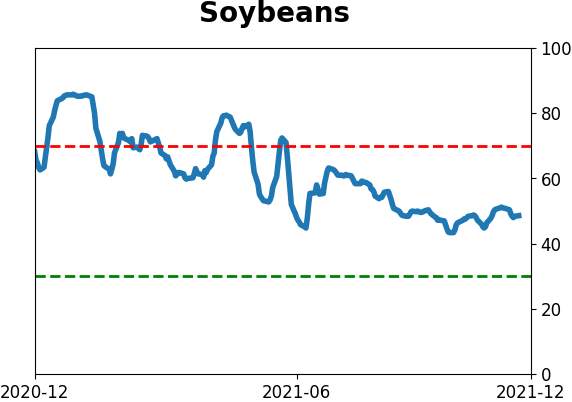
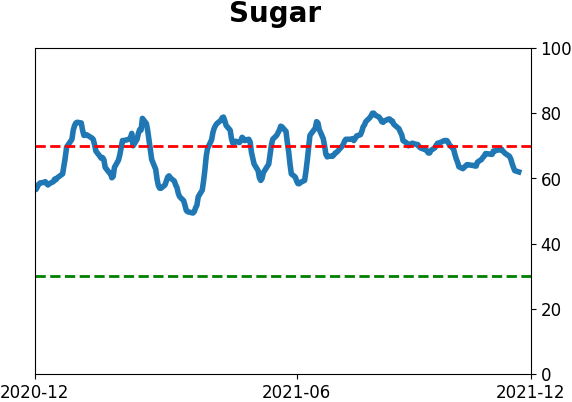
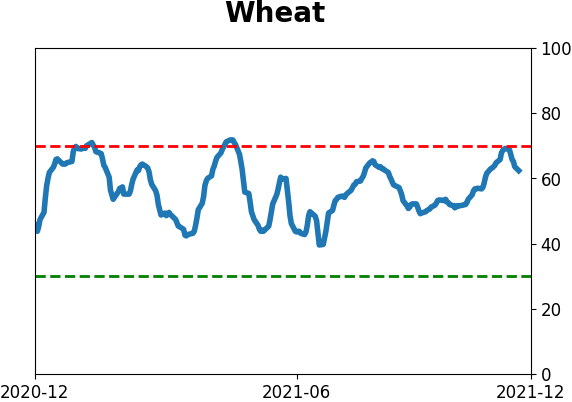
Agriculture

|
|
Research
By Jason Goepfert
BOTTOM LINE
The market environment in the S&P 500 is still mostly healthy but is not in the broader stock market. There are signs of pessimism relative to the past 18 months but still far from historic washout conditions. That suggests waiting for a return to Risk-On behavior.
FORECAST / TIMEFRAME
None
|
Key points:
- The market environment in the S&P 500 is still healthy
- In the broader equity market, however, it is not
- There are signs of pessimism, but only relative to the past 18 months
- That suggests buyers may want to wait for a return to Risk-On behavior
Defining the market environment
Over the 20 years we've been publishing here, we've had the good fortune to test thousands of strategies. There is a reason we keep coming back to sentiment-related measures - because they worked more consistently over a multi-month time frame than any other.
One of the keys, however, is context. Investors behave differently during bull markets than they do during bear markets, and both of those are different than trading ranges.
Because of that, we've also tested an untold number of indicators to determine a market's trend. Some add significant value, but usually, they're highly complex and optimized based on historical conditions that may change.
In the help section, we outlined some basics on looking at the market environment. They're simple rules, it's easy to find the indicators just about anywhere, they've worked for decades across every imaginable setting, and they work about as well as more sophisticated systems.
Nowadays, there are many advanced charting and testing platforms available to investors and at reasonable prices. The downside is that it's too easy to get lost by continually searching for a Holy Grail and lose sight of the big picture in the process. For discretionary investors, keeping it simple is usually a better option.
The market environment is still positive...for the S&P 500, anyway
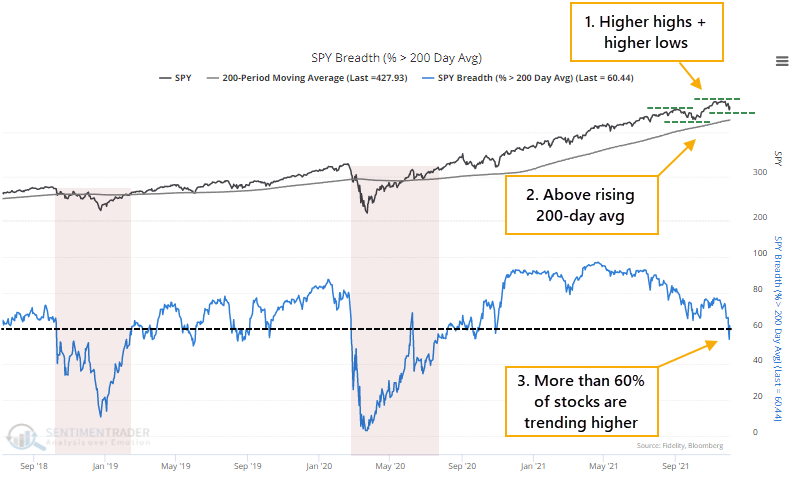
There are a few simple primary guides we watch, all of which are positive:
- Are there a series of higher highs and higher lows? YES
- Are prices above a rising 200-day moving average? YES
- Are more than 60% of stocks consistently holding above their averages? YES (but wobbly)
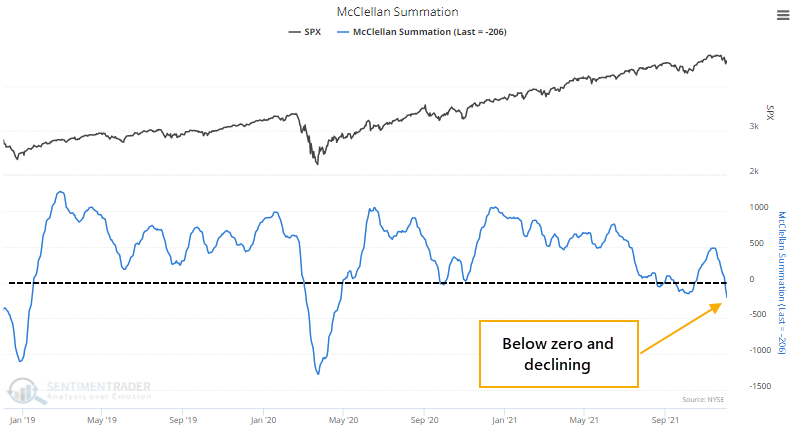
And a few secondary ones, all of which are negative:
1. Is the McClellan Summation Index above zero and rising? NO
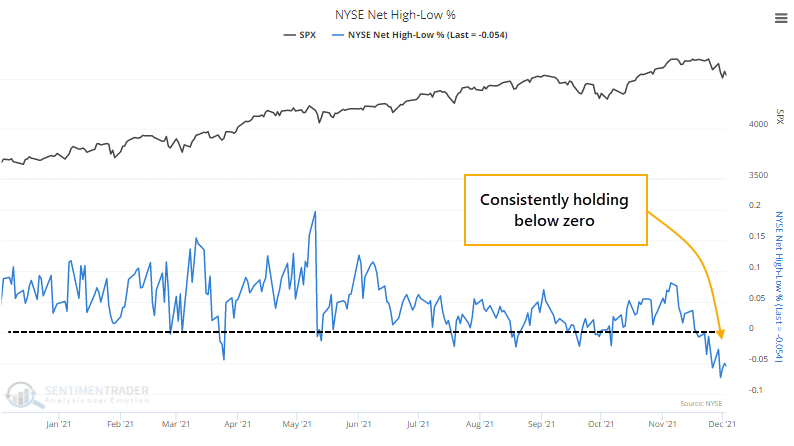
2. Are there more securities at 52-week highs than lows? NO
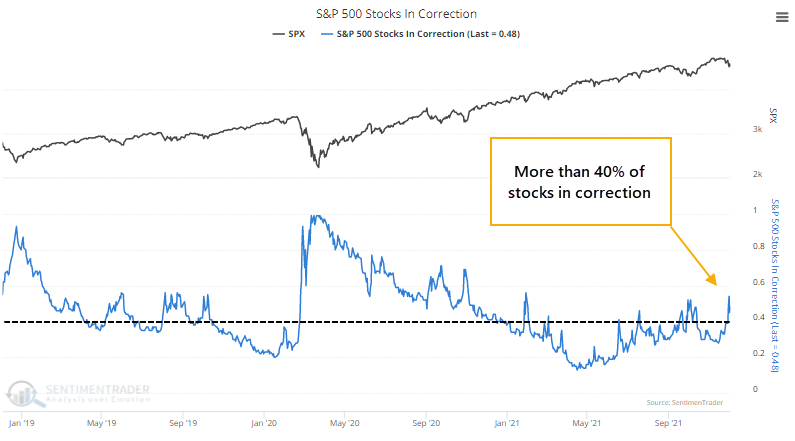
3. Are fewer than 40% of S&P 500 stocks in a correction? NO
So, this is a problem.
We've spent much of the last couple of weeks looking at how split the stock market has been, with too many securities diverging from what the major indexes were doing. These conditions have a strong habit of leading to poor short- to medium-term returns. We can see that above, with positive trend indications in the S&P 500, but negative elsewhere.
Some signs of pessimism (but...)
An iffy market environment makes it more challenging to know how much weight to put on mean-reversion indicators. Historically, conditions like this are most like trading-range environments, where buying pessimism and selling optimism work the best.
And right now, there are some clear signs of pessimism. Not on a historical scale, but relative to other post-pandemic stretches.
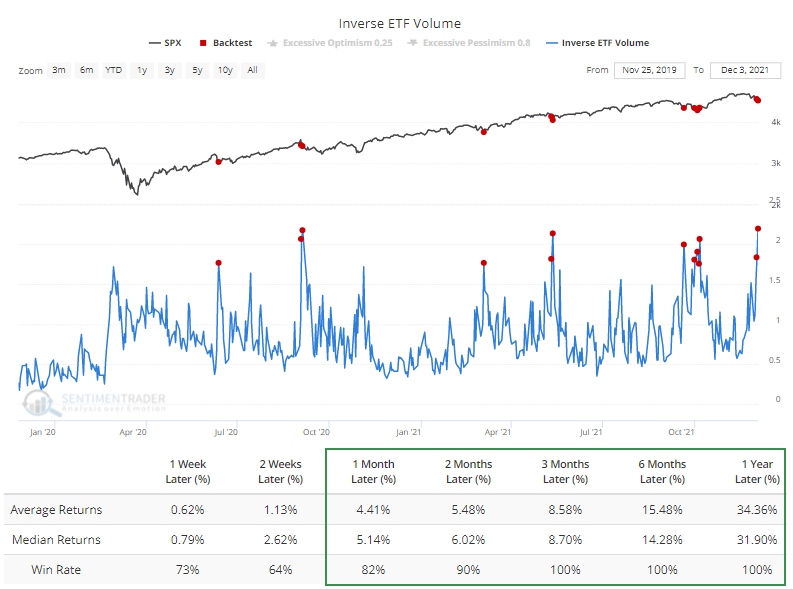
Friday's reversal triggered a rush into inverse ETFs that profit when stocks decline. At more than 2.2% of NYSE volume, this was a record high. The Backtest Engine shows good returns after the other extremes, though that's primarily because they only triggered during the dips in the current rally.
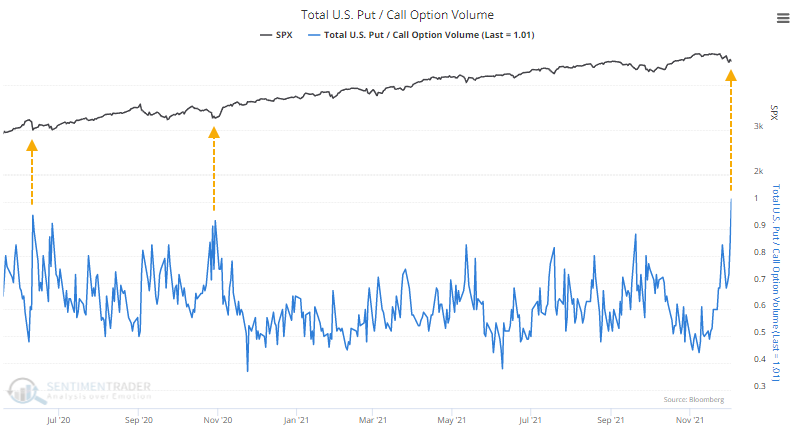
In a stark change from recent behavior, traders scrambled to trade put options instead of call options. For the first time since the pandemic rally began, there were more puts than calls traded across all U.S. exchanges.
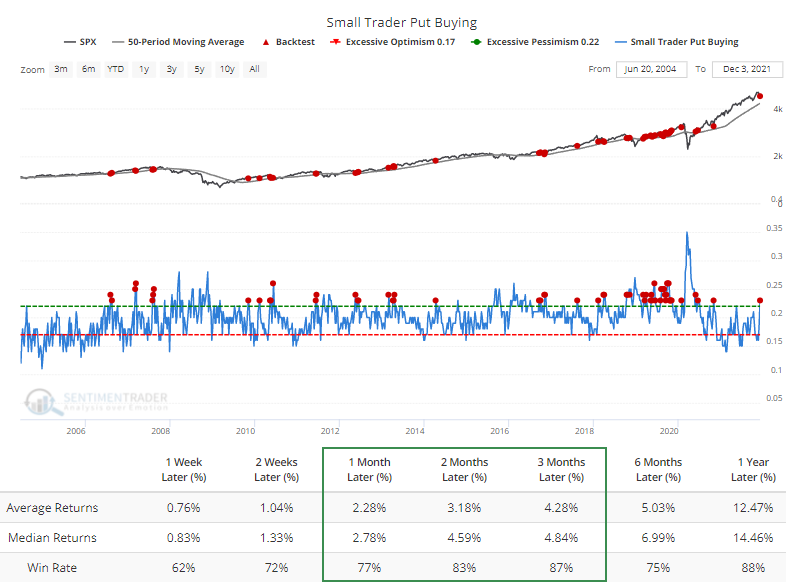
Much of that was due to an about-face among small retail traders. When we looked at their spurt of optimistic excesses a month ago, the conclusion was that the most speculative areas of the market were likely at an increased risk of imminent loss. Now that these traders have suffered, they're back to being relatively aggressive in protecting themselves.
Last week, they spent 23% of their total volume on buying put options to open. According to the Backtest Engine, this much hedging when the S&P 500 was above its rising 50-week moving average preceded good returns. Out of 60 weeks that met the criteria, 52 showed a positive return 3 months later.
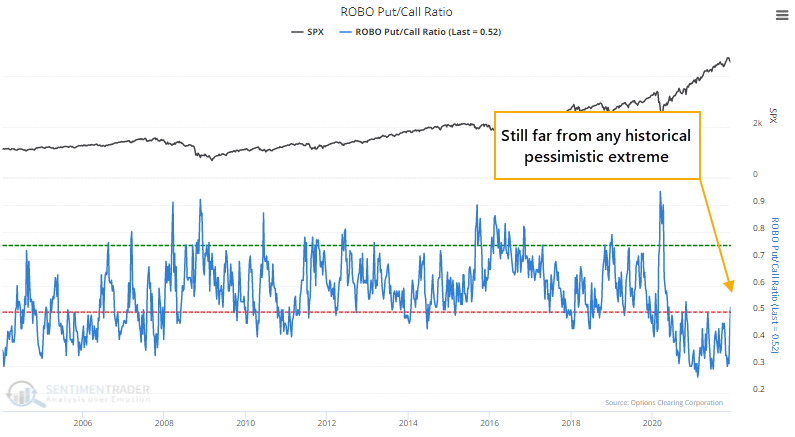
That's a reasonably good sign, though they can get much more pessimistic during bear markets, and call activity is still relatively robust. So the ROBO Put/Call Ratio is high compared to the past year but is barely even into neutral territory long-term.
Mostly risk-off behavior
If we look at our models, they're mostly showing risk-off behavior. In the case of the spread between Smart Money and Dumb Money Confidence, it's nearing an extreme, which we'll likely be looking at tomorrow.
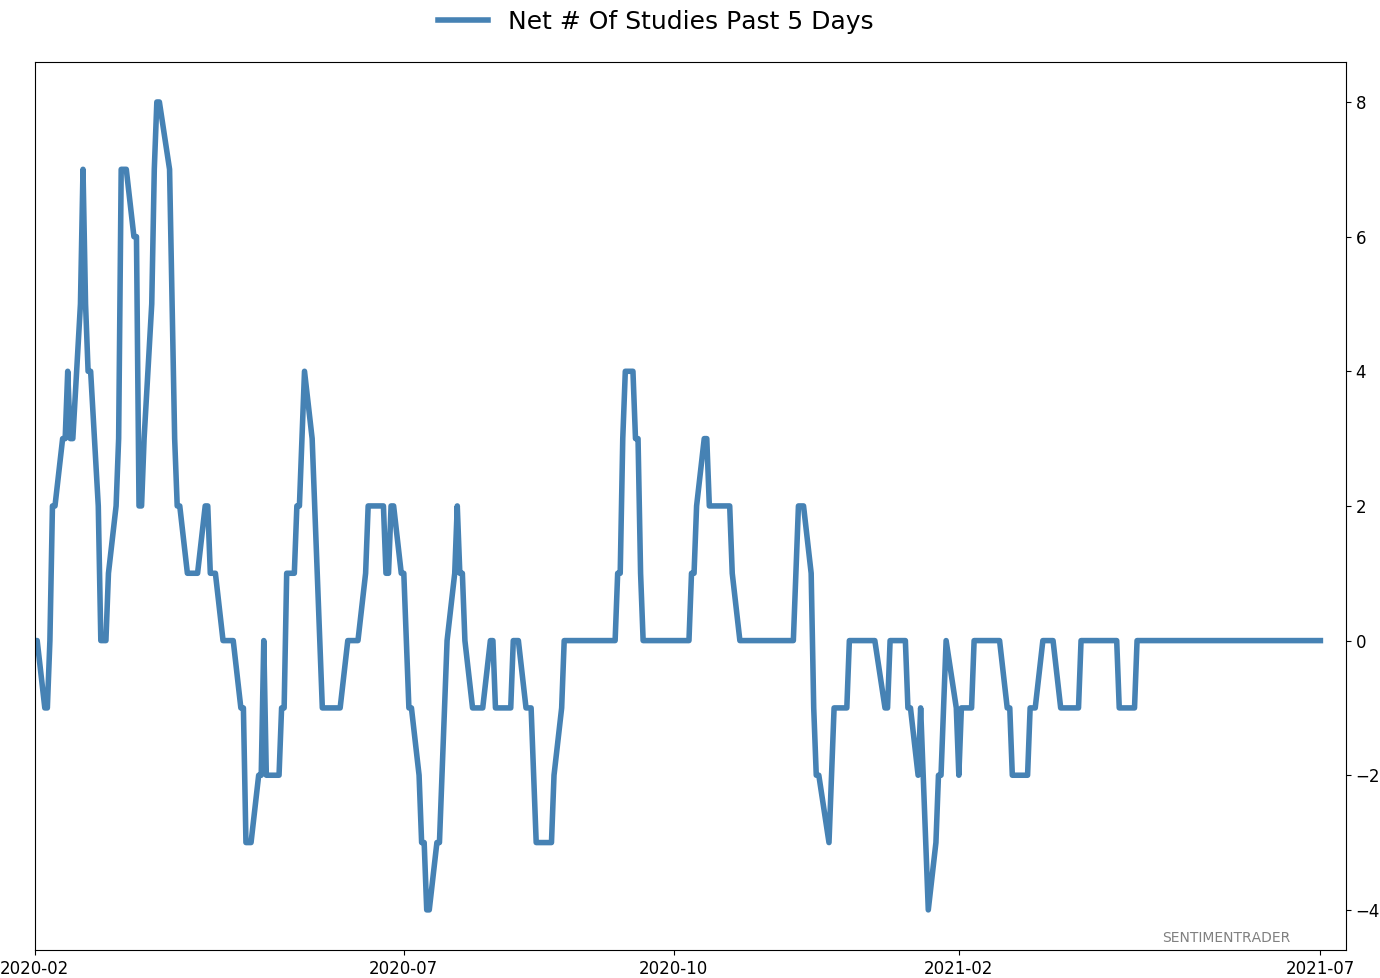
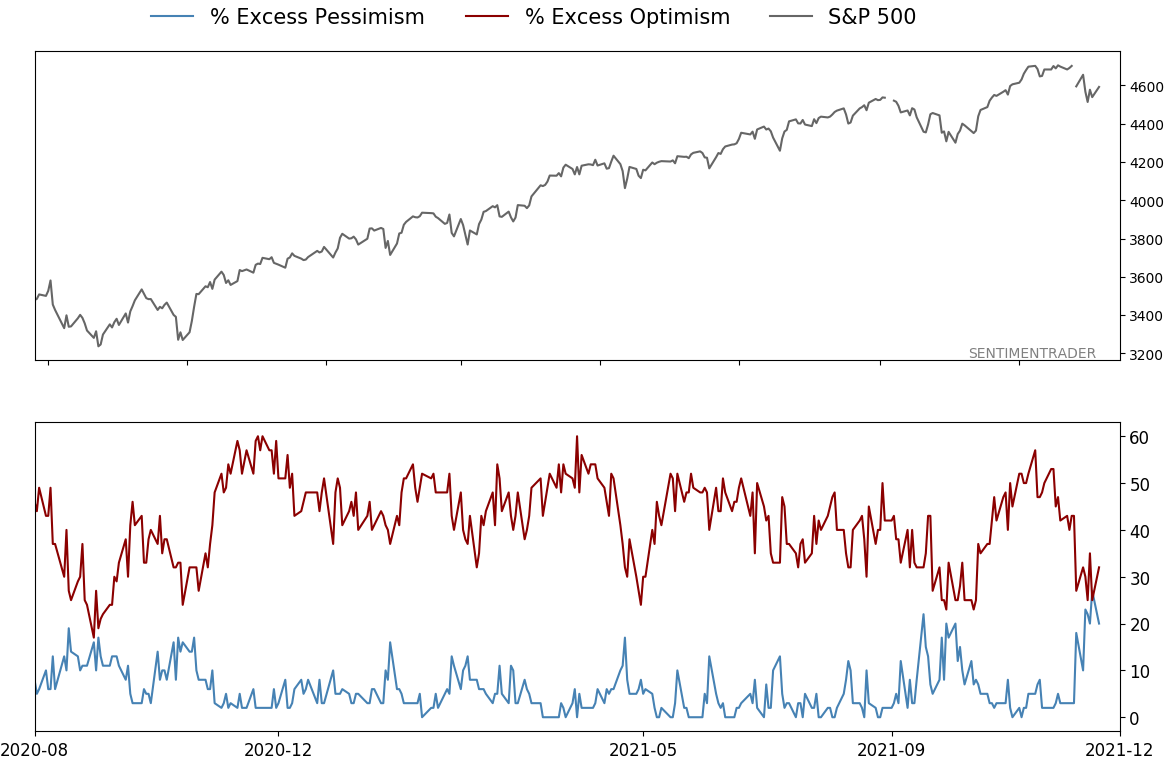
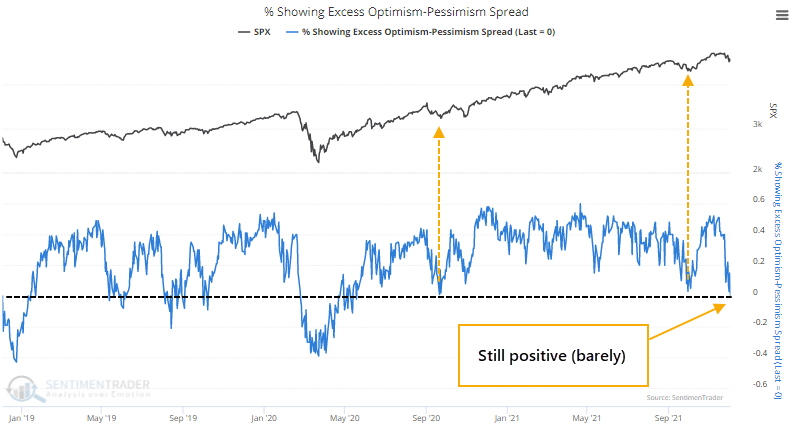
There is an even balance between those showing optimistic extremes and pessimistic ones among almost all of our indicators. When this (mostly) holds above zero, it shows risk-seeking behavior and a positive mood among investors, making it easier for stocks to rise. This one is hanging on the precipice. When it got this low during September 2020 and again in September 2021, stocks bottomed, so we'll have to see how this one is treated.
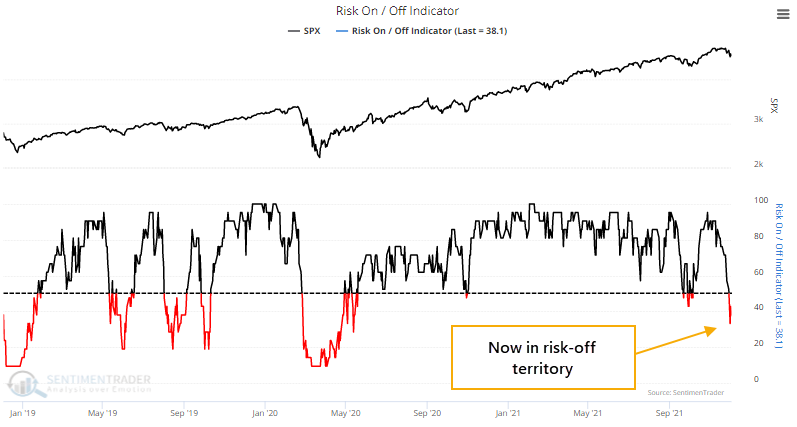
Another aggregate measure of behavior is the Risk-On / Risk-Off Indicator, which is firmly in Risk-Off territory. This one is more curated than the above, and we have more confidence in the selected indicators as accurately reflecting sentiment. So, it's worrying that this has changed, with appetite skewing toward risk aversion to the most significant degree since the spring of 2020. A safer bet for buyers is to wait until this moves back into Risk-On territory.
What the research tells us...
For the first time since the March 2020 surge in buying interest, there is reason to question the trends underlying most securities and investors' willingness to buy the dip. Within indexes like the S&P 500, trends are mostly healthy and not unlike other pullbacks over the past 18 months. But it's a different story across the broader universe of stocks, and there are definite reasons for caution.
While the decline last week triggered extremes relative to other bouts of mini-pessimism during the past 18 months, historically, we're far from seeing the kinds of signs that suggest a washout. That suggests that a lower-risk way for potential buyers right now is to wait for a return of risk-seeking behavior, which we'd see in a move above 50% in the Risk-On / Risk-Off Indicator. That means missing the exact low, with the tradeoff being less probability of getting caught in a downward spiral in an overvalued market.
Active Studies
| Time Frame | Bullish | Bearish | | Short-Term | 2 | 3 | | Medium-Term | 11 | 1 | | Long-Term | 13 | 7 |
|
Indicators at Extremes
Portfolio
| Position | Description | Weight % | Added / Reduced | Date | | Stocks | RSP | 10.7 | Added 6.4% | 2021-10-01 | | Bonds | 32.7% BND, 7.1% SCHP | 39.8 | Added 8.3% | 2021-10-26 | | Commodities | GCC | 2.4 | Reduced 2.1%
| 2020-09-04 | | Precious Metals | GDX | 4.6 | Reduced 4.2% | 2021-05-19 | | Special Situations | 9.8% KWEB, 4.7% XLE, 2.9% PSCE | 17.3 | Added 9.78% | 2021-10-01 | | Cash | | 24.1 | | |
|
Updates (Changes made today are underlined)
Much of our momentum and trend work has remained positive for several months, with some scattered exceptions. Almost all sentiment-related work has shown a poor risk/reward ratio for stocks, especially as speculation drove to record highs in exuberance in February. Much of that has worn off, and most of our models are back toward neutral levels. There isn't much to be excited about here. The same goes for bonds and even gold. Gold has been performing well lately and is back above long-term trend lines. The issue is that it has a poor record of holding onto gains when attempting a long-term trend change like this, so we'll take a wait-and-see approach. Momentum has ebbed quickly in recent weeks, and nearing oversold levels in some indicators. This can be a dangerous area, with a lot of short-term volatility, but we'd be more inclined to add medium- to long-term exposure rather than sell on much more of a decline, thanks to already rock-bottom exposure. Other areas look more attractive, including some overseas markets. RETURN YTD: 8.5% 2020: 8.1%, 2019: 12.6%, 2018: 0.6%, 2017: 3.8%, 2016: 17.1%, 2015: 9.2%, 2014: 14.5%, 2013: 2.2%, 2012: 10.8%, 2011: 16.5%, 2010: 15.3%, 2009: 23.9%, 2008: 16.2%, 2007: 7.8%
|
|
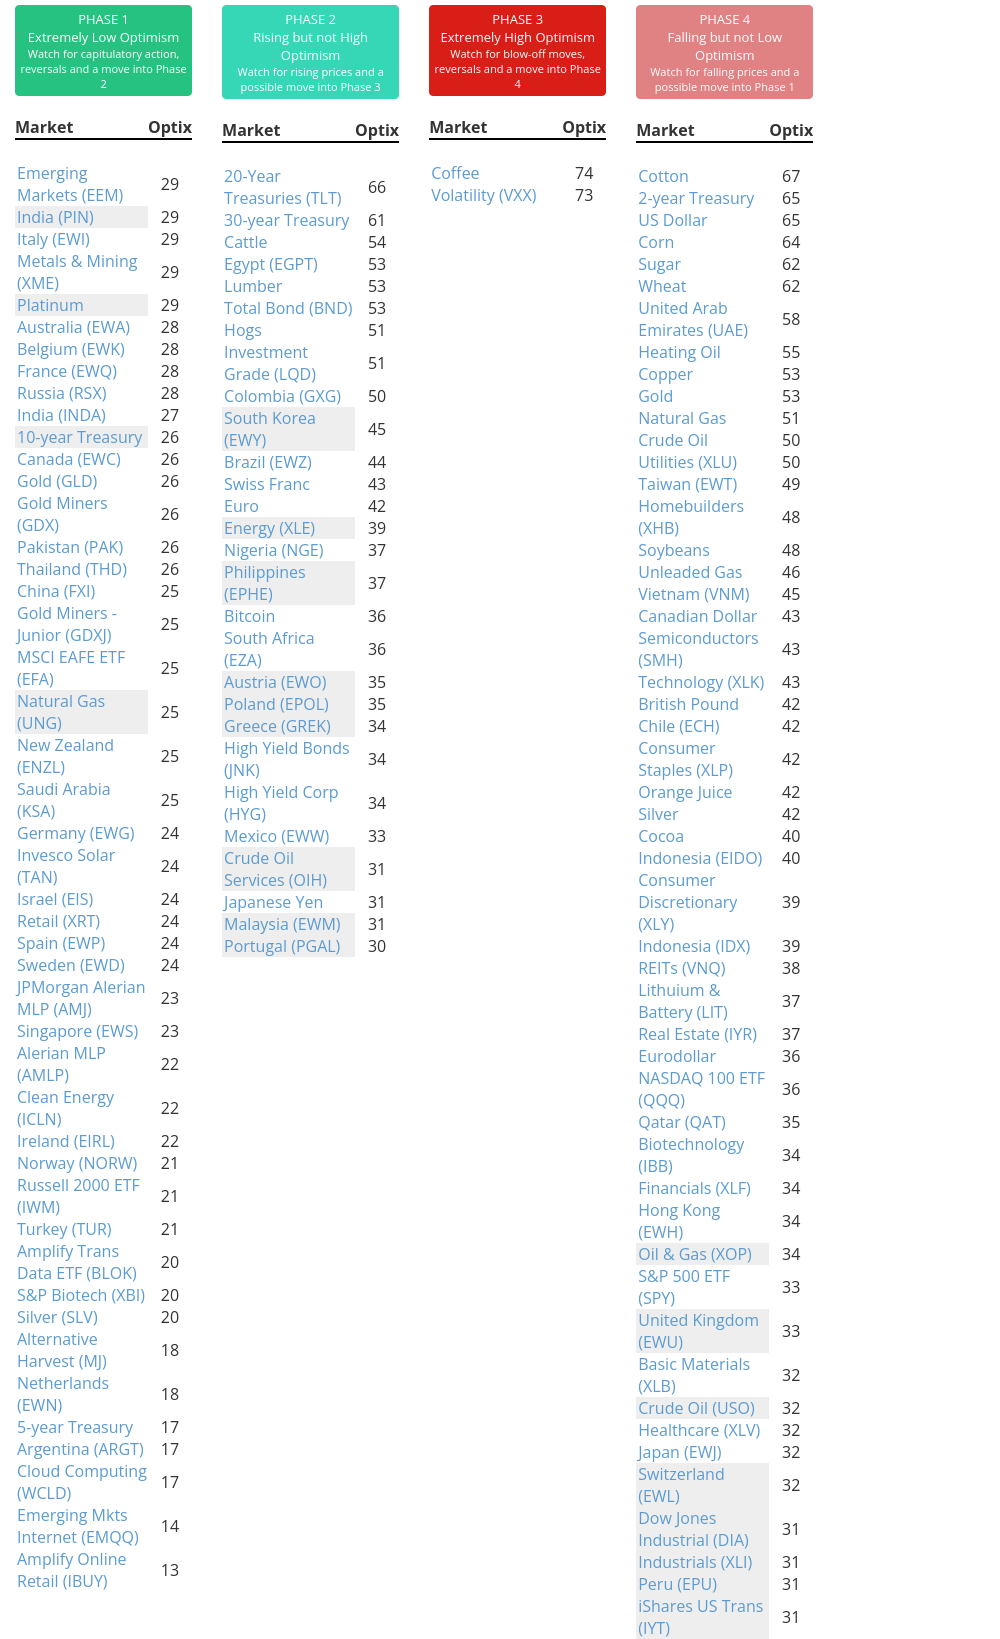
Phase Table
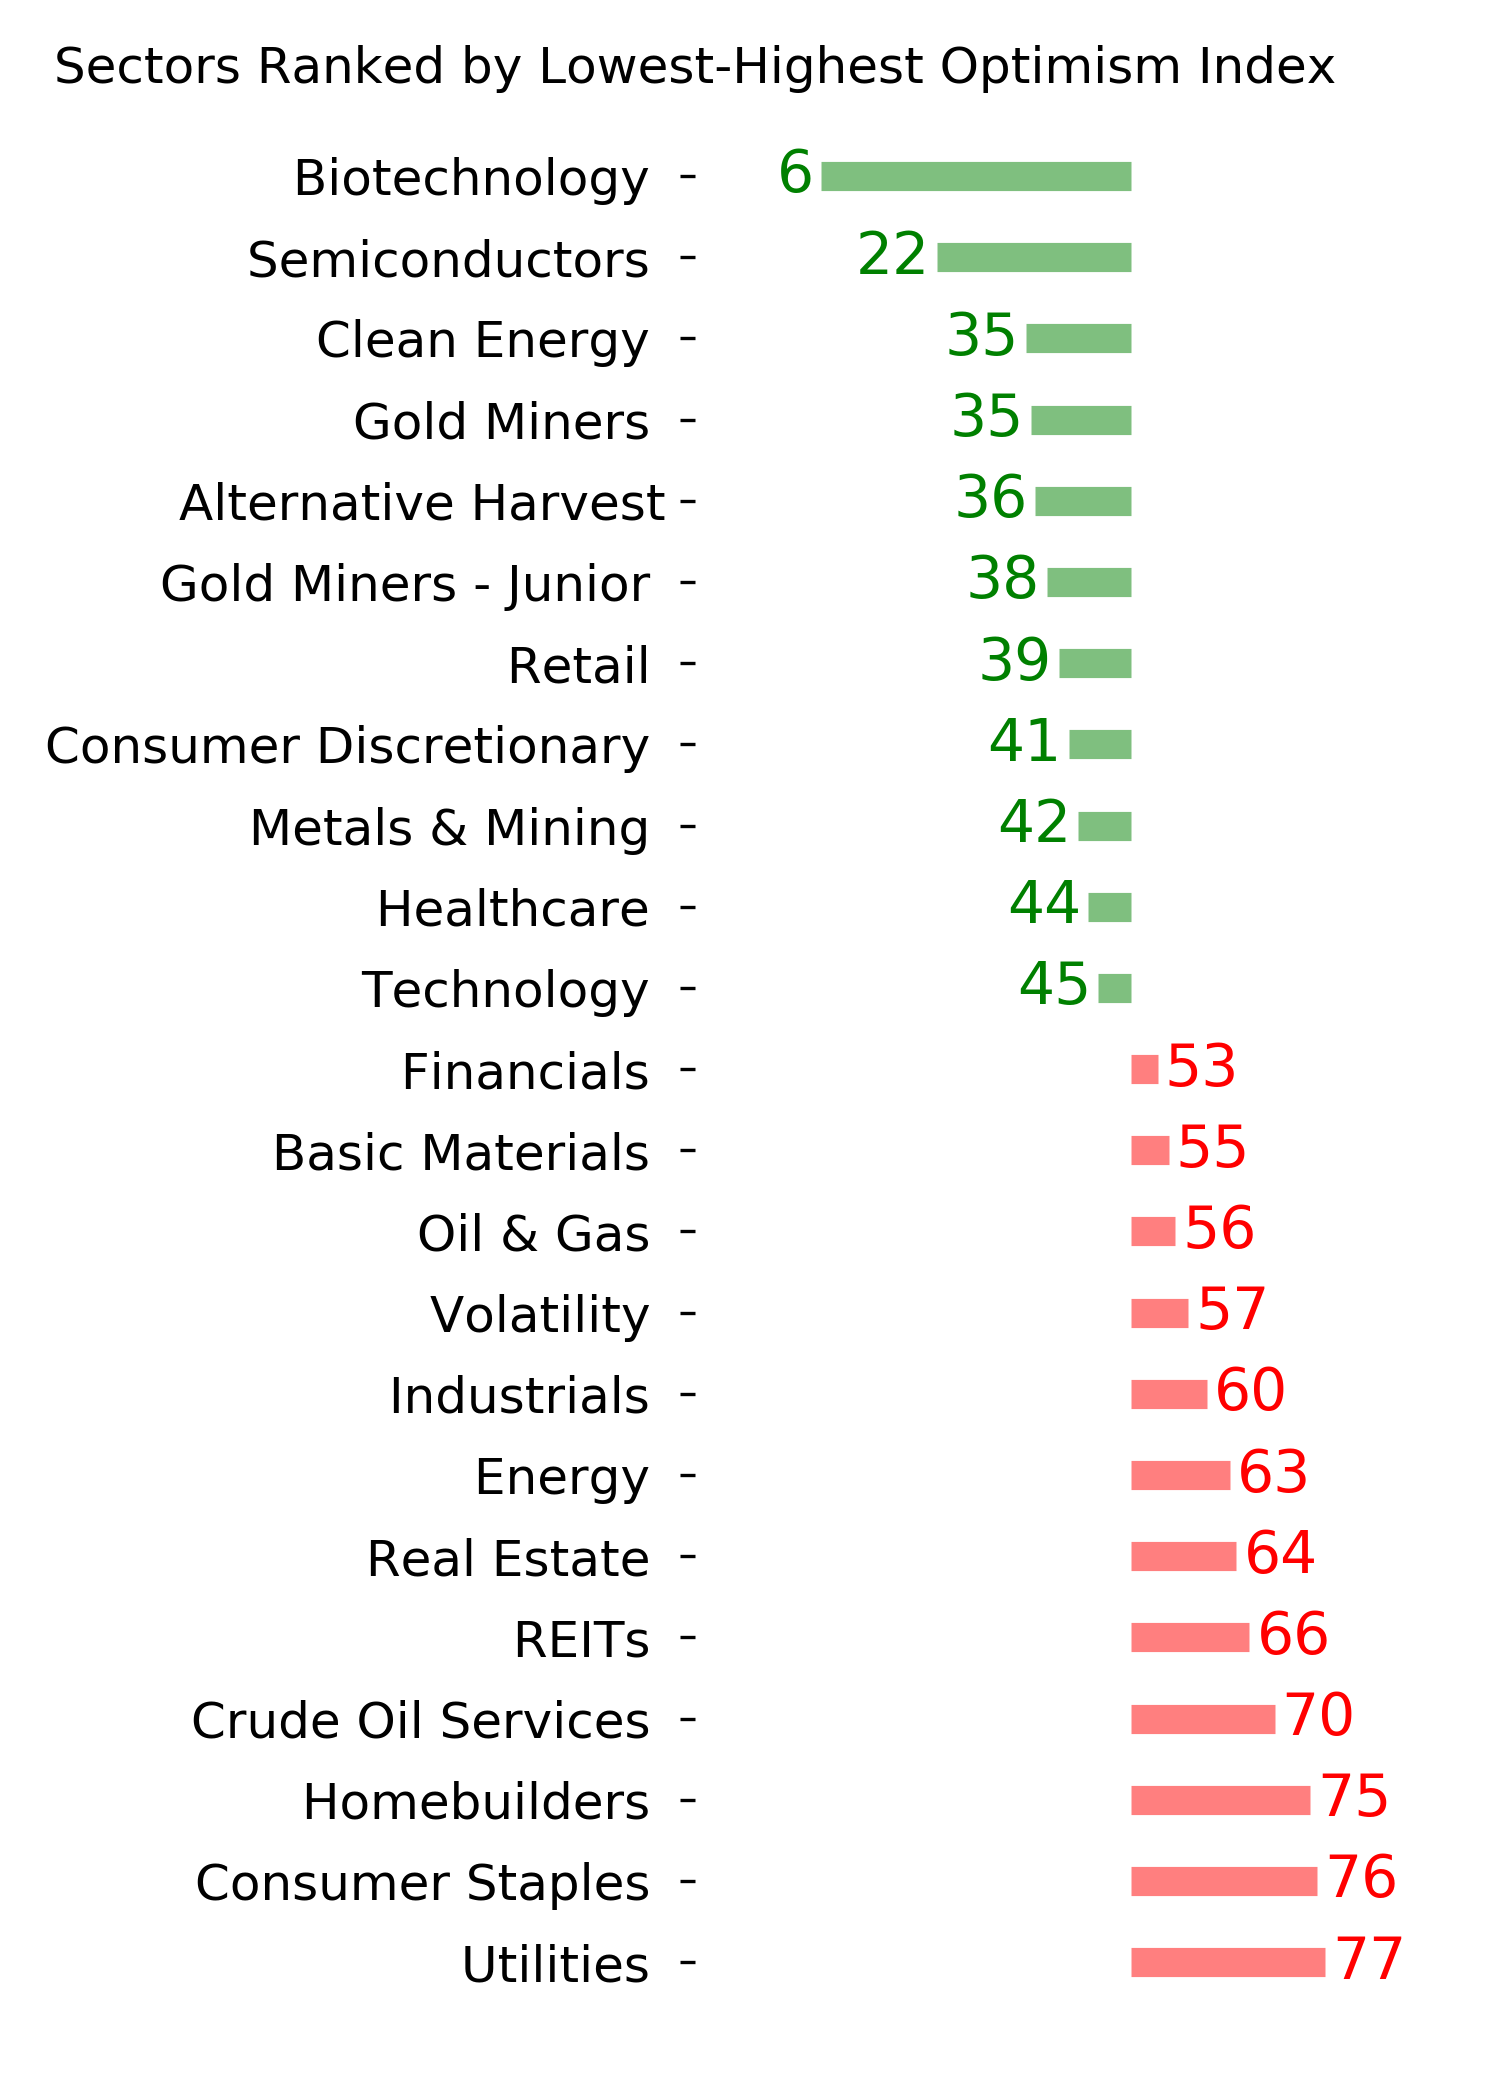
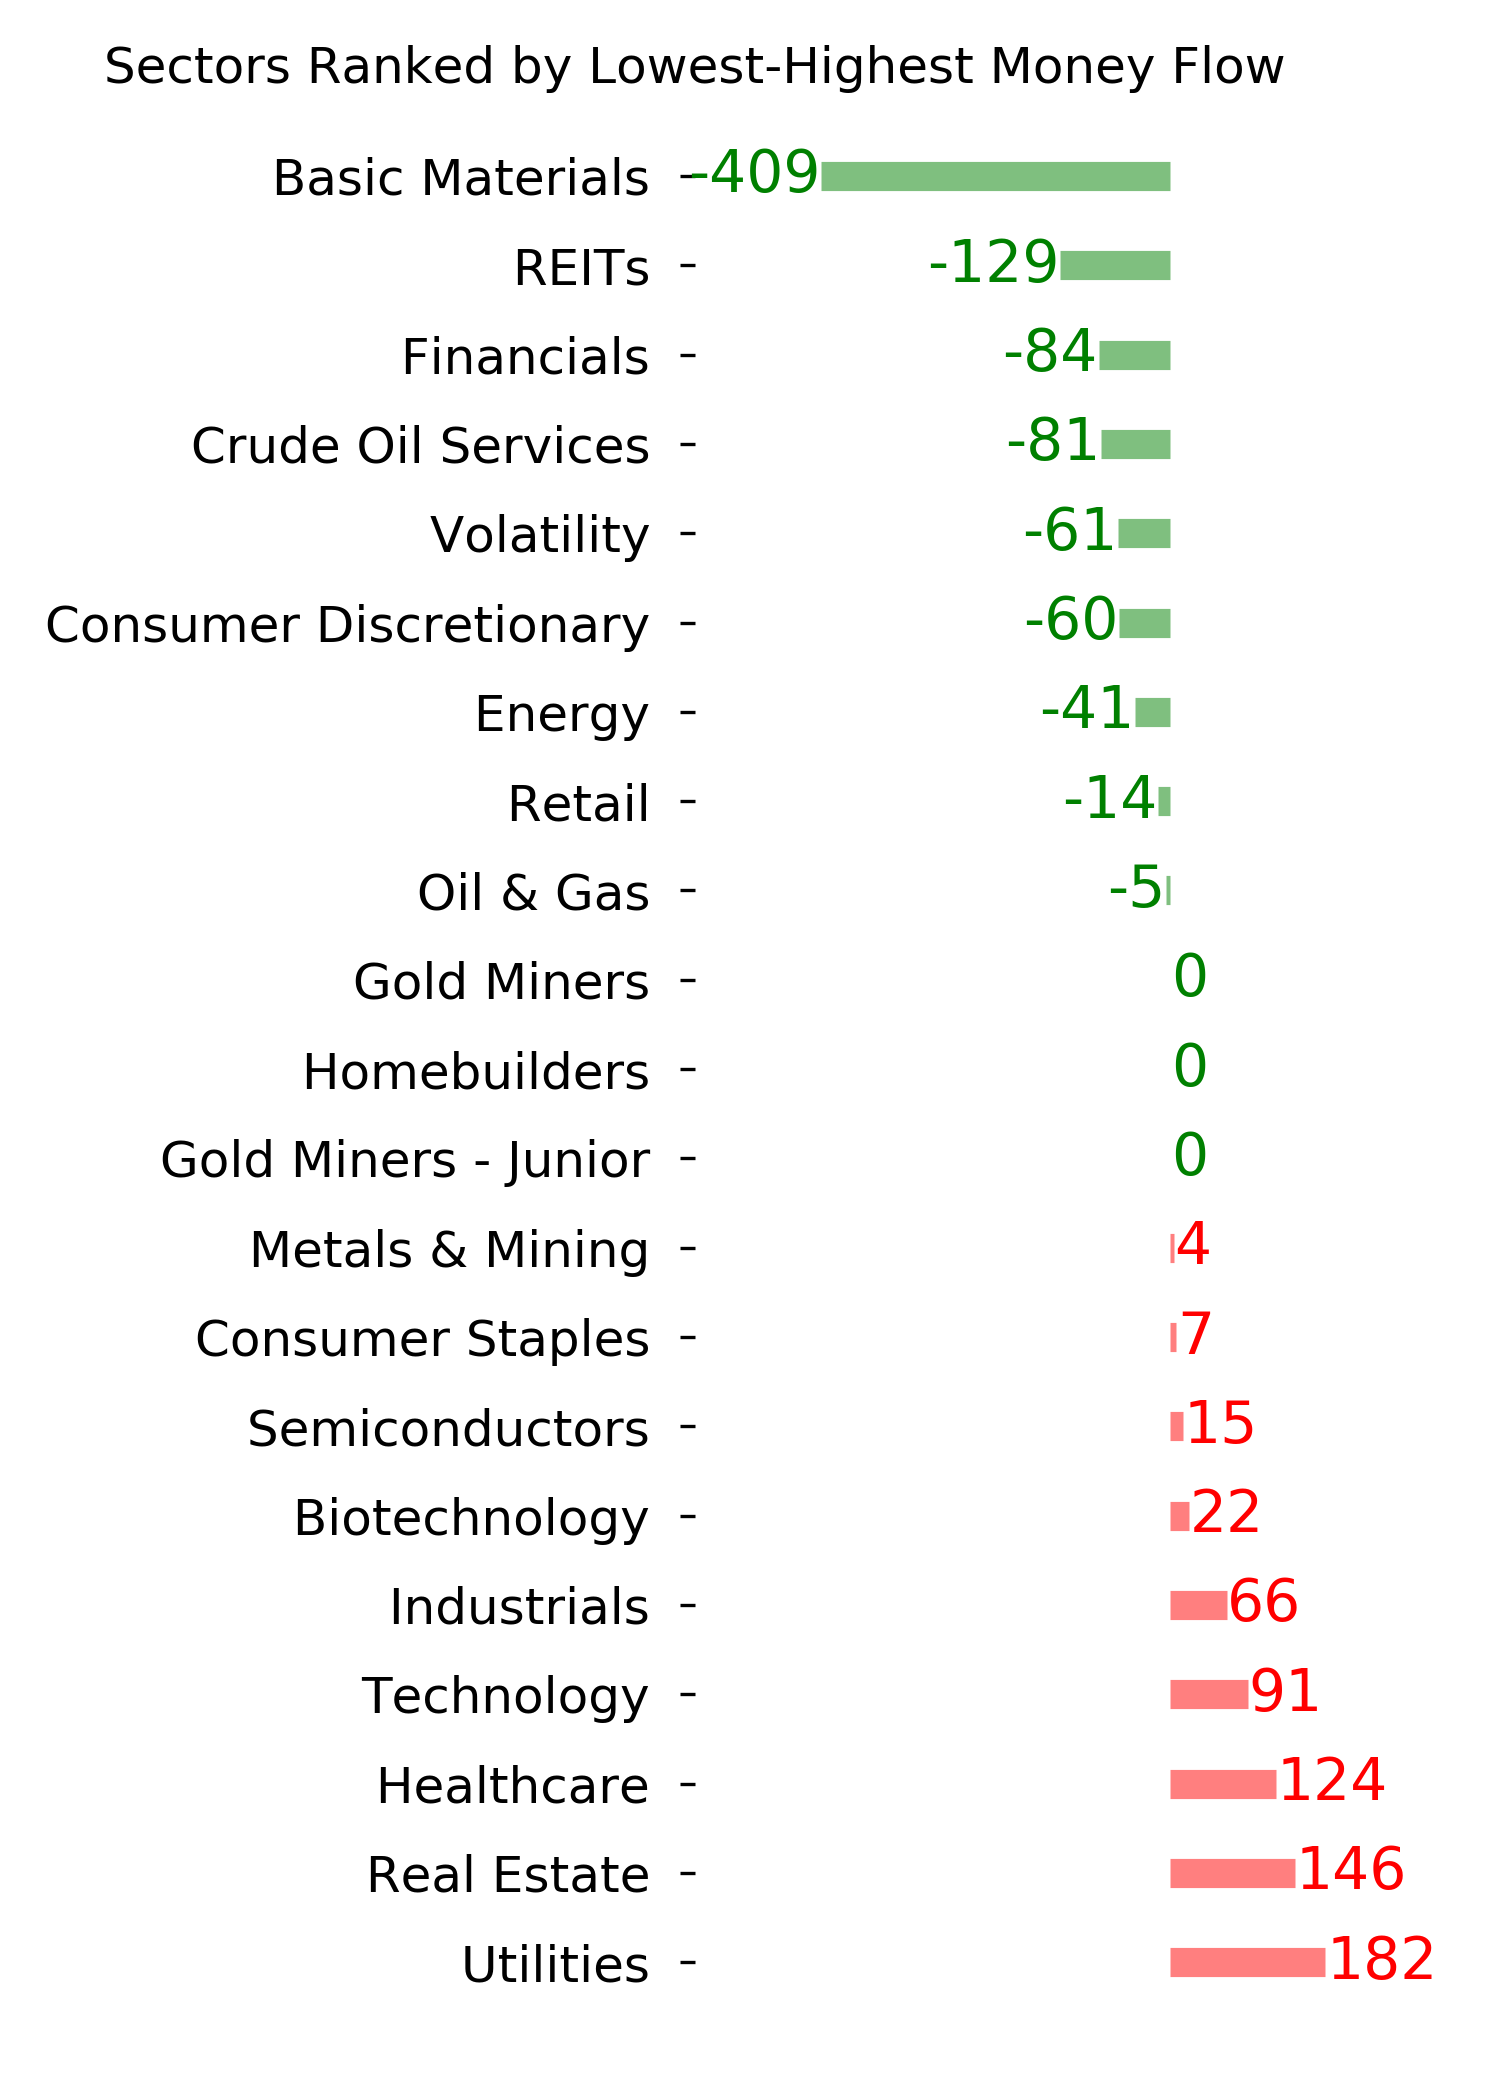
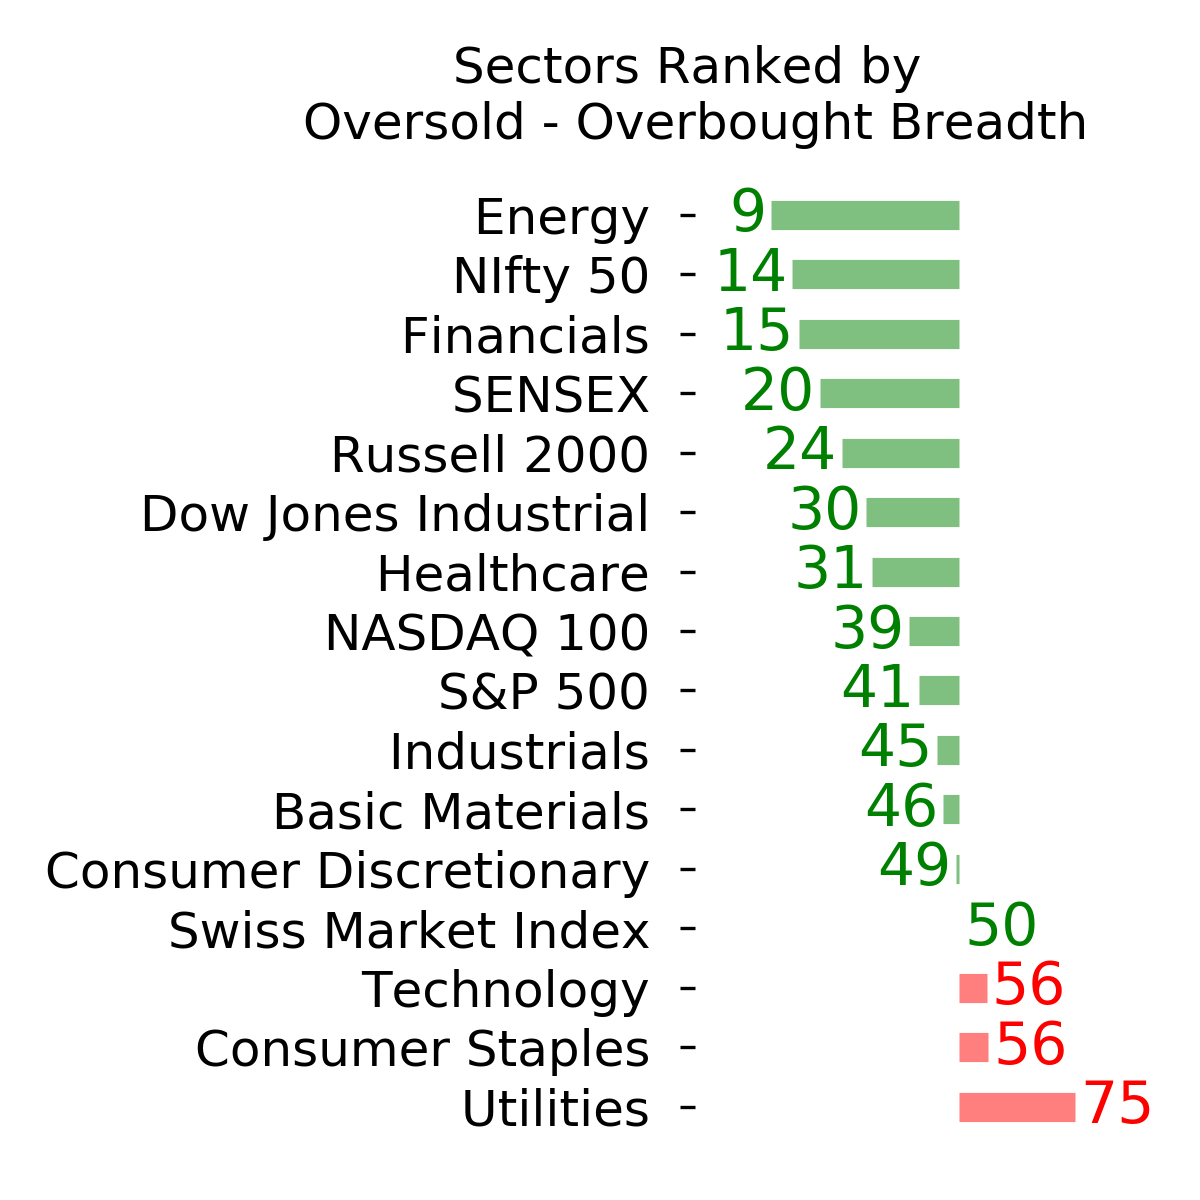
Ranks
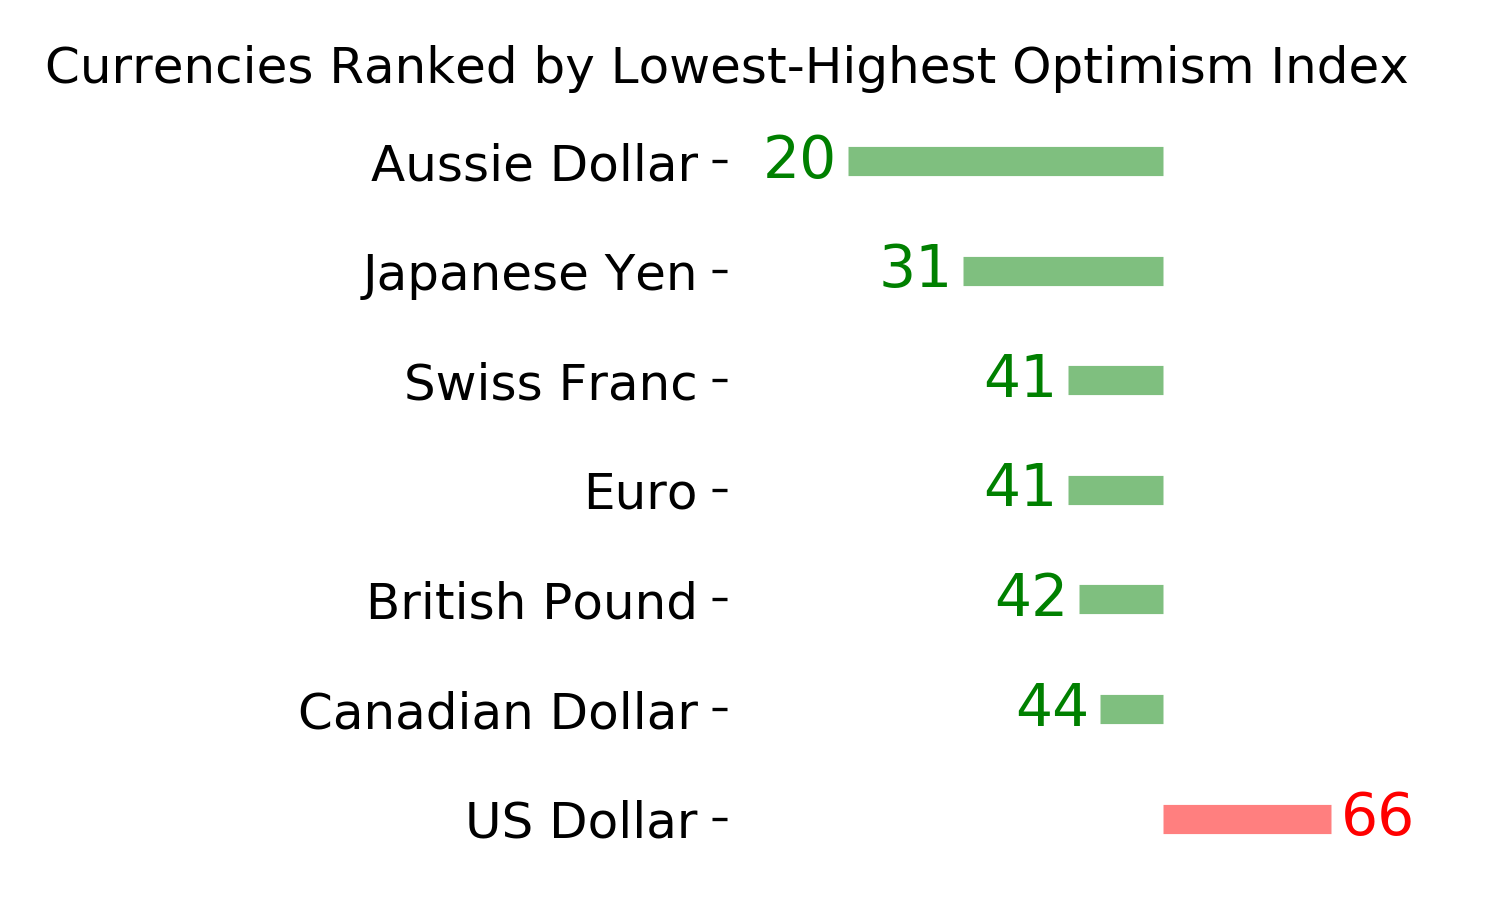
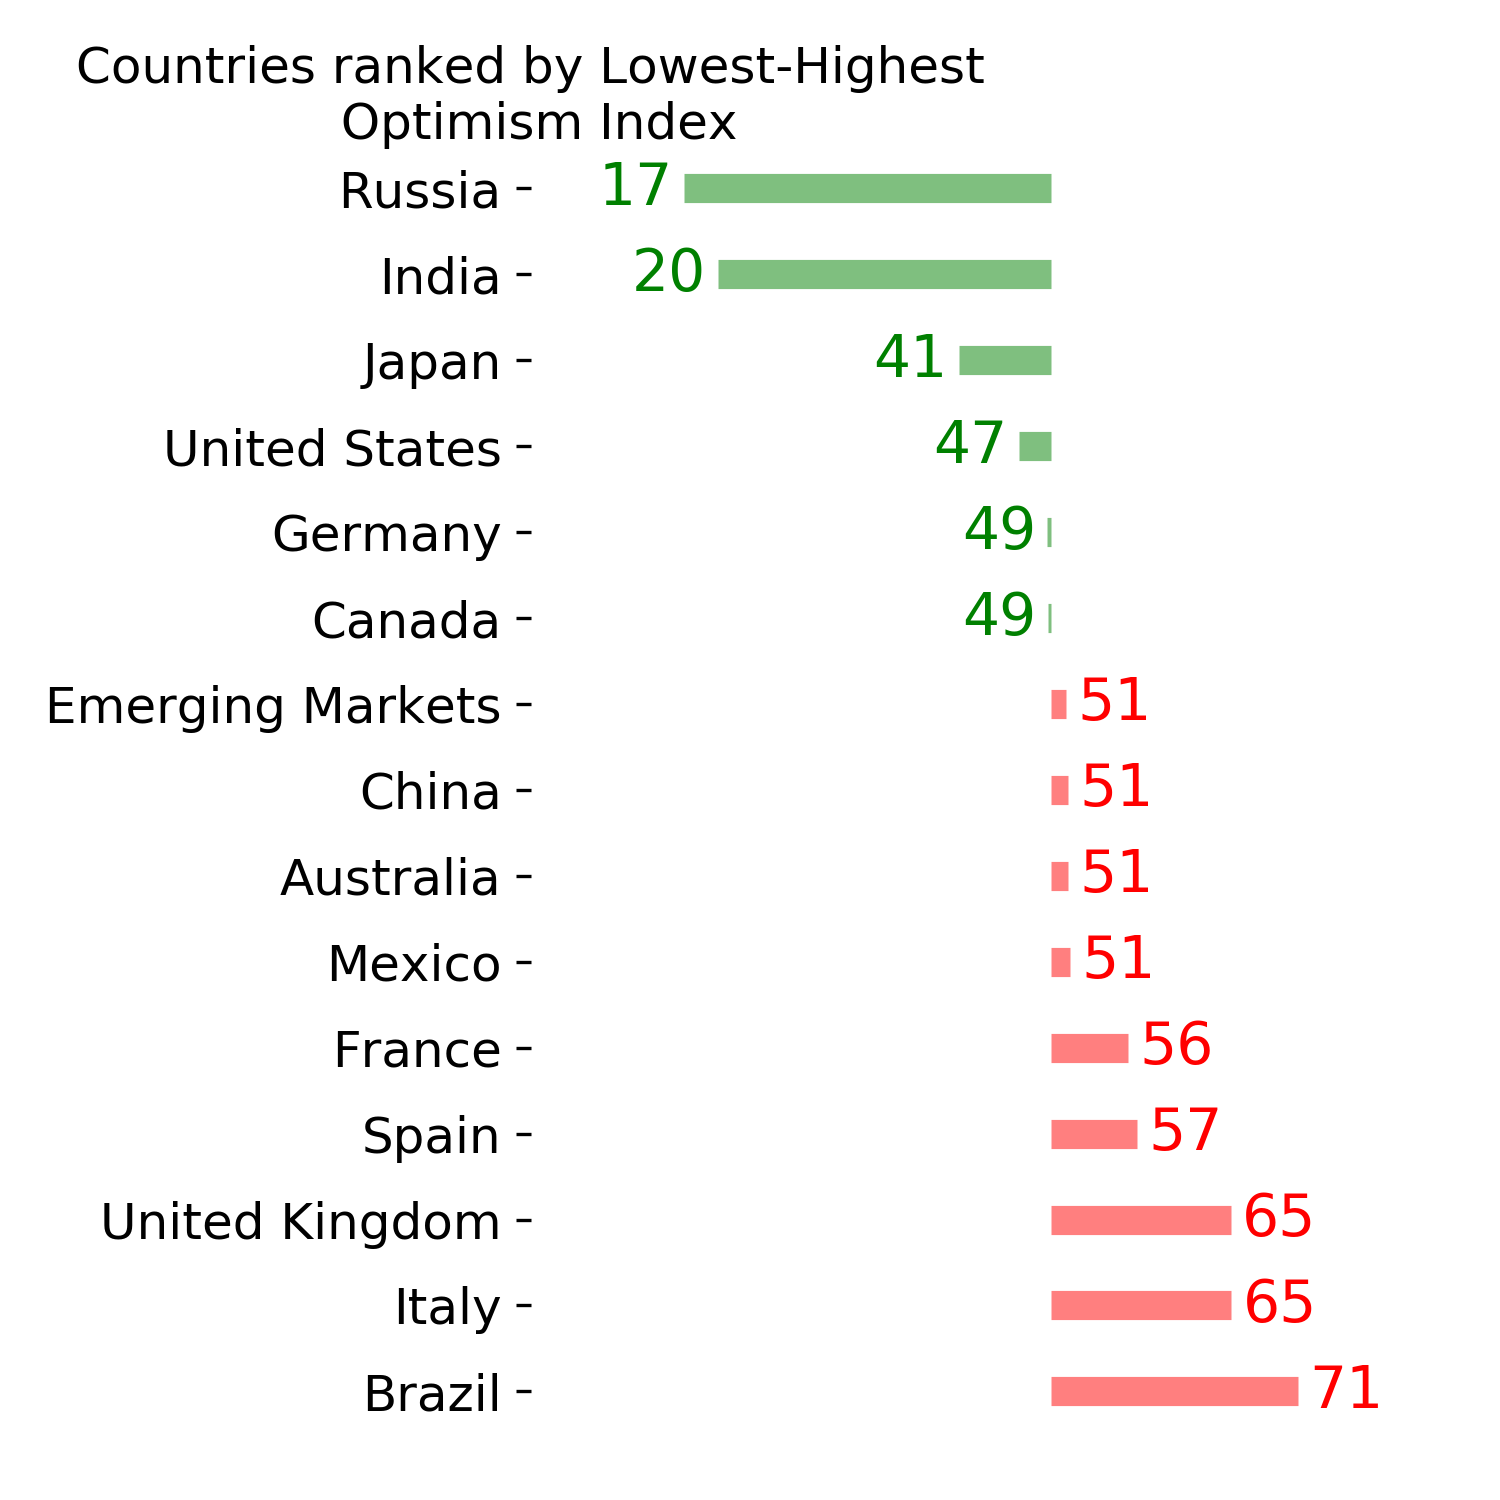
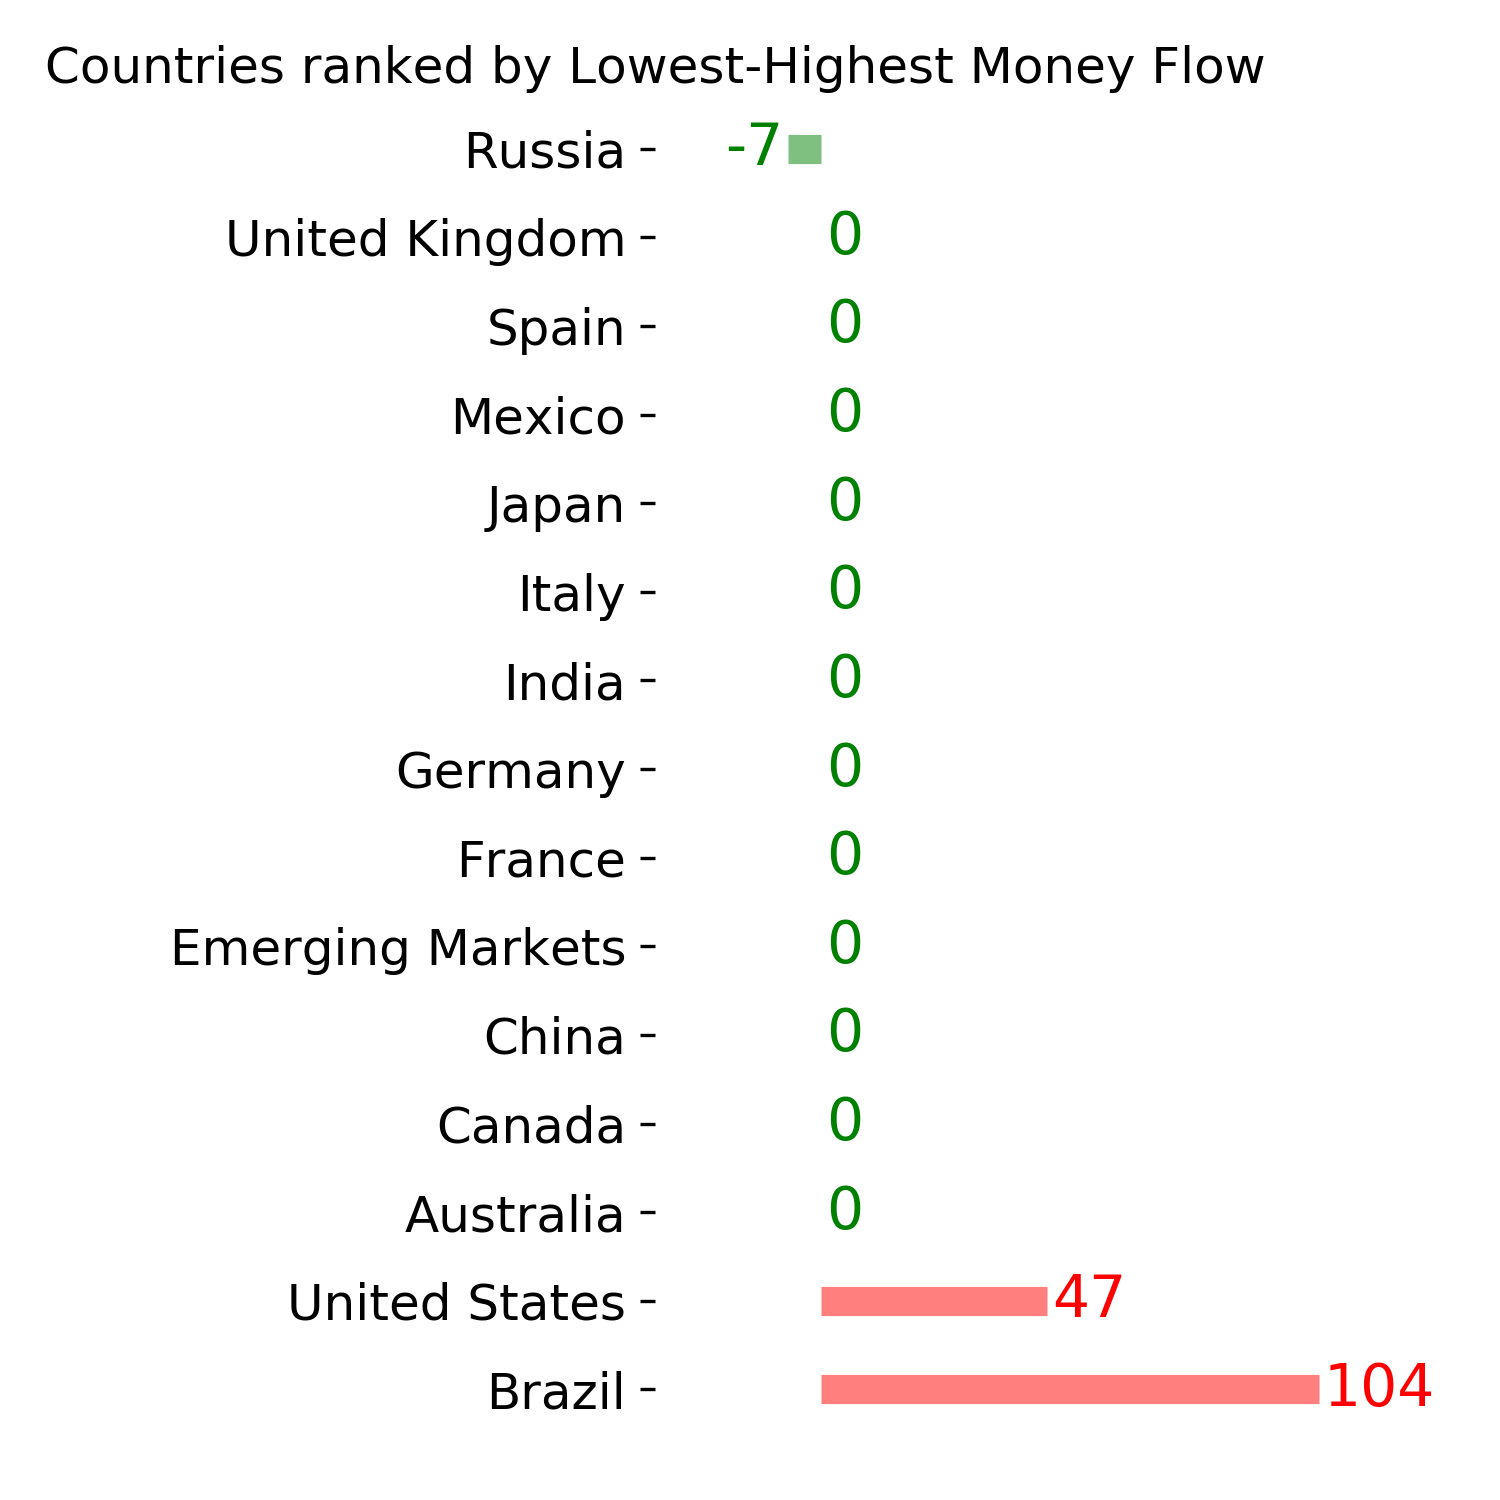
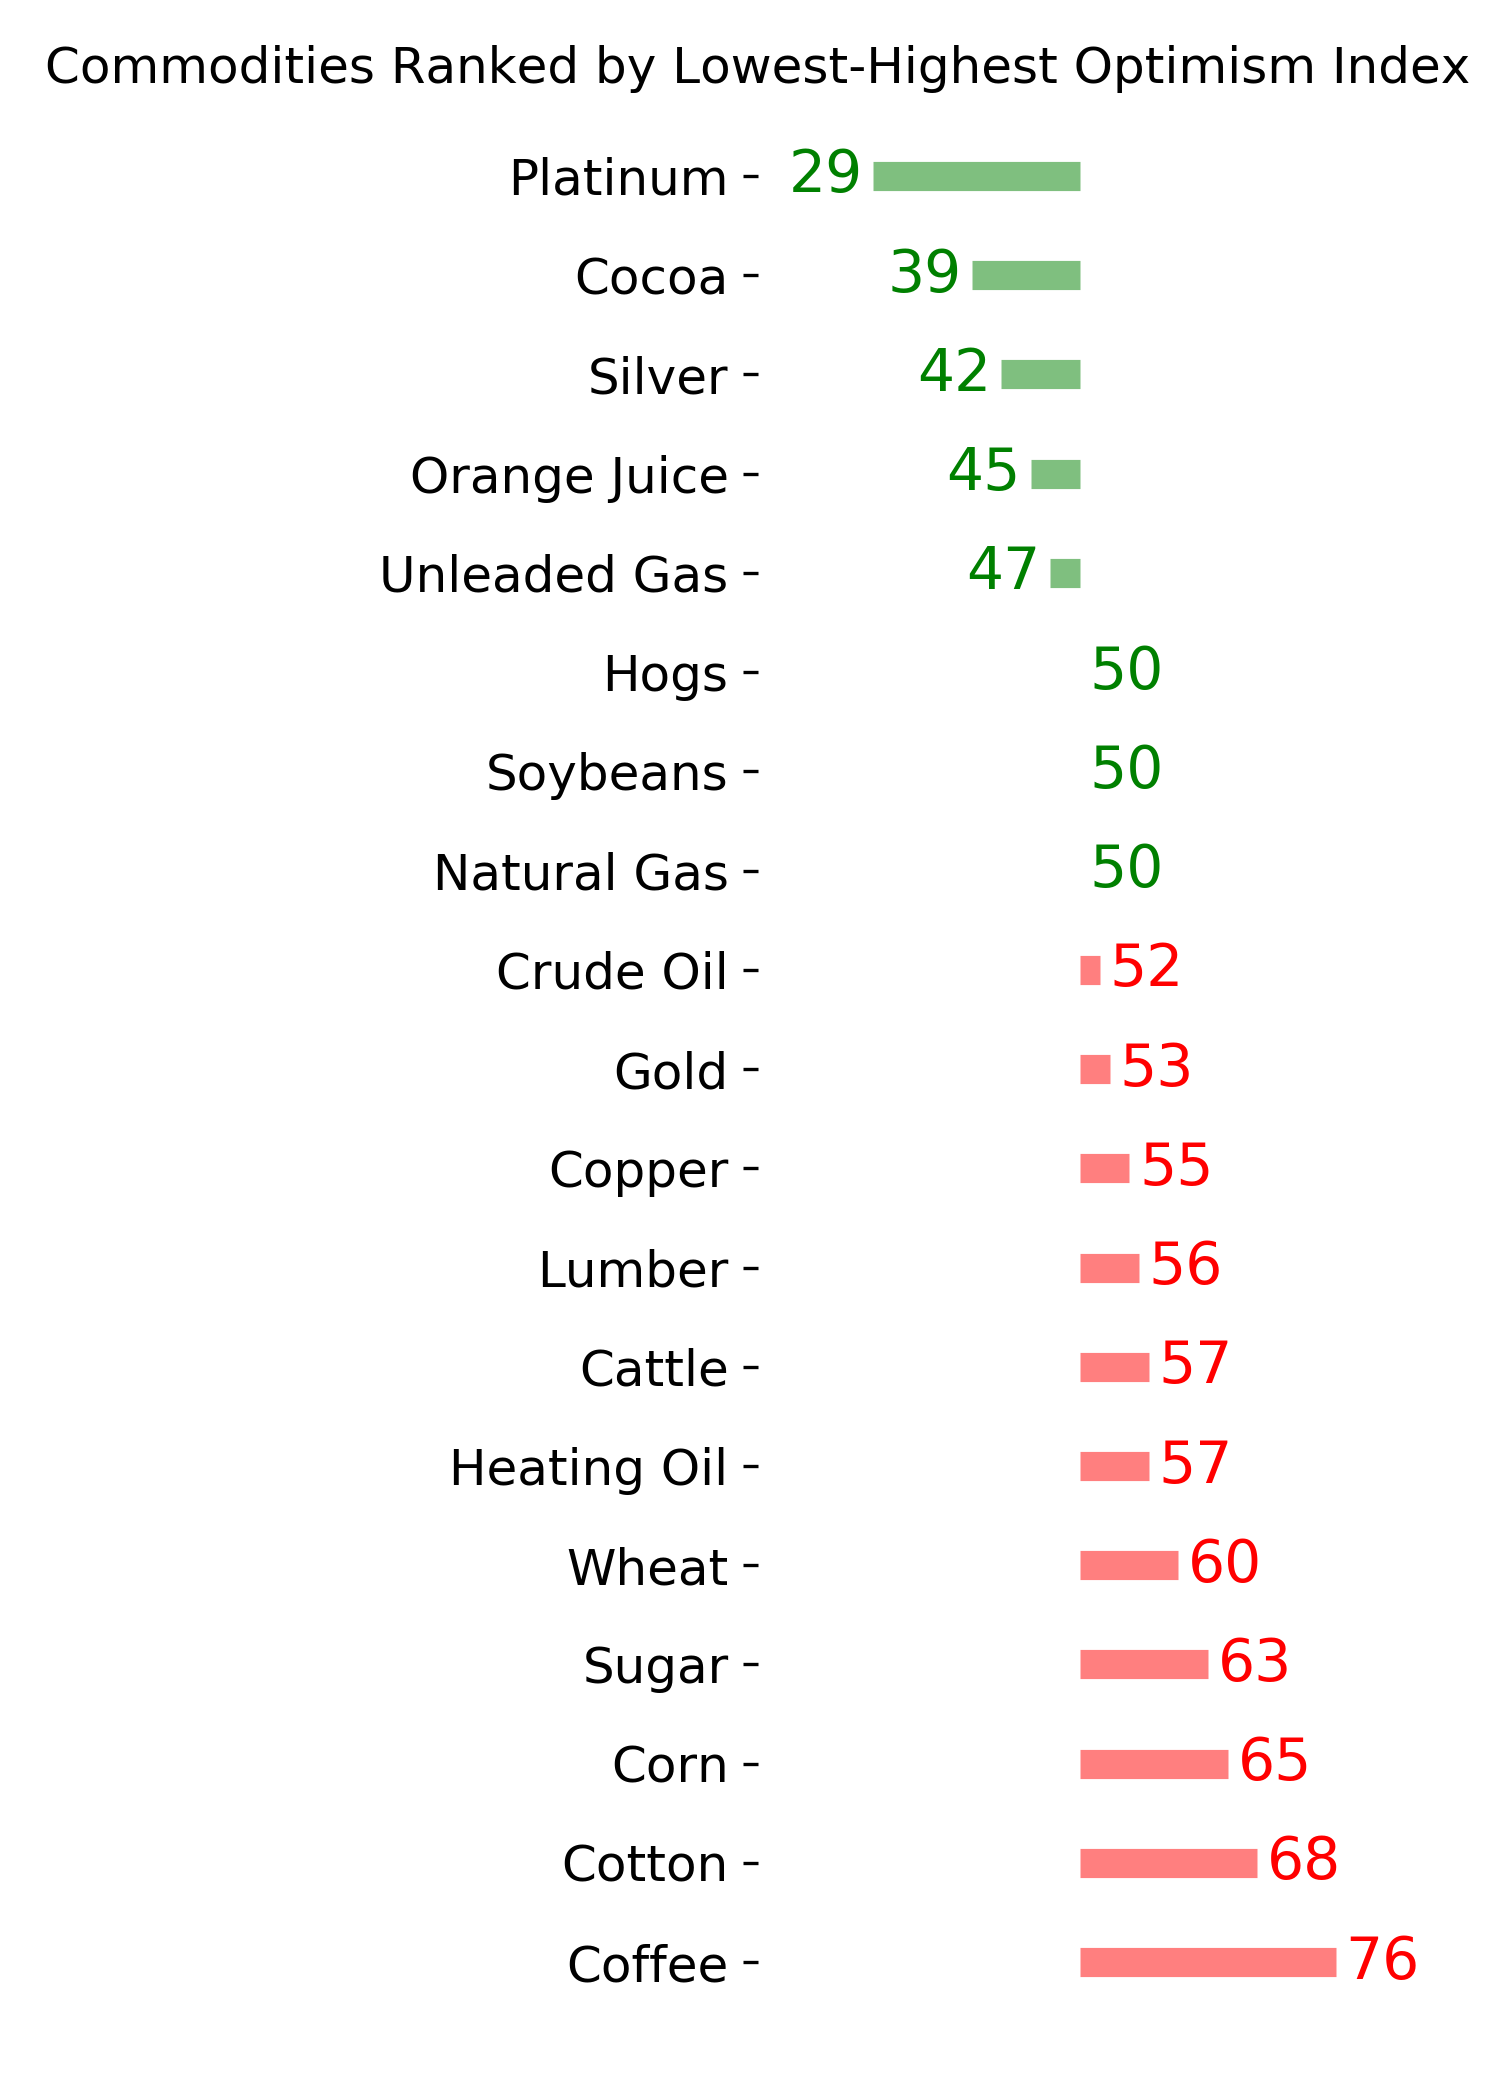
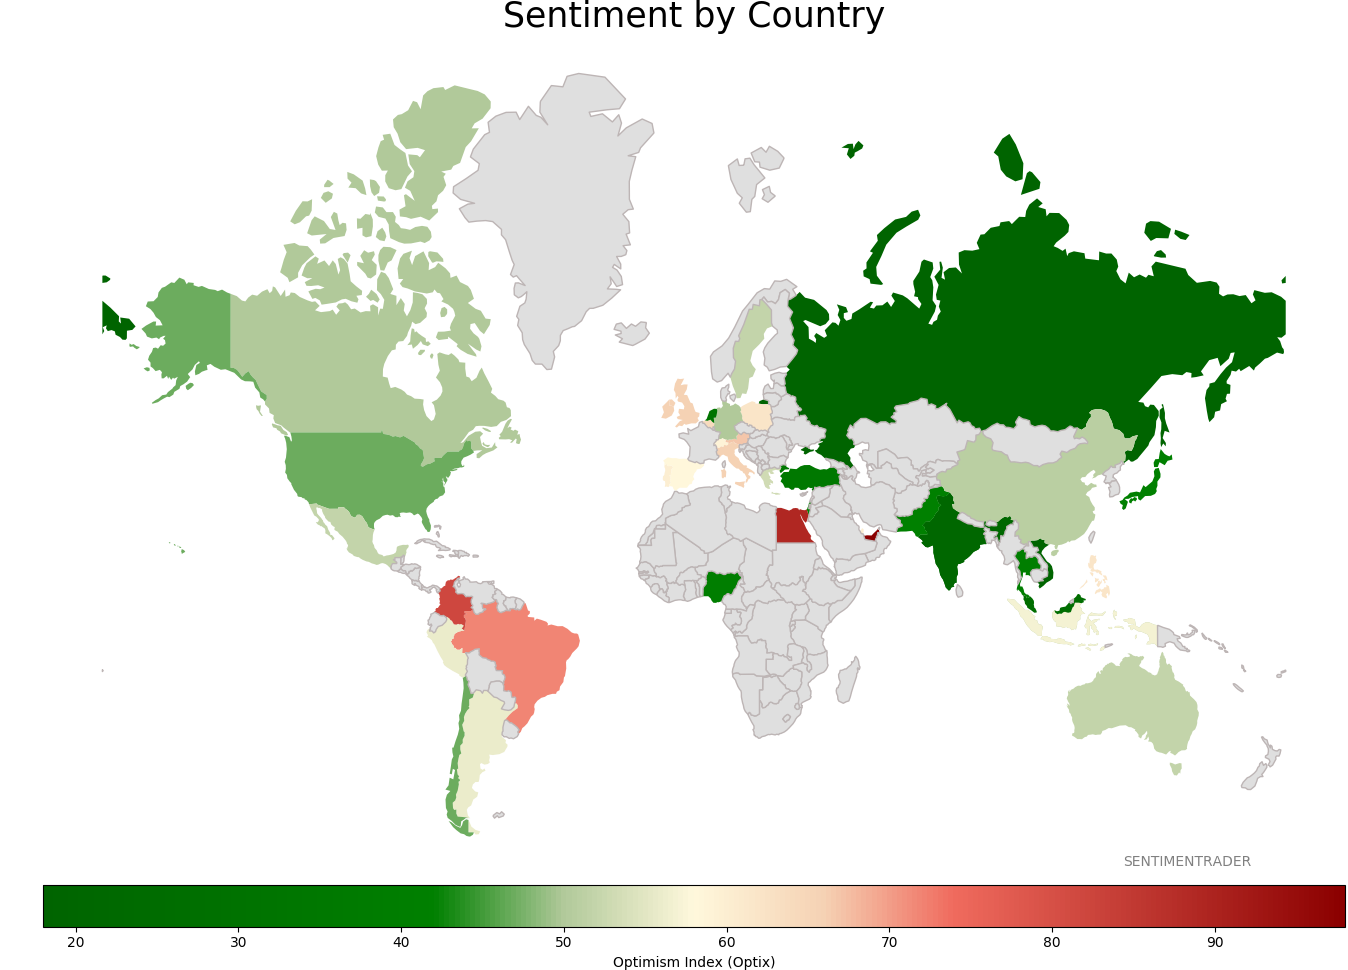
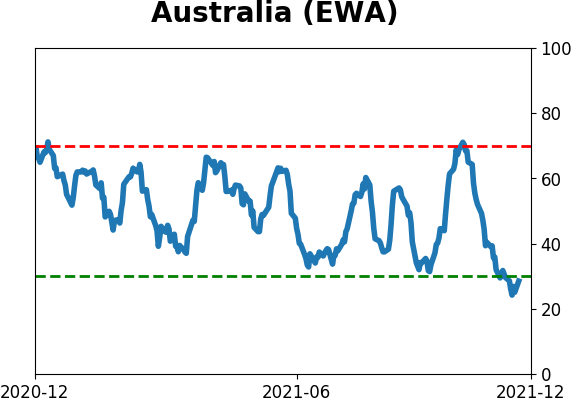
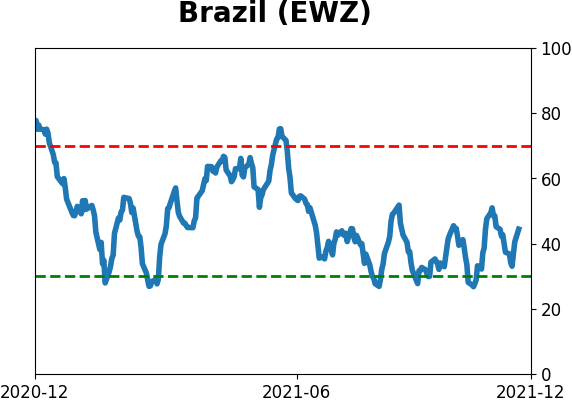
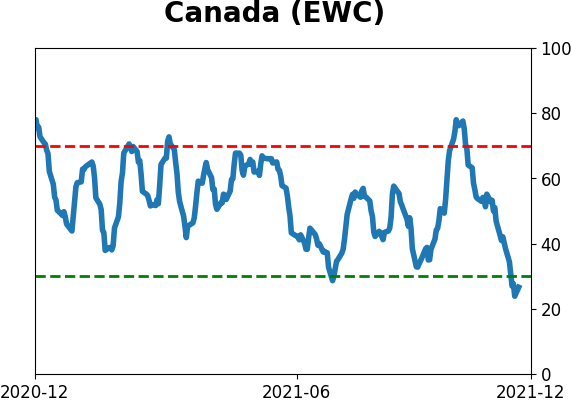
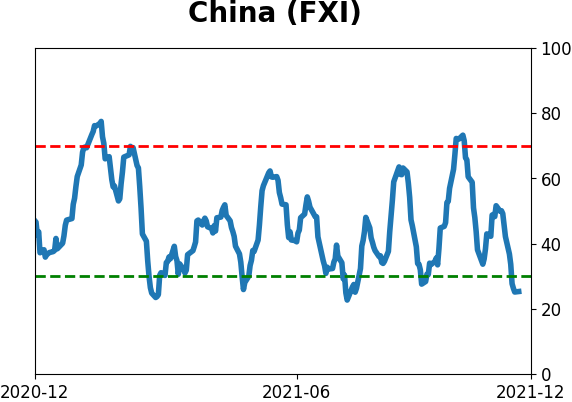
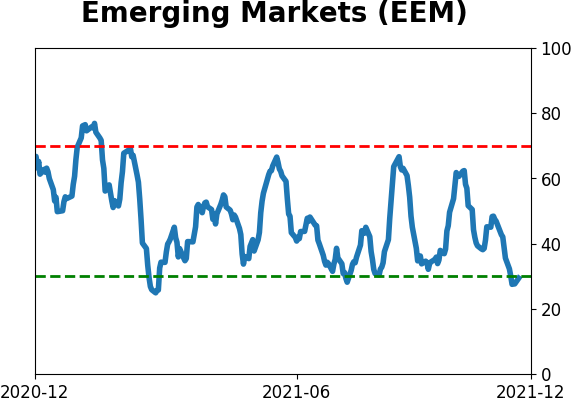
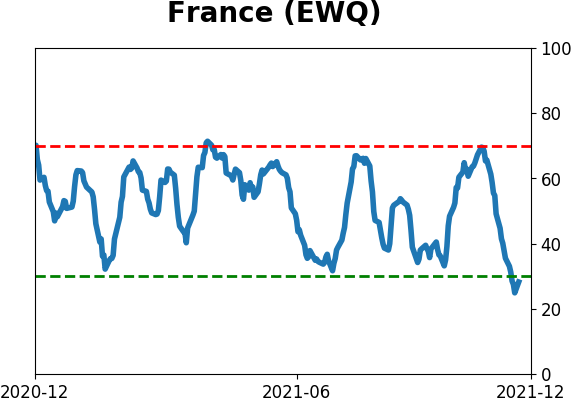
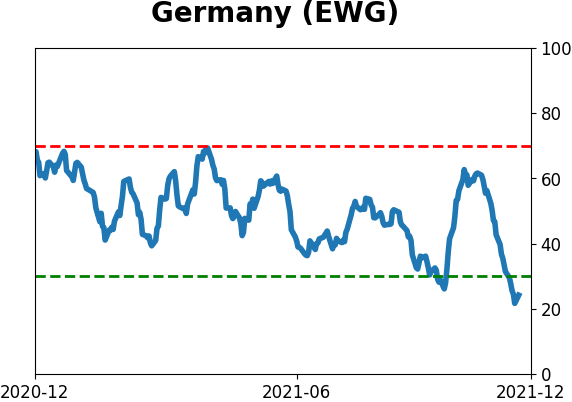
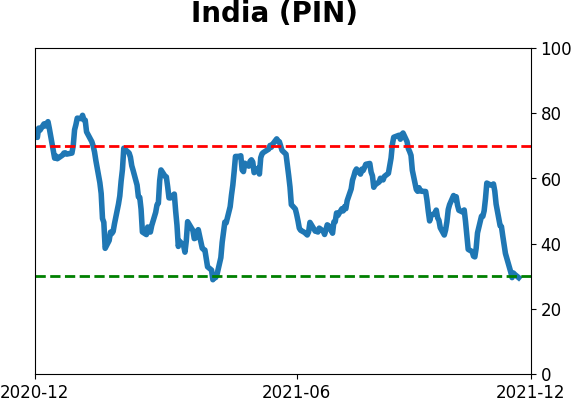
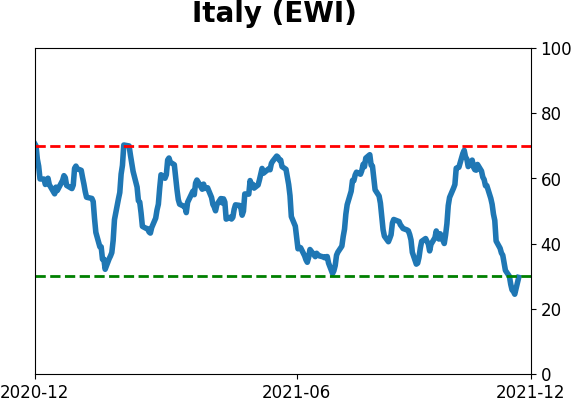
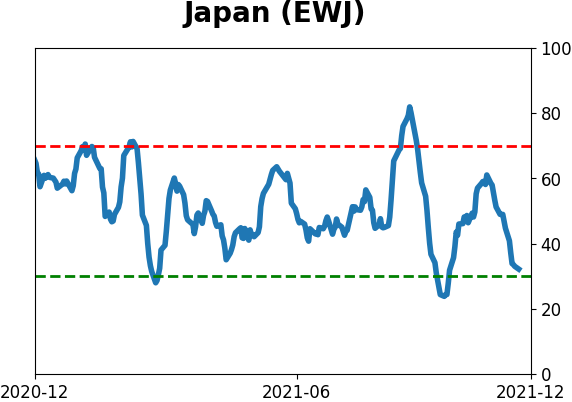
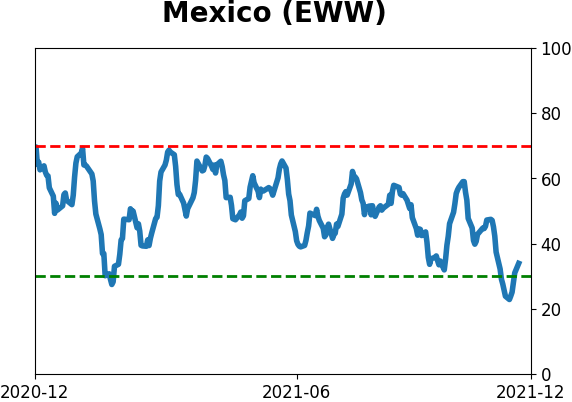
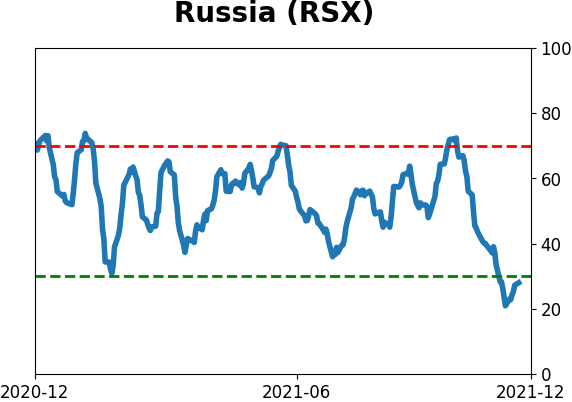
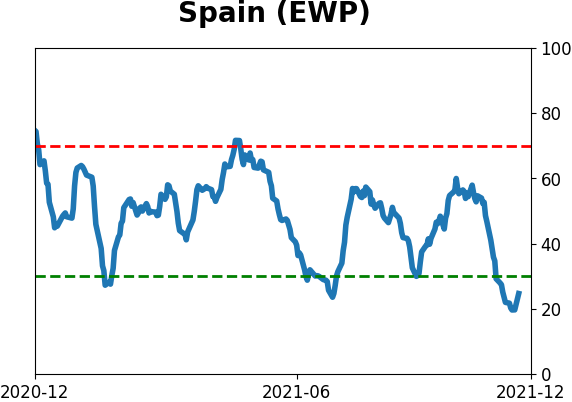
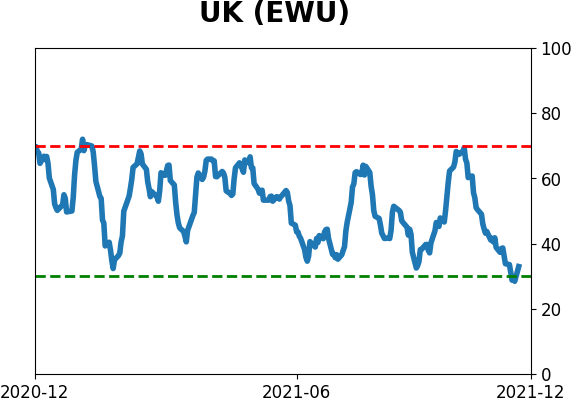
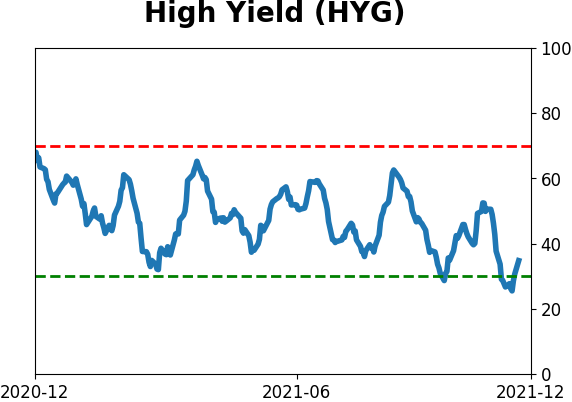
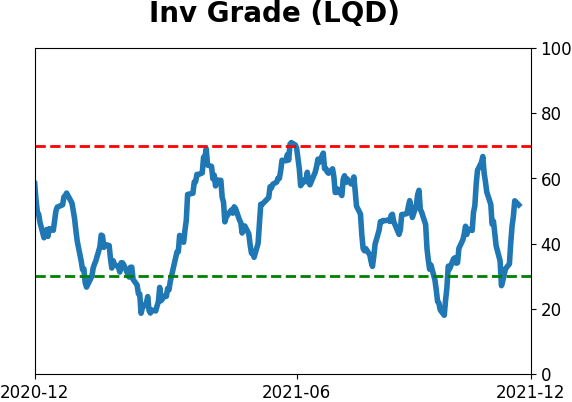
Sentiment Around The World
Optimism Index Thumbnails
|
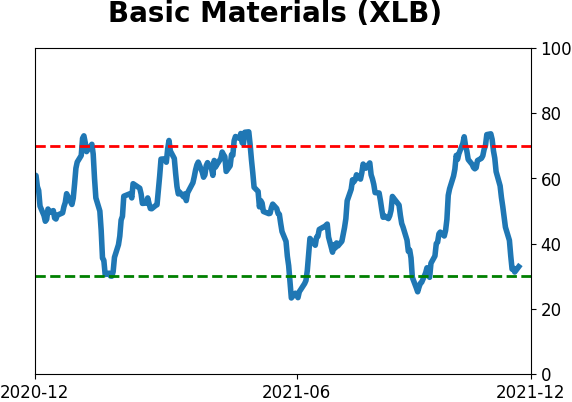
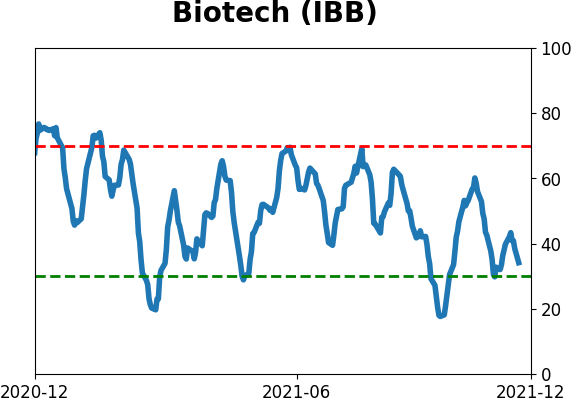
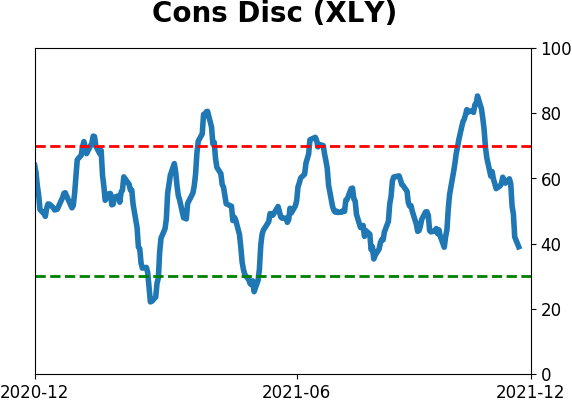
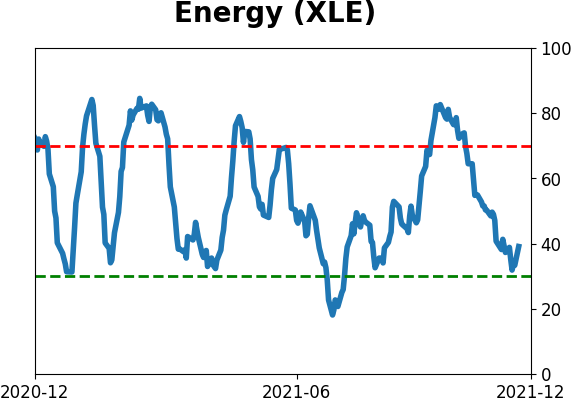
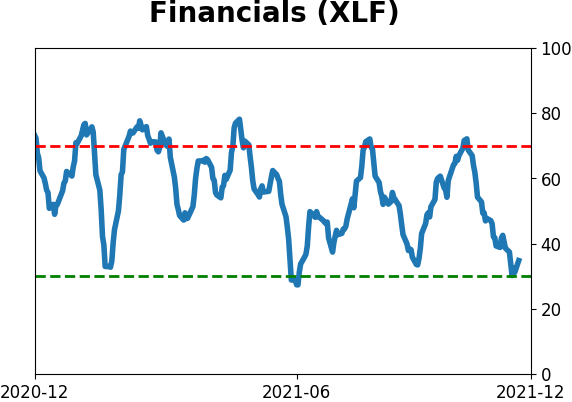
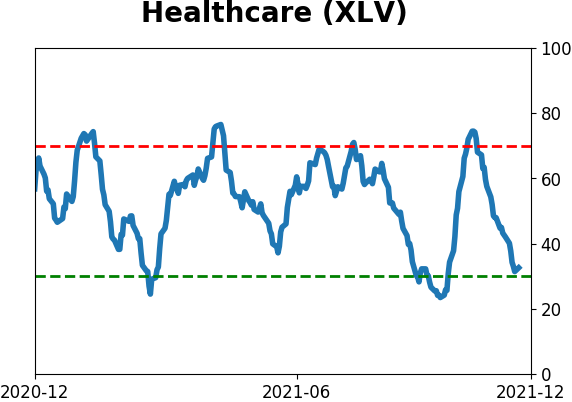
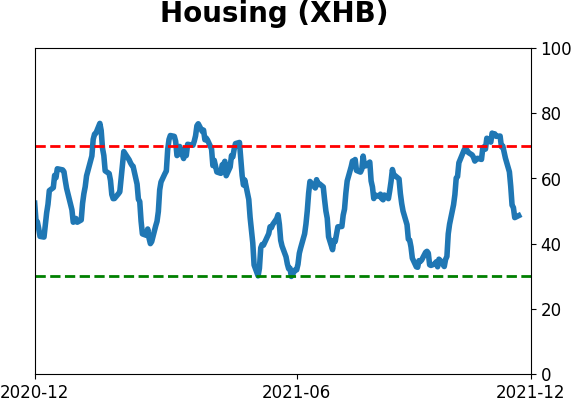
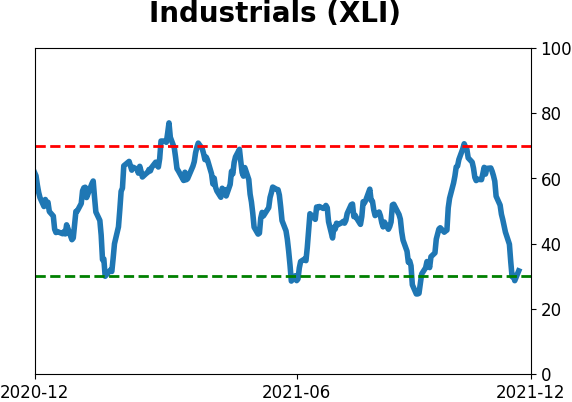
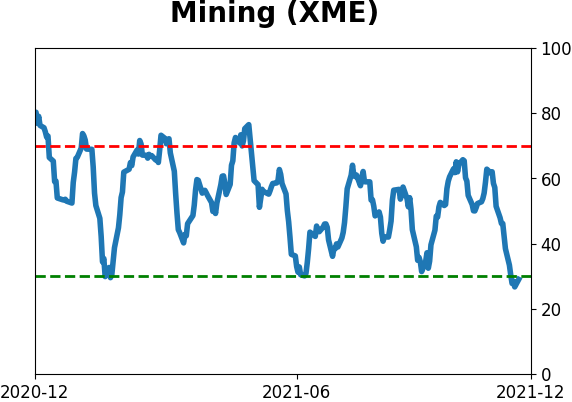
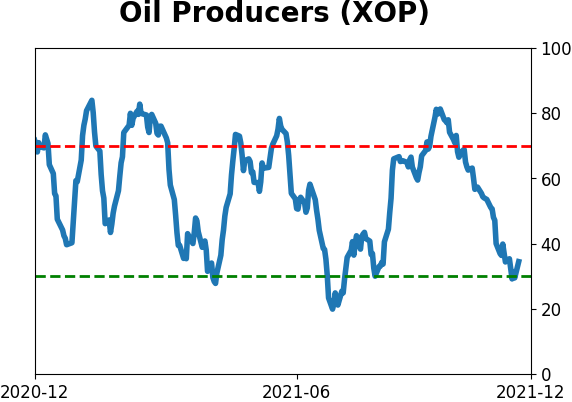
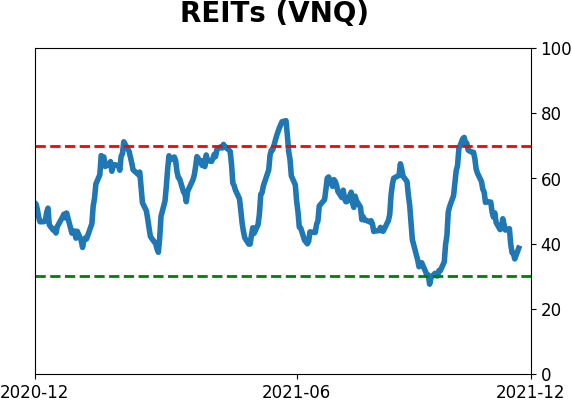
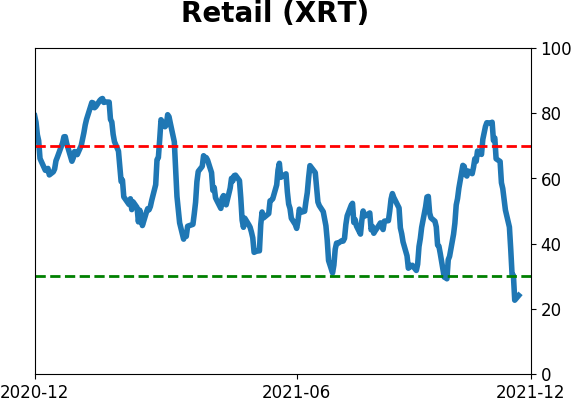
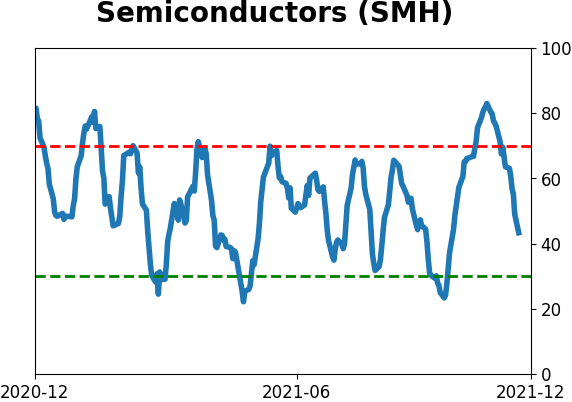
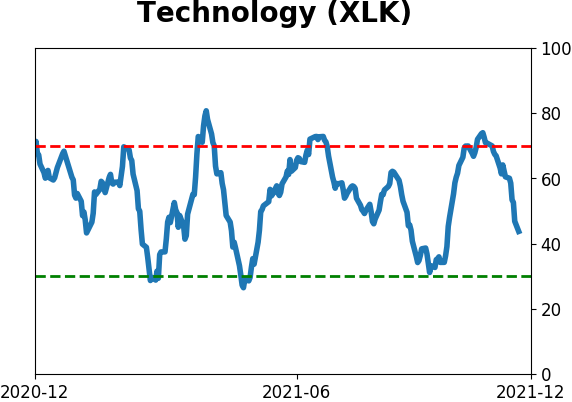
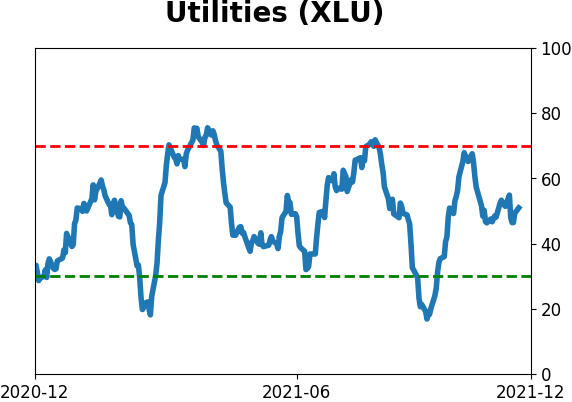
Sector ETF's - 10-Day Moving Average
|
|
|
Country ETF's - 10-Day Moving Average
|
|
|
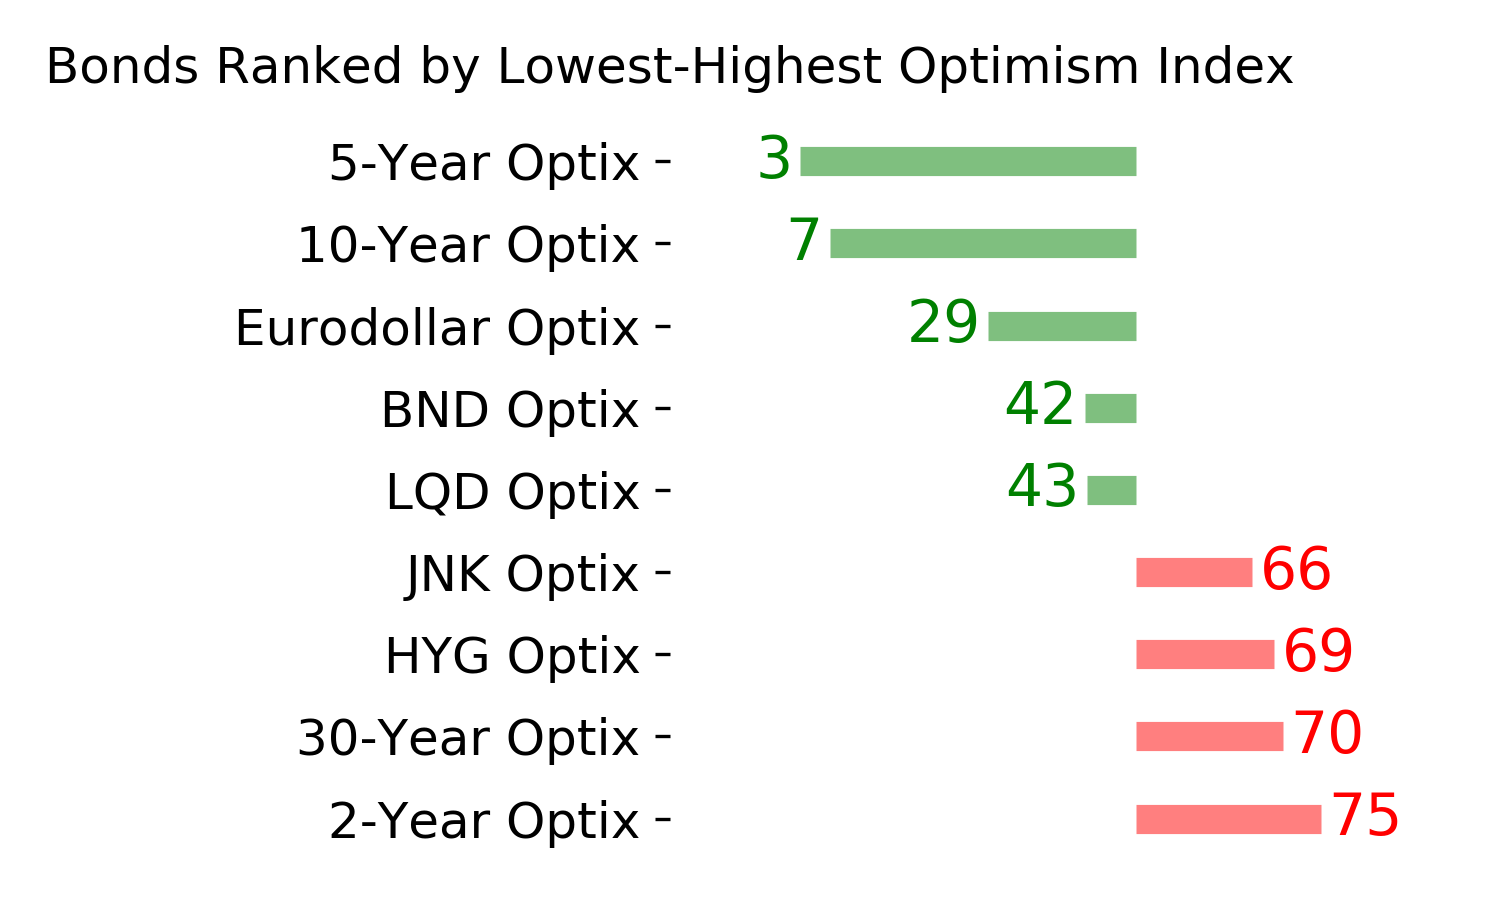
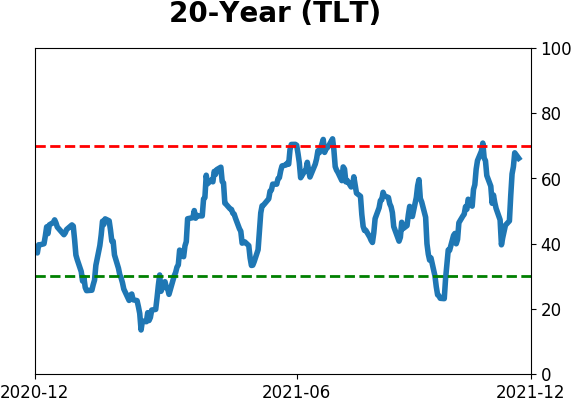
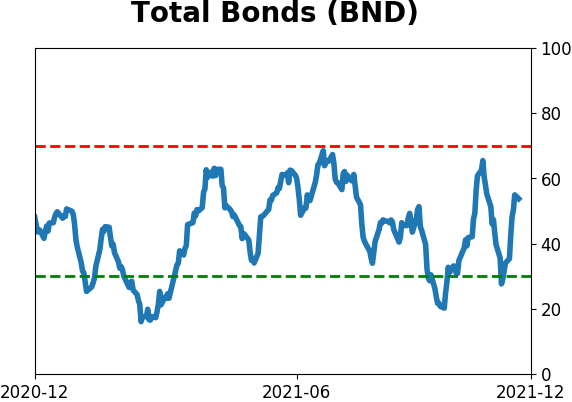
Bond ETF's - 10-Day Moving Average
|
|
|
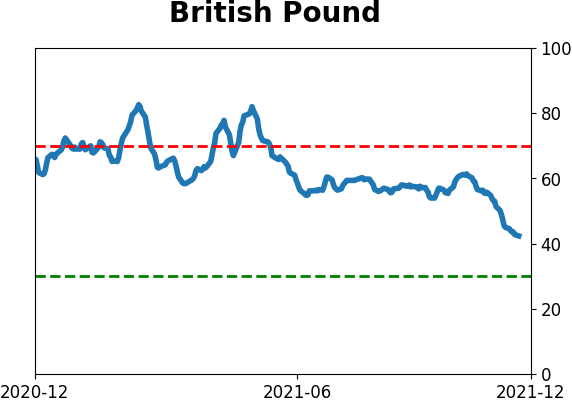
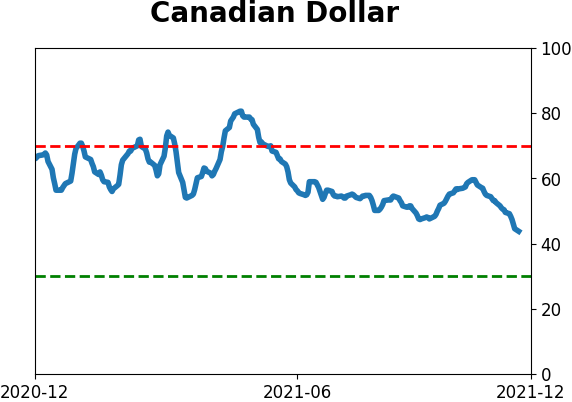
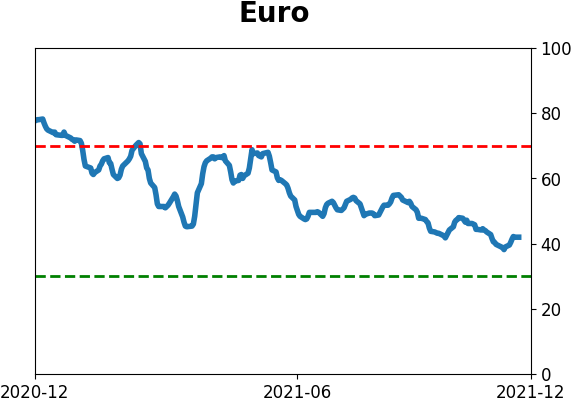
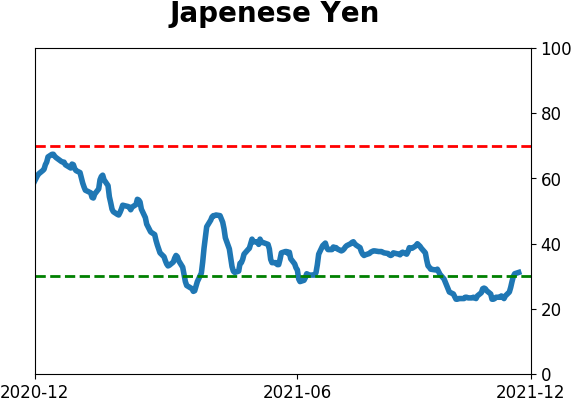
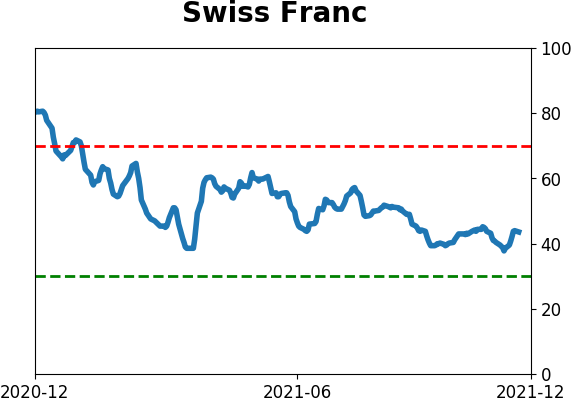
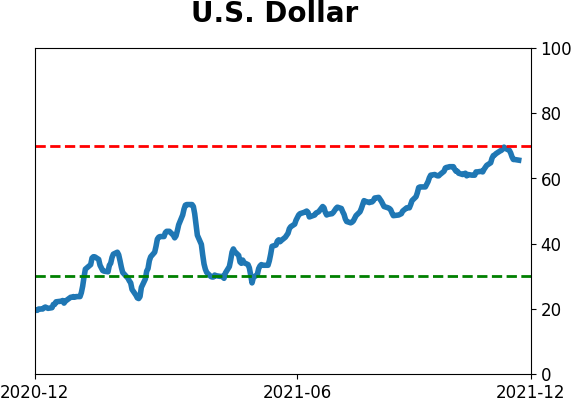
Currency ETF's - 5-Day Moving Average
|
|
|
Commodity ETF's - 5-Day Moving Average
|
|