Daily Report for 12-03-2021

| View/Print a PDF version of this Report |
Headlines
|
The latest Commitments of Traders report was released, covering positions through Tuesday: The 3-Year Min/Max Screen shows that "smart money" commercial hedgers pushed even further on their equity index short positions, primarily in the S&P 500. For the first time ever, they're holding more than $100 billion worth of contracts net short. This is counter to how they typically behave, and we've been noting for over a year that this data is acting oddly compared to how it did in the prior decade. So, it seems worrisome, but we're not putting a lot of weight on it. Elsewhere, they moved to a multi-year long position in the Mexican peso, but that currency can get stuck in a rut like few others. Hedgers remain heavily long 10-year Treasury note futures. In cocoa, they're net long more than 5,000 contracts, which the Backtest Engine shows led to an average 4.7% gain over the next 3 months during the past 15 years. Bottom Line: STOCKS: Hold By early October, sentiment had reset. Several important momentum streaks ended, which has brought in buyers in the past, and seasonality turned positive. We're now seeing signs that sentiment has quickly shifted, especially among options traders. It's gotten to an extreme that has preceded weaker-than-average returns. BONDS: Hold In late October, sentiment on bonds - from Treasuries to corporates - entered pessimistic territory. It's now starting to recover, with some quick moves in corporate bonds. We'll see if those bonds, in particular, can hold recent gains. GOLD: Hold |
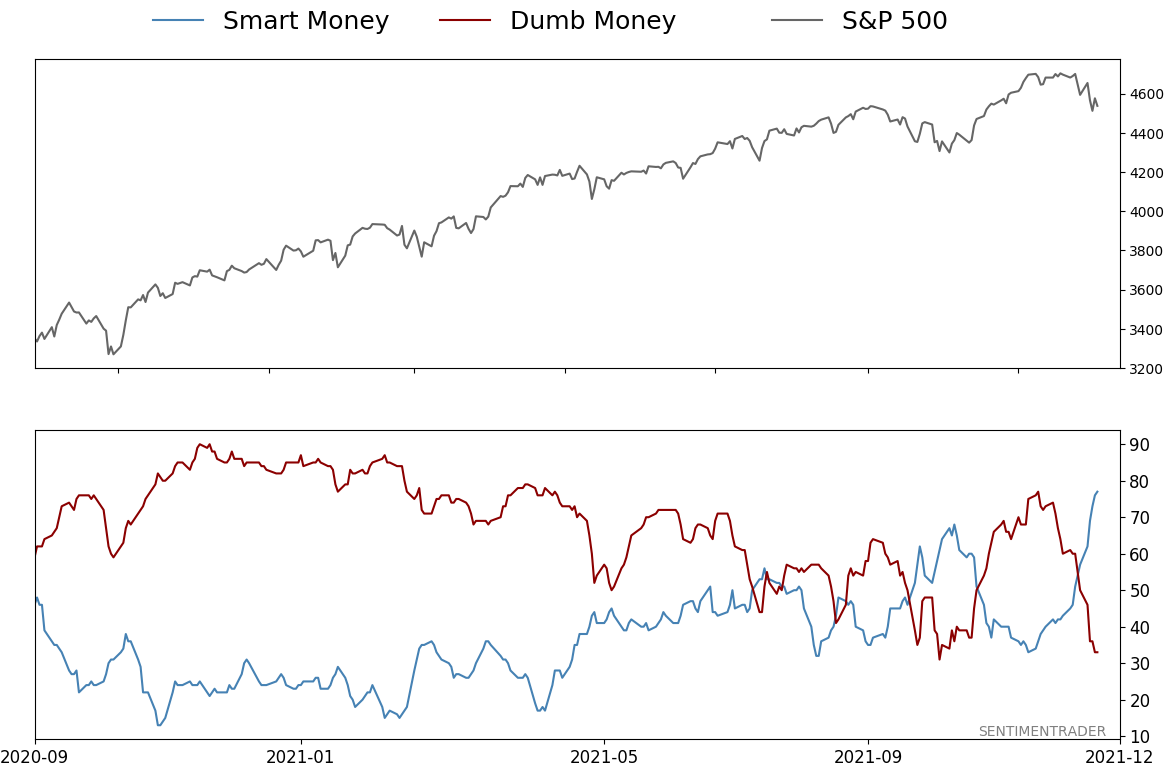
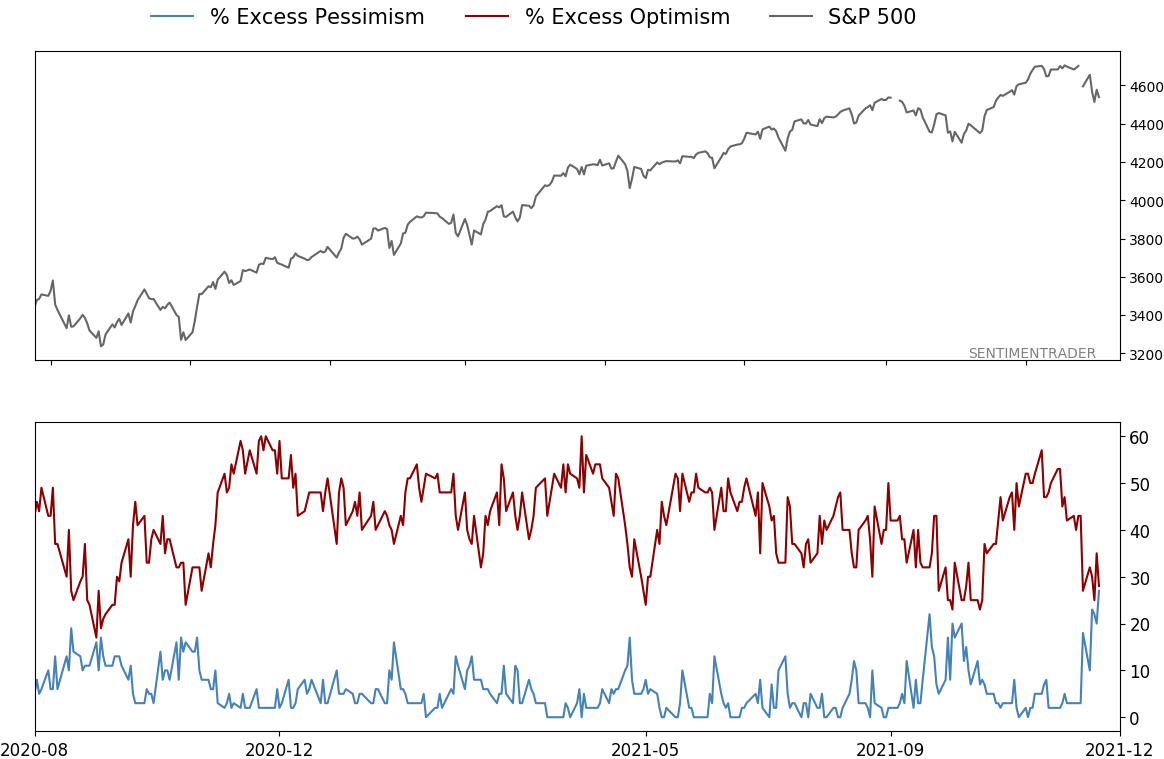
Smart / Dumb Money Confidence
|
|
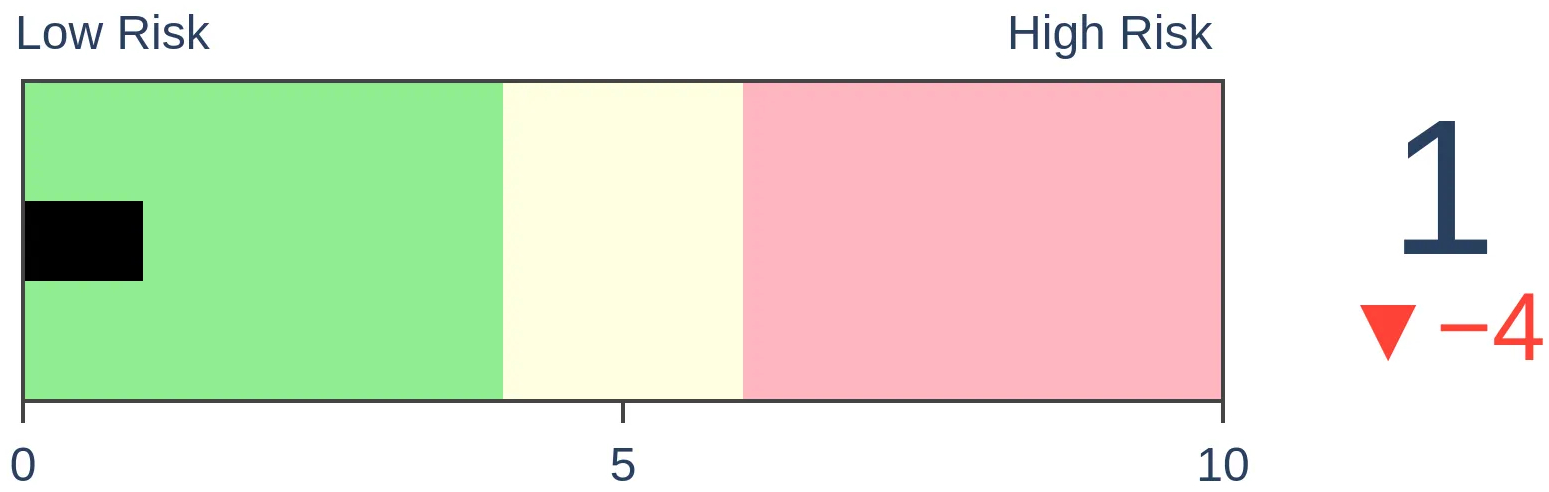
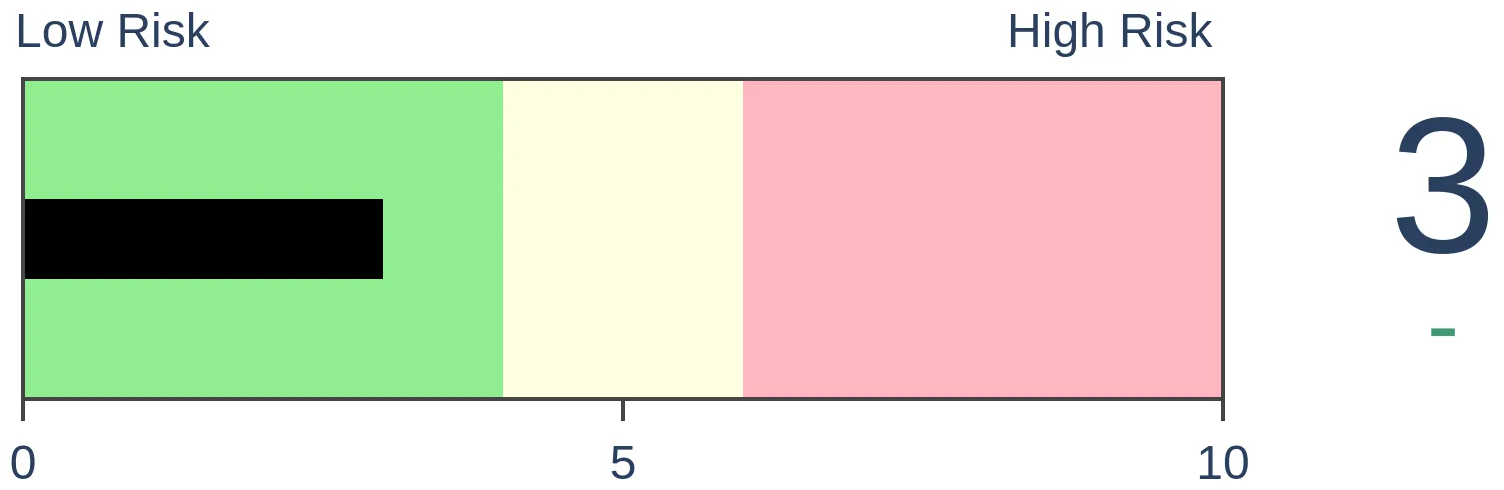
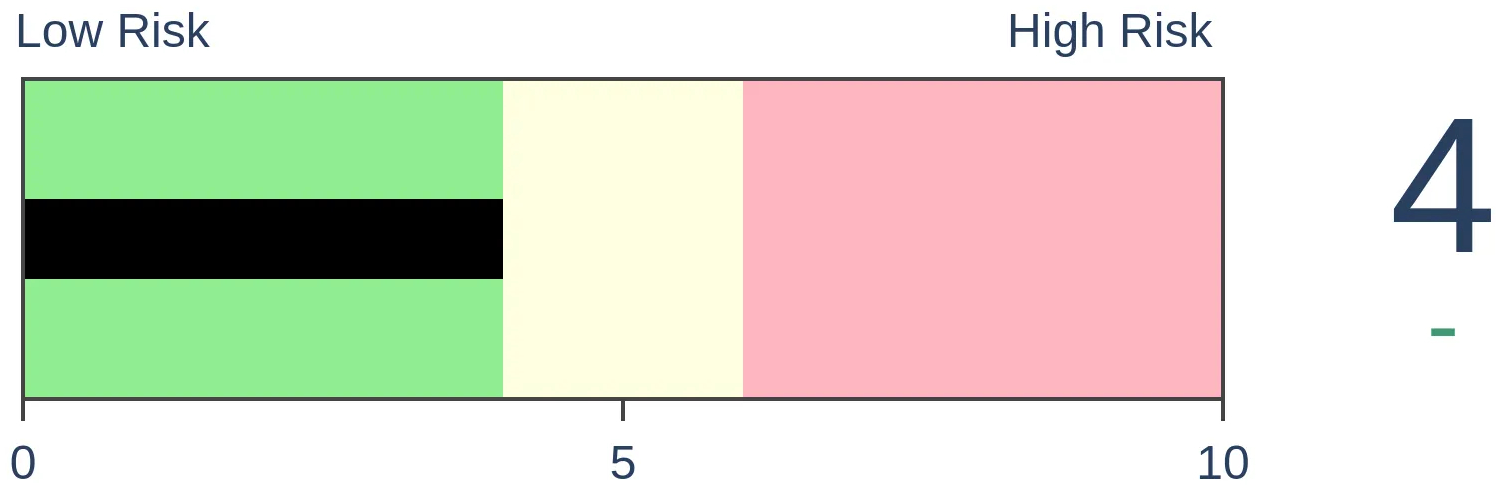
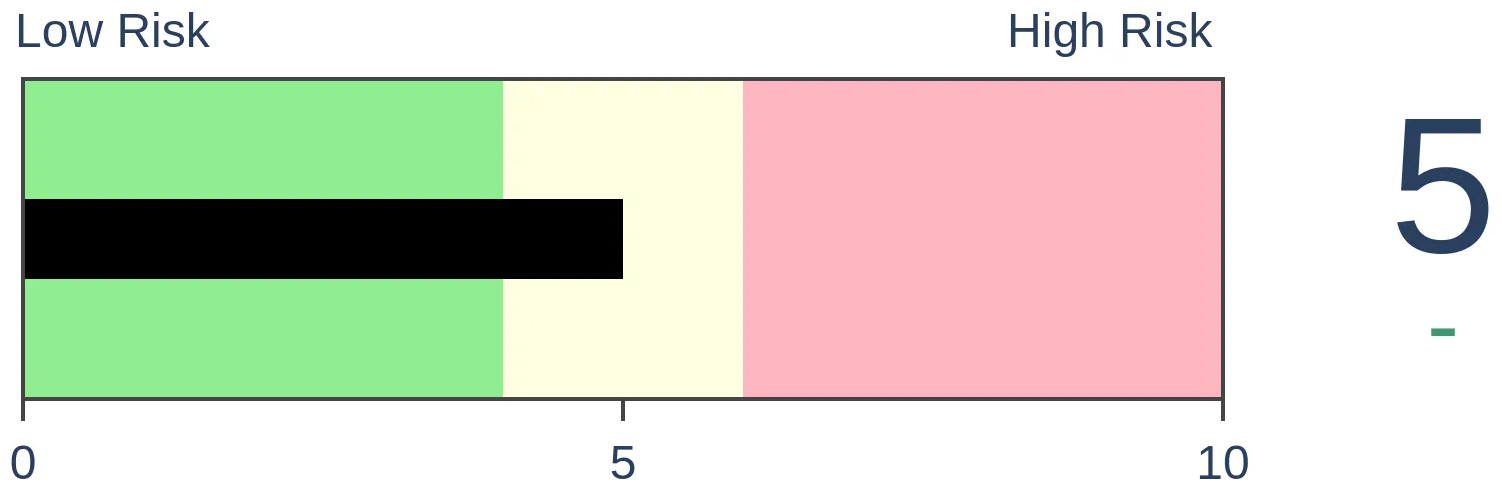
Risk Levels
|
|

|

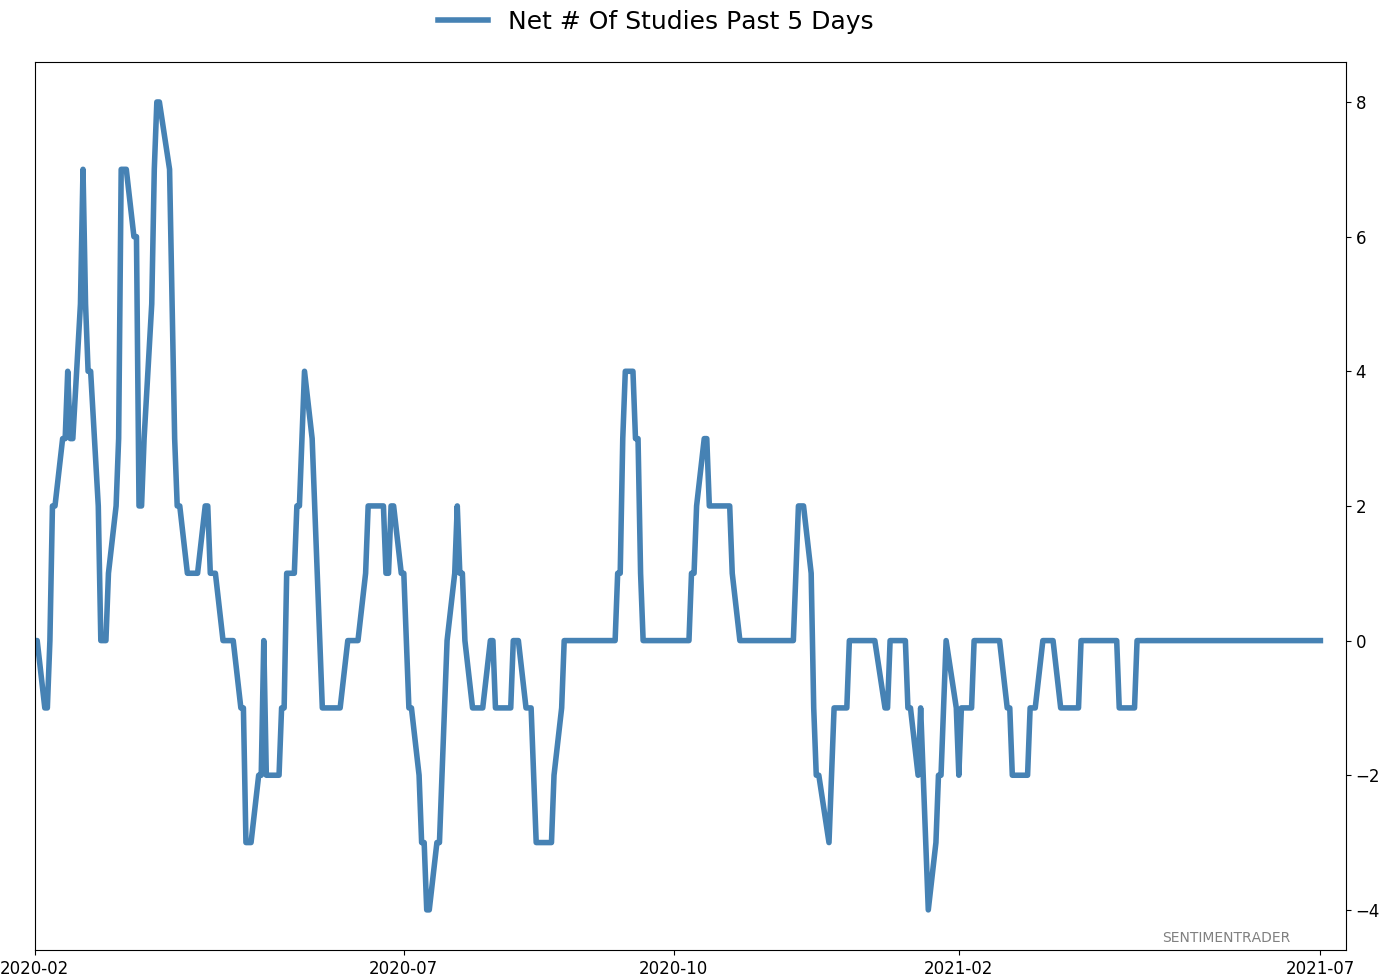
Active Studies
|
|
|
|
|
|
Indicators at Extremes
|
|
|
Portfolio
|
|
|
|
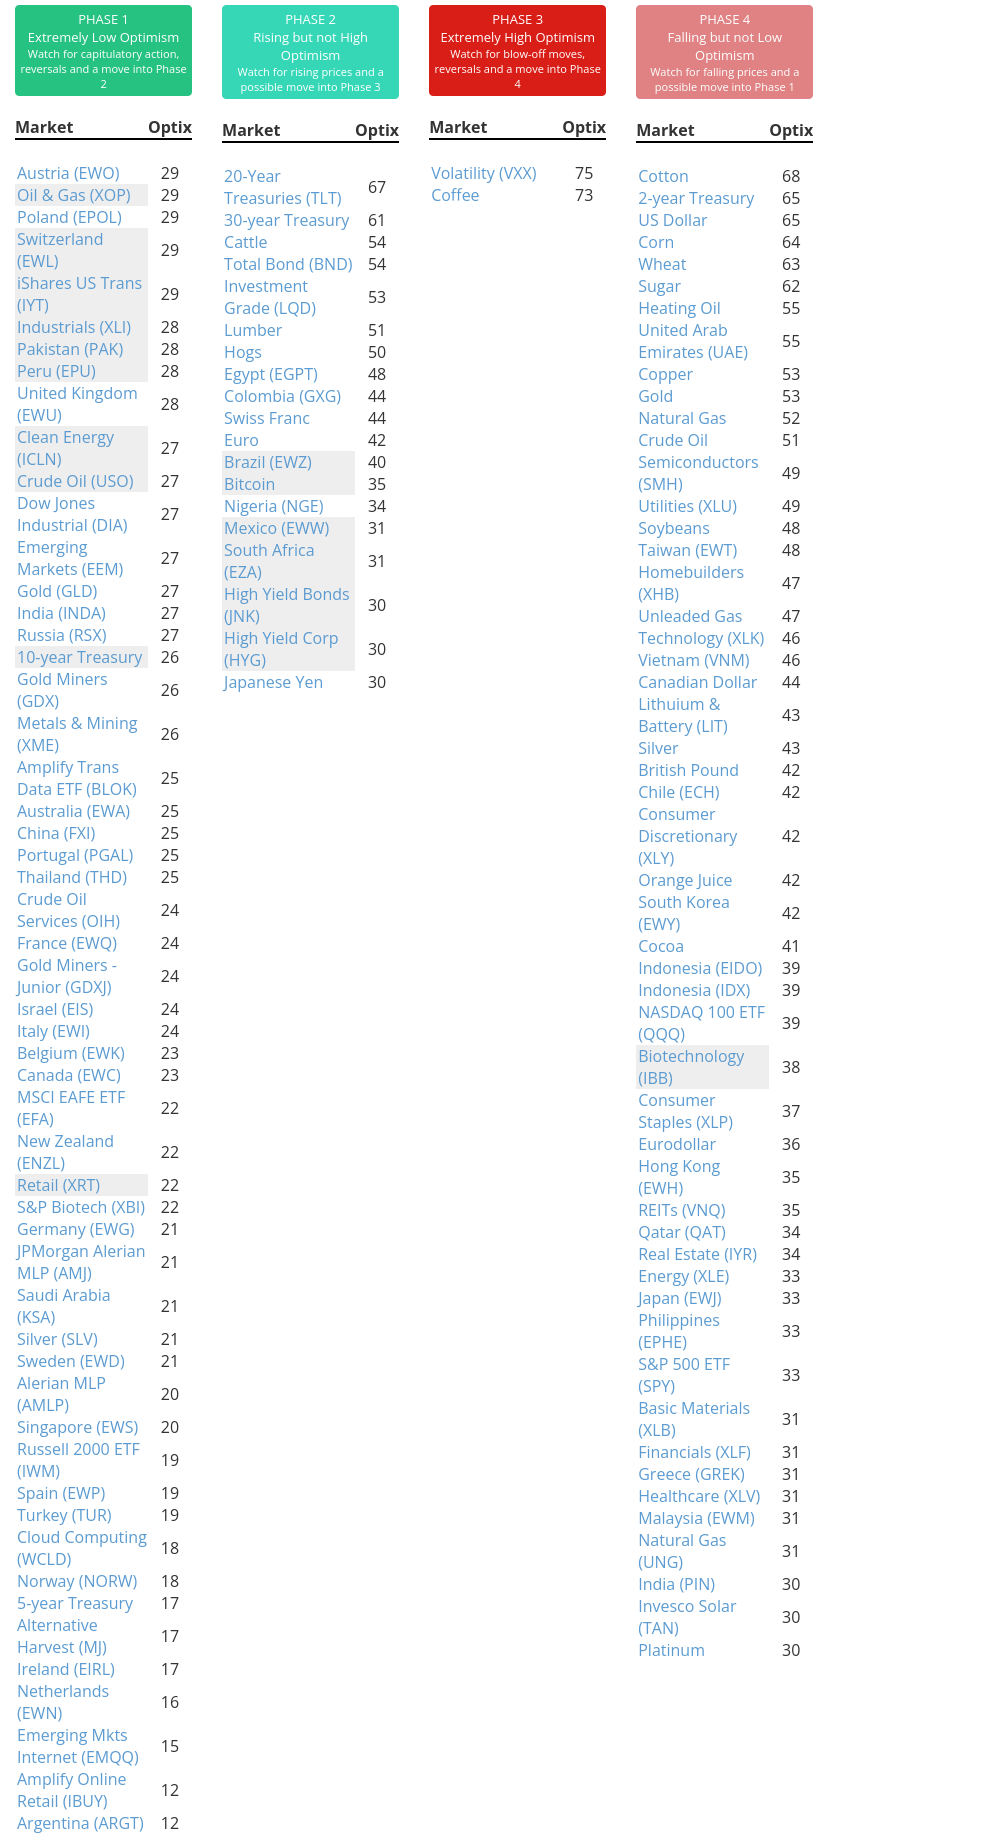
Phase Table
|
|
|
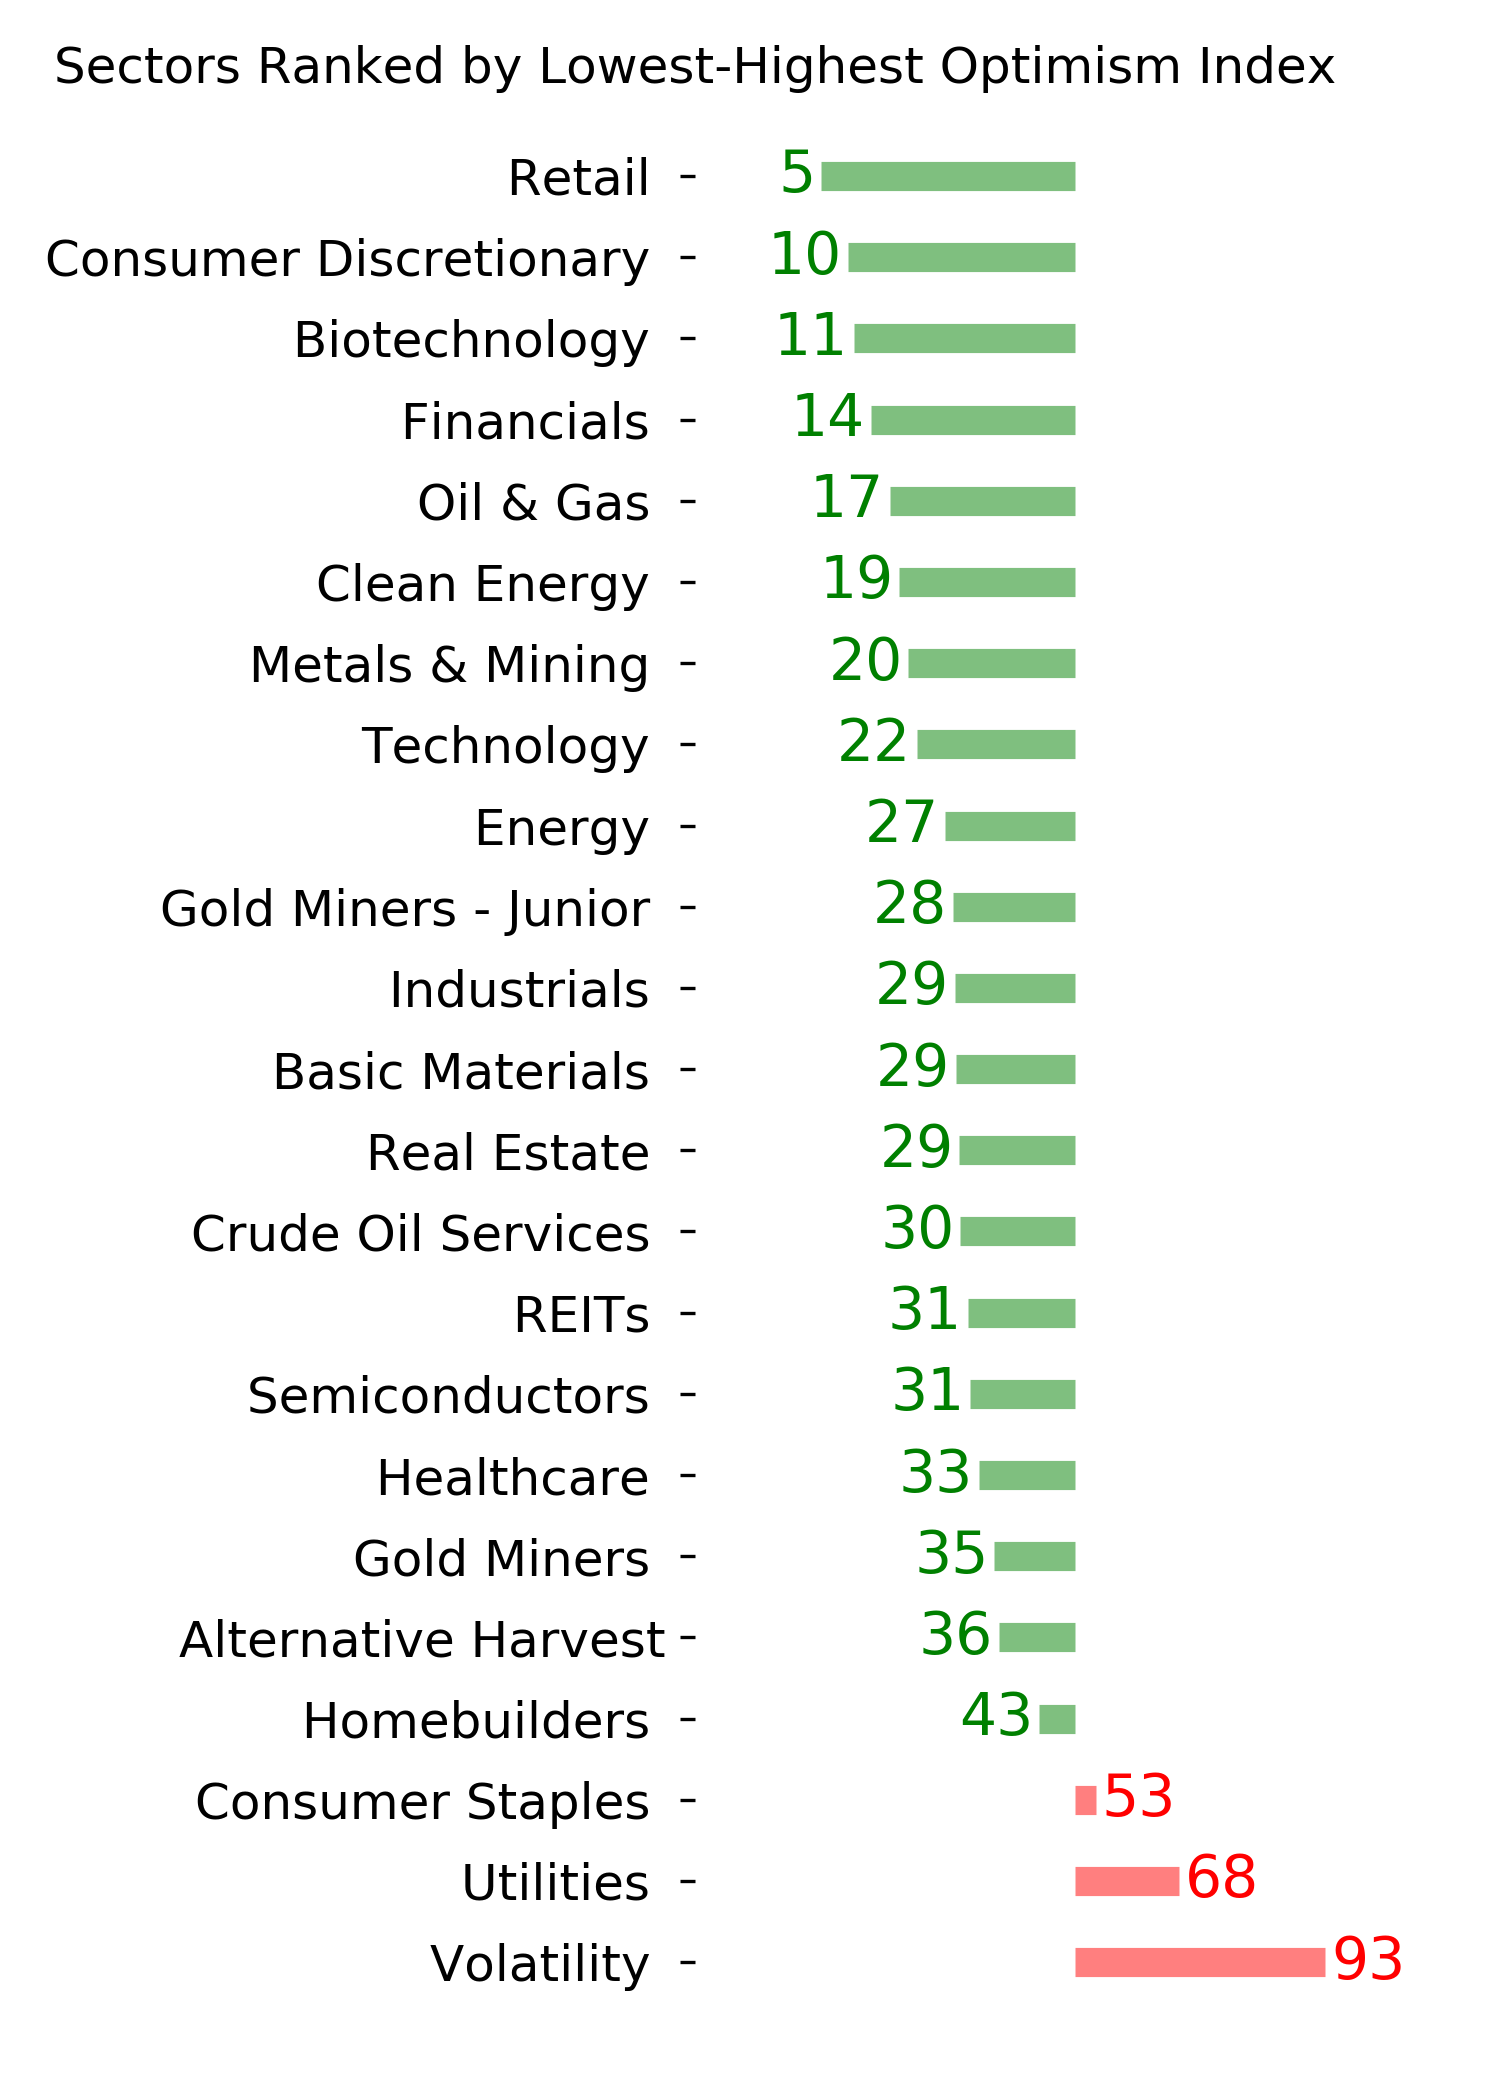
Ranks
|
|
|
|
|
|
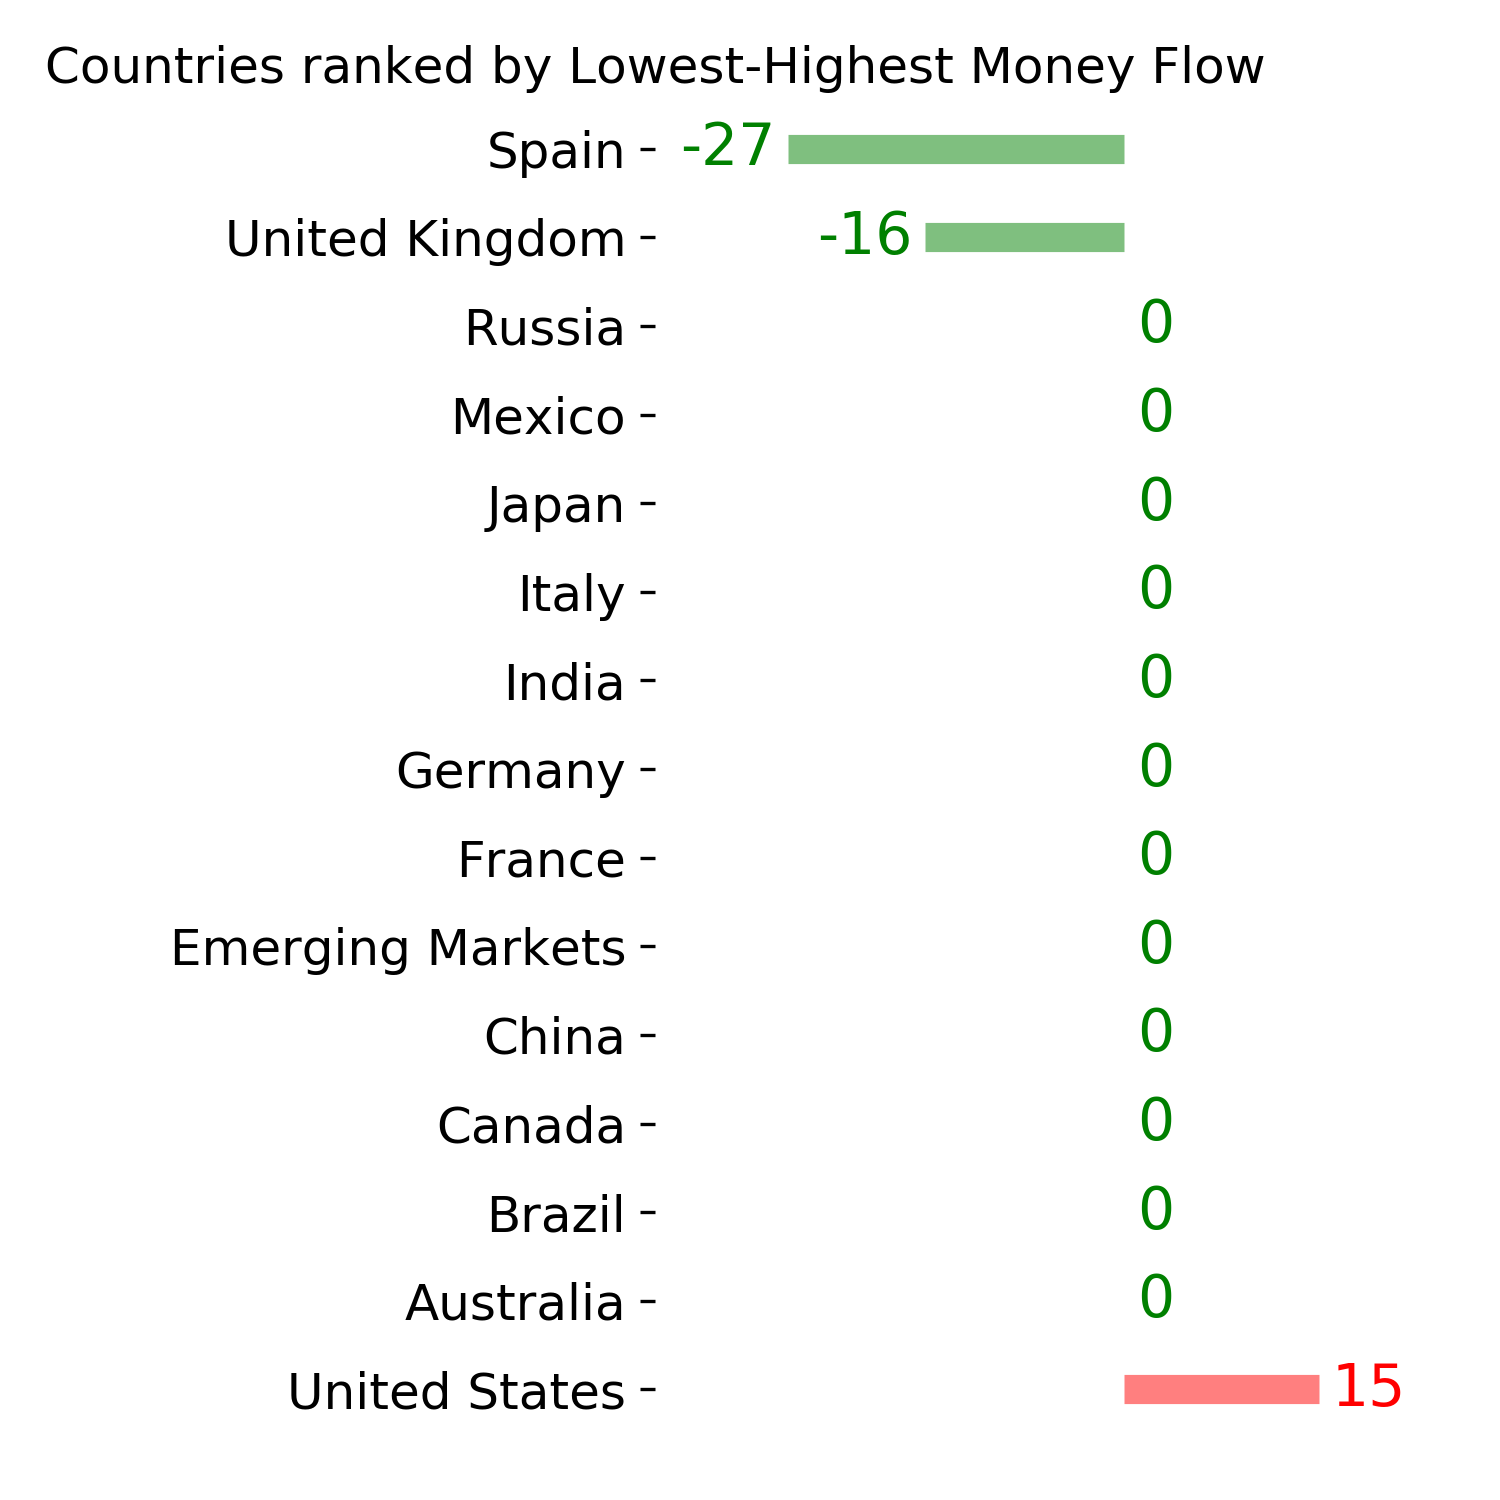
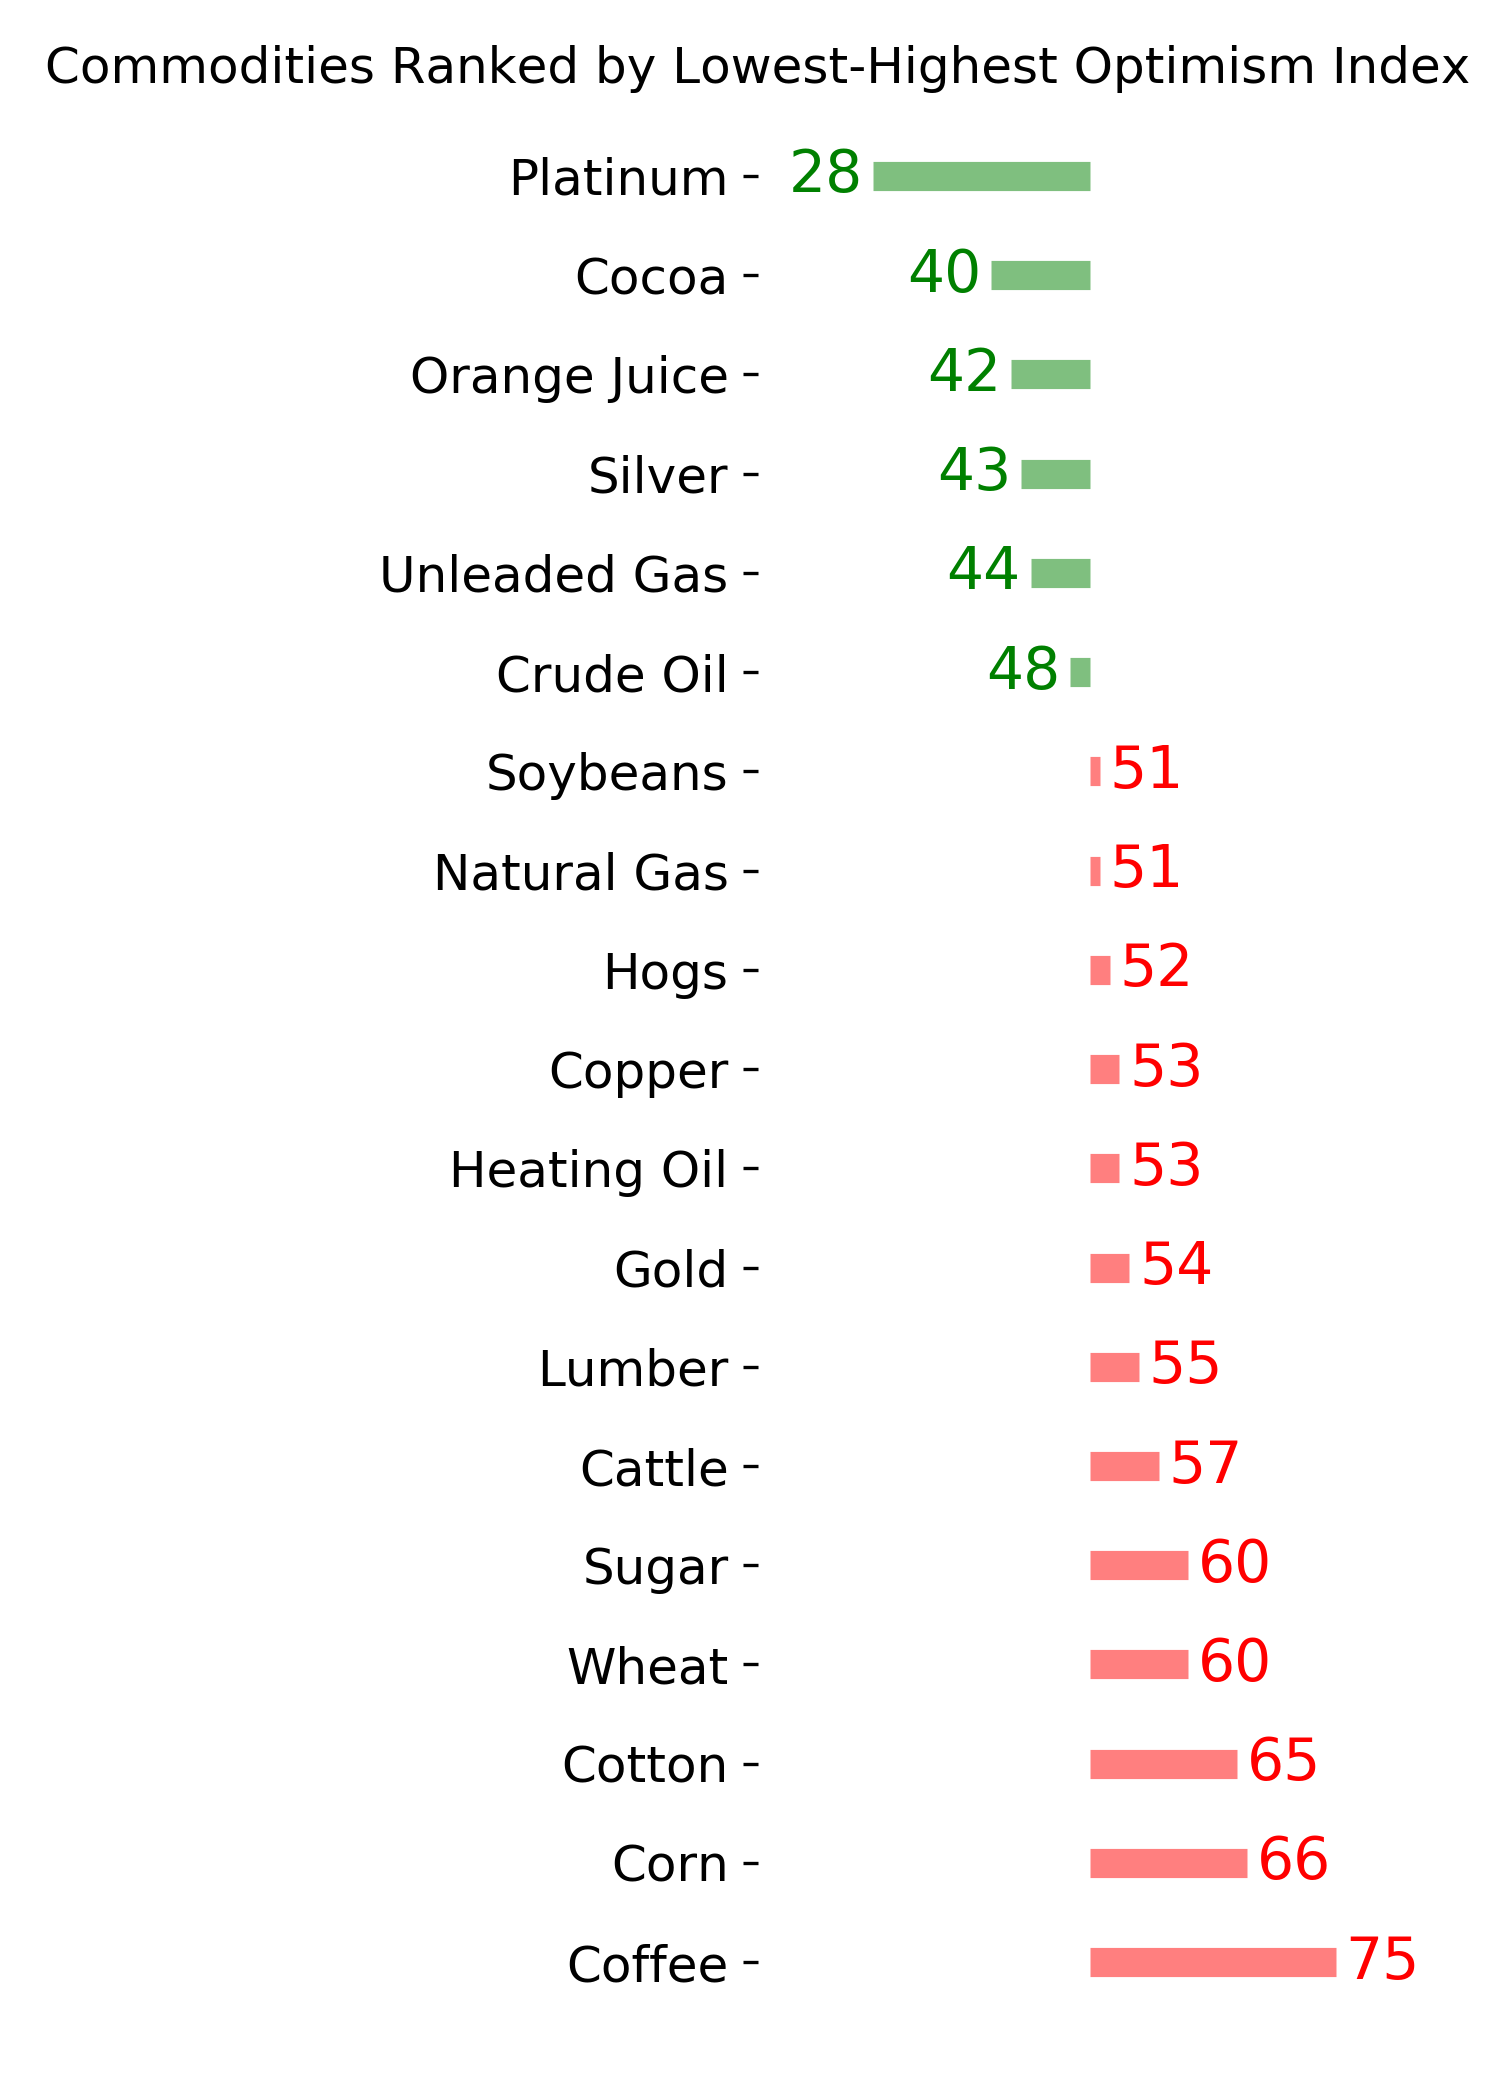
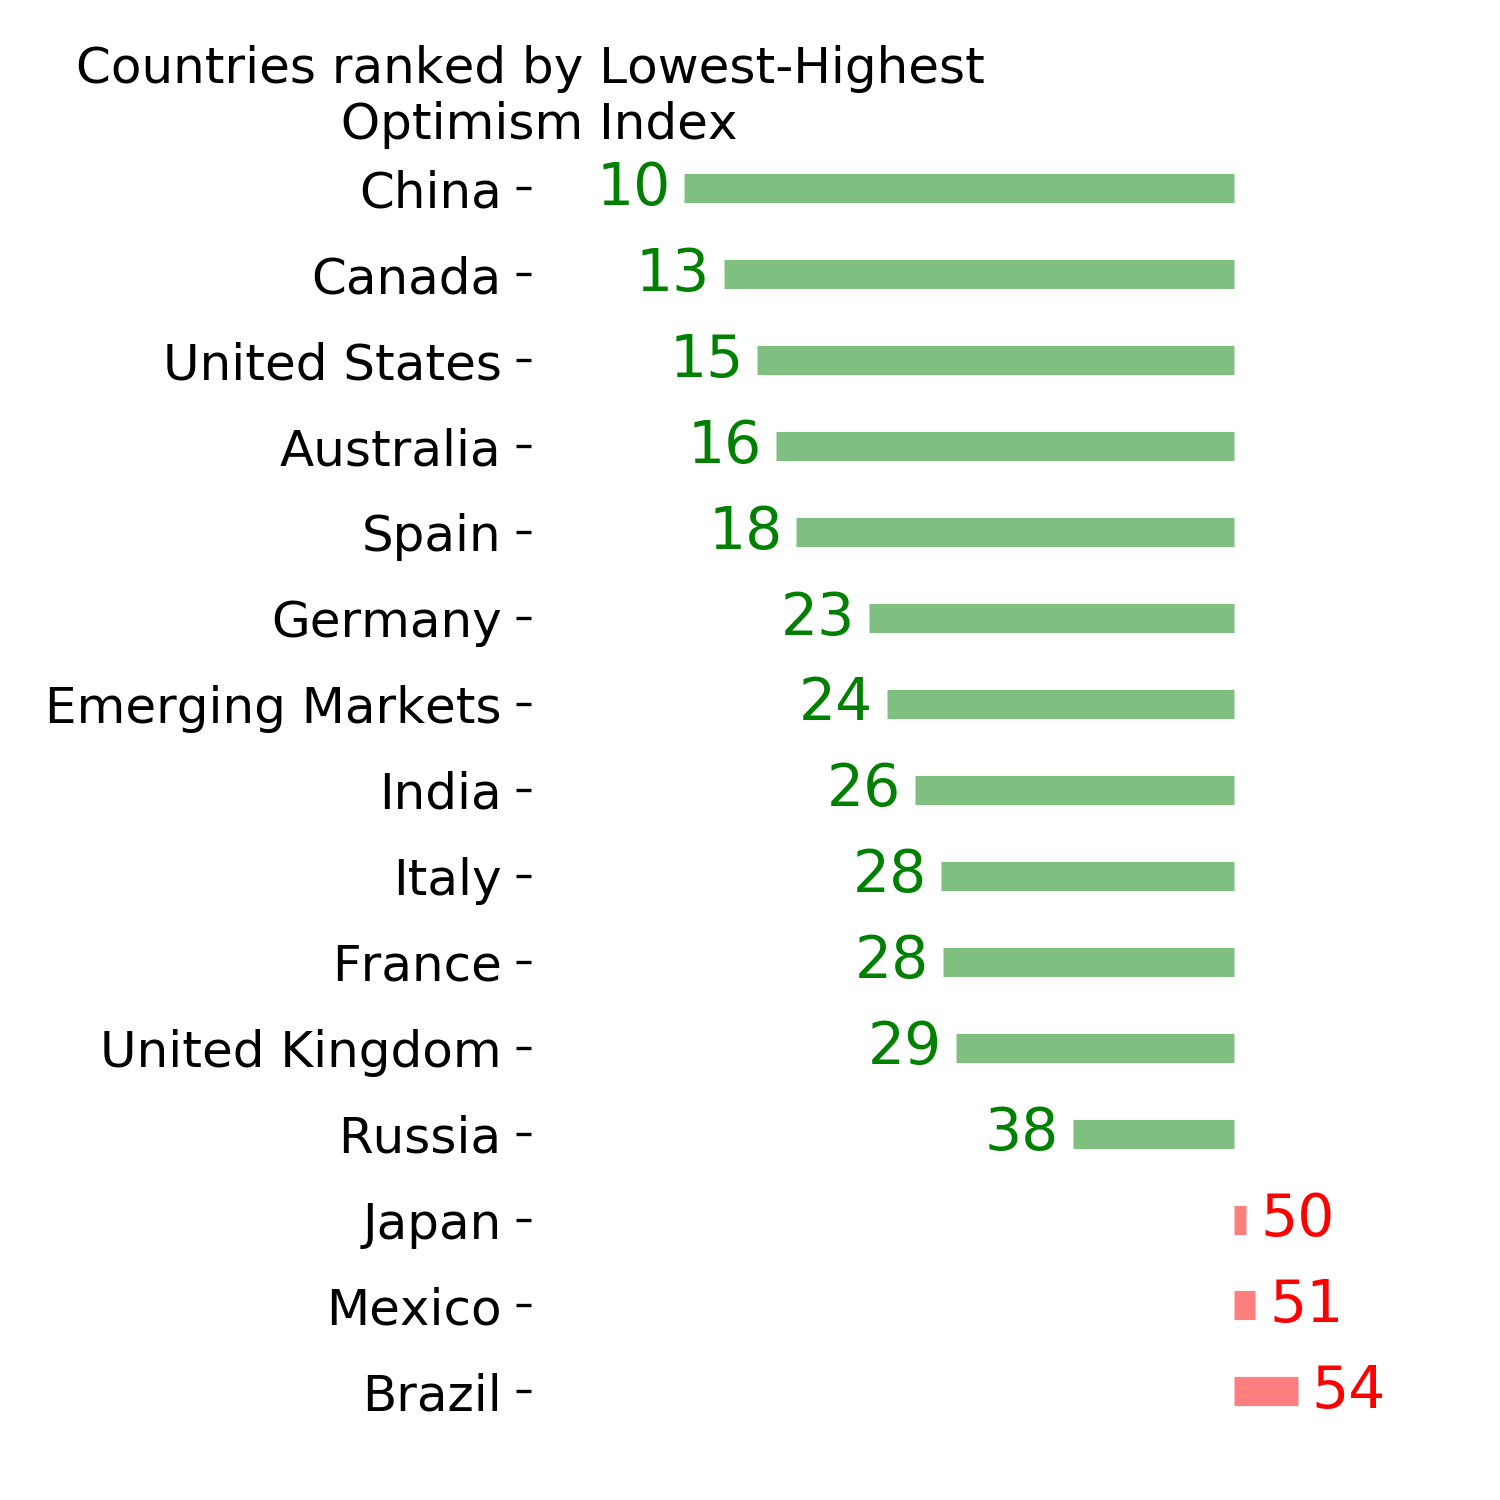
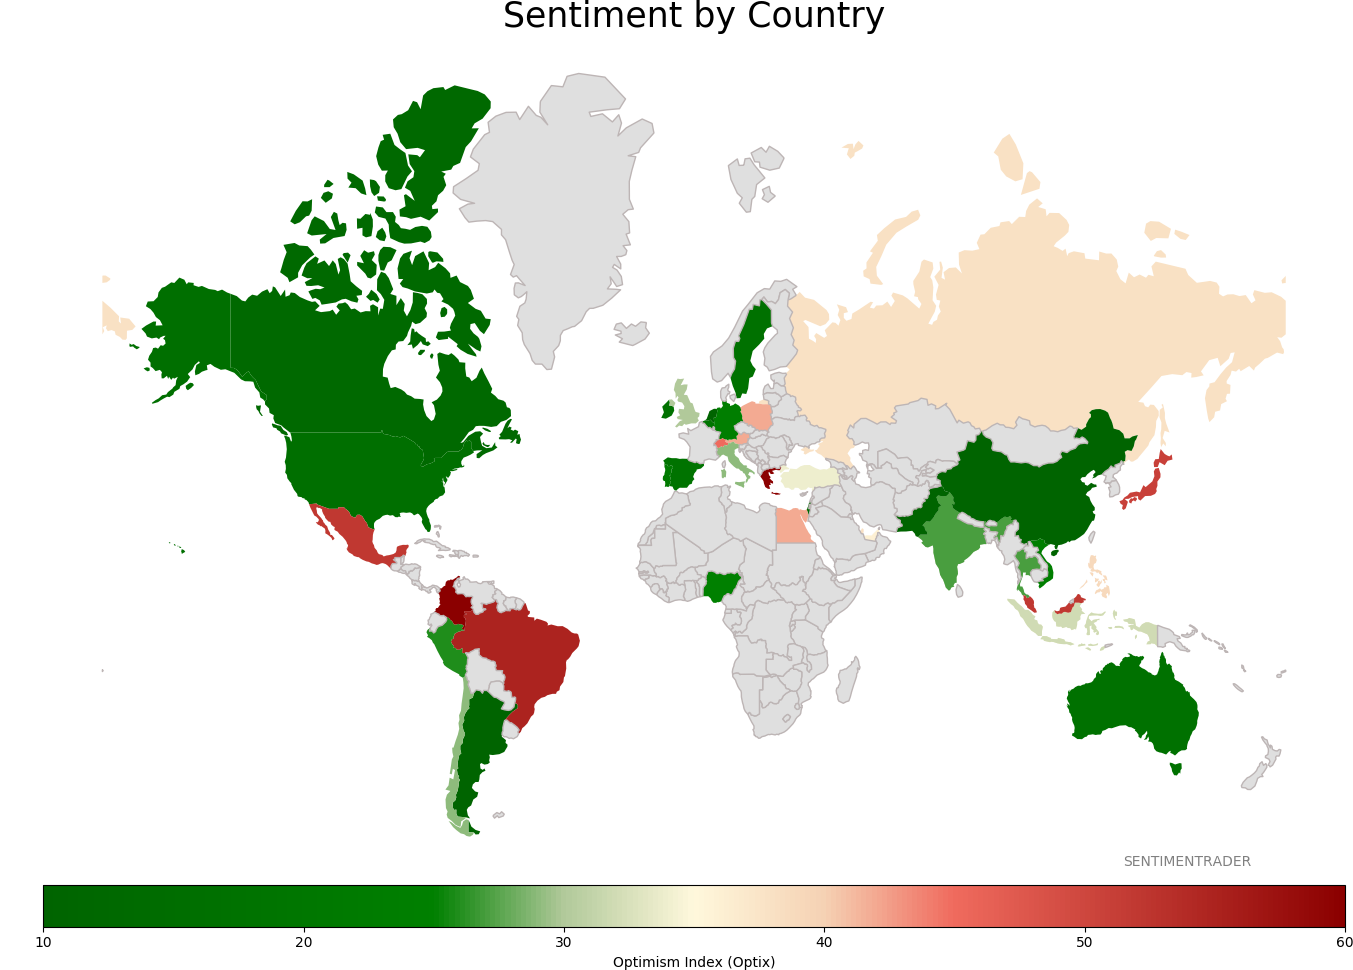
Sentiment Around The World
|
|
|
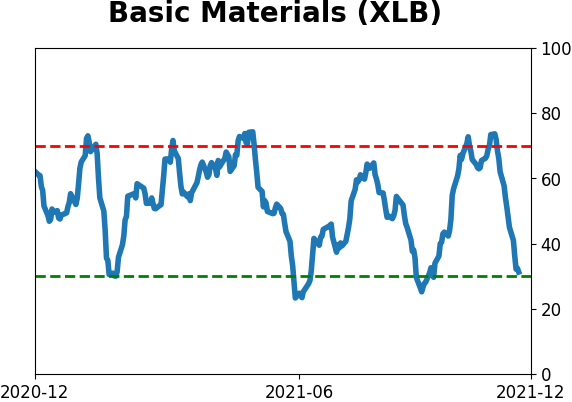
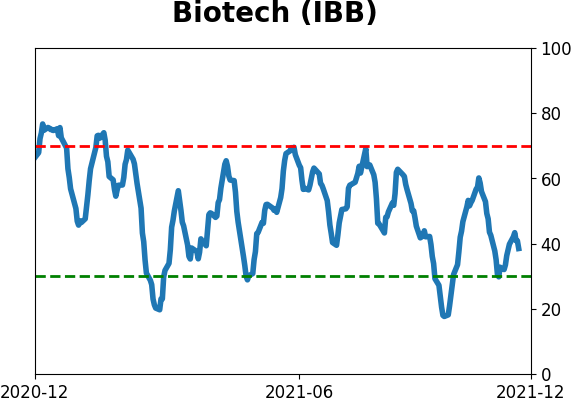
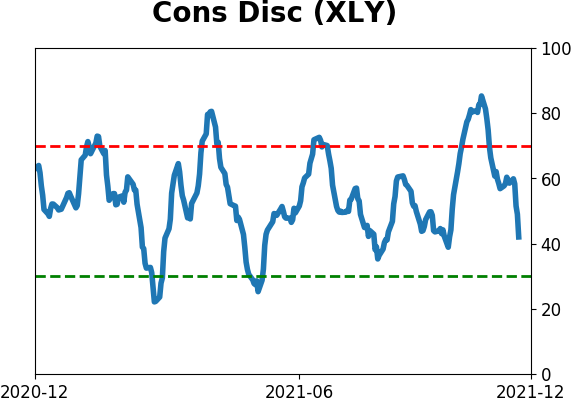
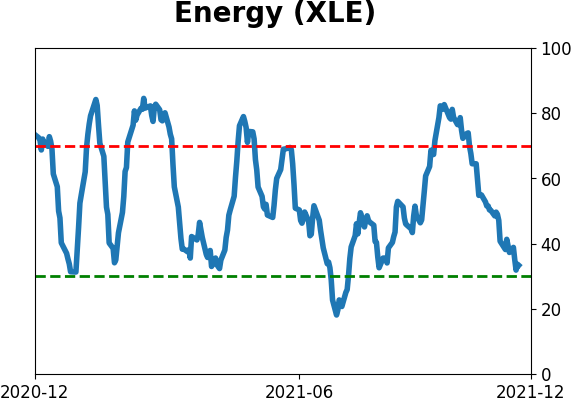
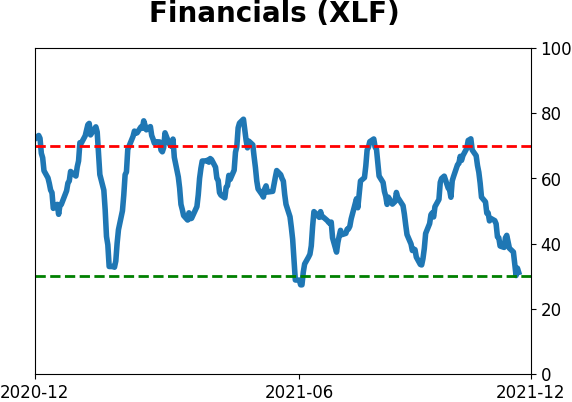
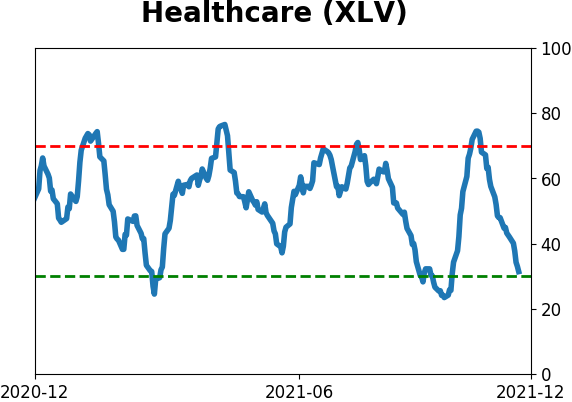
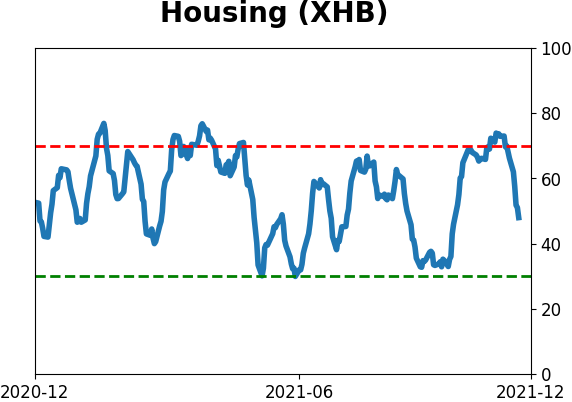
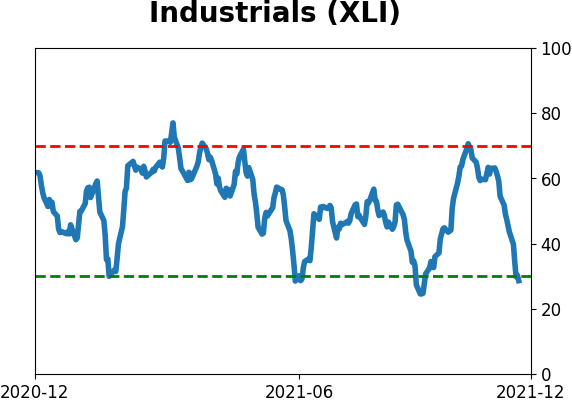
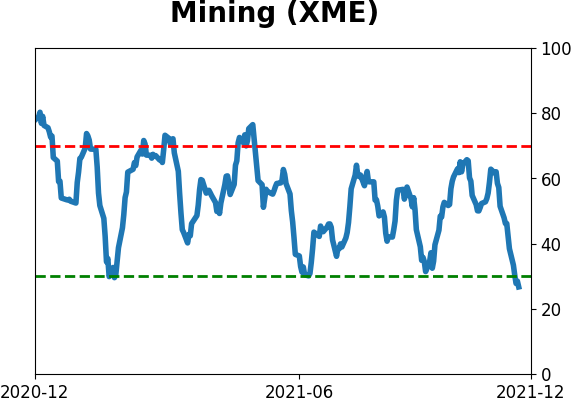
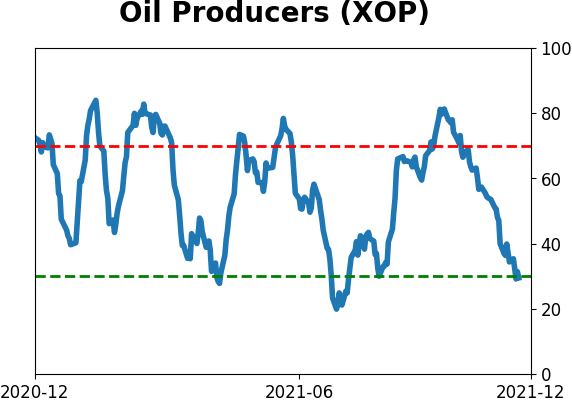
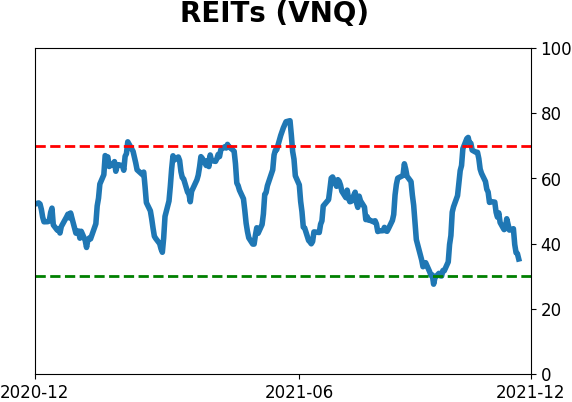
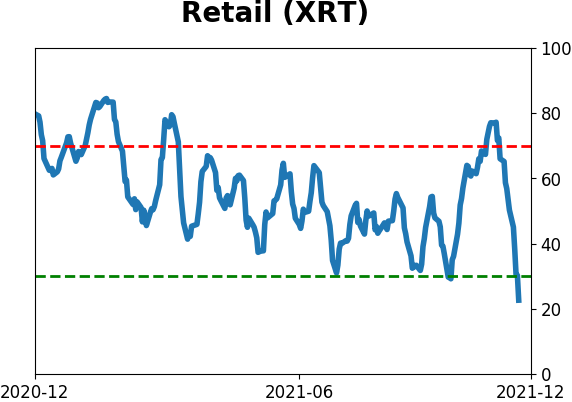
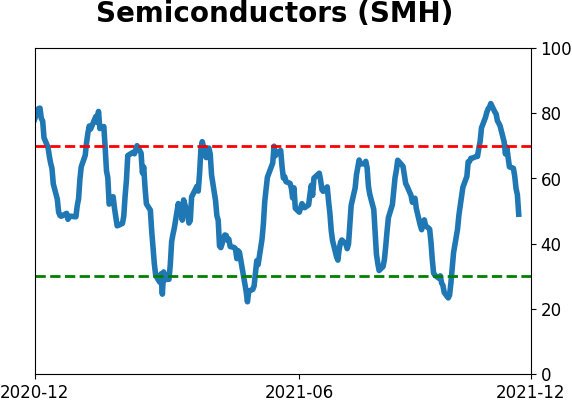
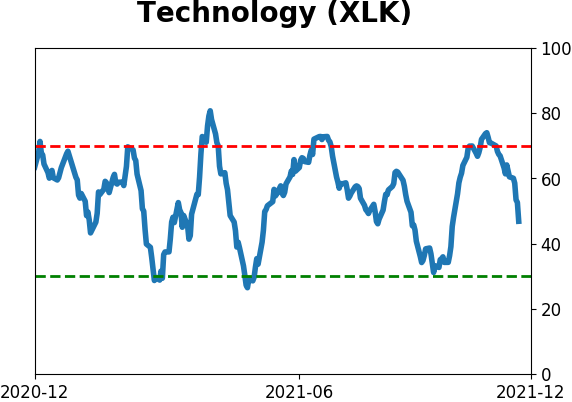
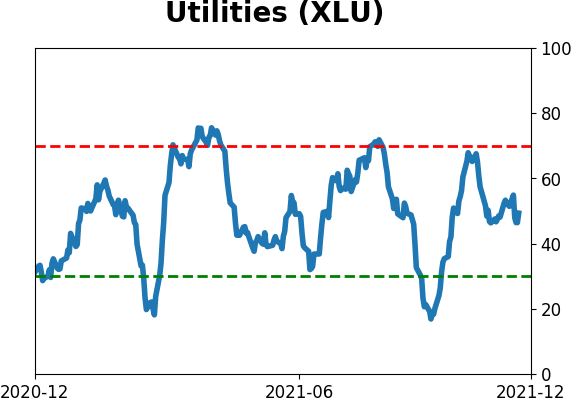
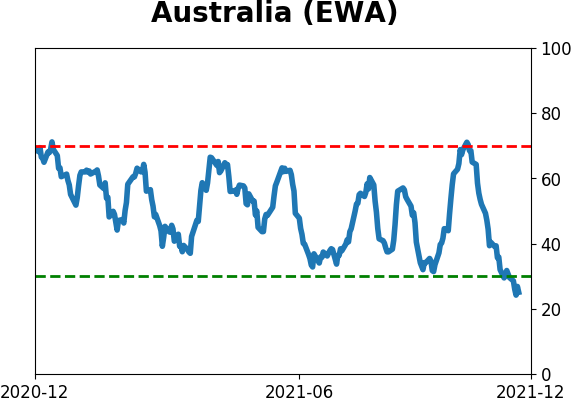
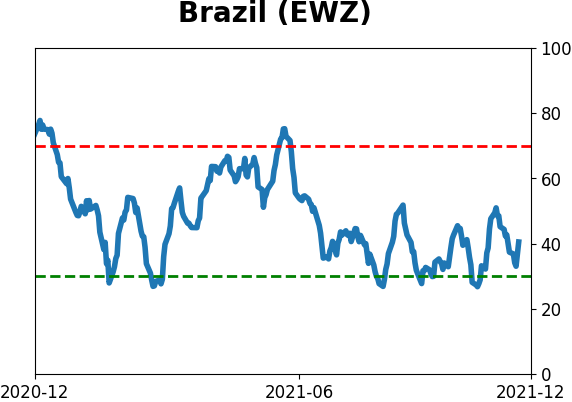
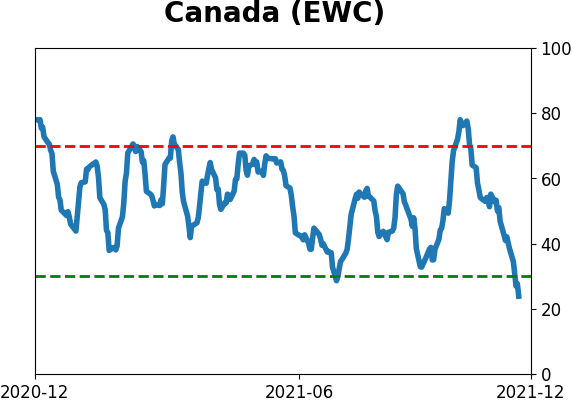
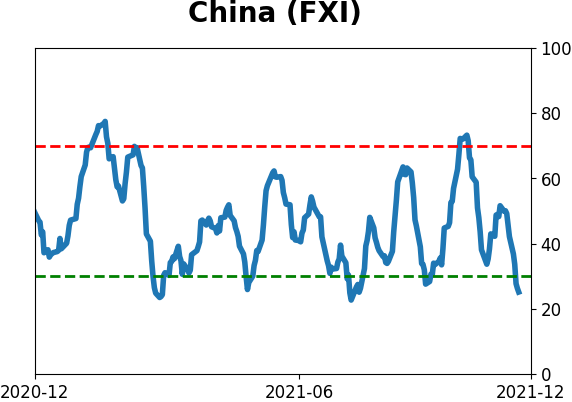
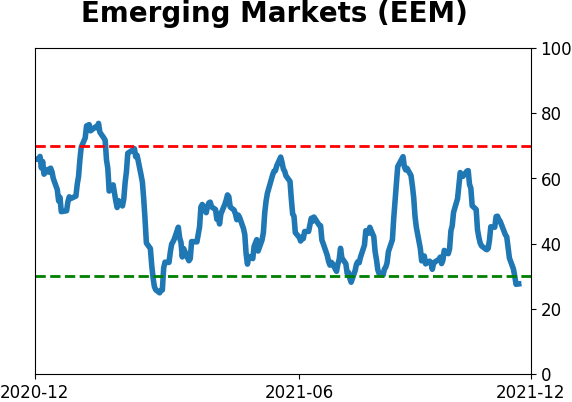
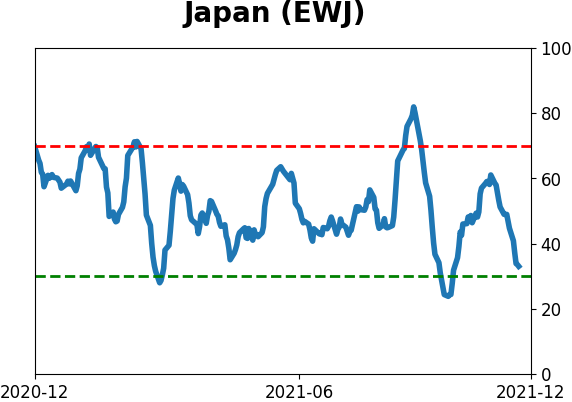
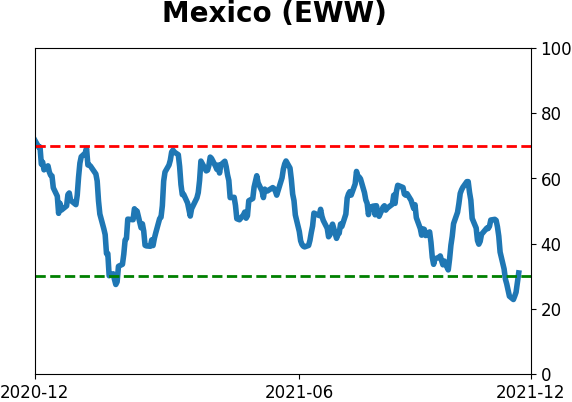
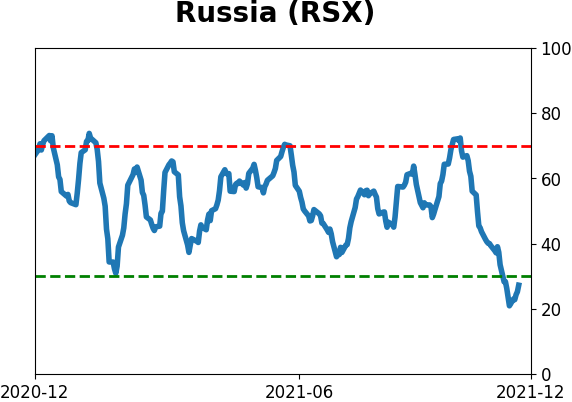
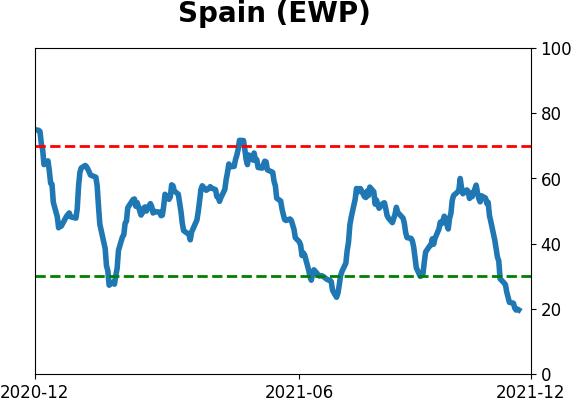
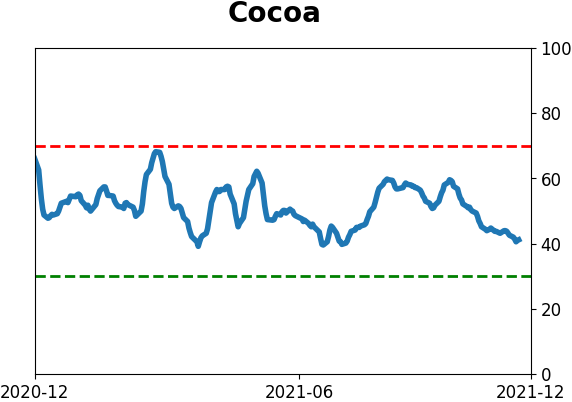
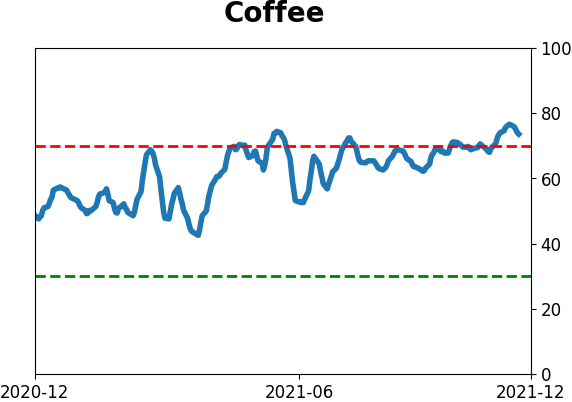
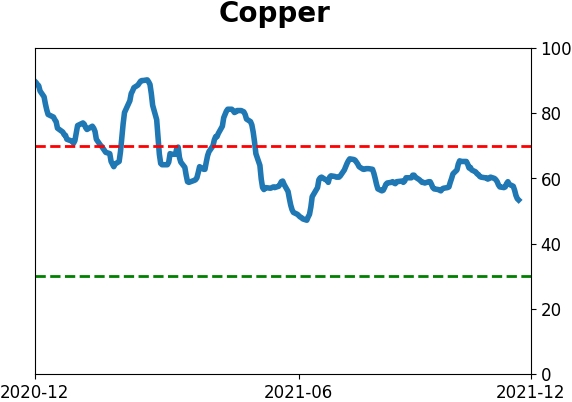
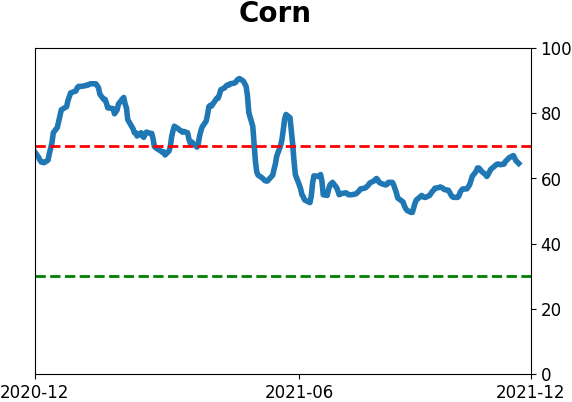
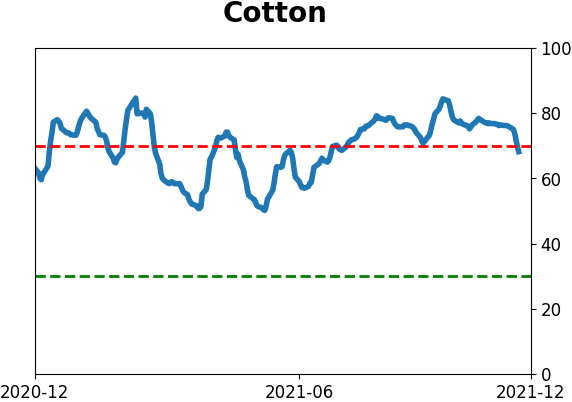
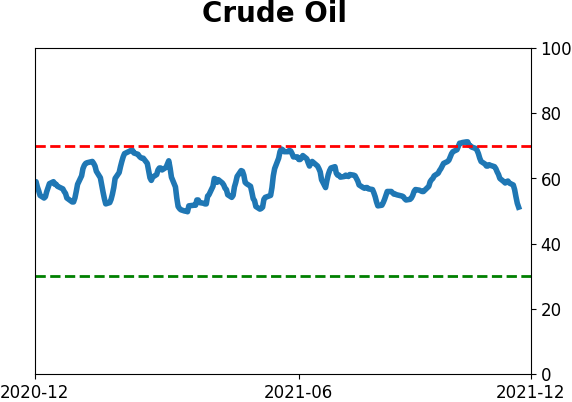
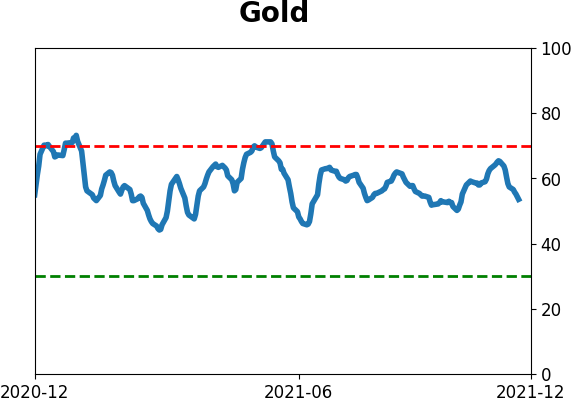
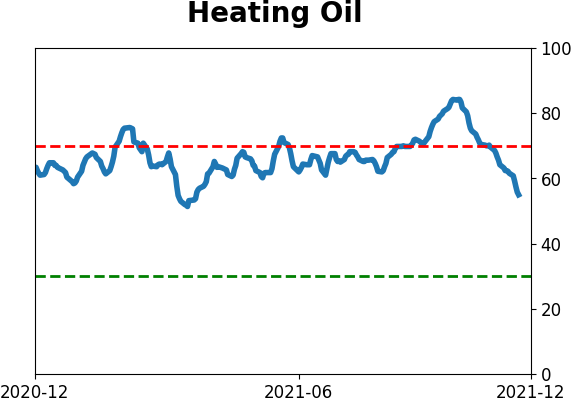
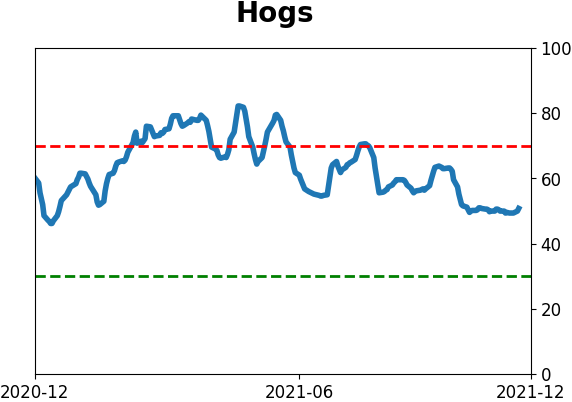
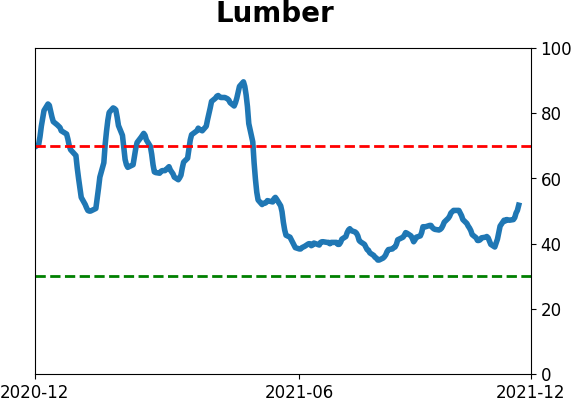
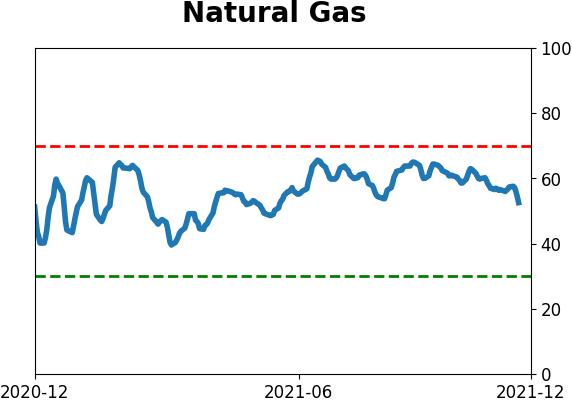
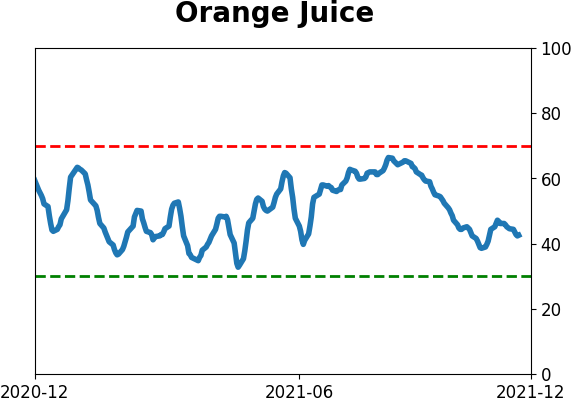
Optimism Index Thumbnails
|
|
|
|
|
|
|
|
|
|
|
|
|
|
|
|
|
|
|
|
|