Headlines
|
|
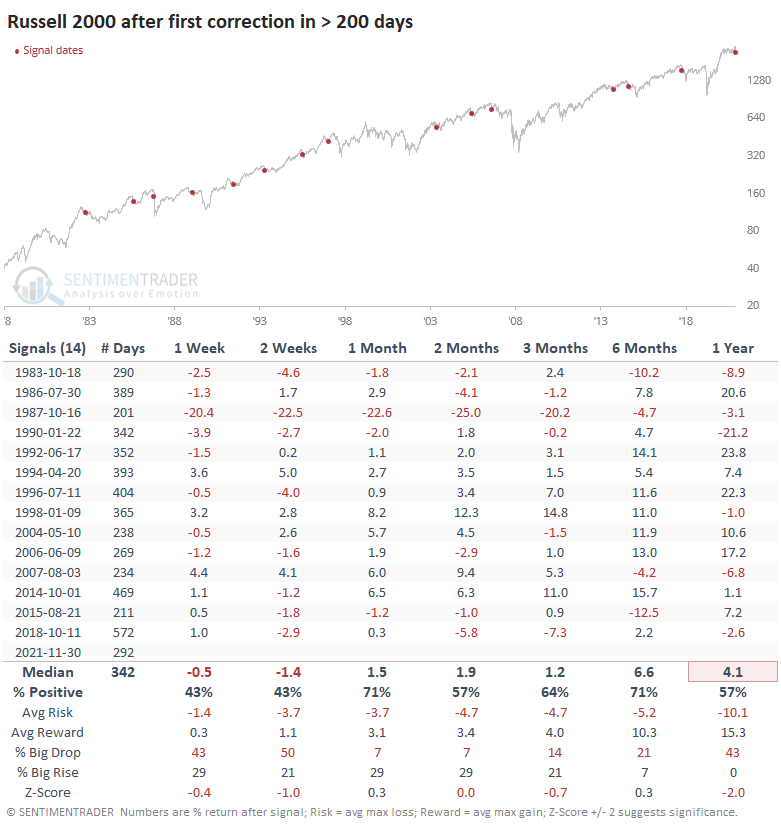
Small Caps have suffered a fast correction, the first in a year:
Only 3 weeks after setting a new high, the small-cap Russell 2000 fell into a correction, more than 10% below its peak. This is its 4th-fastest correction ever. It also ended one of its longest streaks without a correction. Both behaviors tended to lead to more selling.
Bottom Line:
STOCKS: Hold By early October, sentiment had reset. Several important momentum streaks ended, which has brought in buyers in the past, and seasonality turned positive. We're now seeing signs that sentiment has quickly shifted, especially among options traders. It's gotten to an extreme that has preceded weaker-than-average returns.
BONDS: Hold In late October, sentiment on bonds - from Treasuries to corporates - entered pessimistic territory. It's now starting to recover, with some quick moves in corporate bonds. We'll see if those bonds, in particular, can hold recent gains.
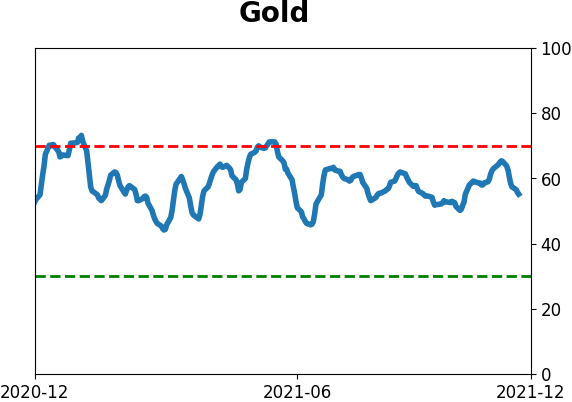
GOLD: Hold
Gold and miners were rejected after trying to recover above their 200-day averages in May. Some oversold extremes in breadth measures among miners triggered in late September, and they've recovered a bit since then. The group still has some proving to do.
|
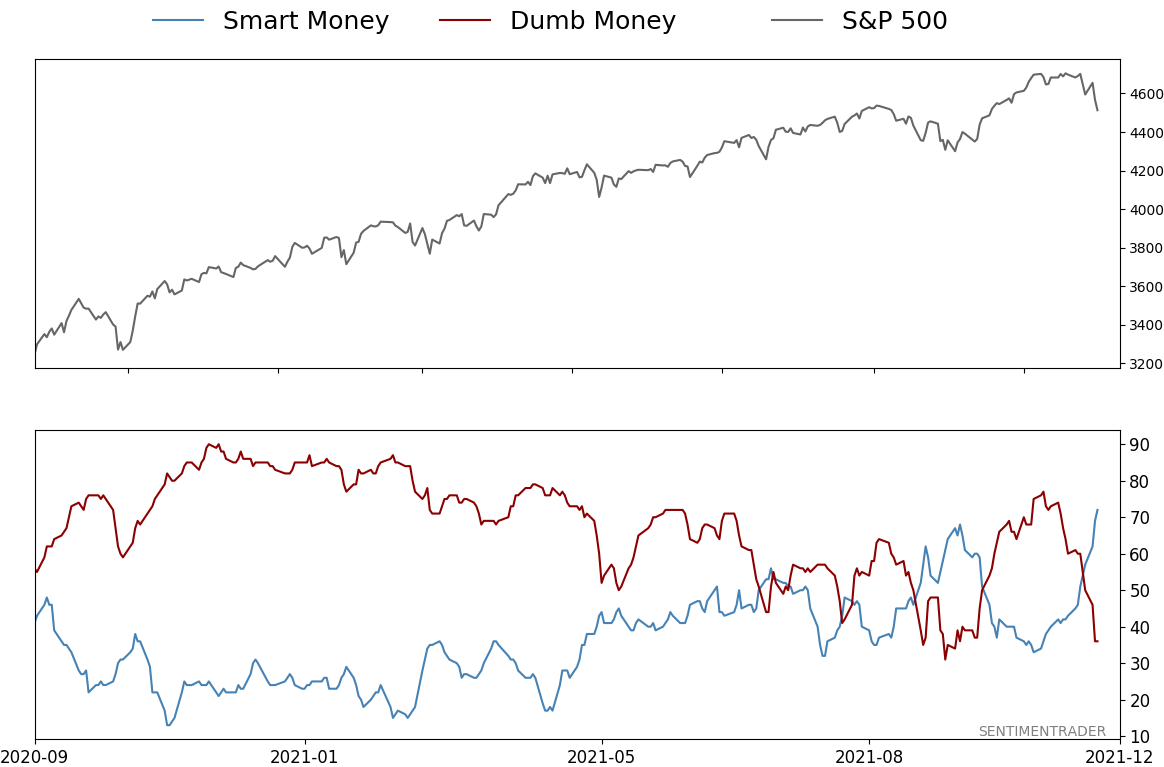
Smart / Dumb Money Confidence
|
Smart Money Confidence: 72%
Dumb Money Confidence: 36%
|
|
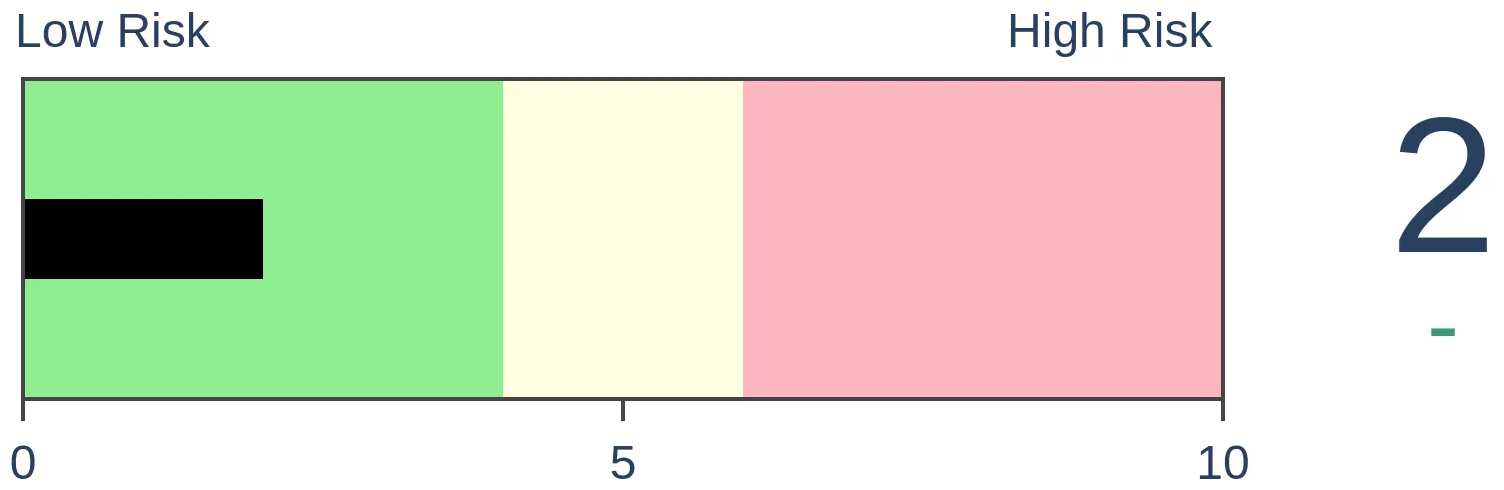
Risk Levels
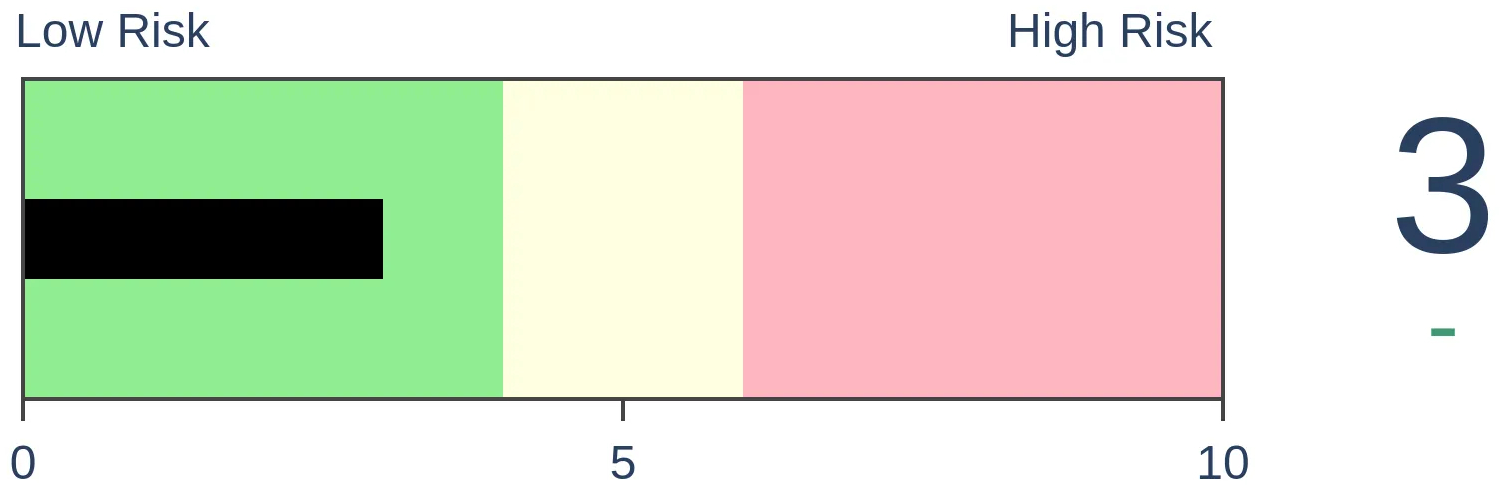
Stocks Short-Term
|
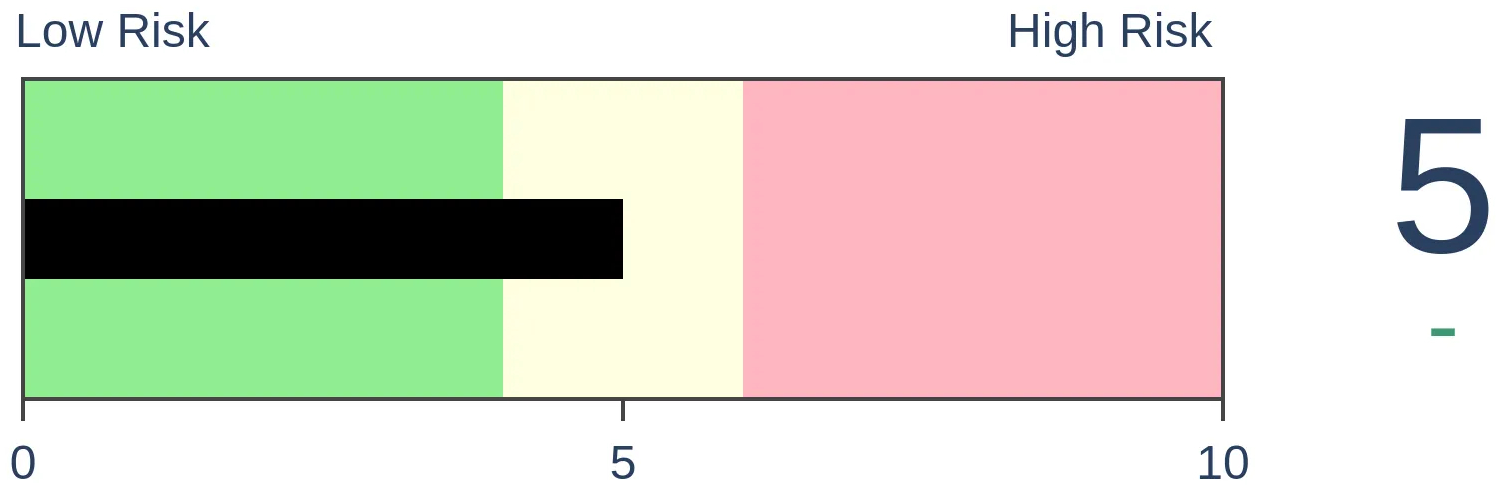
Stocks Medium-Term
|
|
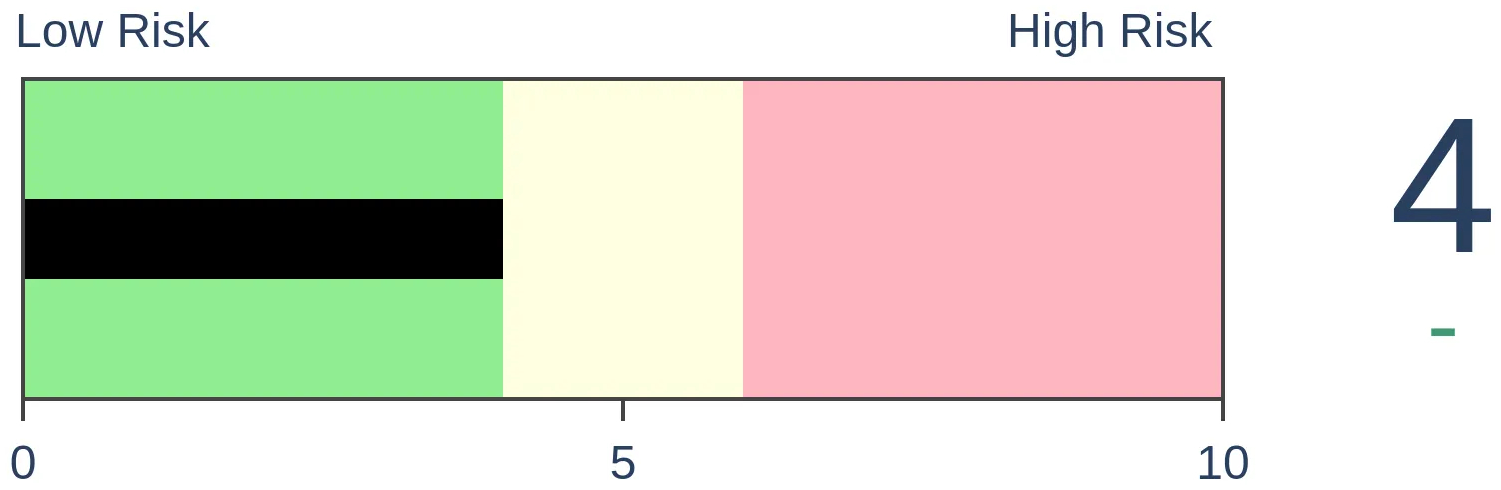
Bonds
|
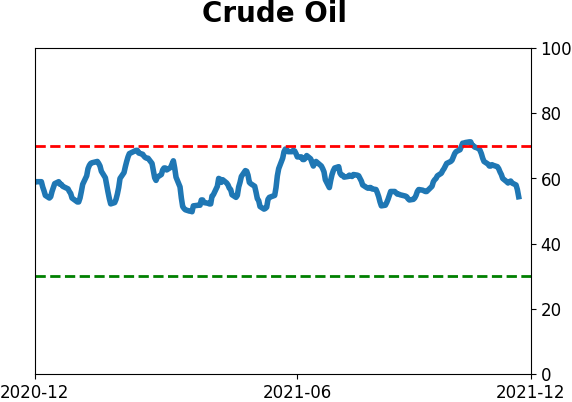
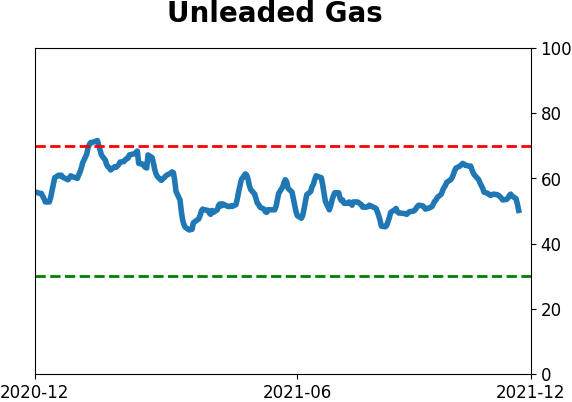
Crude Oil
|
|
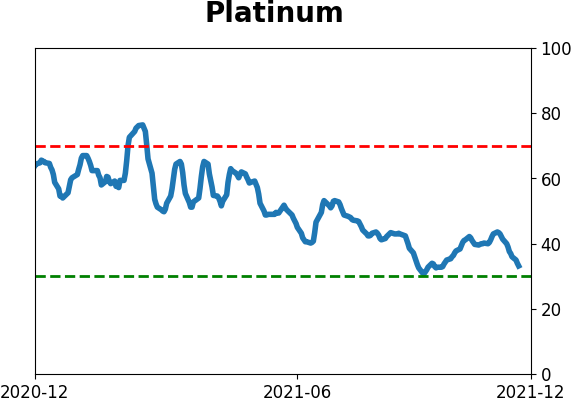
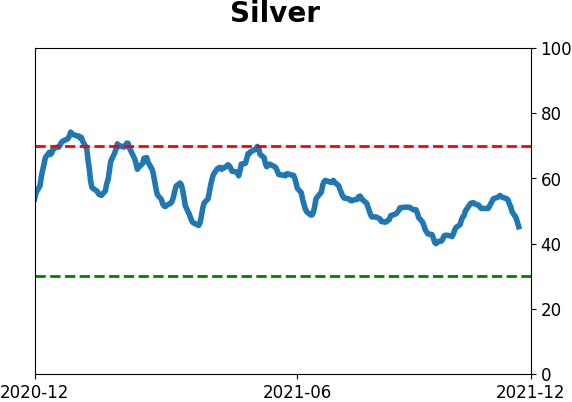
Gold

|
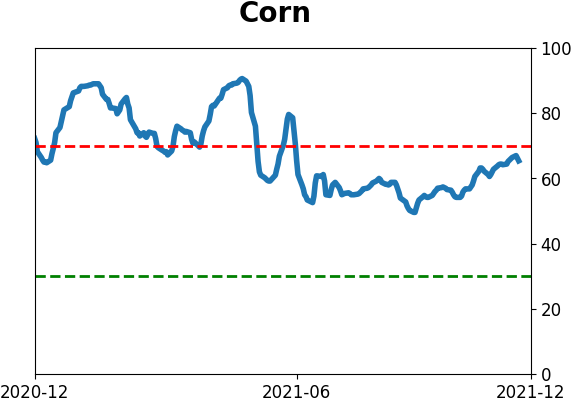
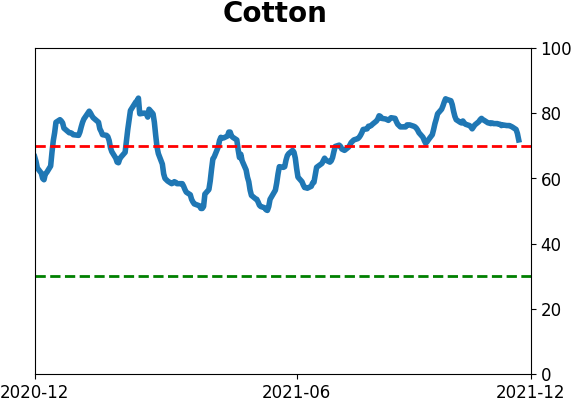
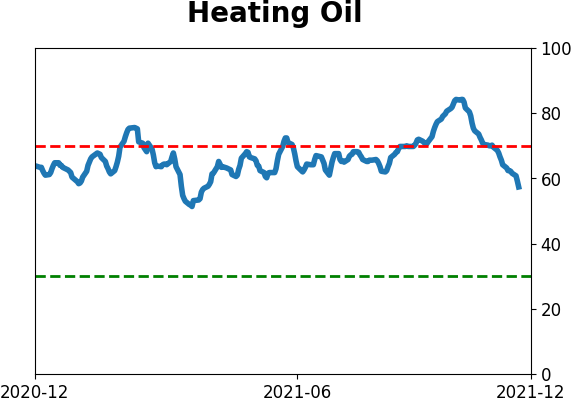
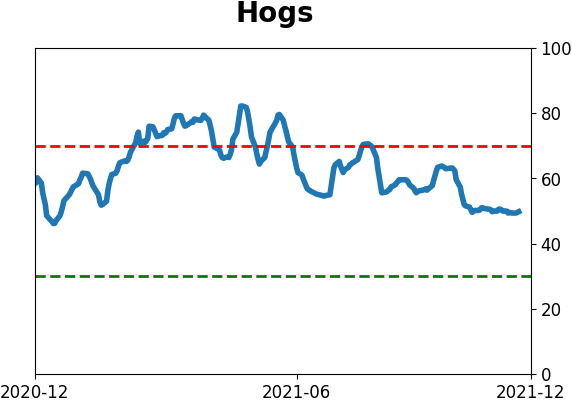
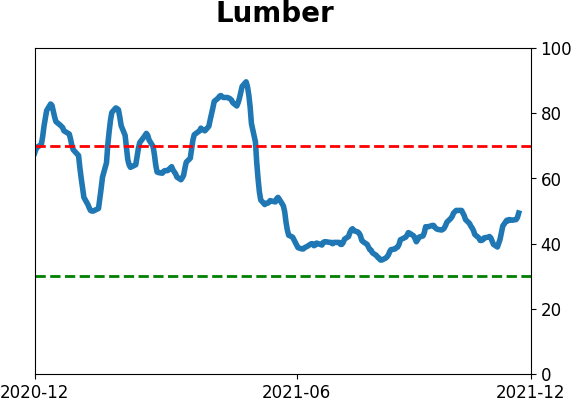
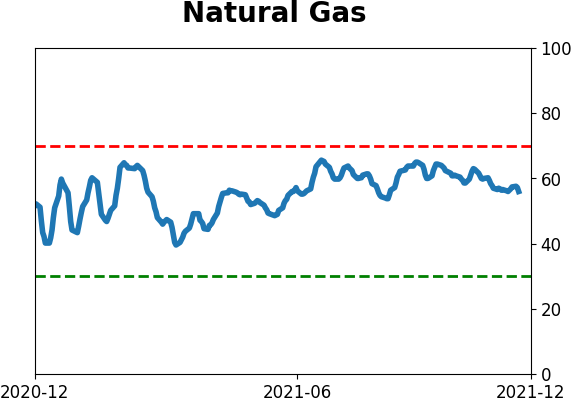
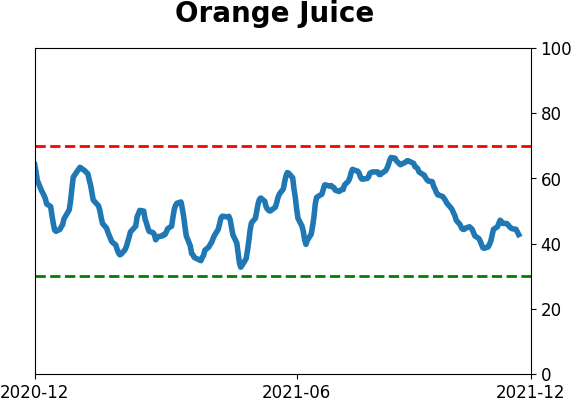
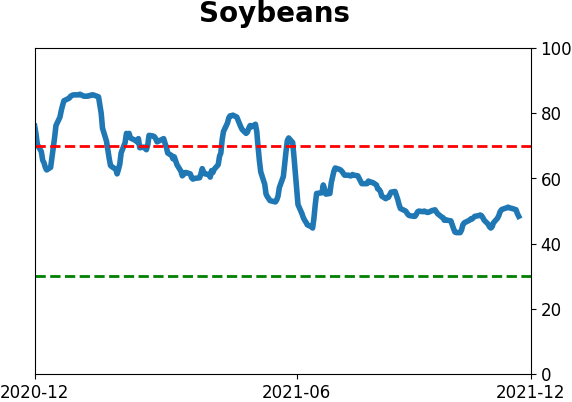
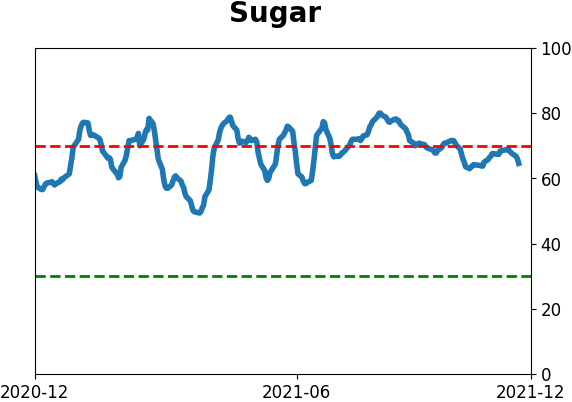
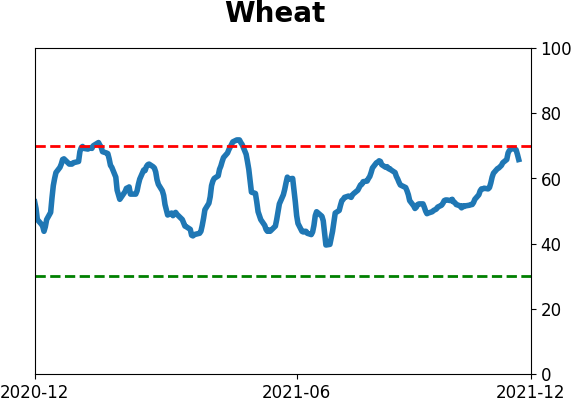
Agriculture

|
|
Research
By Jason Goepfert
BOTTOM LINE
Only 3 weeks after setting a new high, the small-cap Russell 2000 fell into a correction, more than 10% below its peak. This is its 4th-fastest correction ever. It also ended one of its longest streaks without a correction. Both behaviors tended to lead to more selling.
FORECAST / TIMEFRAME
IWM -- Down, Medium-Term
|
Key points:
- The Russell 2000 just suffered one of its quickest corrections ever following a new high
- It also ended one of its longest streaks without a correction
- Both behaviors typically led to more selling pressure over the short- to medium-term
One of the quickest-ever corrections
Earlier this month, the small-cap Russell 2000 broke out of a long consolidation. When it's done that before, it had a strong tendency to keep going. While short-term returns were modestly positive, the index showed a positive return 2 months later 16 out of 18 times.
After its latest attempt, it promptly failed. And failed hard.
Within only a few weeks of trading at an all-time high, the Russell is already back into correction territory. This is its first drawdown of more than 10% (rounded) in more than a year.
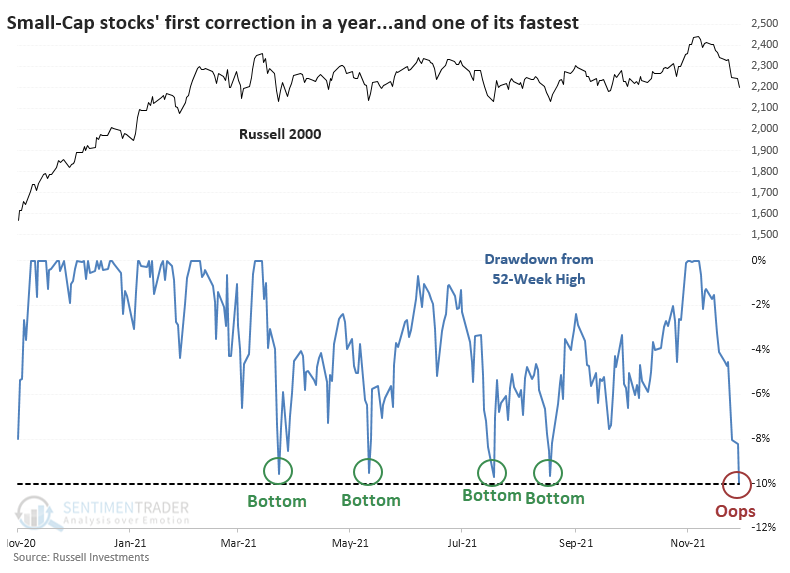
At only 15 days removed from a 52-week high, this is the Russell 2000's 4th-fastest correction.
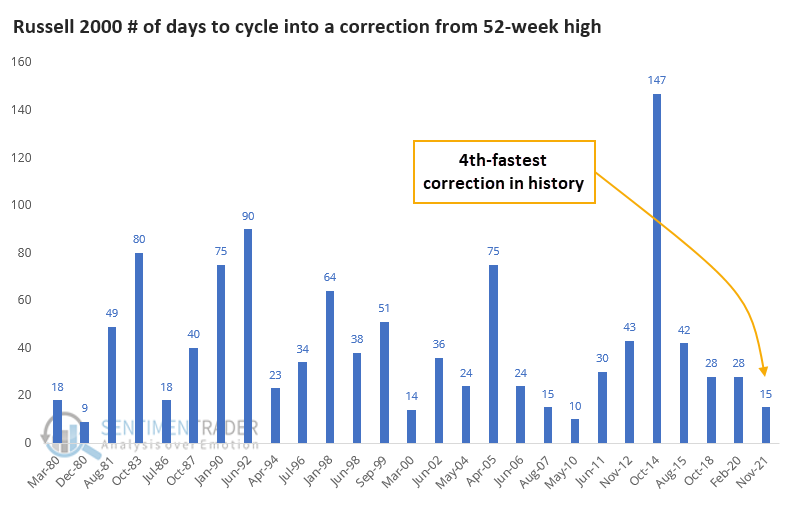
Since the Russell's breakout failed (so far) to follow through on its historical tendencies, maybe we can't rely on its failure either. But for the most part, fast corrections equaled negative future returns for the small-cap index. Quick failures were not a good sign for these stocks, with 9 out of the 12 signals leading to a negative return either 2 or 3 months later. A few of them bounced in the short-term then crapped out.
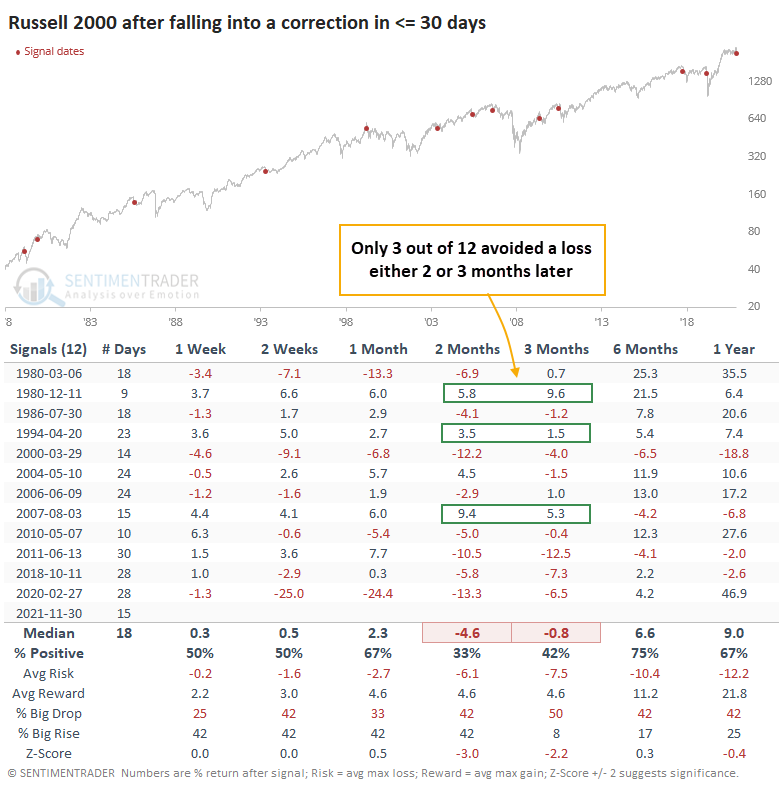
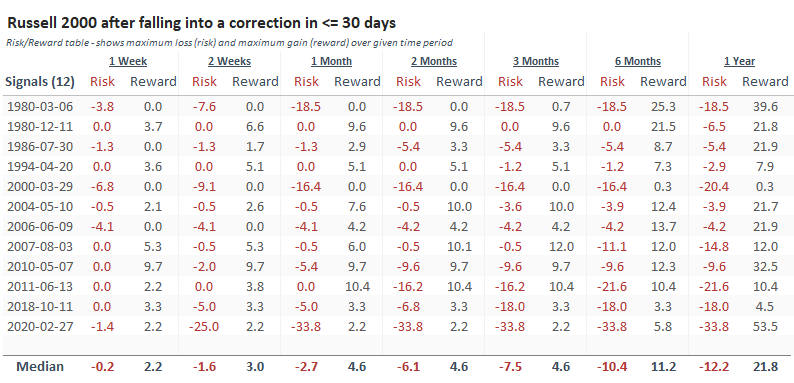
The Risk/Reward Tables shows just how poor the Russell tended to perform. Out of the 12 signals, 8 of them showed (almost) more risk than reward during the next 3 months.
The first correction in more than a year
This quick correction is also the Russell's first substantial pullback in a long time. It ends a streak of nearly 300 trading days since it last traded more than 10% below a 52-week high.
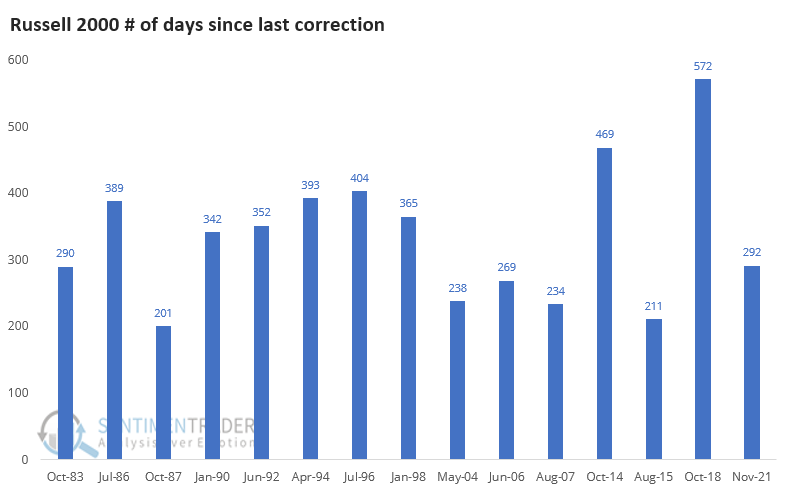
The first correction in more than 200 days tended to precede weak short-term returns and below-average medium-term ones. Out of the 14 other signals, only 2 managed to see large and sustained gains in the months ahead (June 1992 and July 1996). Most of the others either saw weak medium-term returns, or strong ones that ended up being given back over the next 6-12 months.
What the research tells us...
When a market breaks out and everyone gets excited, it tends to keep going. Quick and forceful failures after a breakout are relatively unusual, but the small-cap Russell 2000 just suffered one. The history of the index shows that investors tend to sell after fast failures, with consistently weak returns over the next 2-3 months.
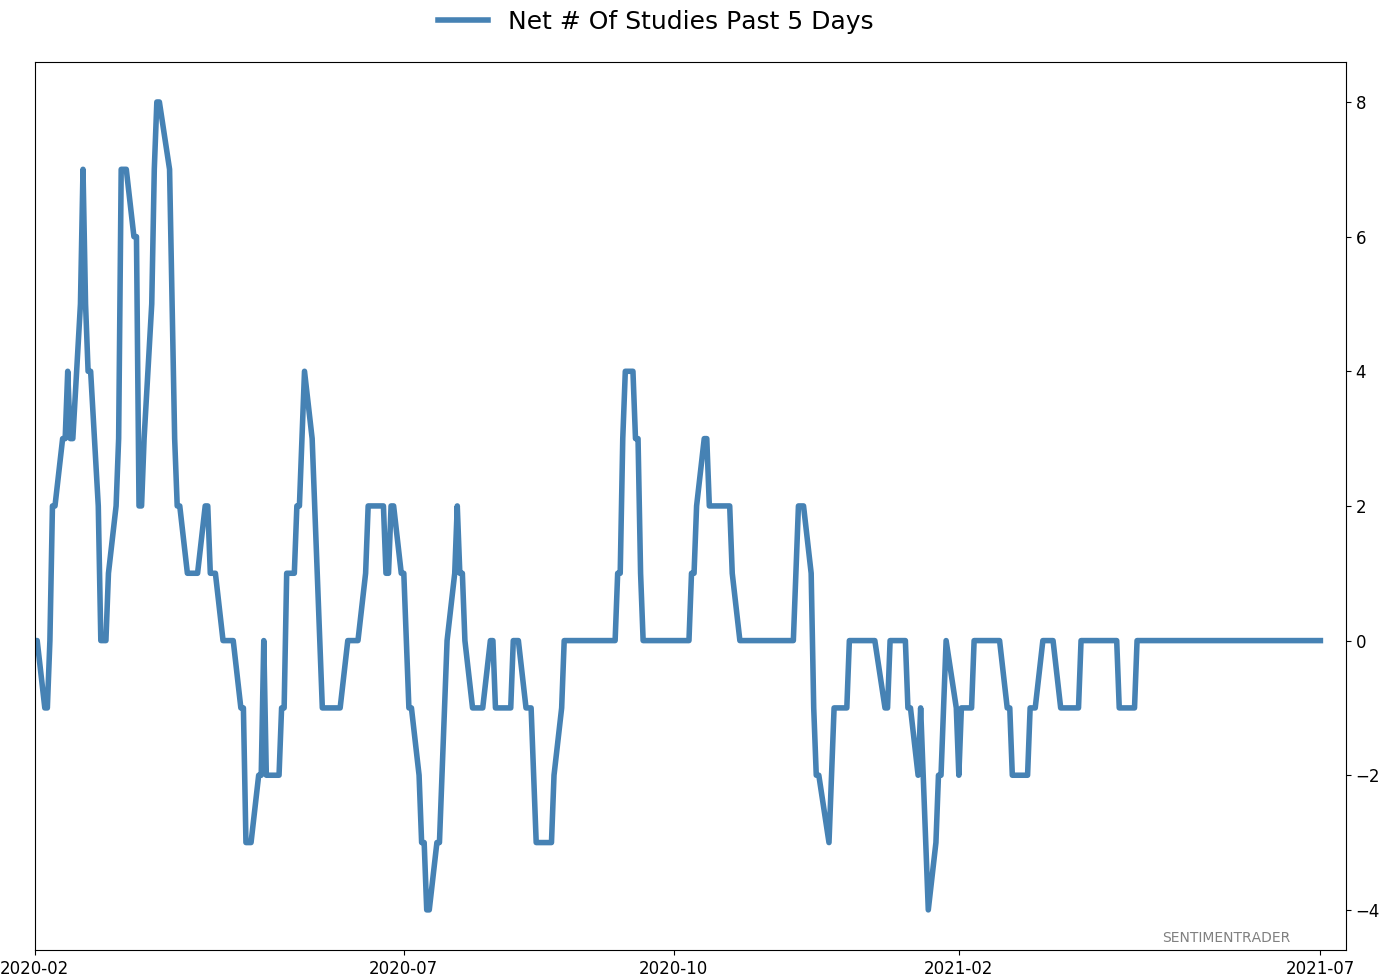
Active Studies
| Time Frame | Bullish | Bearish | | Short-Term | 2 | 2 | | Medium-Term | 11 | 1 | | Long-Term | 13 | 7 |
|
Indicators at Extremes
Portfolio
| Position | Description | Weight % | Added / Reduced | Date | | Stocks | RSP | 10.7 | Added 6.4% | 2021-10-01 | | Bonds | 32.7% BND, 7.1% SCHP | 39.8 | Added 8.3% | 2021-10-26 | | Commodities | GCC | 2.4 | Reduced 2.1%
| 2020-09-04 | | Precious Metals | GDX | 4.6 | Reduced 4.2% | 2021-05-19 | | Special Situations | 9.8% KWEB, 4.7% XLE, 2.9% PSCE | 17.3 | Added 9.78% | 2021-10-01 | | Cash | | 24.1 | | |
|
Updates (Changes made today are underlined)
Much of our momentum and trend work has remained positive for several months, with some scattered exceptions. Almost all sentiment-related work has shown a poor risk/reward ratio for stocks, especially as speculation drove to record highs in exuberance in February. Much of that has worn off, and most of our models are back toward neutral levels. There isn't much to be excited about here. The same goes for bonds and even gold. Gold has been performing well lately and is back above long-term trend lines. The issue is that it has a poor record of holding onto gains when attempting a long-term trend change like this, so we'll take a wait-and-see approach. Momentum has ebbed quickly in recent weeks, and nearing oversold levels in some indicators. This can be a dangerous area, with a lot of short-term volatility, but we'd be more inclined to add medium- to long-term exposure rather than sell on much more of a decline, thanks to already rock-bottom exposure. Other areas look more attractive, including some overseas markets. RETURN YTD: 8.0% 2020: 8.1%, 2019: 12.6%, 2018: 0.6%, 2017: 3.8%, 2016: 17.1%, 2015: 9.2%, 2014: 14.5%, 2013: 2.2%, 2012: 10.8%, 2011: 16.5%, 2010: 15.3%, 2009: 23.9%, 2008: 16.2%, 2007: 7.8%
|
|
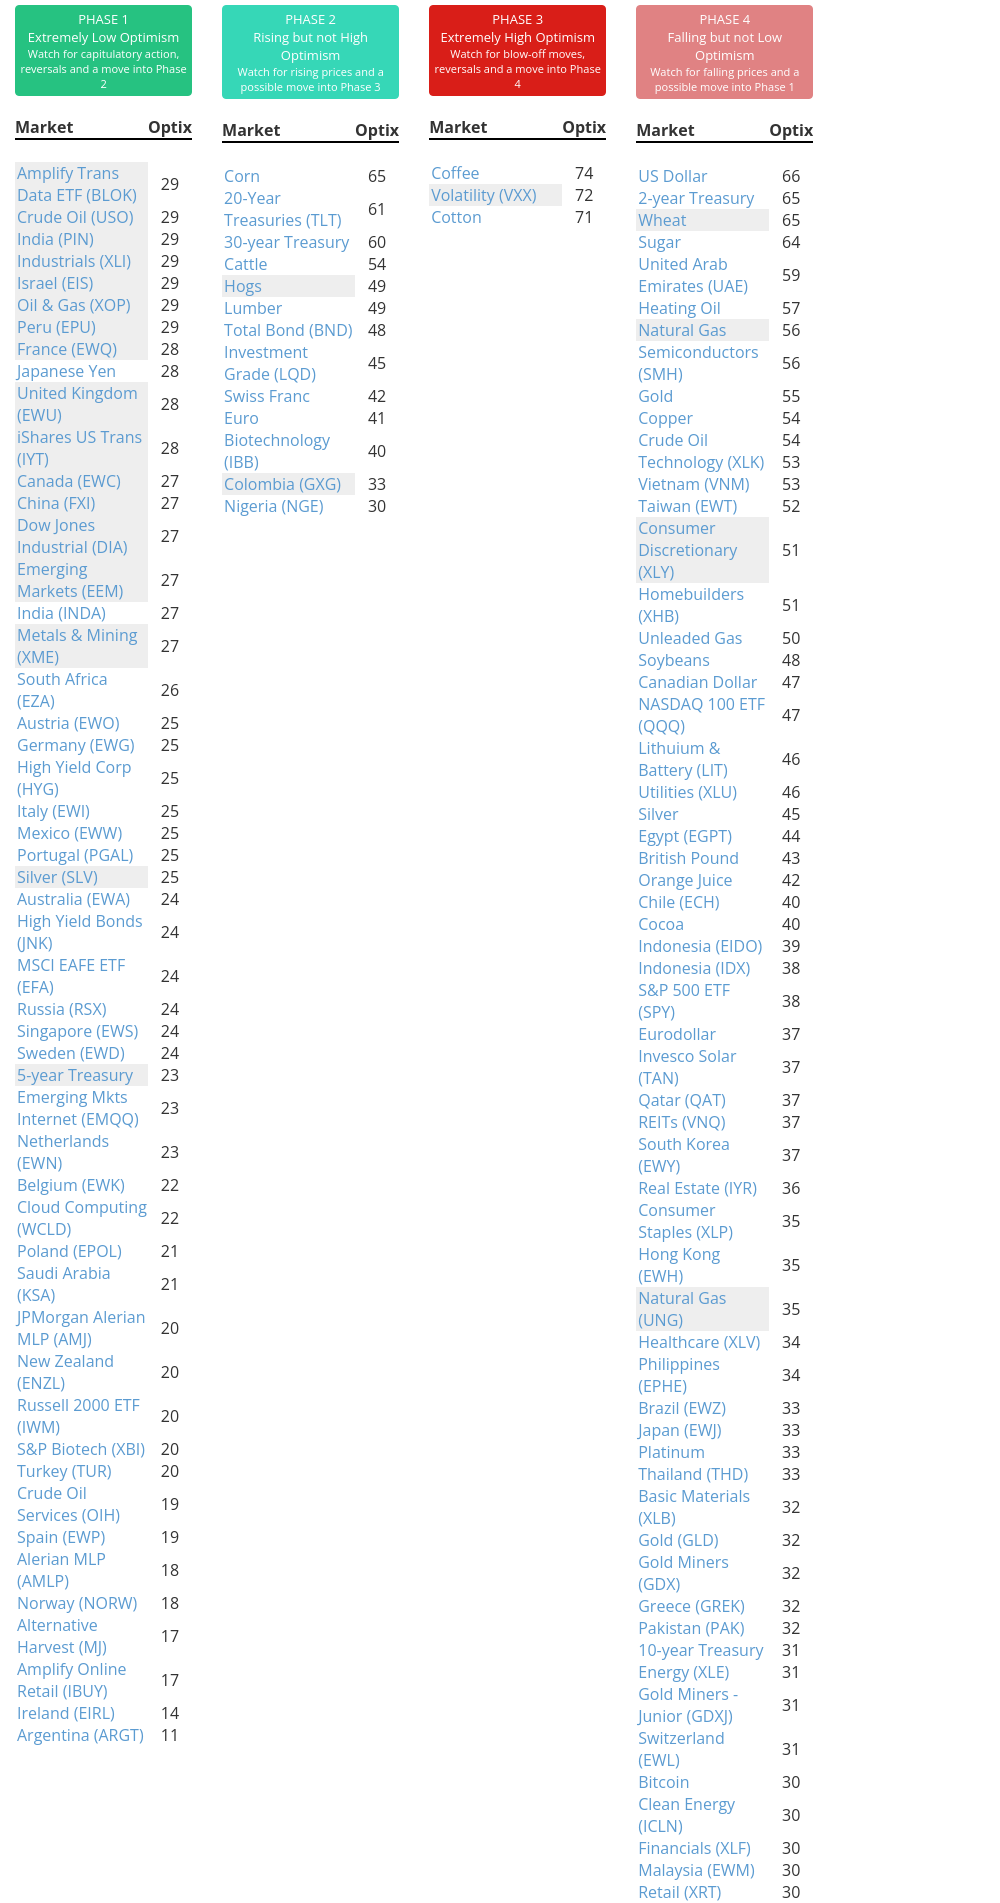
Phase Table
Ranks
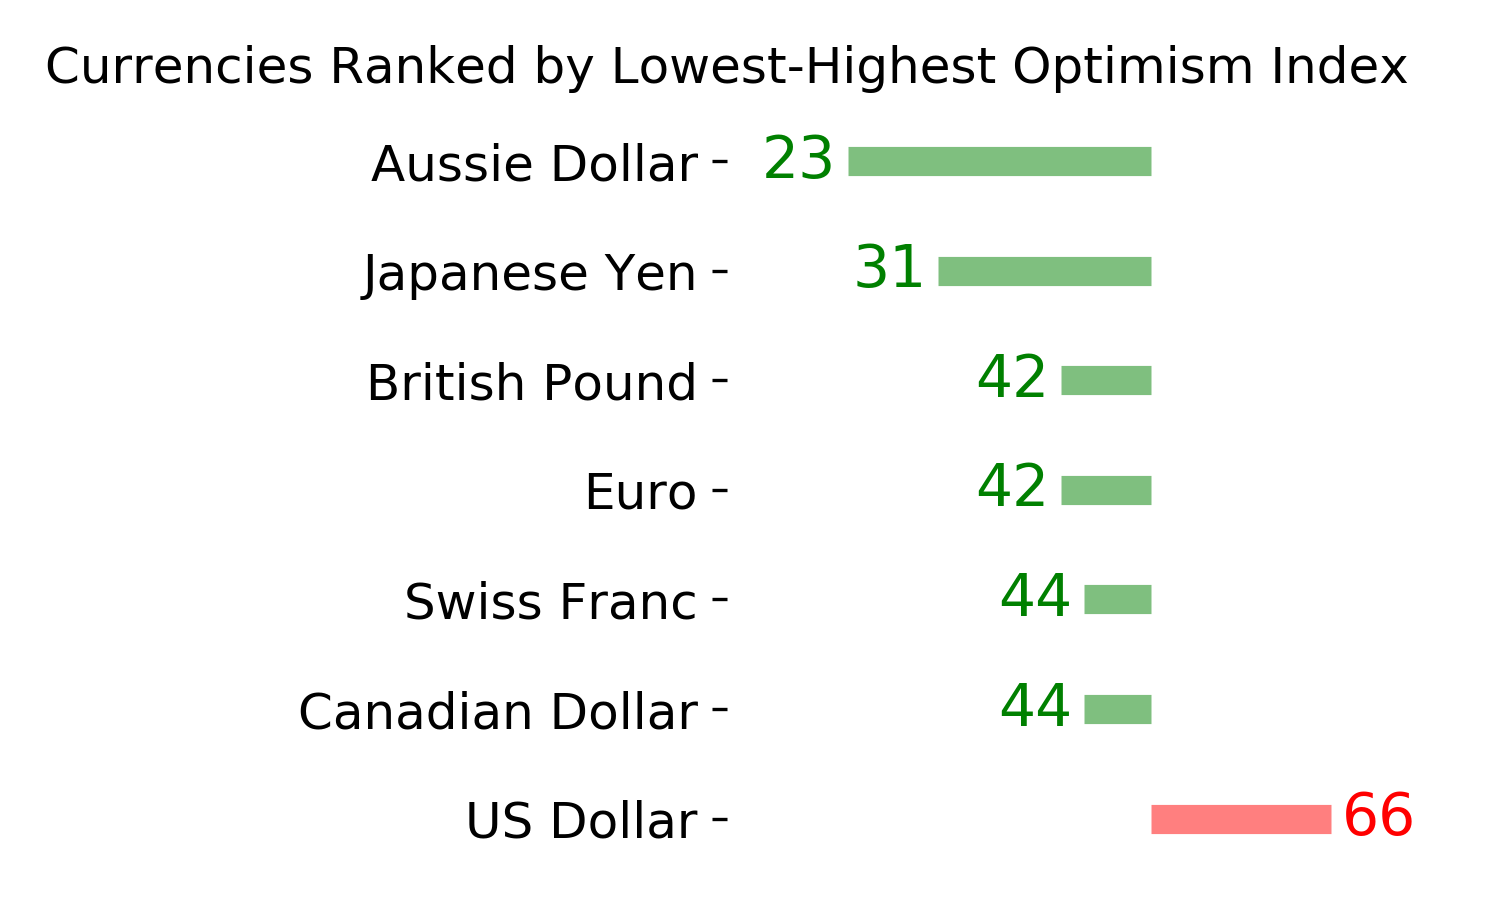
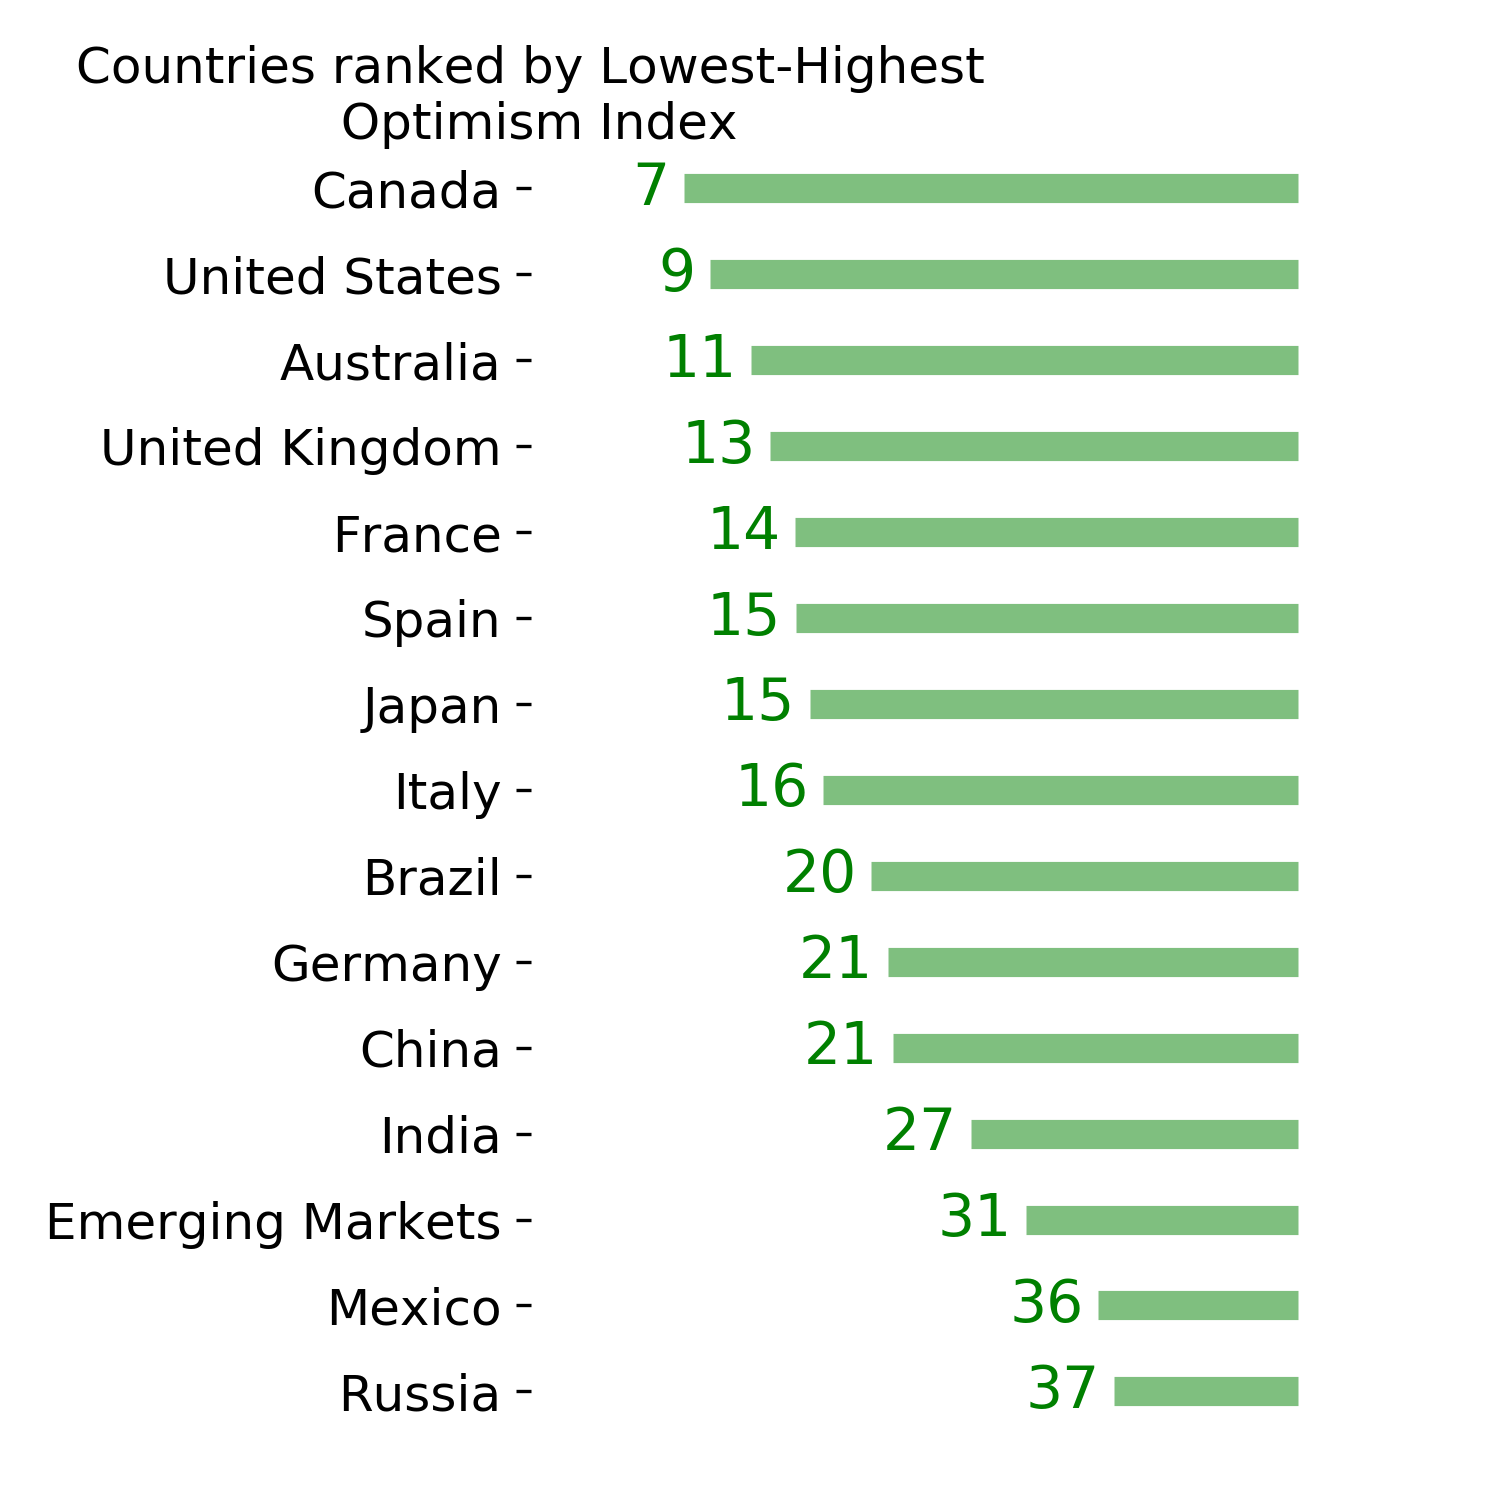
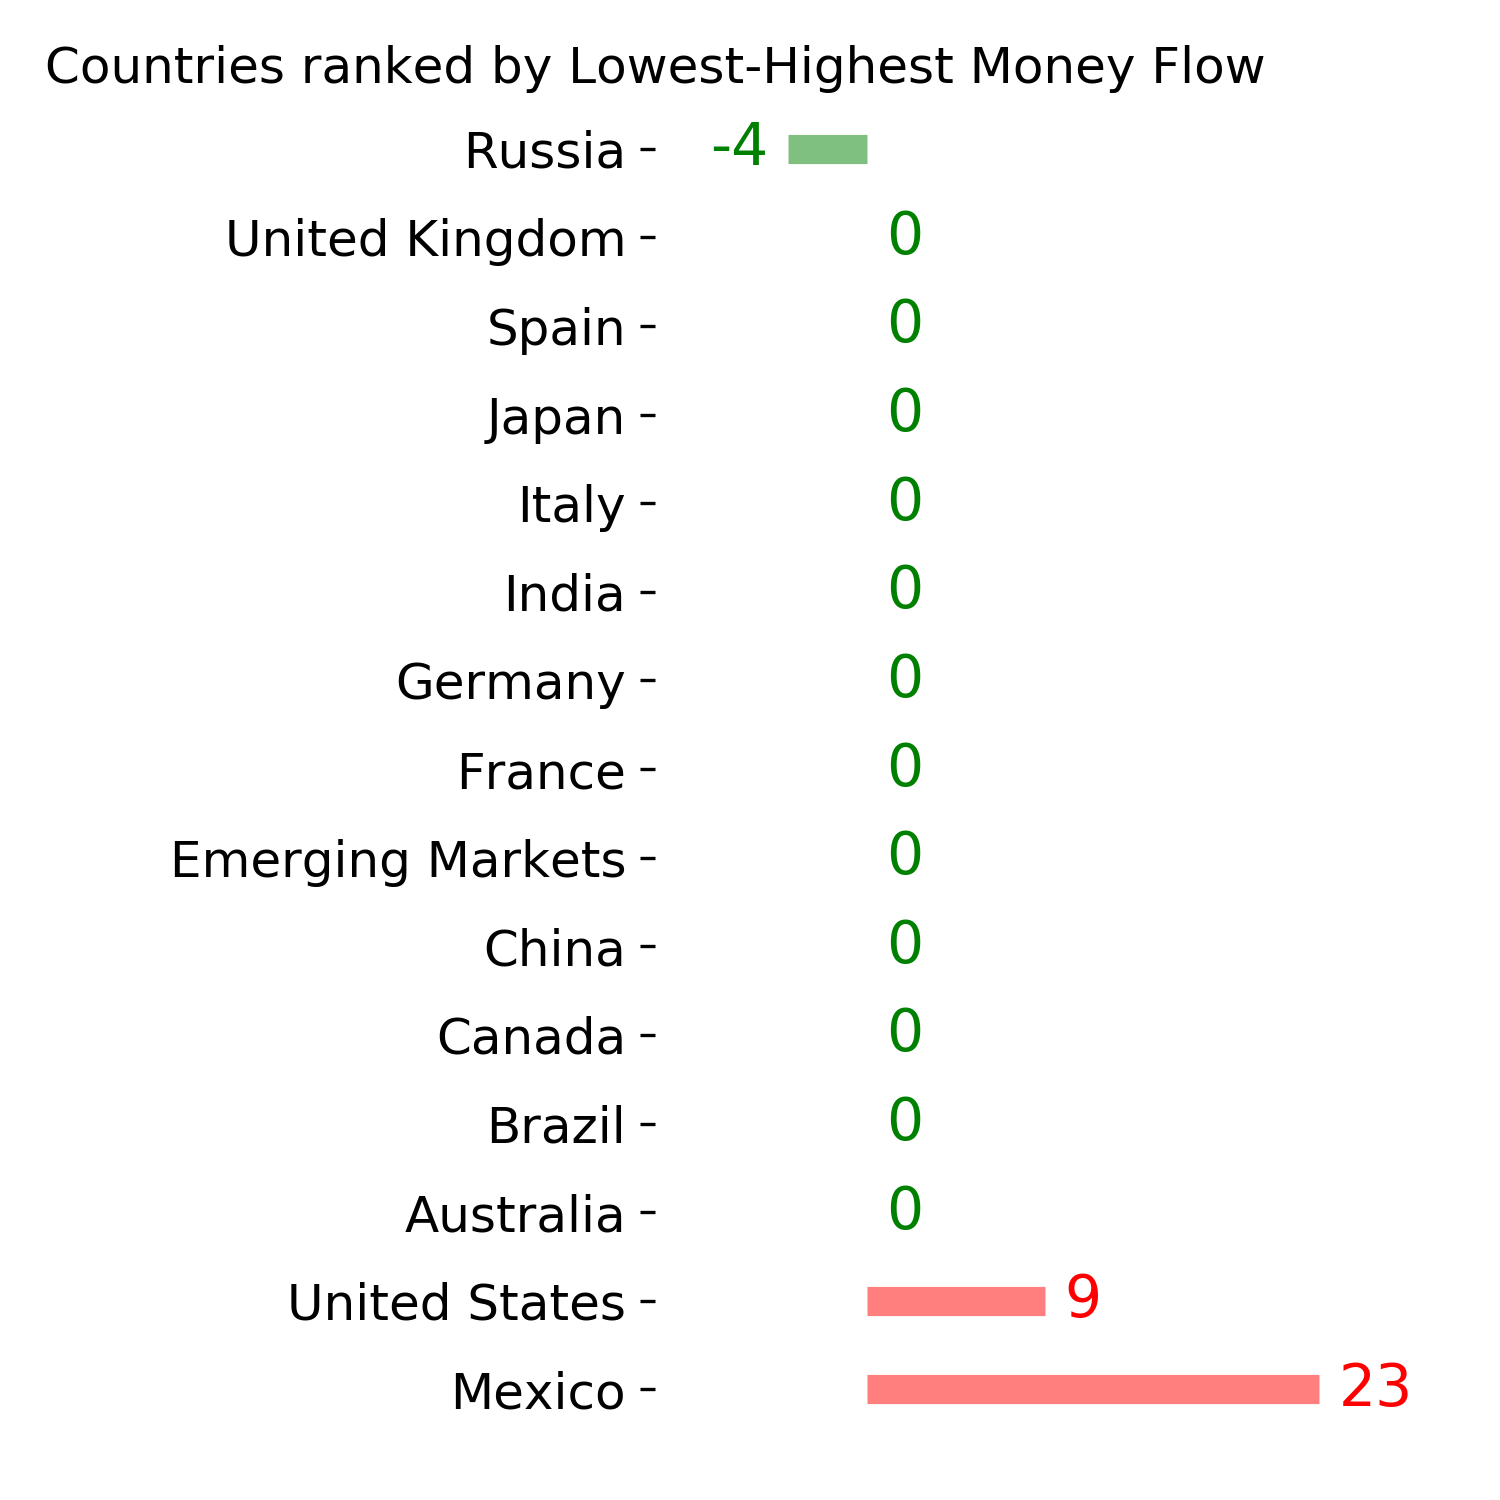
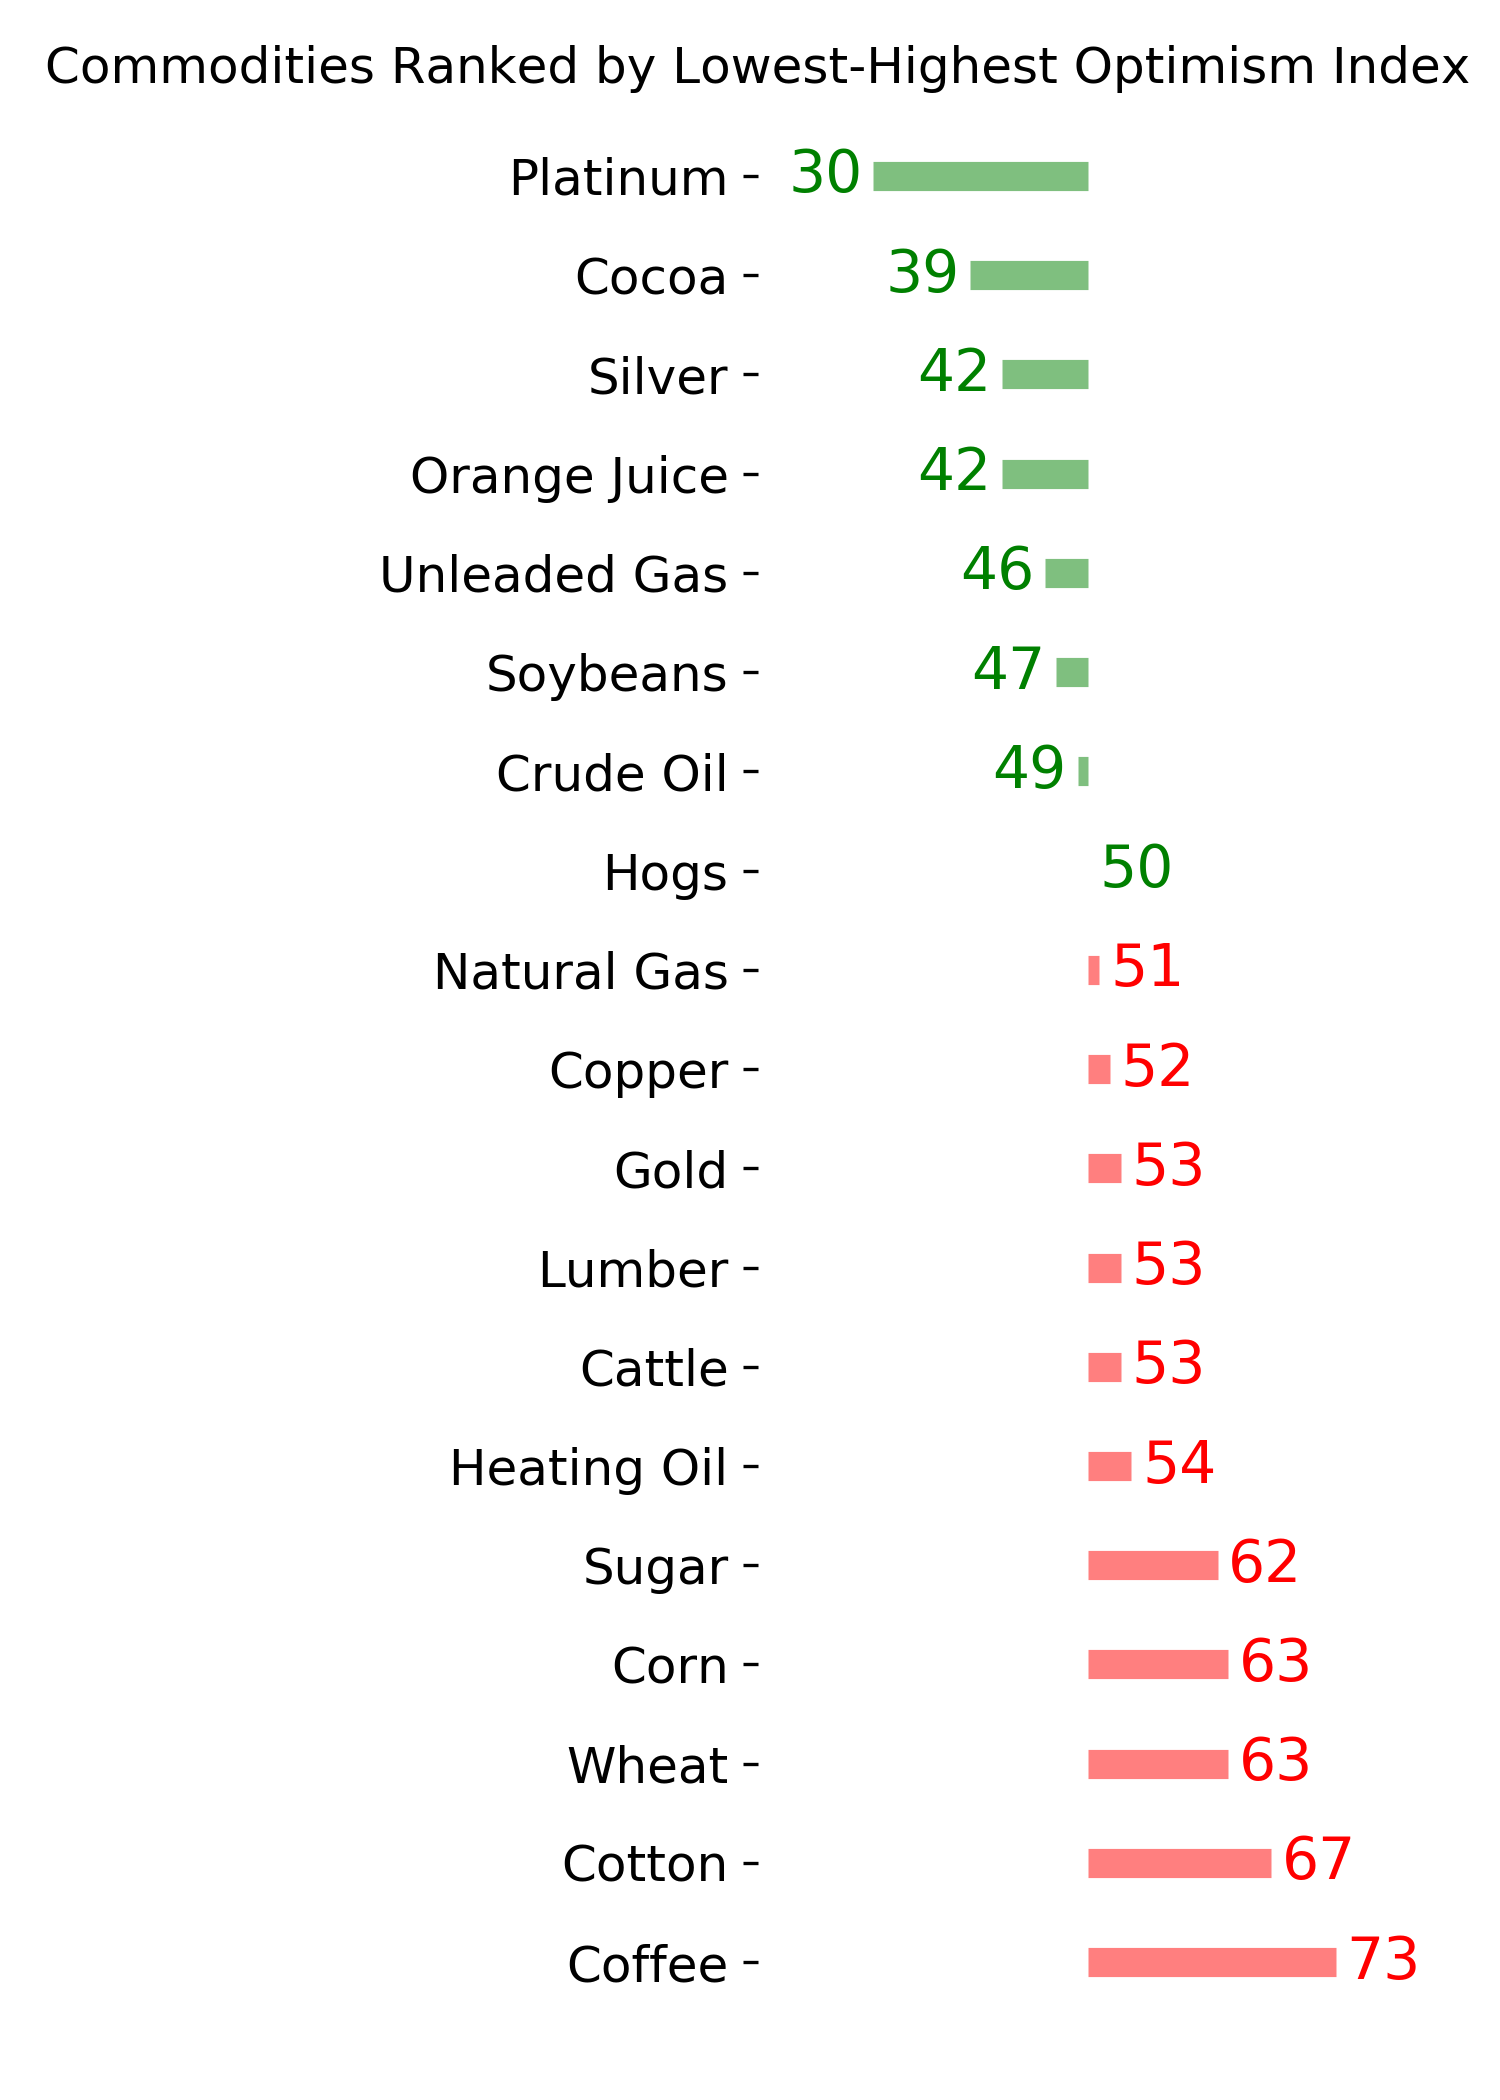
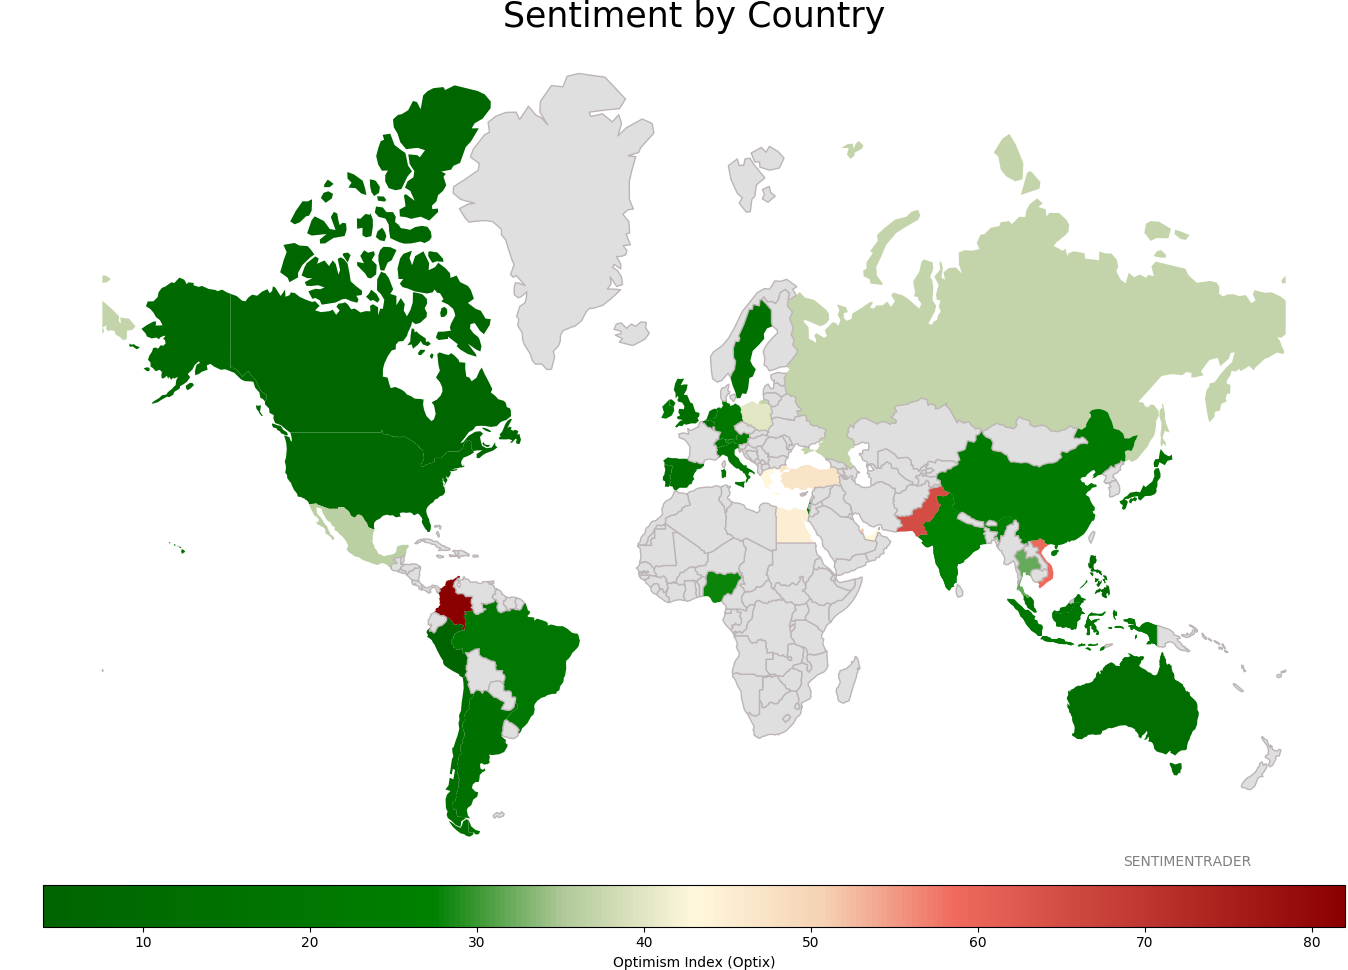
Sentiment Around The World
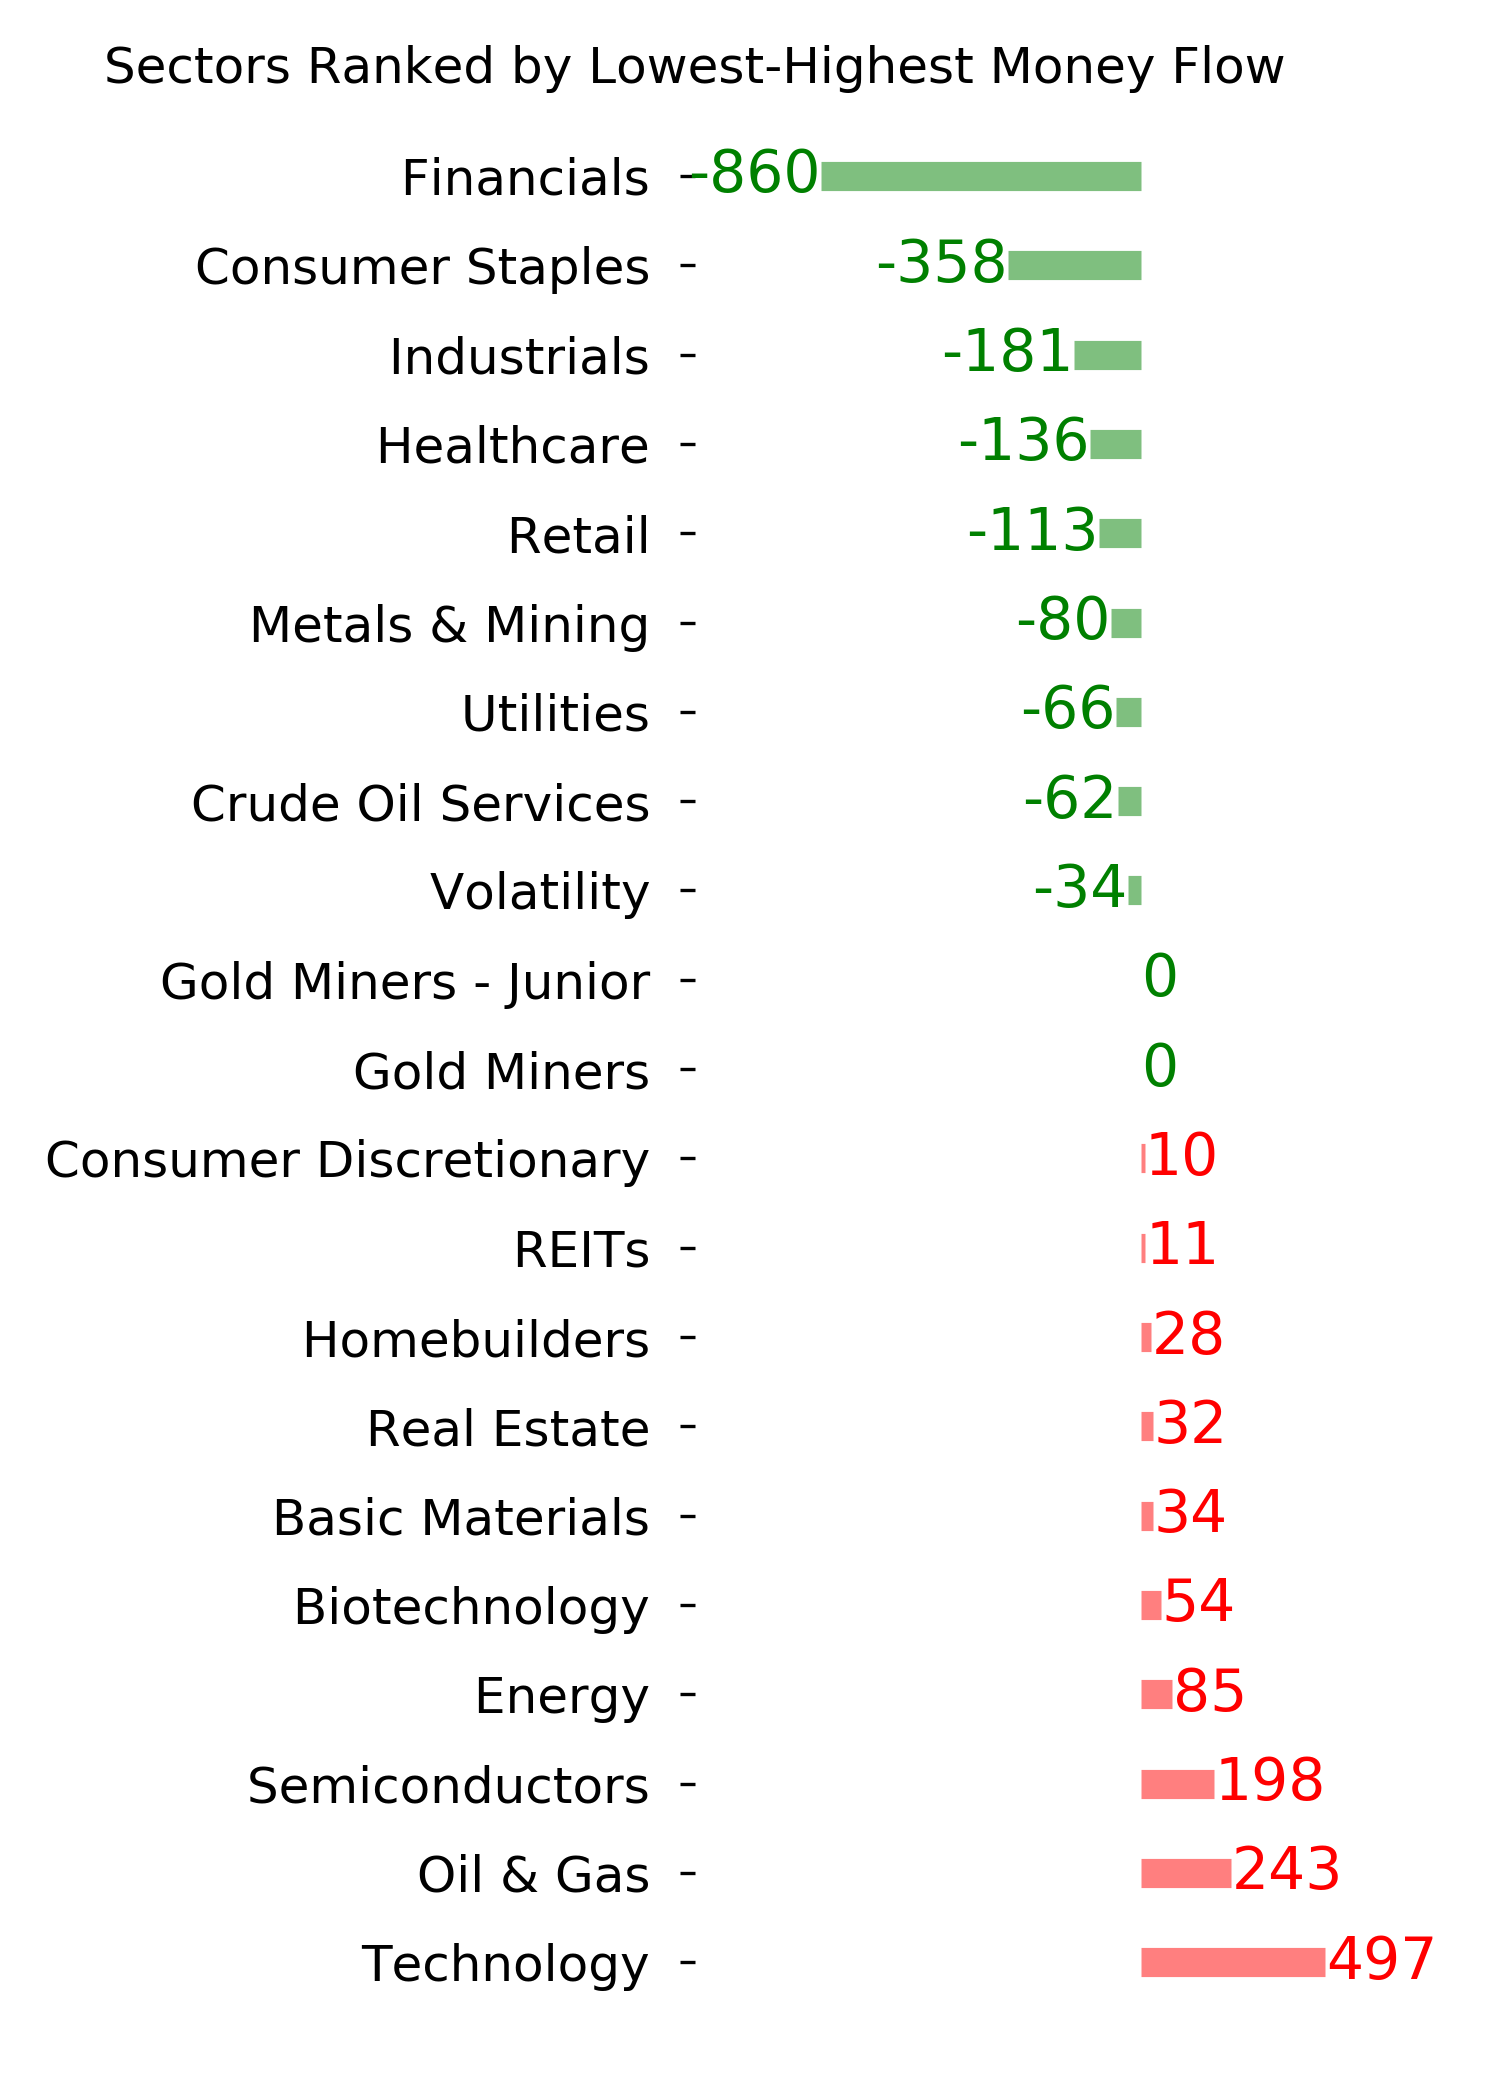
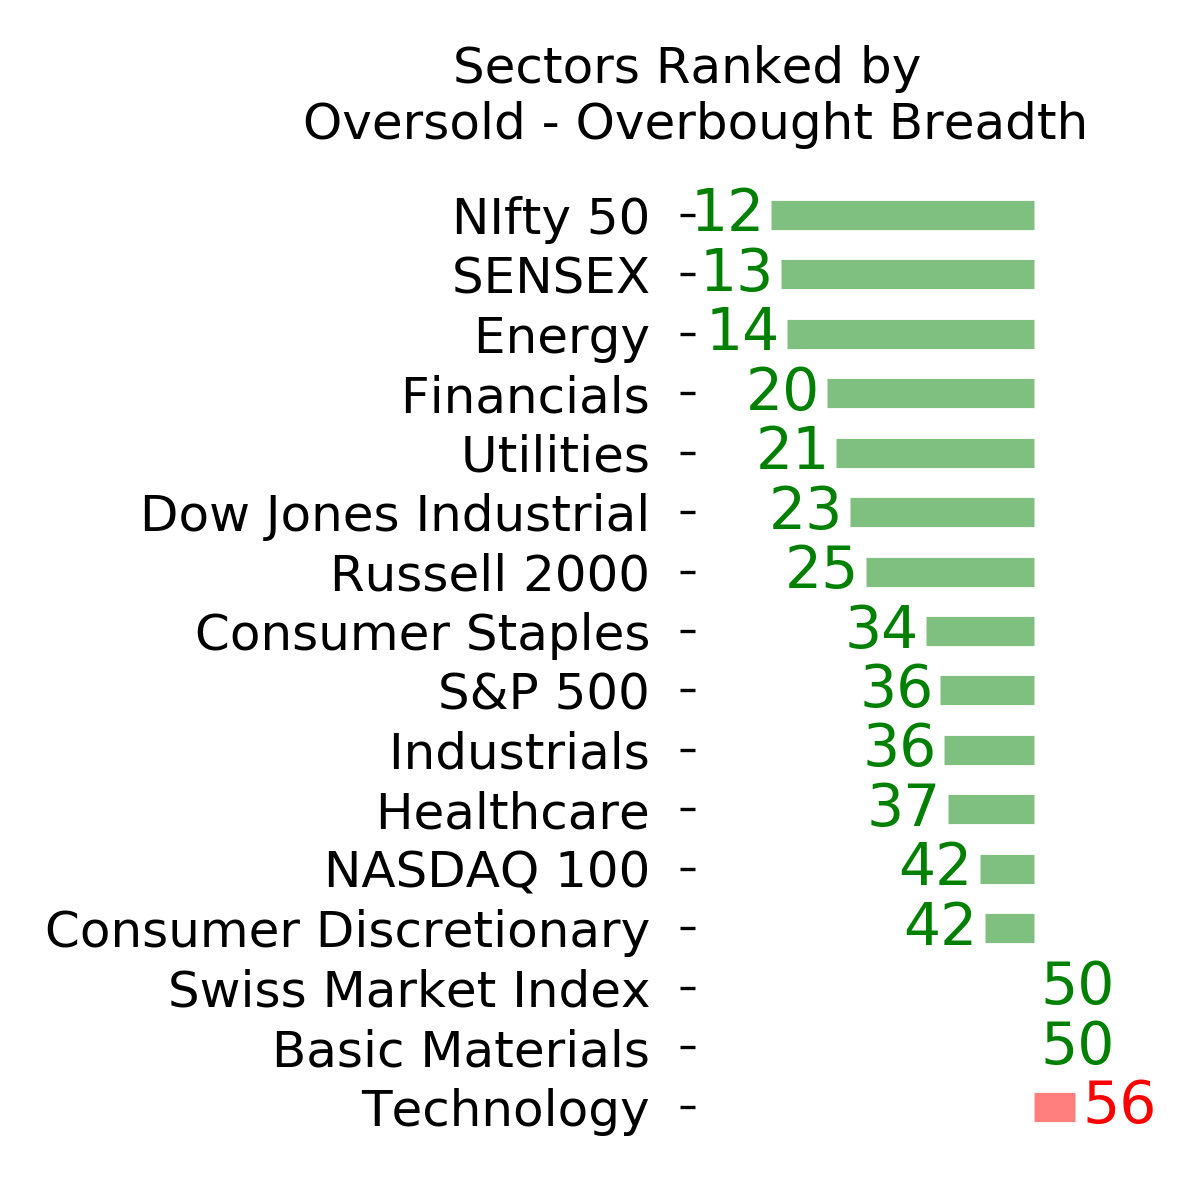
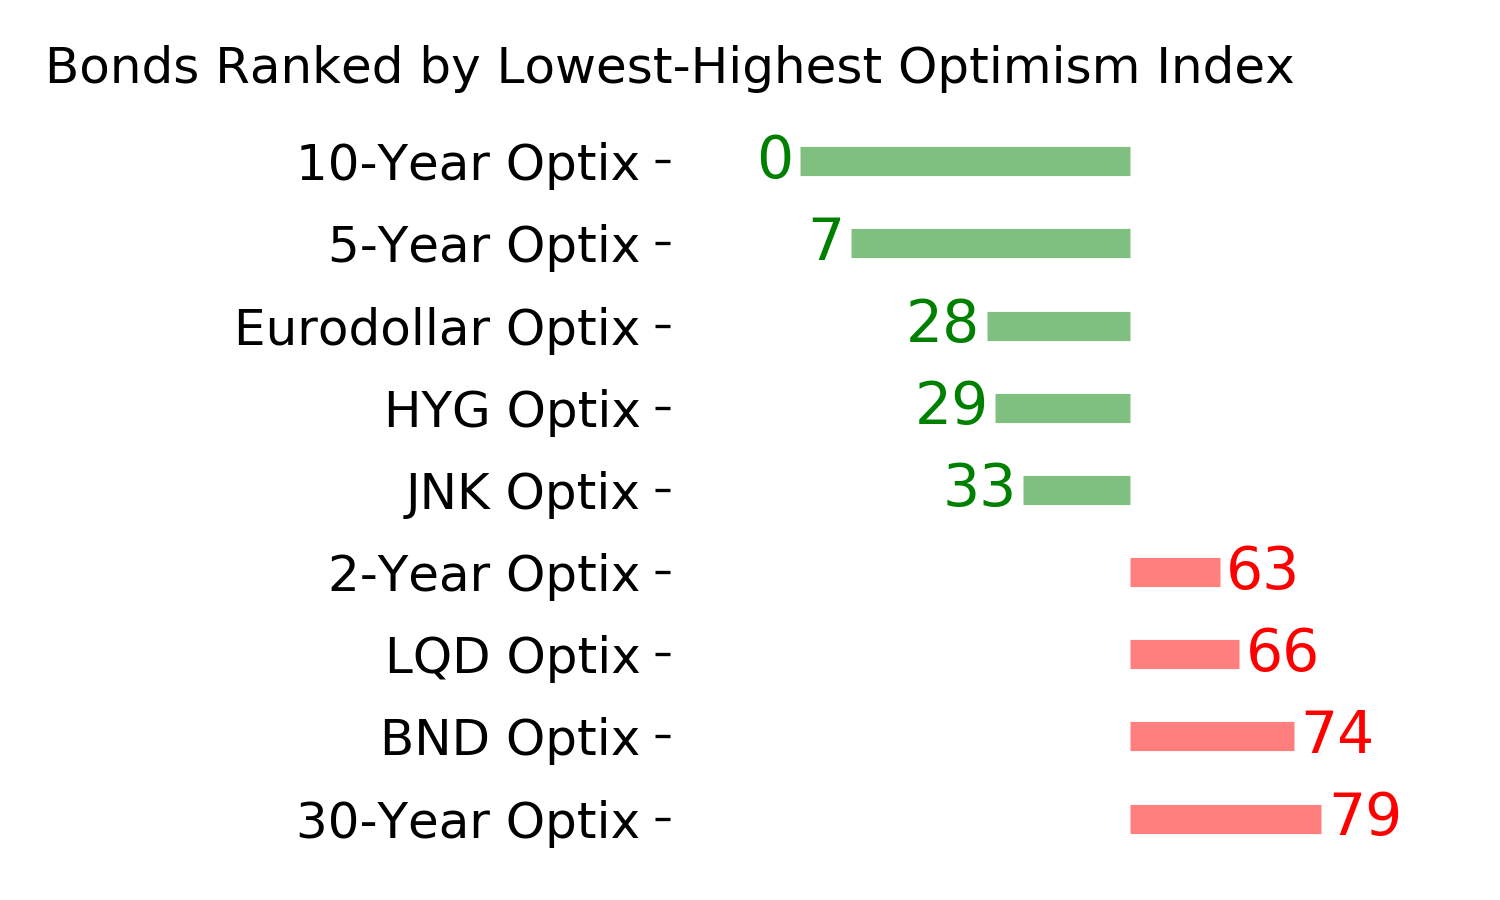
Optimism Index Thumbnails
|
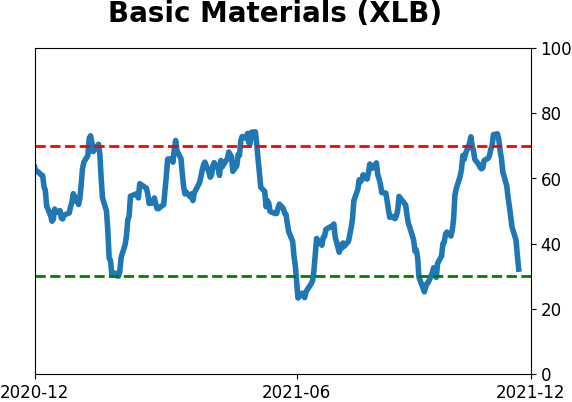
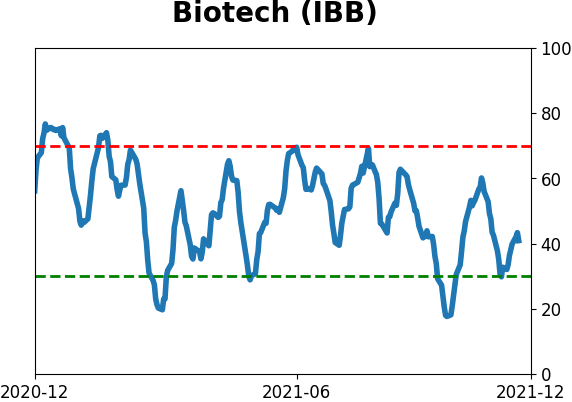
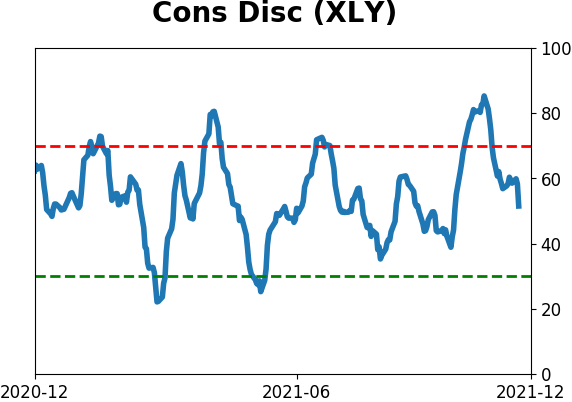
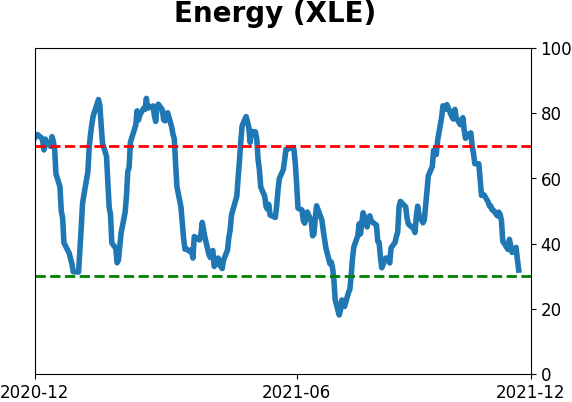
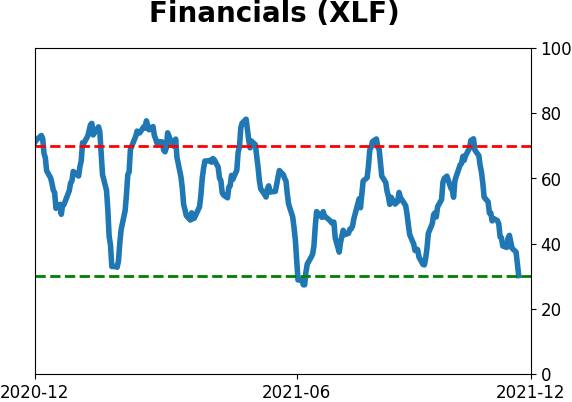
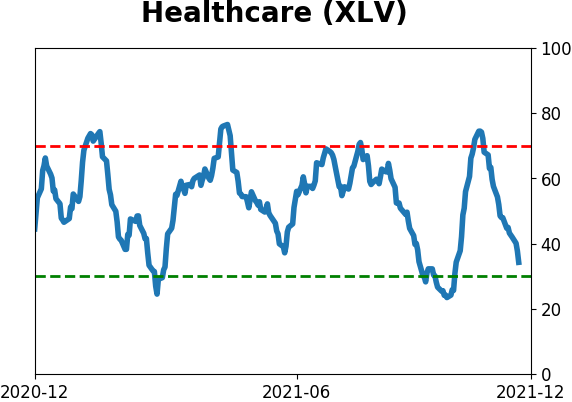
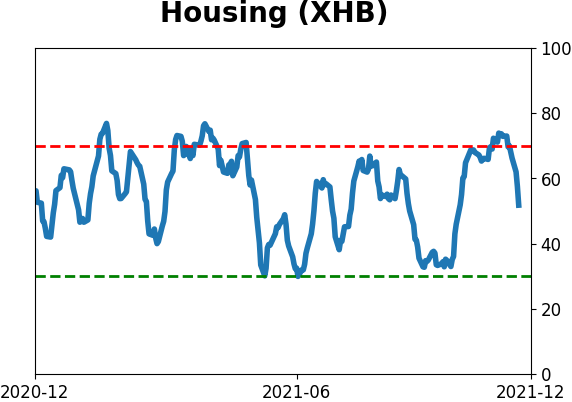
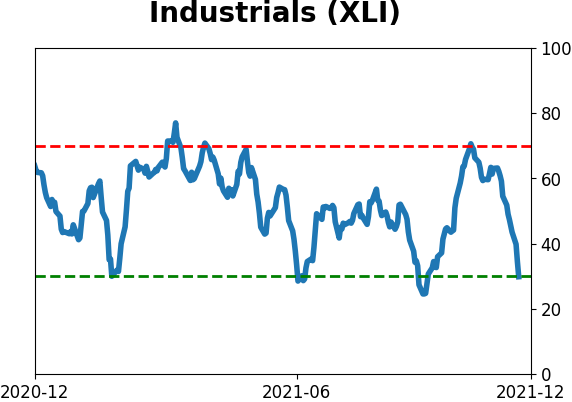
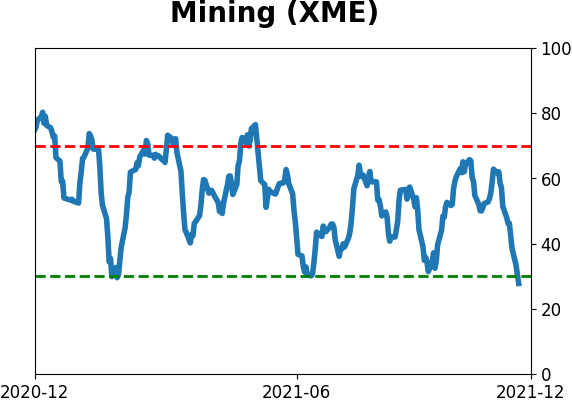
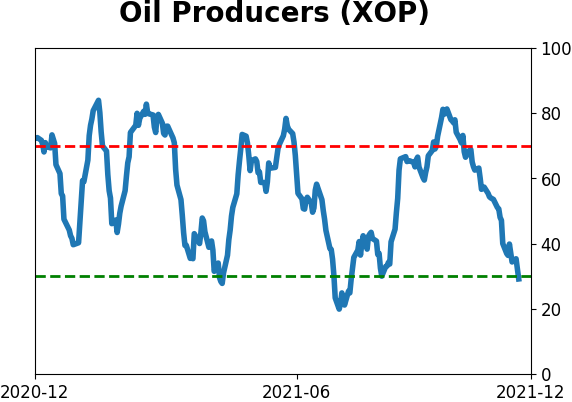
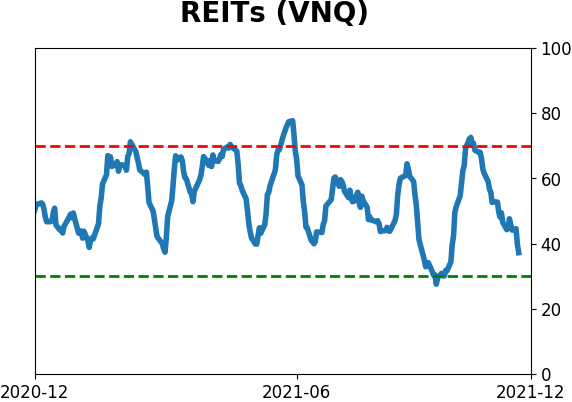
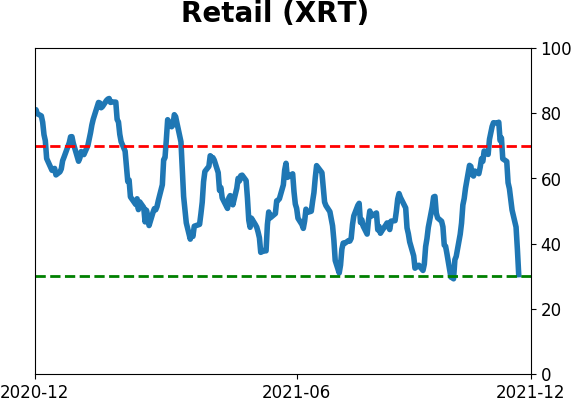
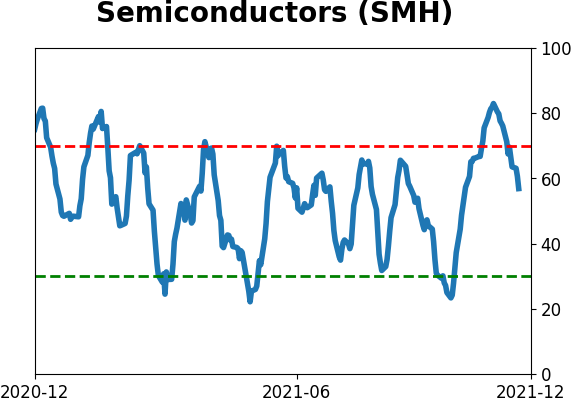
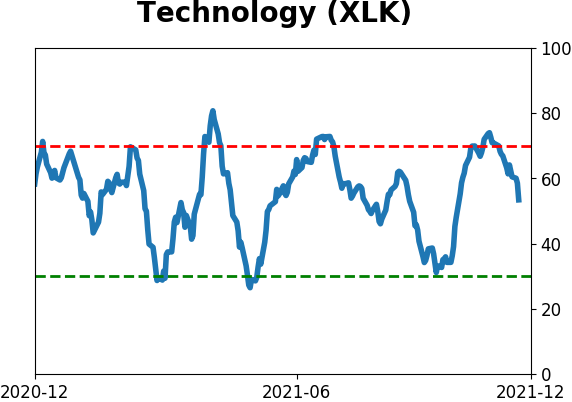
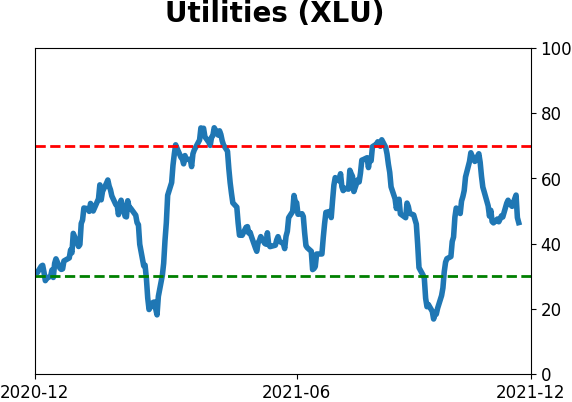
Sector ETF's - 10-Day Moving Average
|
|
|
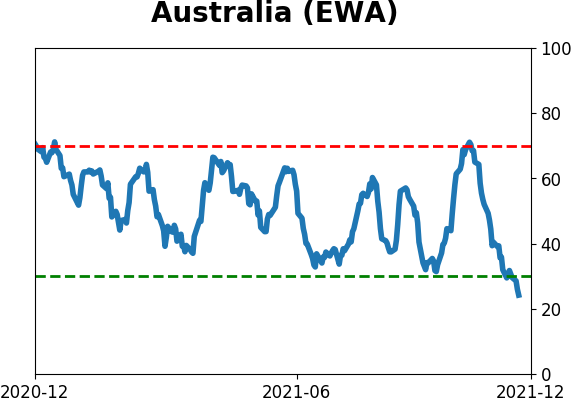
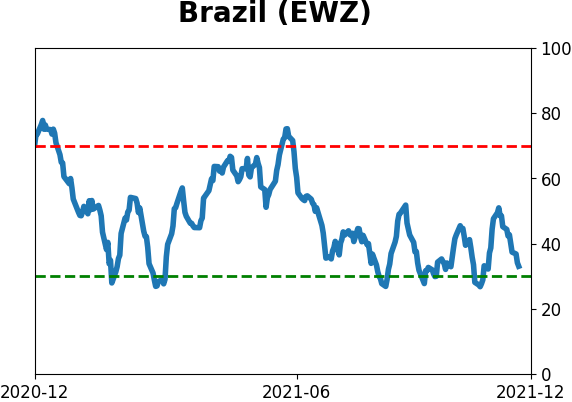
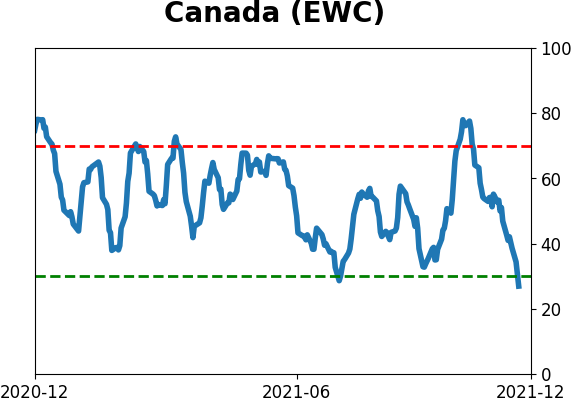
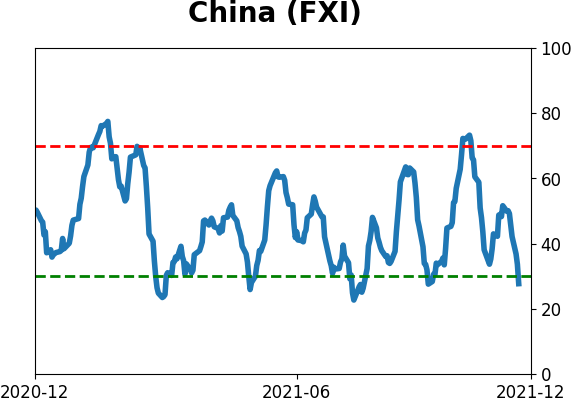
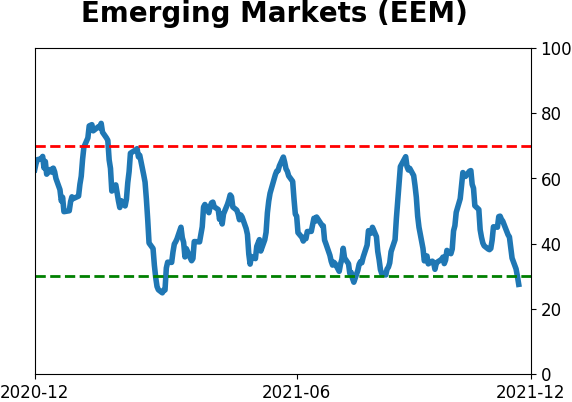
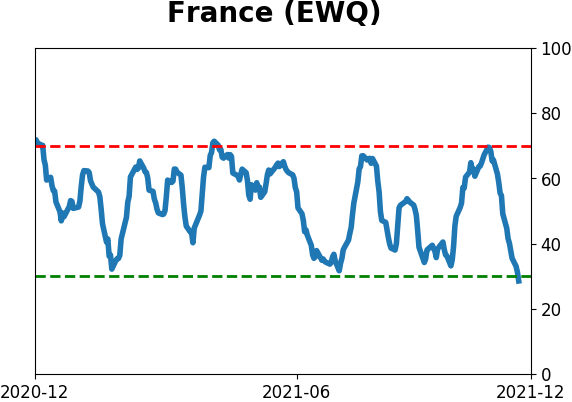
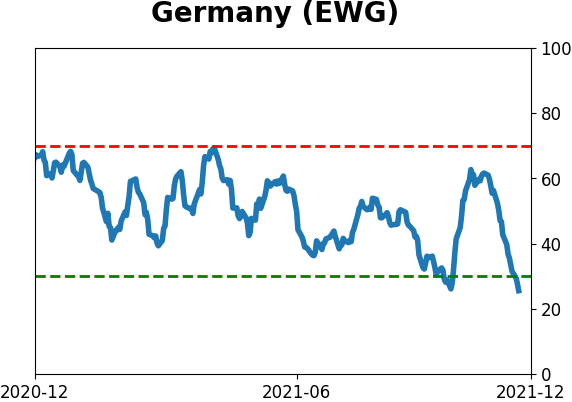
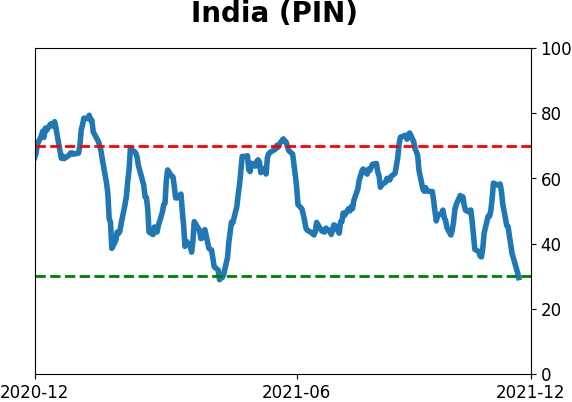
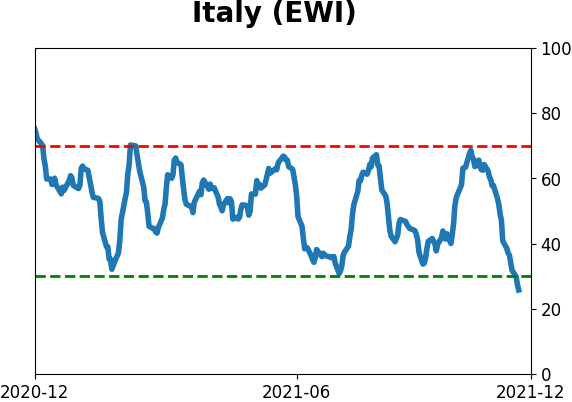
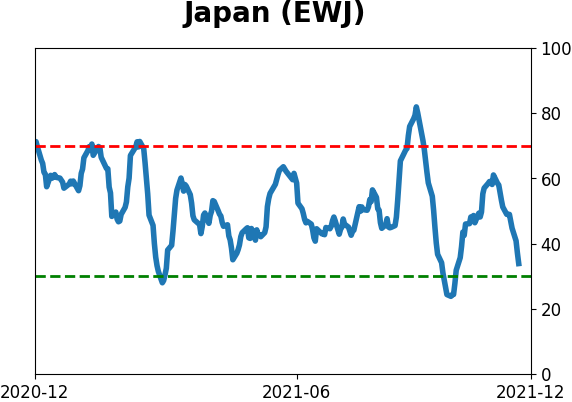
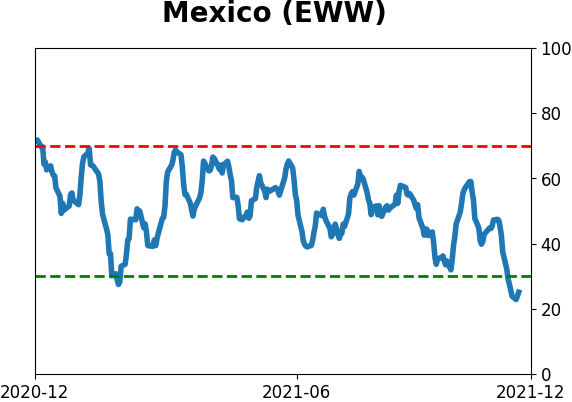
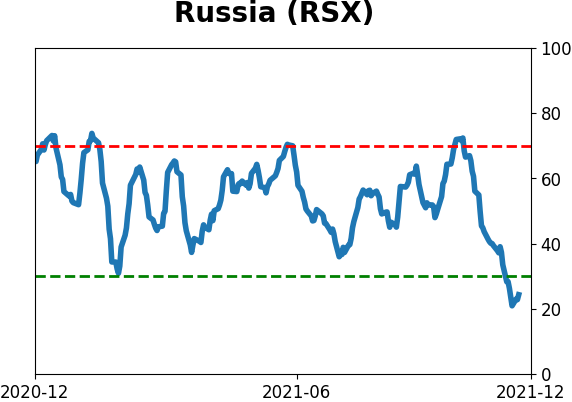
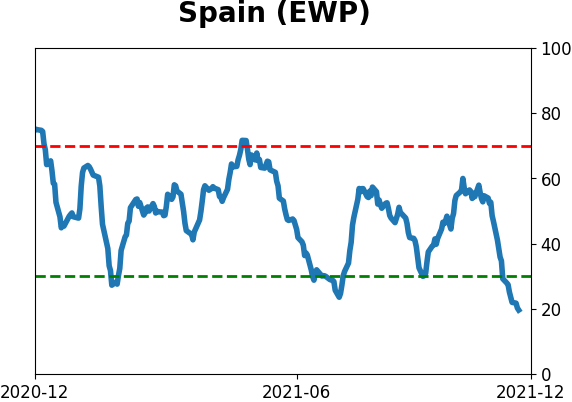
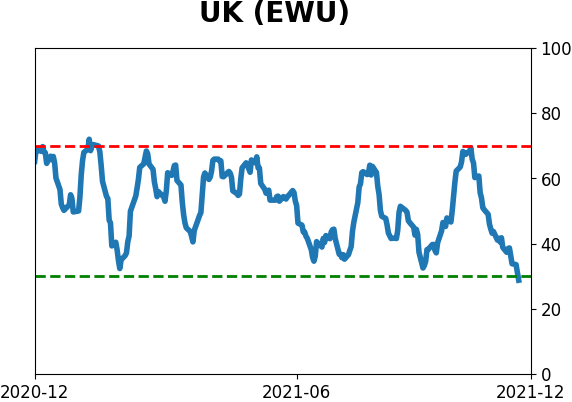
Country ETF's - 10-Day Moving Average
|
|
|
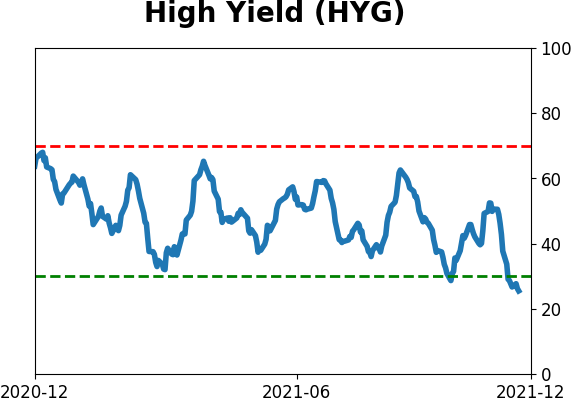
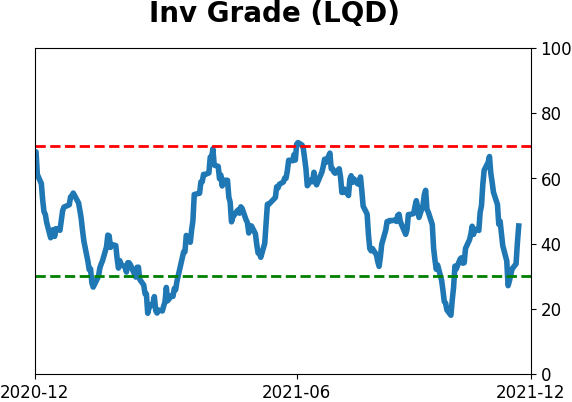
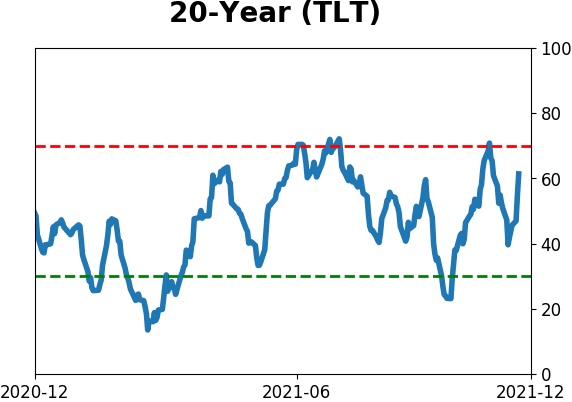
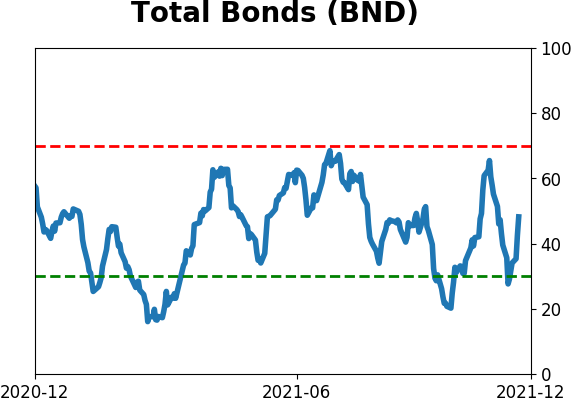
Bond ETF's - 10-Day Moving Average
|
|
|
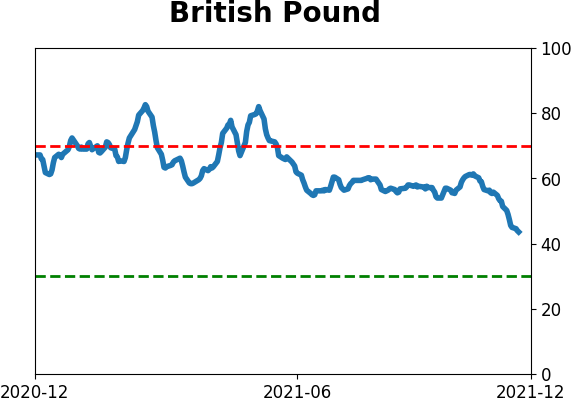
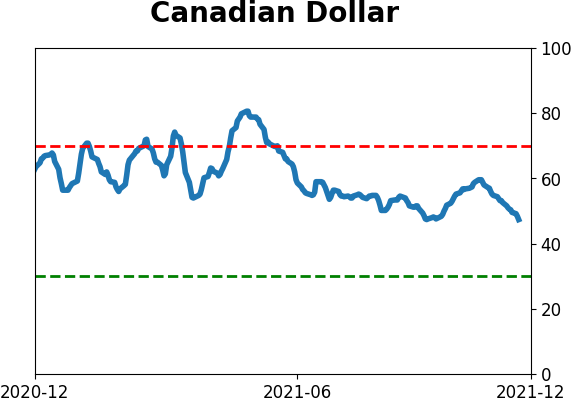
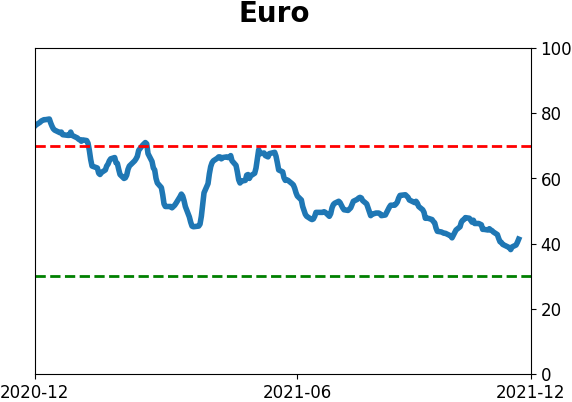
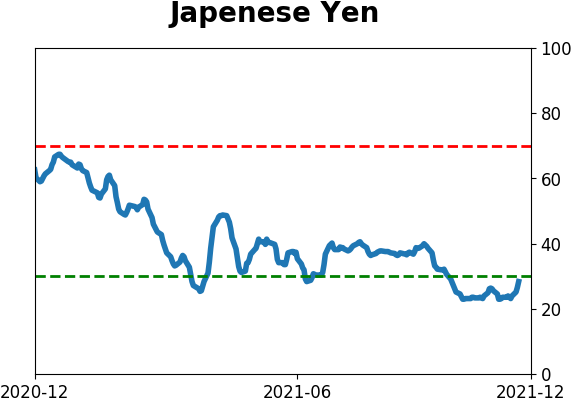
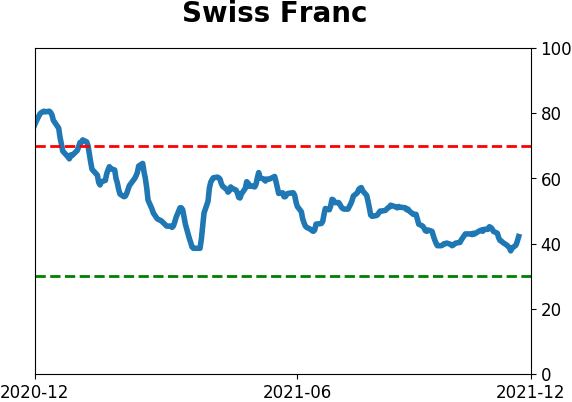
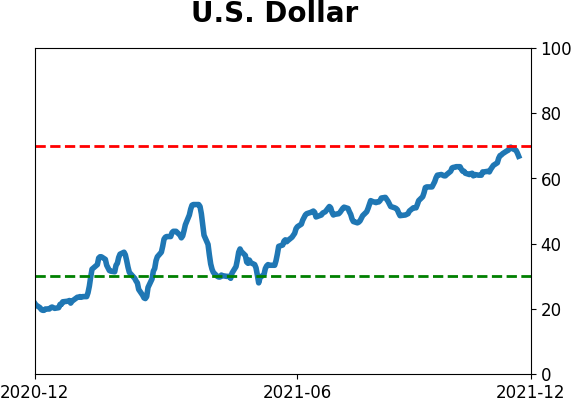
Currency ETF's - 5-Day Moving Average
|
|
|
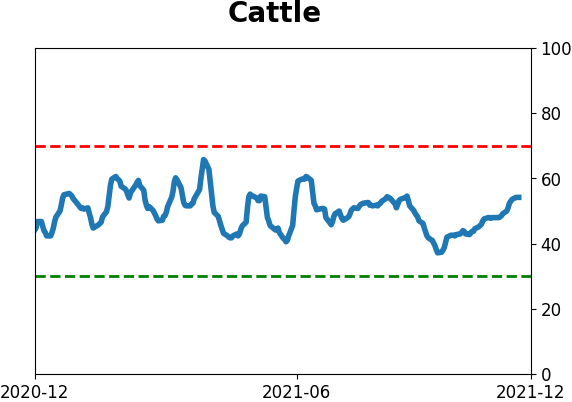
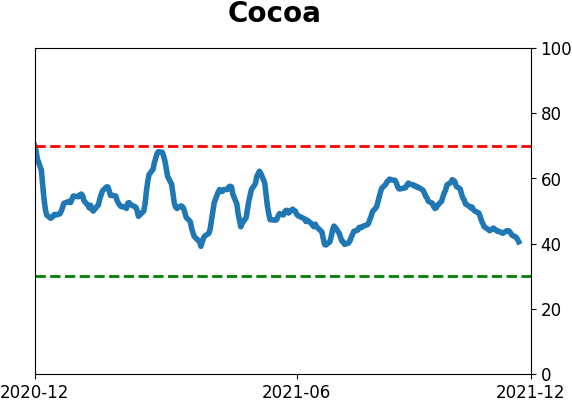
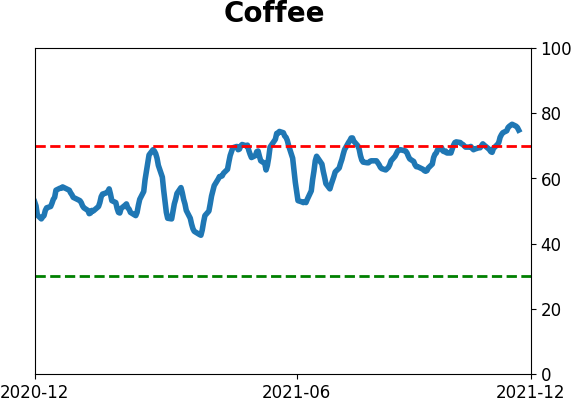
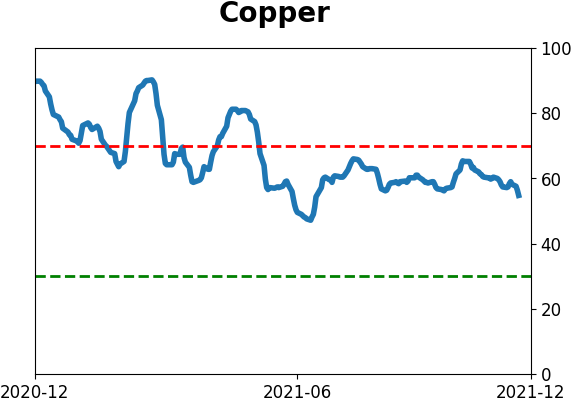
Commodity ETF's - 5-Day Moving Average
|
|