Headlines
|
|
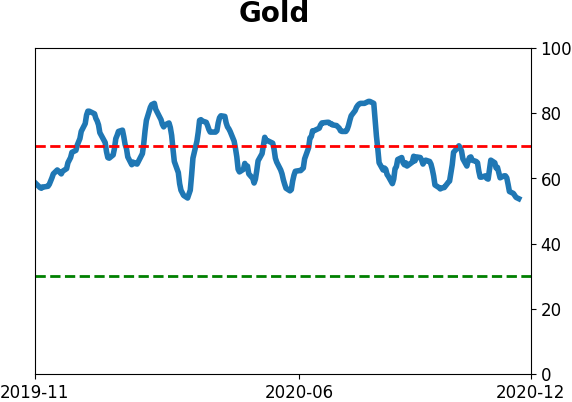
Gold suffers its 1st real test of its long-term trend:
Gold has crossed below its 200-day average for the first time in nearly 9 months. It has also suffered its deepest pullback since 2016 when it had recently been at a new high. This kind of behavior has generally led to higher prices for gold, and for gold mining stocks.
Bottom Line:
- The market environment is pristine, but with near-historic optimism, gains tend to be muted, with a high probability of being reversed at some point over the ensuing weeks.
|
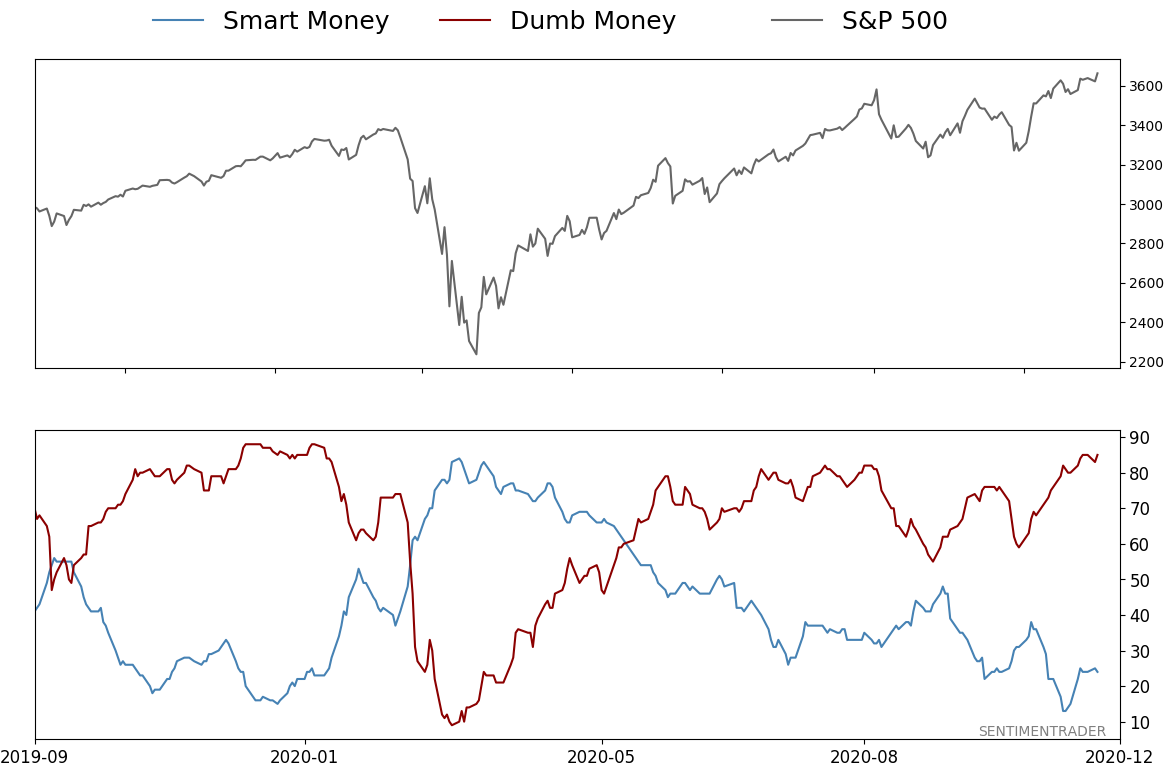
Smart / Dumb Money Confidence
|
Smart Money Confidence: 24%
Dumb Money Confidence: 85%
|
|
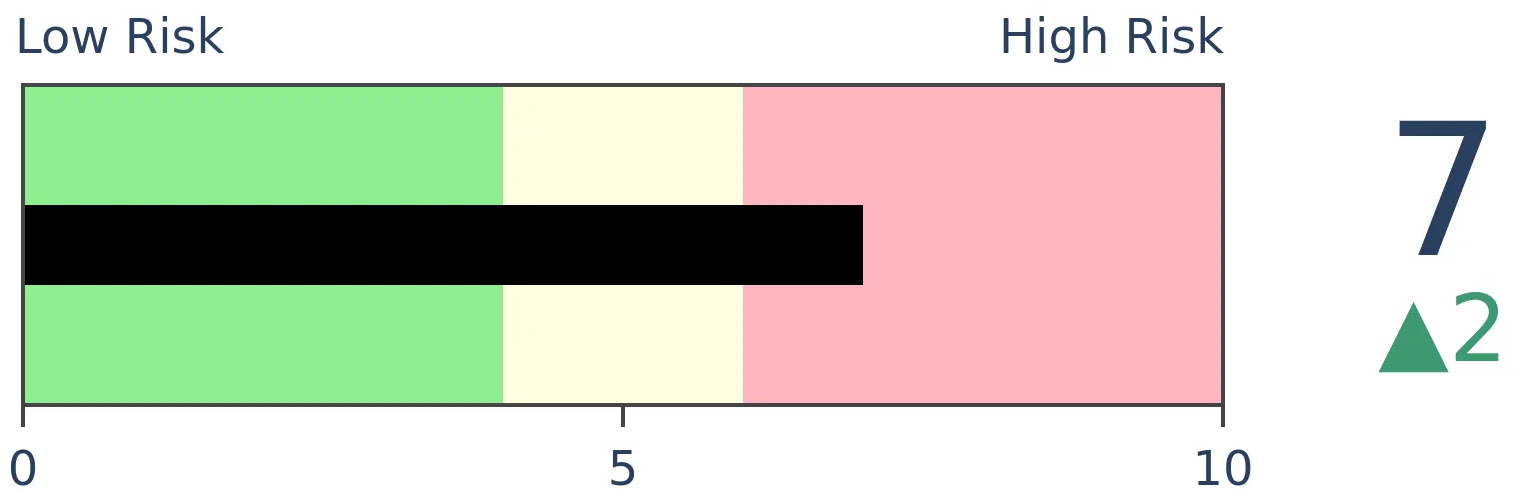
Risk Levels
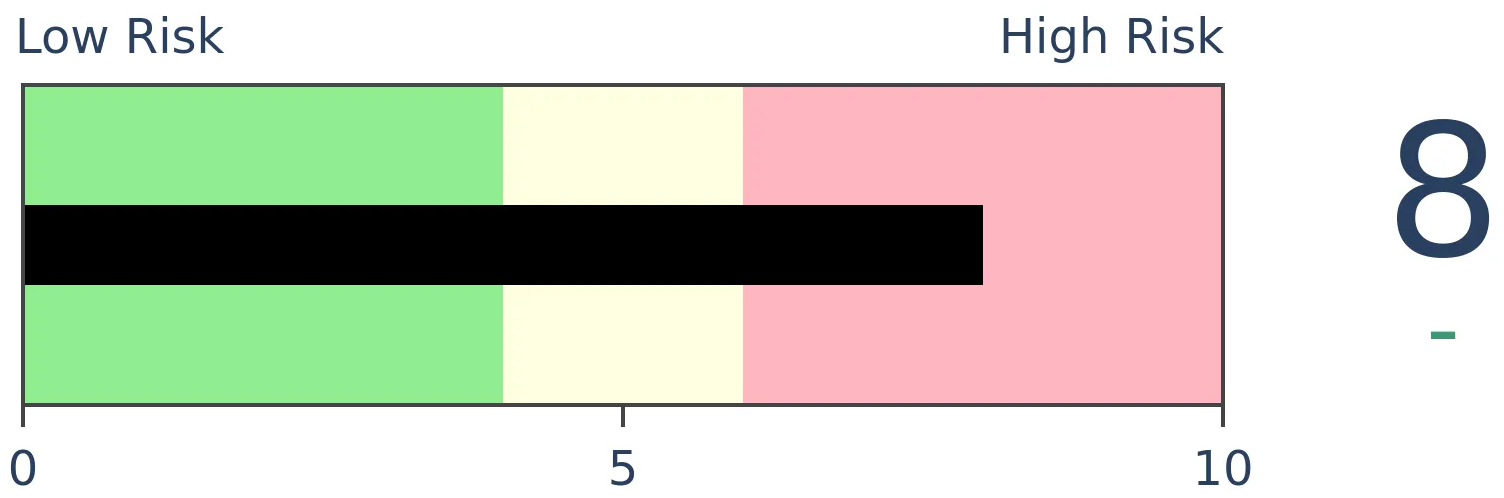
Stocks Short-Term
|
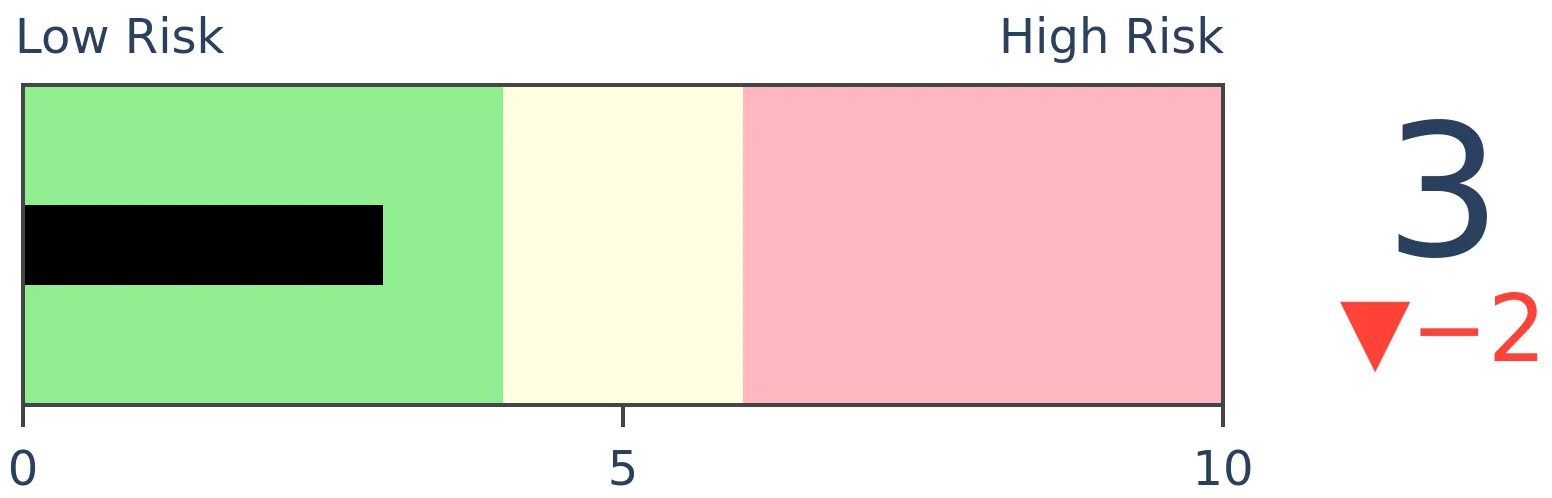
Stocks Medium-Term
|
|
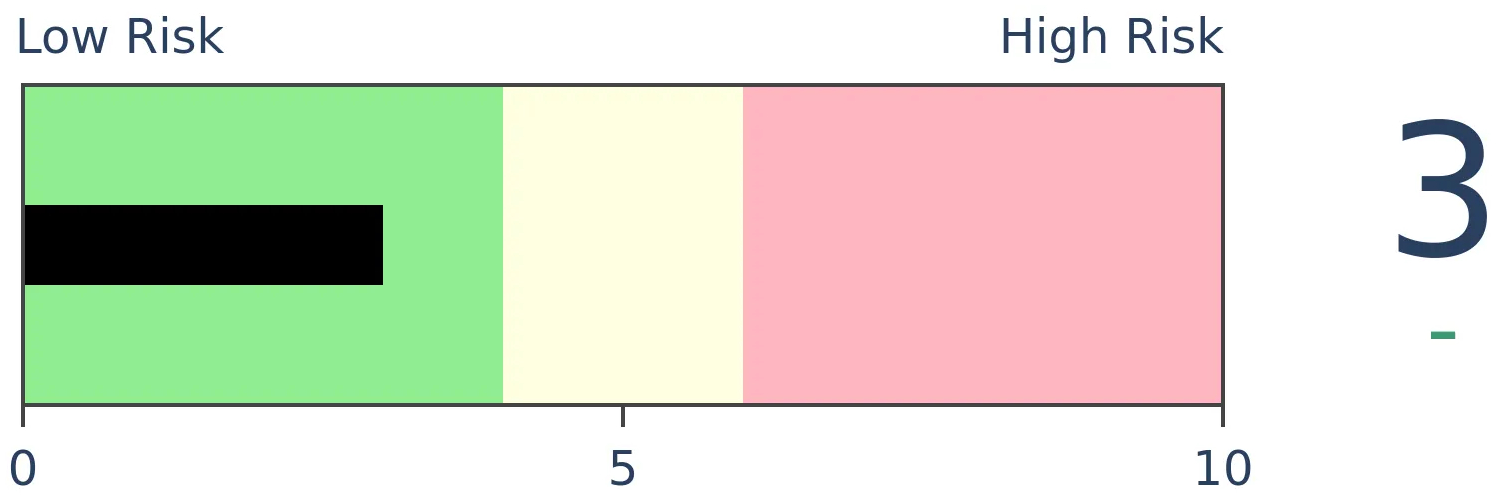
Bonds
|
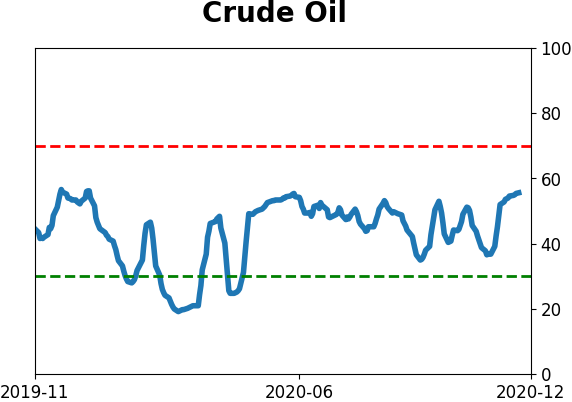
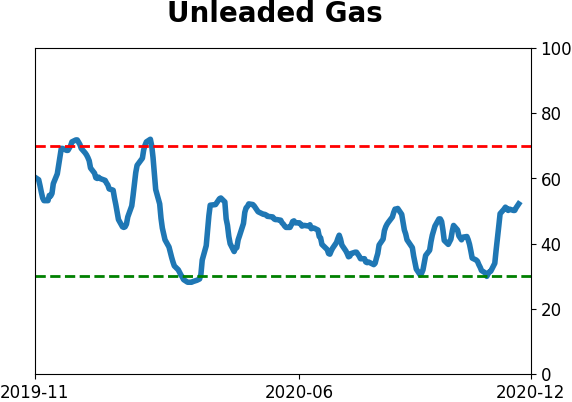
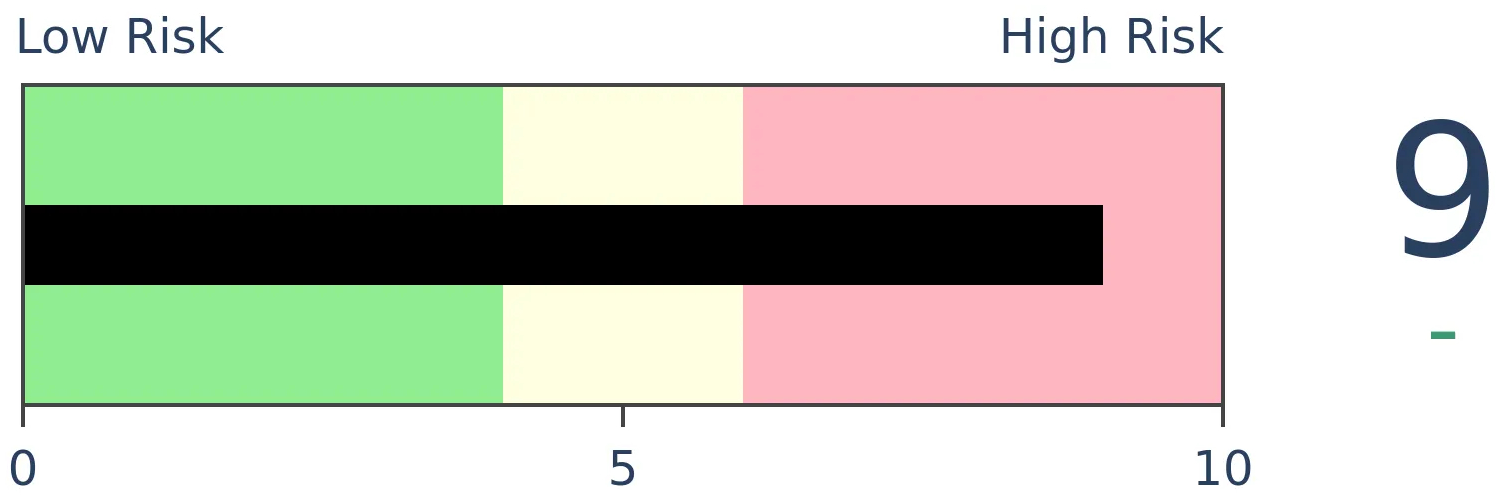
Crude Oil

|
|
Gold
|
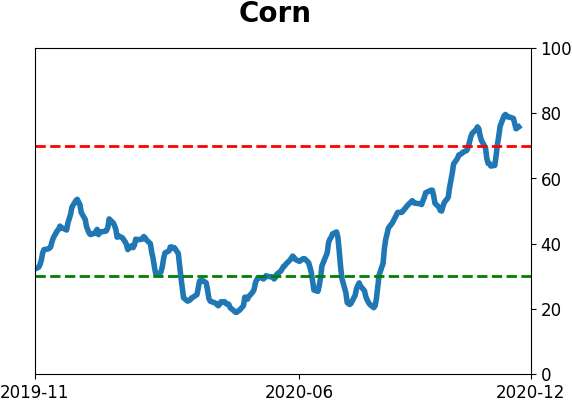
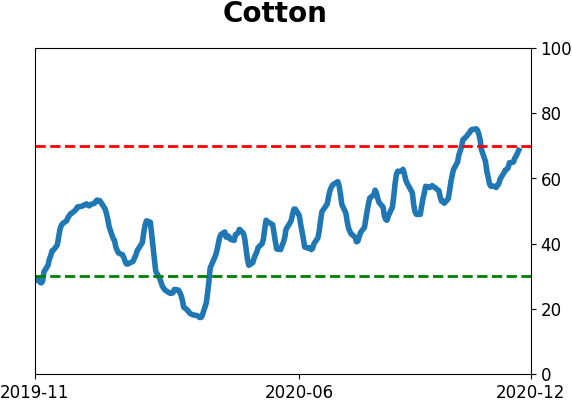
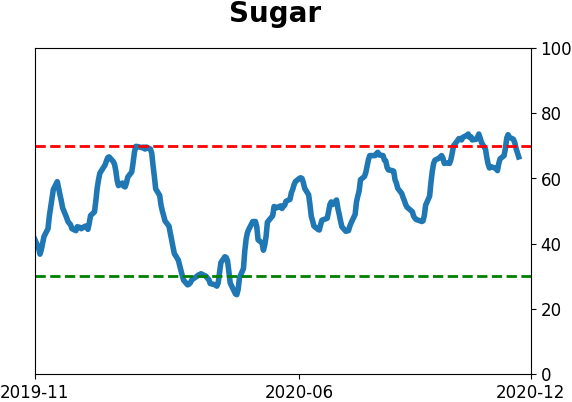
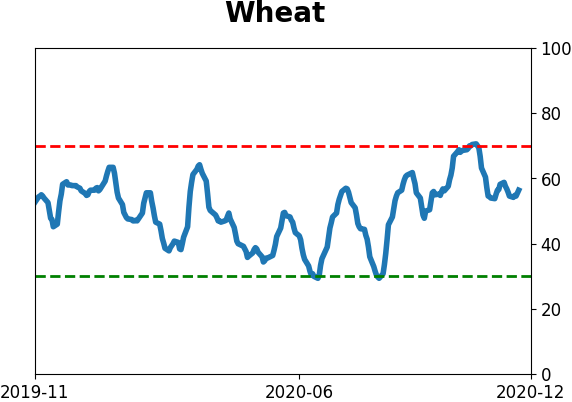
Agriculture
|
|
Research
BOTTOM LINE
Gold has crossed below its 200-day average for the first time in nearly 9 months. It has also suffered its deepest pullback since 2016 when it had recently been at a new high. This kind of behavior has generally led to higher prices for gold, and for gold mining stocks.
FORECAST / TIMEFRAME
GDX -- Up, Medium-Term
|
After rallying for months and generating the expected bout of excitement, the mainstay precious metal has lost its luster in favor of bitcoin. For the first time in nearly 9 months, gold has crossed below its 200-day moving average.
This ends its 10th-longest streak above its long-term average.
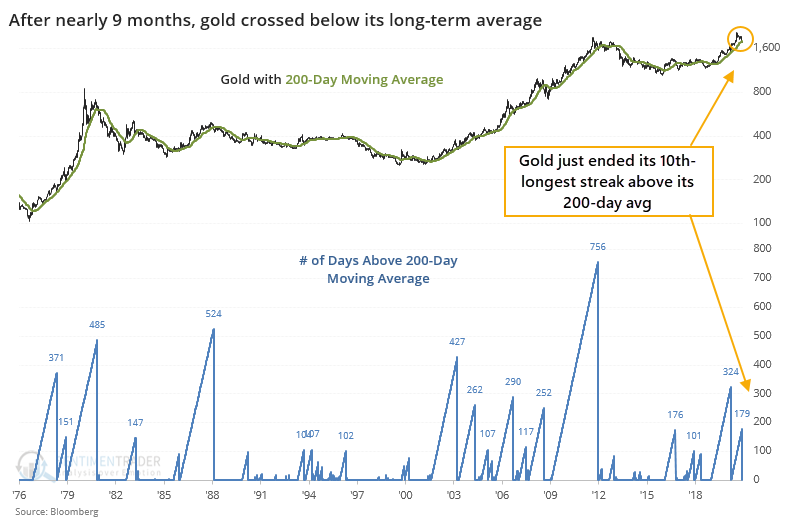
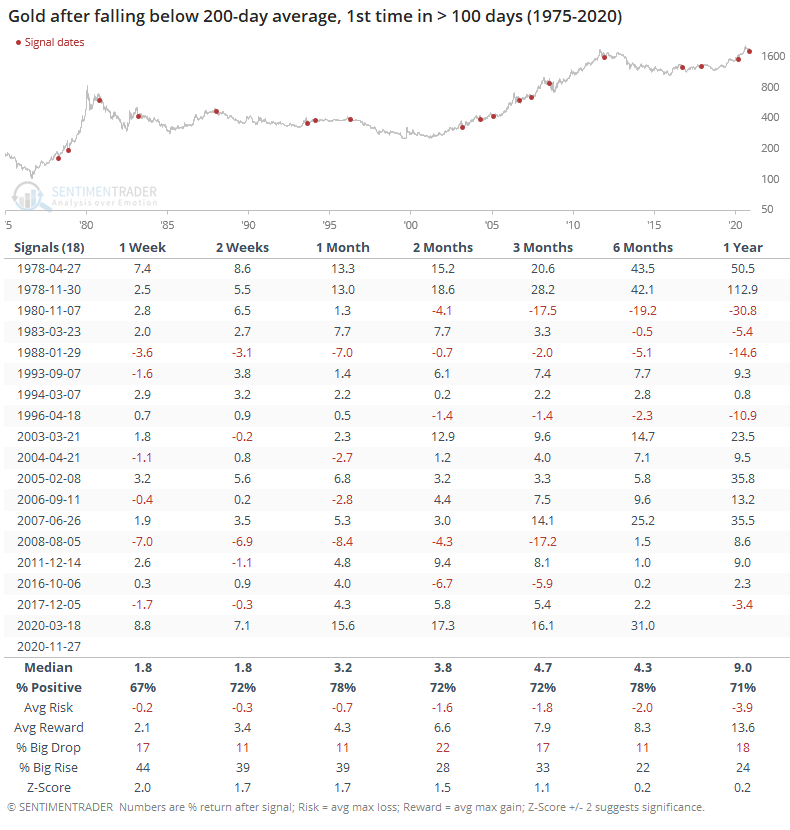
After gold ended other streaks of at least 100 days above its 200-day, it tended to resume its uptrend. Over the next month, gold rebounded 78% of the time, with a heavily positive risk/reward ratio. Returns across all time frames were consistently positive.
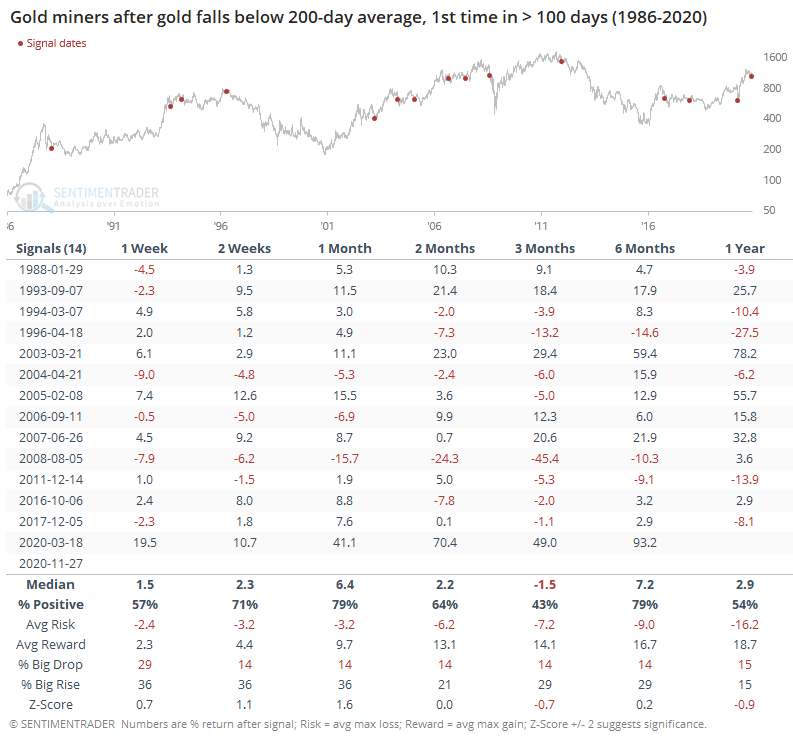
There is a positive correlation between the price of gold and the price action of gold miners. Because gold mostly rallied after these signals, miners also saw mostly positive returns, except for that odd 3-month window which was bookended by more consistently positive results. Over the next 6 months, miners gained ground after 11 out of 14 signals, though those 3 losses were large.
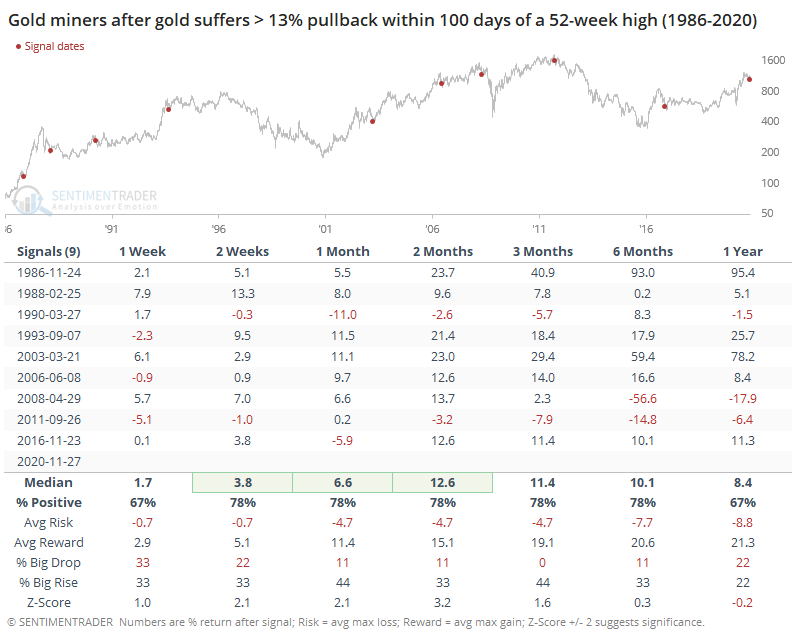
Gold has also pulled back more than 13% from a 52-week high, within 100 days of setting that high. This is its deepest pullback in this kind of a time frame since 2016.
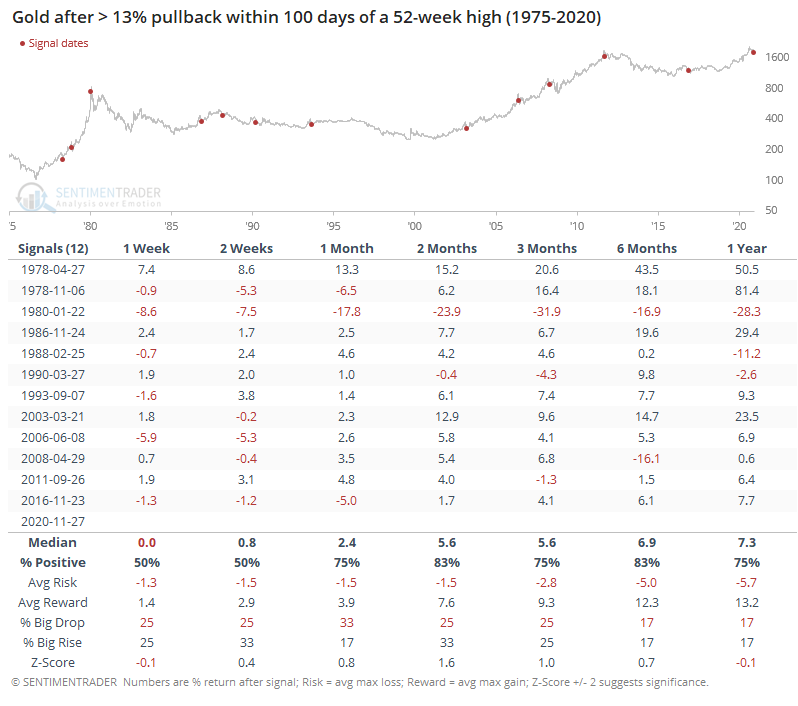
Again, gold performed well going forward. Over the next 2 months, gold gained after 10 out of 12 signals, with the only real failure being that big loss in 1980 when the loss of momentum morphed into a true bear market.
After these signals, miners performed better. Their average return over the next 2-8 weeks was at least 2 standard deviations beyond random, with a heavily skewed risk/reward ratio. Within the next 3 months, miners showed a 44% chance of enjoying a big rise, while none of the signals showed a big drop.
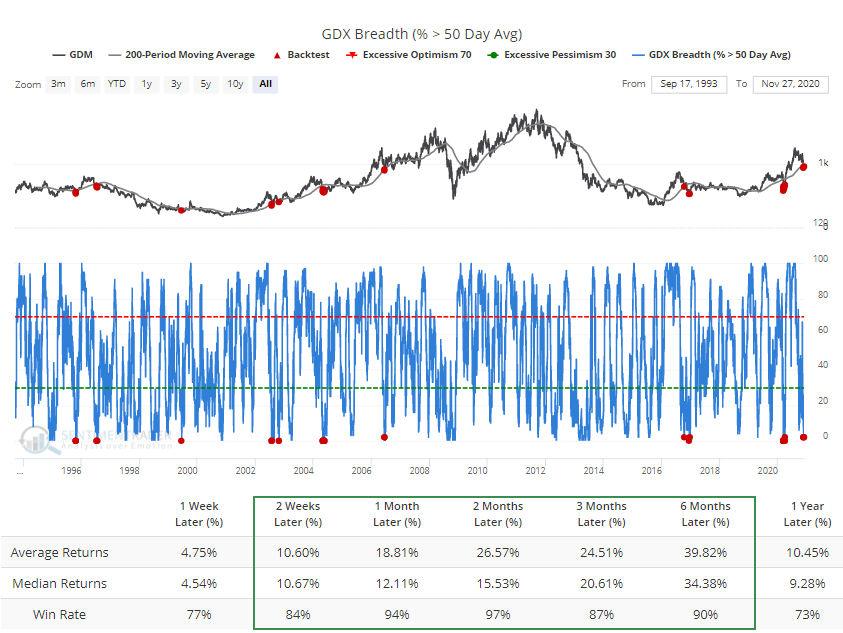
In the premium minutes yesterday, we looked at what has happened when gold mining stocks dipped within a general uptrend and fewer than 3% of miners managed to hold above their 50-day averages. The Backtest Engine shows that miners rebounded 97% of the time over the next 2 months.
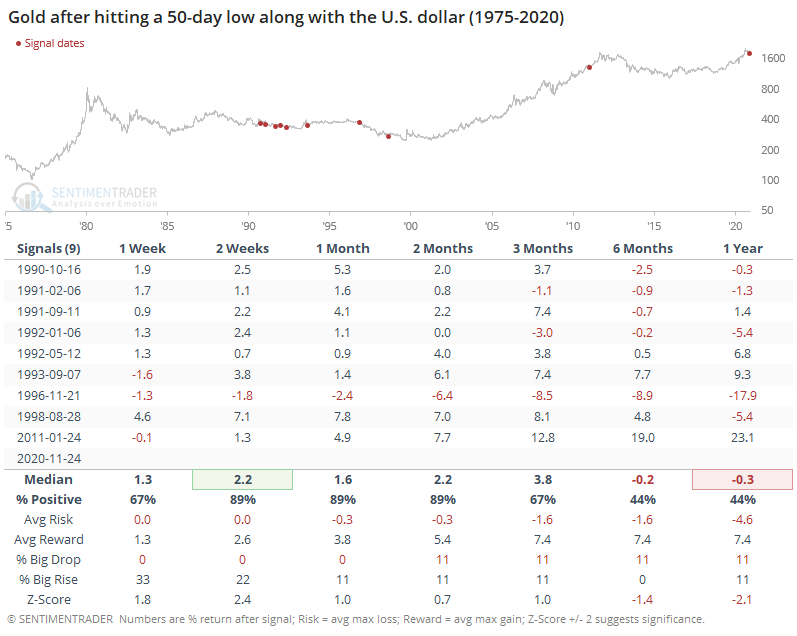
Gold has been falling even though the dollar has as well. Gold is supposed to rally when the dollar falls, suggesting that "something" is pushing gold lower that shouldn't be. When they've fallen together before, though, it wasn't necessarily a bad omen. While gold's 6-12 month returns were poor, it showed a positive return during the next 1-3 months after 8 out of the 9 precedents.
Whenever a trendy market like metals or currencies shows nascent signs of a shift in momentum, it can get scary for those positioned in the direction of the prevailing trend. When the shifts happen, they can be absolutely relentless. So far, we're not seeing too many compelling signs that this has triggered for gold. After witnessing the kind of momentum it has enjoyed since March, the first real pullback has mostly served as a temporary reset and not a change in trend. That has typically been especially beneficial to some of the stocks most closely tied to this market.
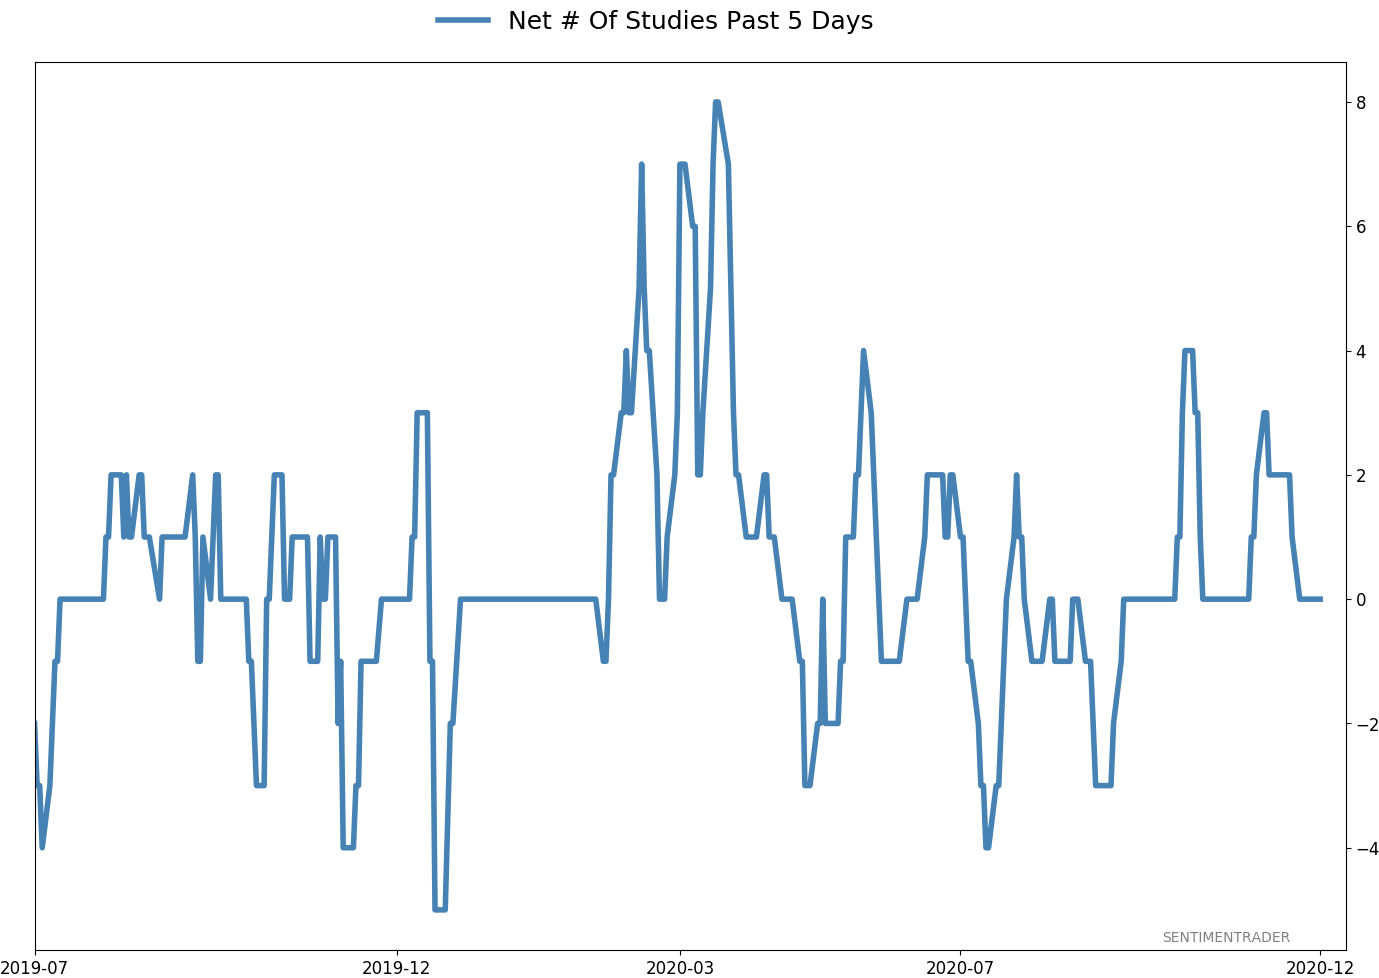
Active Studies
| Time Frame | Bullish | Bearish | | Short-Term | 0 | 0 | | Medium-Term | 5 | 8 | | Long-Term | 51 | 2 |
|
Indicators at Extremes
Portfolio
| Position | Description | Weight % | Added / Reduced | Date | | Stocks | 15.6% RSP, 10.1% VWO, 7.5% XLE, 5.1% PSCE | 41.2 | Added 5% | 2020-10-15 | | Bonds | 10% BND, 10% SCHP, 10% ANGL | 28.6 | Reduced 0.1% | 2020-10-02 | | Commodities | GCC | 2.4 | Reduced 2.1%
| 2020-09-04 | | Precious Metals | GDX | 9.5 | Added 4.8% | 2020-12-01 | | Special Situations | | 0.0 | Reduced 5% | 2020-10-02 | | Cash | | 18.3 | | |
|
Updates (Changes made today are underlined)
I've been quiet here because there hasn't been much to do. The things that were supposed to work have pretty much been doing so. With sentiment extremely stretched, I have no desire to add exposure there. About the only place I would add is energy, which has been following through exactly as it should. I did add back to my position in gold miners, due to the studies recently posted to the site. When gold (and miners) have pulled back after momentum like they enjoyed since March, the typical reaction is a resumption of the uptrend over the medium-term, and not a rollover into a bear phase. The continued weakness in the dollar certainly helps. RETURN YTD: 5.4% 2019: 12.6%, 2018: 0.6%, 2017: 3.8%, 2016: 17.1%, 2015: 9.2%, 2014: 14.5%, 2013: 2.2%, 2012: 10.8%, 2011: 16.5%, 2010: 15.3%, 2009: 23.9%, 2008: 16.2%, 2007: 7.8%
|
|
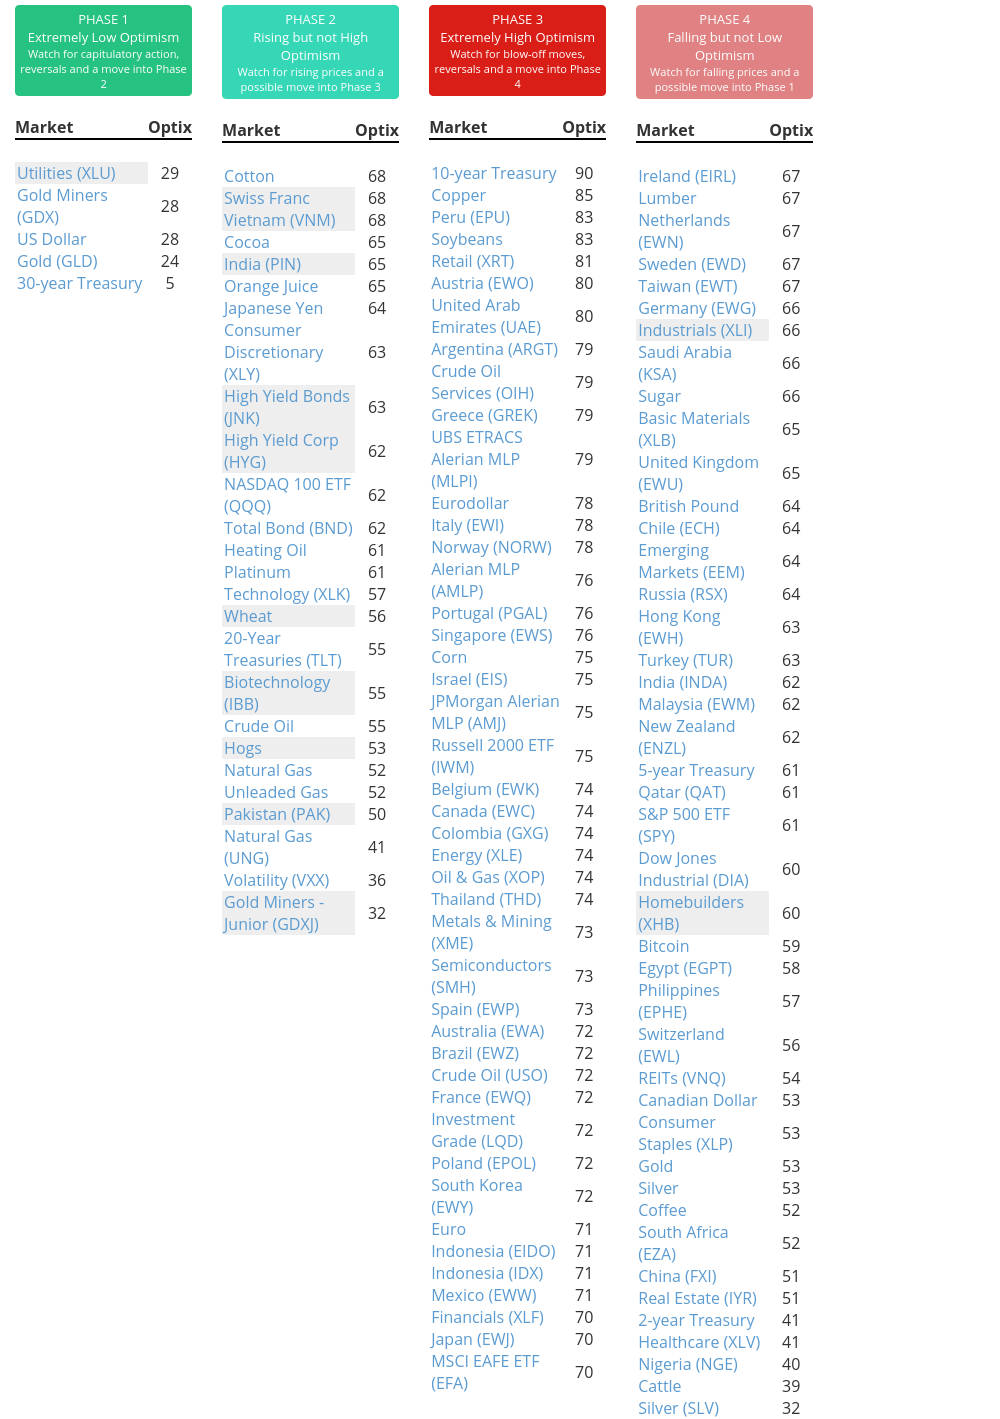
Phase Table
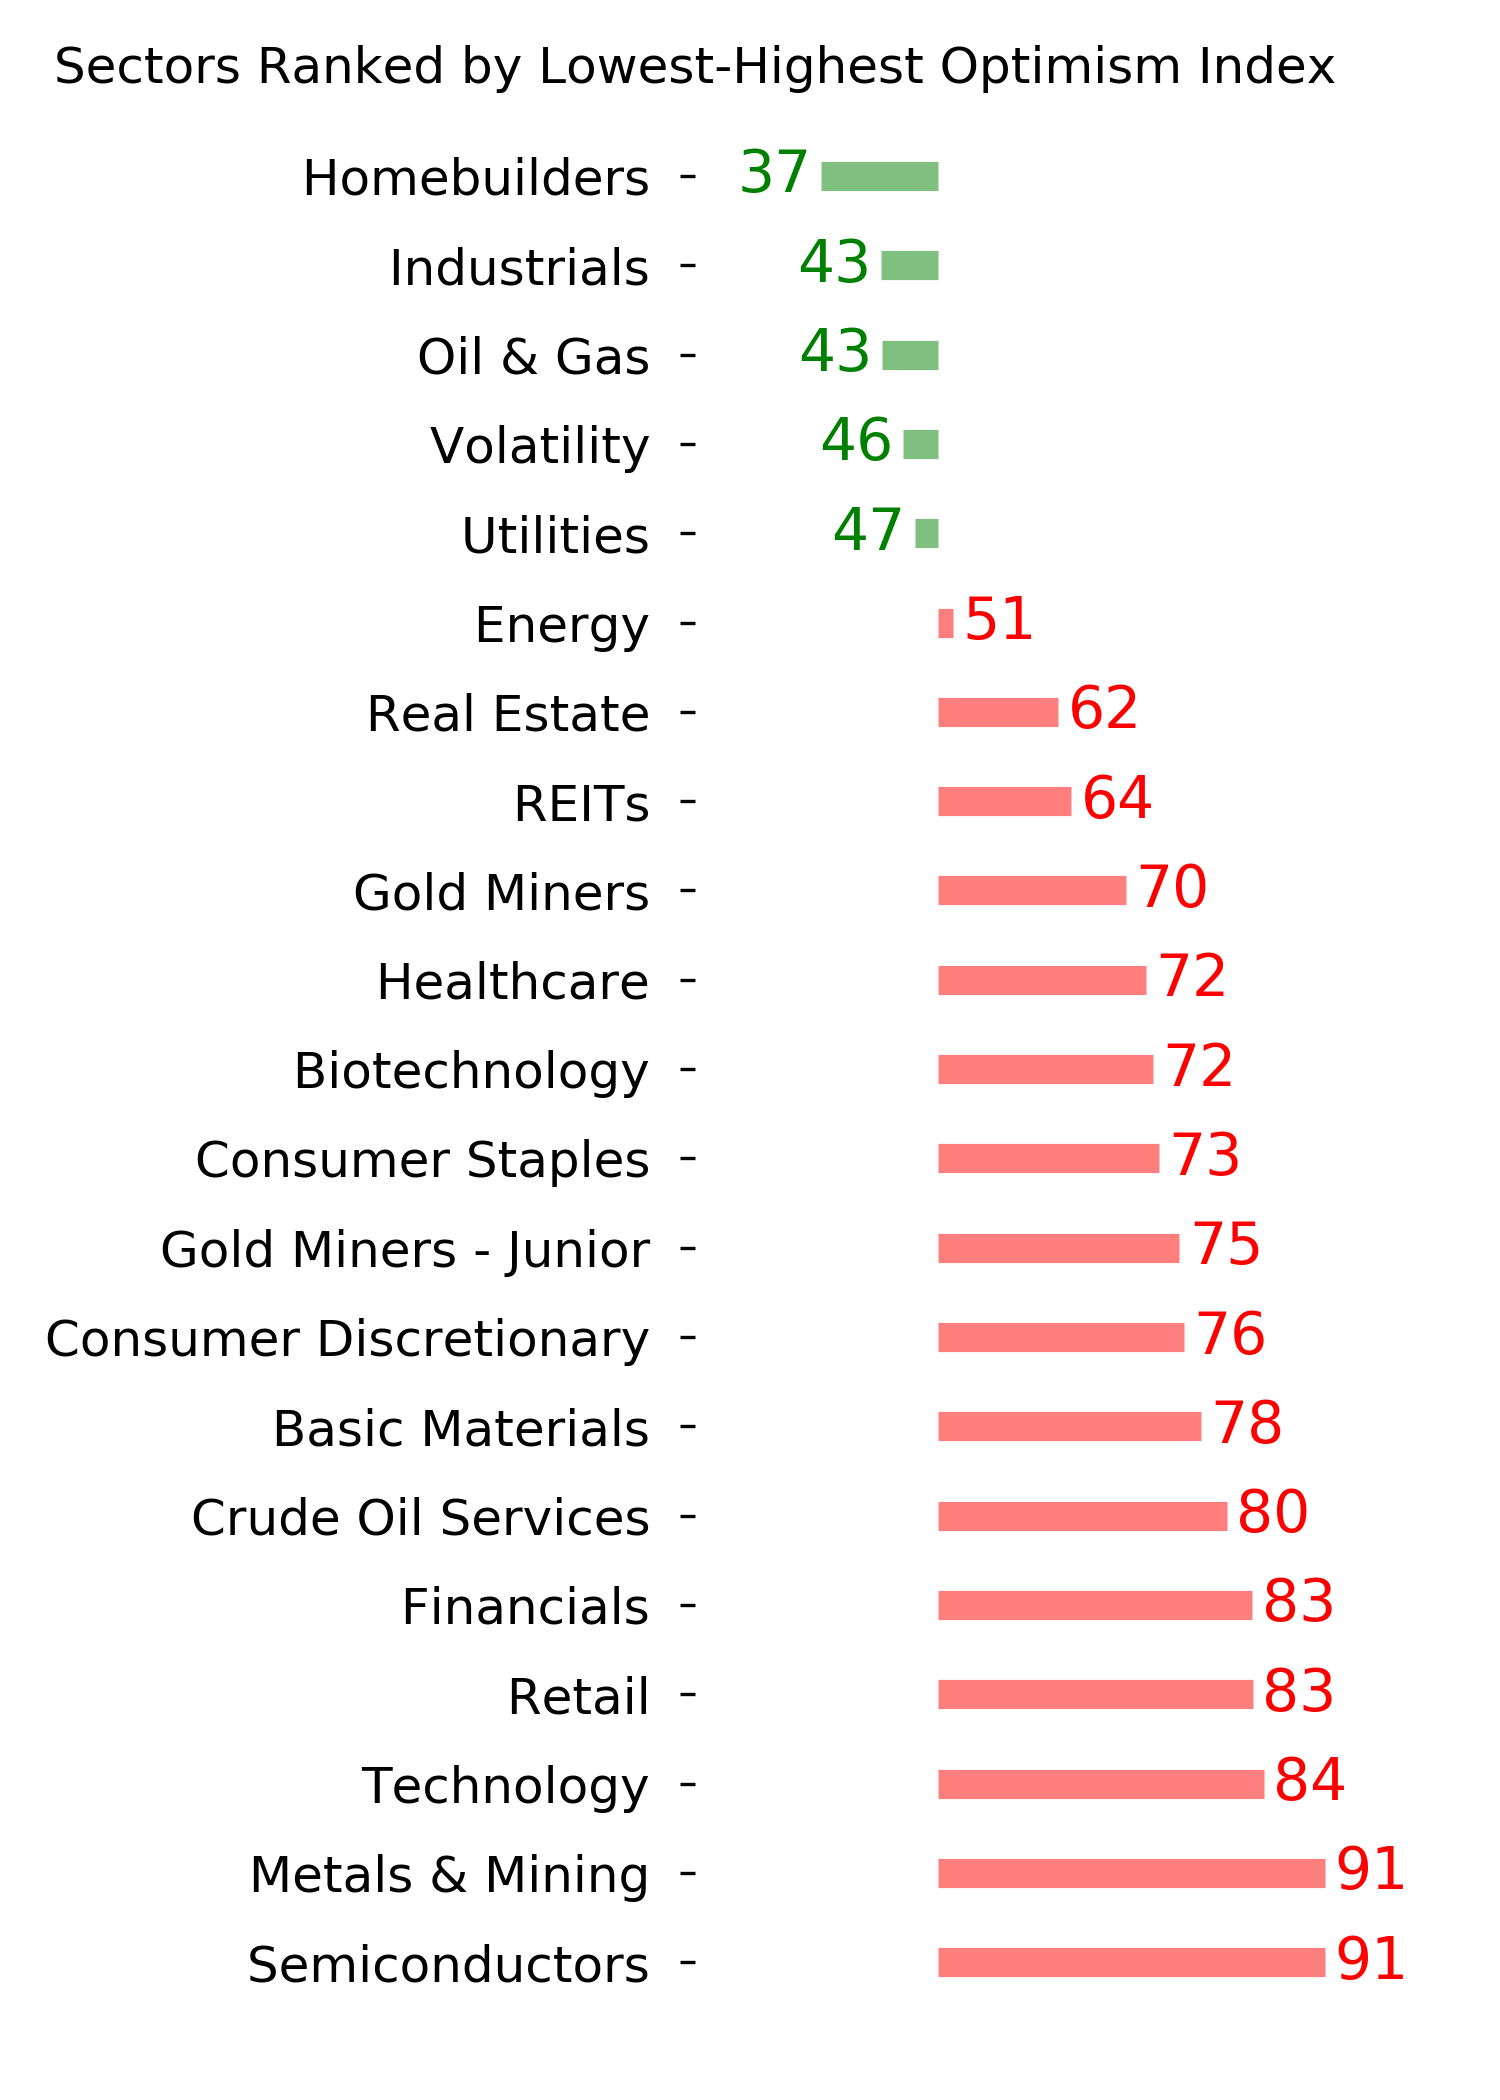
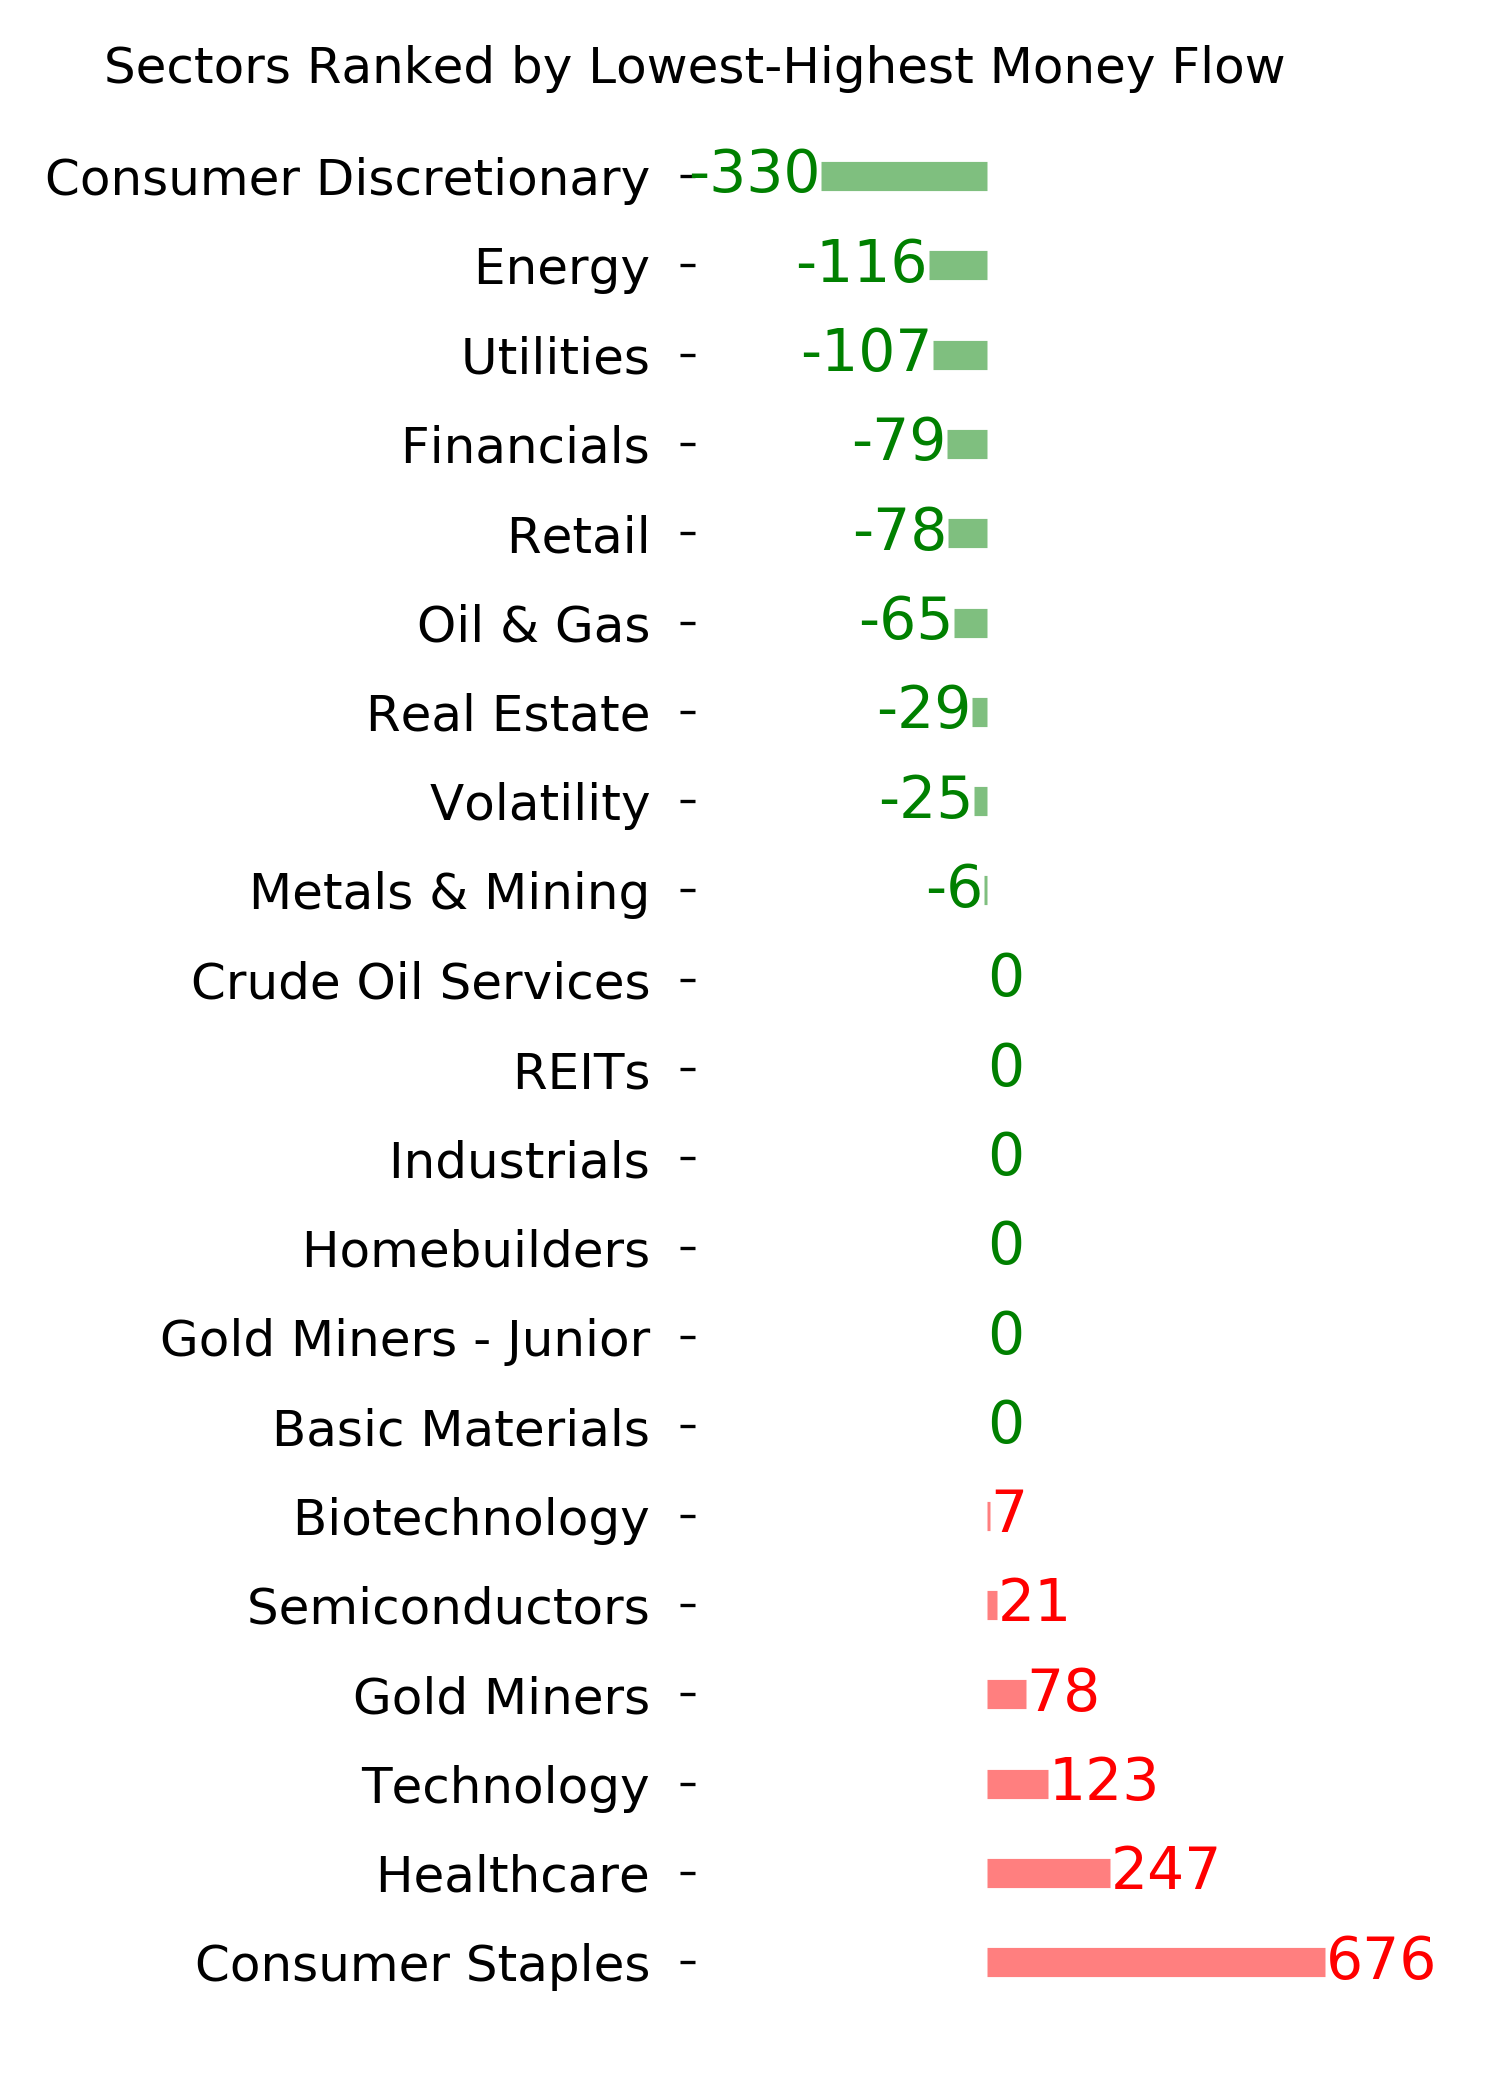
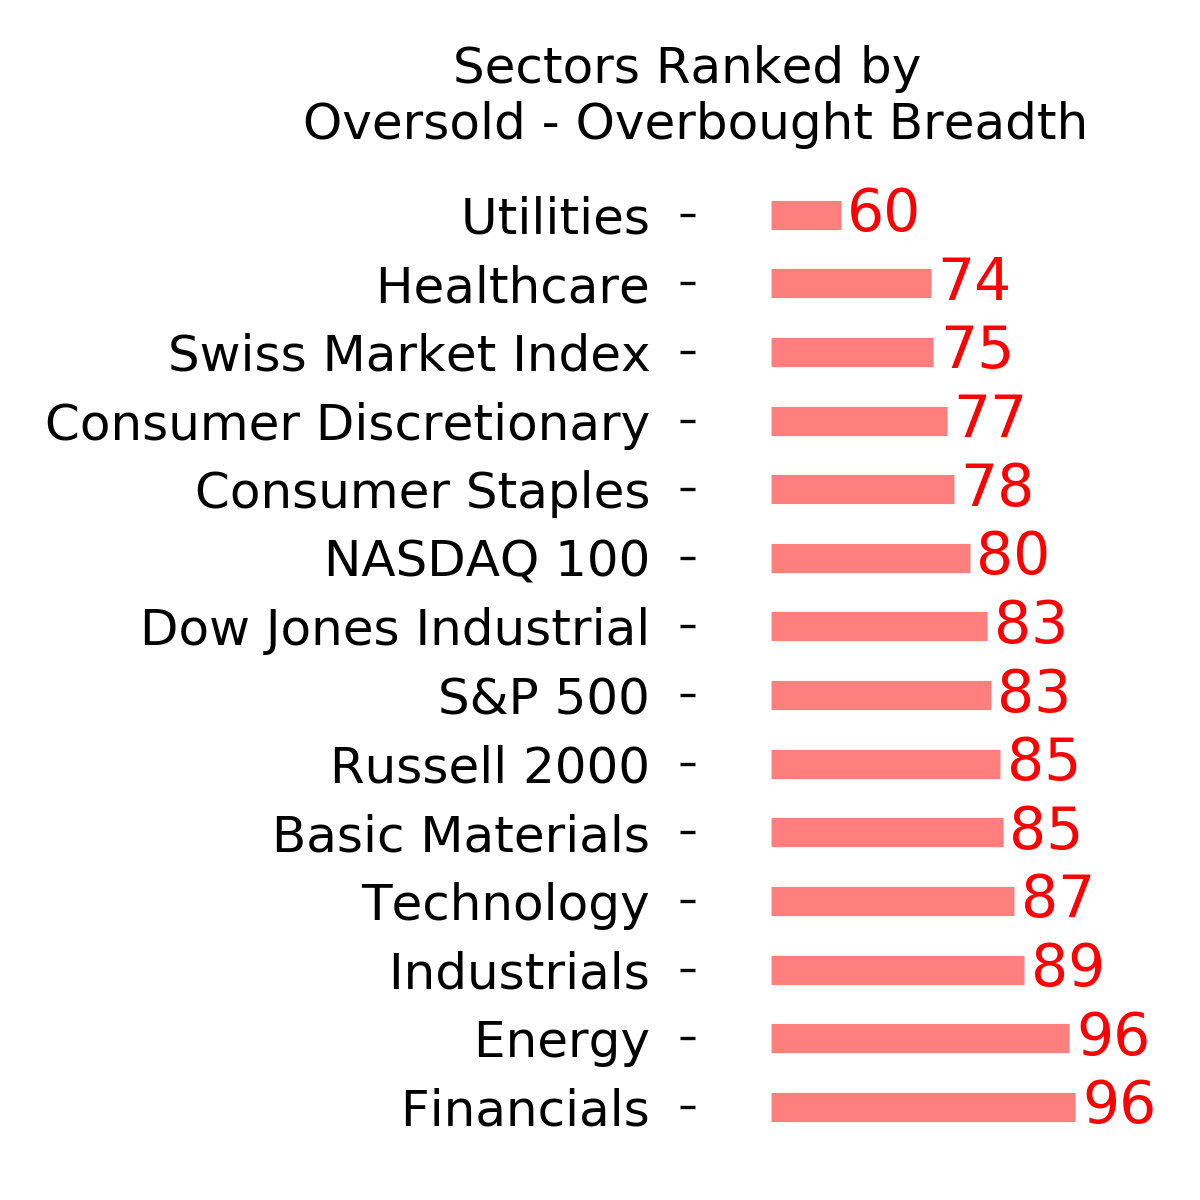
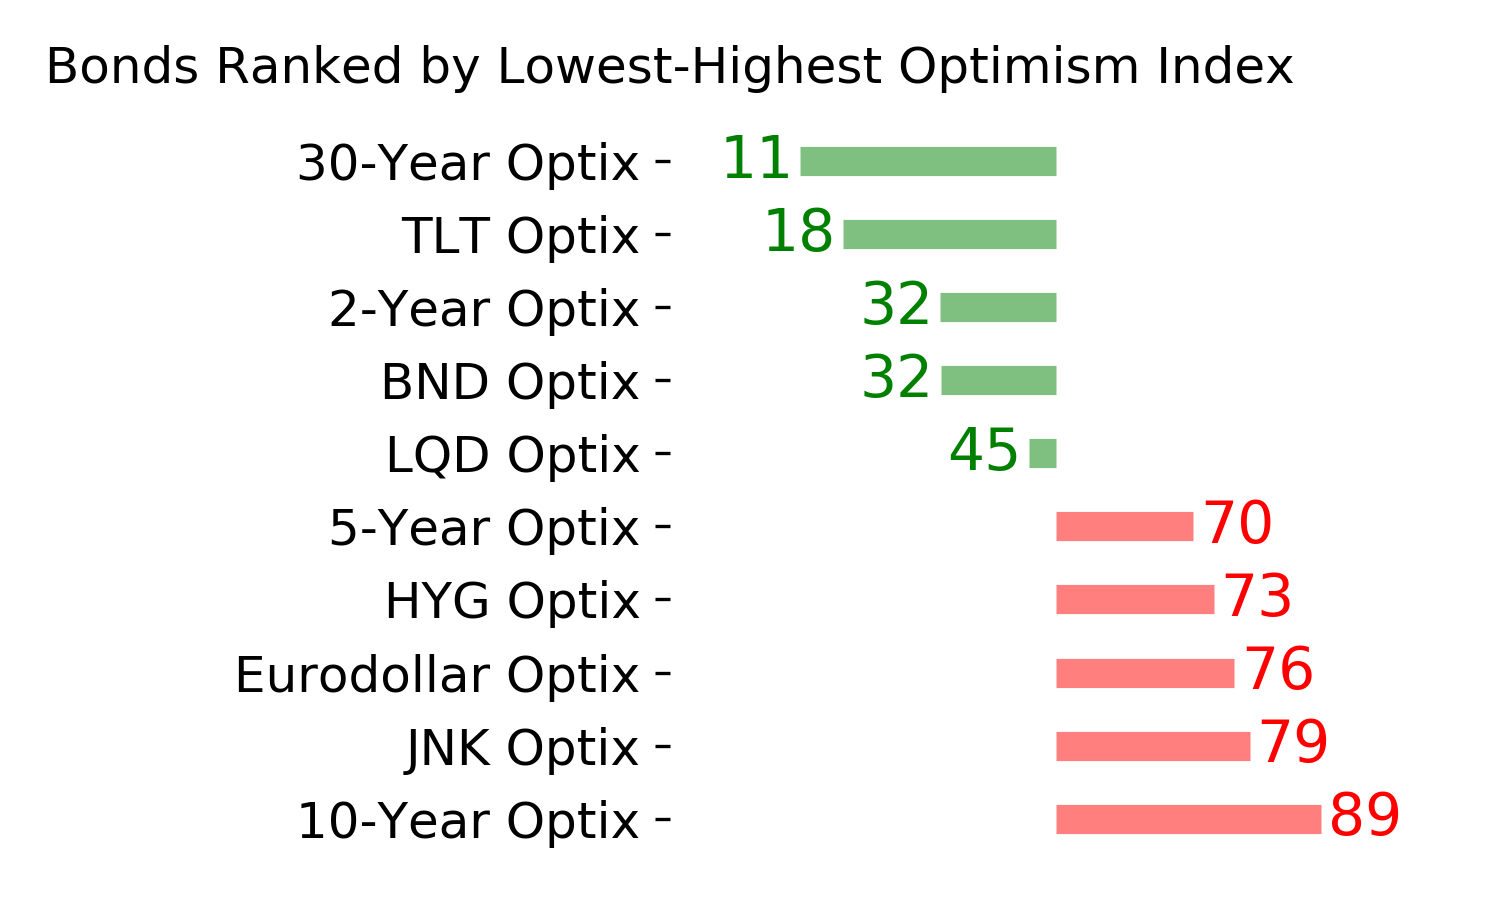
Ranks
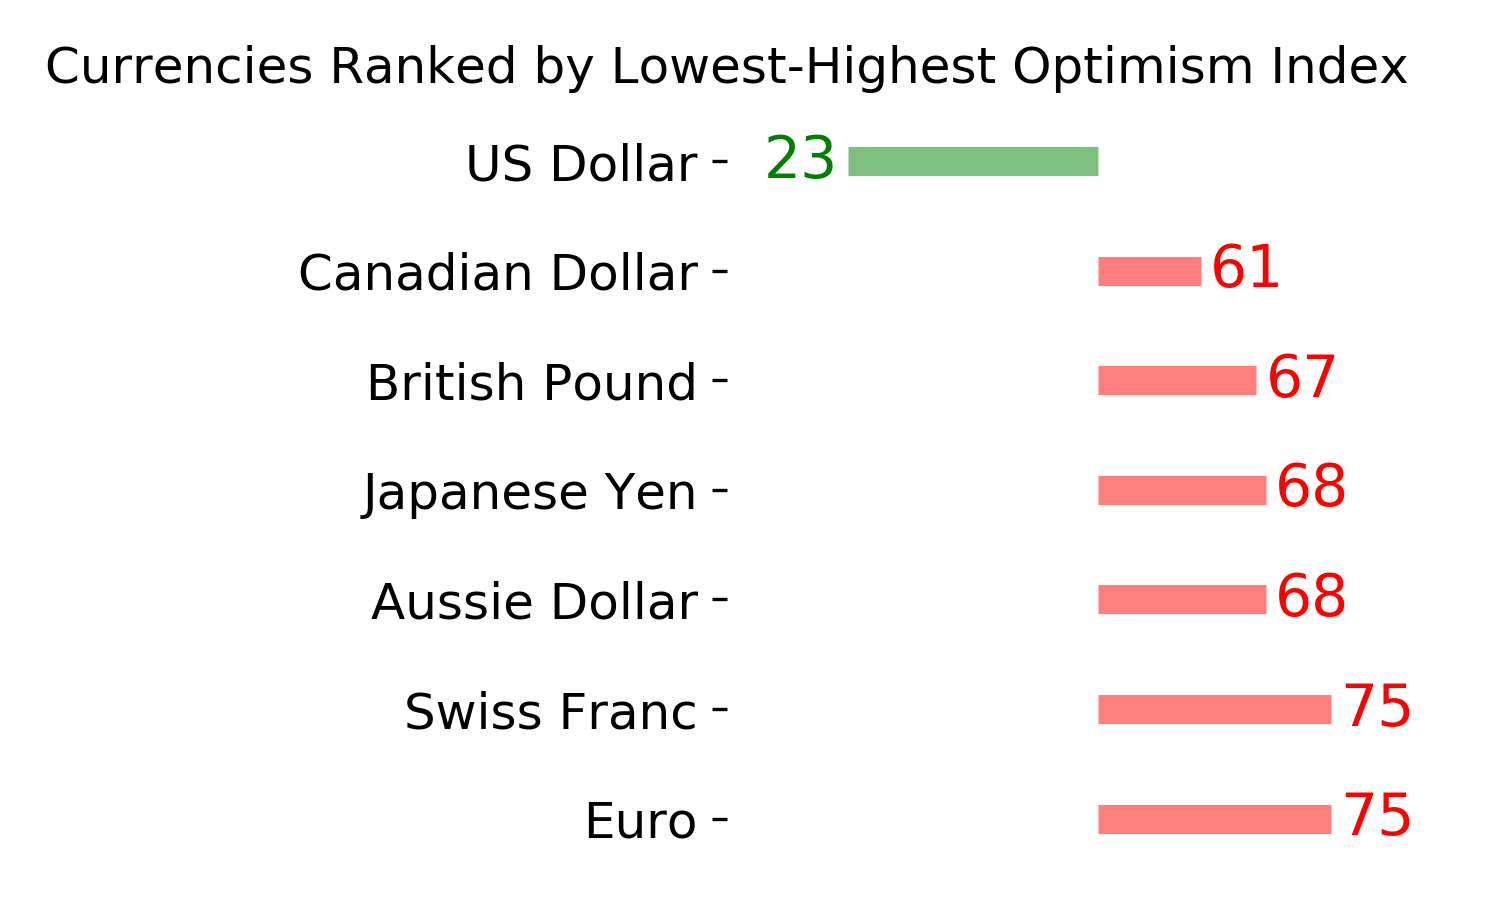
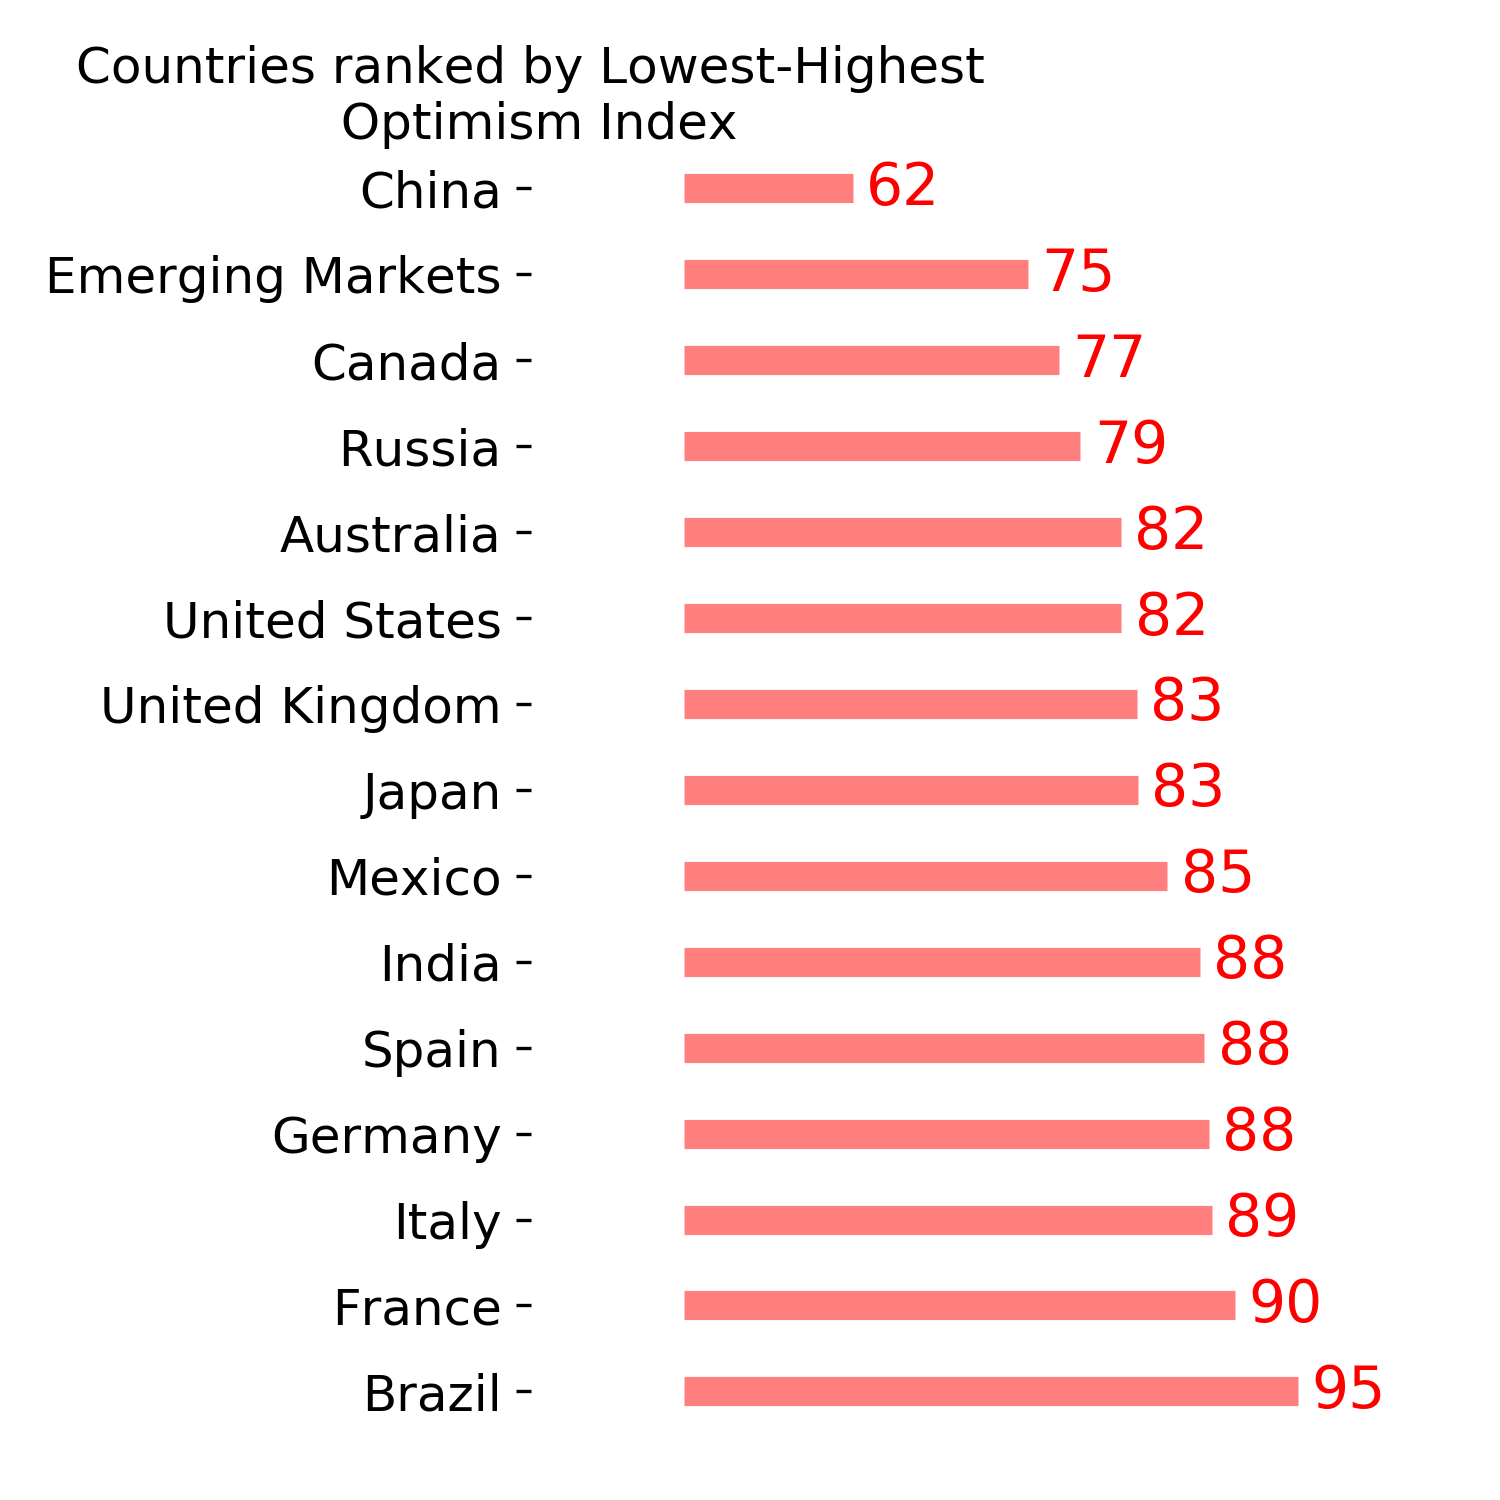
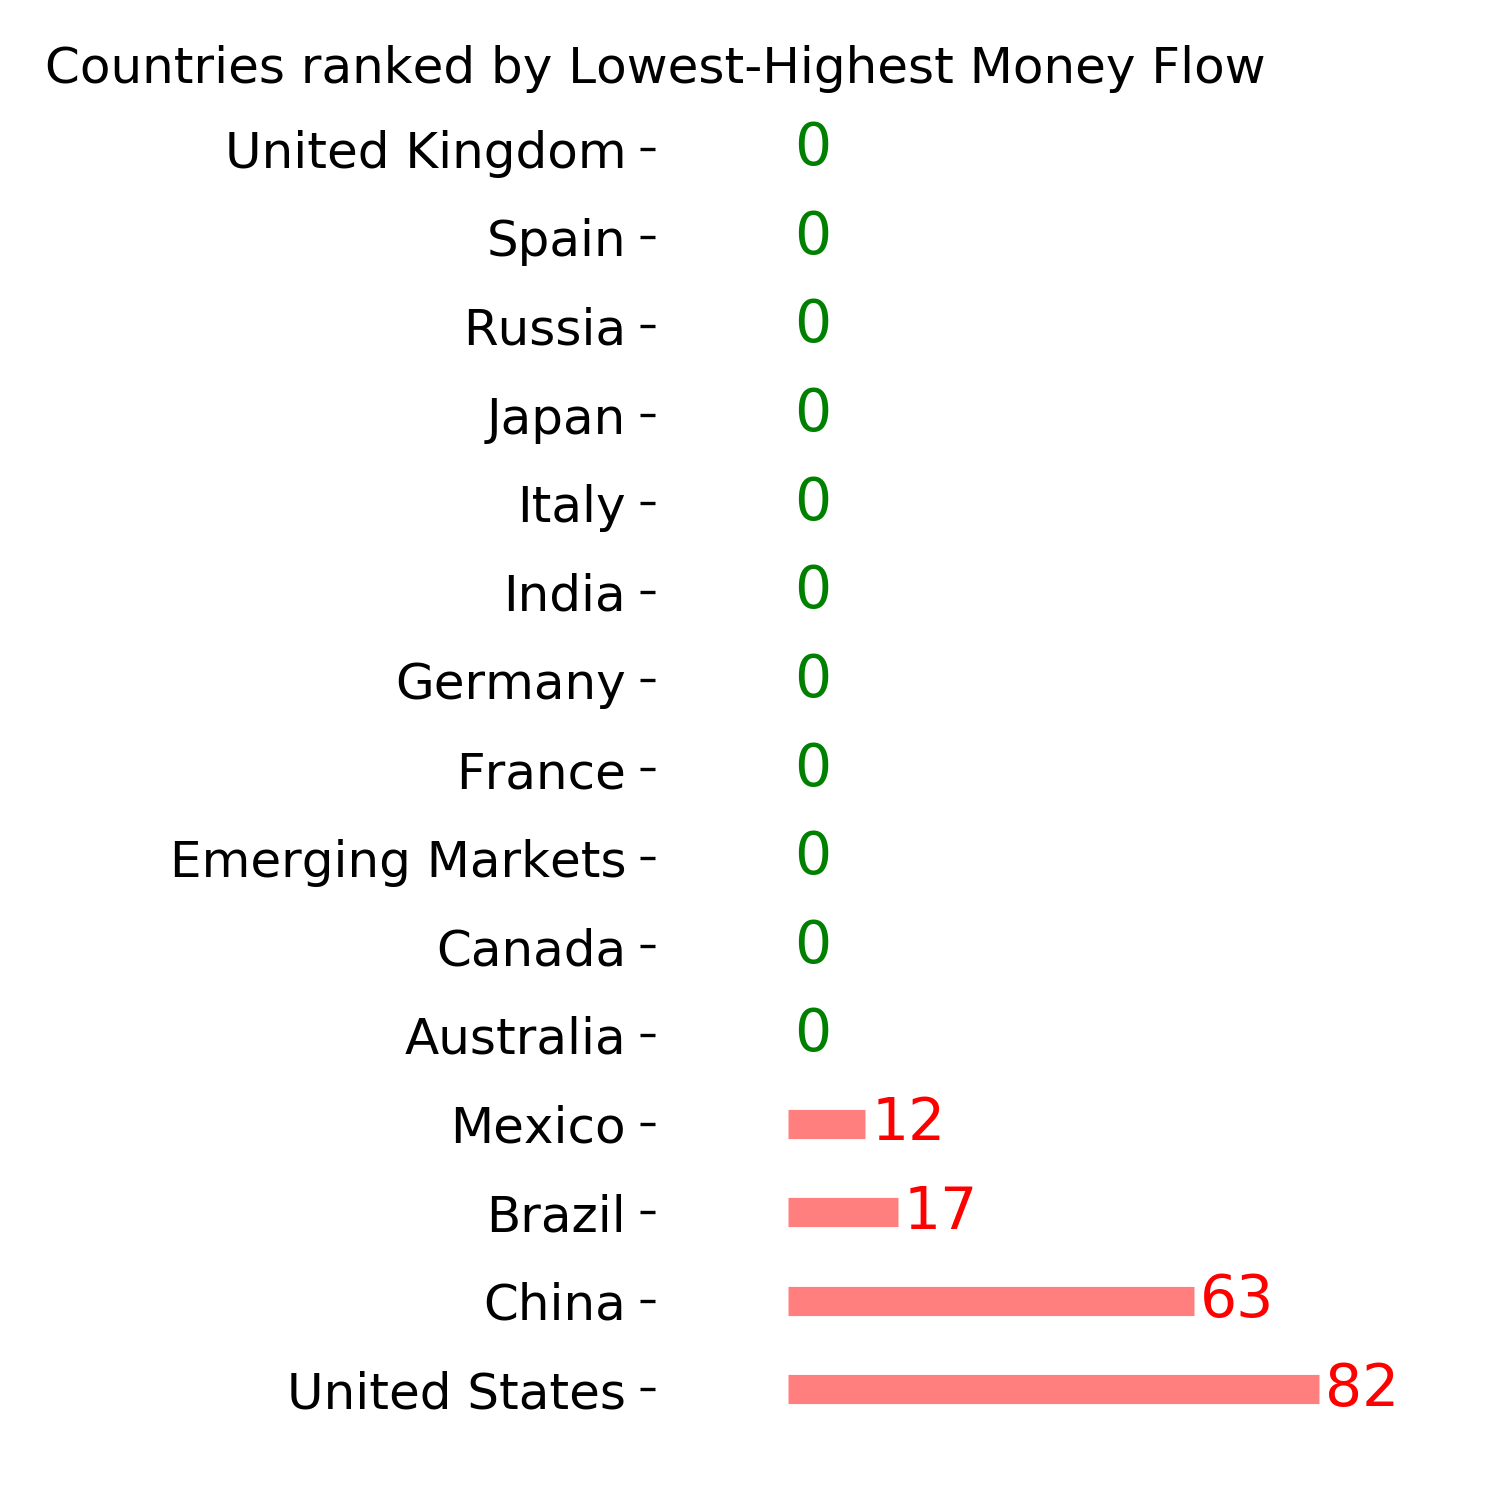
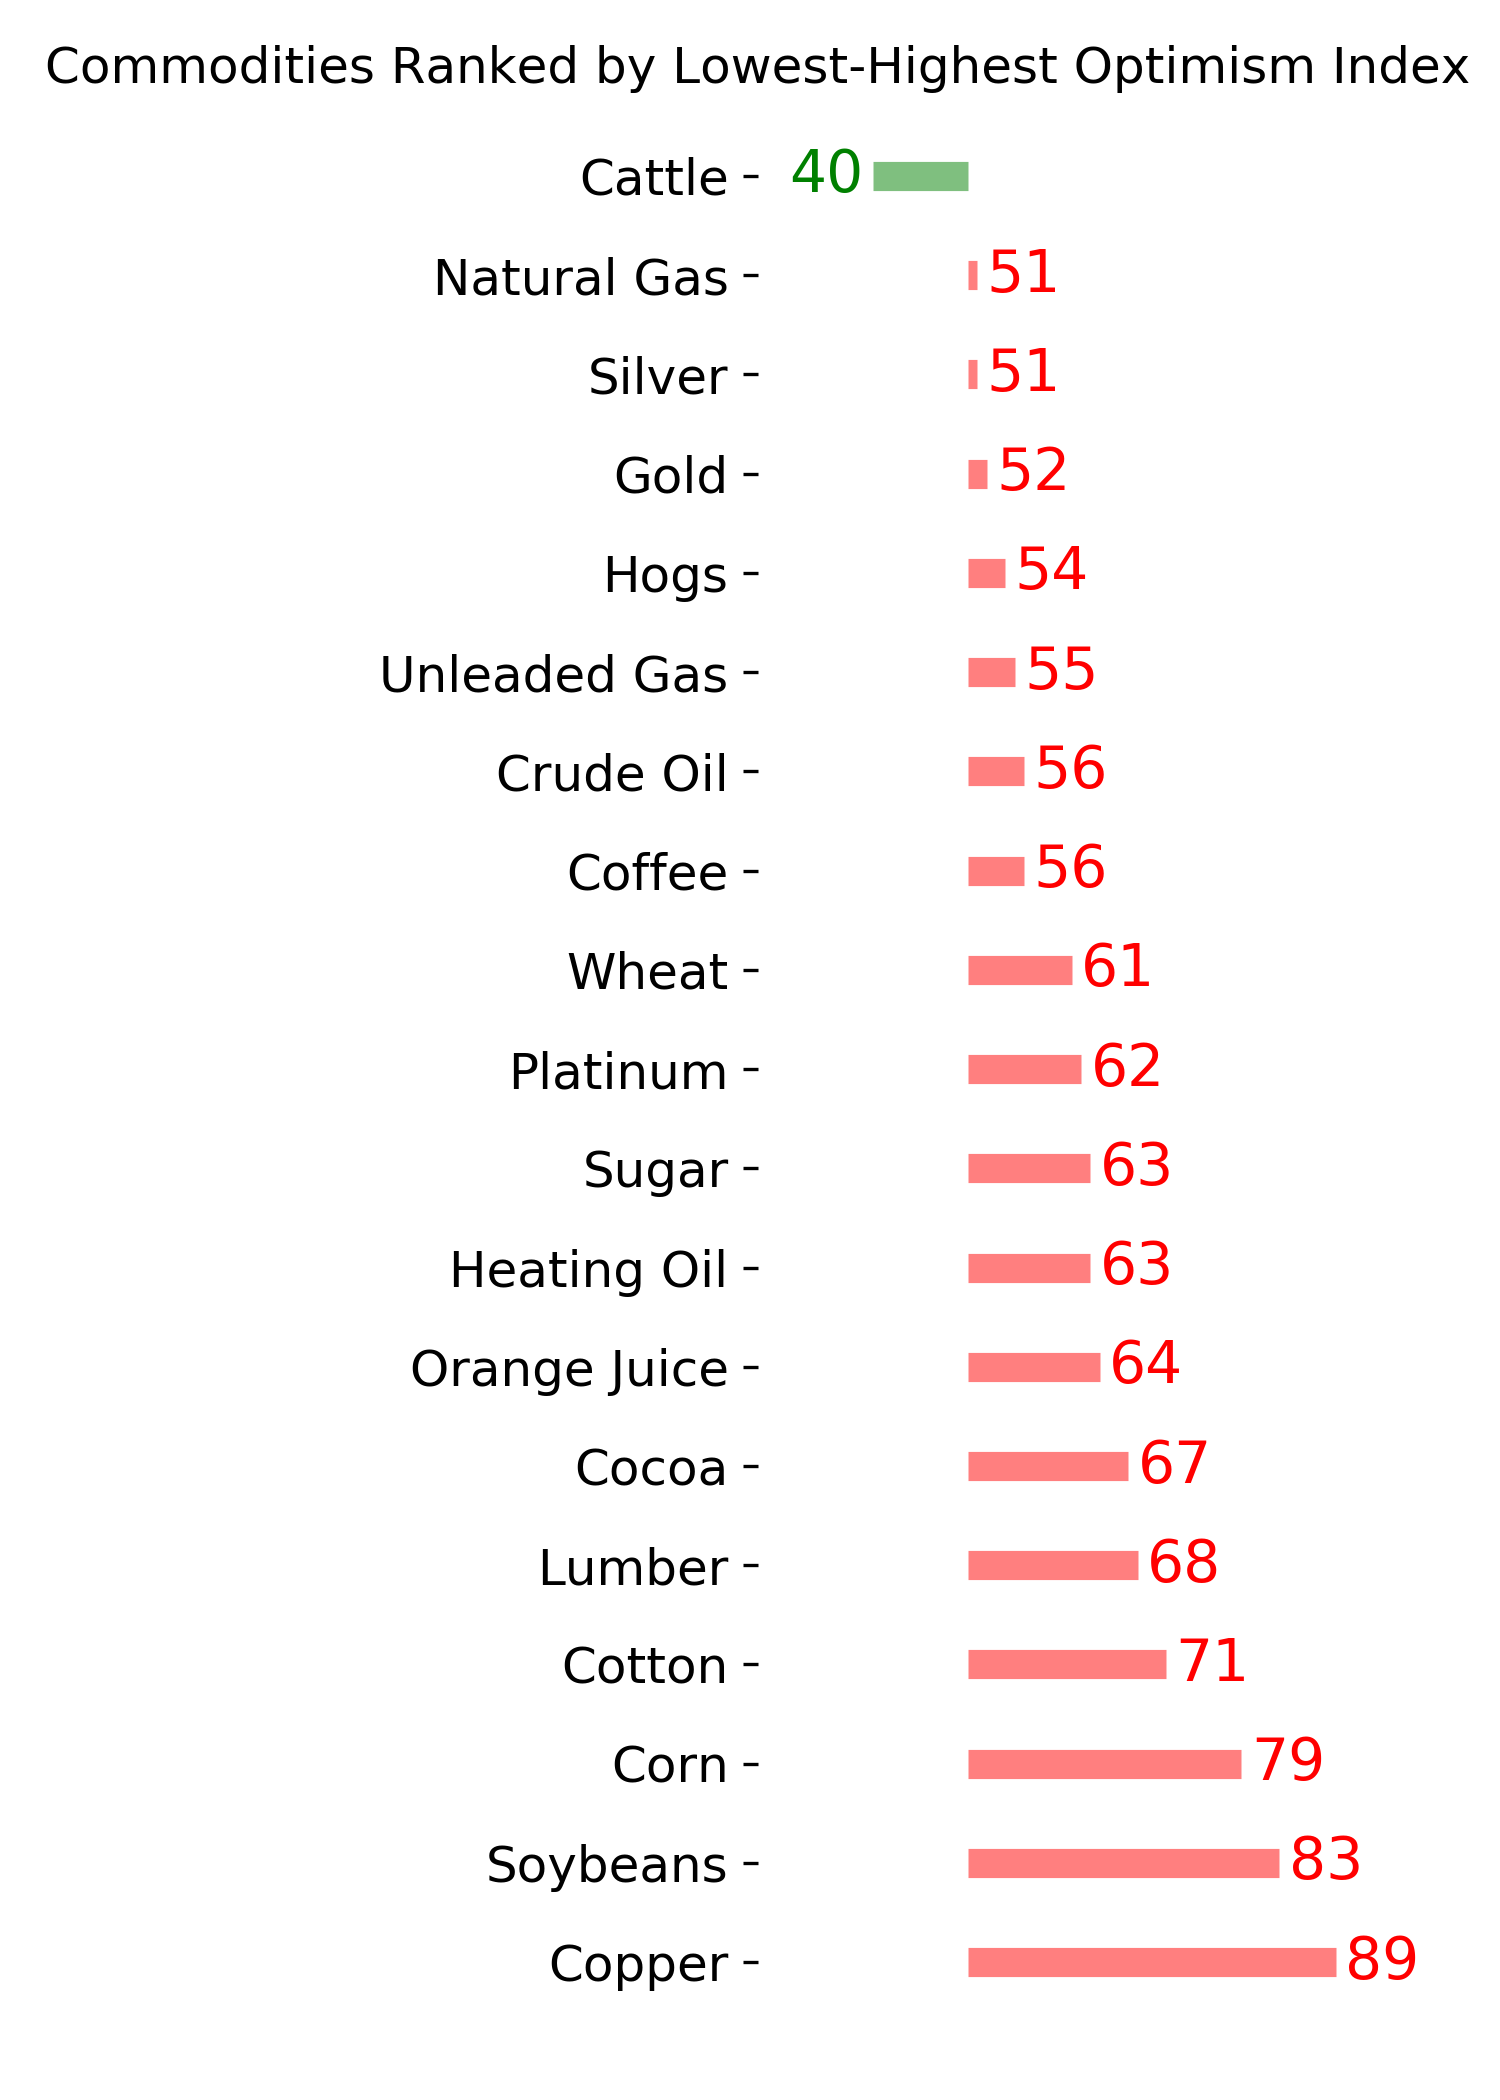
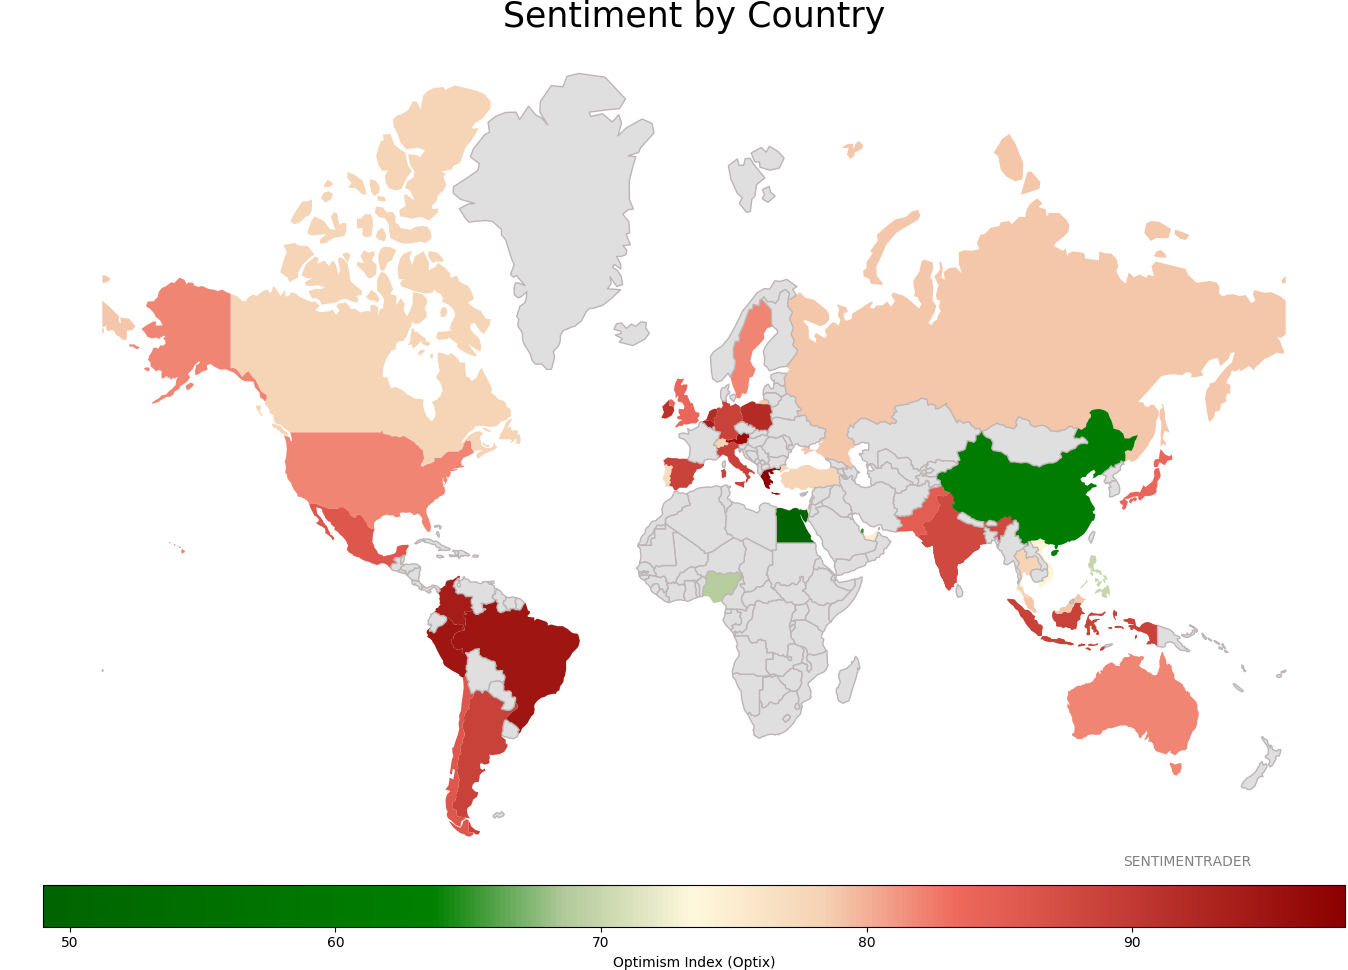
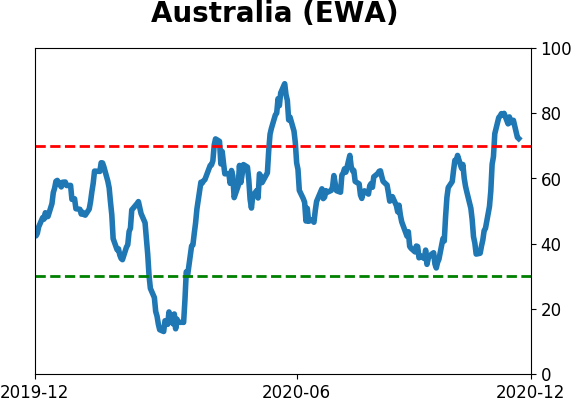
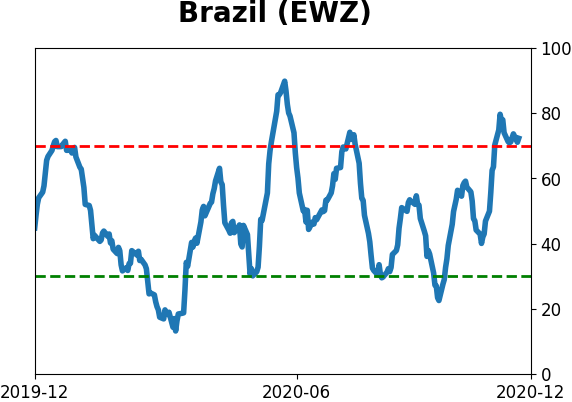
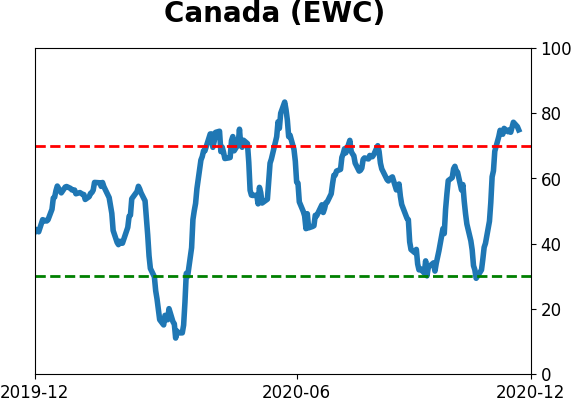
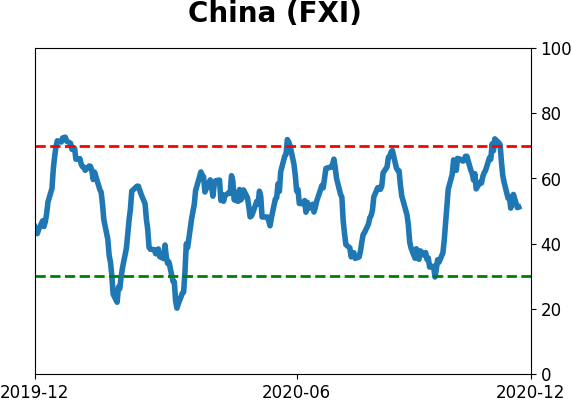
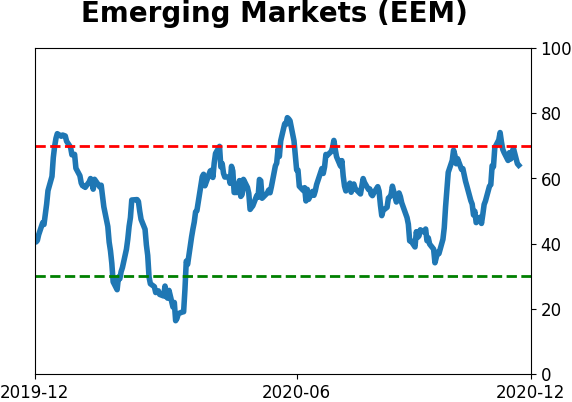
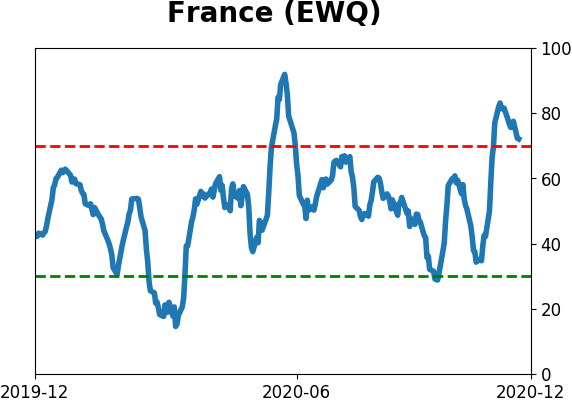
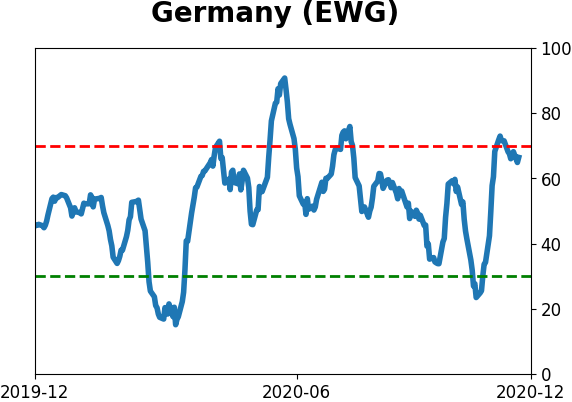
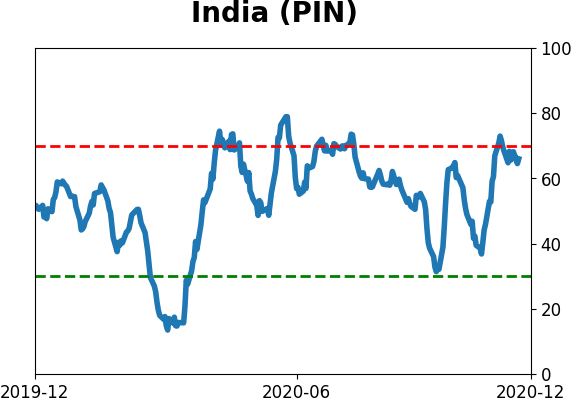
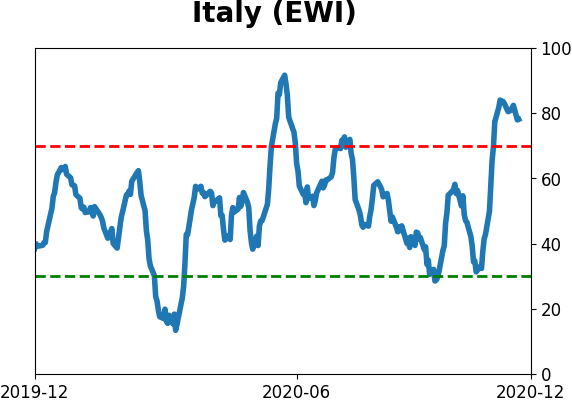
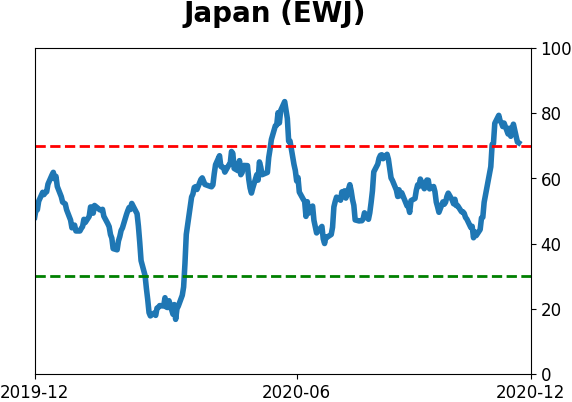
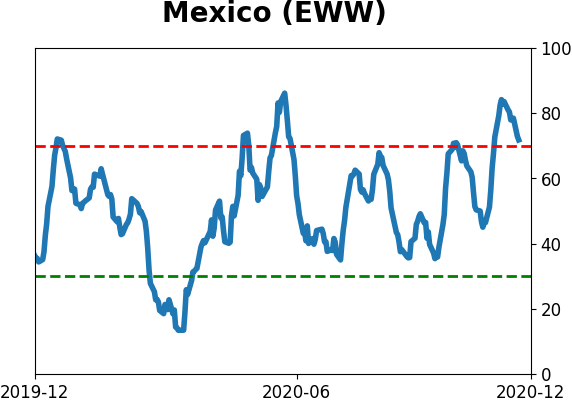
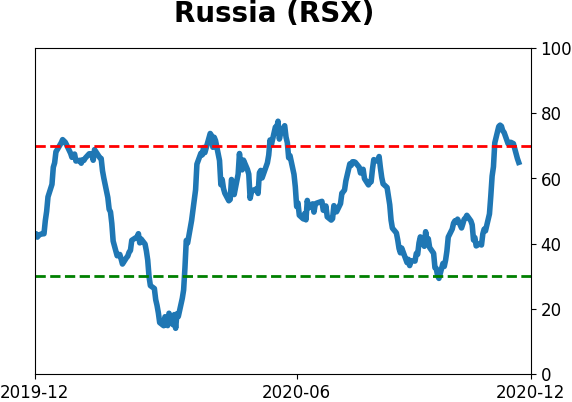
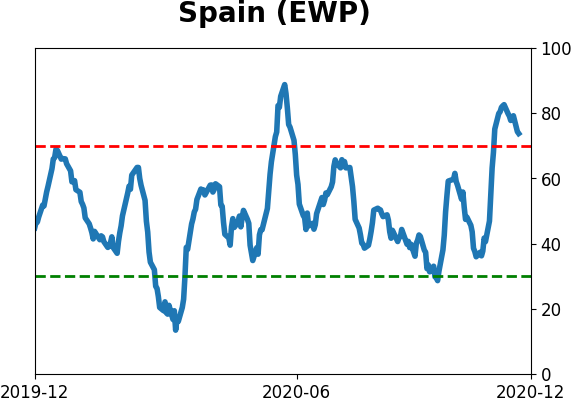
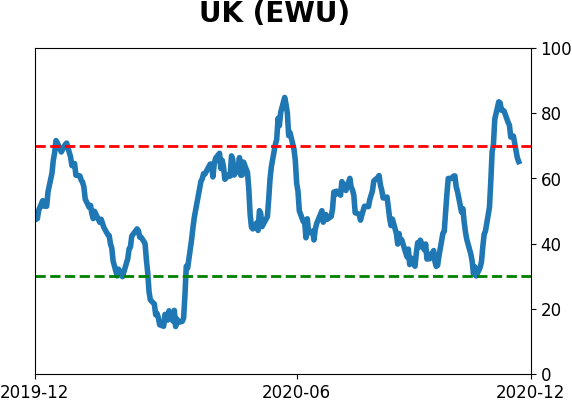
Sentiment Around The World
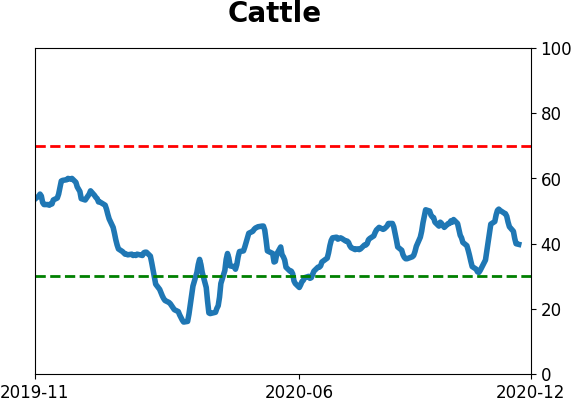
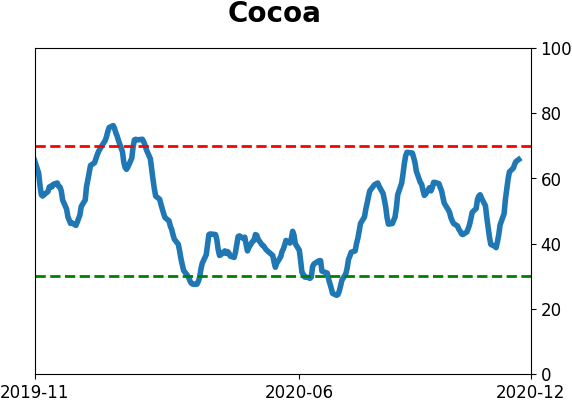
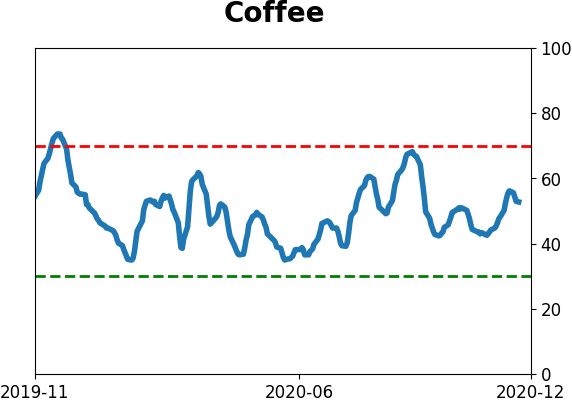
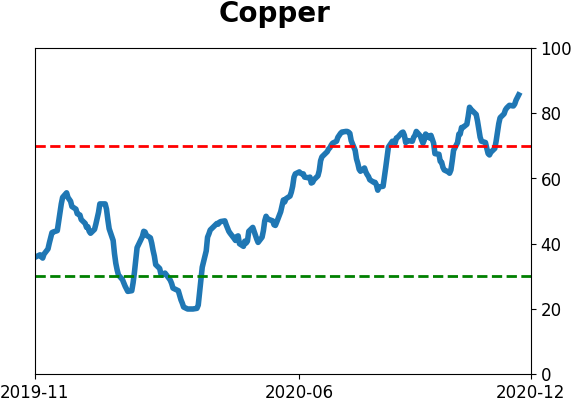
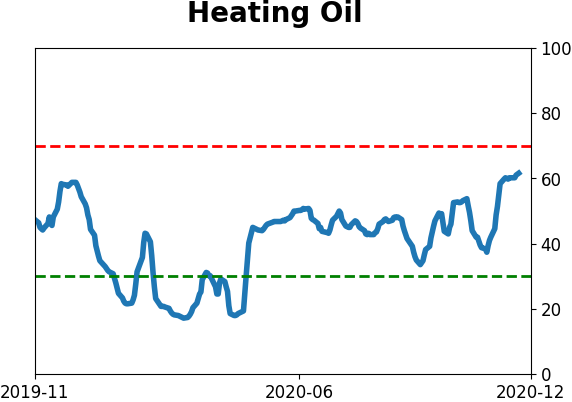
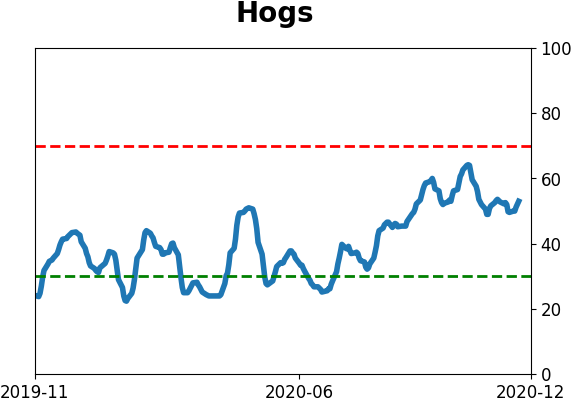
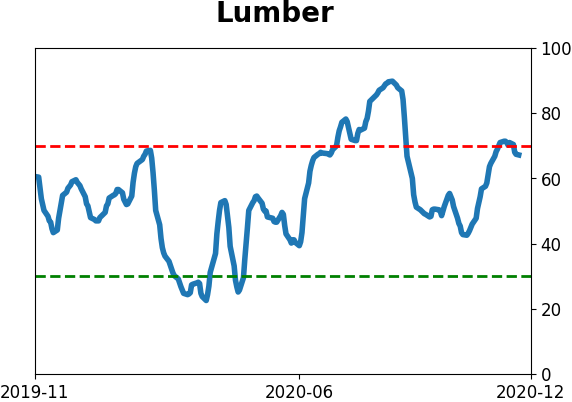
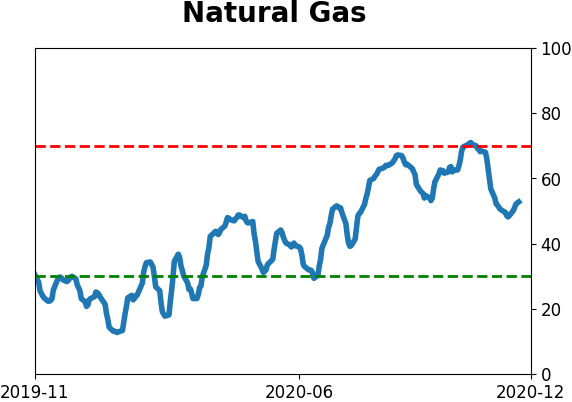
Optimism Index Thumbnails
|
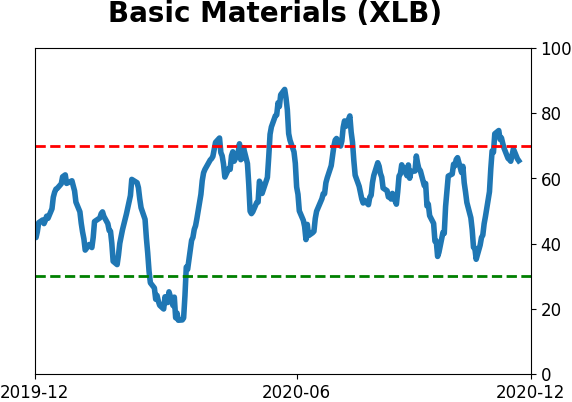
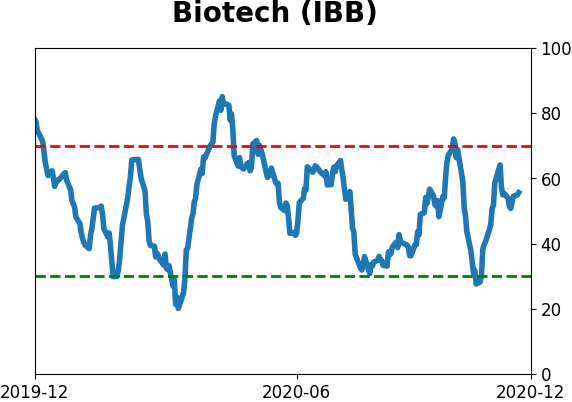
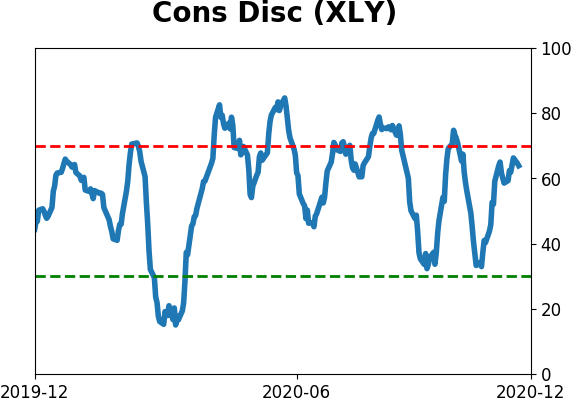
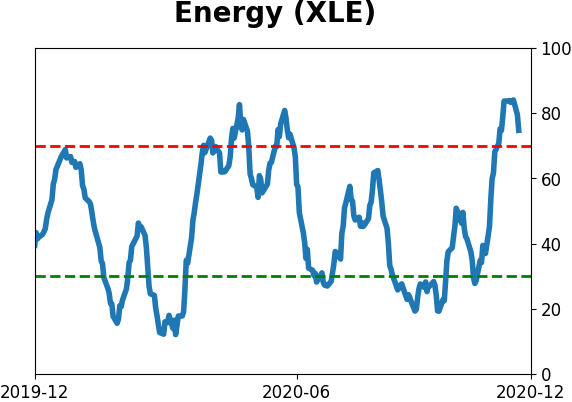
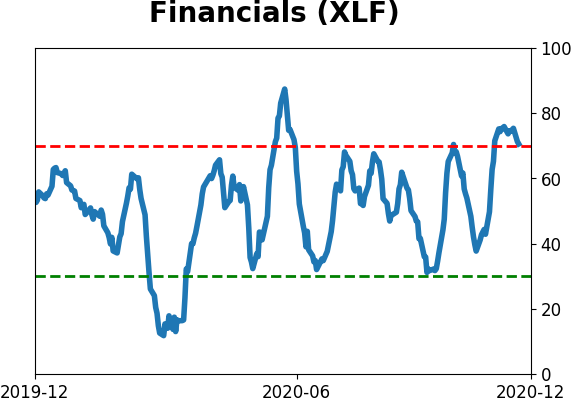
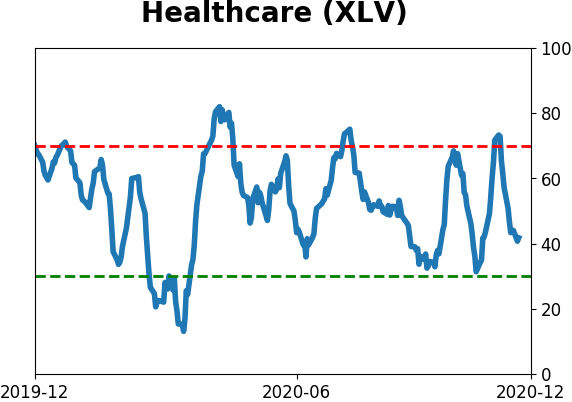
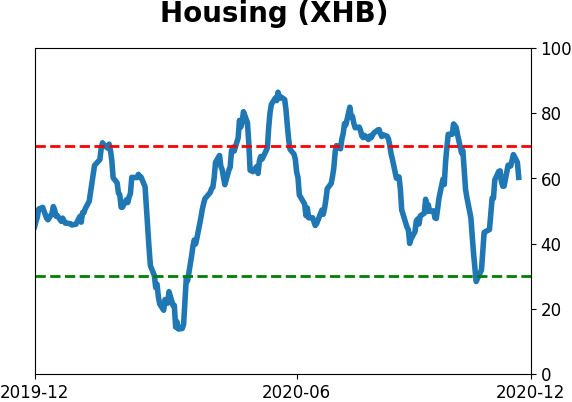
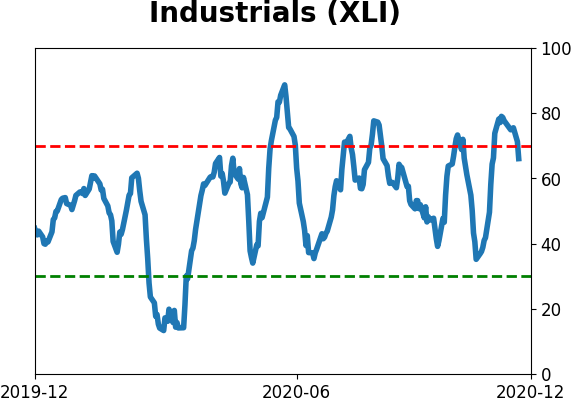
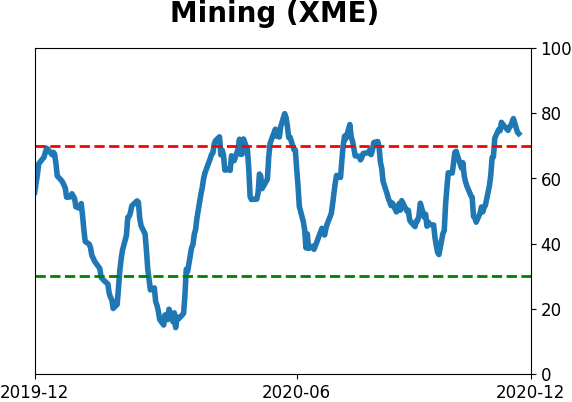
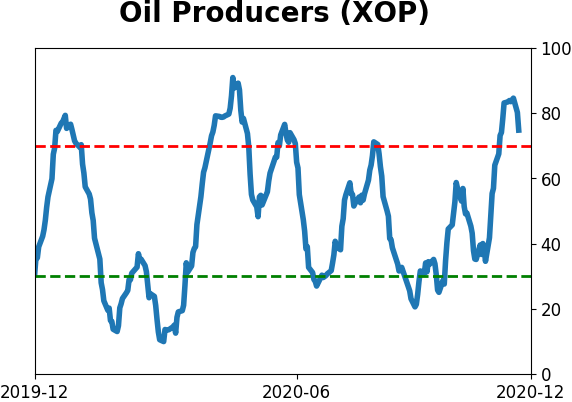
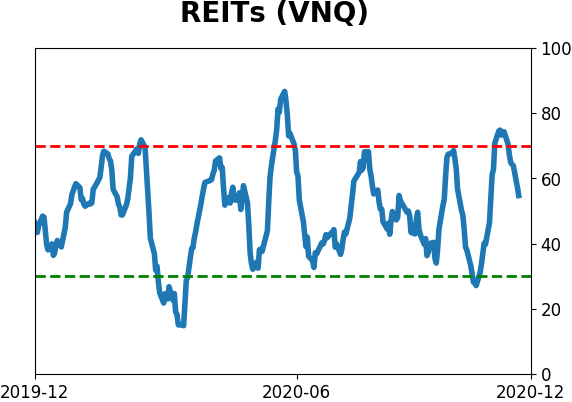
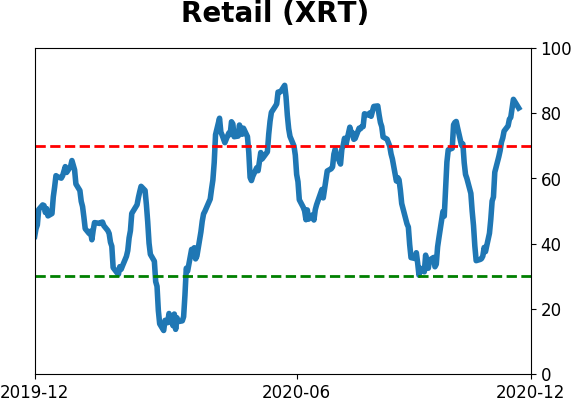
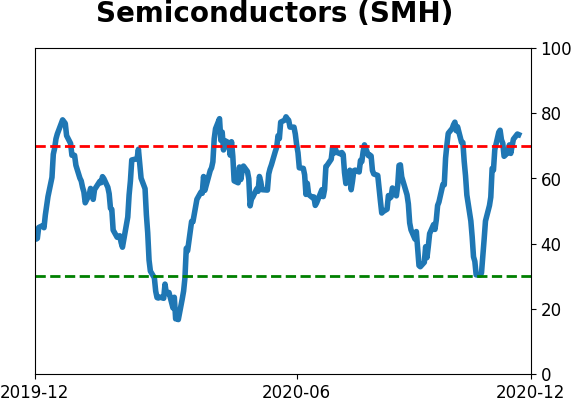
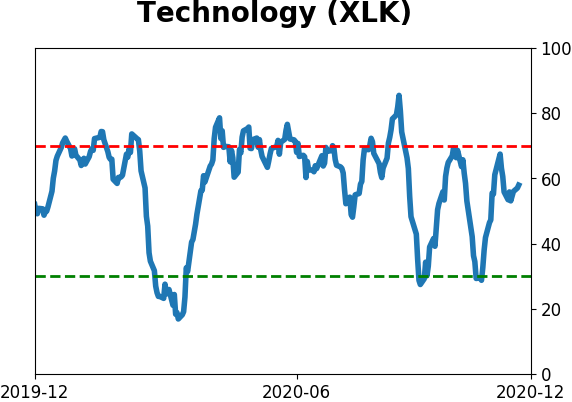
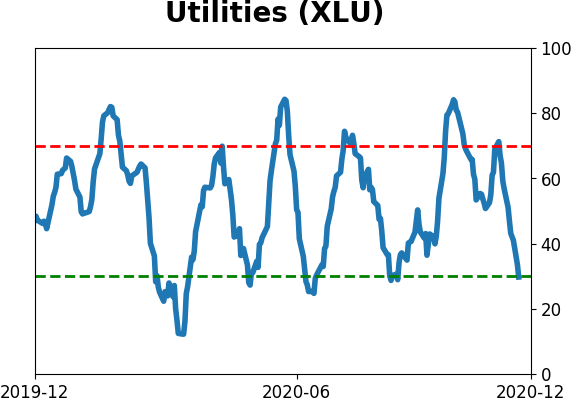
Sector ETF's - 10-Day Moving Average
|
|
|
Country ETF's - 10-Day Moving Average
|
|
|
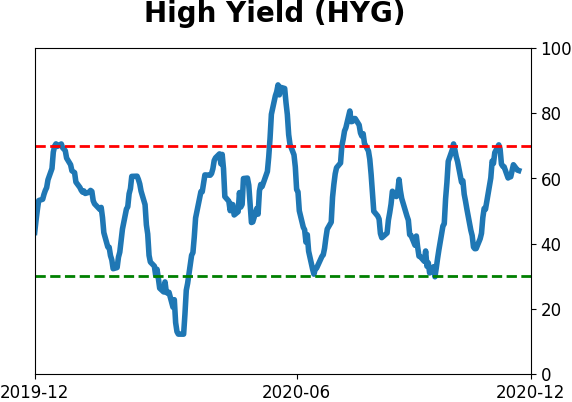
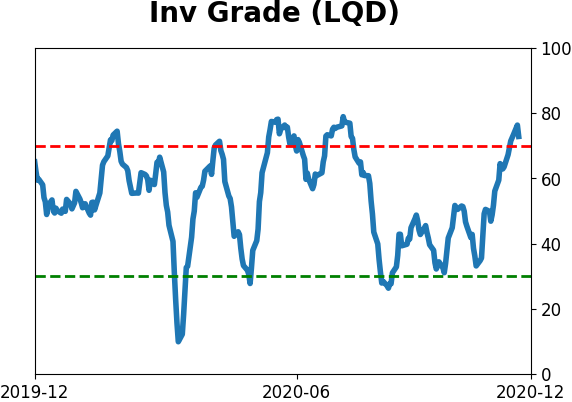
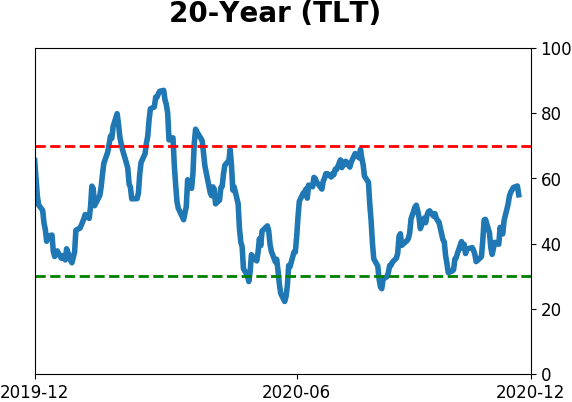
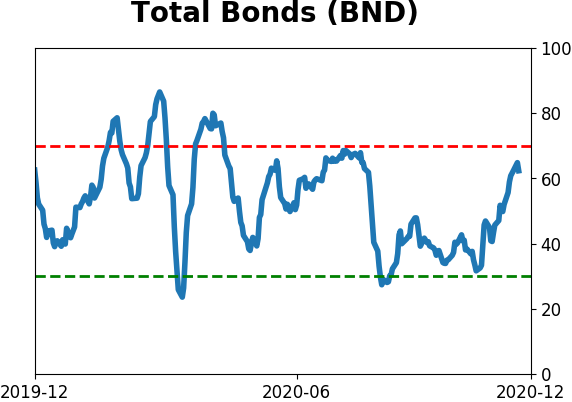
Bond ETF's - 10-Day Moving Average
|
|
|
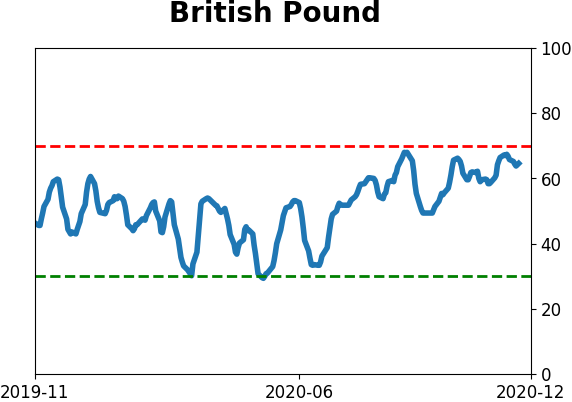
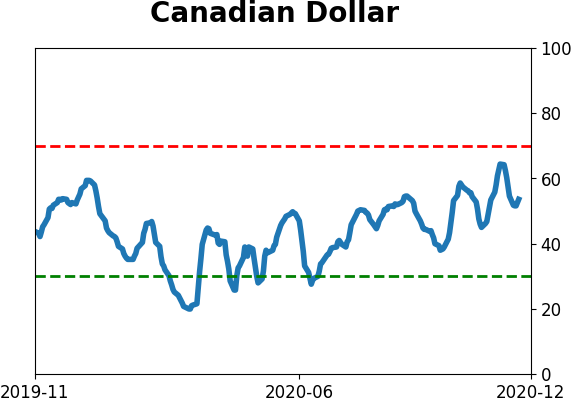
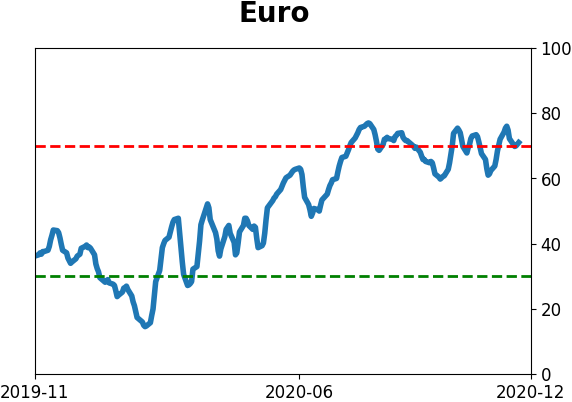
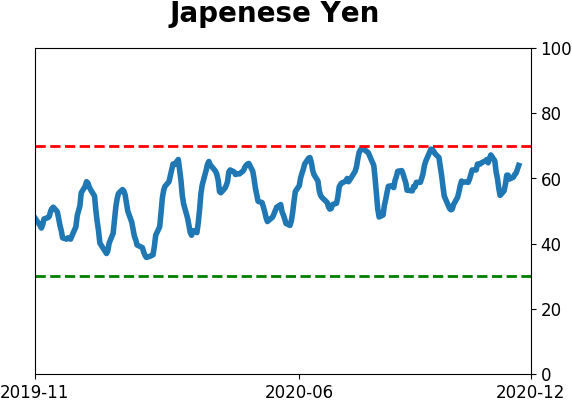
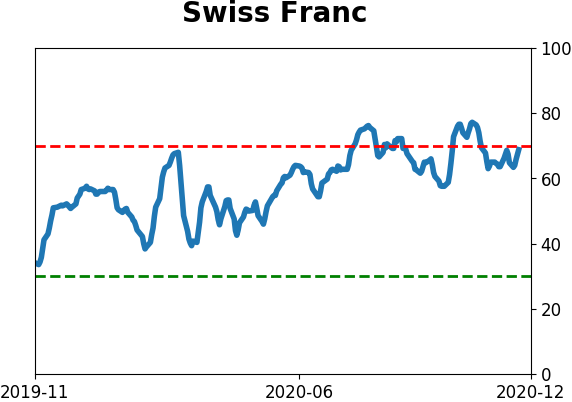
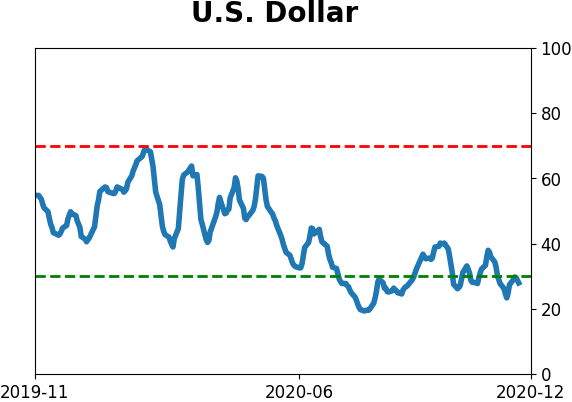
Currency ETF's - 5-Day Moving Average
|
|
|
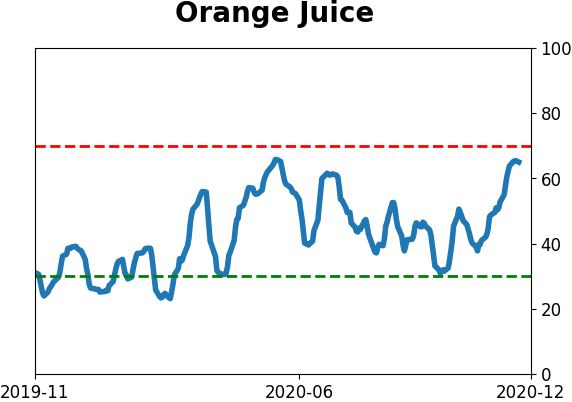
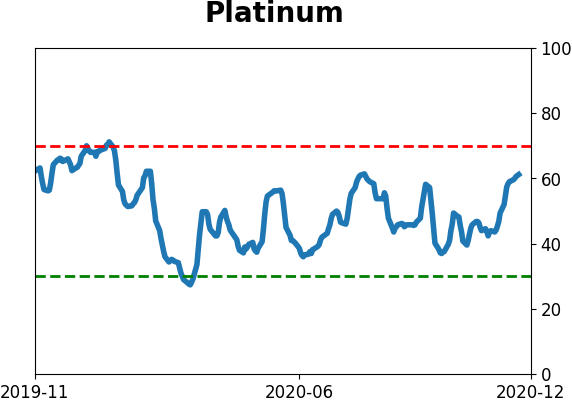
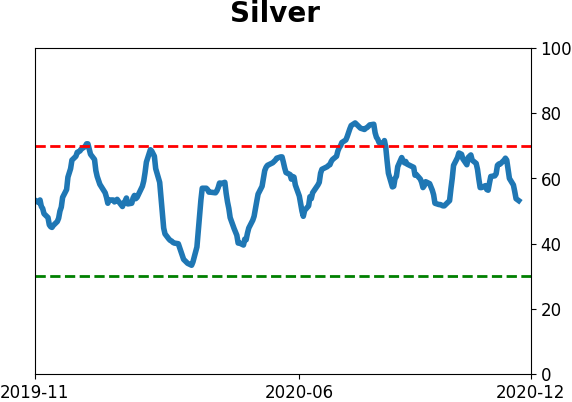
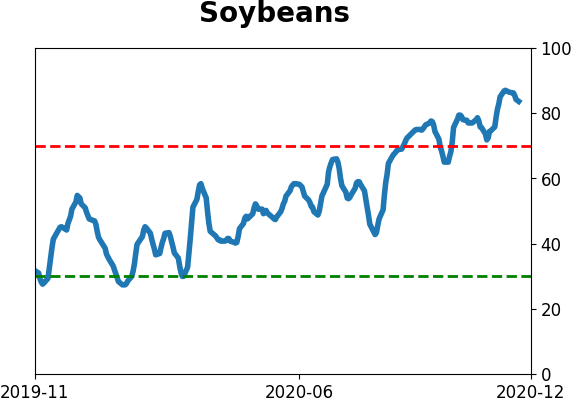
Commodity ETF's - 5-Day Moving Average
|
|