Headlines
|
|
Investors pull back on leverage as stocks rebound:
Stock prices jumped in October, but investors pulled back on their leverage. The S&P 500 rallied more than 7% while margin debt fell more than 2%. Similar behavior tended to lead to even higher prices in the months ahead.
|
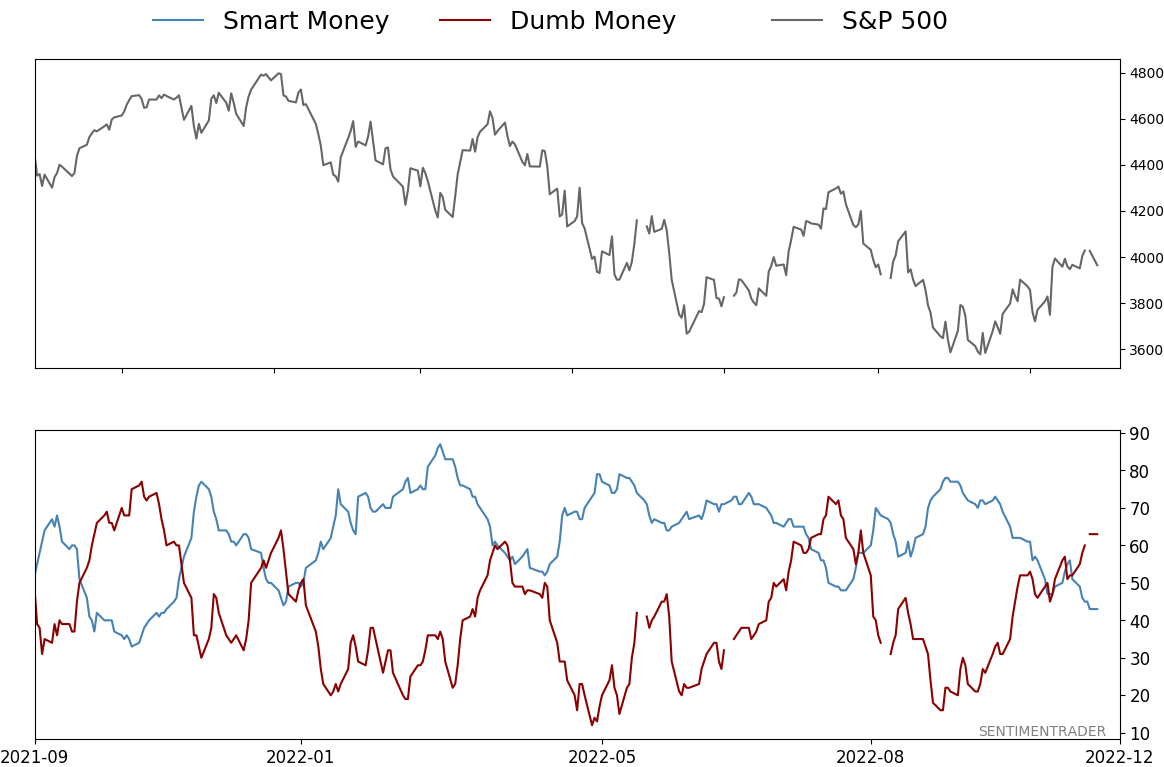
Smart / Dumb Money Confidence
|
Smart Money Confidence: 43%
Dumb Money Confidence: 63%
|
|
Risk Levels
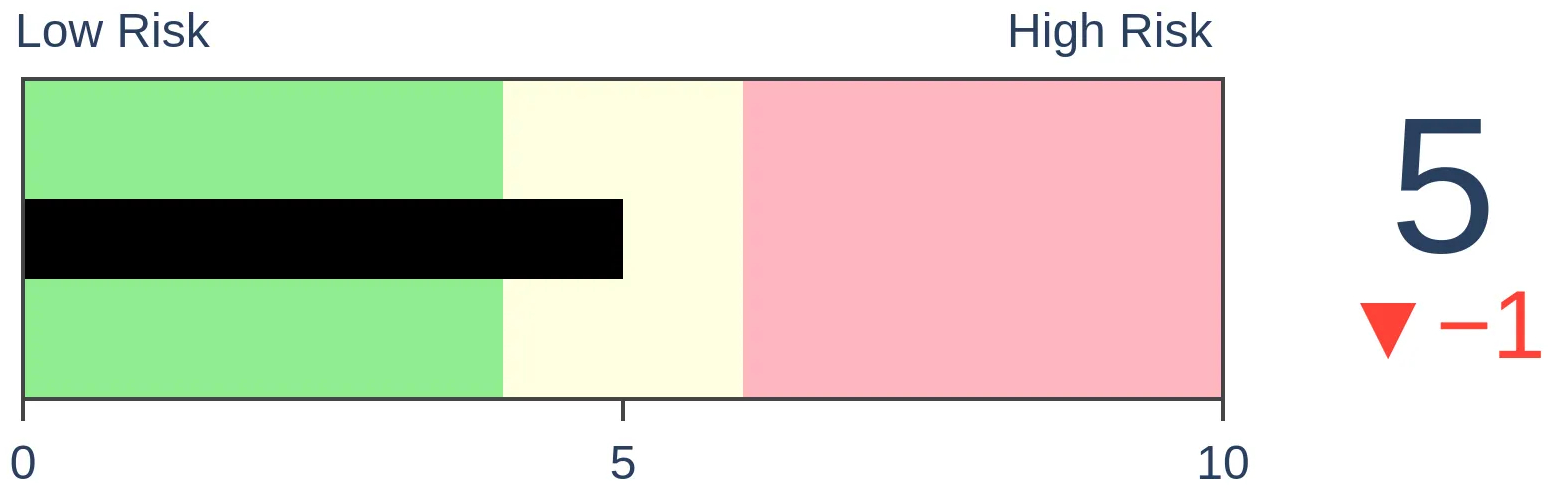
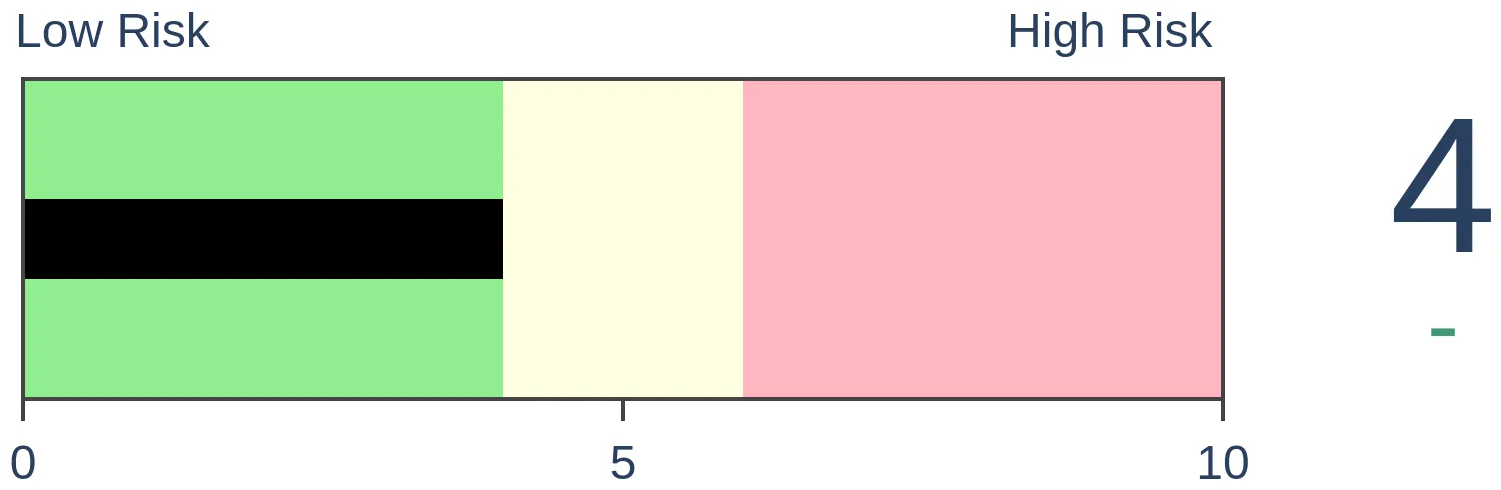
Stocks Short-Term
|
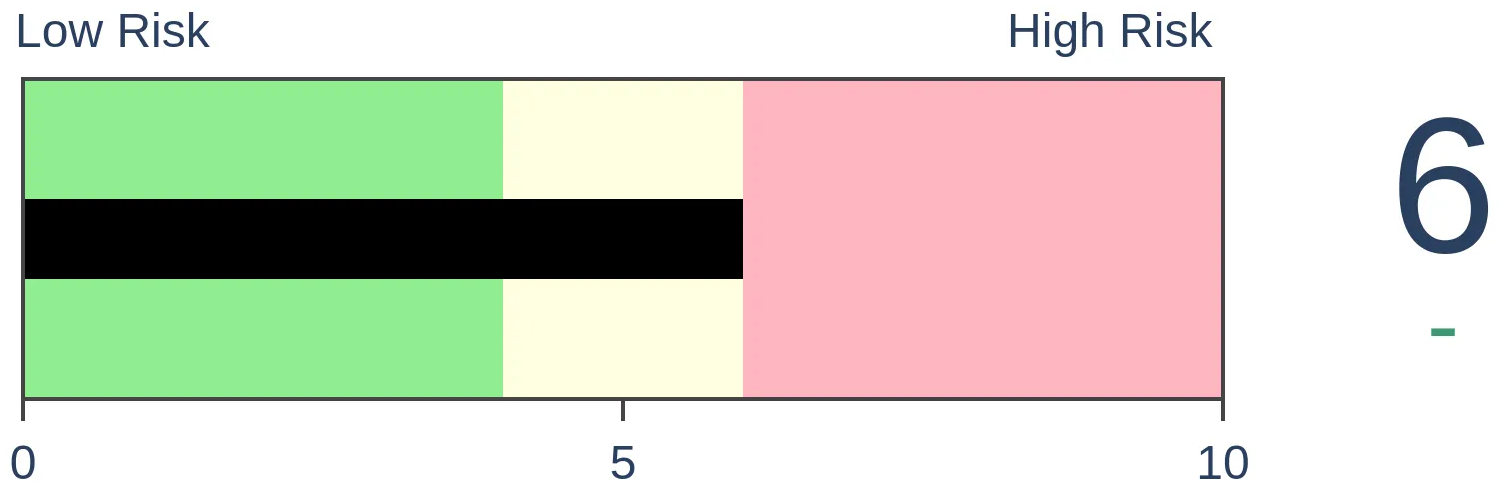
Stocks Medium-Term
|
|
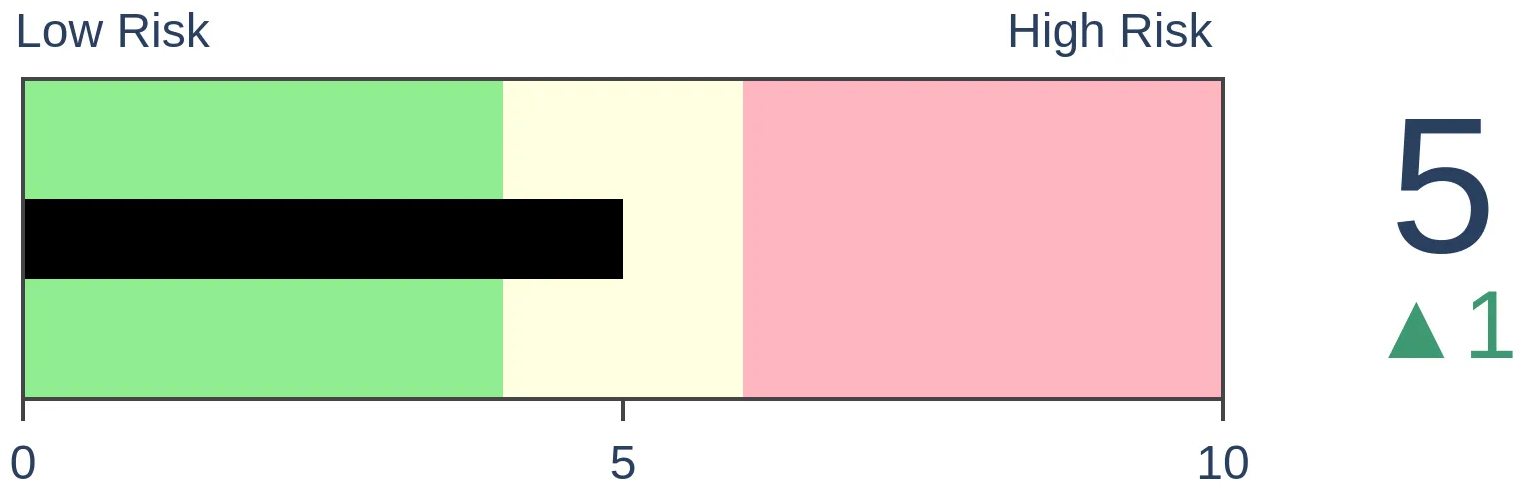
Bonds
|
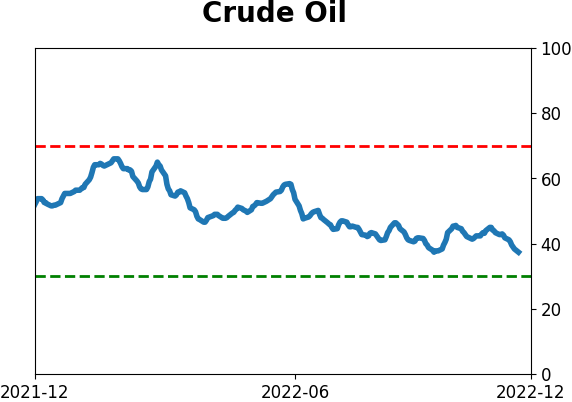
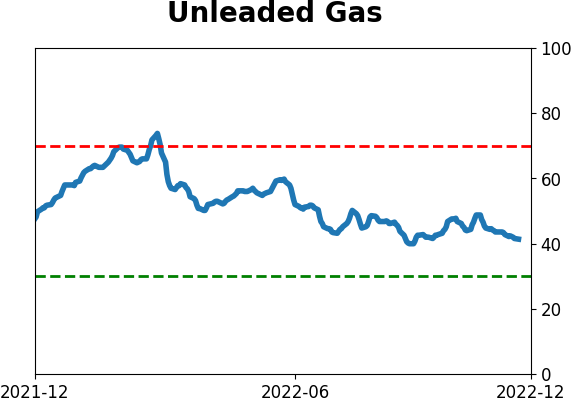
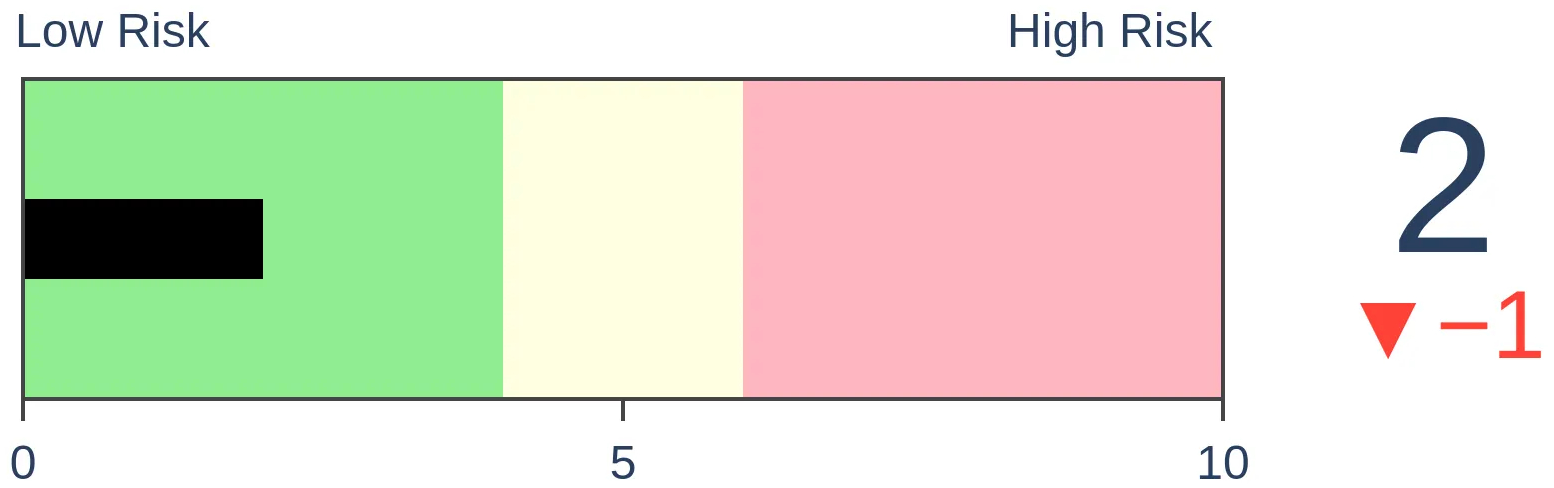
Crude Oil
|
|
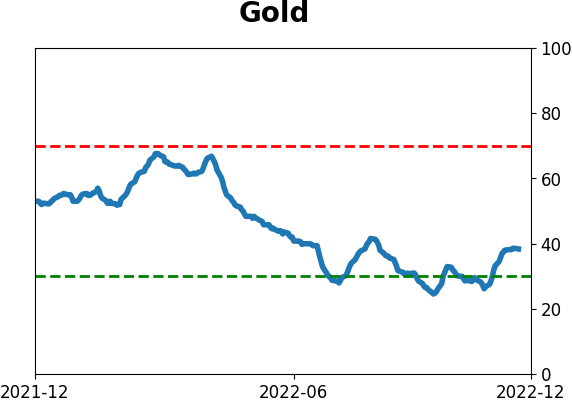
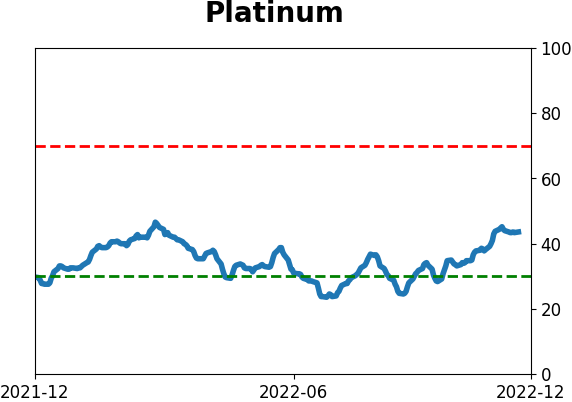
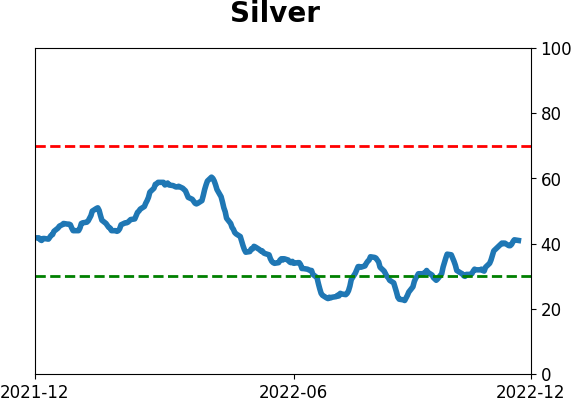
Gold

|
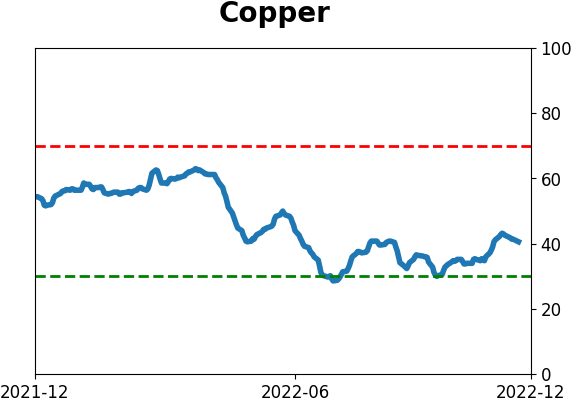
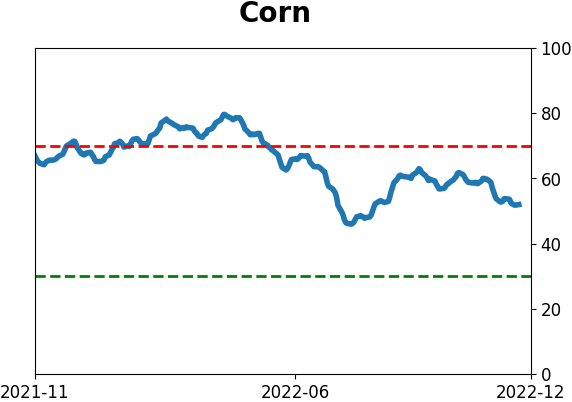
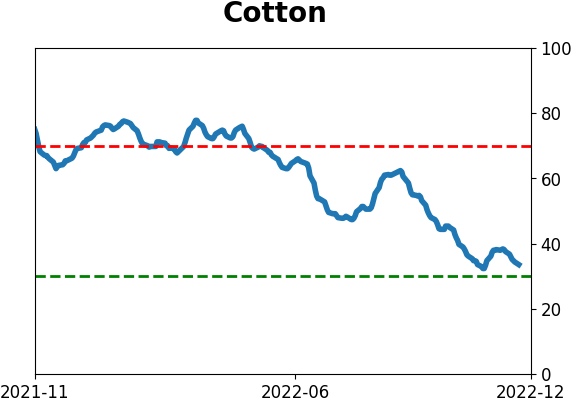
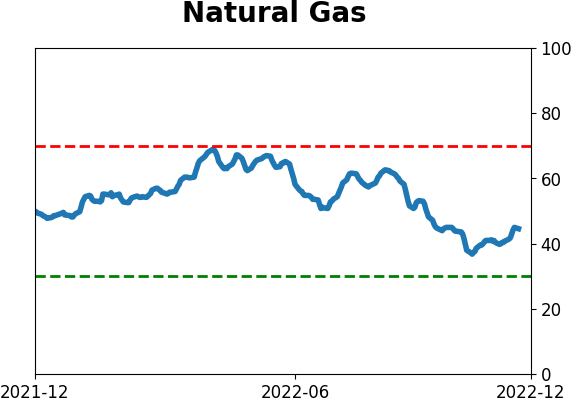
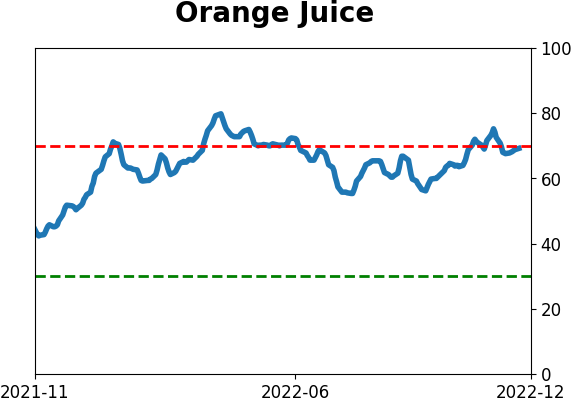
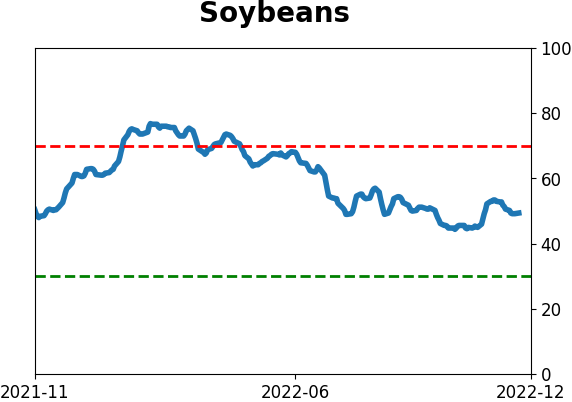
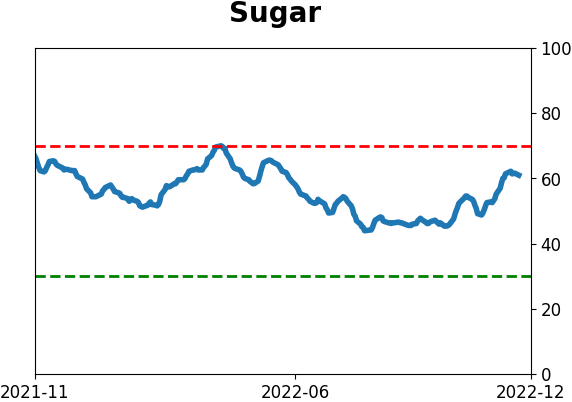
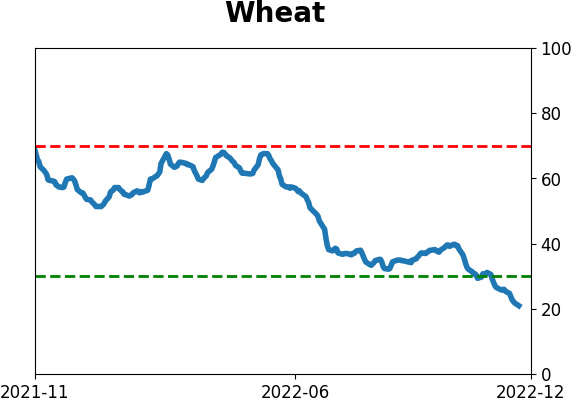
Agriculture
|
|
Research
By Jason Goepfert
BOTTOM LINE
Stock prices jumped in October, but investors pulled back on their leverage. The S&P 500 rallied more than 7% while margin debt fell more than 2%. Similar behavior tended to lead to even higher prices in the months ahead.
FORECAST / TIMEFRAME
None
|
Key points:
- The S&P 500 jumped more than 7% in October, but margin debt fell
- This is an outlier from how investors have typically behaved over the past 70 years
- When stocks jump from a one-year low but debt declines, stocks tend to keep rallying
Despite big gains, investors pull back on their loans
We saw in April that stocks tend to fall when investors pile on debt using their securities as collateral and then pull back on their risk appetite.
Debt has continued to recede as investors cover their margin calls by selling stocks or adding additional cash to their accounts. The S&P 500 has declined more than 15% year-over-year using monthly closes through October, but margin debt has plunged more than 30% over the past year.
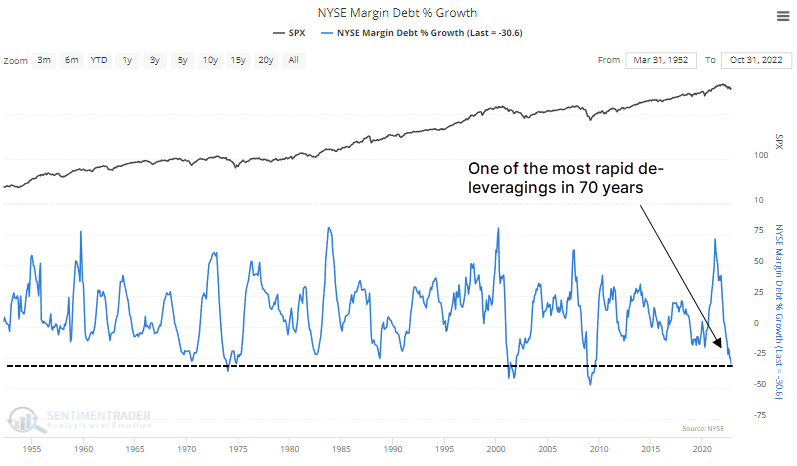
We've noted for decades that changes in margin debt tend to go hand-in-hand with changes in the price of stocks. When the S&P 500 rises in any given month, margin debt tends to grow, and vice-versa. Last month was odd in that the S&P jumped nearly 8%, yet debt declined by more than 2%.
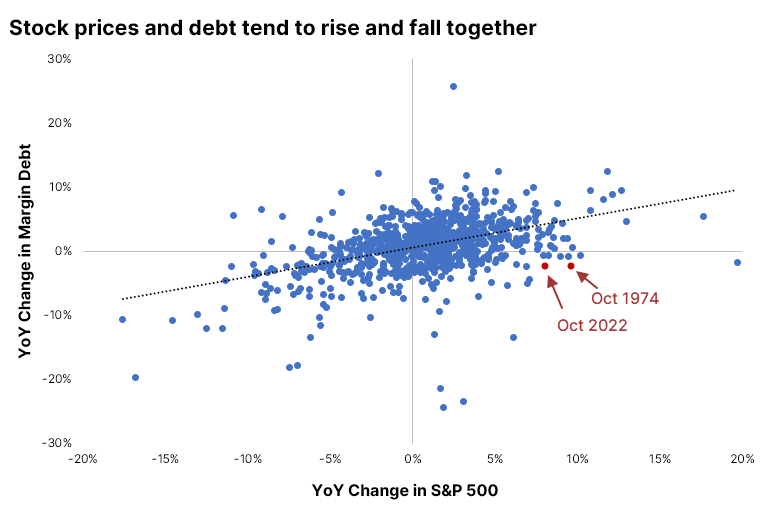
The only other month when the S&P gained more than 7.5% during the month and debt declined by 2% or more was October 1974.
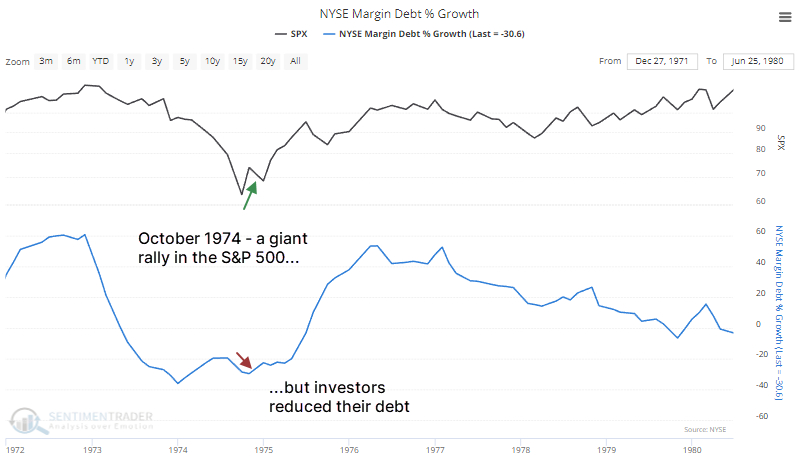
Big rallies in stocks with reduced leverage tend to lead to higher prices
After any month in which the S&P 500 rebounded 3% or more from a one-year low, yet debt continued to fall to a new low, stocks tended to rebound in the months ahead. It wasn't a perfect indicator by any stretch, as it triggered in April 2008 before one of the most gut-wrenching periods in history for equity investors.
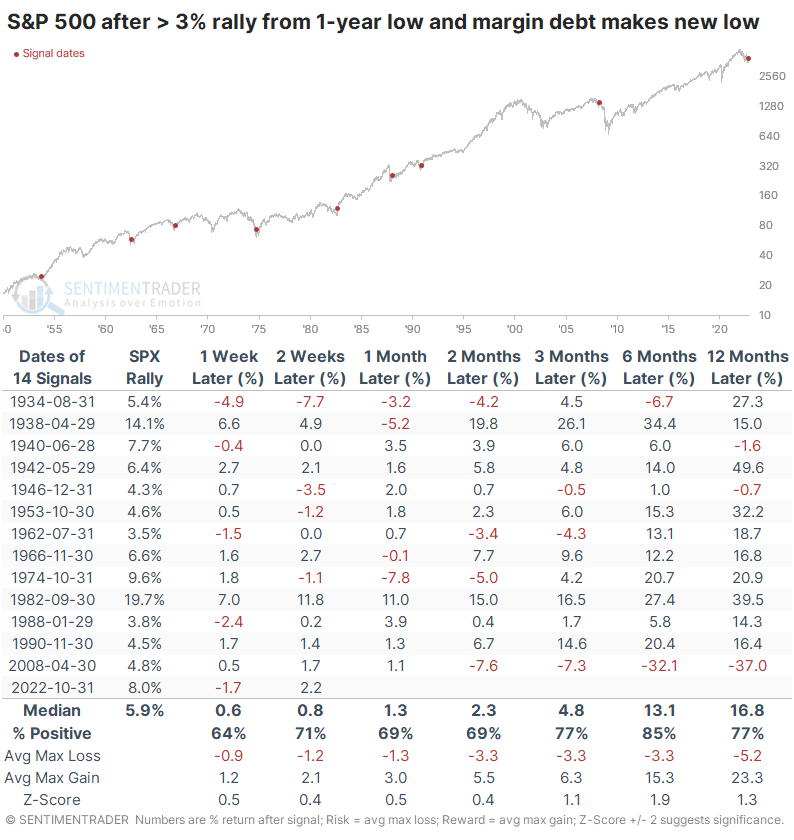
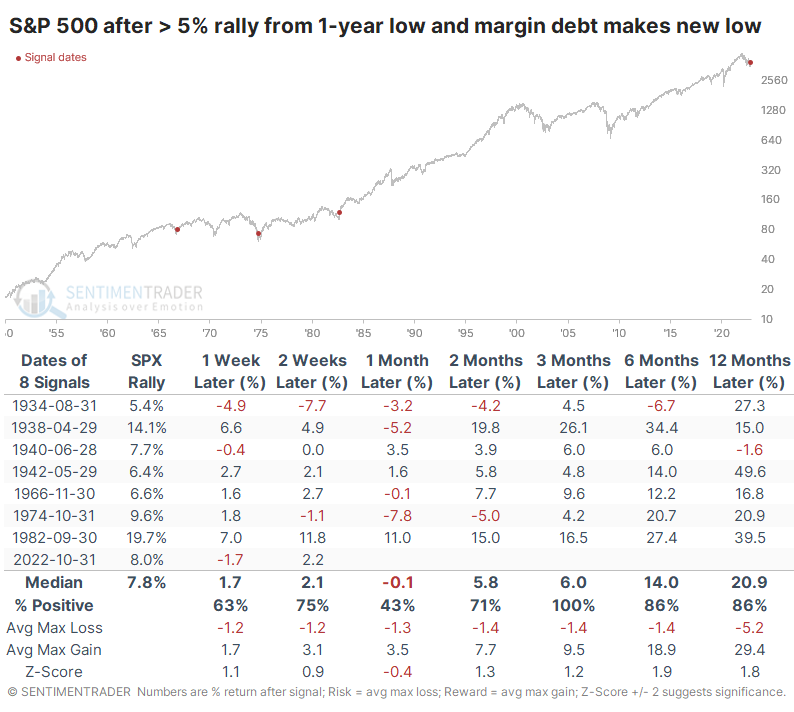
The S&P's rally was more impressive than that, of course. The sample size gets even more uncomfortably small, but when the S&P jumped at least 5% yet debt hit a low, returns were better. Over the next few months, stocks rose every time, and a year later, the S&P averaged a gain of more than 20%.
What the research tells us...
Most sentiment indicators are reflections of price action. Rising prices trigger increased optimism, which helps to trigger even higher prices. The effect is even more pronounced on the downside. The self-perpetuating cycle tends to persist until there is extreme sentiment, then it drifts the other way. It's unusual when prices and sentiment disconnect, and there is no strict rule that such an event is bullish or bearish for prices going forward. With margin debt, disconnects, like in October, have tended to be bullish for prices in the months ahead, so we can at least take that as a mild positive.
Indicators at Extremes
Phase Table
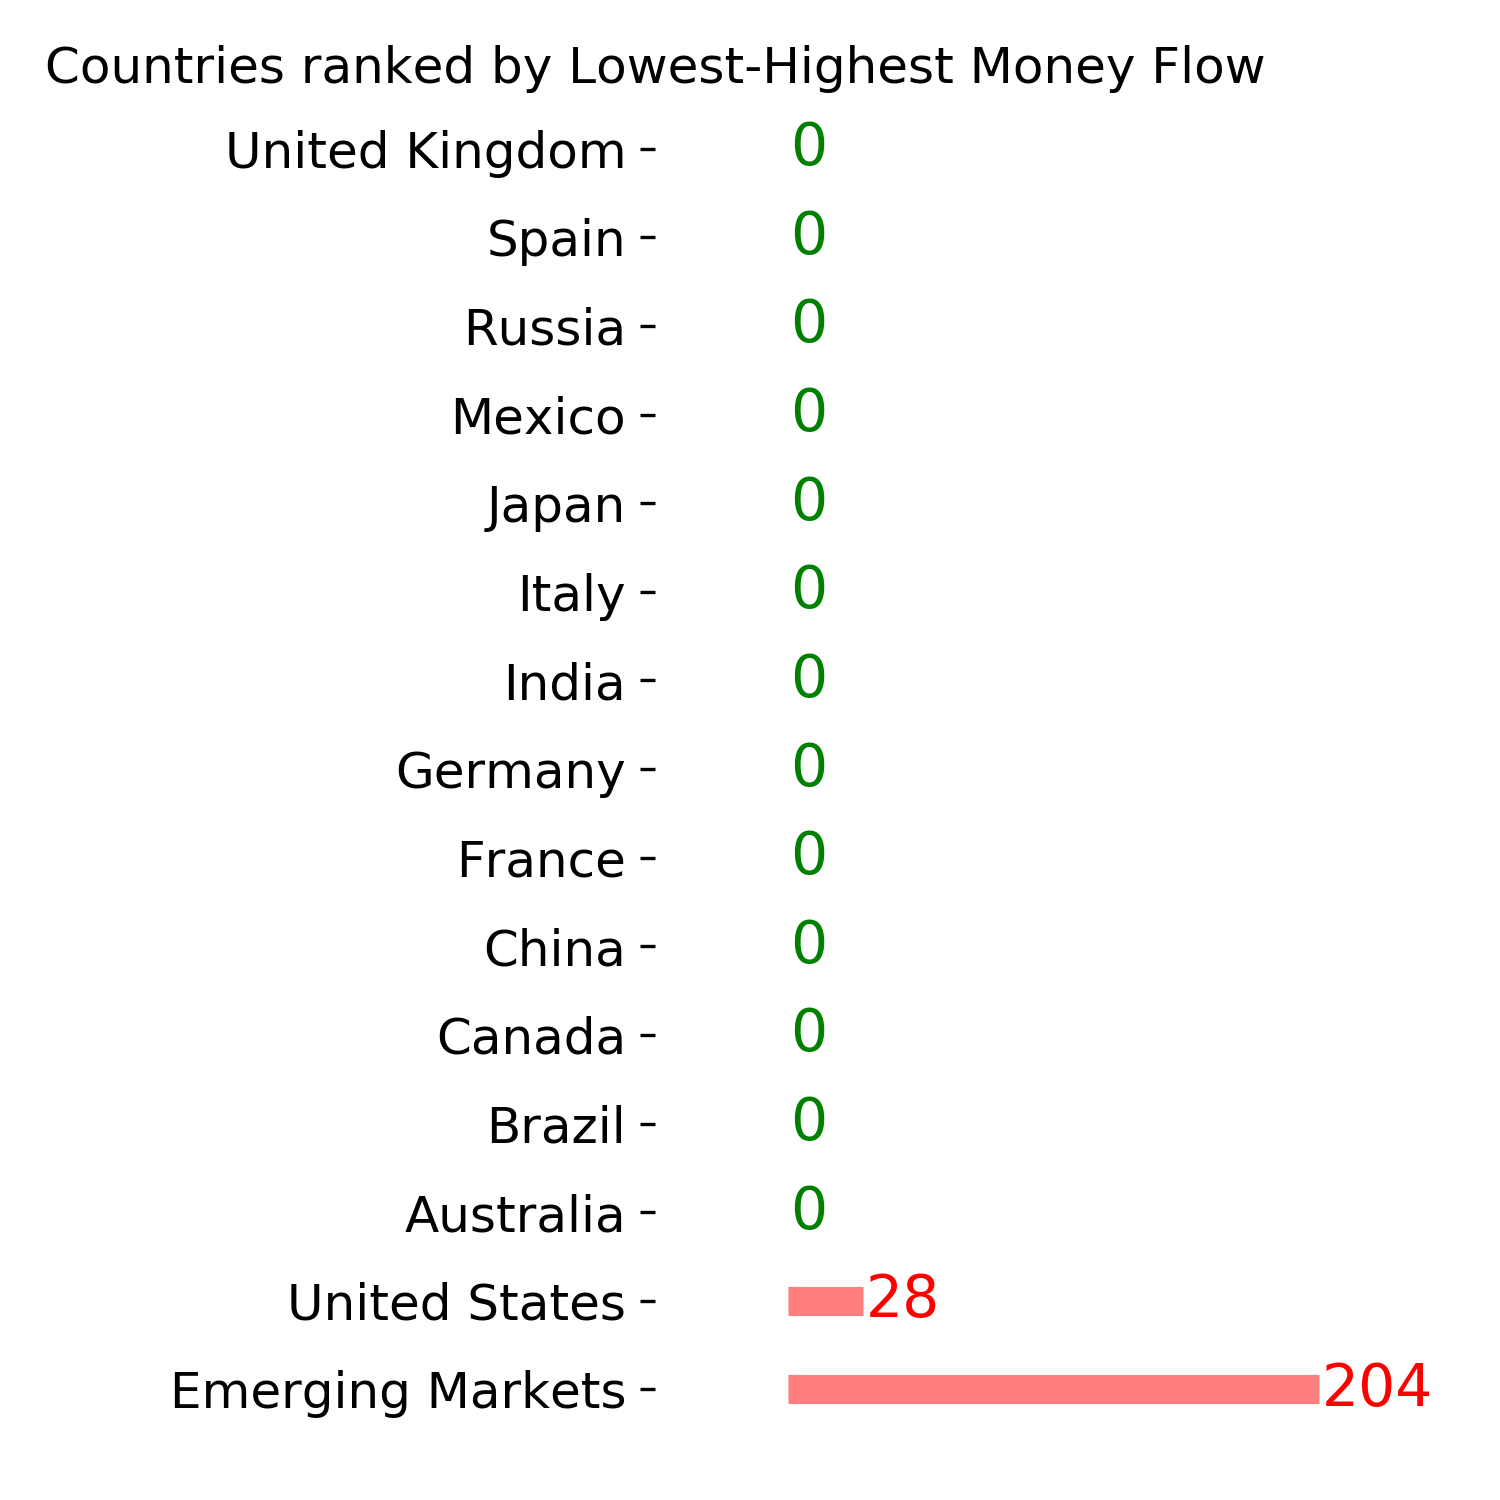
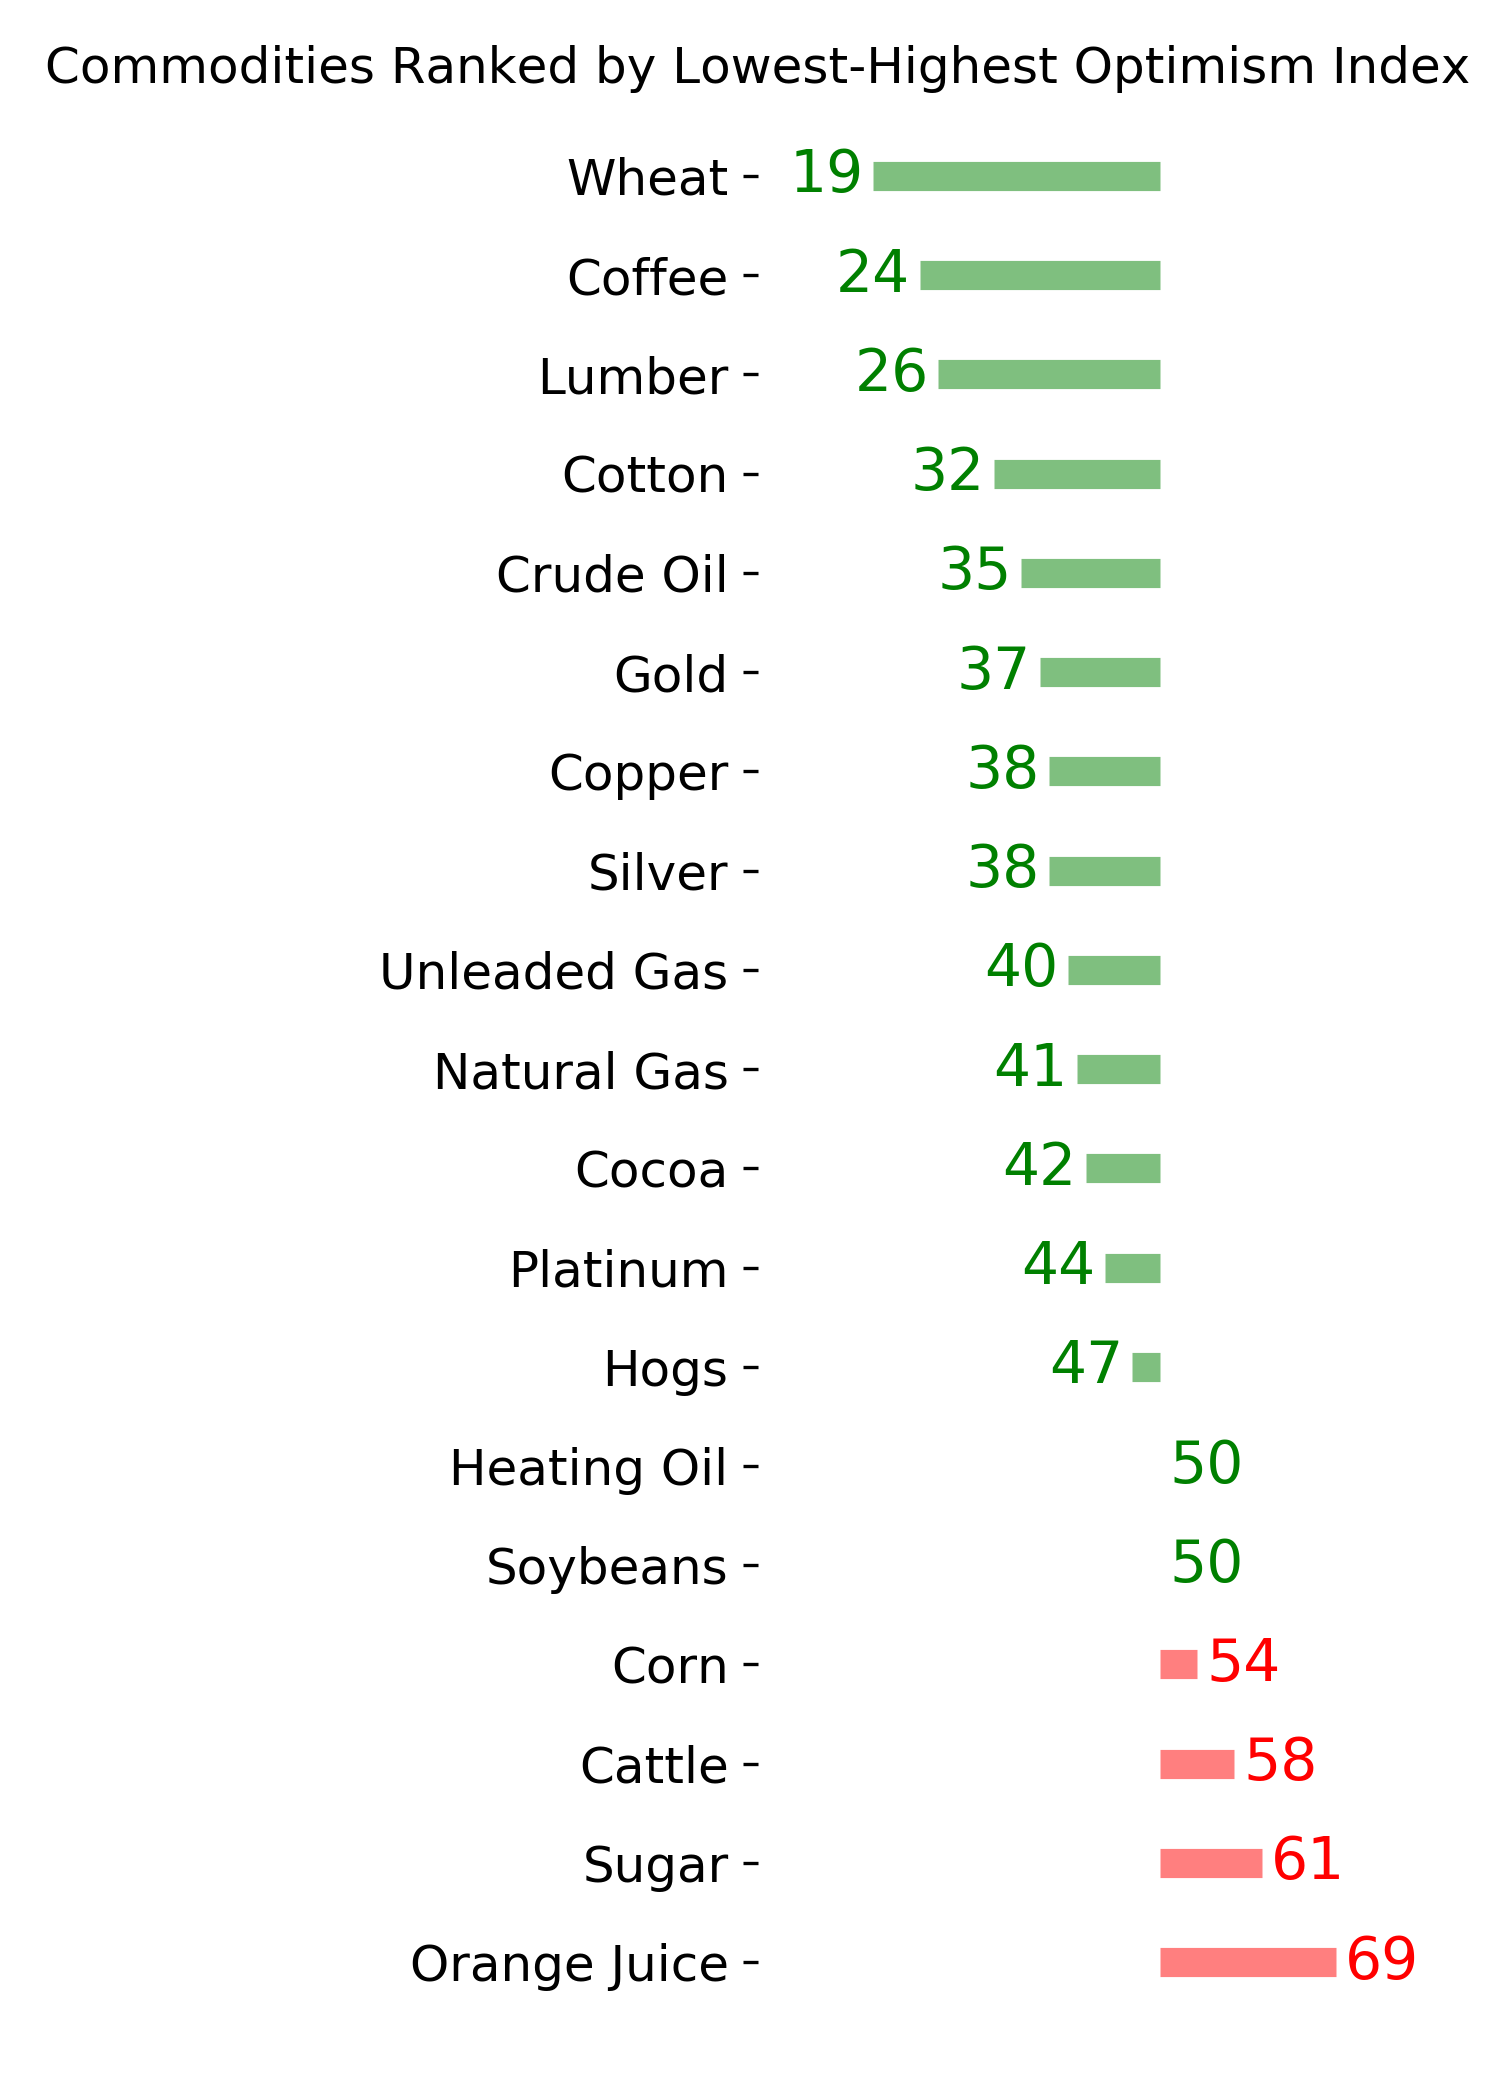
Ranks
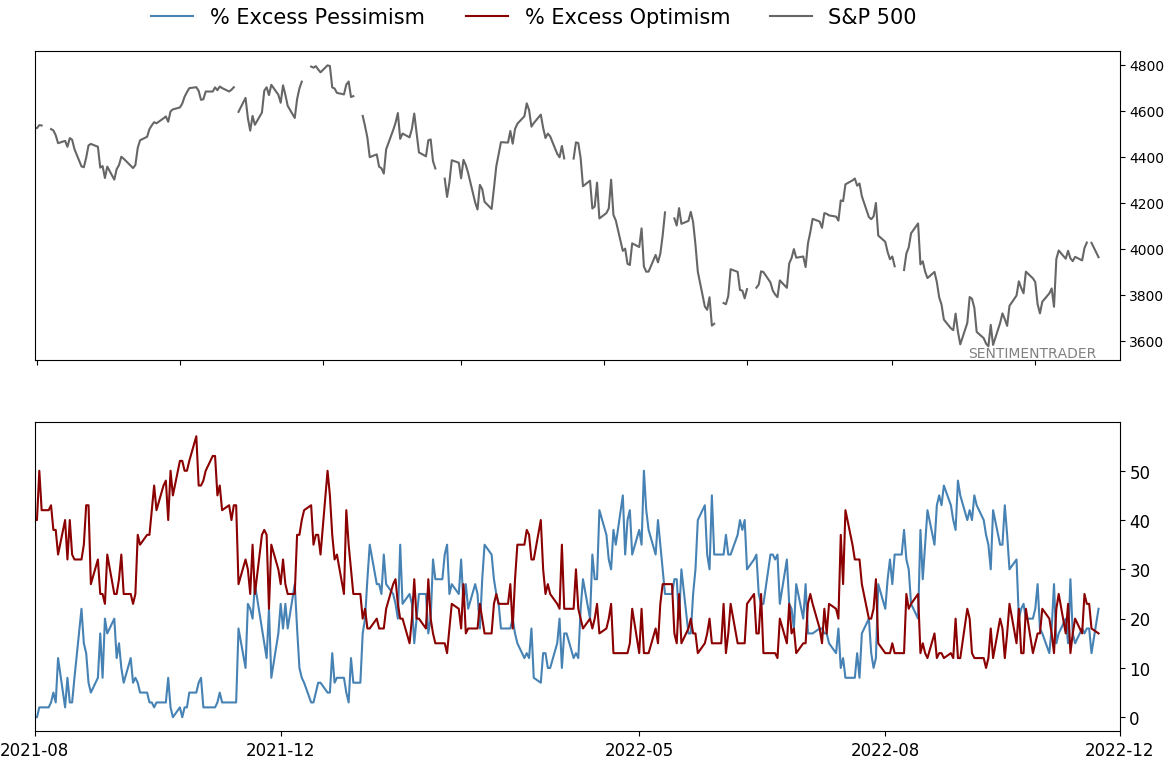
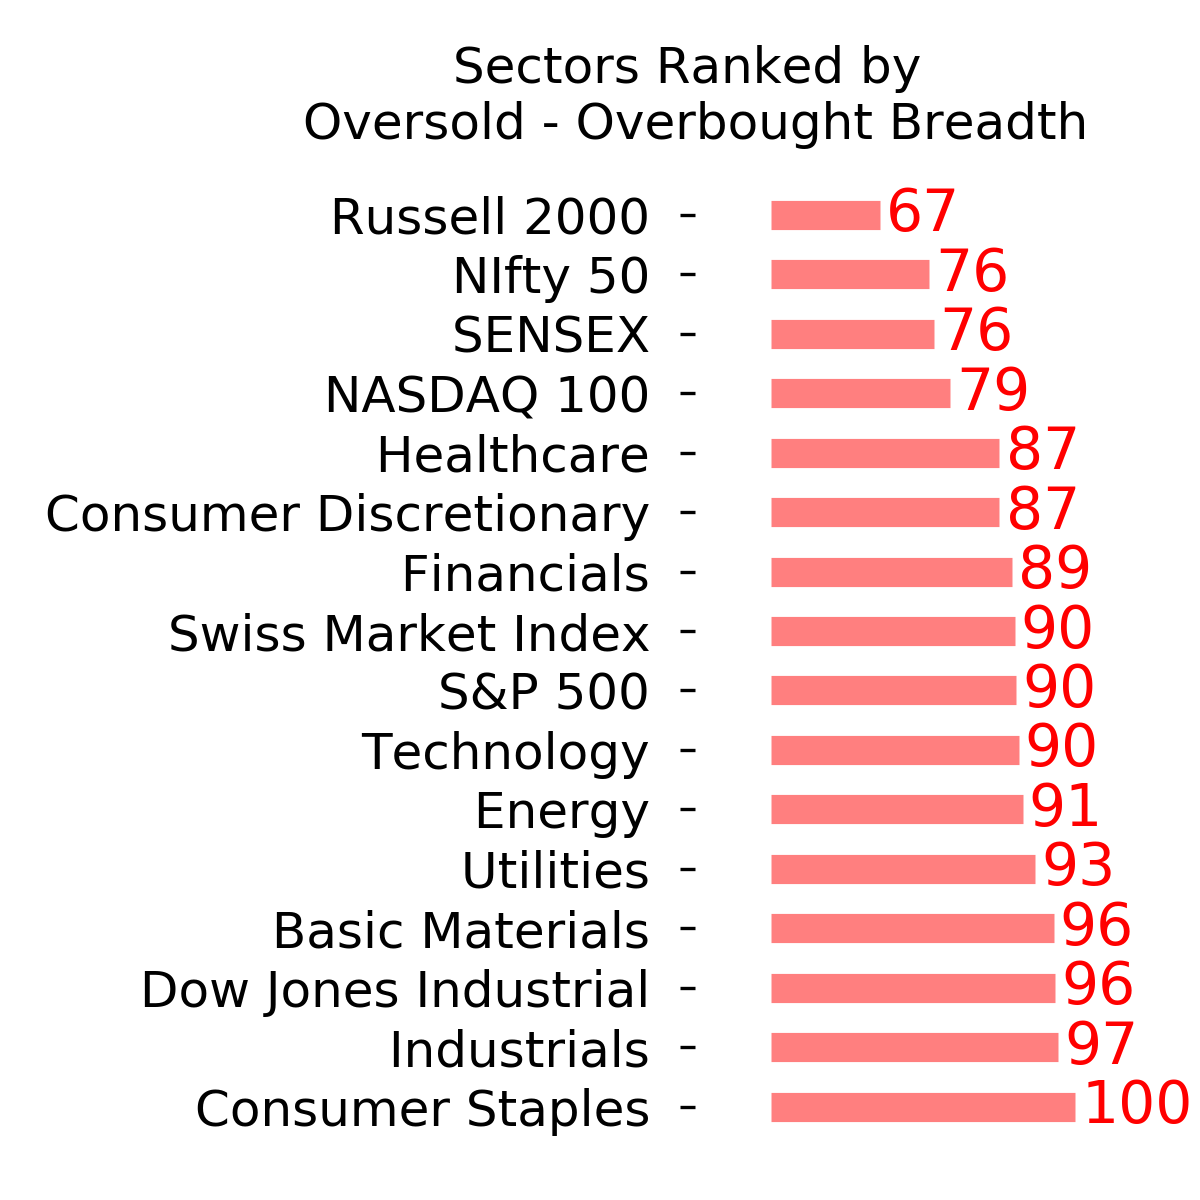
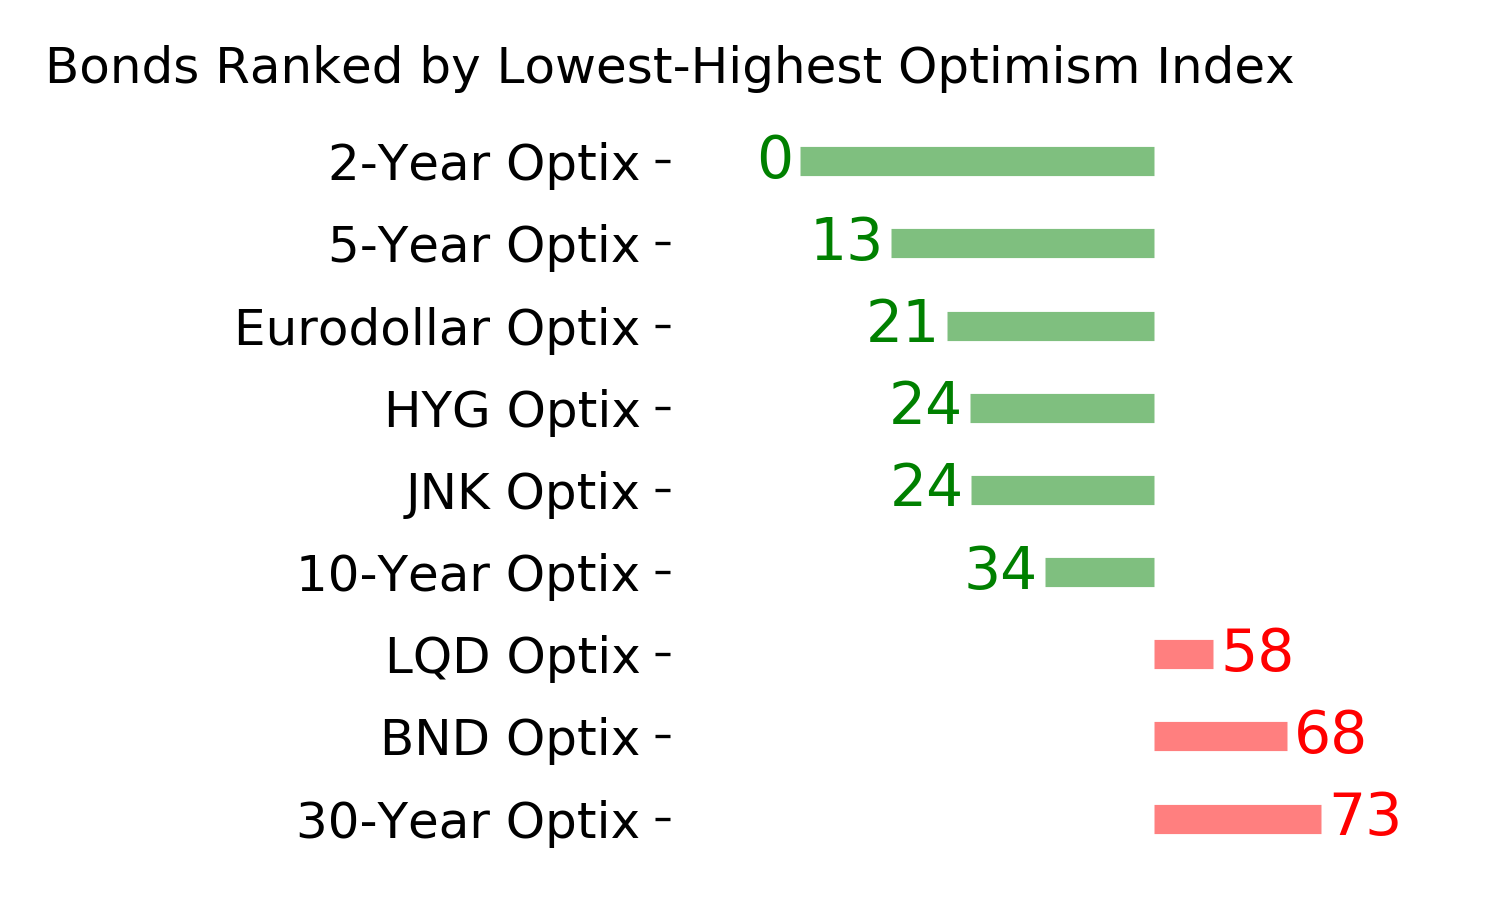
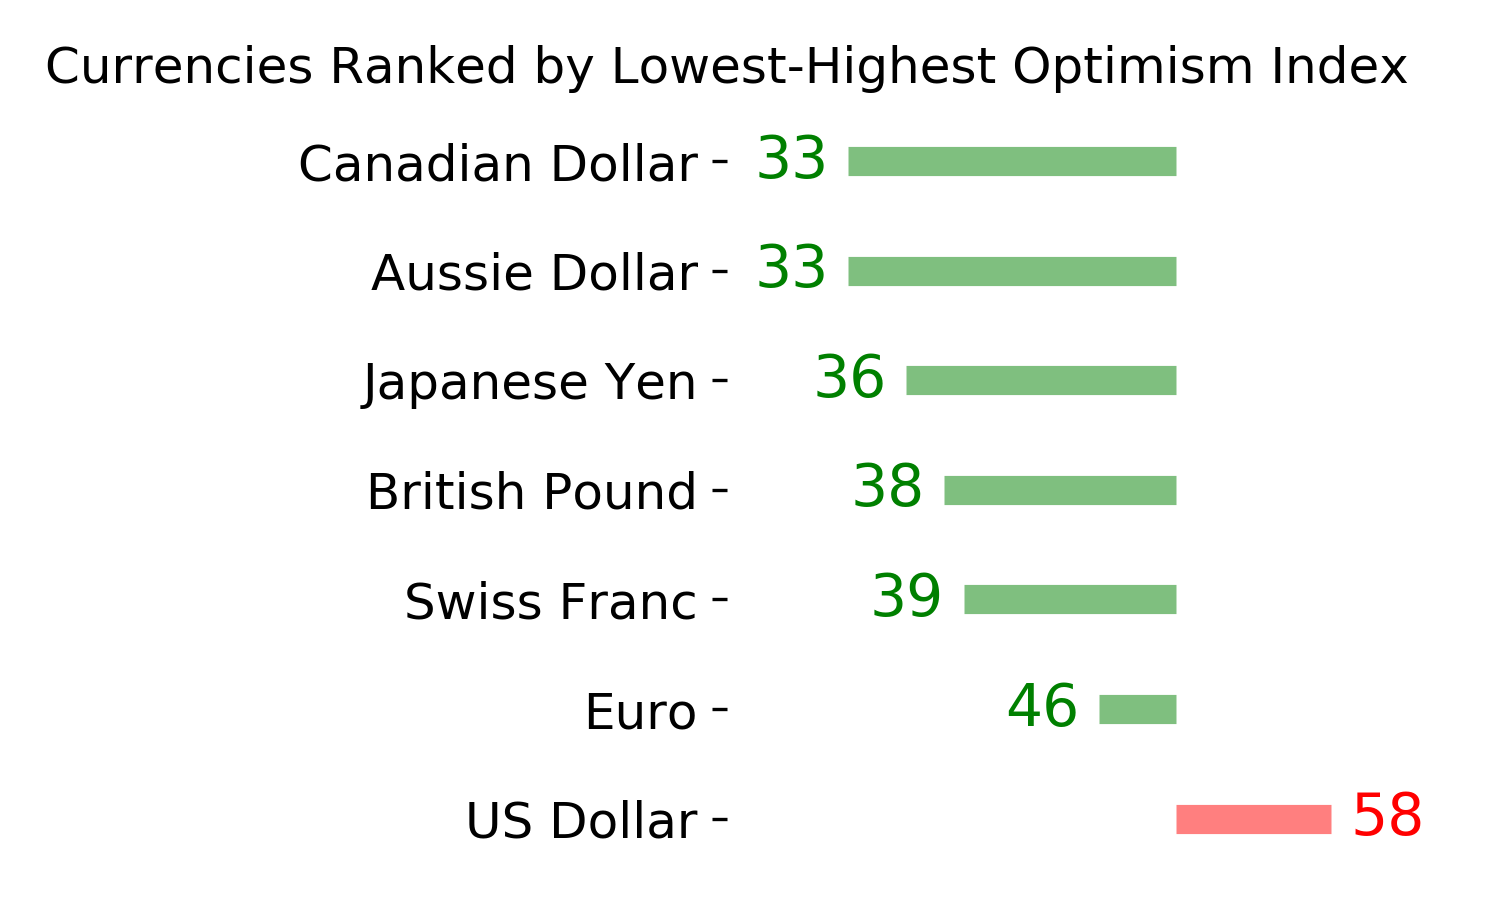
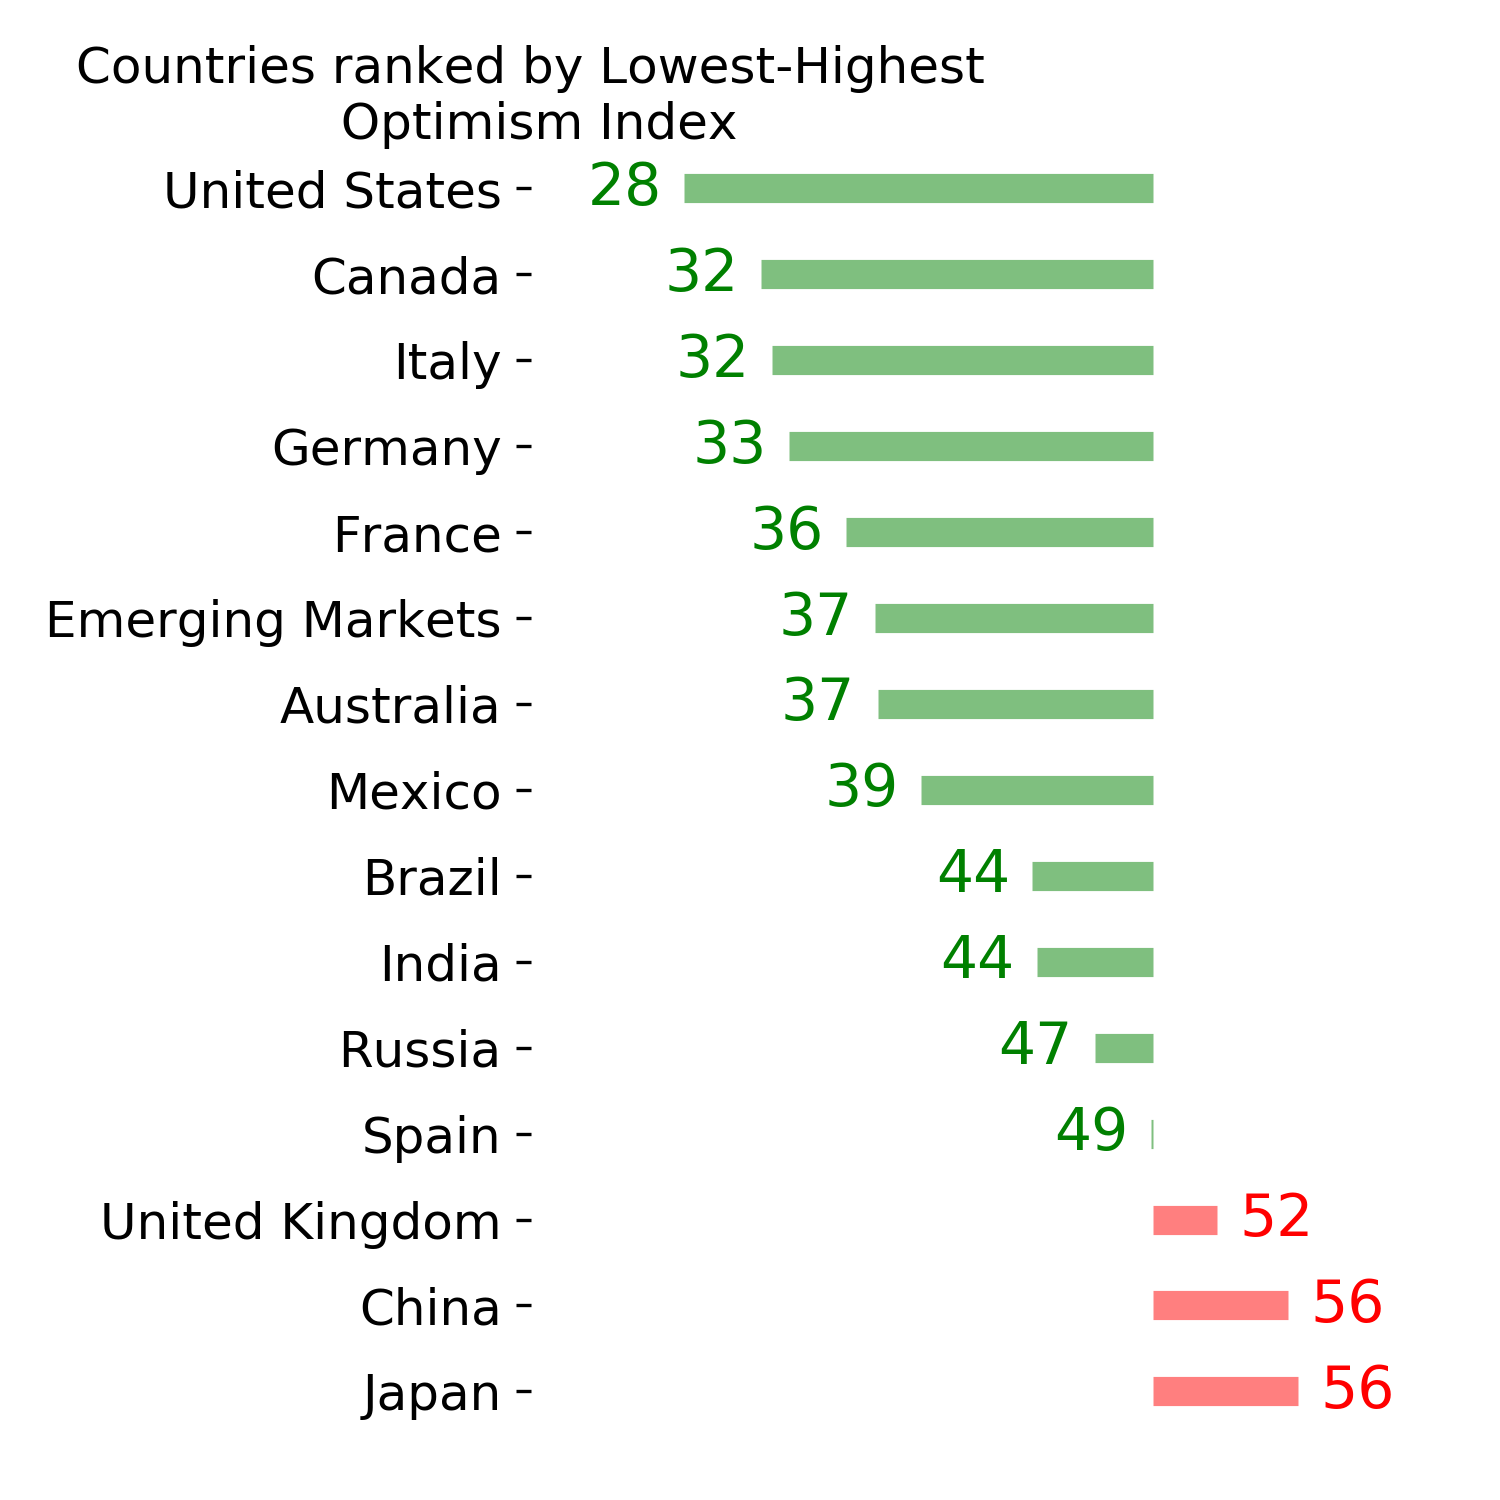
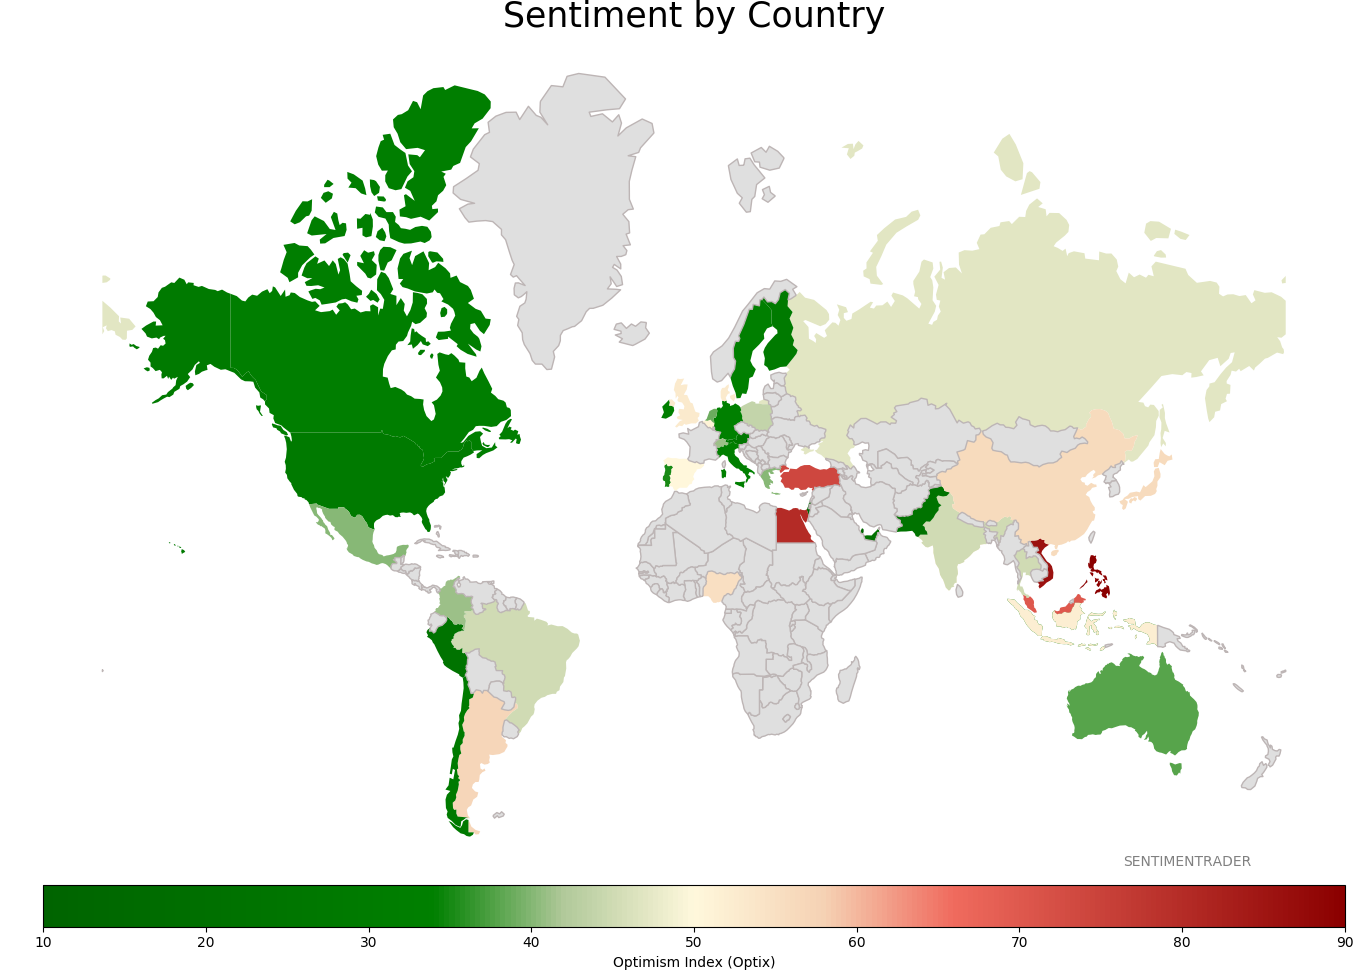
Sentiment Around The World
Optimism Index Thumbnails
|
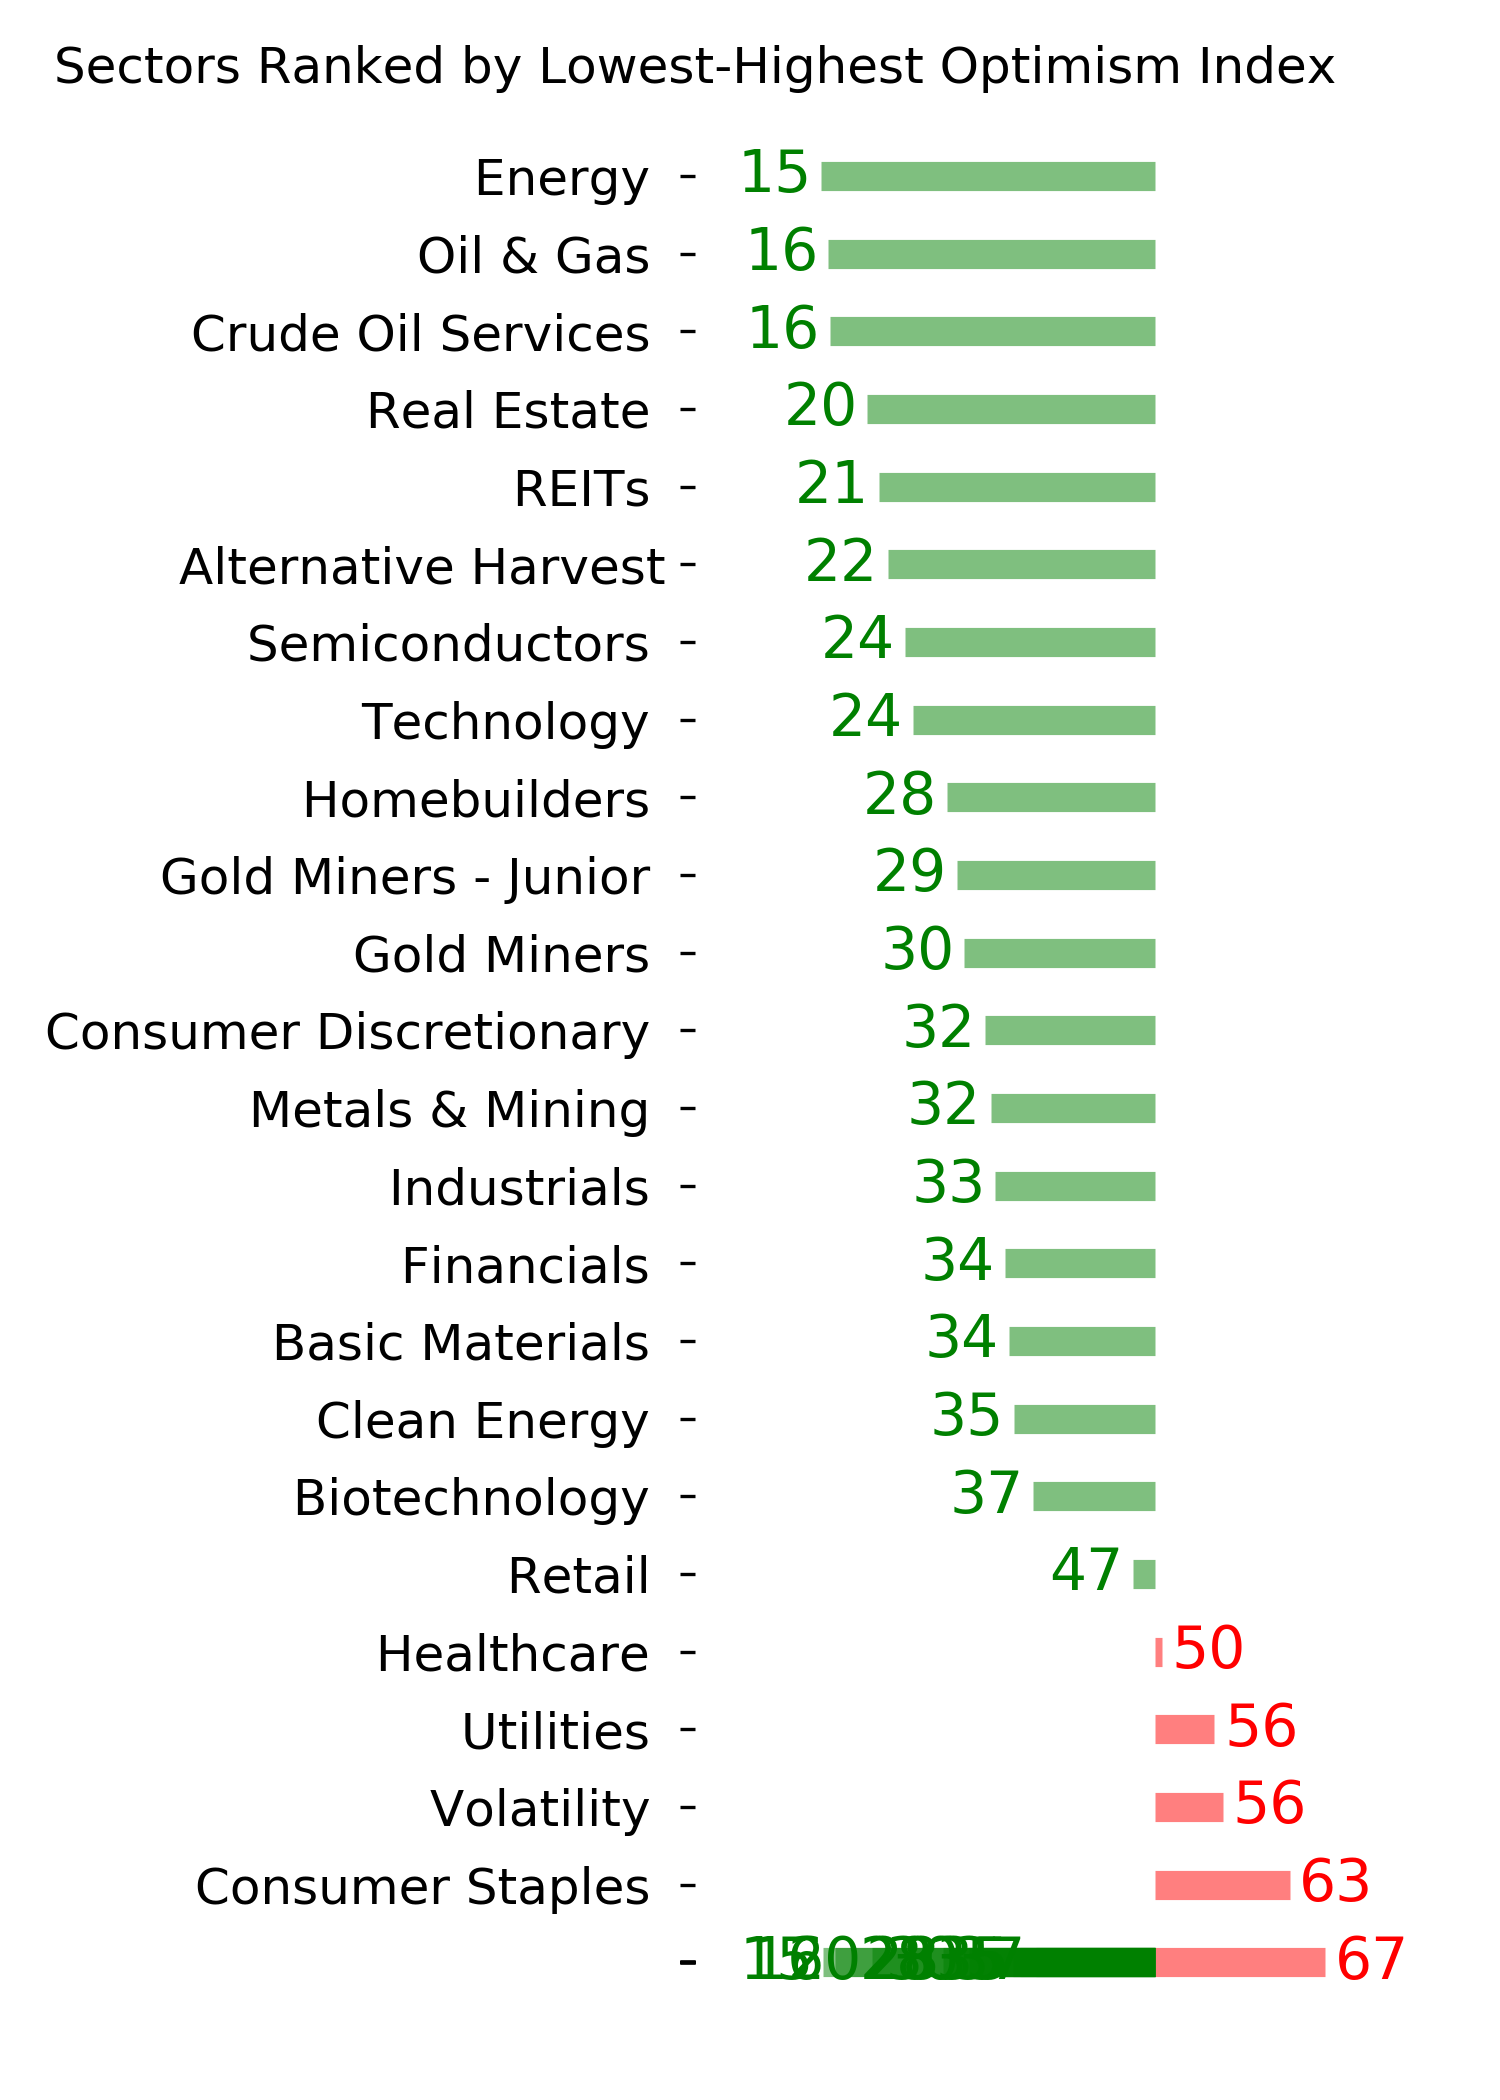
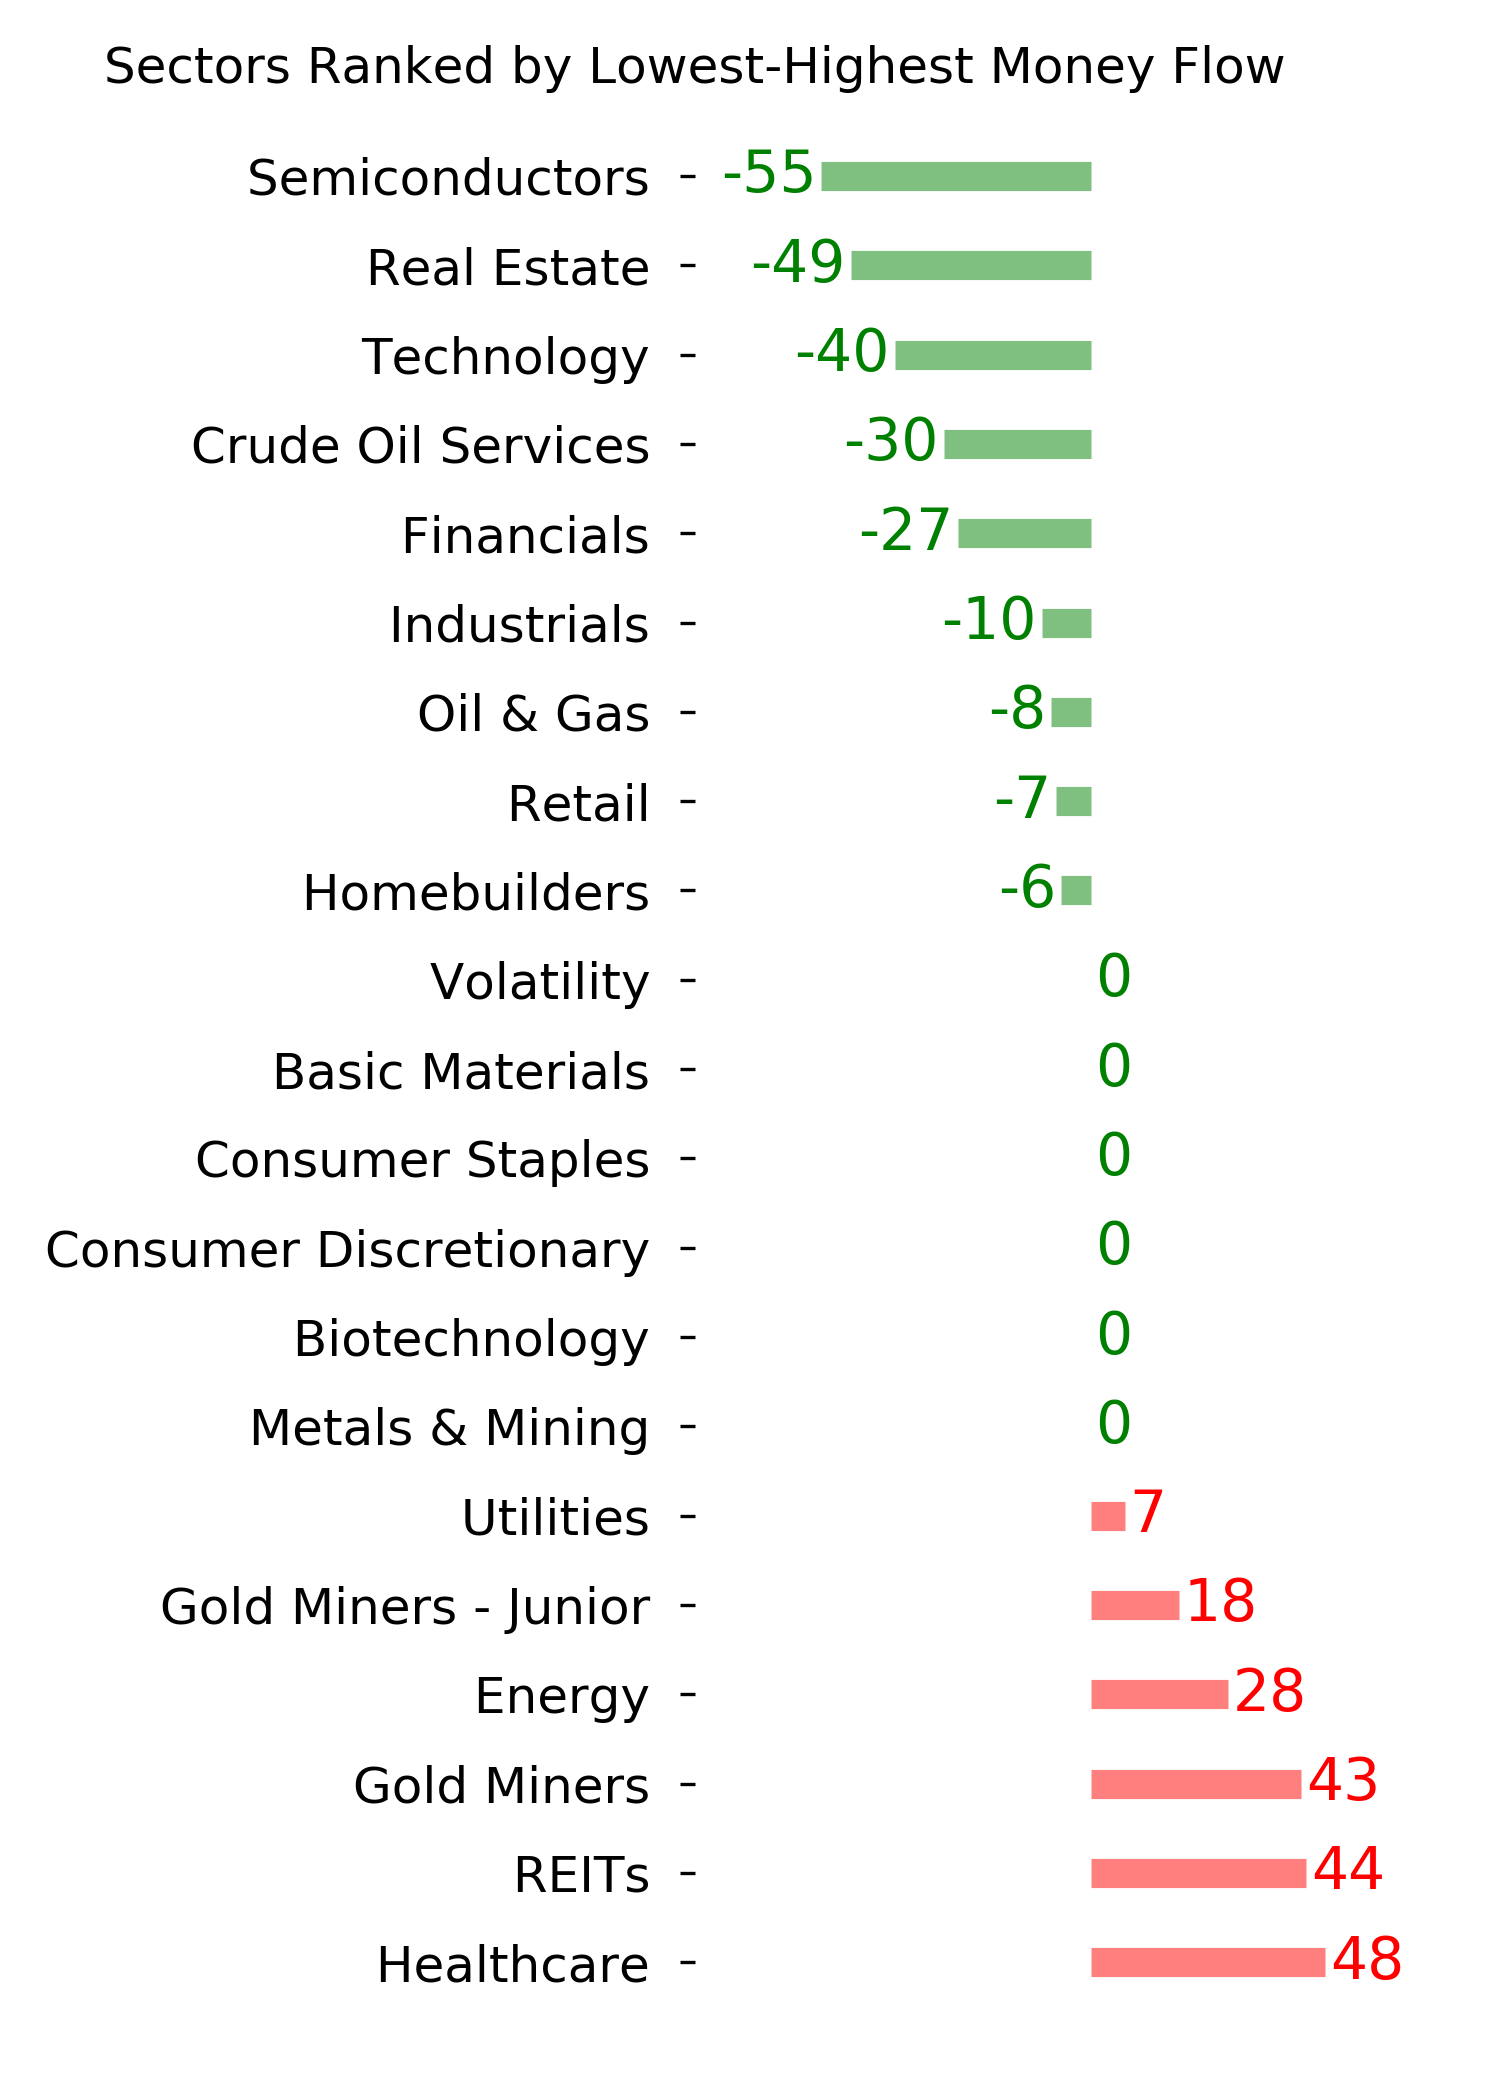
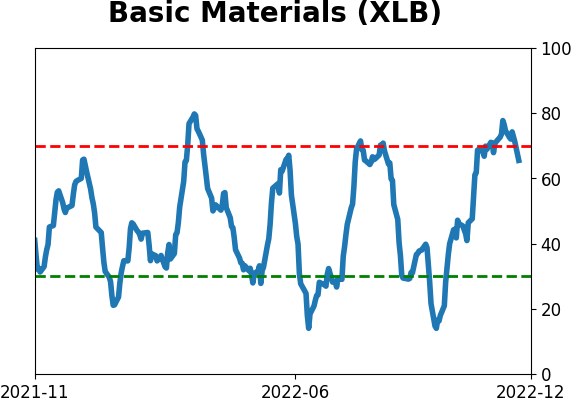
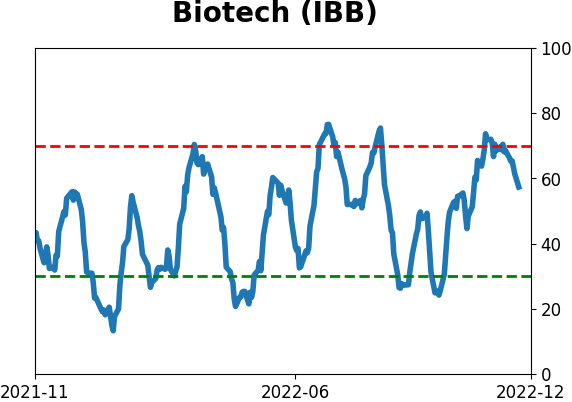
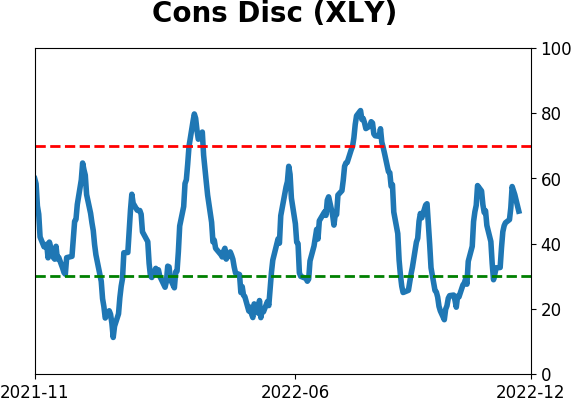
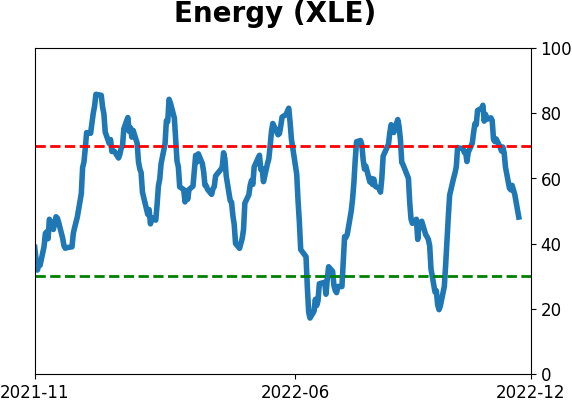
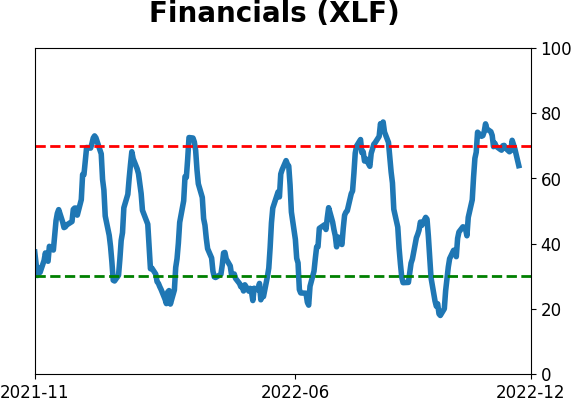
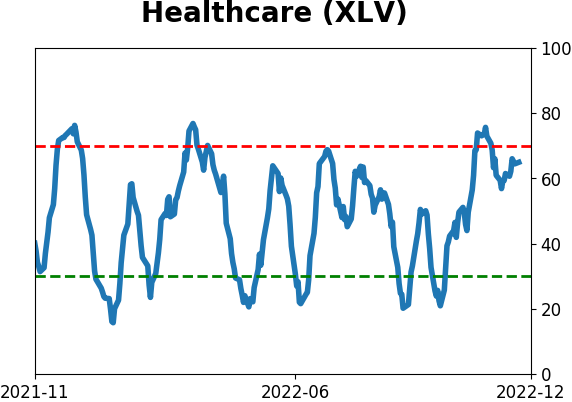
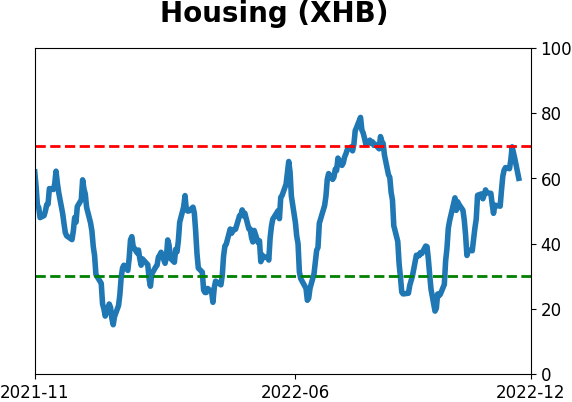
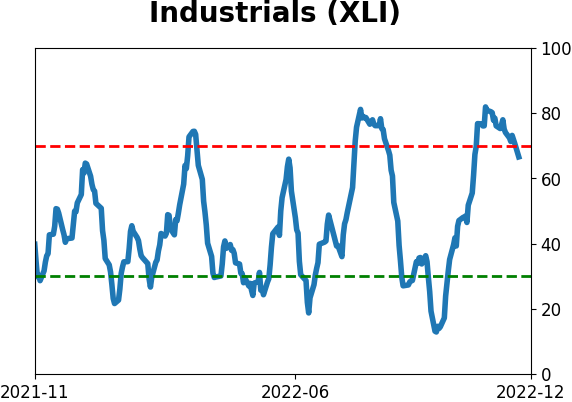
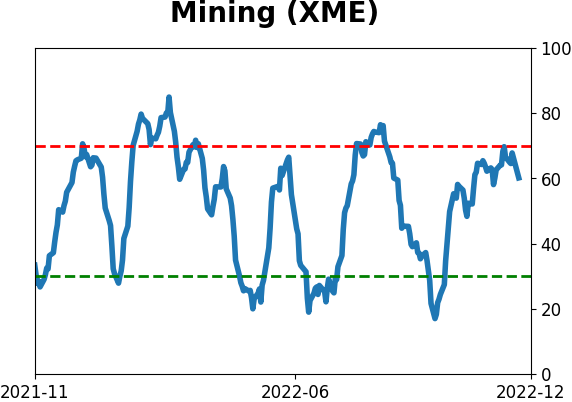
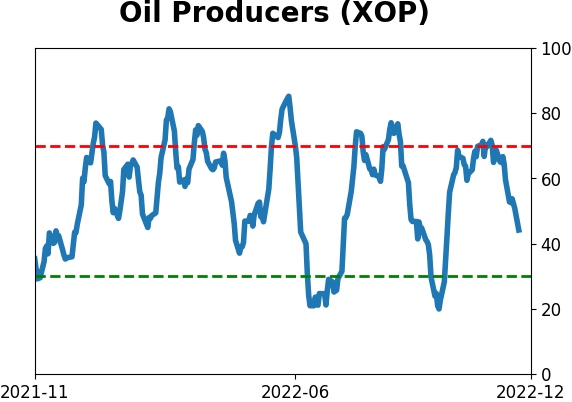
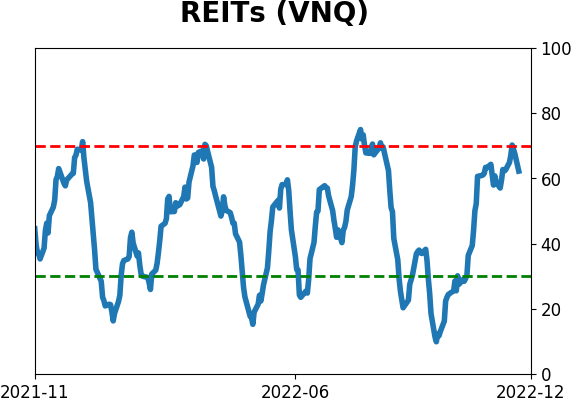
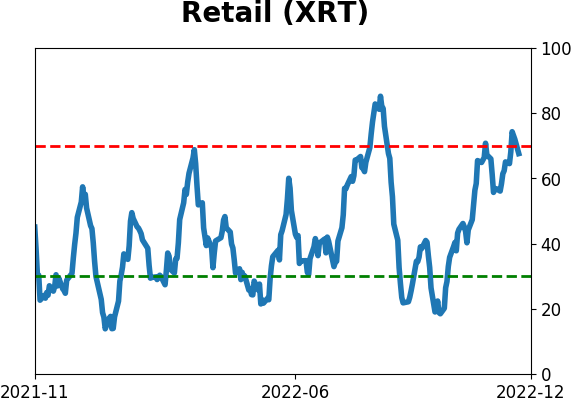
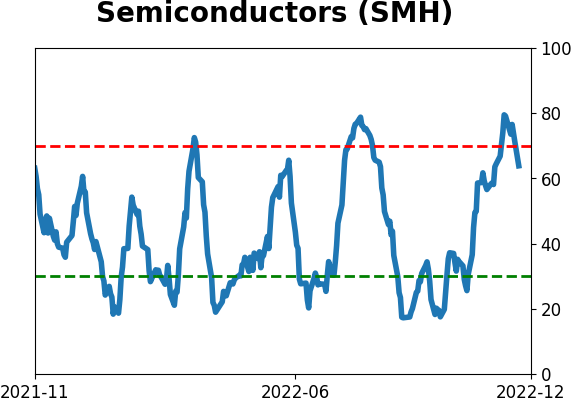
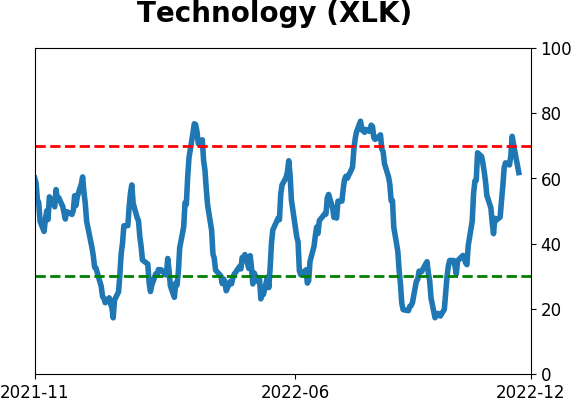
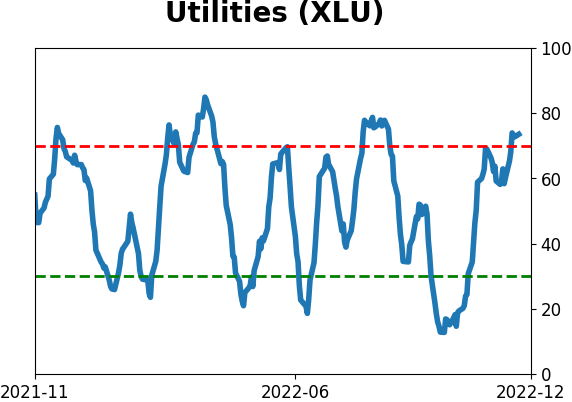
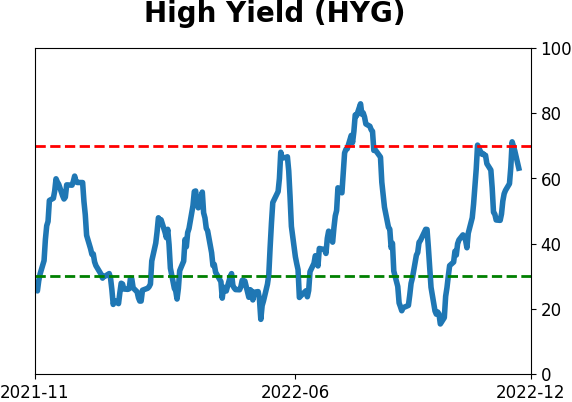
Sector ETF's - 10-Day Moving Average
|
|
|
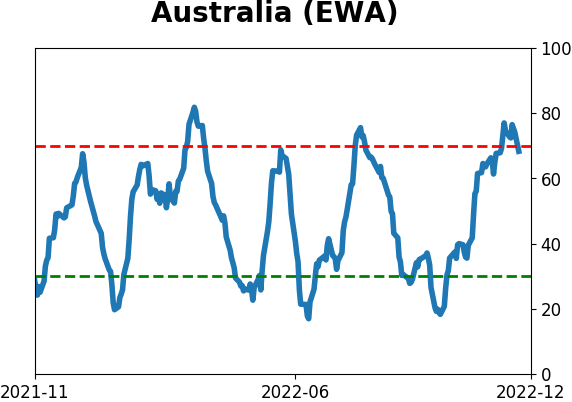
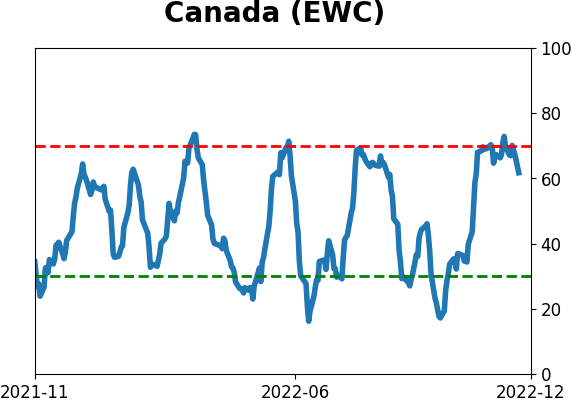
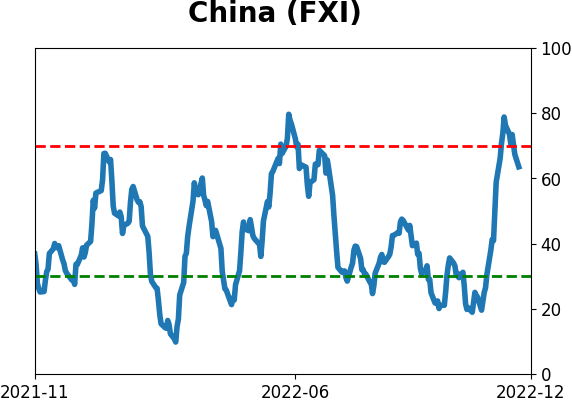
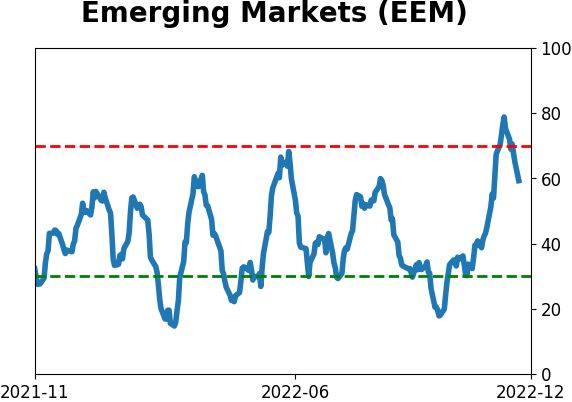
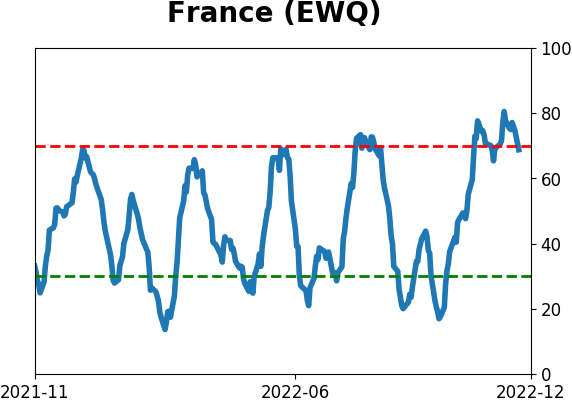
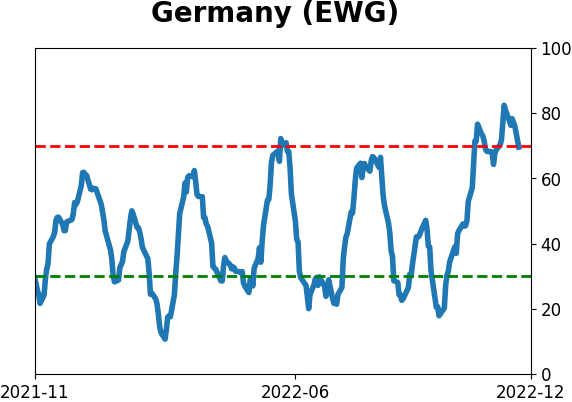
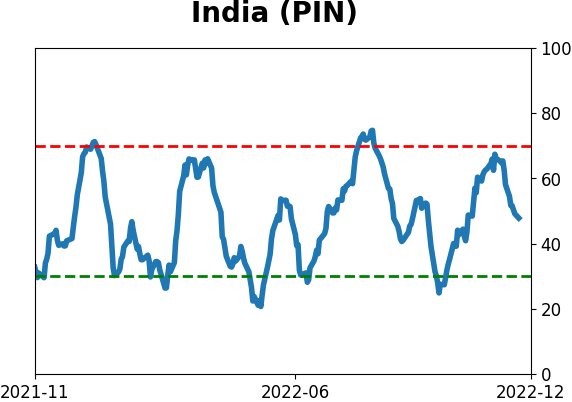
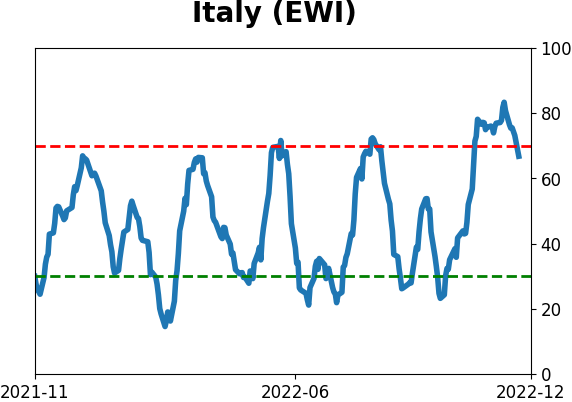
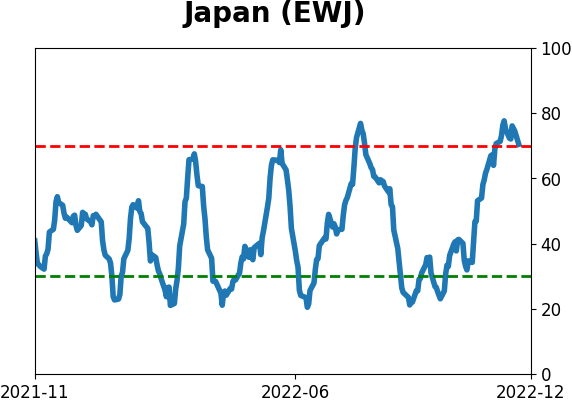
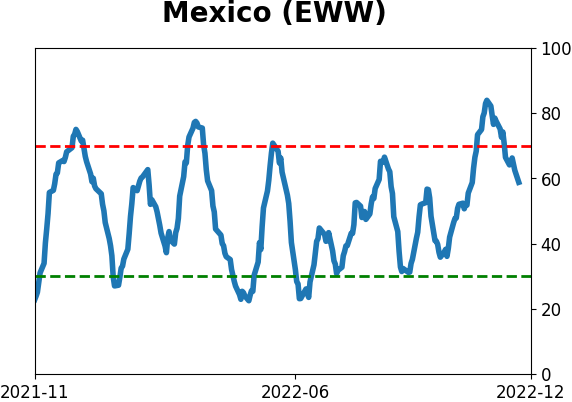
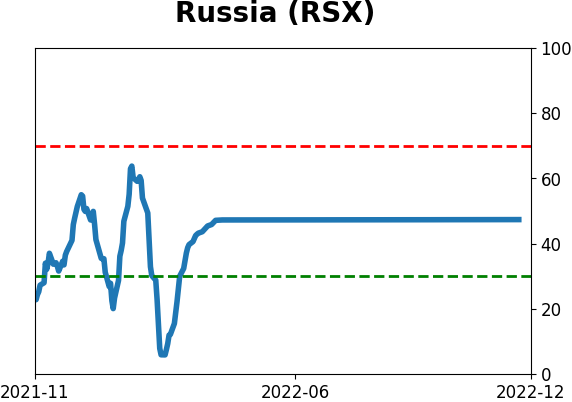
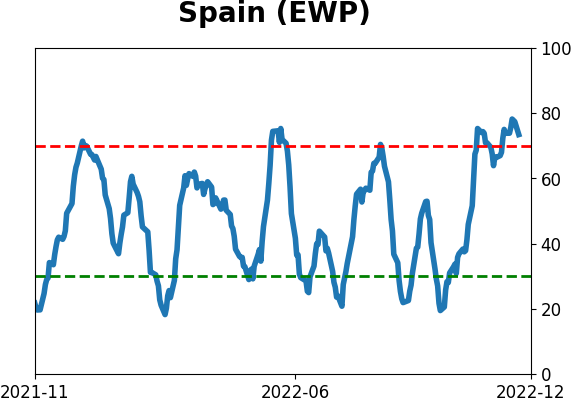
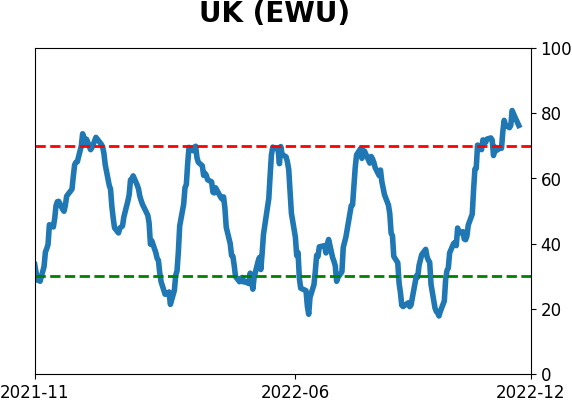
Country ETF's - 10-Day Moving Average
|
|
|
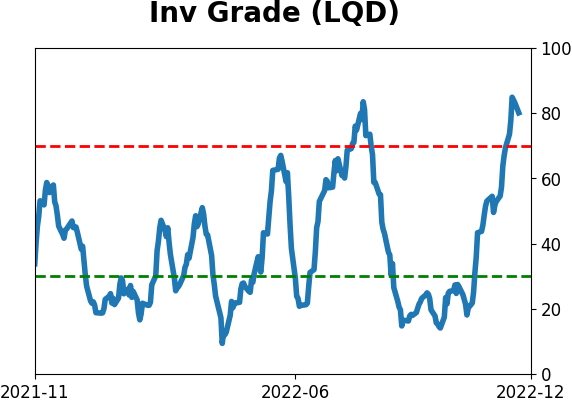
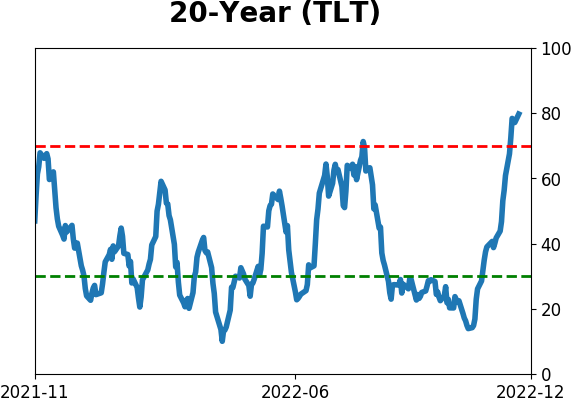
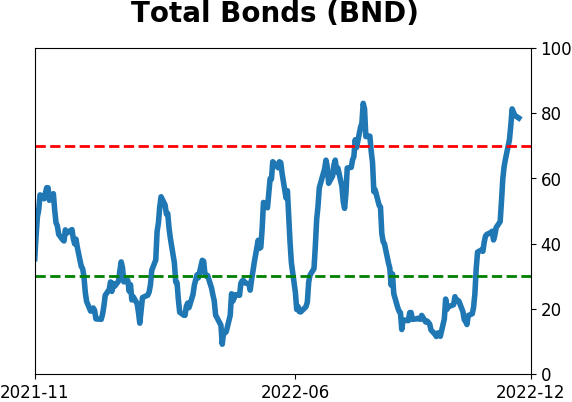
Bond ETF's - 10-Day Moving Average
|
|
|
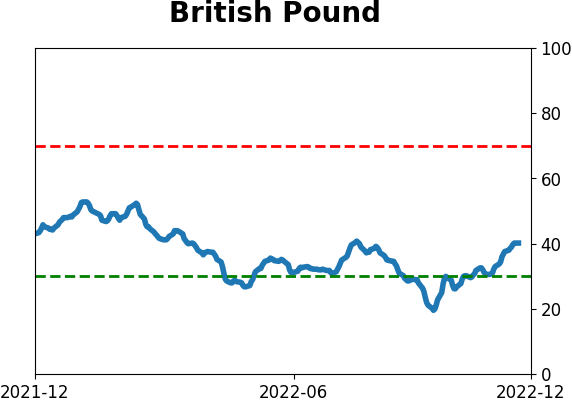
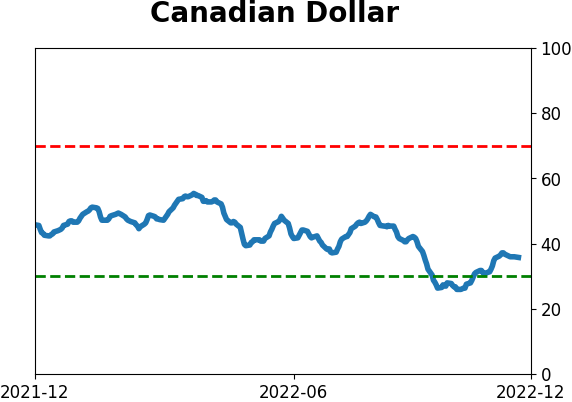
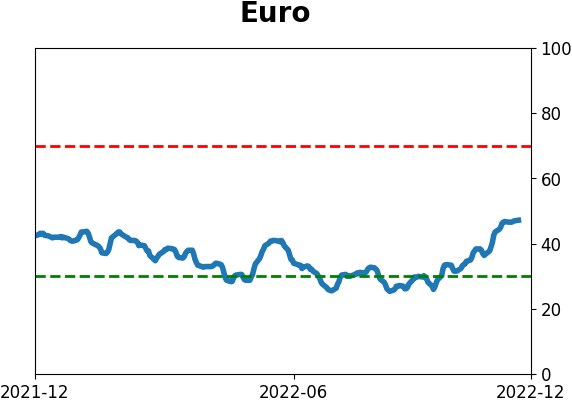
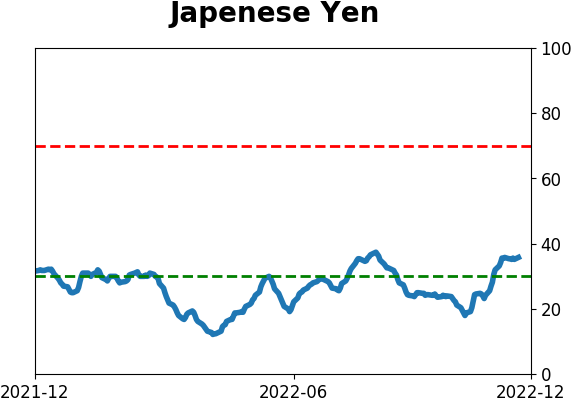
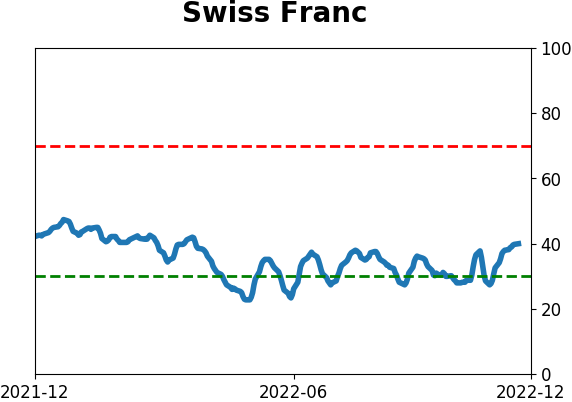
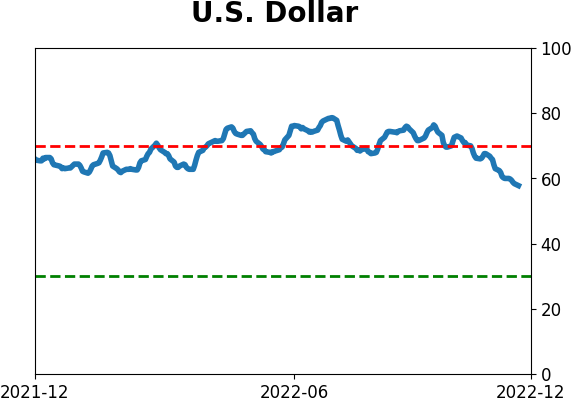
Currency ETF's - 5-Day Moving Average
|
|
|
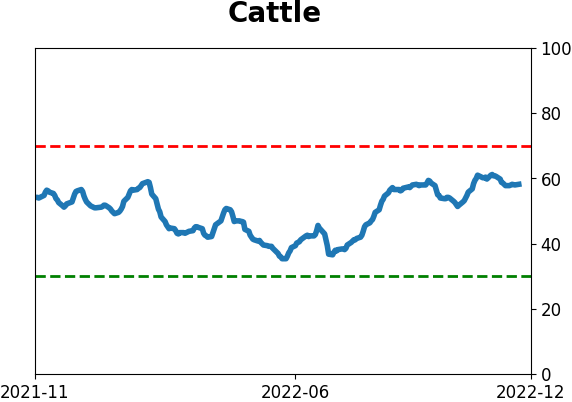
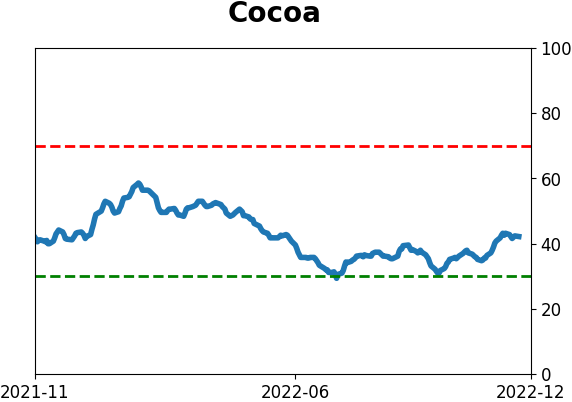
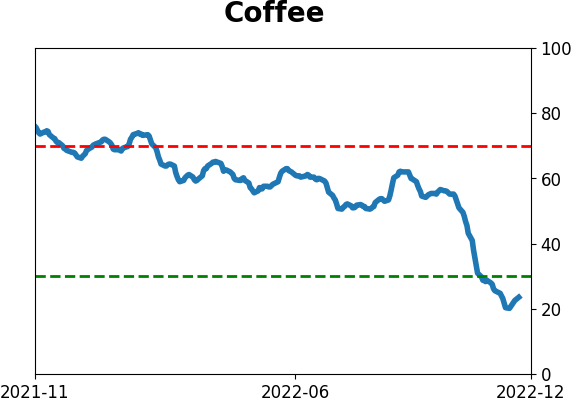
Commodity ETF's - 5-Day Moving Average
|
|