
Stocks split again as investors pull back on leverage

Key points:
- The equity market is split, with too many securities either at 52-week highs or 52-week lows
- Forward returns after split market conditions tend to be terrible
- Investors are also pulling back on margin debt after a historic surge
Once again, a massively split market
Investors became extremely pessimistic by mid-March, while the "smart money" became the most confident in a rally in years. In the weeks following those extremes, buyers entered in force and triggered several breadth thrusts and impressive internal momentum.
Those developments have a long and compelling history of preceding even more gains in the months ahead.
Not everything is hearts and roses. There are some worries, including the fact that the market environment hasn't been able to turn healthy. The best thrusts tend to see little give-back from the initial surge, while this time, we've seen a persistent leak almost from the get-go.
One of the requirements for a healthy environment is that 52-week highs on the NYSE have to outnumber 52-week lows. That's not happening with any consistency. Not only that, there is currently a remarkable split in the market, with too many securities at both extremes.
The HiLo Logic Index was above 4% again on Friday, meaning more than 4% of NYSE issues hit a 52-week high, and more than 4% of them fell to a 52-week low. That is not what bulls want to see.
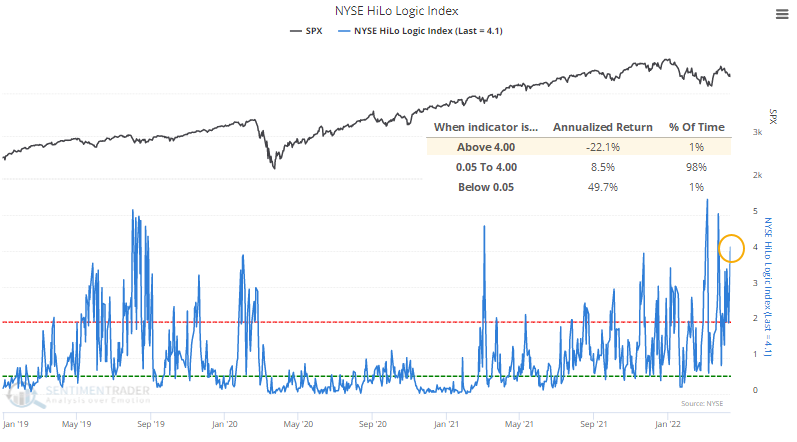
When the HiLo Logic Index was above 4% since 1965, in the top 1% of all days, the S&P 500's annualized return was a horrid -22.1% p.a. (per annum, or percent annualized). When it was at the opposite extreme, the S&P averaged +49.7%.
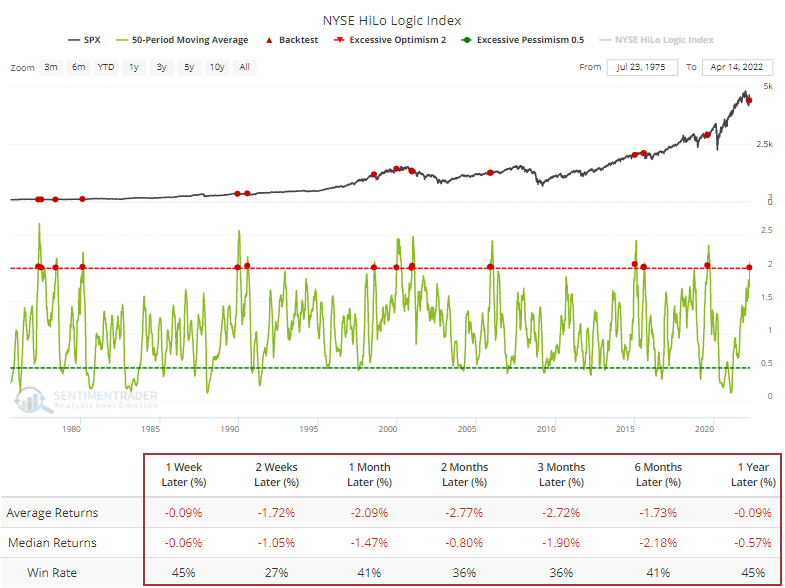
This has been a familiar problem for months. The 50-day average of the HiLo Logic has now climbed above 2%, and the Backtest Engine shows that when the 50-day average got this high, three months later, the S&P 500 was higher only 8 of 22 times. Returns across every time frame were terrible.
We can't just dismiss this because interest-rate sensitive securities dominate the new lows list. Surely, there are a lot of bond funds and related issues that are struggling mightily.
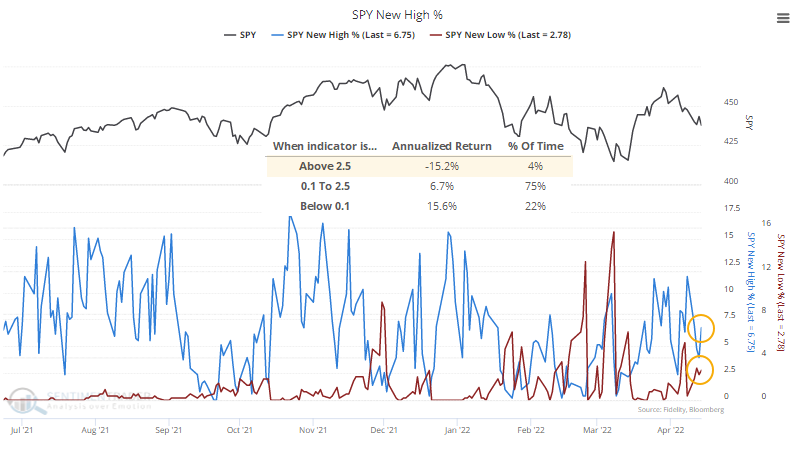
Even within the S&P 500 itself, more than 2.5% of stocks were either at a 52-week high or a 52-week low on Friday. Since 1928, the S&P's returns were terrible when this was the case, with a -15.2% annualized return.
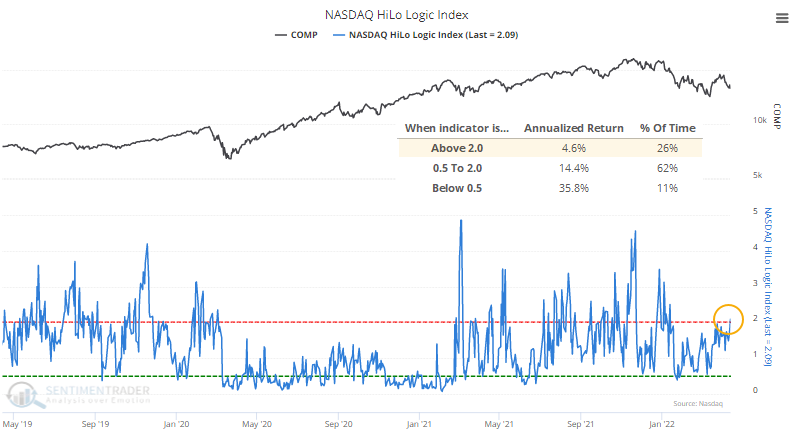
The problem isn't as pronounced on the Nasdaq exchange, but even there, the HiLo Logic Index pushed above 2% on Friday. This has preceded well below-average annualized returns for the Nasdaq Composite since 1984.
Investors are pulling back on big bets
At the same time that the market is splitting between winners and losers, investors are pulling back on leverage.
For the first time in more than a year, investors carry less margin debt than they did a year ago. These are borrowings that use the value of equity holdings as collateral. Investors can use these borrowed funds for anything they like but typically use them to buy even more securities.
The only two times in 25 years that the year-over-year change in debt went from above 50% to below zero were during the beginning phases of protracted bear markets. You'll see this chart everywhere because it's very clear and very bearish.

It's worth at least acknowledging the last two cycles and the dreaded outcomes. But margin debt as an indicator has only been effective in recent decades (and even then, it's mostly just coincident with the movement in the S&P 500). When we look at the complete history, these boom-bust cycles are not as compelling.
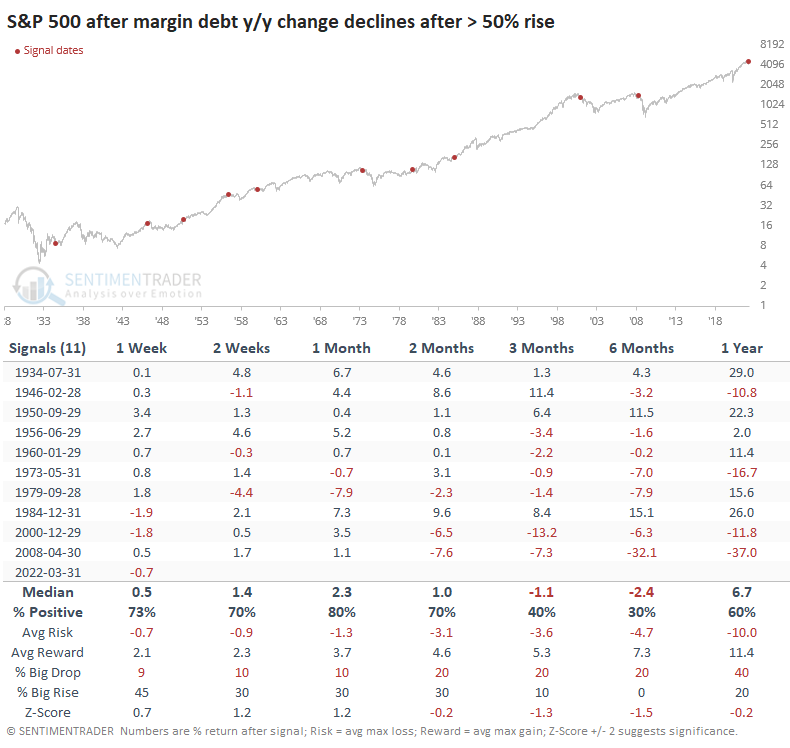
Since the 1930s, when margin debt rose more than 50% from the prior year and then suffered a year-over-year decline, the S&P's returns in the months ahead were inconsistently weak. They were strong up to two months later, then quite weak over three to six months. It essentially had no impact in 1934, 1950, and 1984, but all the others saw losses six months later.
What the research tells us...
Until the last week and a half, buyers were doing what they typically do - storming back after becoming too panicked. But risk appetite has receded quickly since then, and the self-reinforcing nature of sentiment is on the backslide again. This is not bullish. The drop in margin debt is a modest concern though I don't give it a lot of weight. I'm much more worried about the heavily split market, and I can't see the logic in becoming too optimistic as long as the HiLo Logic indexes remain so high.