Headlines
|
|
Margin debt rises at a furious pace as net worth drops to record low:
Margin debt rose again and is at record highs. But it's growth is moderating, especially relative to the S&P 500. Investors' net worth is at a record low but our confidence in this as a warning is low.
Bottom Line:
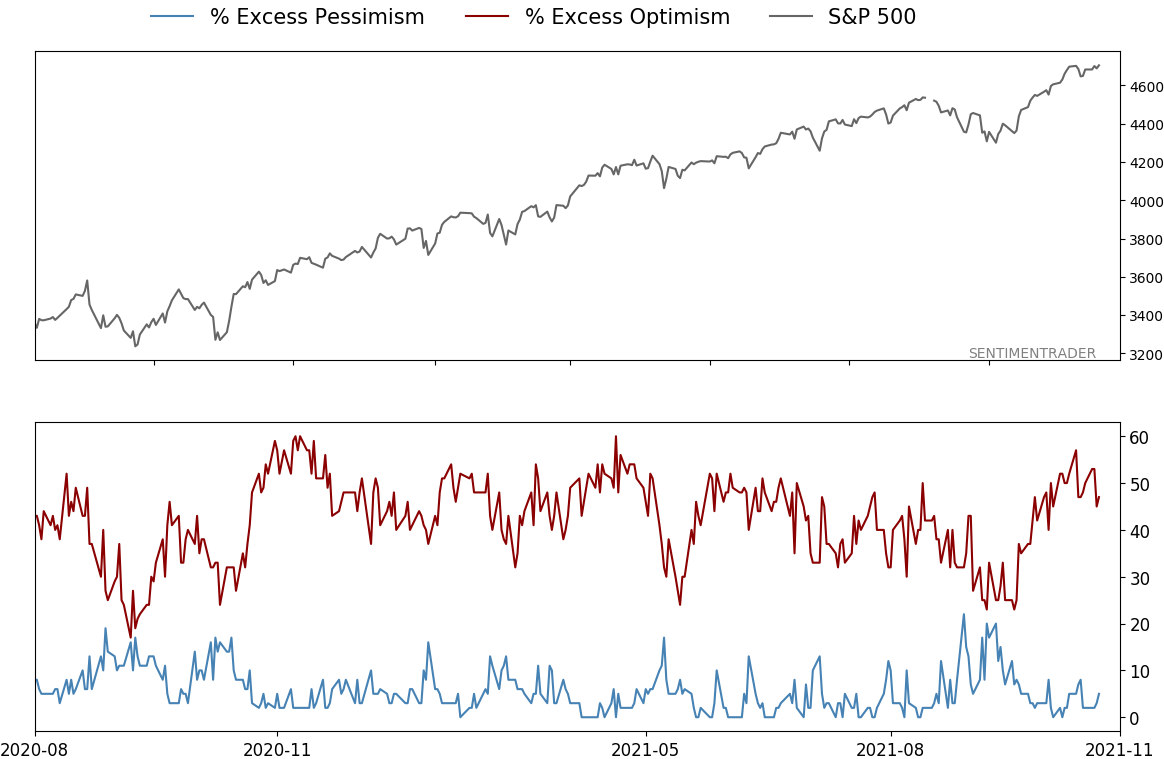
STOCKS: Hold By early October, sentiment had reset. Several important momentum streaks ended, which has brought in buyers in the past, and seasonality turned positive. We're now seeing signs that sentiment has quickly shifted, especially among options traders. It's gotten to an extreme that has preceded weaker-than-average returns.
BONDS: Hold In late October, sentiment on bonds - from Treasuries to corporates - entered pessimistic territory. It's now starting to recover, with some quick moves in corporate bonds. We'll see if those bonds, in particular, can hold recent gains.
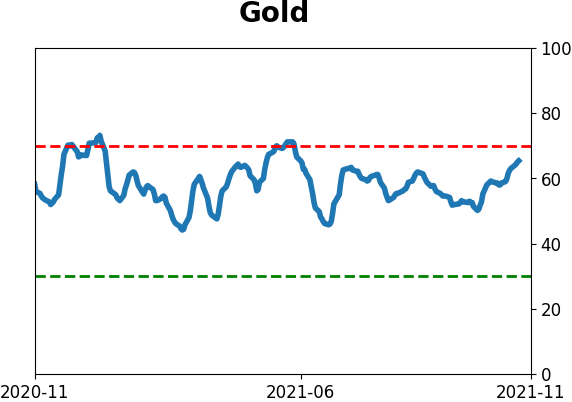
GOLD: Hold
Gold and miners were rejected after trying to recover above their 200-day averages in May. Some oversold extremes in breadth measures among miners triggered in late September, and they've recovered a bit since then. The group still has some proving to do.
|
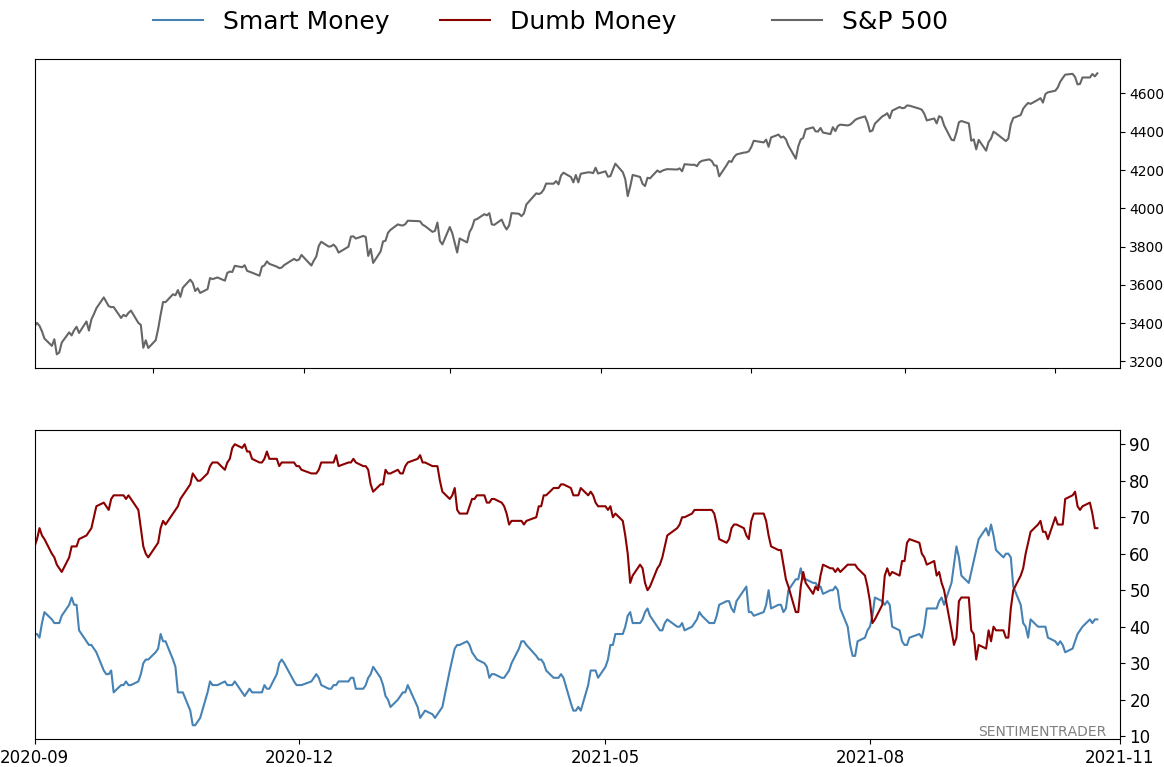
Smart / Dumb Money Confidence
|
Smart Money Confidence: 42%
Dumb Money Confidence: 67%
|
|
Risk Levels
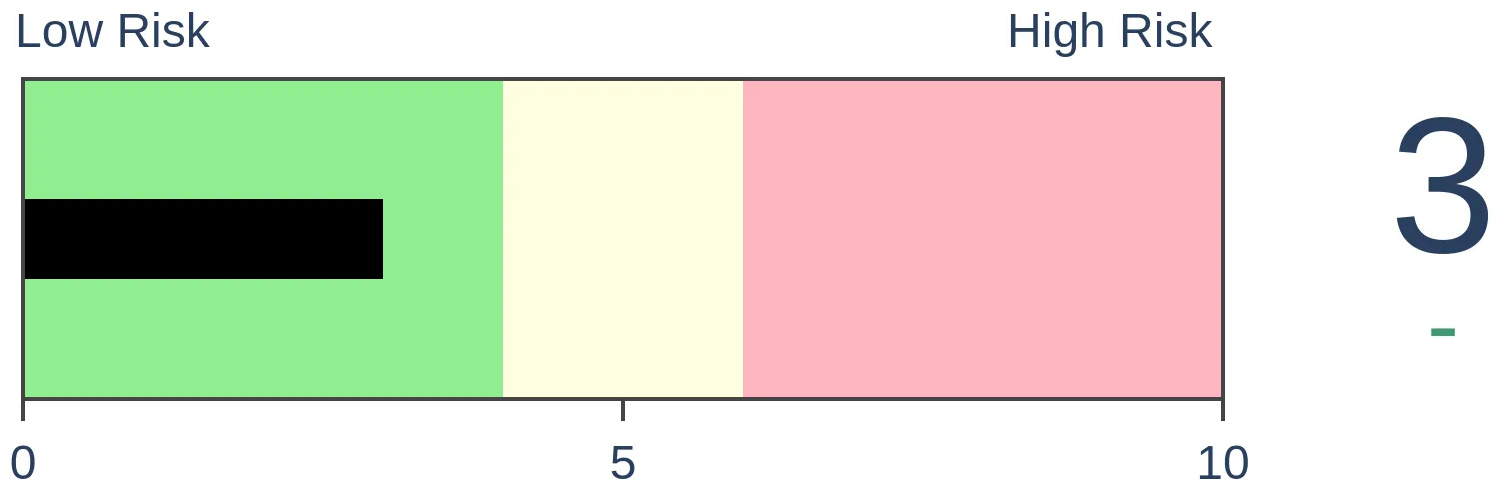
Stocks Short-Term
|
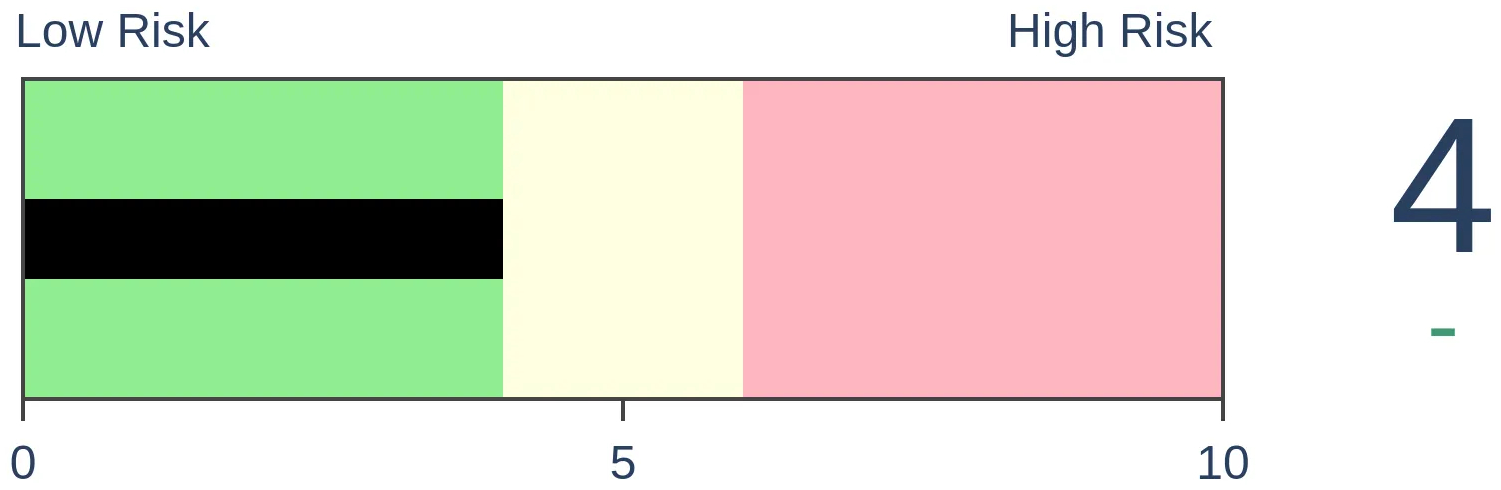
Stocks Medium-Term
|
|
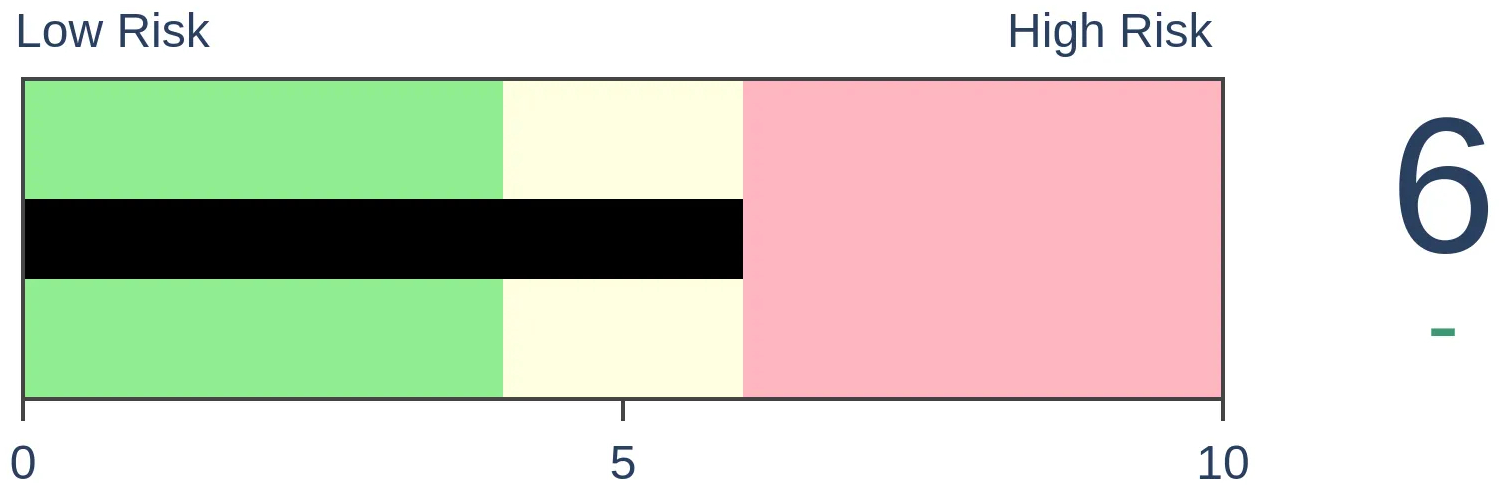
Bonds
|
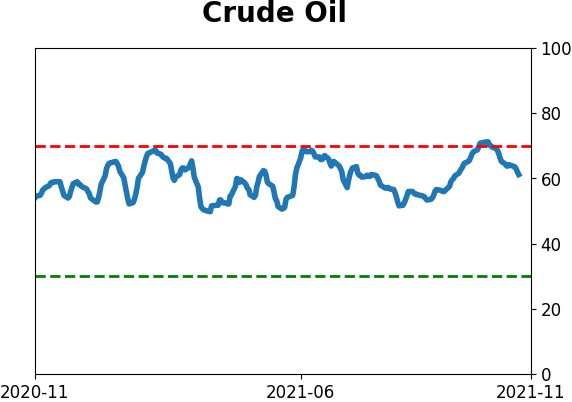
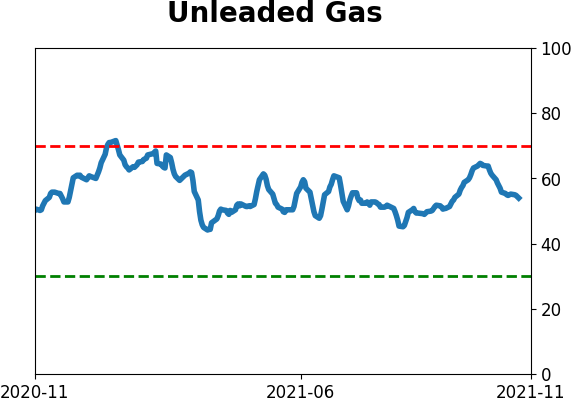
Crude Oil
|
|
Gold
|
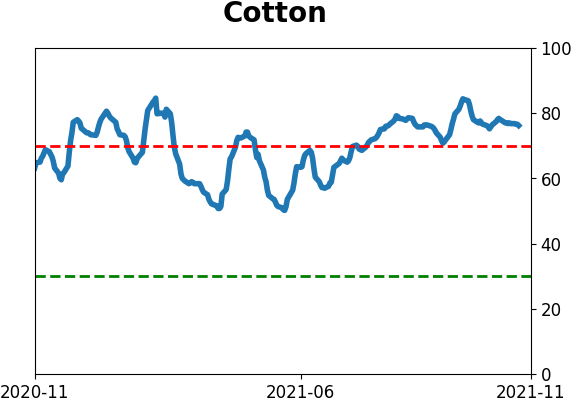
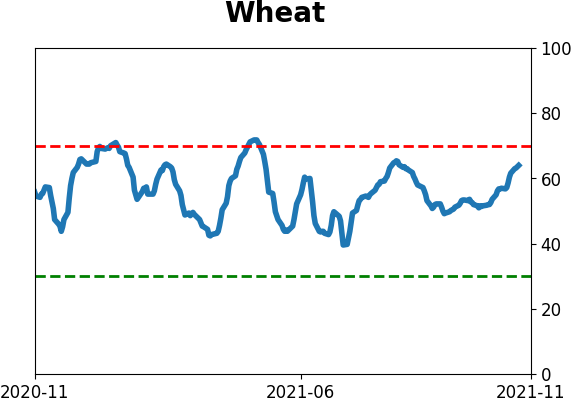
Agriculture

|
|
Research
By Jason Goepfert
BOTTOM LINE
Margin debt rose again and is at record highs. But it's growth is moderating, especially relative to the S&P 500. Investors' net worth is at a record low but our confidence in this as a warning is low.
FORECAST / TIMEFRAME
SPY -- Down, Long-Term
|
Key points:
- Margin debt has soared to record highs, with a troubling rate of growth
- Investors' net worth has dropped to a record low
- This should be a long-term negative, with the caveat that it's been a warning for much of 2021
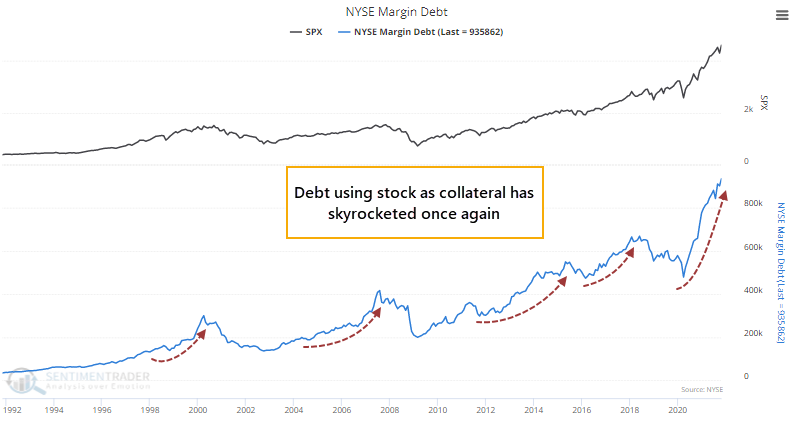
Debt pledged against stock holdings soars again
One of the perma-bears' favorite boogeymen is margin debt, the dollar amount of loans taken out against existing stock holdings. Investors can use these loans to buy more stock, withdraw cash to pay for a kid's education, a new car, or whatever they like. Regardless of the reason, when investors feel confident enough to borrow using public stock as collateral, it's a sign of complacency.
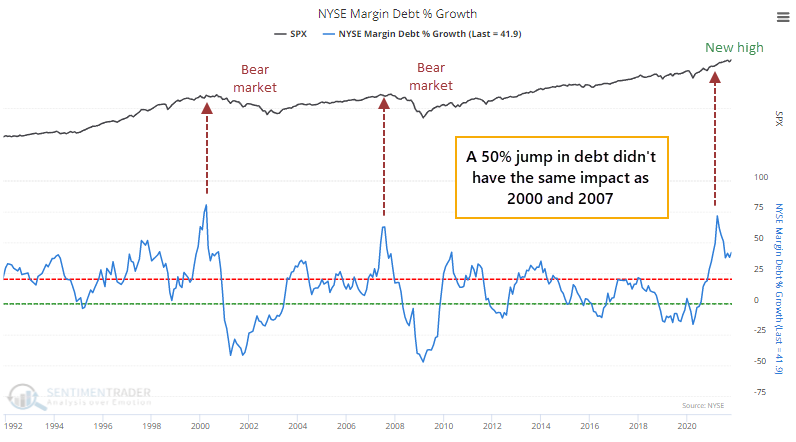
Lately, that complacency has gone parabolic, with margin debt reaching another record high.
Even more troubling, its rate of growth exceeded 50% in the spring, which is what we saw at the speculative peaks in 2000 and 2007. We looked at this in April, along with other signs of excessive complacency. And it didn't matter one whit, at least for indexes like the S&P 500. Many speculative areas took a hit during the summer, and the overall advance/decline line flattened, but no real lasting damage was done.
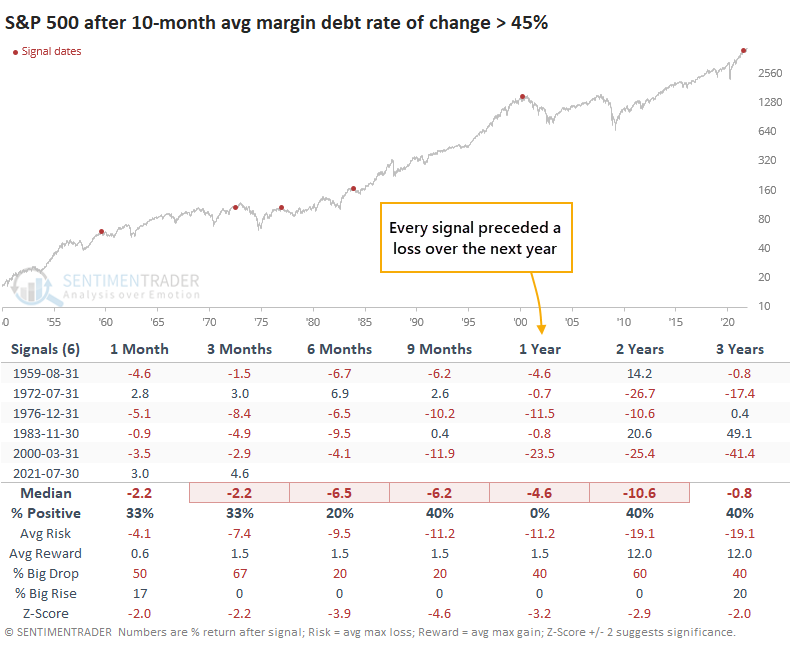
It's very rare to see the rate of growth in debt stay so high over such a prolonged period. The 10-month average rate of change is now approaching 50%.
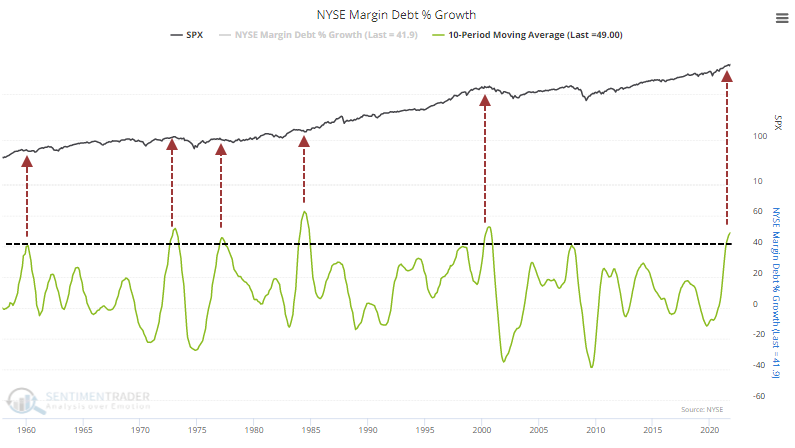
The few other times investors borrowed at such a furious rate, the S&P 500 fell back over the next year each time. It passed this level in July, but again, no impact so far.
The growth in debt had outpaced the growth in the S&P 500 by more than 20%. That's what we saw in 2000 and 2007, as well. And yet, here we are at new highs.

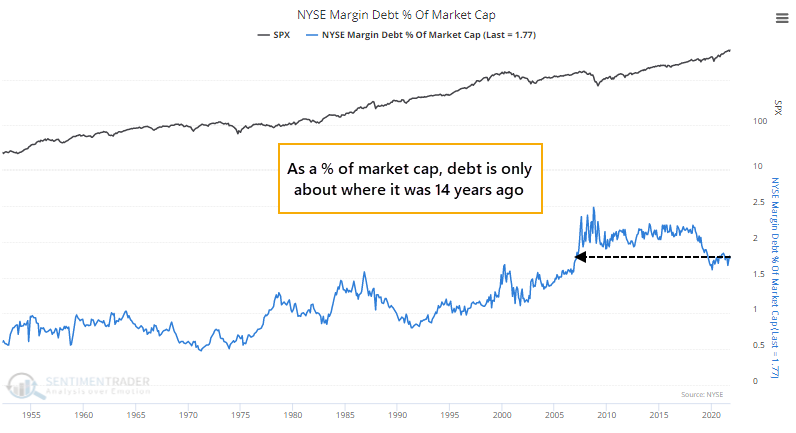
On a relative basis, debt is fine but net worth is not
The value of the U.S. stock market has grown exponentially along with debt, so as a percentage of market capitalization, debt isn't all that extreme. It's still about where it was 15 years ago. For whatever reason, this has never been a particularly effective indicator either way.
At the same time that margin debt has grown, free cash levels have fallen off. That has pushed investors' net worth, or available cash, to negative $500 billion, a record low. As a percentage of market cap, it's just above the prior low.
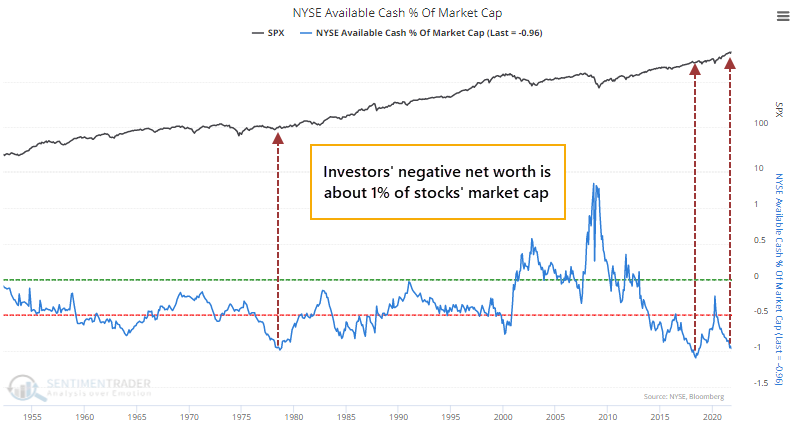
When it reached this level in 1978, stocks didn't go anywhere for more than 9 months. When it did so again at the start of 2018, stocks entered one of their rockiest patches in the past decade.
What the research tells us...
Margin debt is a favorite go-to indicator for those who consistently warn about market excesses. For most of the past 5 years, there was no evidence to justify the warnings. That changed during the spring of 2021, but so far it has little, if any, impact on stocks. On a long-term basis, the growth in debt, against relatively little cash holdings, appears to be a negative, with the caveat that other warning signs this year haven't preceded their typical weak performance in indexes like the S&P 500.
Active Studies
| Time Frame | Bullish | Bearish | | Short-Term | 2 | 0 | | Medium-Term | 11 | 0 | | Long-Term | 13 | 6 |
|
Indicators at Extremes
Portfolio
| Position | Description | Weight % | Added / Reduced | Date | | Stocks | RSP | 10.7 | Added 6.4% | 2021-10-01 | | Bonds | 32.7% BND, 7.1% SCHP | 39.8 | Added 8.3% | 2021-10-26 | | Commodities | GCC | 2.4 | Reduced 2.1%
| 2020-09-04 | | Precious Metals | GDX | 4.6 | Reduced 4.2% | 2021-05-19 | | Special Situations | 9.8% KWEB, 4.7% XLE, 2.9% PSCE | 17.3 | Added 9.78% | 2021-10-01 | | Cash | | 24.1 | | |
|
Updates (Changes made today are underlined)
Much of our momentum and trend work has remained positive for several months, with some scattered exceptions. Almost all sentiment-related work has shown a poor risk/reward ratio for stocks, especially as speculation drove to record highs in exuberance in February. Much of that has worn off, and most of our models are back toward neutral levels. There isn't much to be excited about here. The same goes for bonds and even gold. Gold has been performing well lately and is back above long-term trend lines. The issue is that it has a poor record of holding onto gains when attempting a long-term trend change like this, so we'll take a wait-and-see approach. Momentum has ebbed quickly in recent weeks, and nearing oversold levels in some indicators. This can be a dangerous area, with a lot of short-term volatility, but we'd be more inclined to add medium- to long-term exposure rather than sell on much more of a decline, thanks to already rock-bottom exposure. Other areas look more attractive, including some overseas markets. RETURN YTD: 11.3% 2020: 8.1%, 2019: 12.6%, 2018: 0.6%, 2017: 3.8%, 2016: 17.1%, 2015: 9.2%, 2014: 14.5%, 2013: 2.2%, 2012: 10.8%, 2011: 16.5%, 2010: 15.3%, 2009: 23.9%, 2008: 16.2%, 2007: 7.8%
|
|
Phase Table
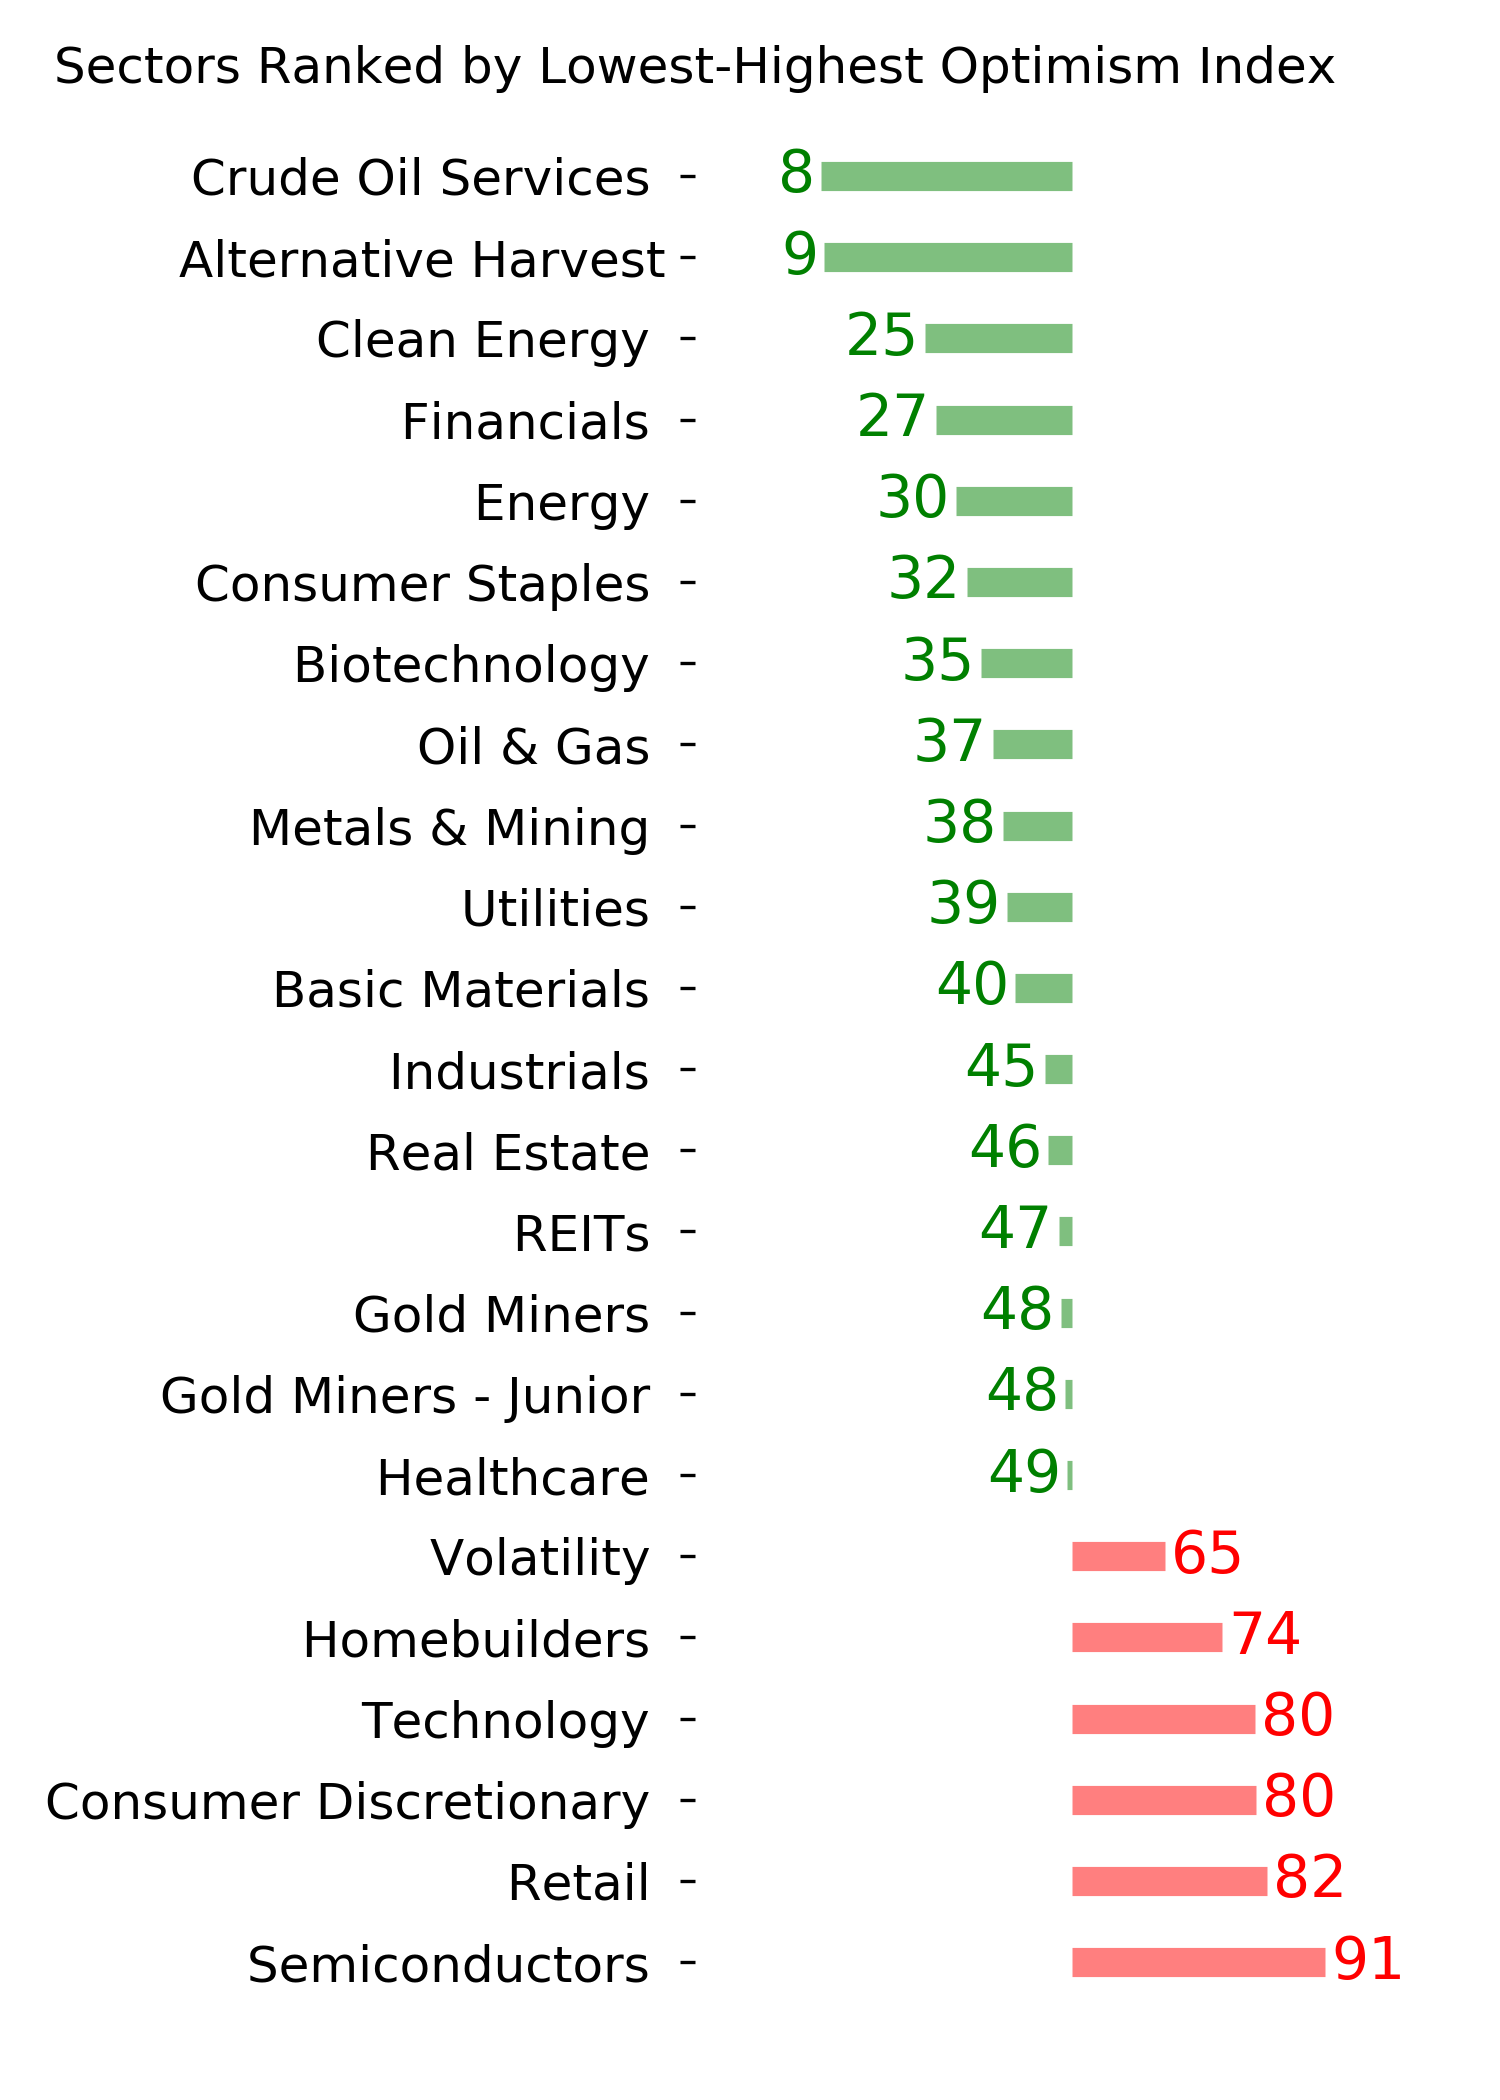
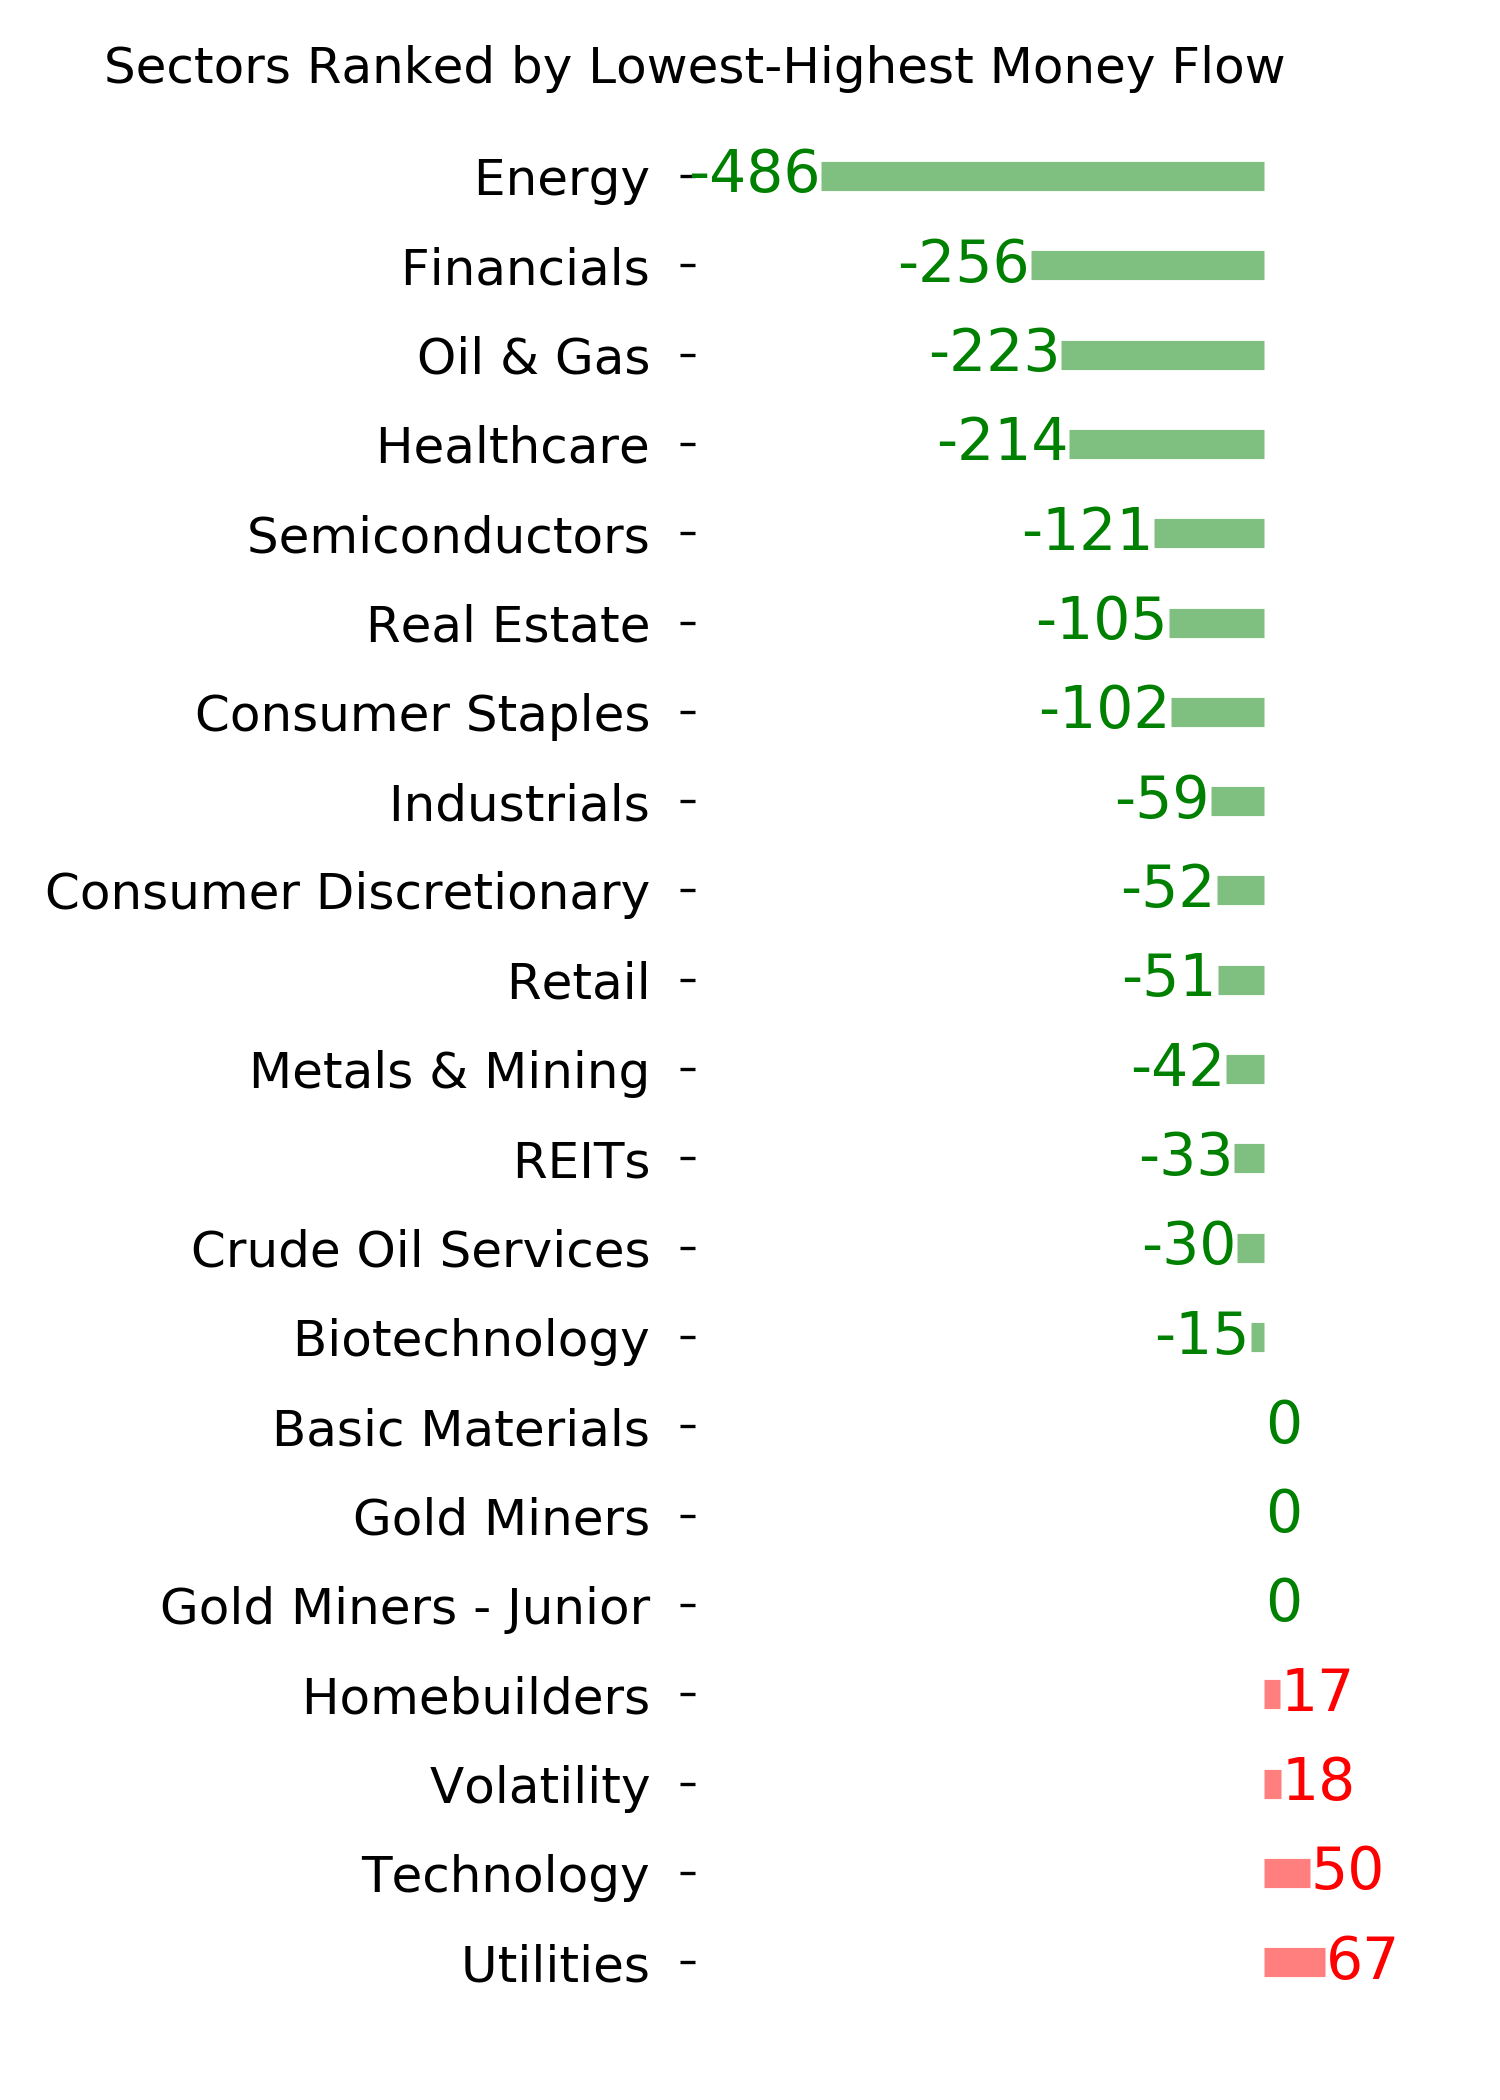
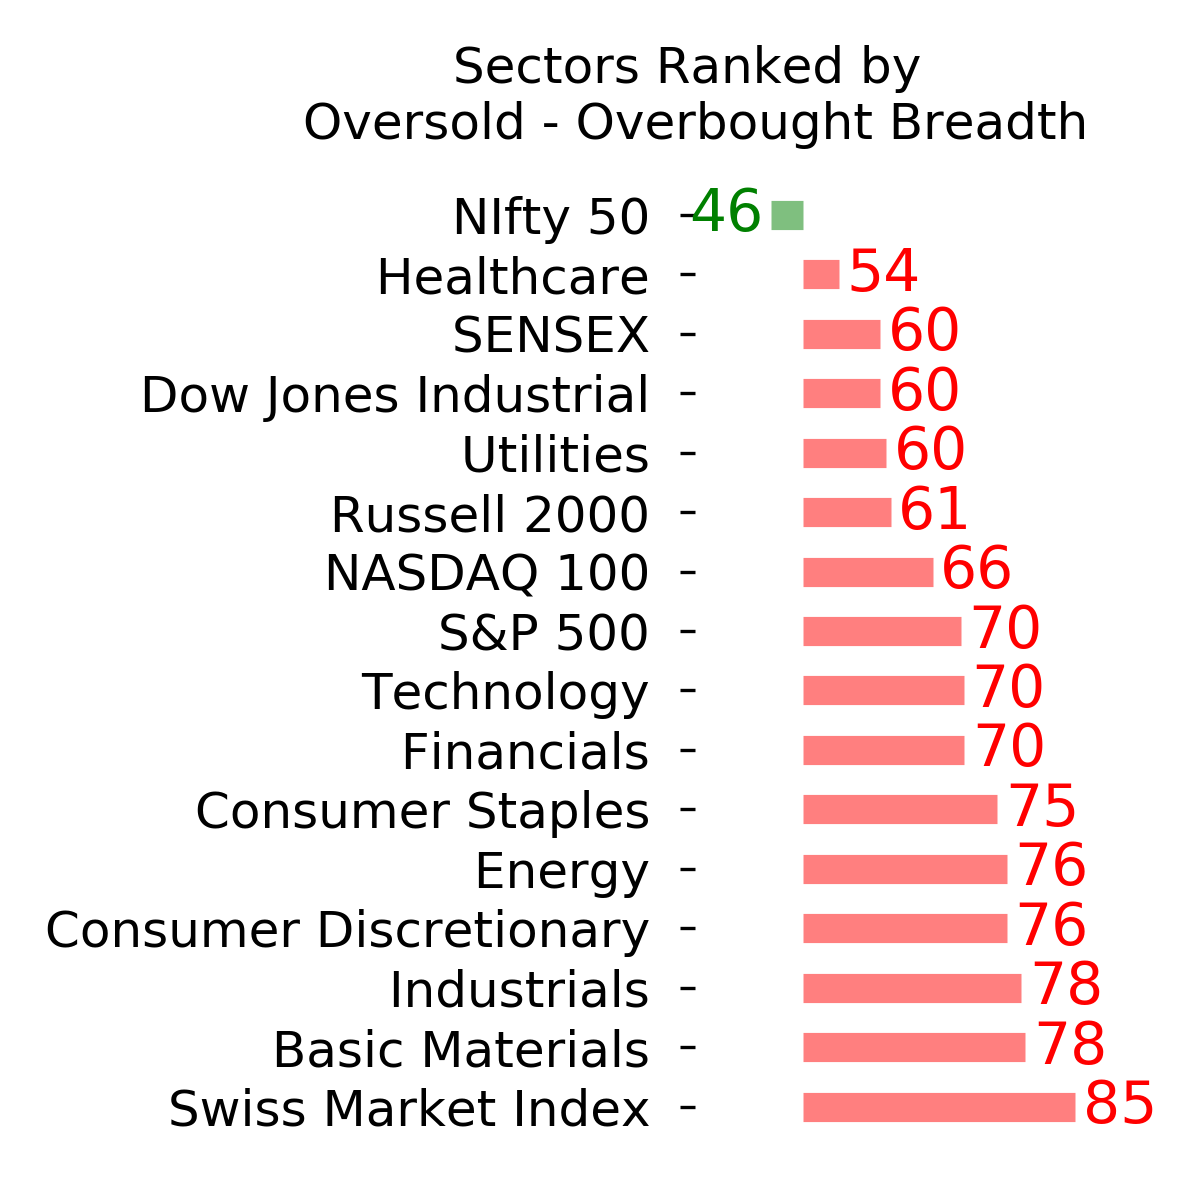
Ranks
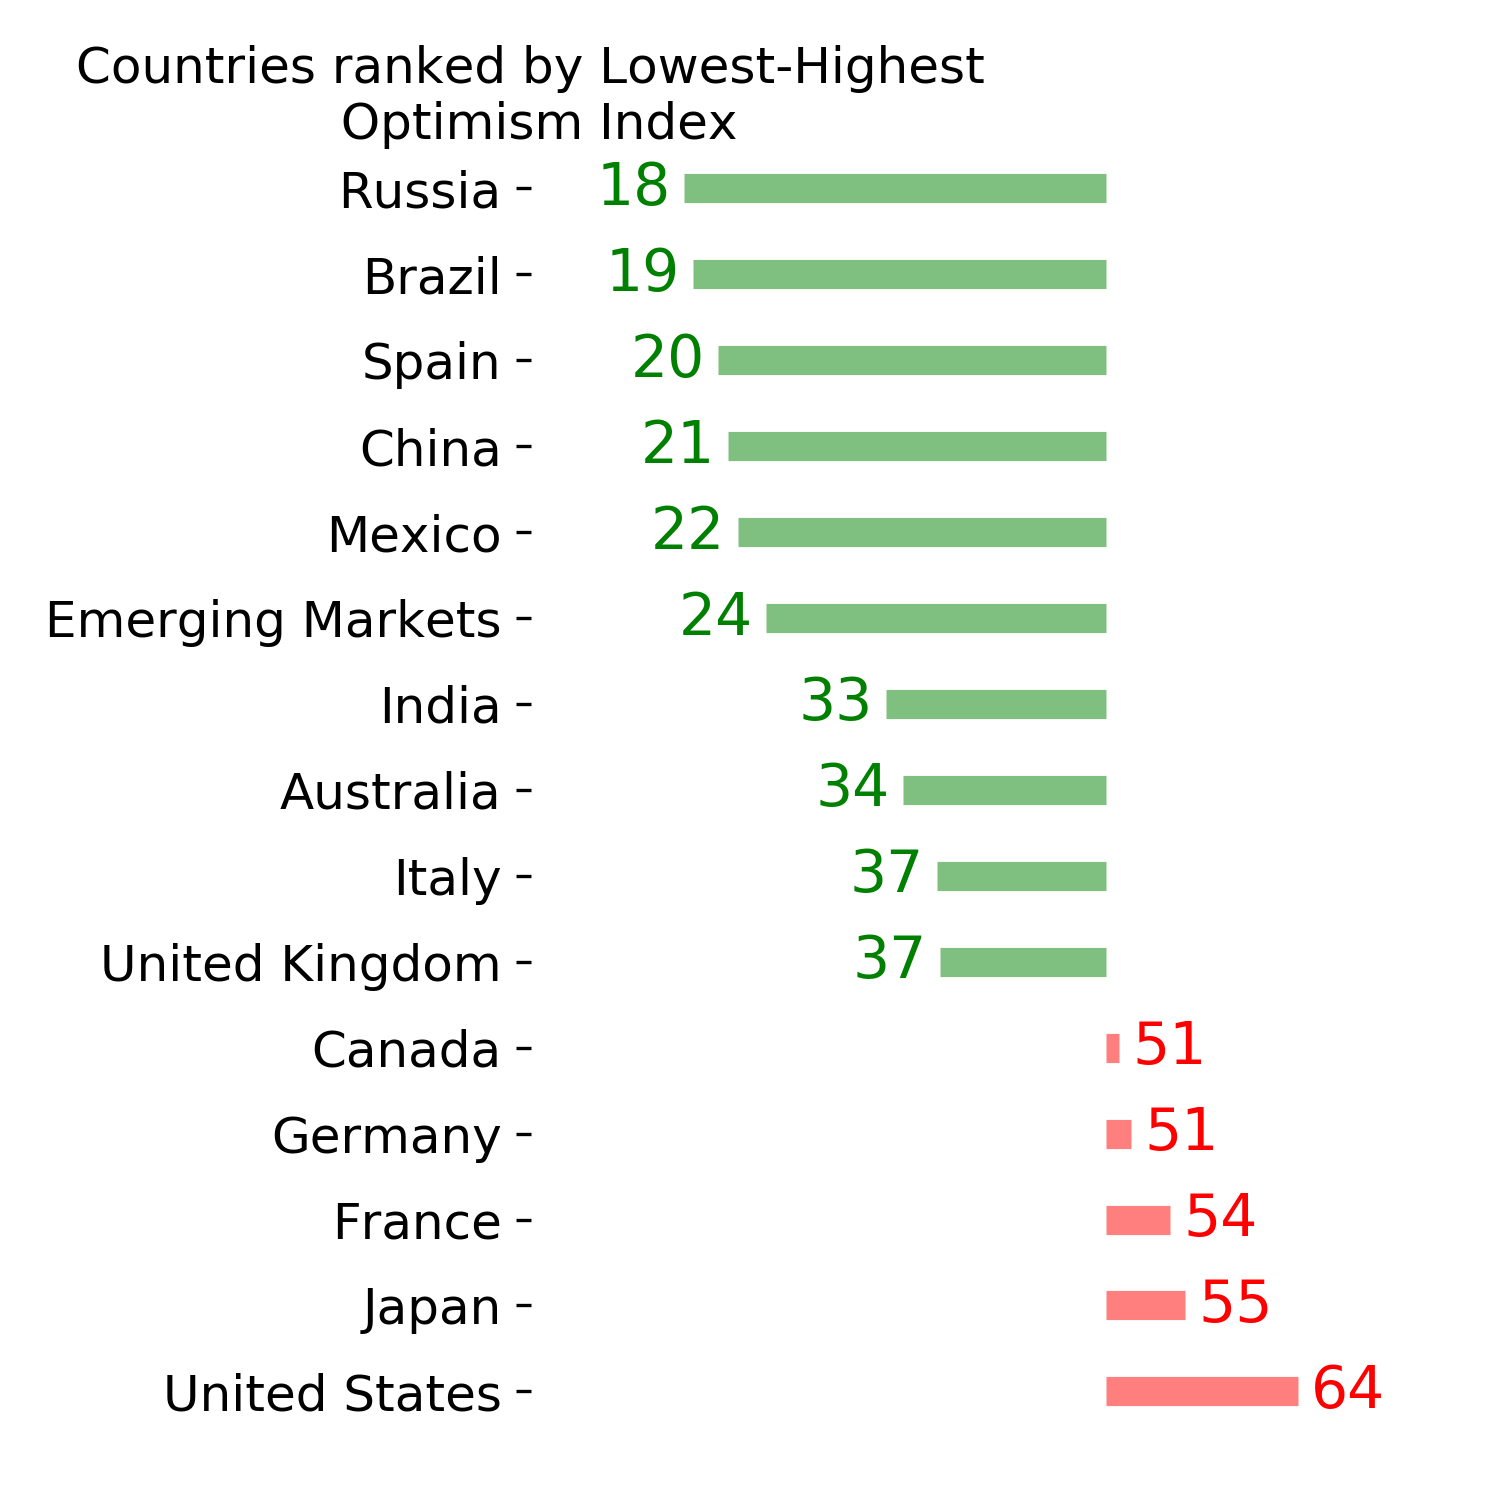
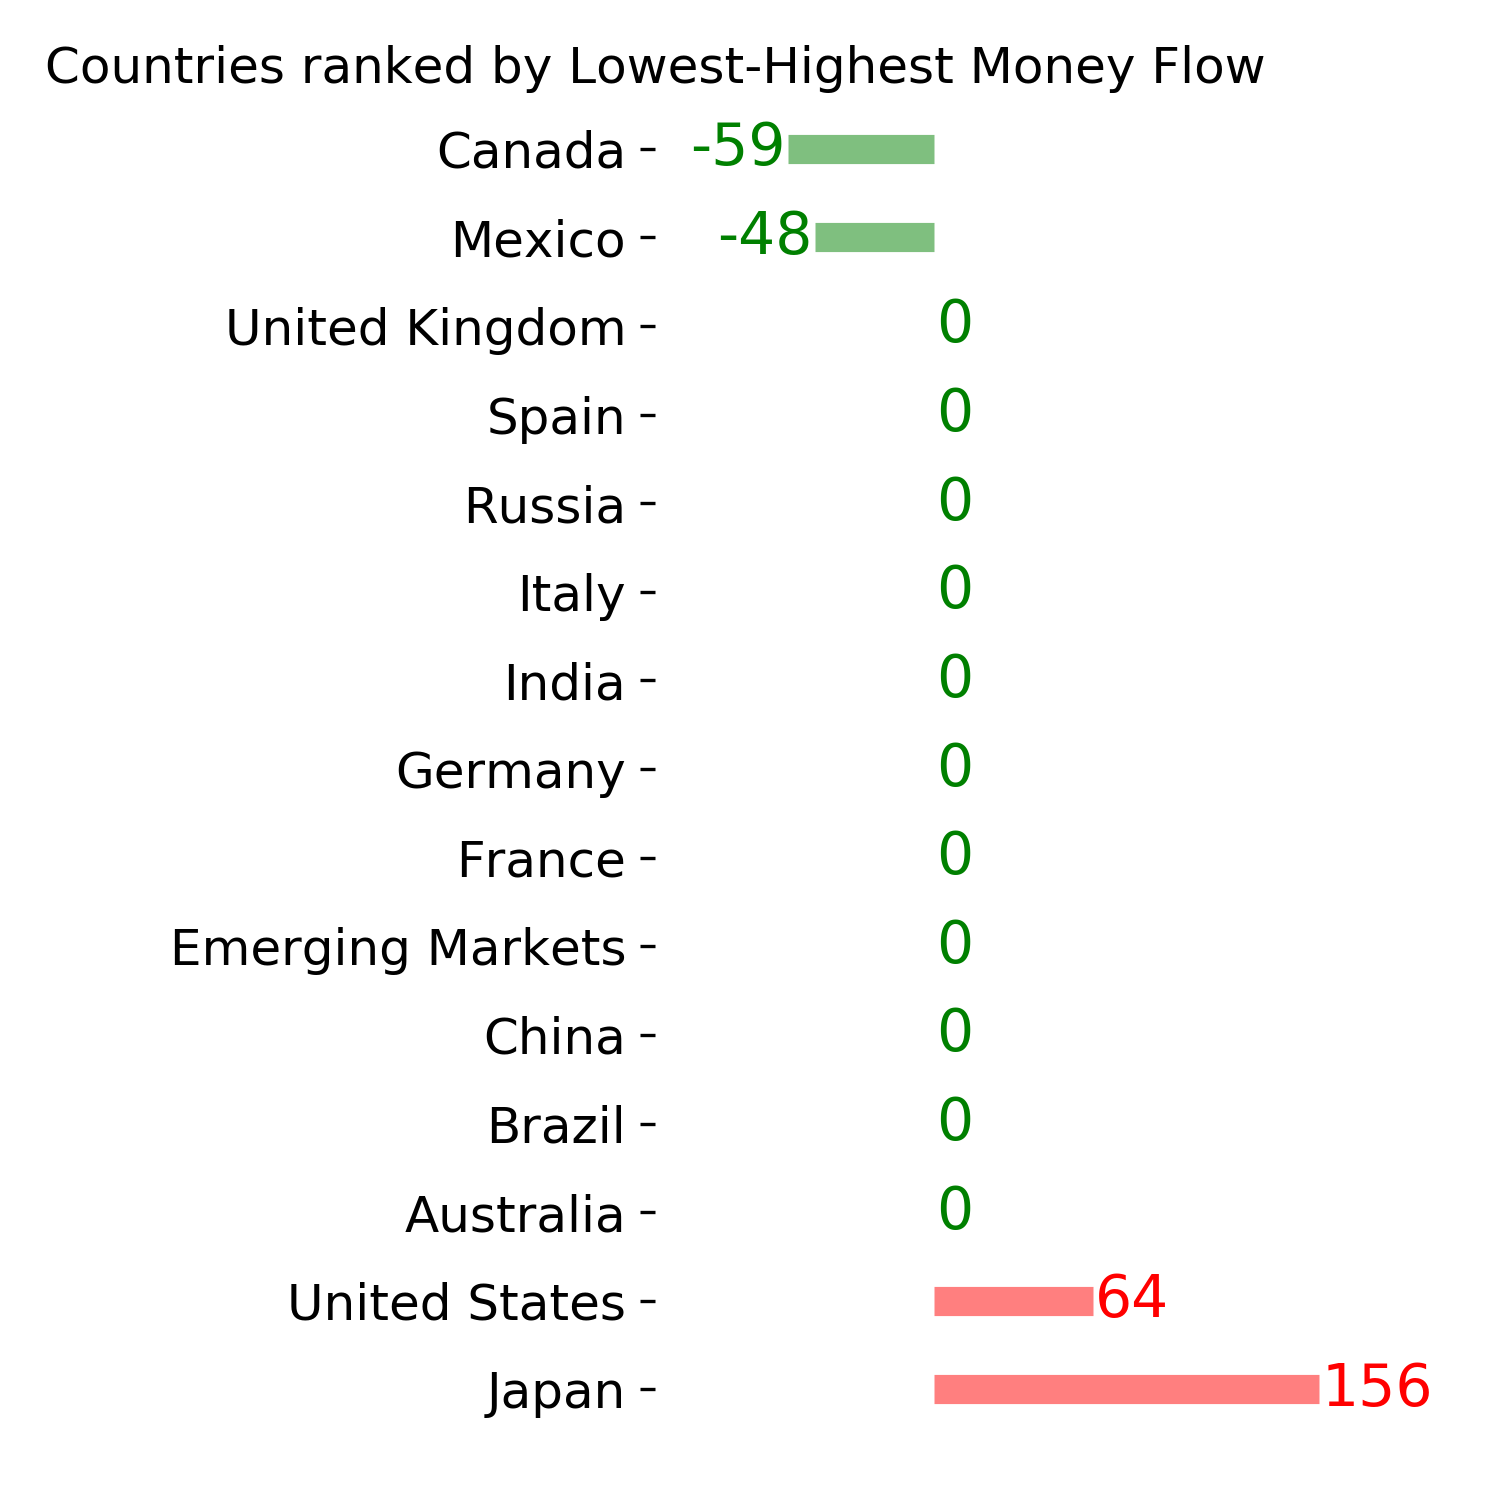
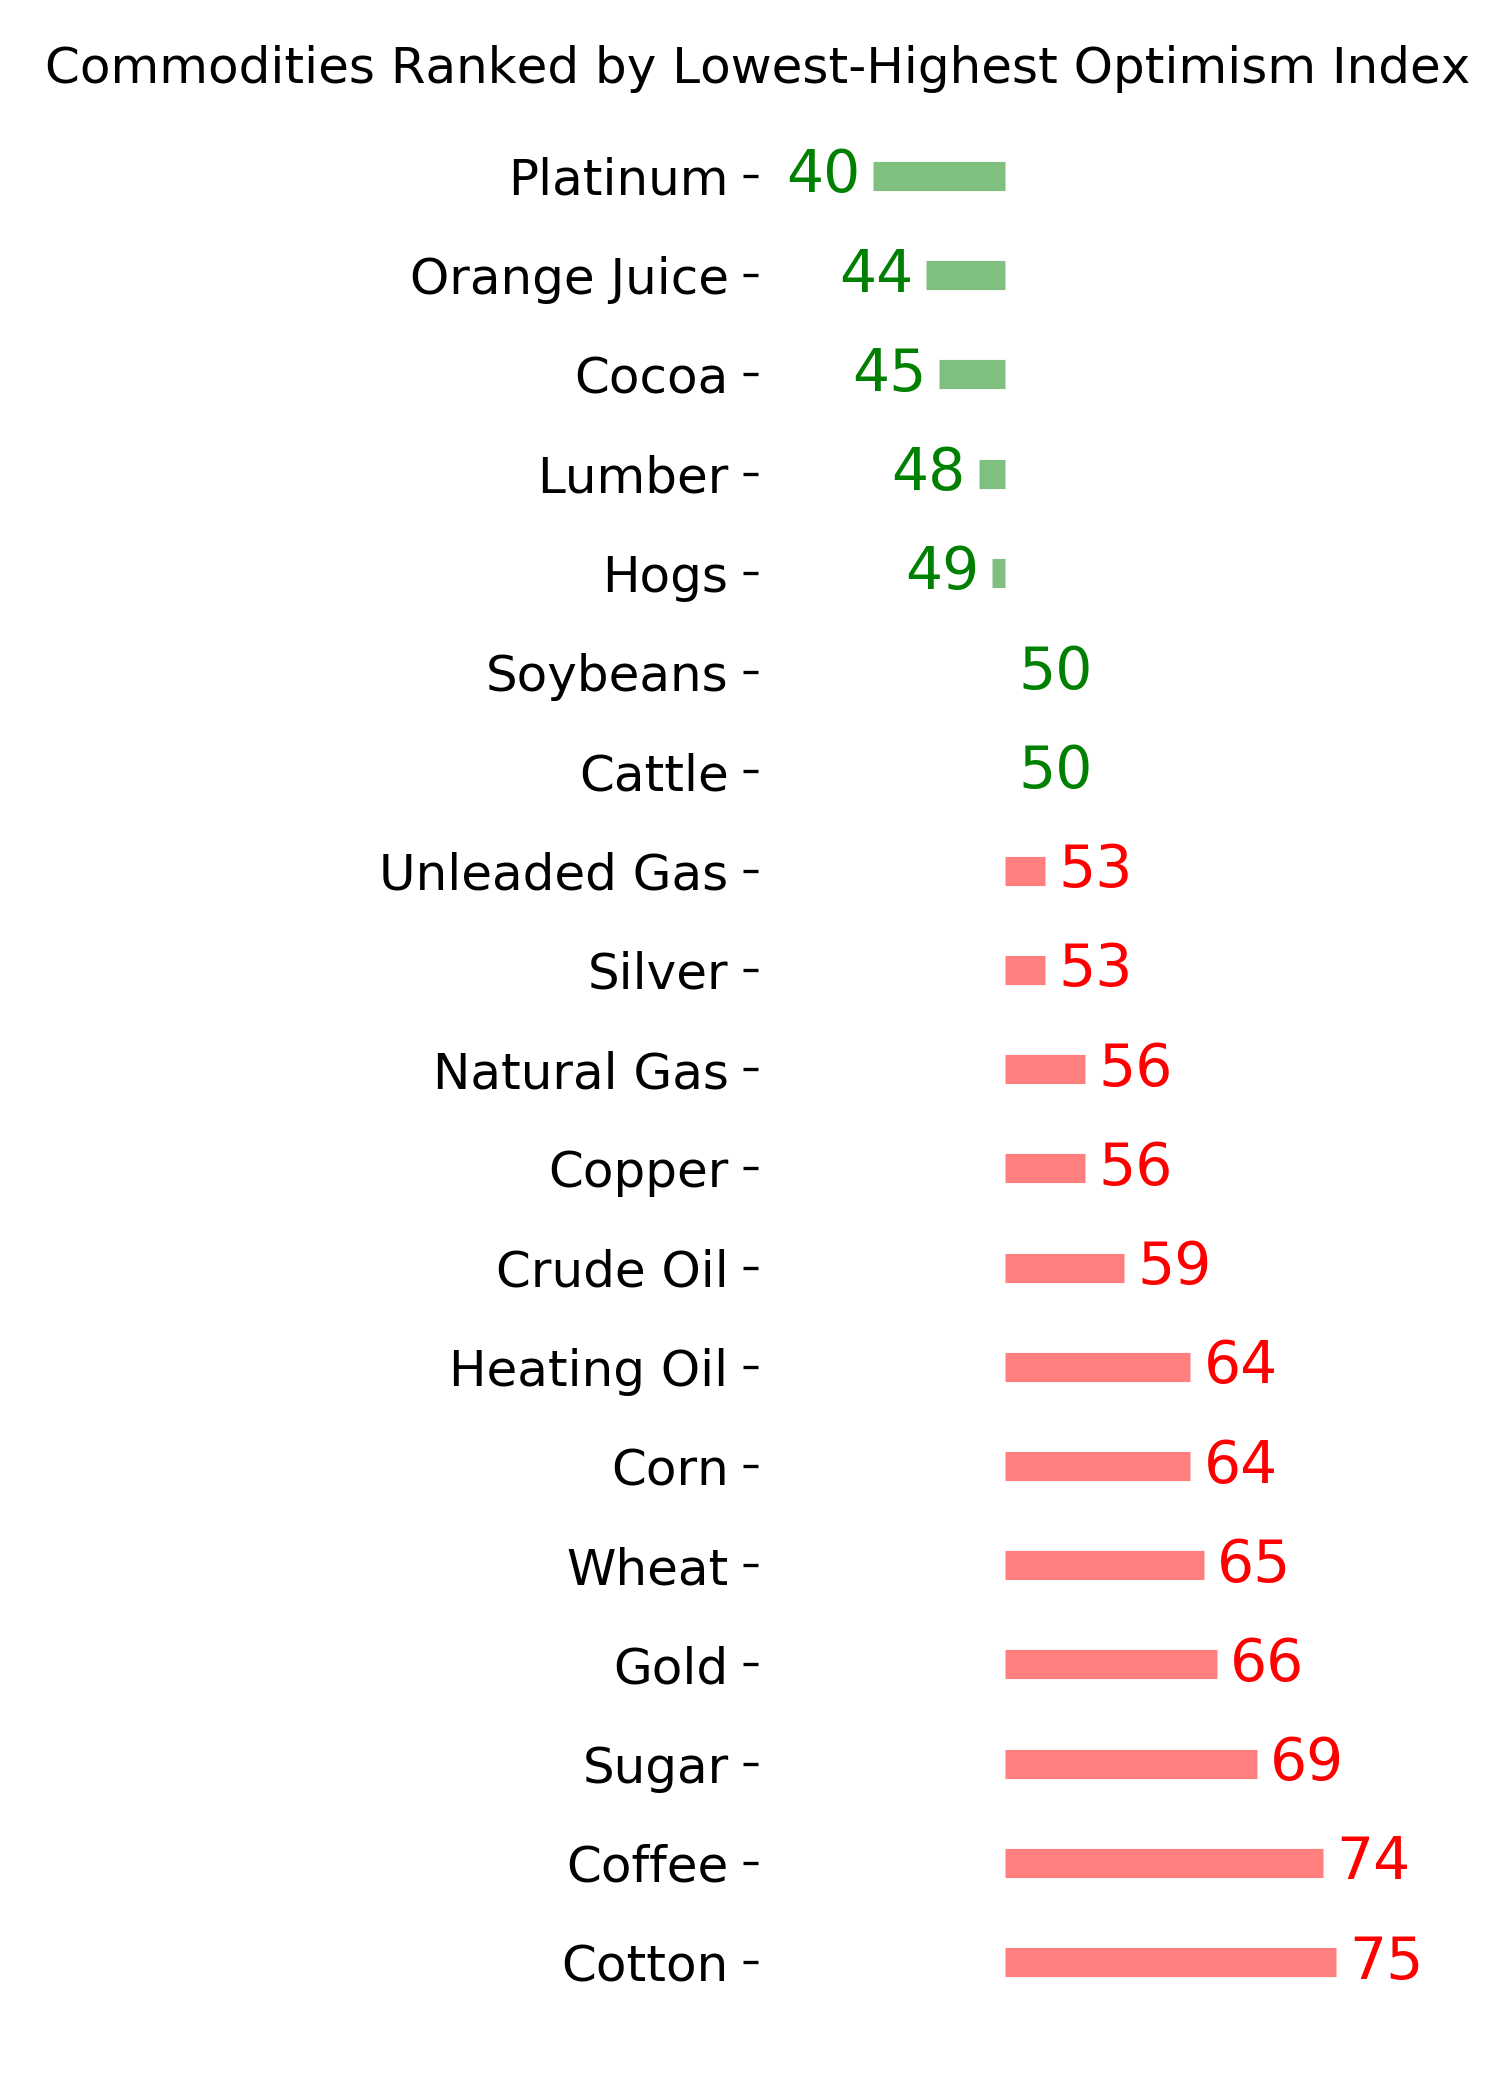
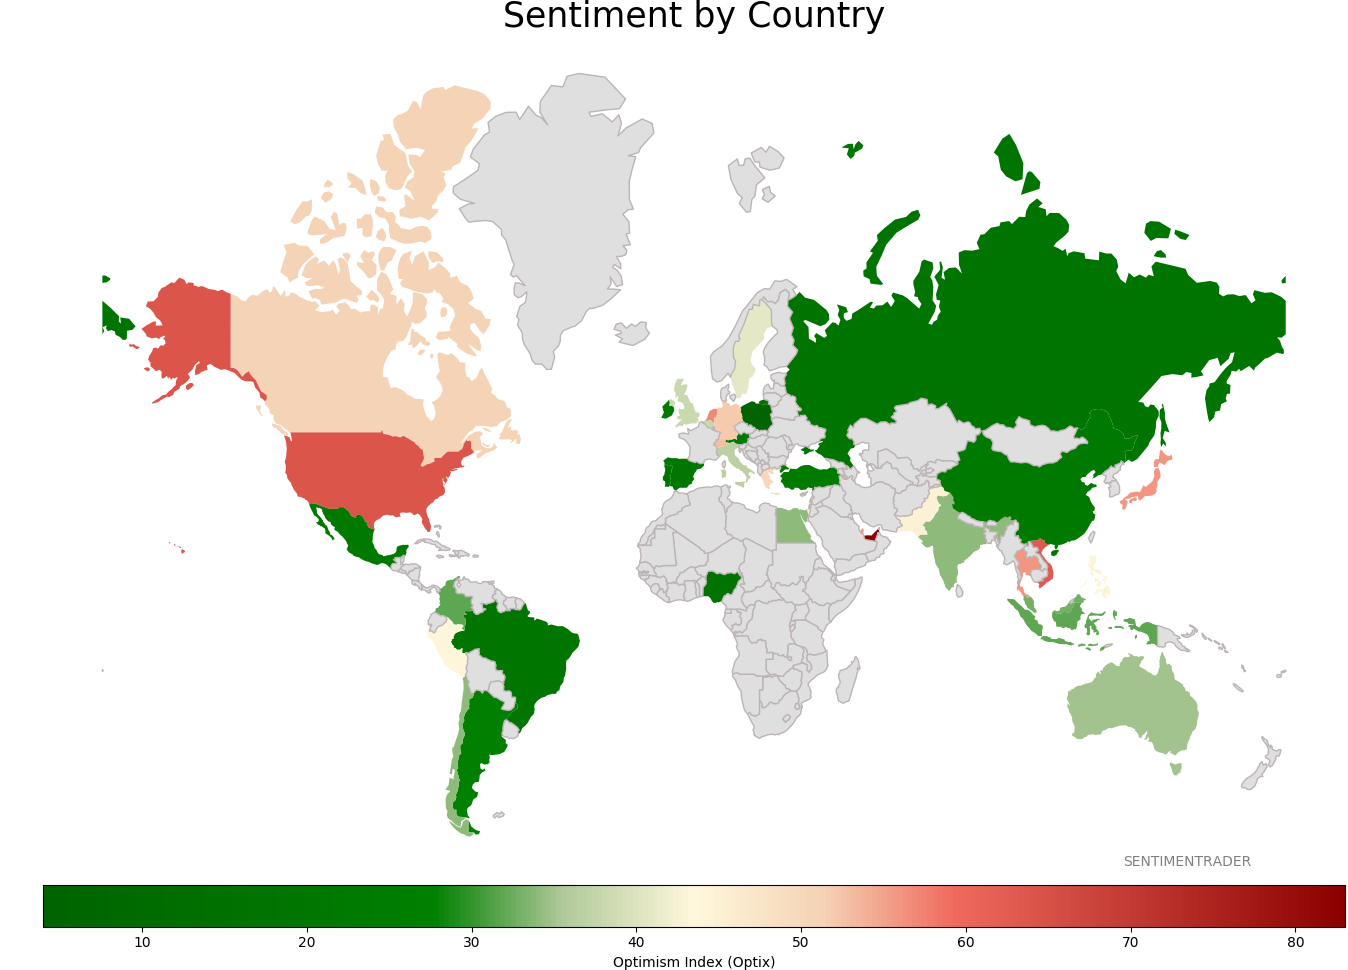
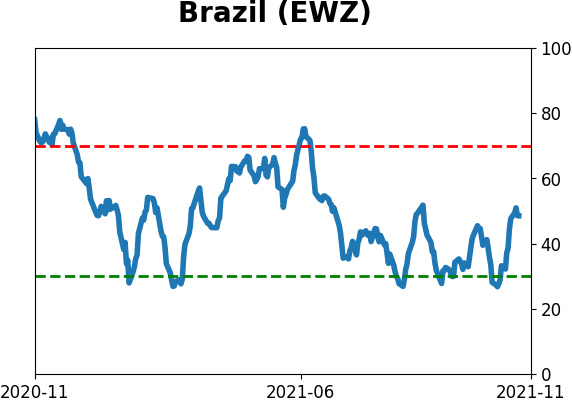
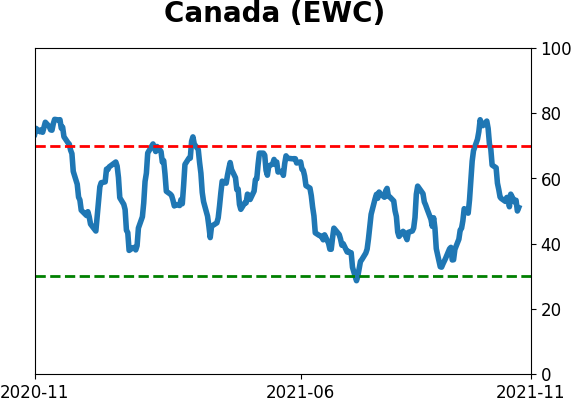
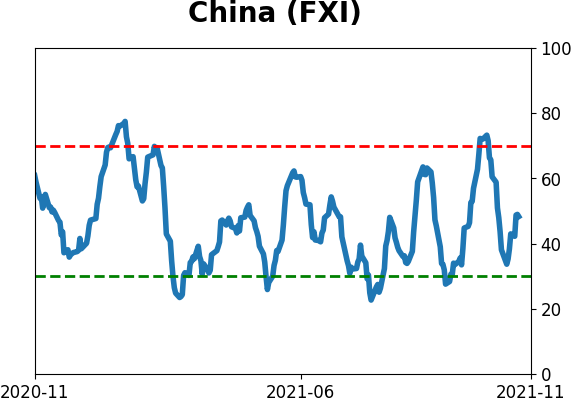
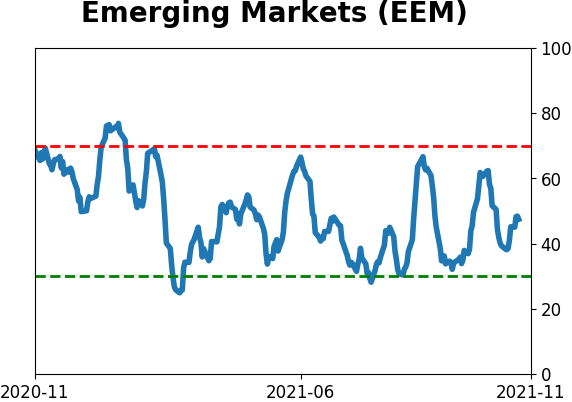
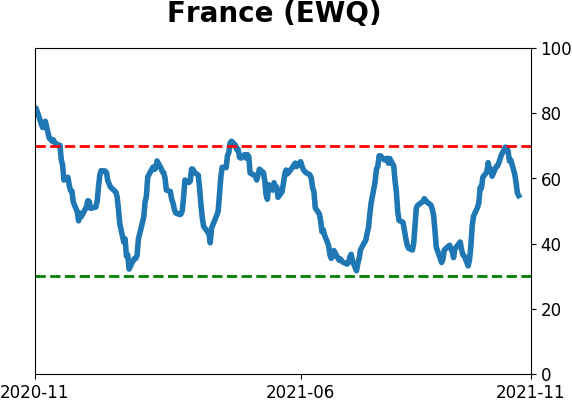
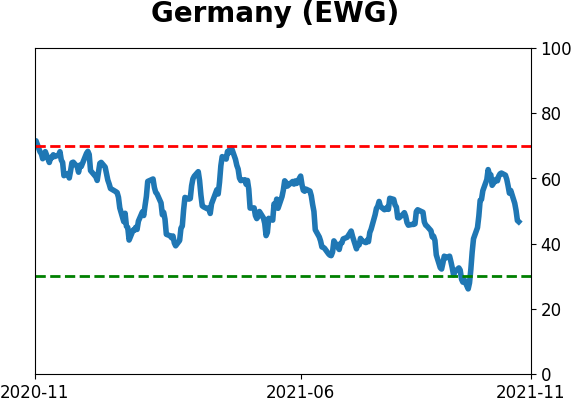
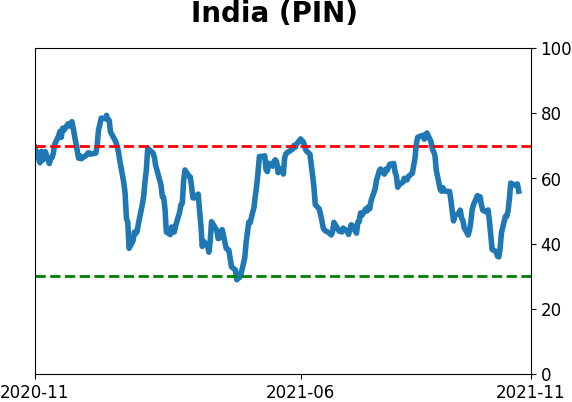
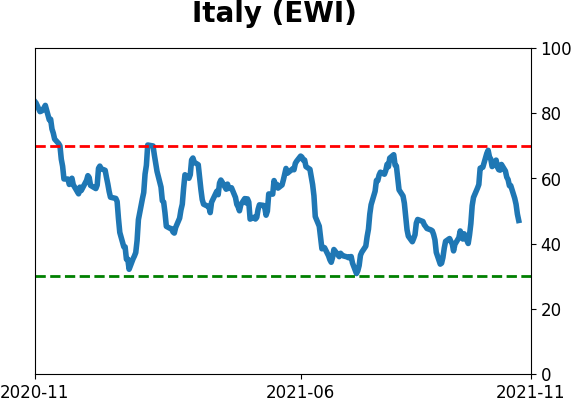
Sentiment Around The World
Optimism Index Thumbnails
|
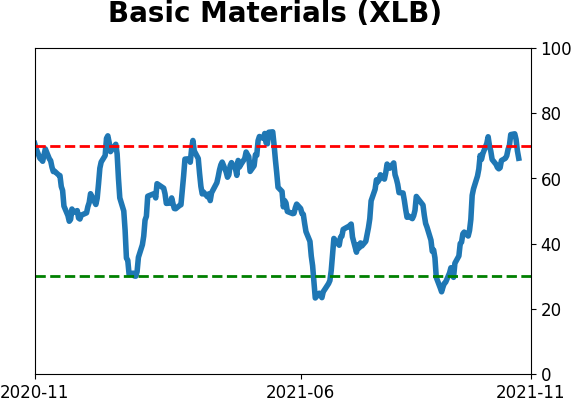
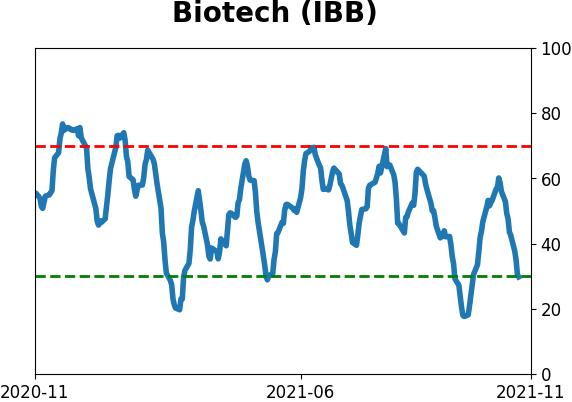
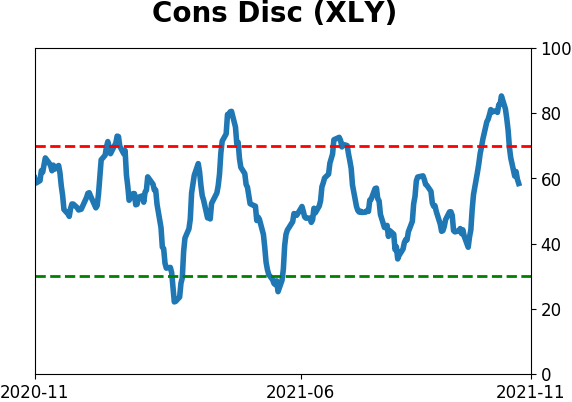
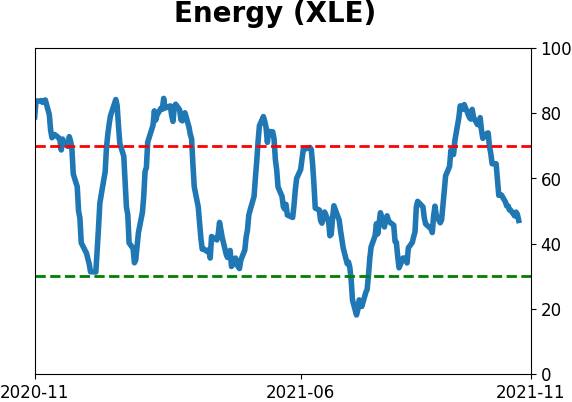
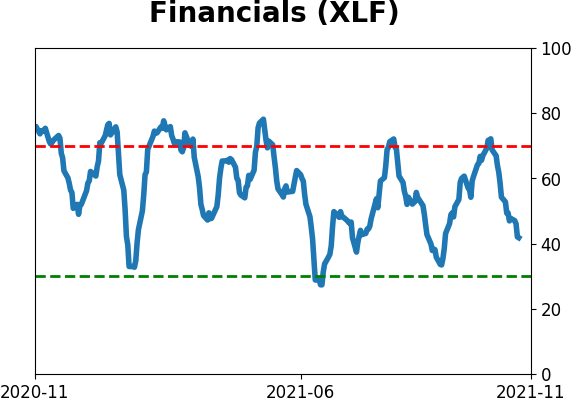
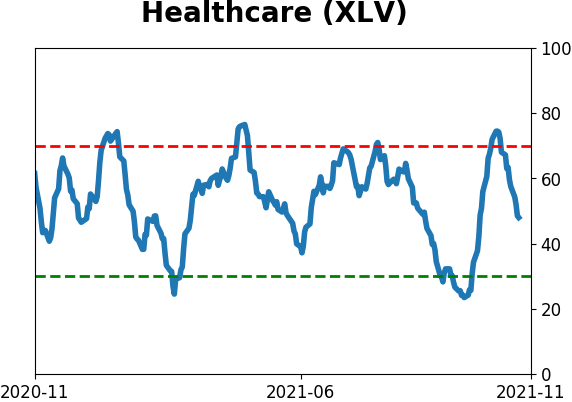
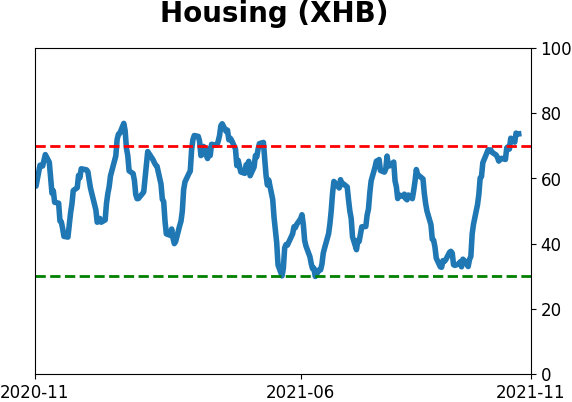
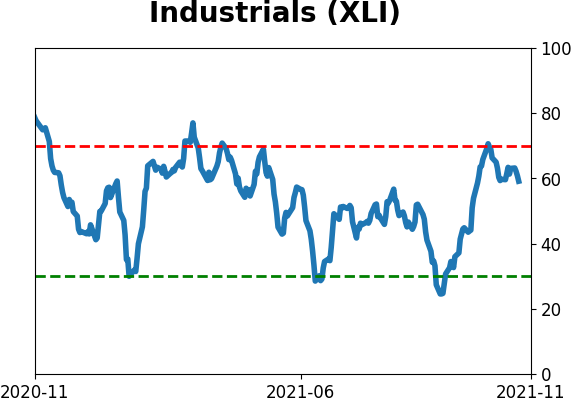
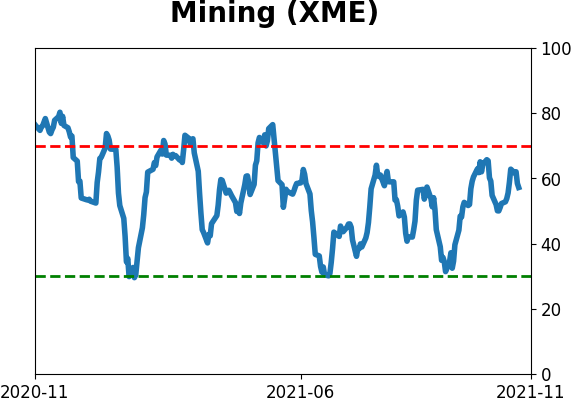
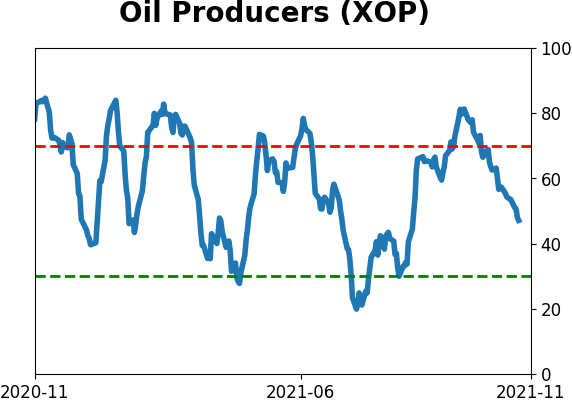
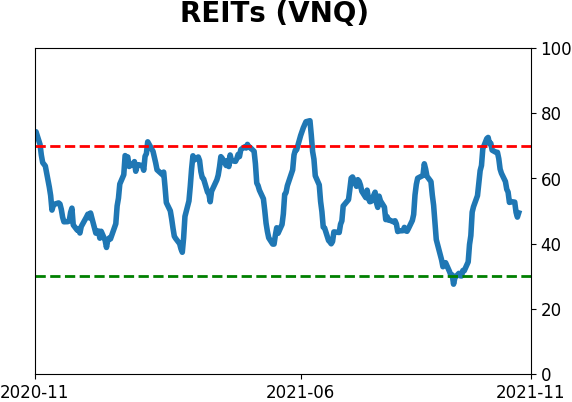
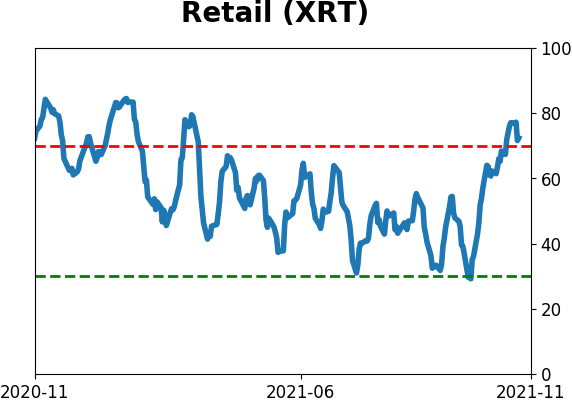
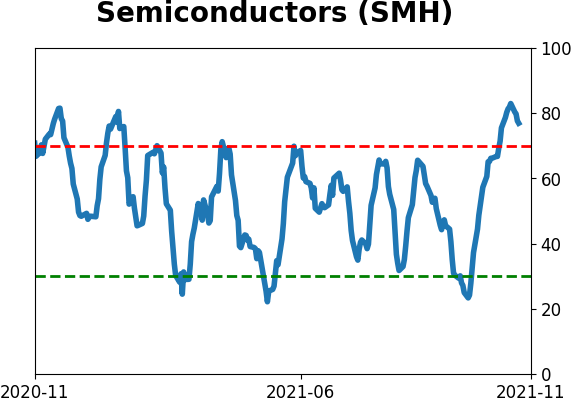
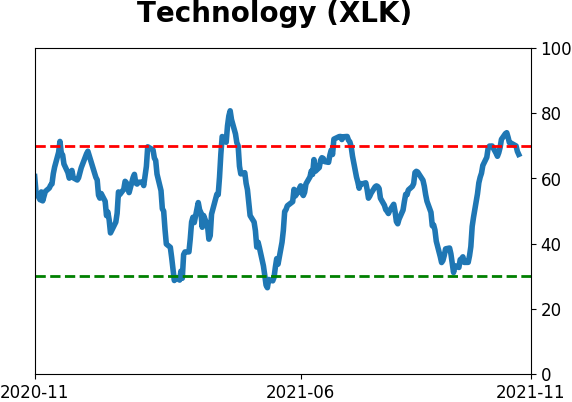
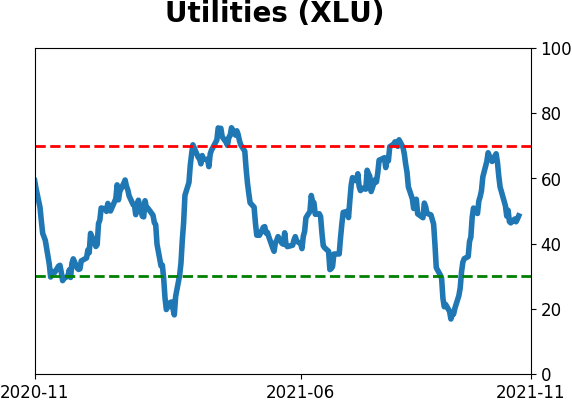
Sector ETF's - 10-Day Moving Average
|
|
|
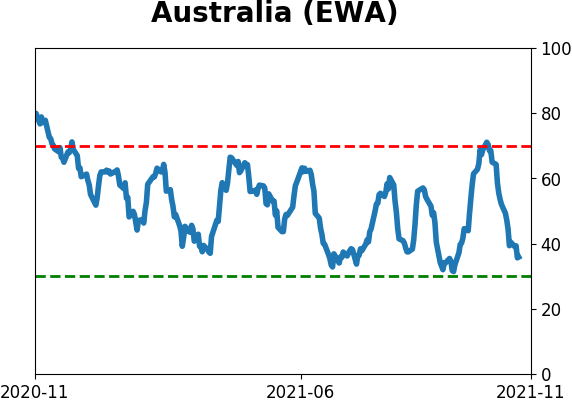
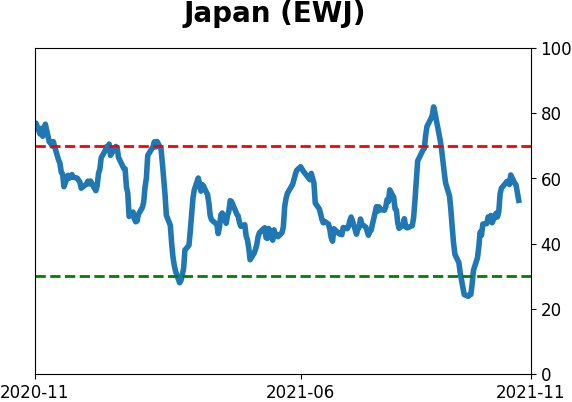
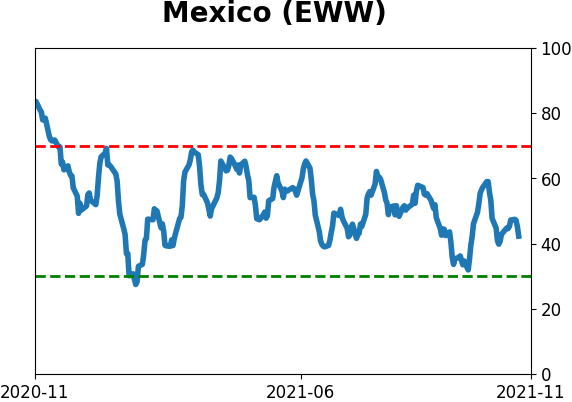
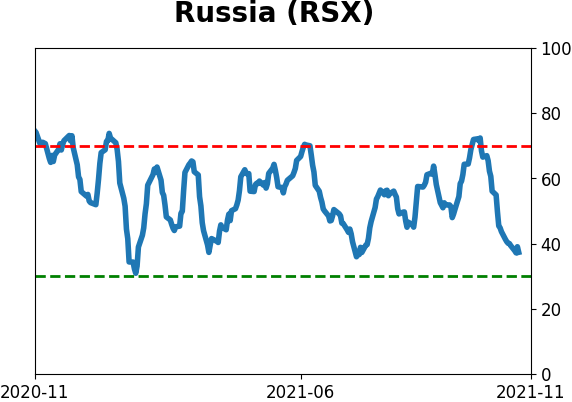
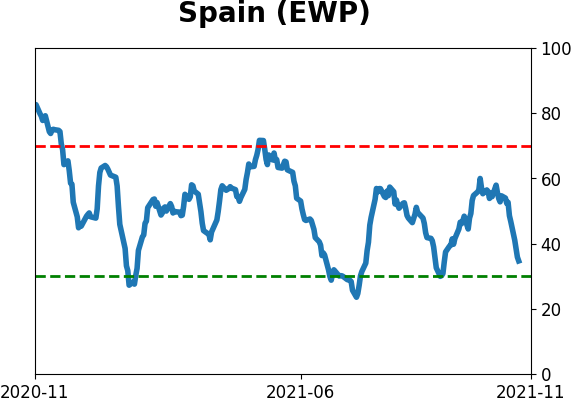
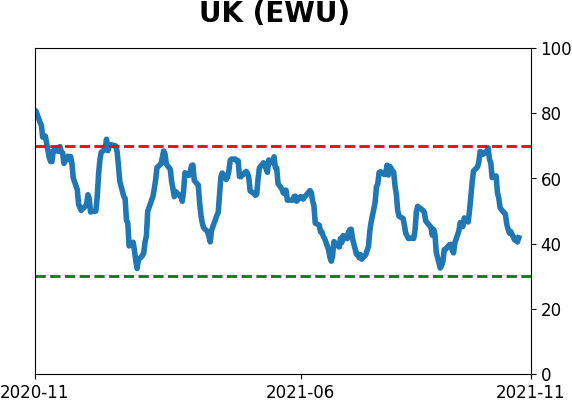
Country ETF's - 10-Day Moving Average
|
|
|
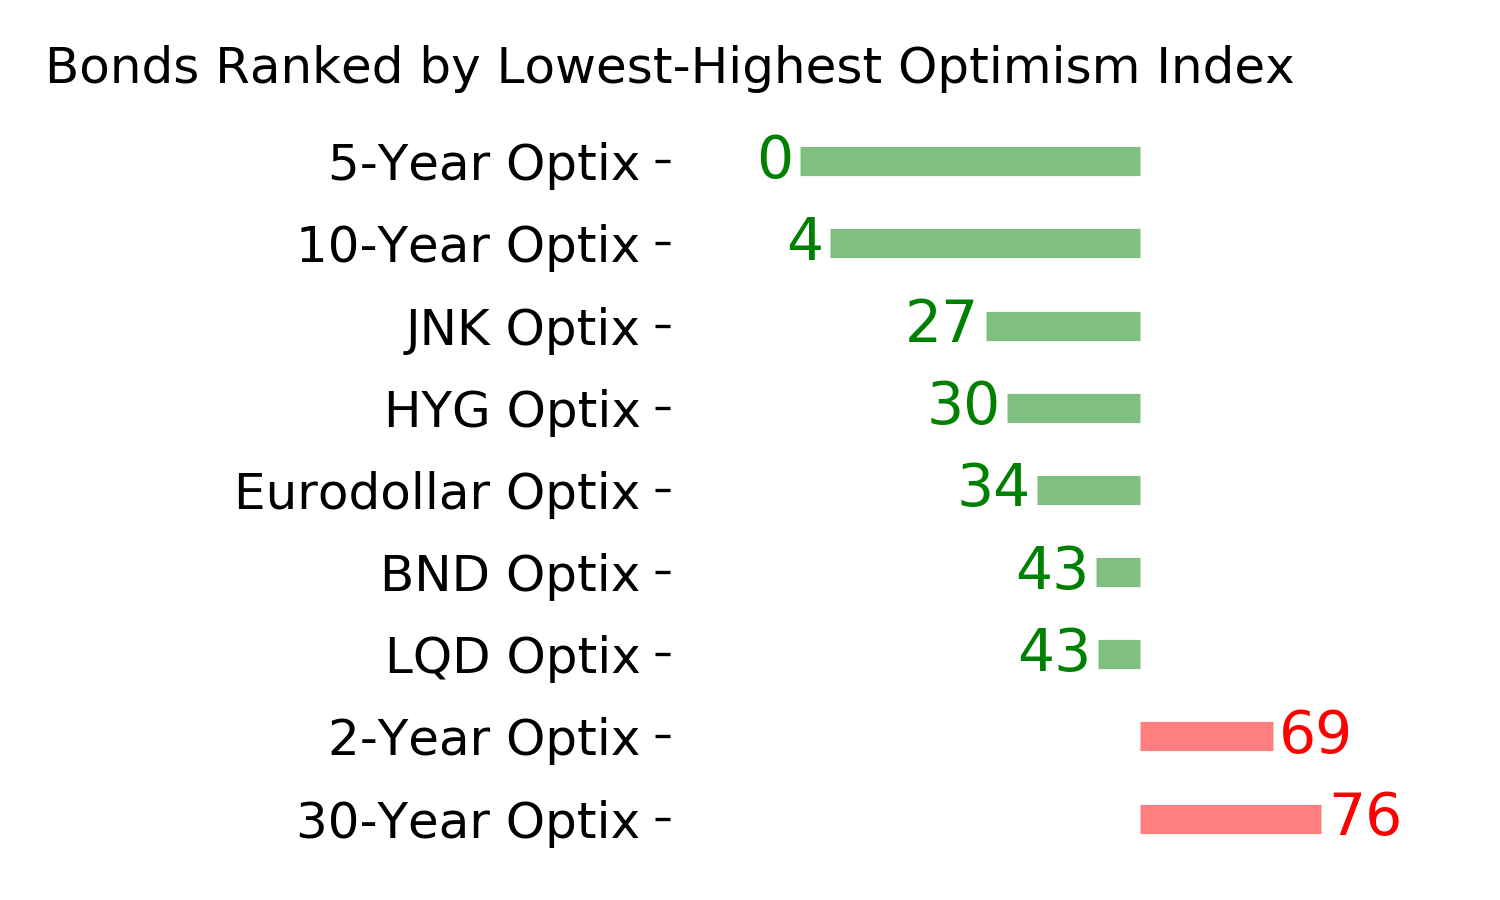
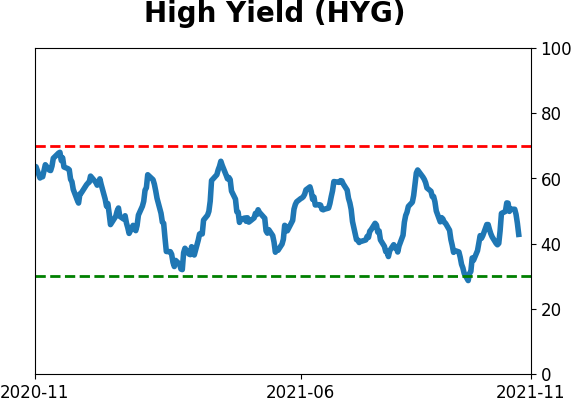
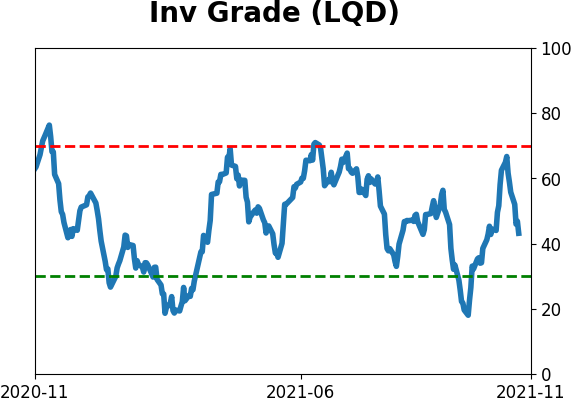
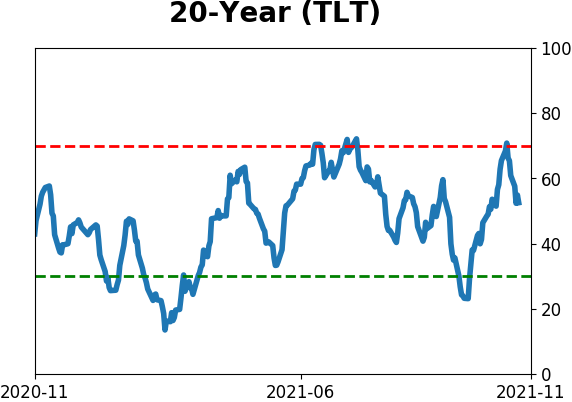
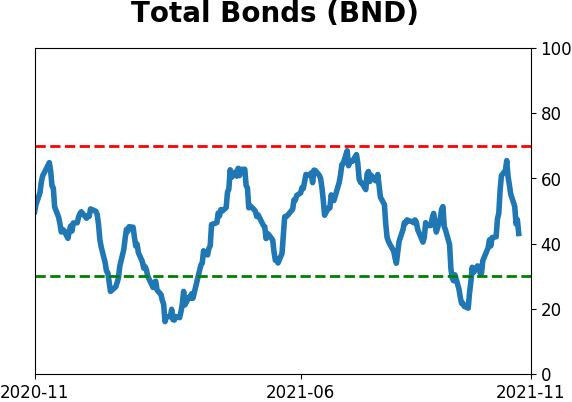
Bond ETF's - 10-Day Moving Average
|
|
|
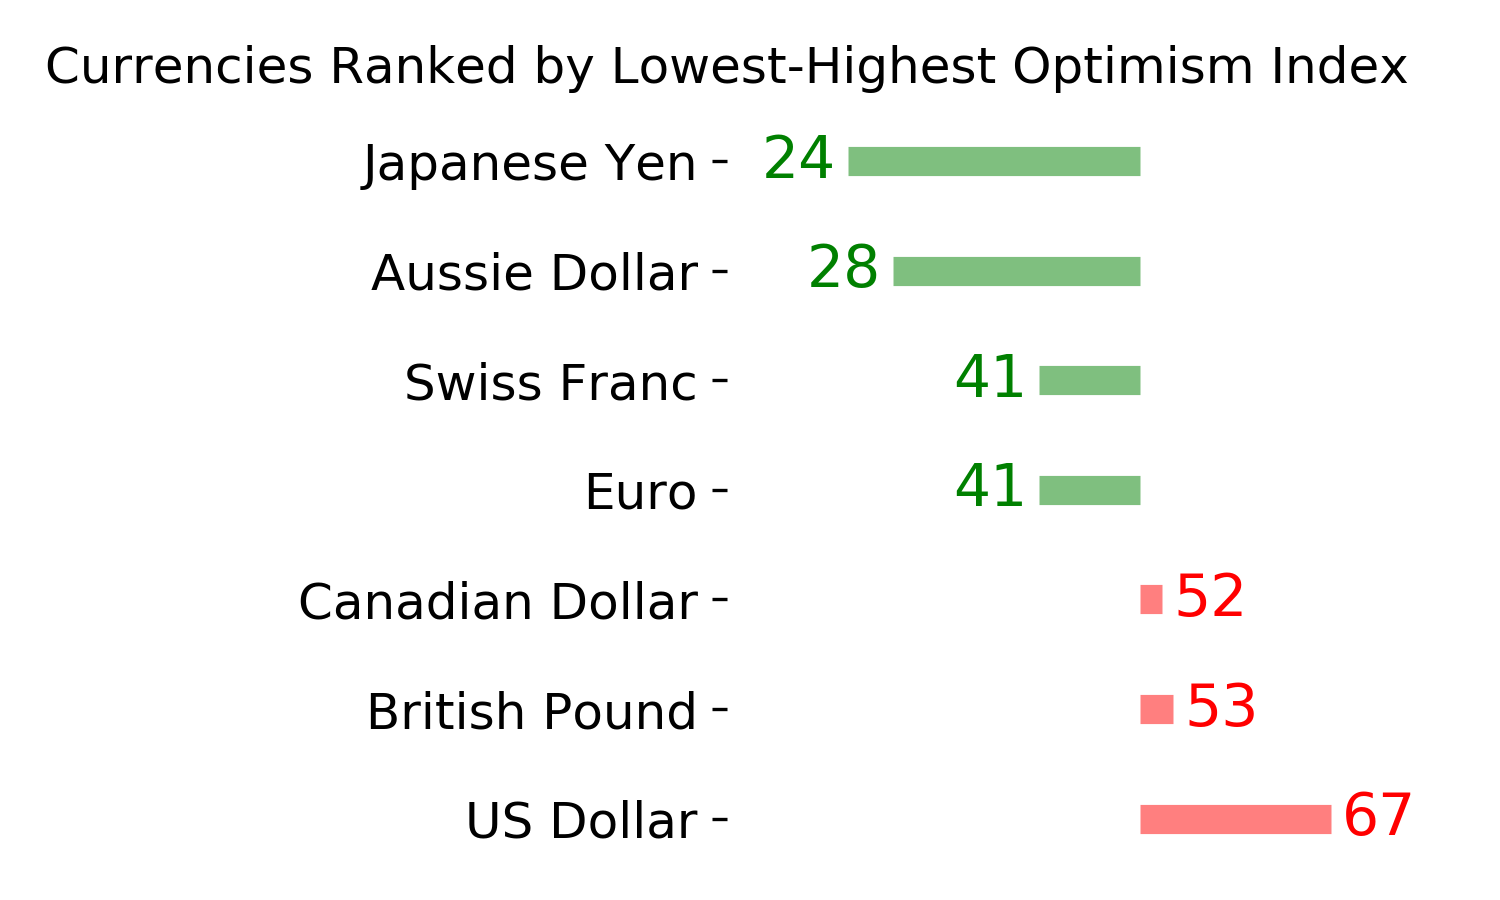
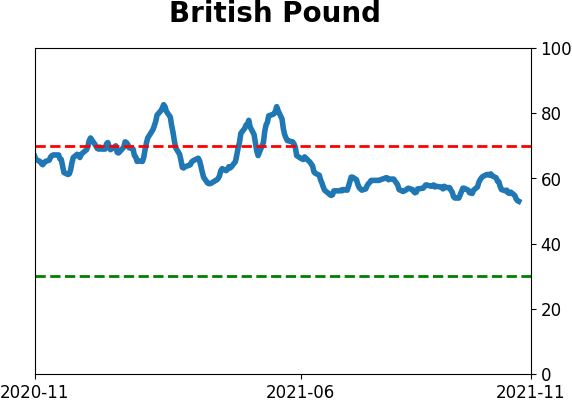
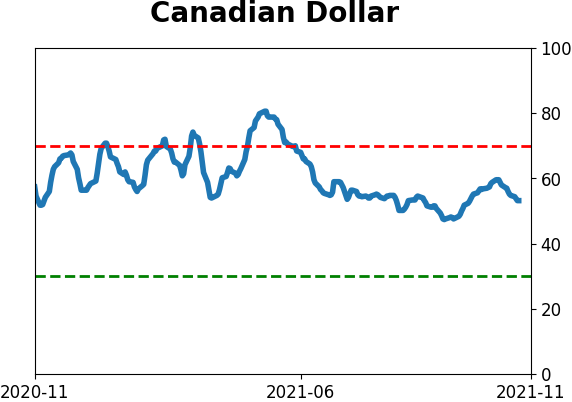
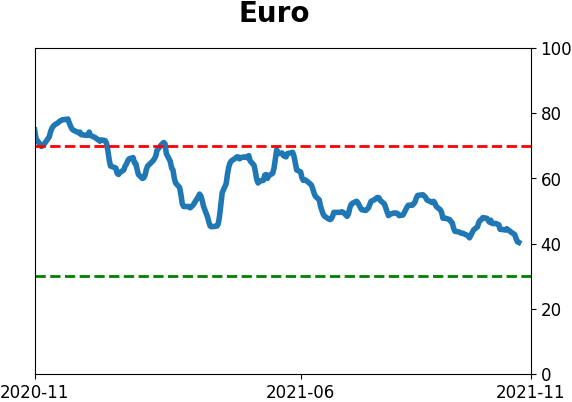
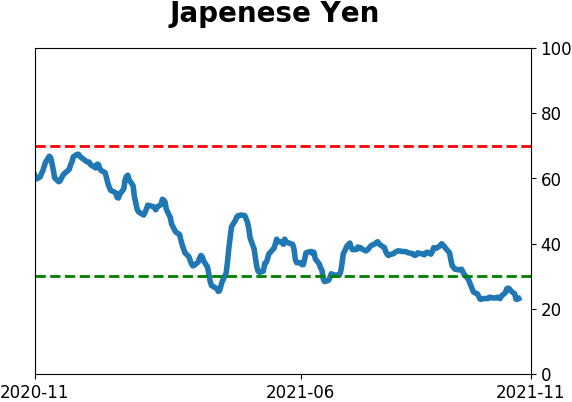
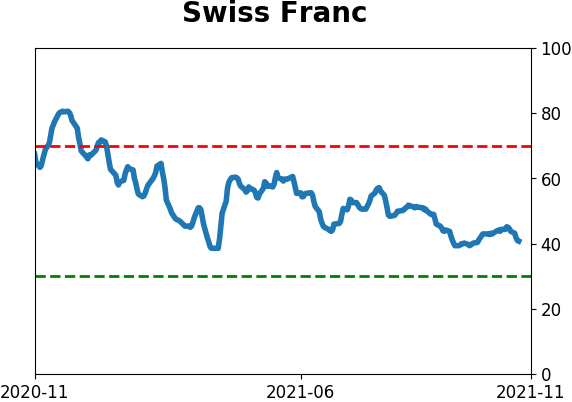
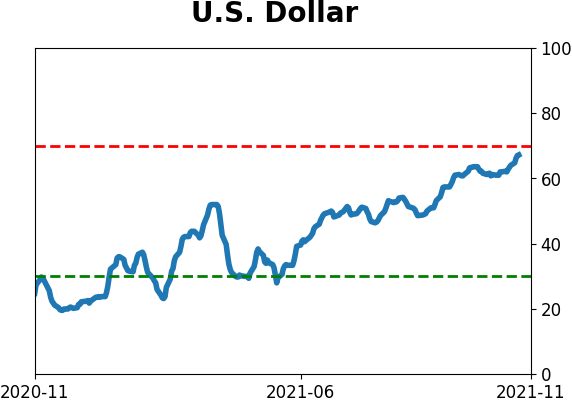
Currency ETF's - 5-Day Moving Average
|
|
|
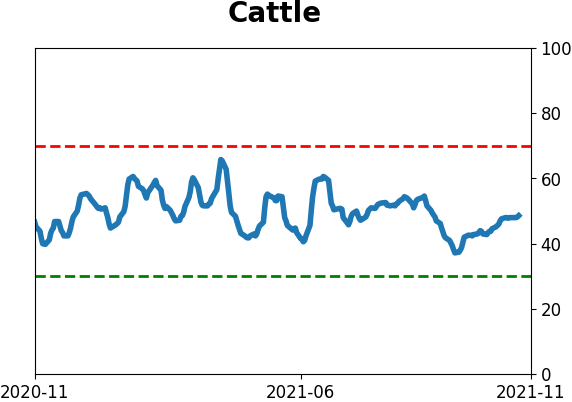
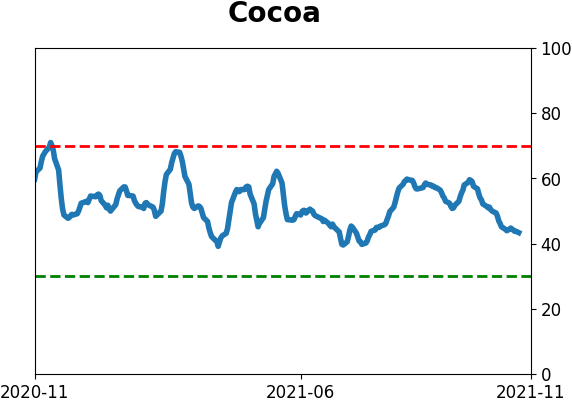
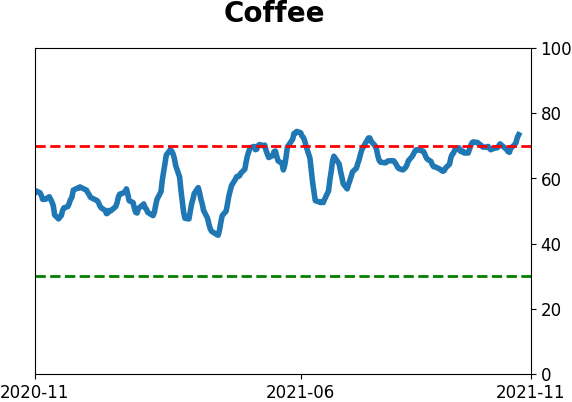
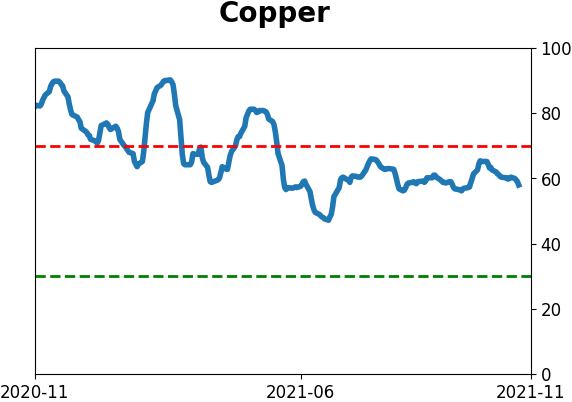
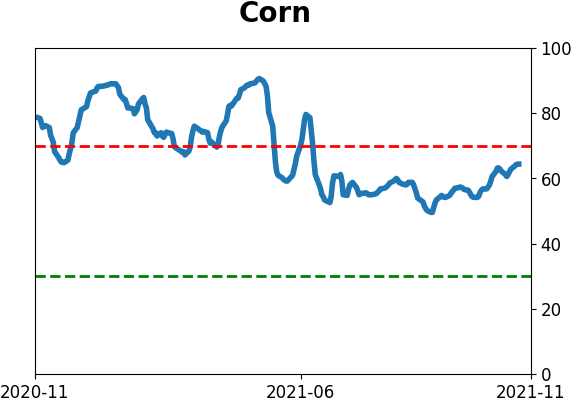
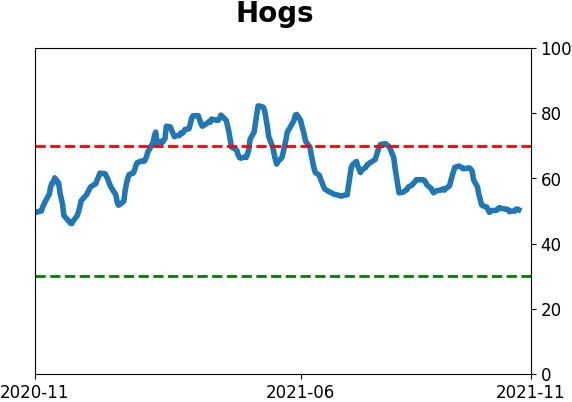
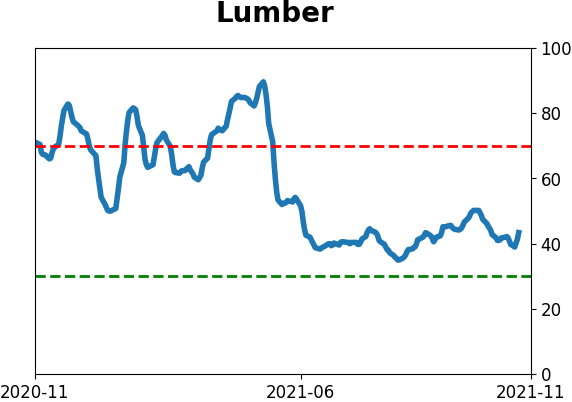
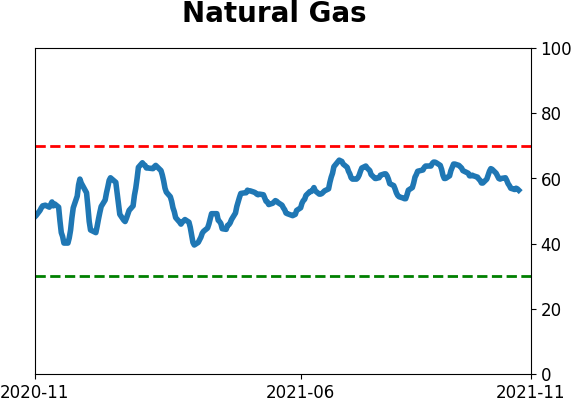
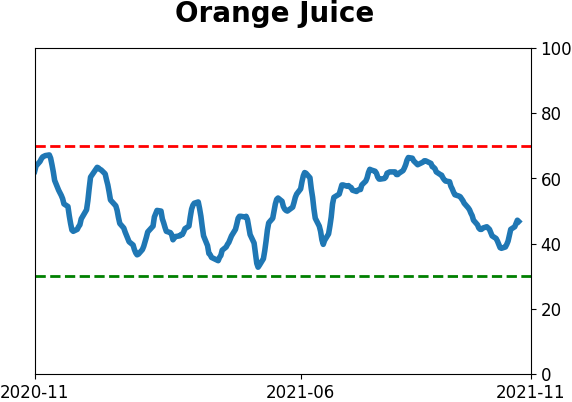
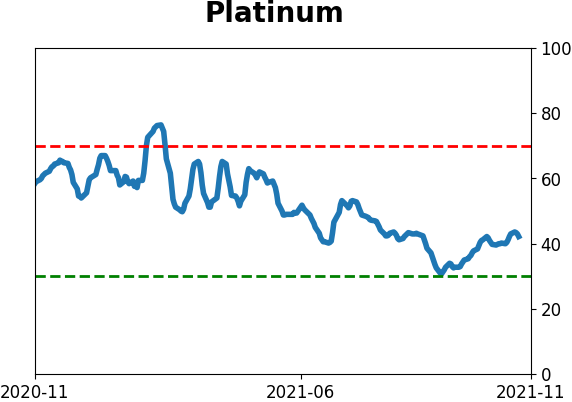
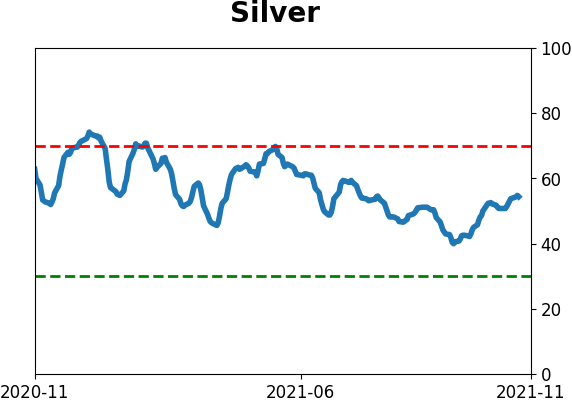
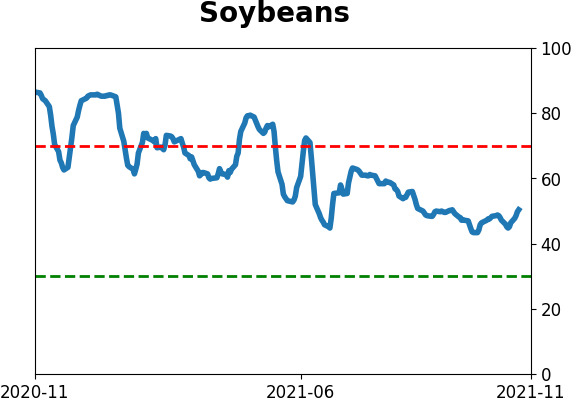
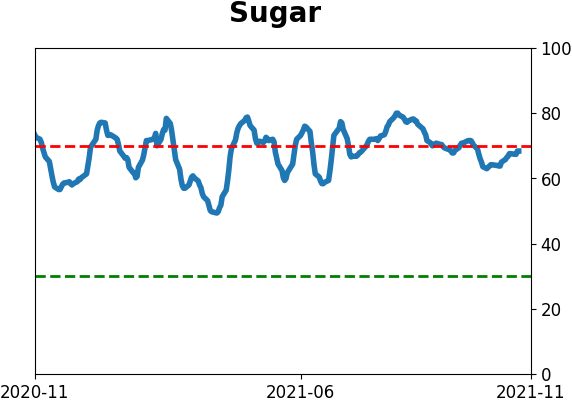
Commodity ETF's - 5-Day Moving Average
|
|