Headlines
|
|
What happens when S&P tries to swallow a whale:
When Standard & Poor's feels the pressure to add an ultra-large stock to the index, it has typically come after a rally, and forward returns were below average. For the large stocks themselves, once they were actually added to the index, they had a tendency to see lower prices over the next few months.
Uptrends are sliding back: After the surge in stocks with uptrends, roughly defined by being above their 200-day averages, Wednesday's selling triggered a pause. Now fewer than 90% of stocks in the S&P 500 are above their long-term trends. The Backtest Engine shows that when this happens, the index was higher a month later after 33 out of 41 signals. When it was the first signal in at least a year, there were virtually no losses across the 6 distinct instances. Extreme momentum doesn't die easily.
Bottom Line:
- The market environment is pristine, but with near-historic optimism, gains tend to be muted, with a high probability of being reversed at some point over the ensuing weeks.
|
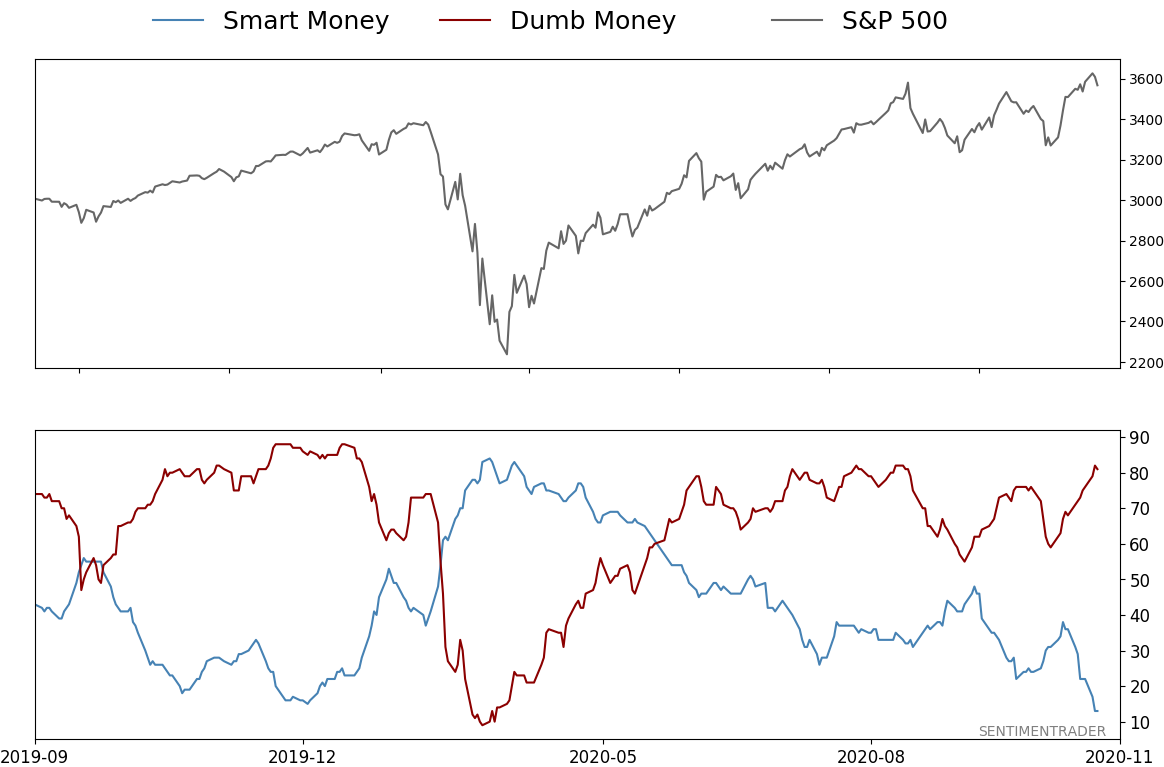
Smart / Dumb Money Confidence
|
Smart Money Confidence: 13%
Dumb Money Confidence: 81%
|
|
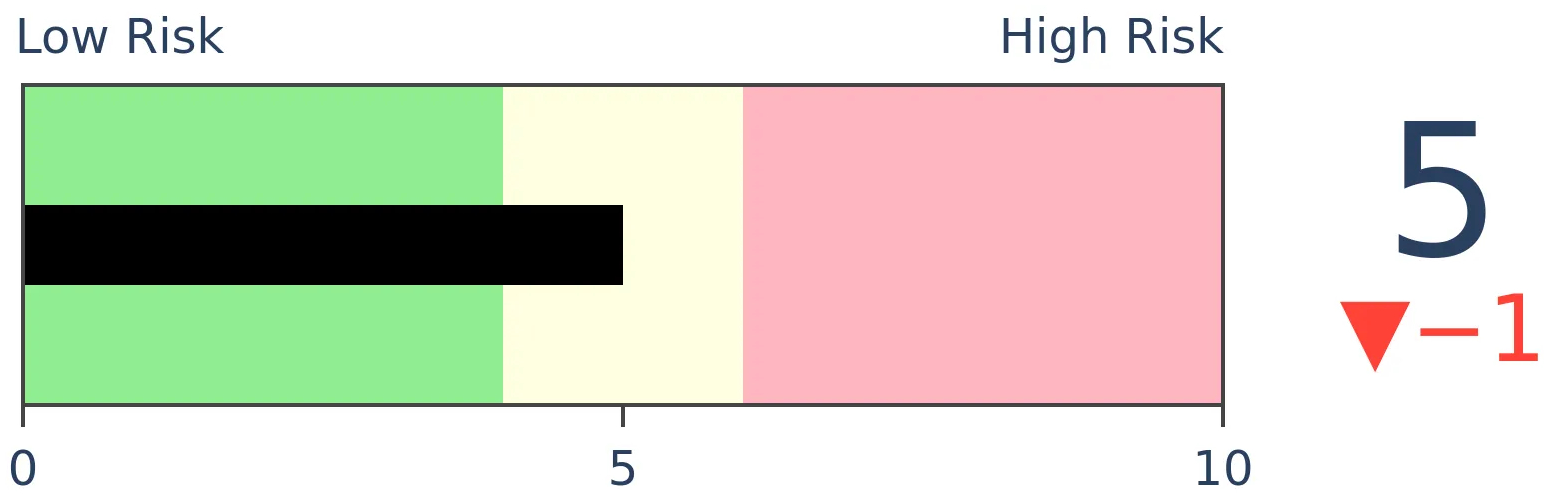
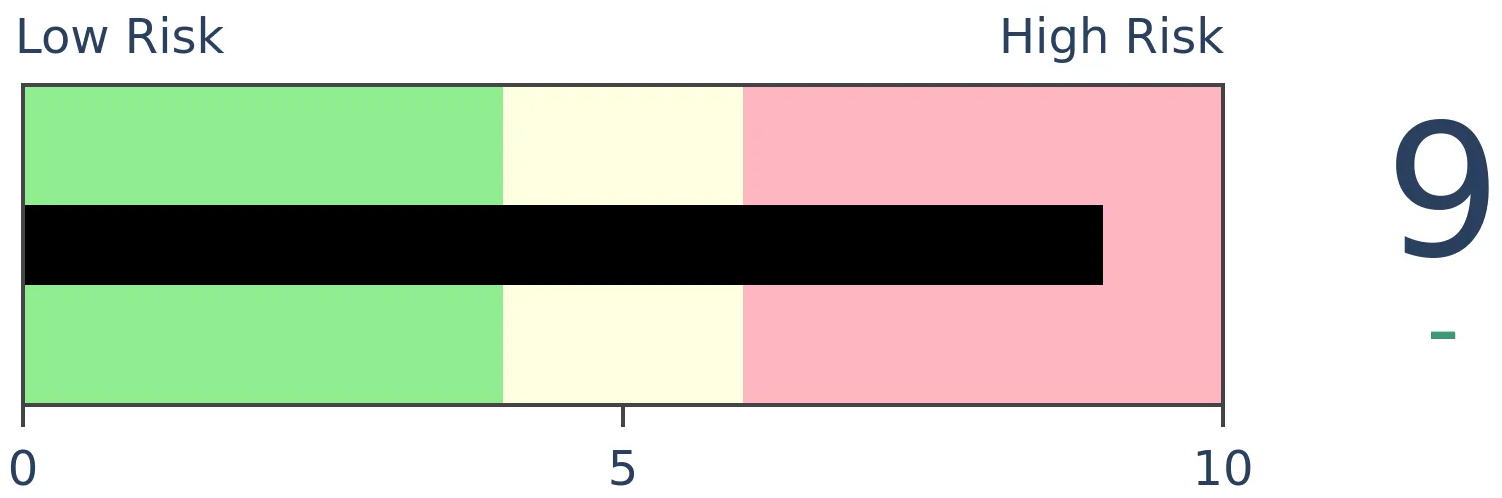
Risk Levels
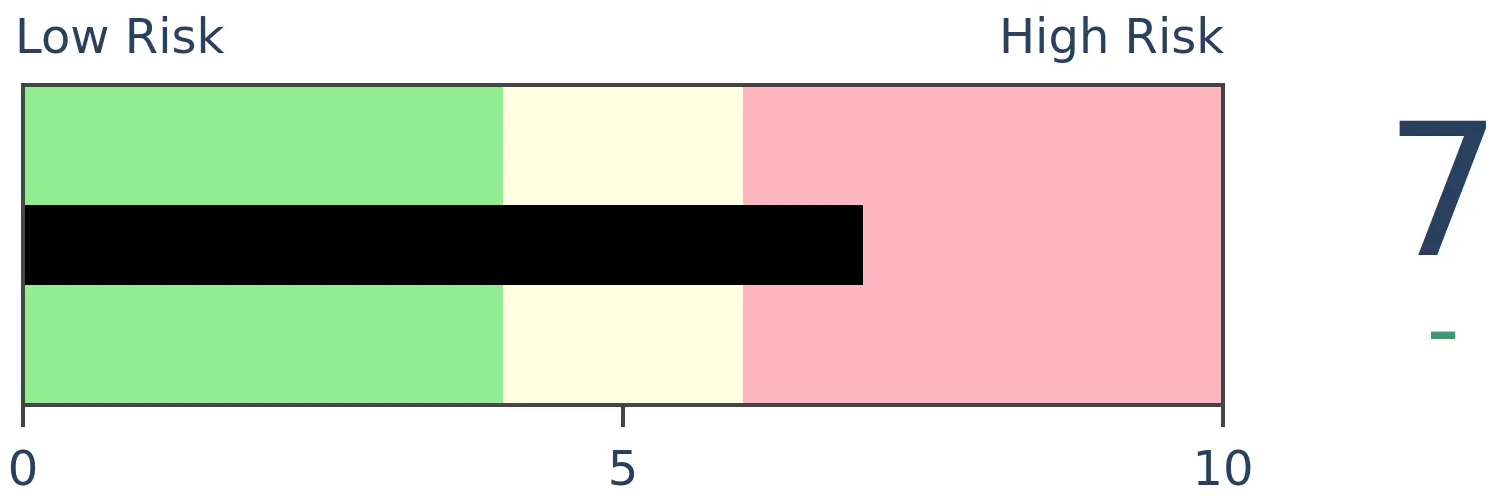
Stocks Short-Term
|
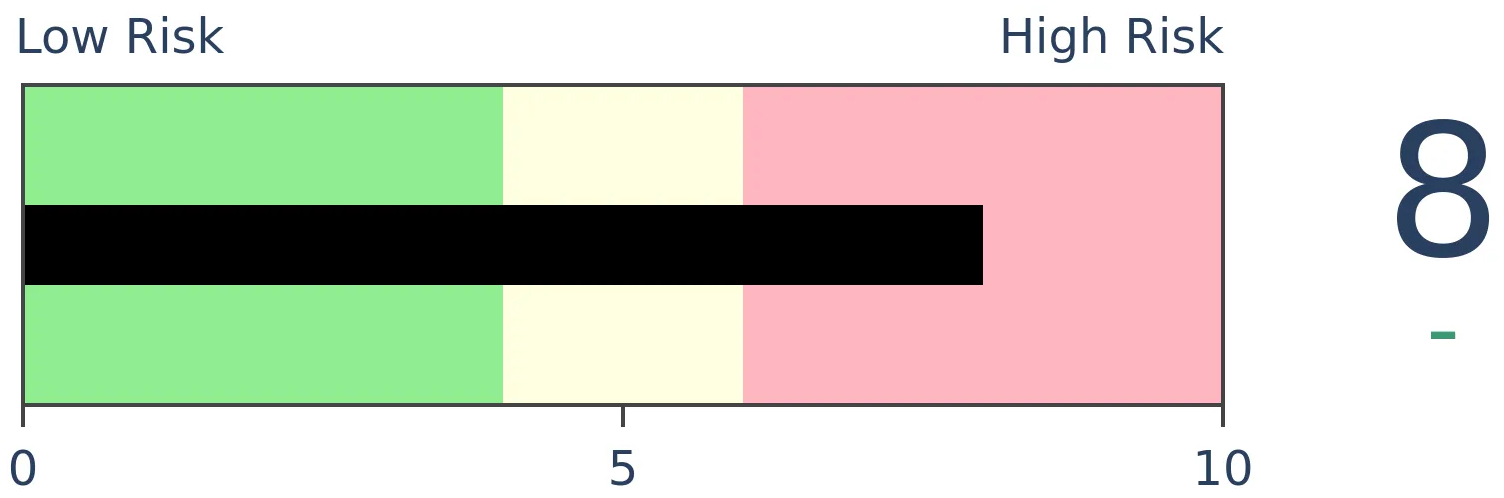
Stocks Medium-Term
|
|
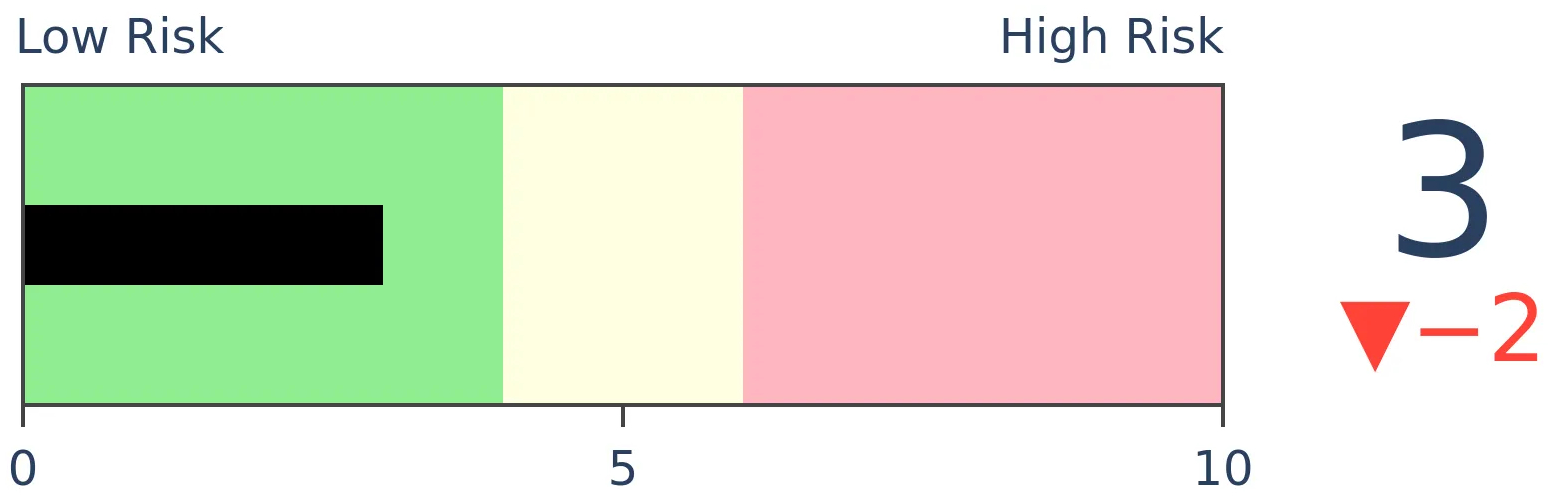
Bonds
|
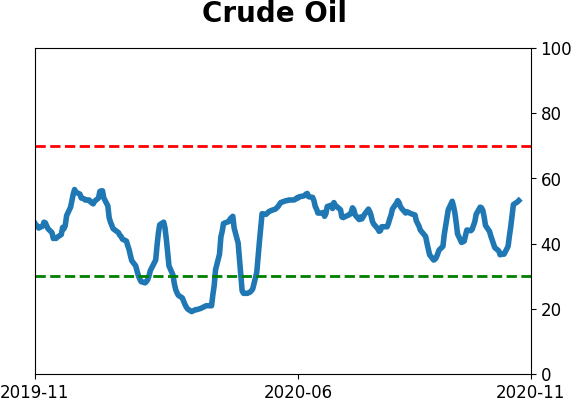
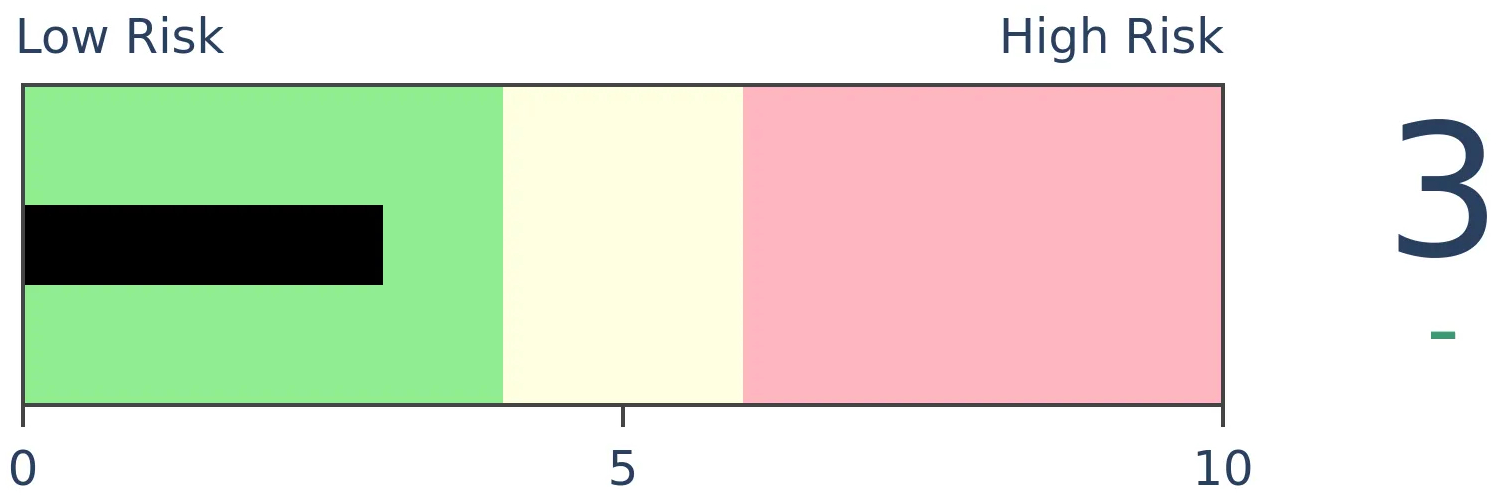
Crude Oil
|
|
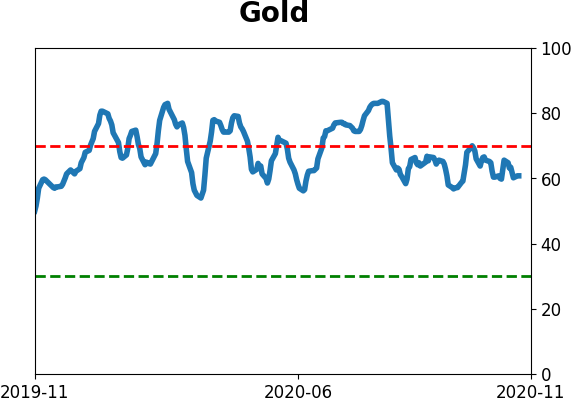
Gold
|
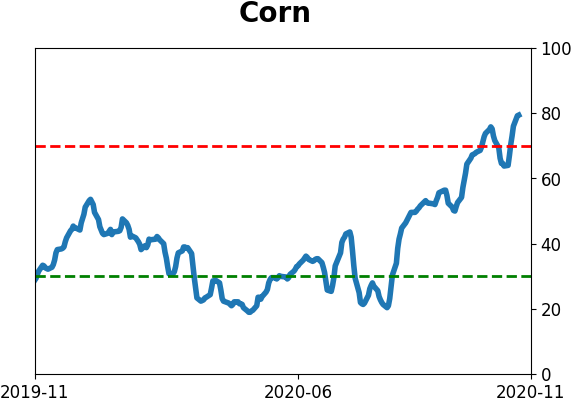
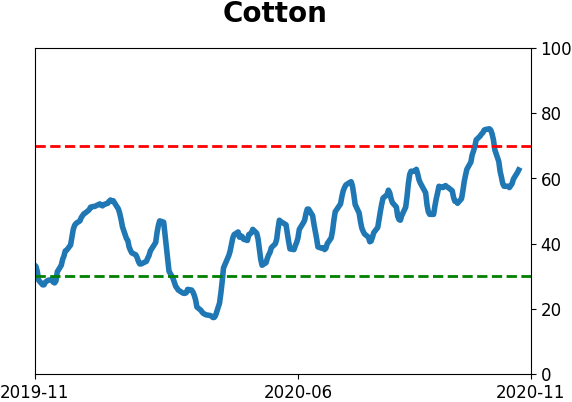
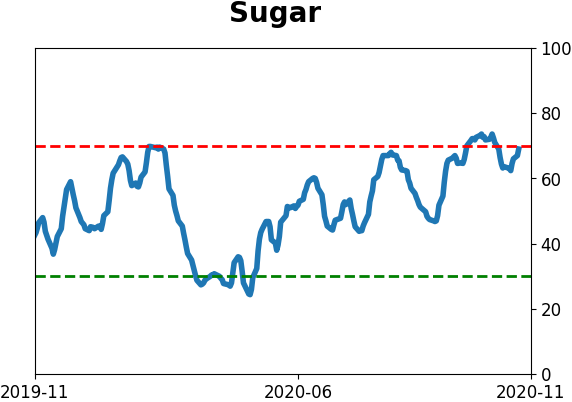
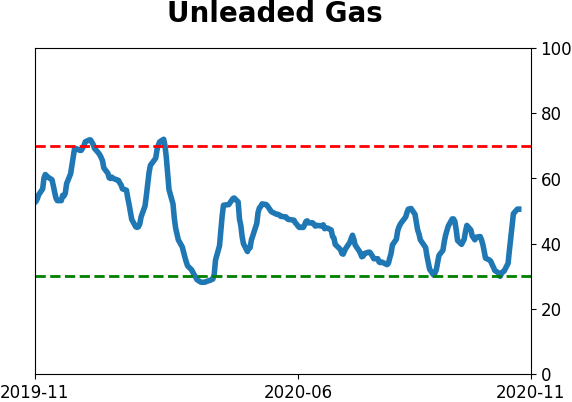
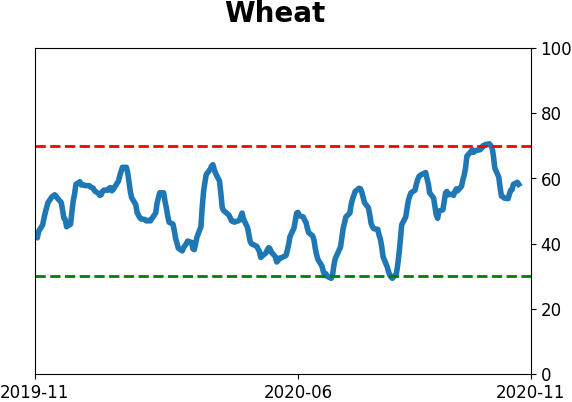
Agriculture
|
|
Research
BOTTOM LINE
When Standard & Poor's feels the pressure to add an ultra-large stock to the index, it has typically come after a rally, and forward returns were below average. For the large stocks themselves, once they were actually added to the index, they had a tendency to see lower prices over the next few months.
FORECAST / TIMEFRAME
None
|
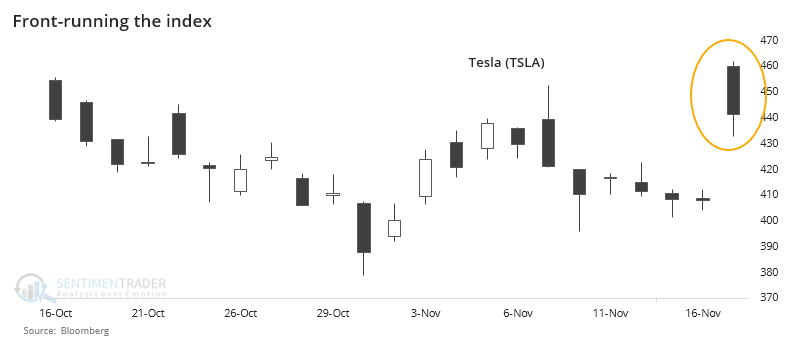
An event that Elon Musk fans have been waiting for all year finally happened, with the announcement that Tesla would be added to the most important equity benchmark in the world. There are trillions invested based on the S&P 500 index, and inclusion brings a certain cachet.
What it doesn't usually bring is profit.
Even though being added to the index seemed widely expected, investors were disappointed the last time the S&P updated its index and Tesla wasn't included. Perhaps they were once bitten, twice shy. Regardless, the news was enough to trigger a pop at Tuesday's open which faded during the rest of the day.
Going back to 1979, we looked for every time the Standard & Poor's committee added a new stock to the index of (approximately) 500 stocks in the S&P 500. We filtered it to only look at the stocks that had the largest market capitalizations at the time of the announcement. Tesla will be - by far - the largest stock the index tries to swallow at the moment of inclusion.
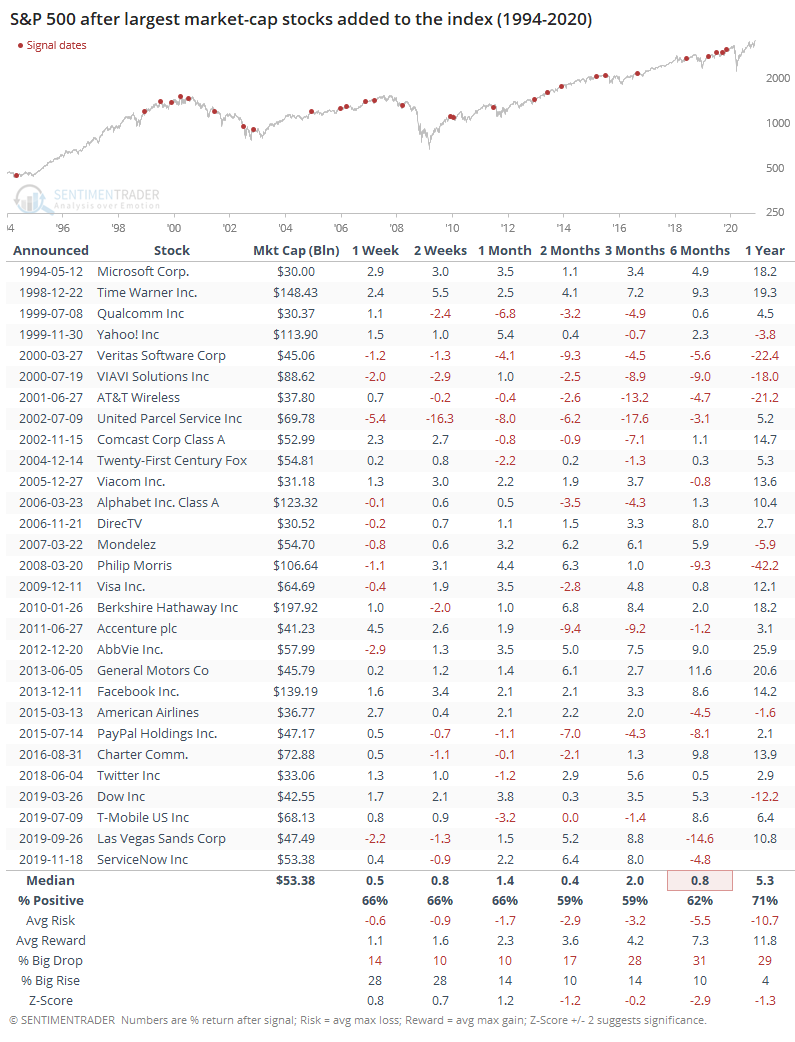
For the S&P, it preceded mostly below-average returns going forward. Over the next 6 months, it averaged a measly 0.8%, nearly 3 standard deviations below a random 6-month return over the past 25 years. There were no additions prior to 1994 that made the list of largest market cap stocks added to the index.
For the stocks themselves, forward returns from the date of the announcement were pretty good. Excluding the bubble additions in 1999-2000, the returns were even better, though there have been some big oopsies over the past 5 years.
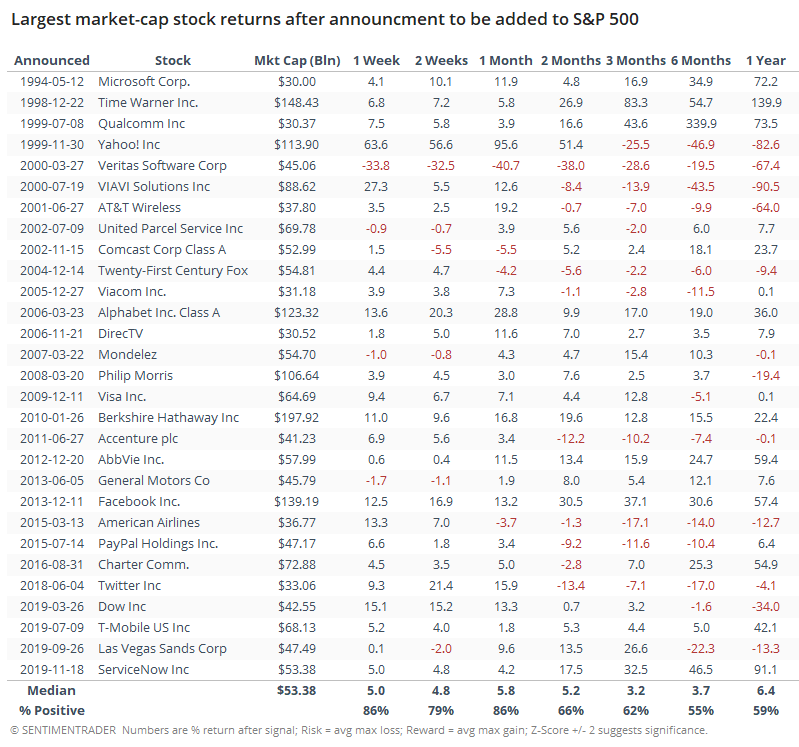
Where it gets interesting is that returns turn significantly south once the stock is actually added to the index, which on average has been around 7 trading days after the announcement date. By this time, investors have front-run the index in anticipation of all the passive buying that should flood into the stock.
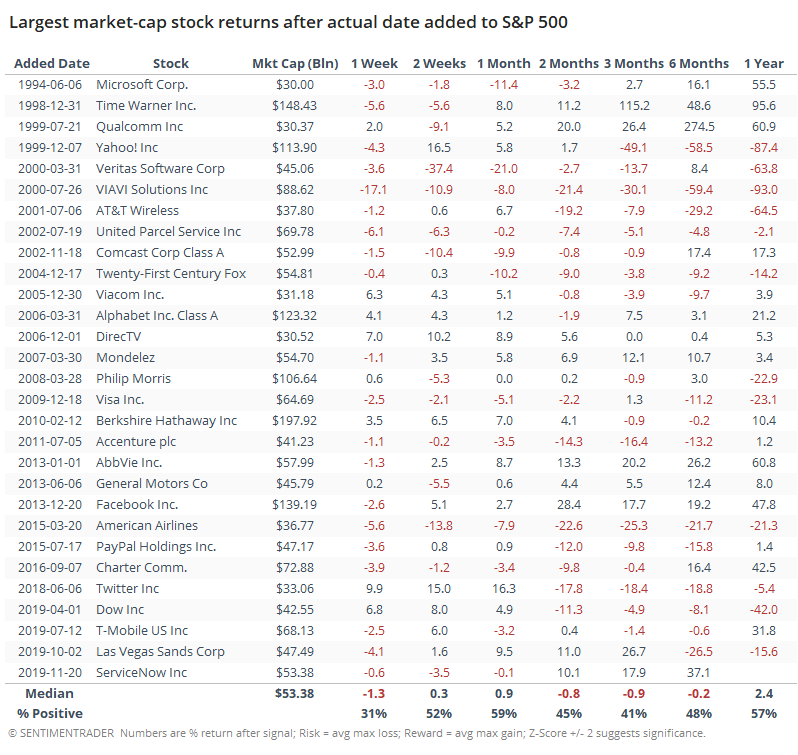
Once the stock was added to the index, it had a strong tendency to see poor returns immediately and up to a week later. There were some rebounds after that, but by 3 months later, only 41% of them sported a price that was higher than the close on the date it was added to the index.
For Tesla bulls, it's a modest warning that much of the good news about being added to the most important index in the world may have already been priced in. It's even more of a challenge that the stock is so huge to begin with.
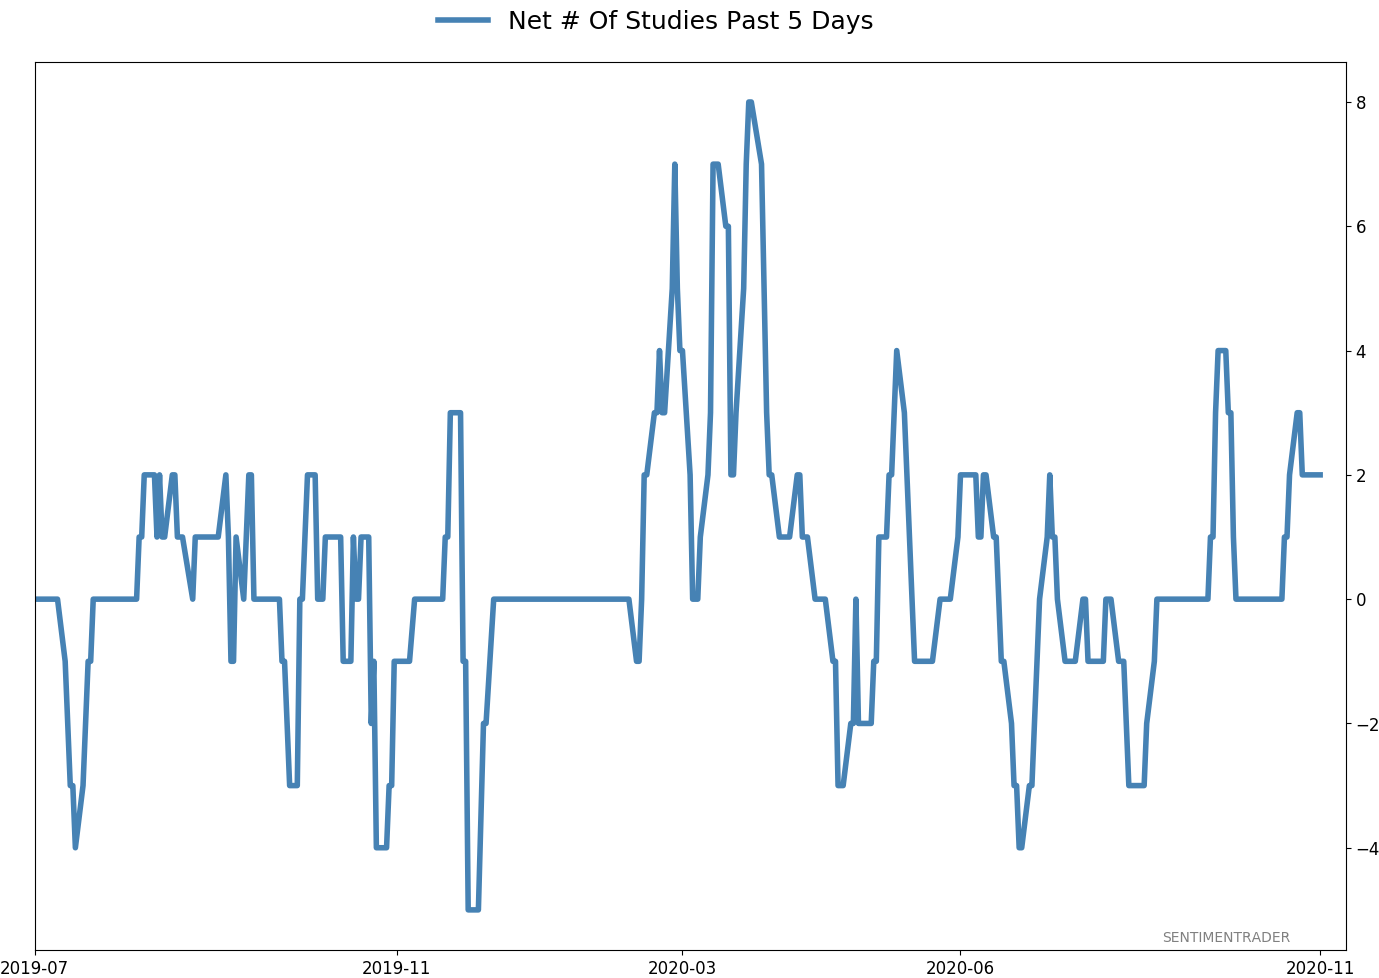
Active Studies
| Time Frame | Bullish | Bearish | | Short-Term | 0 | 0 | | Medium-Term | 5 | 8 | | Long-Term | 51 | 2 |
|
Indicators at Extremes
Portfolio
| Position | Description | Weight % | Added / Reduced | Date | | Stocks | 15.6% RSP, 10.1% VWO, 7.5% XLE, 5.1% PSCE | 38.2 | Added 5% | 2020-10-15 | | Bonds | 10% BND, 10% SCHP, 10% ANGL | 29.7 | Reduced 0.1% | 2020-10-02 | | Commodities | GCC | 2.4 | Reduced 2.1%
| 2020-09-04 | | Precious Metals | GDX | 4.7 | Added 5% | 2020-09-09 | | Special Situations | | 0.0 | Reduced 5% | 2020-10-02 | | Cash | | 25.0 | | |
|
Updates (Changes made today are underlined)
After the September swoon wrung some of the worst of the speculation out of stocks, there are some signs that it's returning, especially in the options market. It's helped to push Dumb Money Confidence above 70%. A big difference between now and August is that in August, there was a multitude of days with exceptionally odd breadth readings. Some of the biggest stocks were masking underlying weakness. Combined with heavy speculative activity, it was a dangerous setup. Now, we've seen very strong internal strength, in the broad market, as well as tech and small-cap stocks. Prior signals almost invariably led to higher prices. That's hard to square with the idea that forward returns tend to be subdued when Confidence is high, but that's less reliable during healthy market conditions, which we're seeing now (for the most part). I added some risk with small-cap energy stocks, due to an increasing number of positive signs in both small-caps and energy. This is intended as a long-term position.
RETURN YTD: 3.4% 2019: 12.6%, 2018: 0.6%, 2017: 3.8%, 2016: 17.1%, 2015: 9.2%, 2014: 14.5%, 2013: 2.2%, 2012: 10.8%, 2011: 16.5%, 2010: 15.3%, 2009: 23.9%, 2008: 16.2%, 2007: 7.8%
|
|
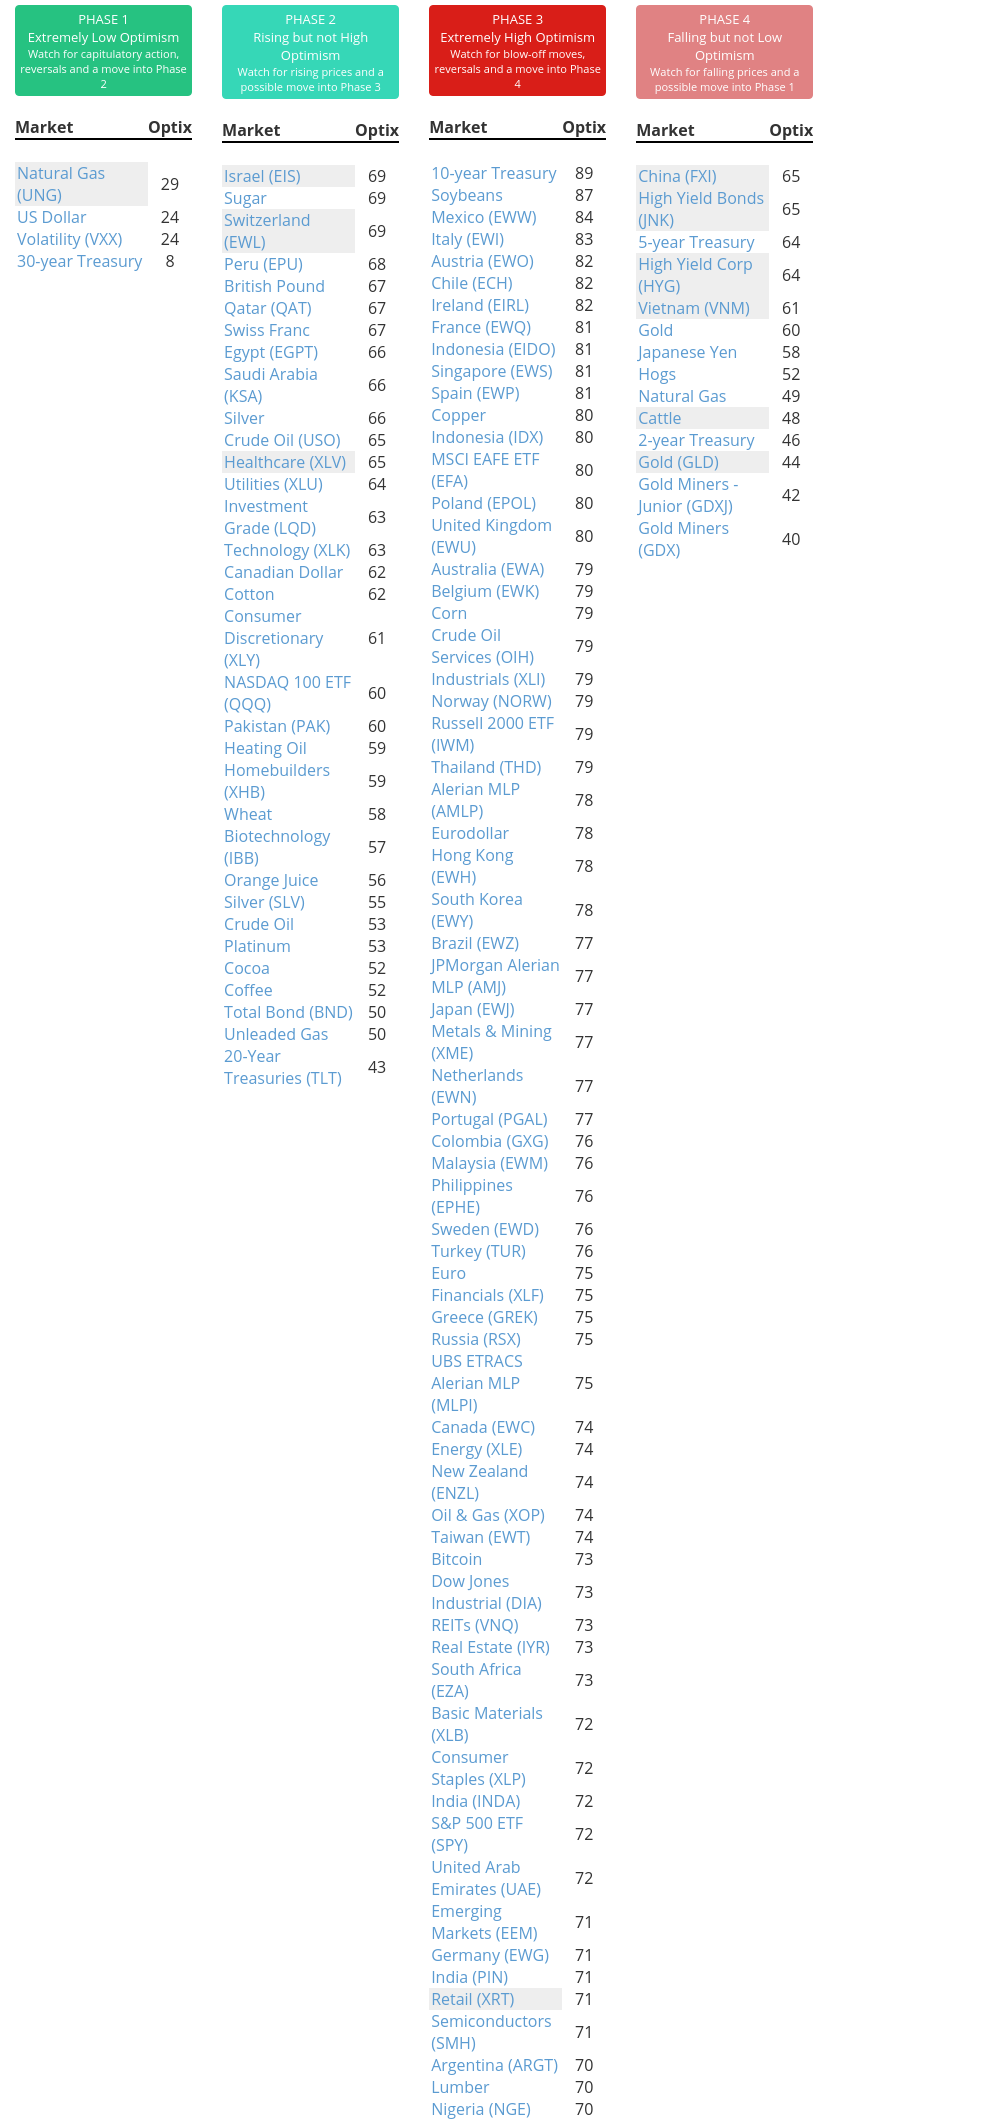
Phase Table
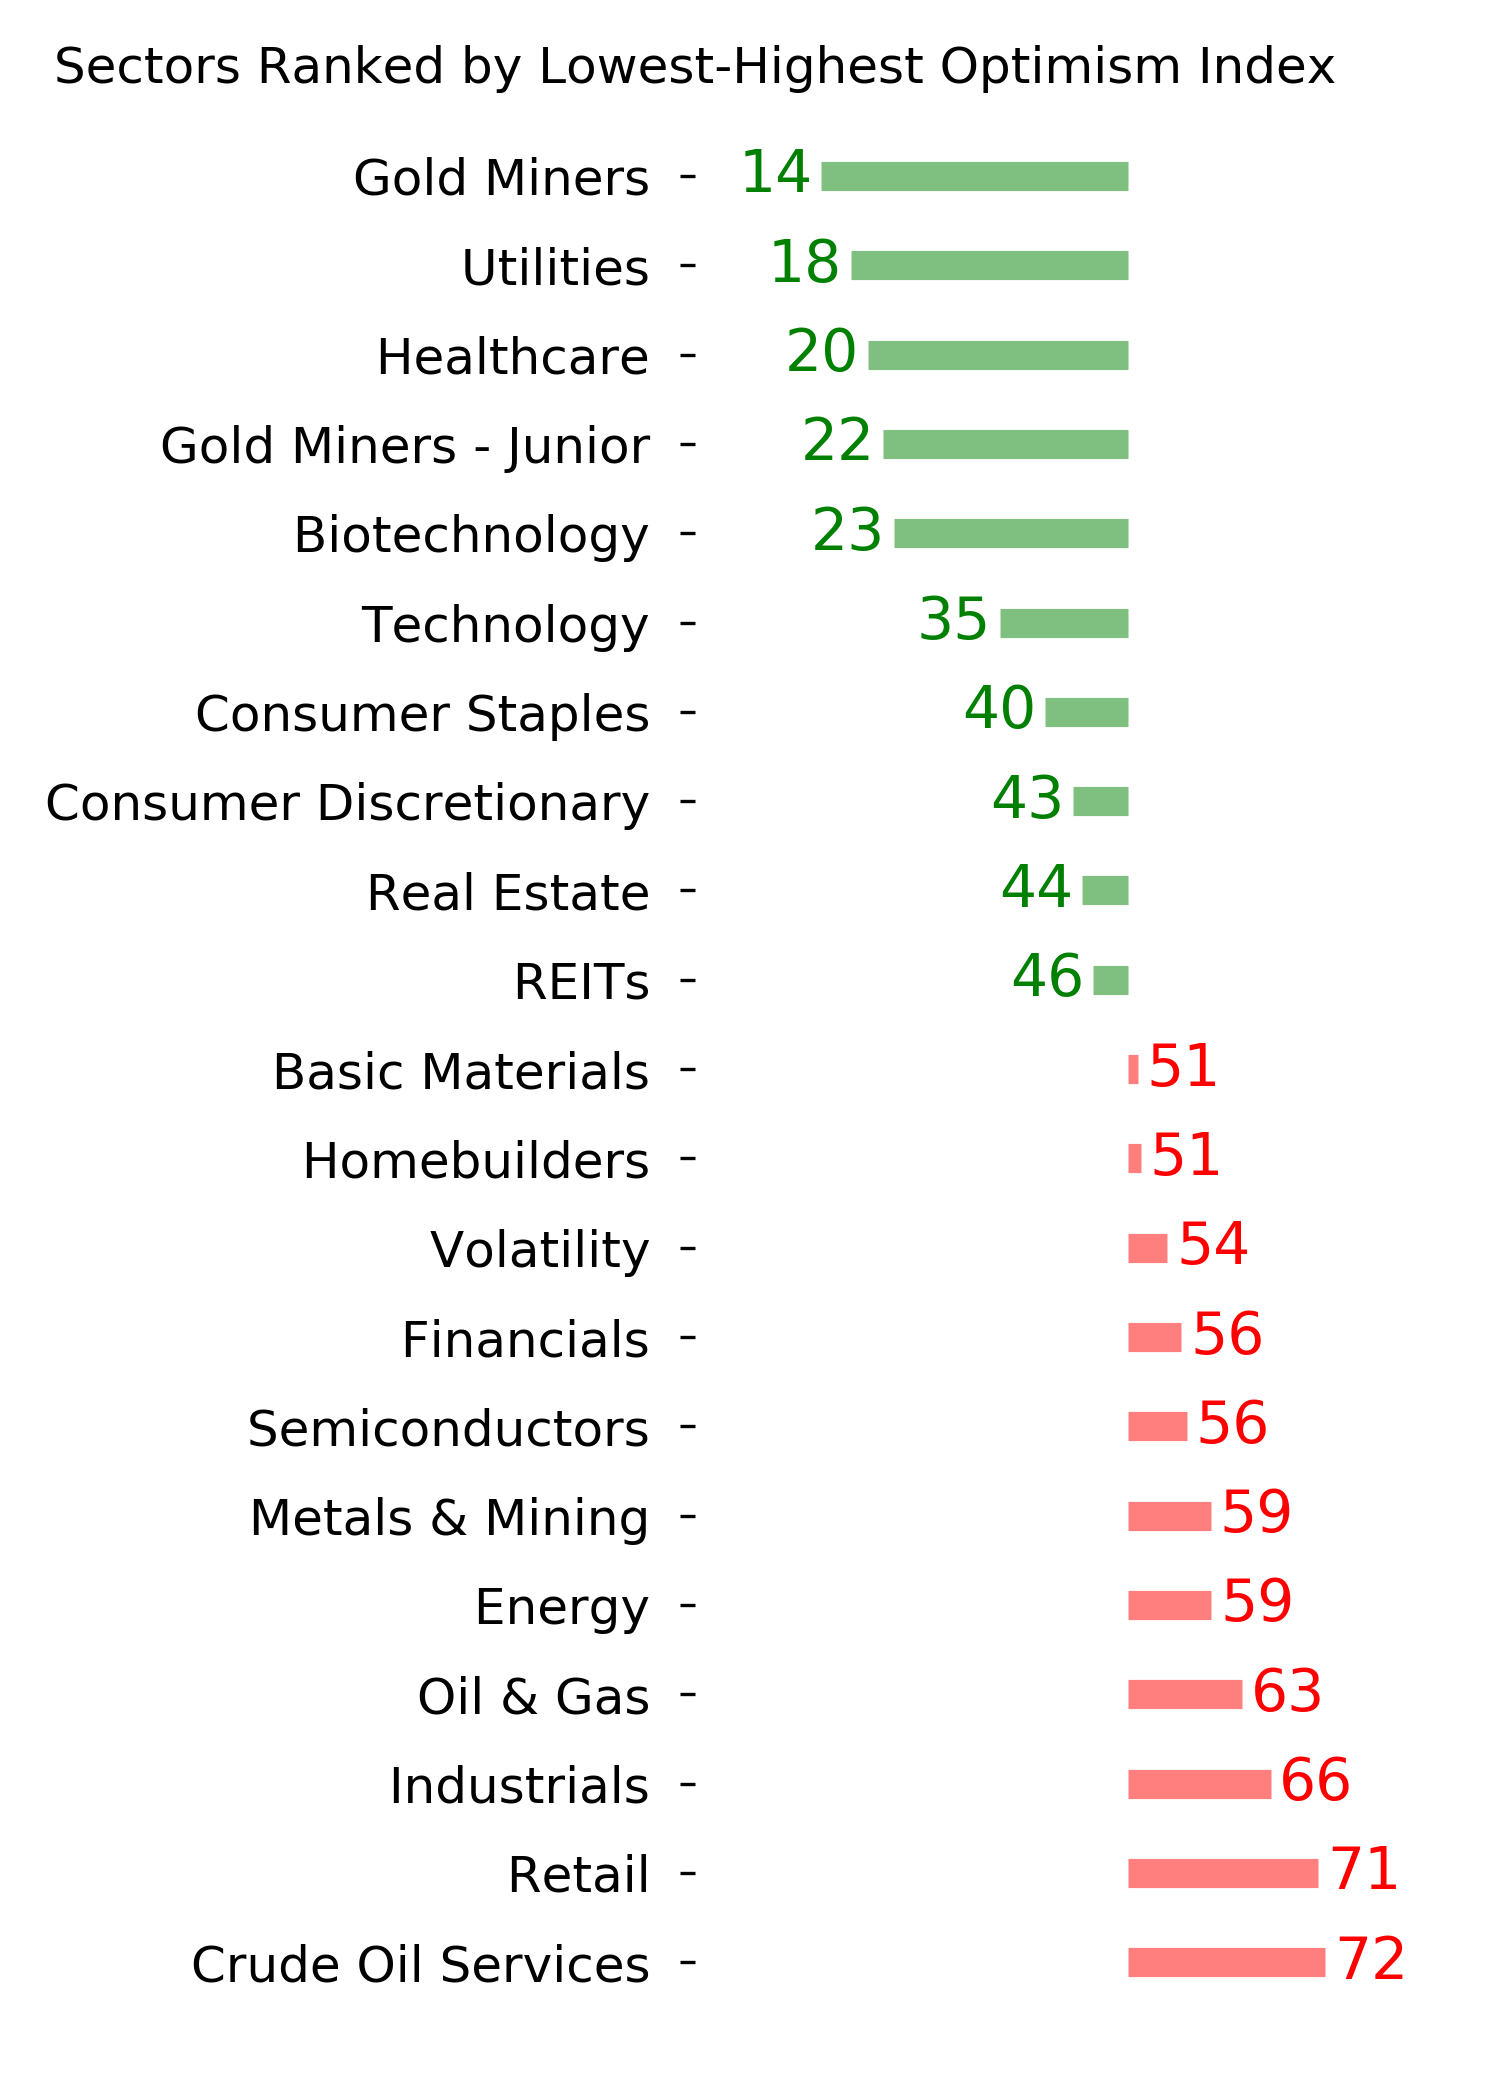
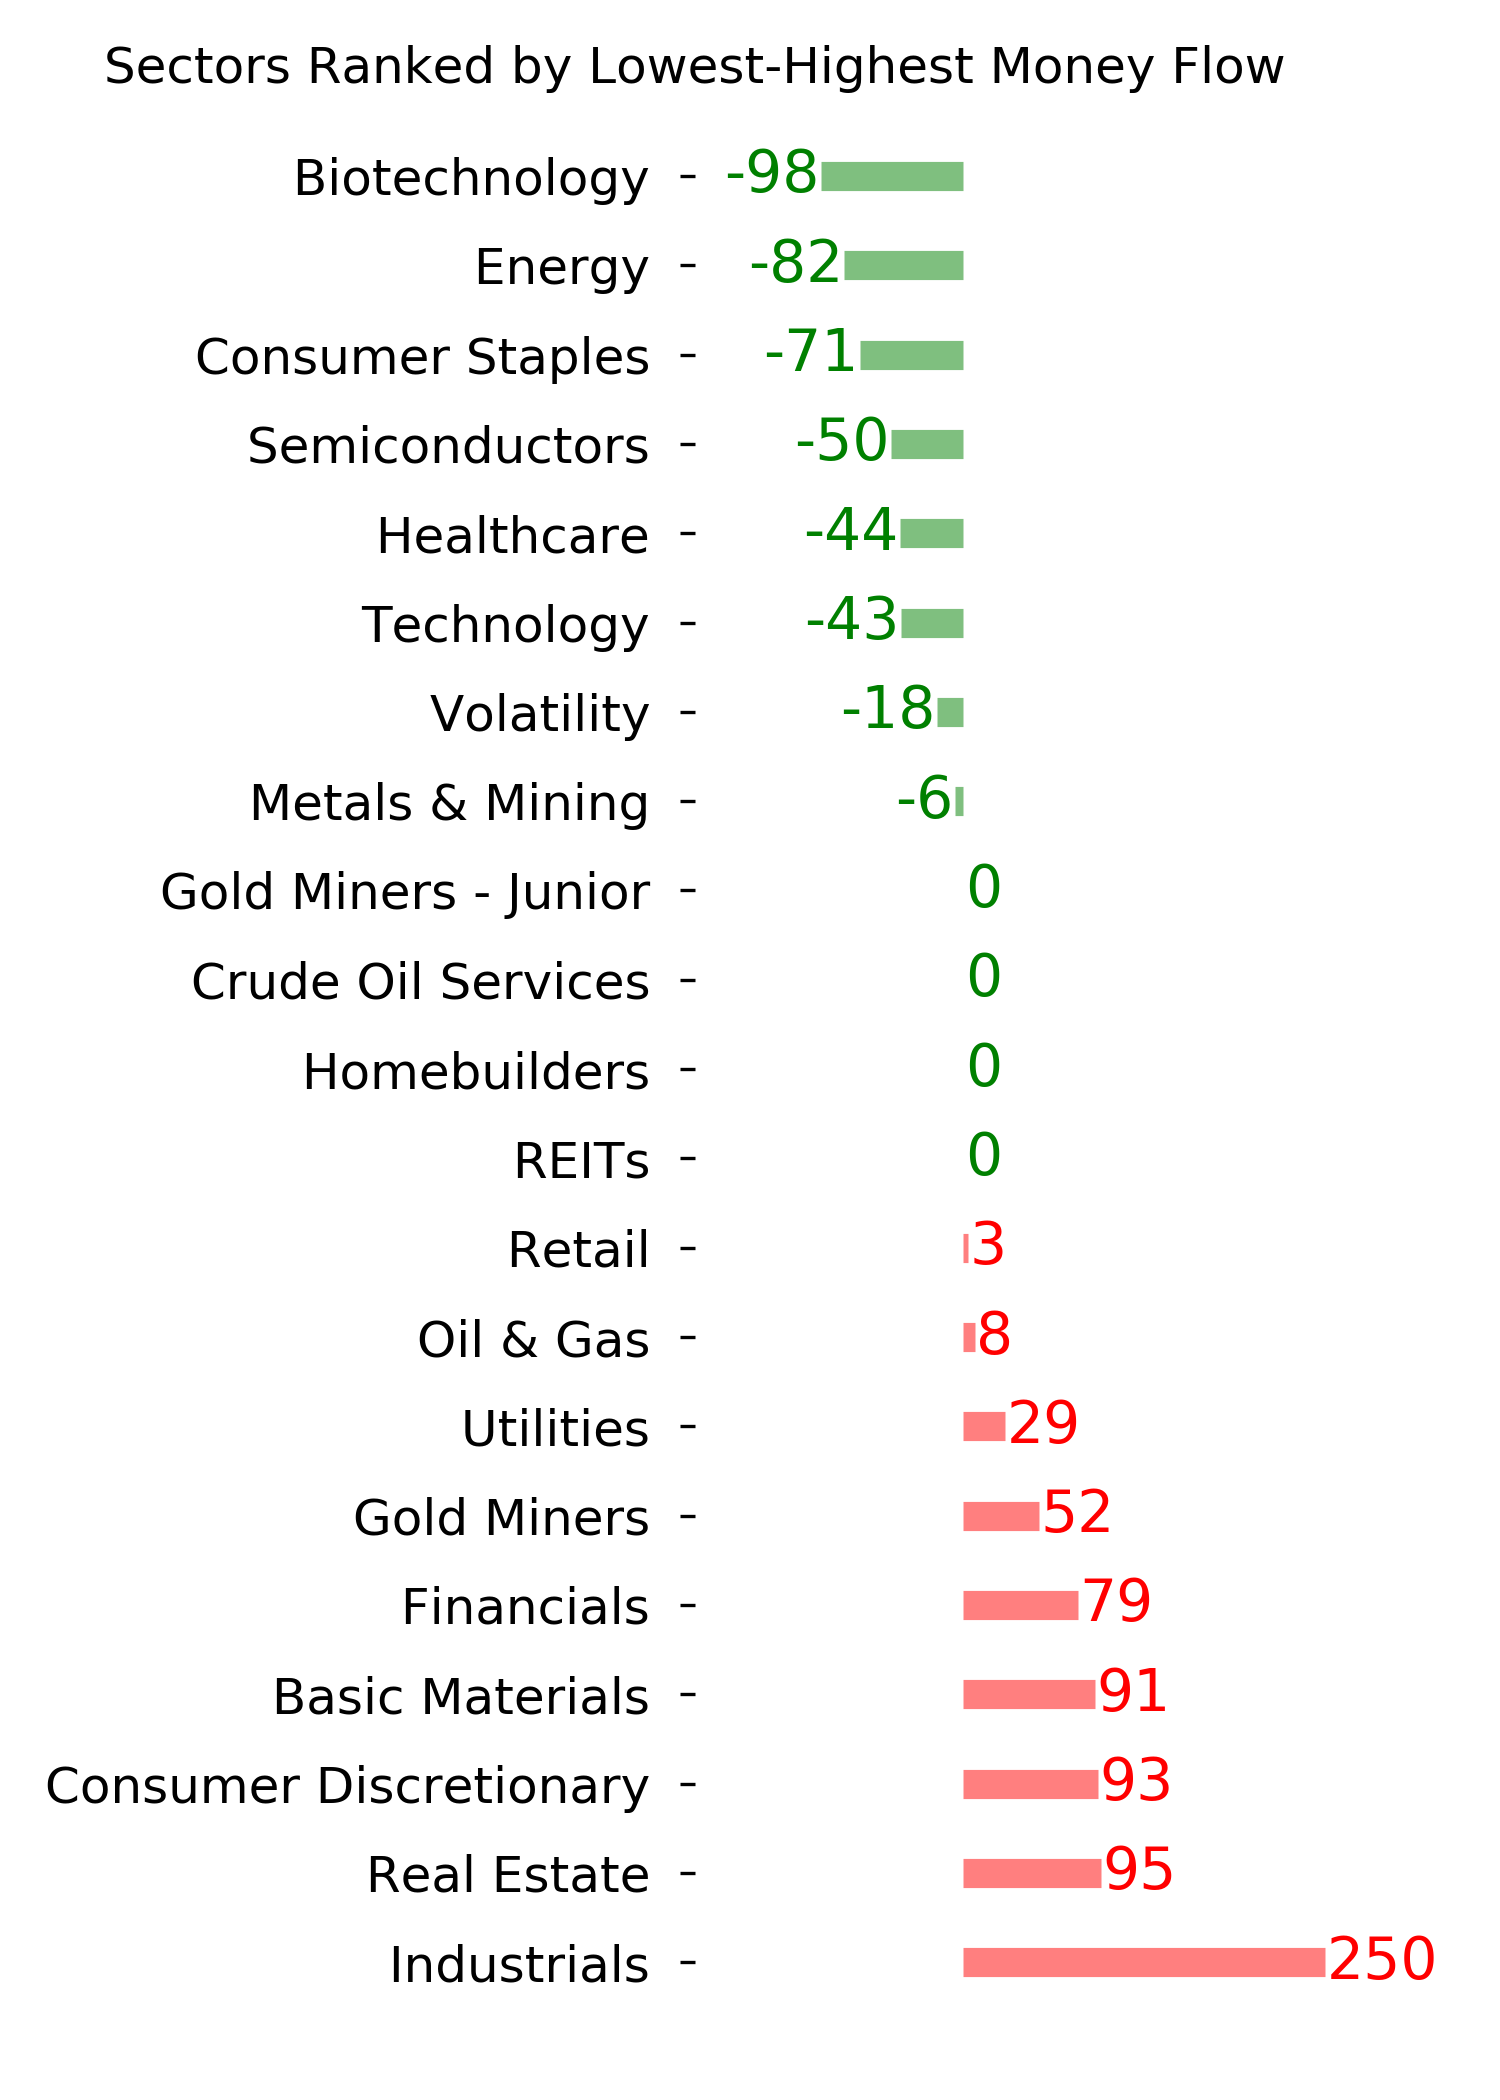
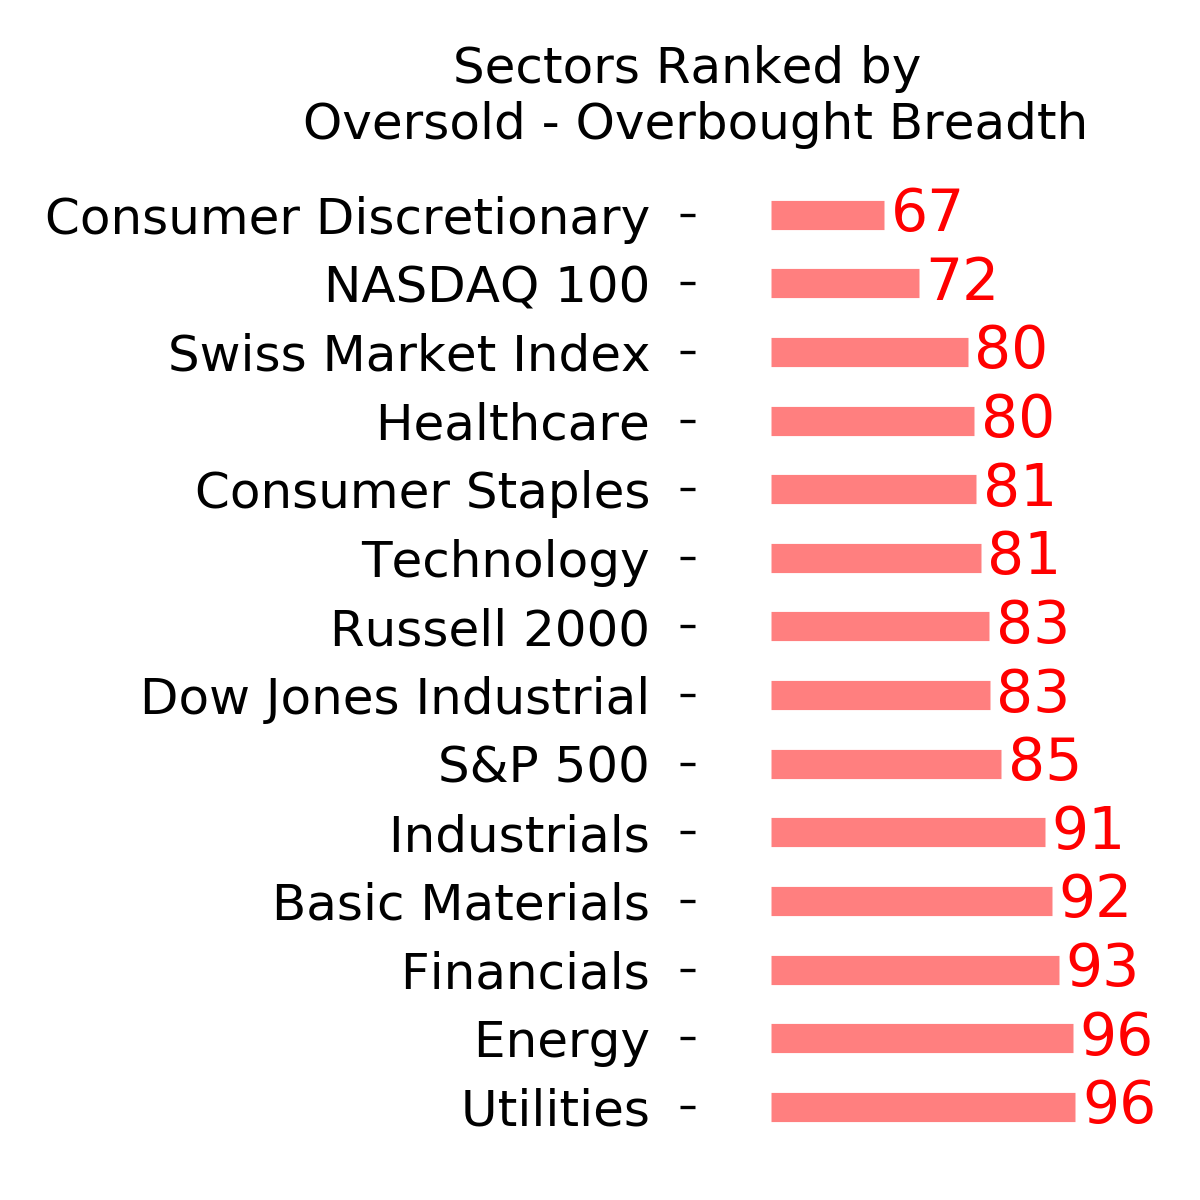
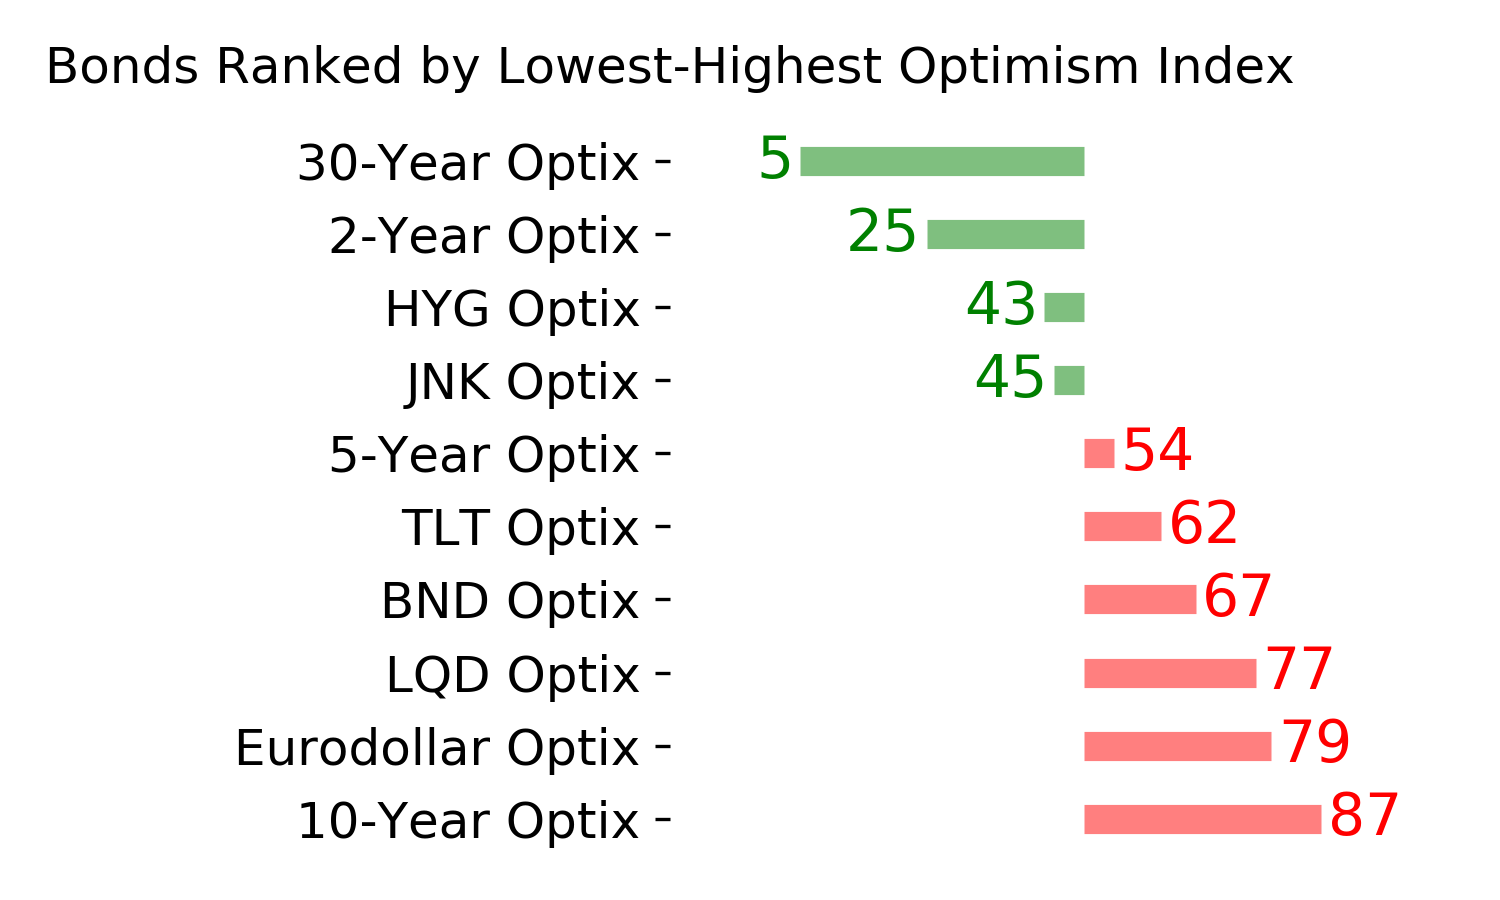
Ranks
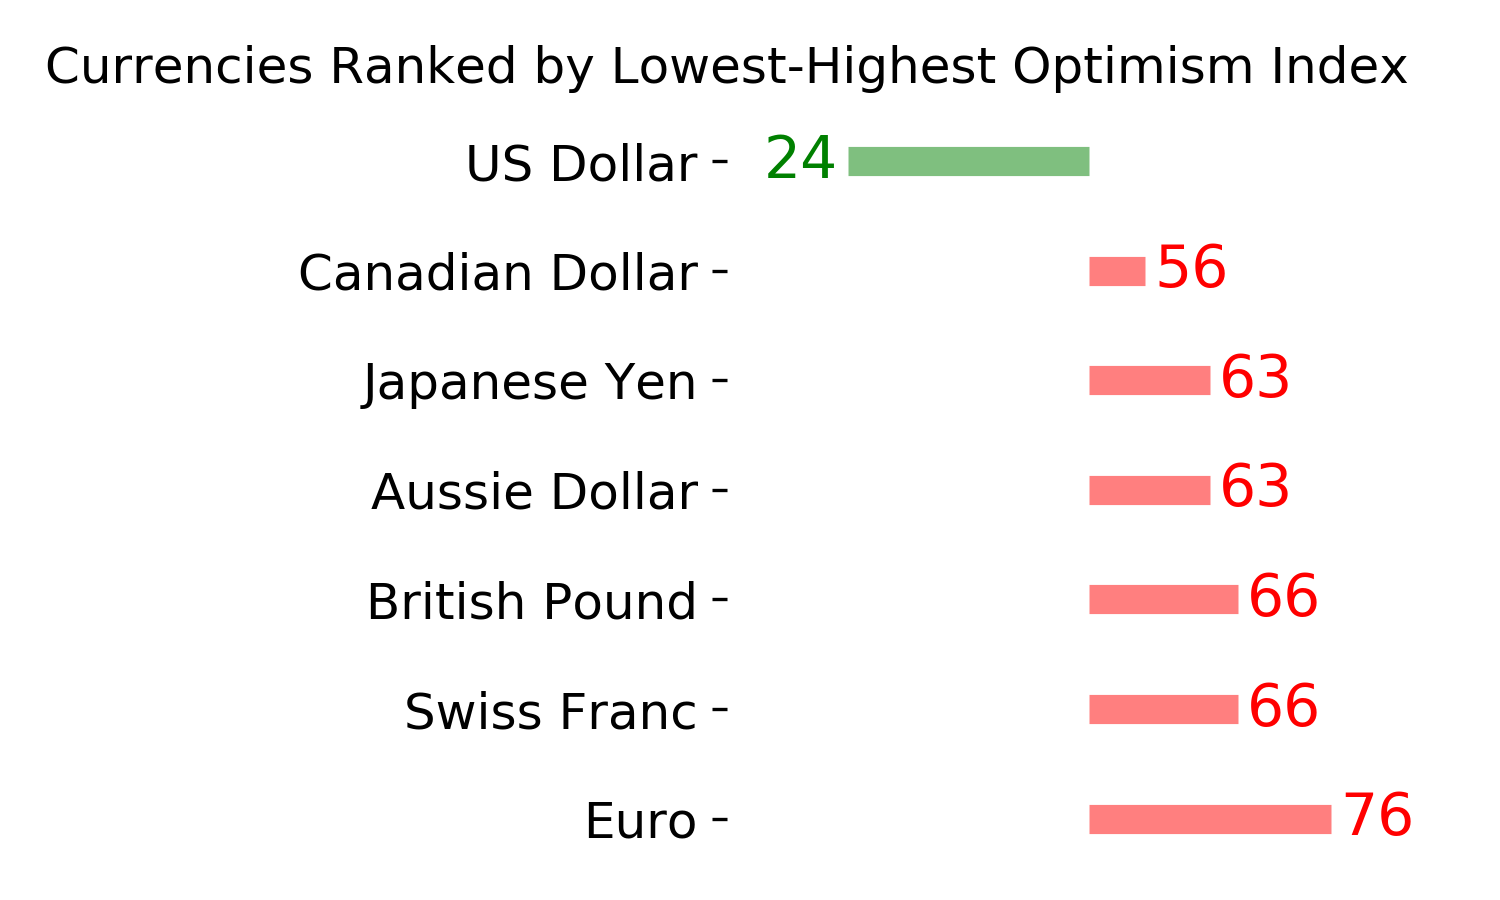
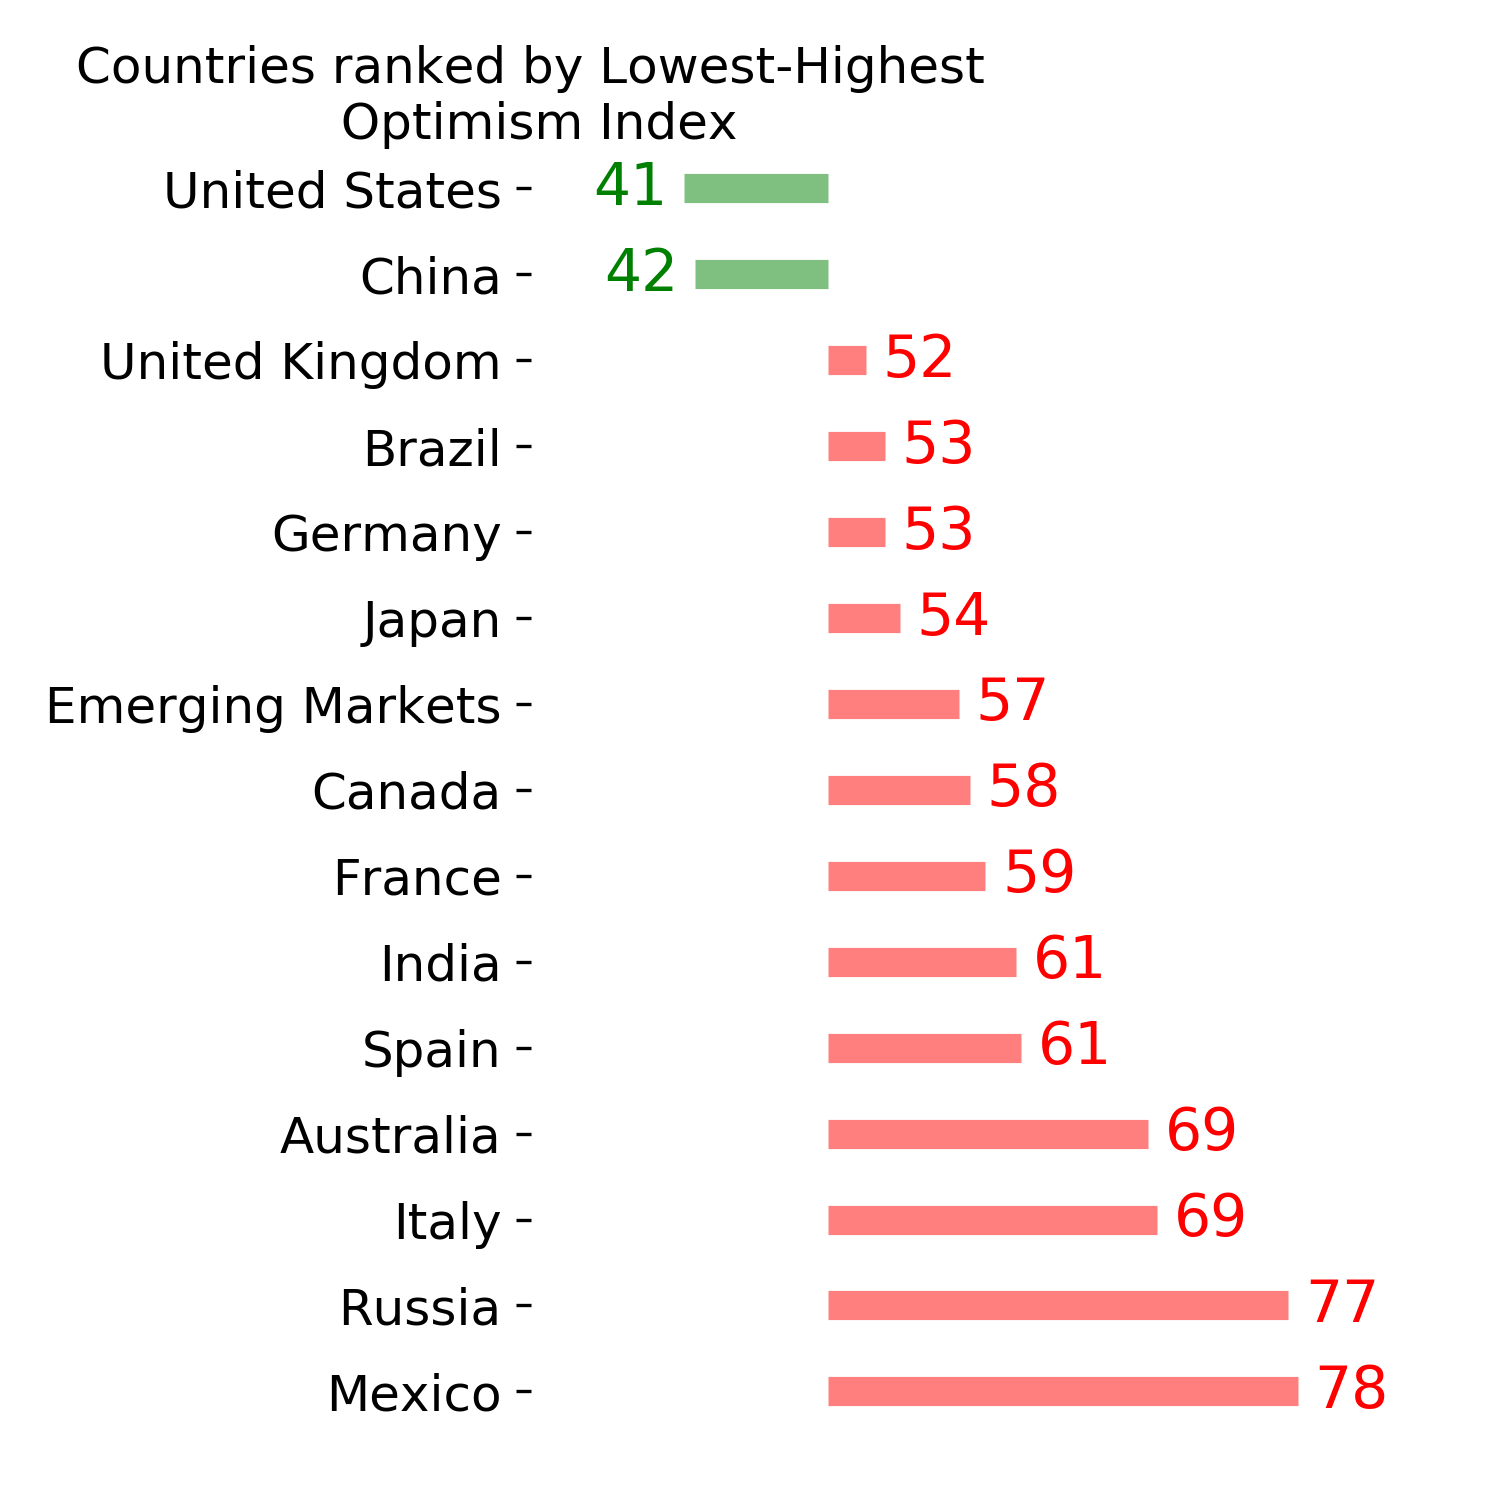
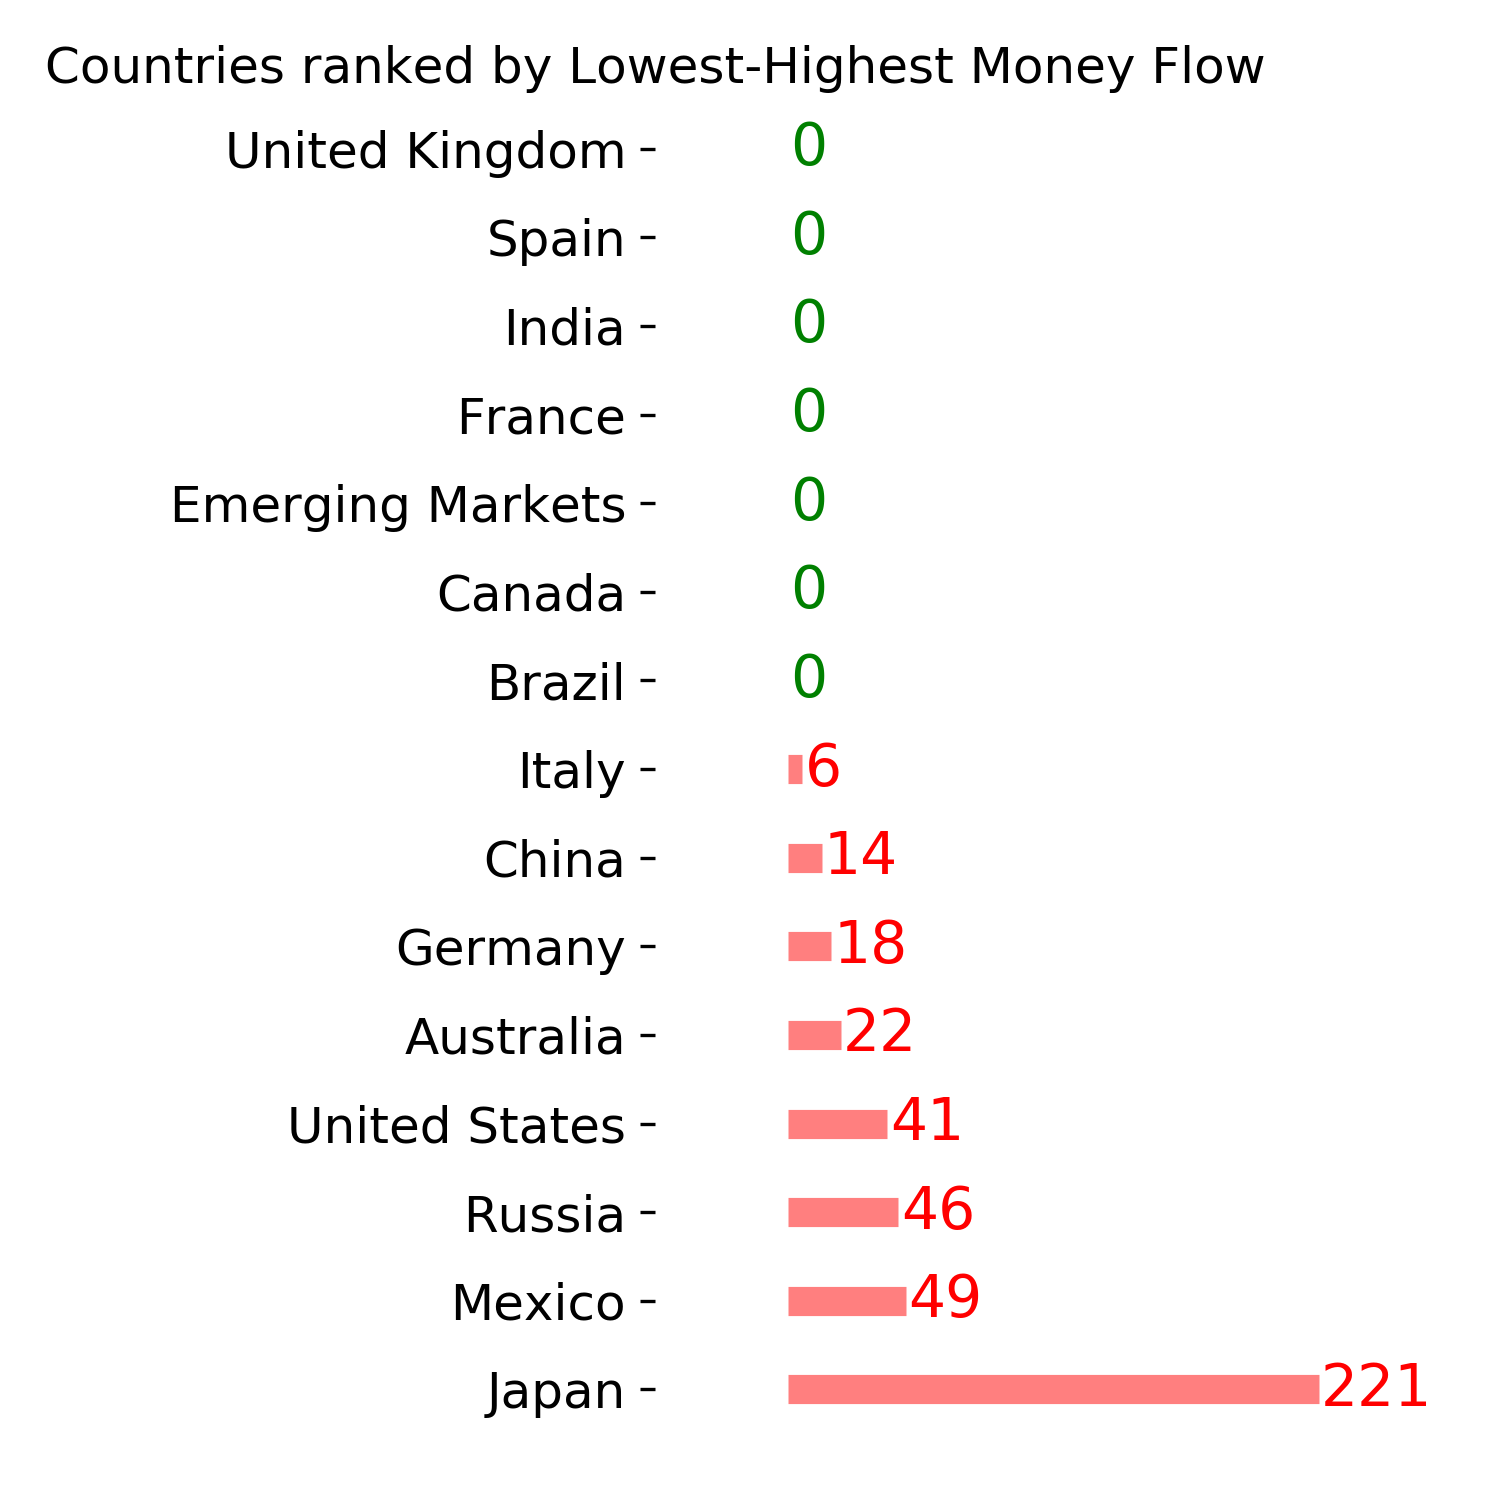
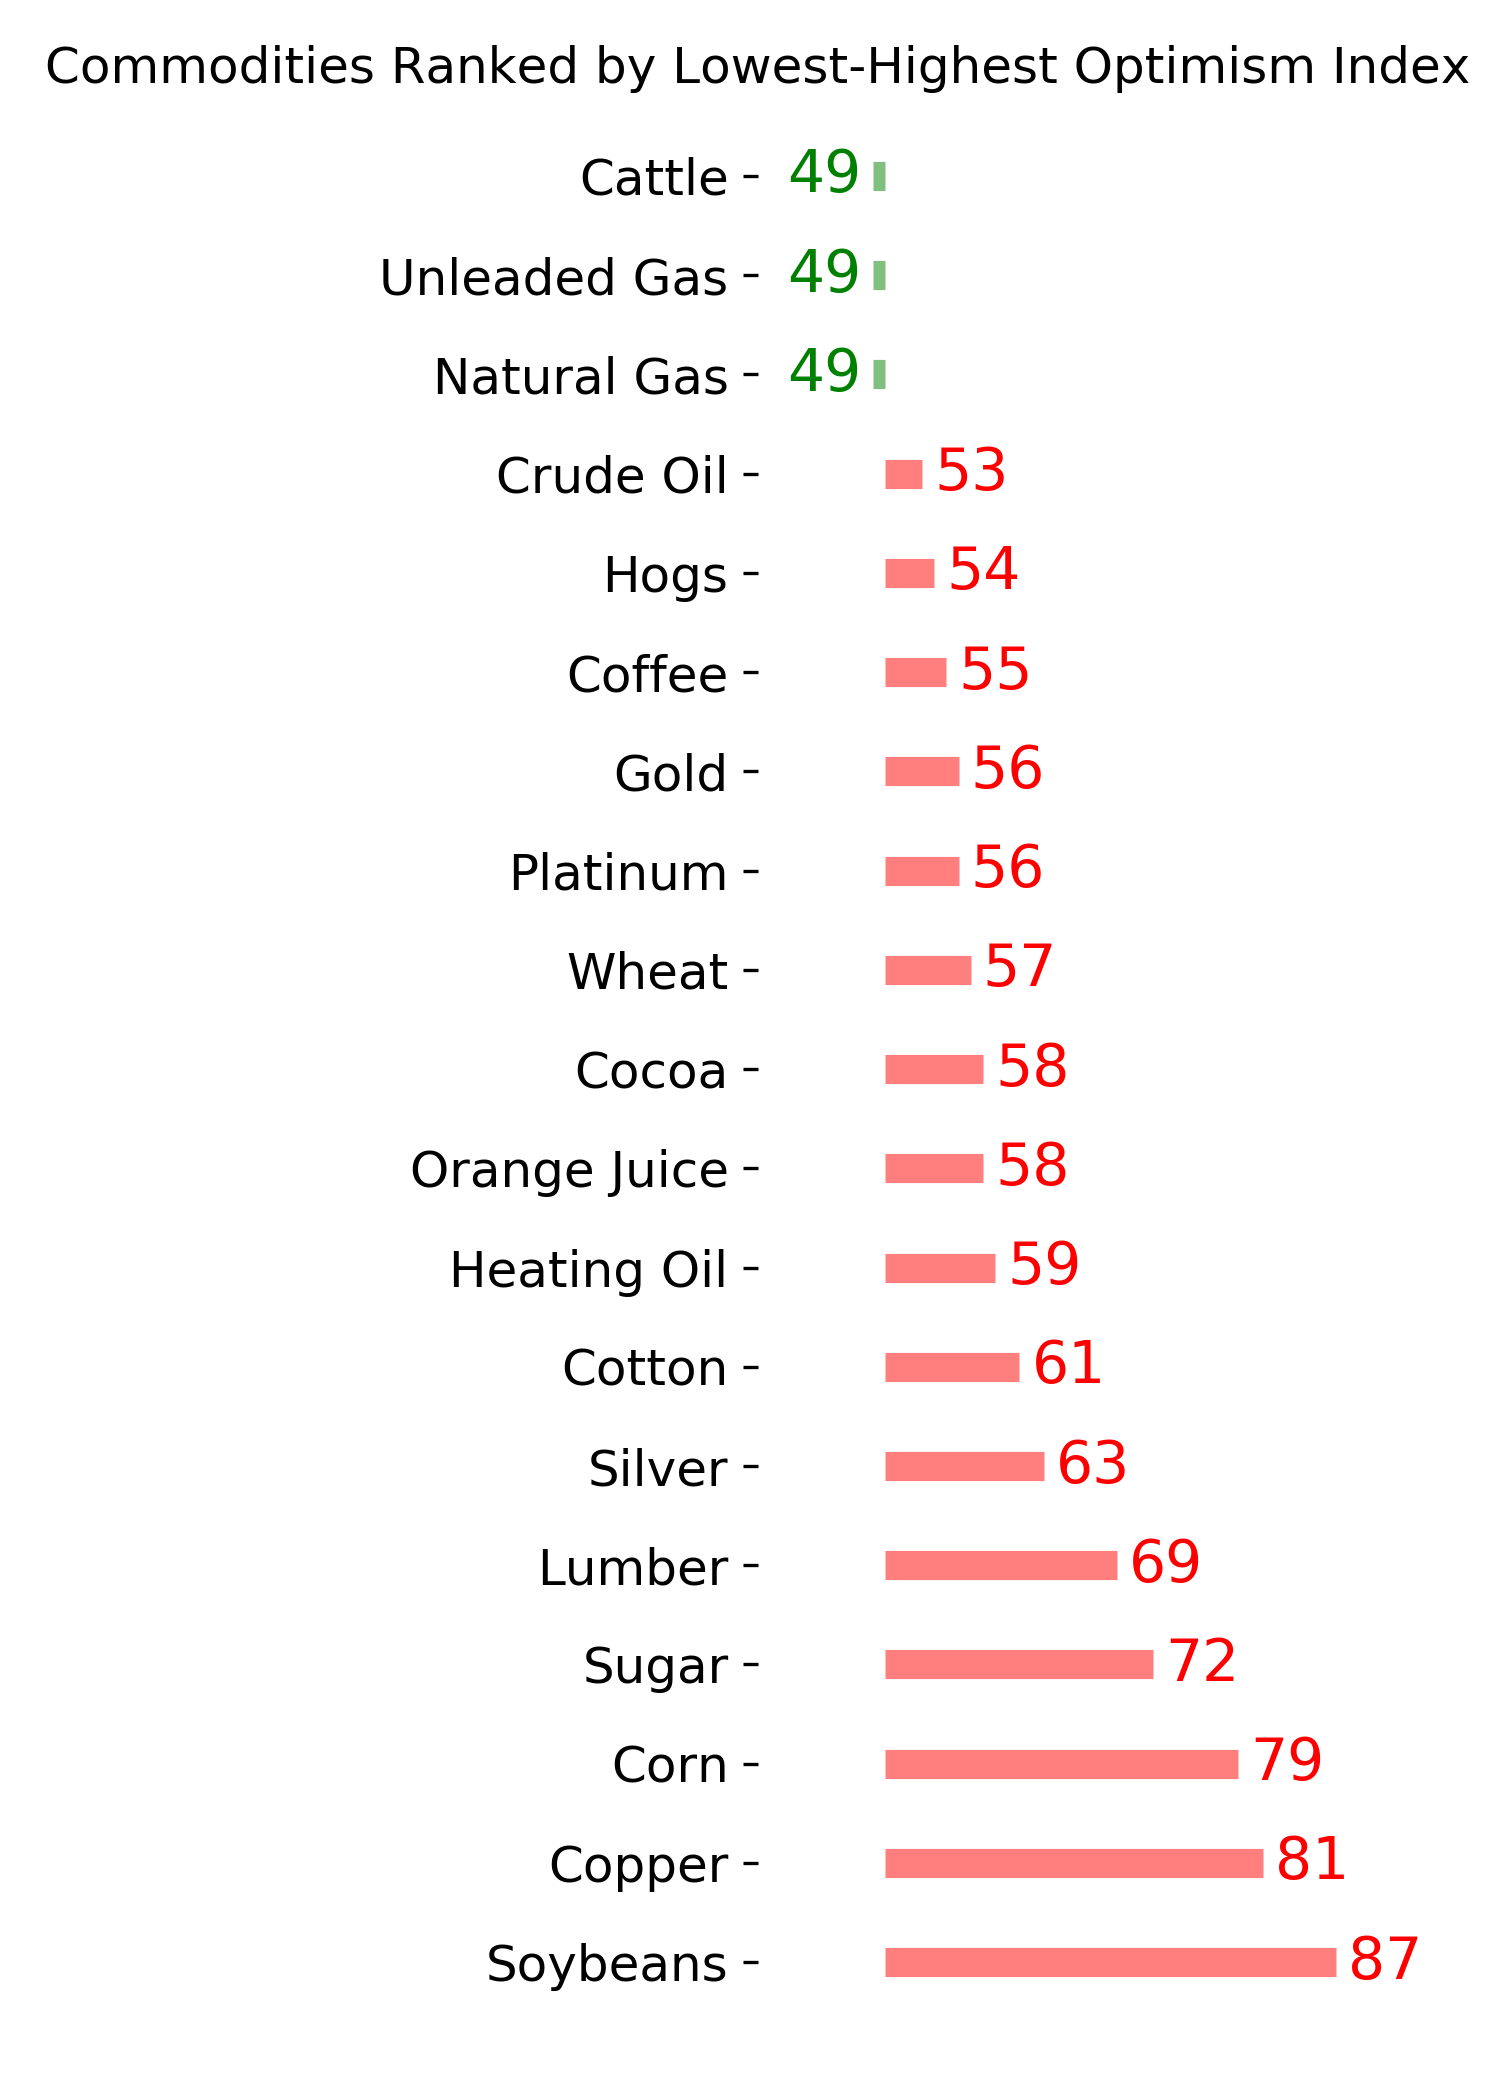
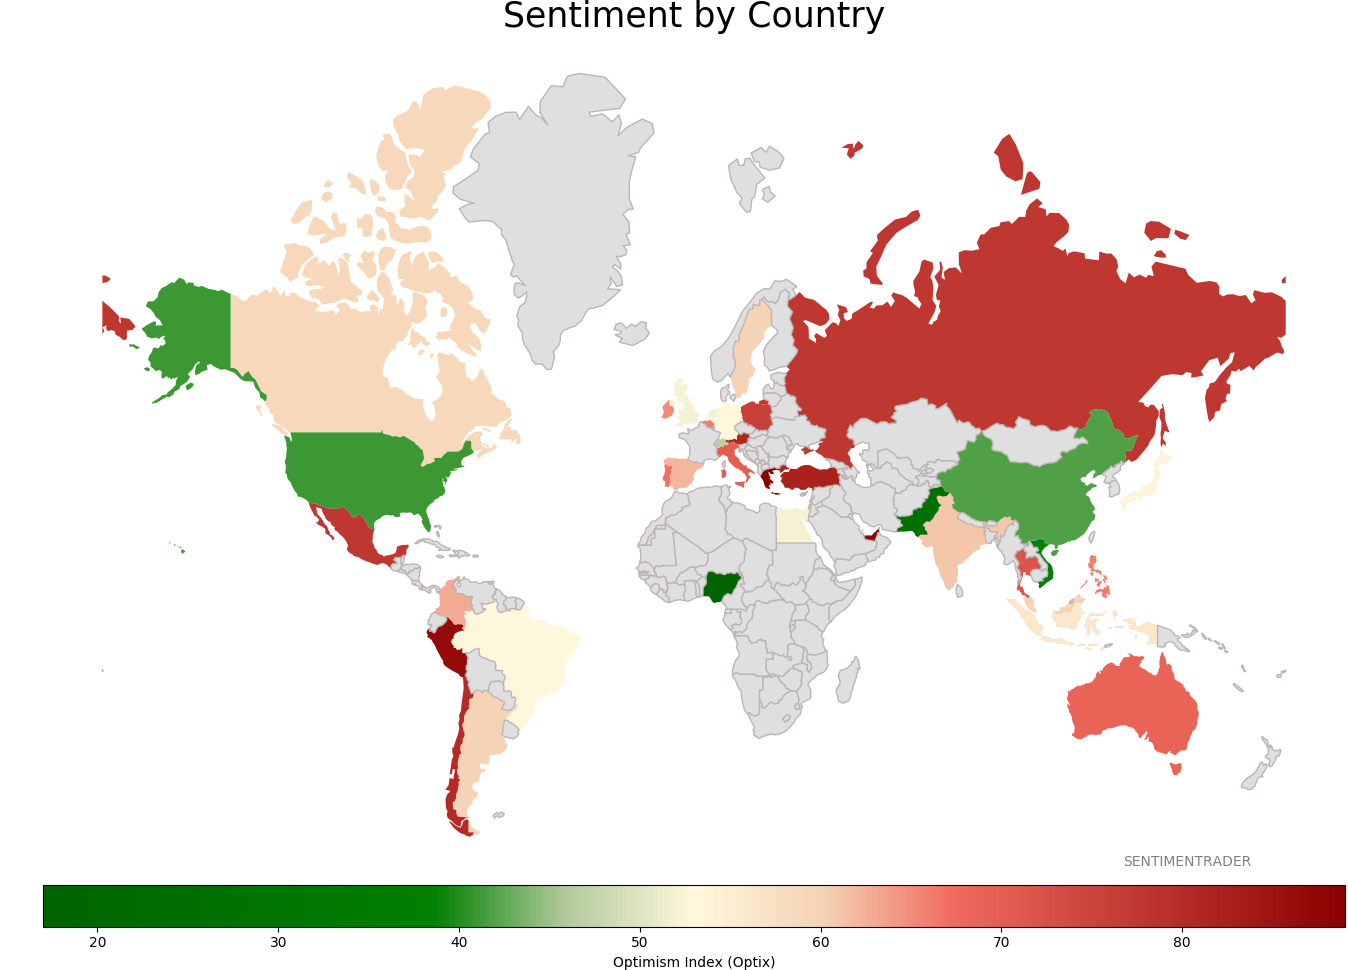
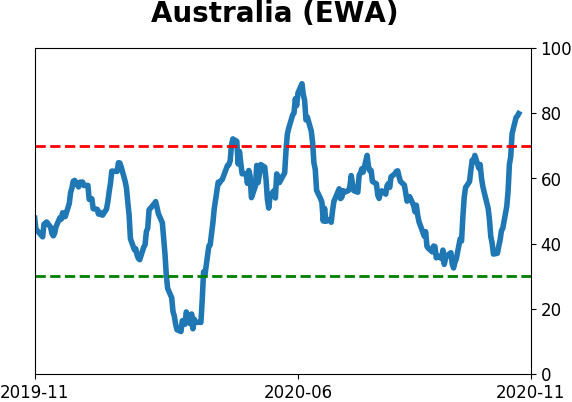
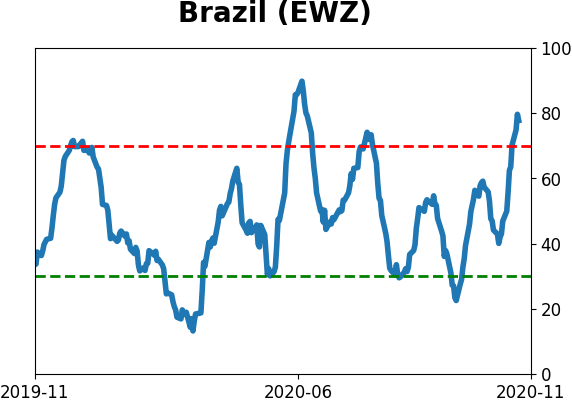
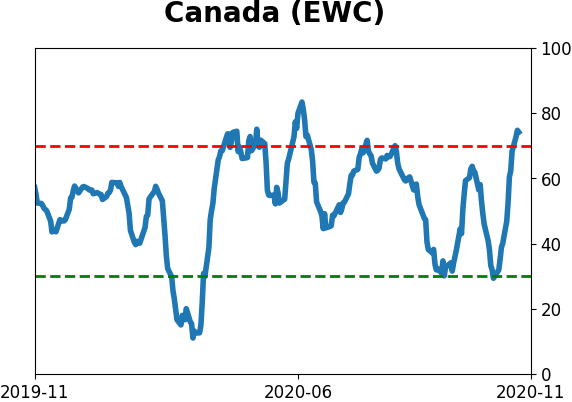
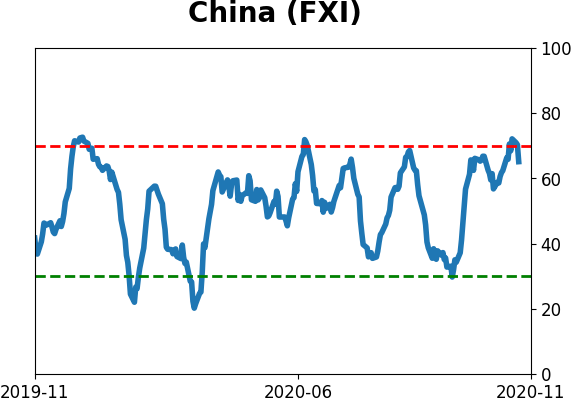
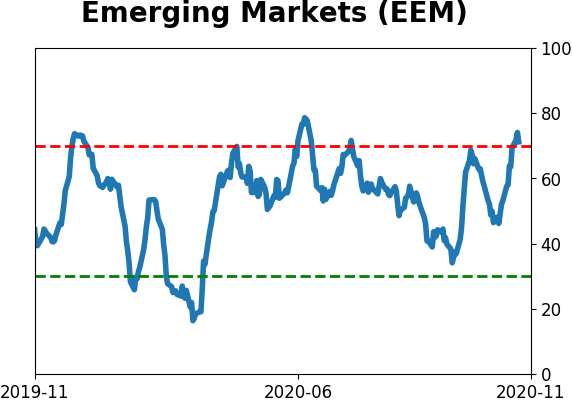
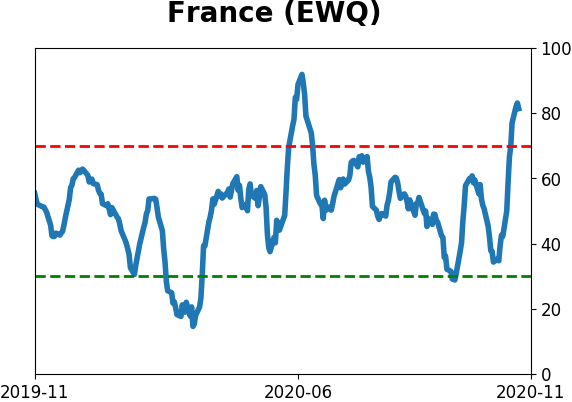
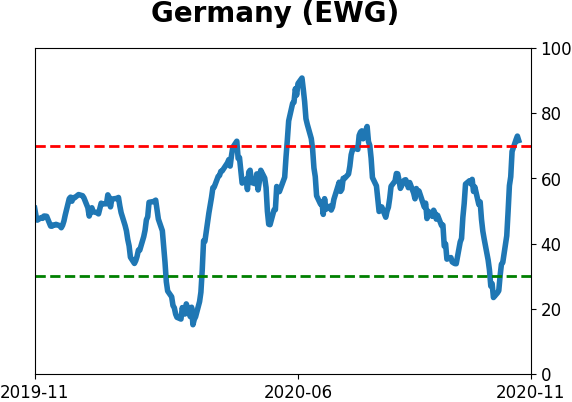
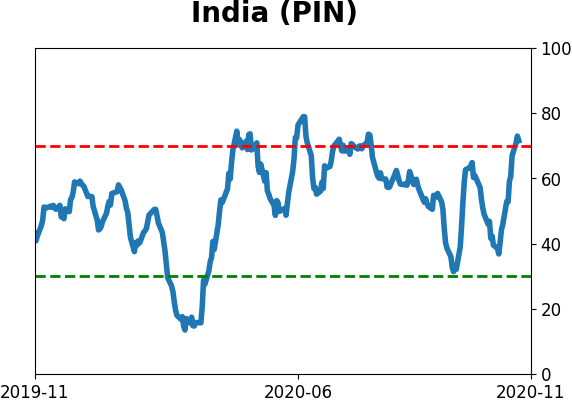
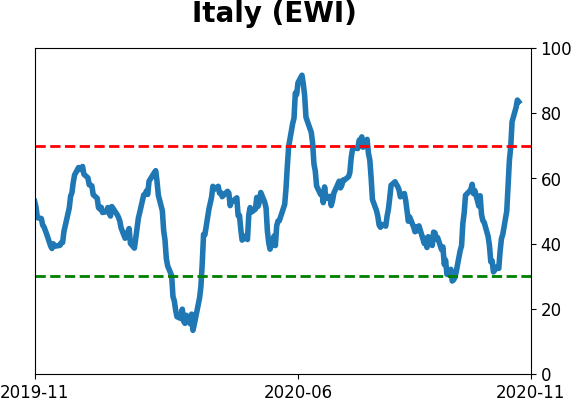
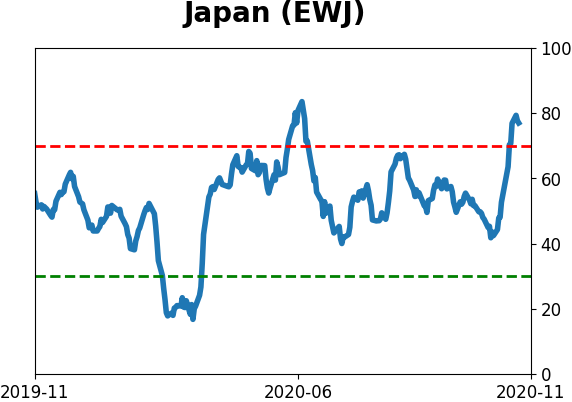
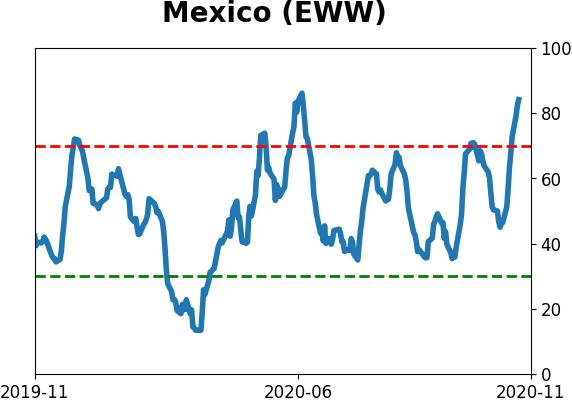
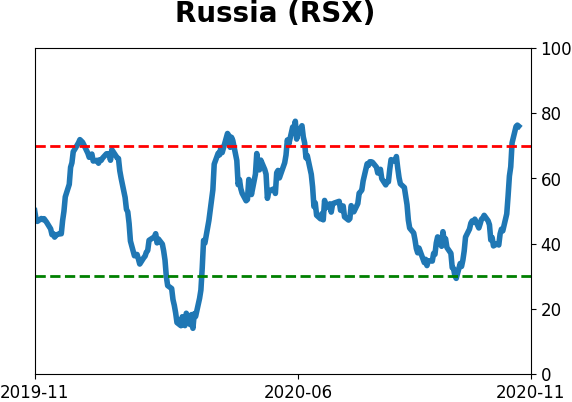
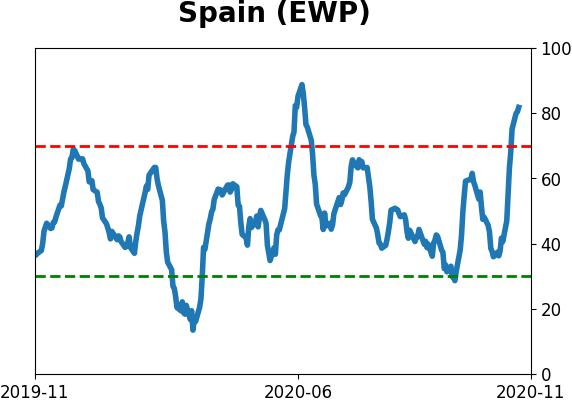
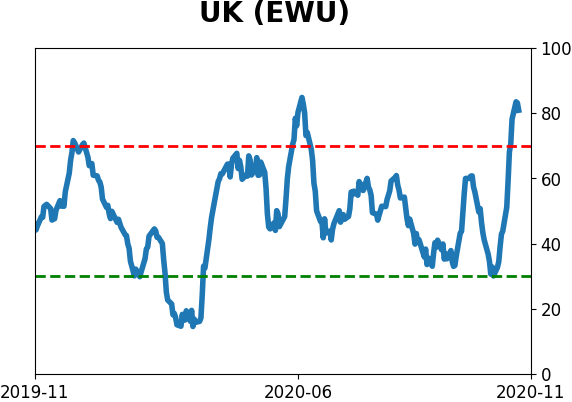
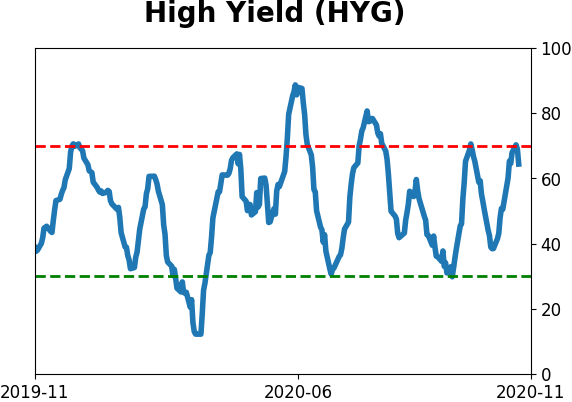
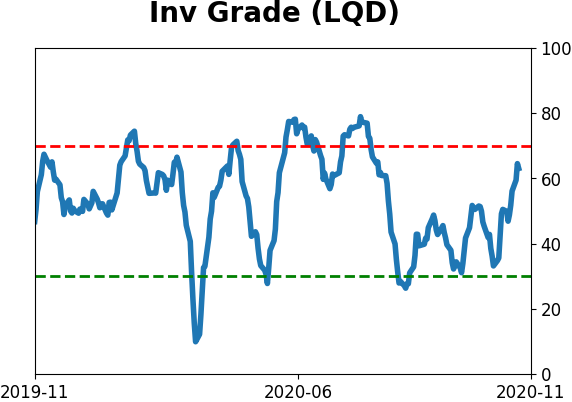
Sentiment Around The World
Optimism Index Thumbnails
|
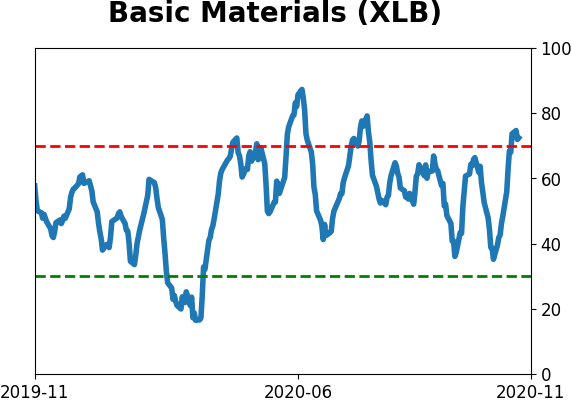
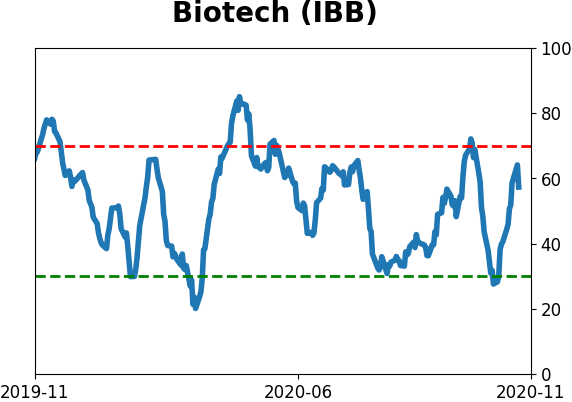
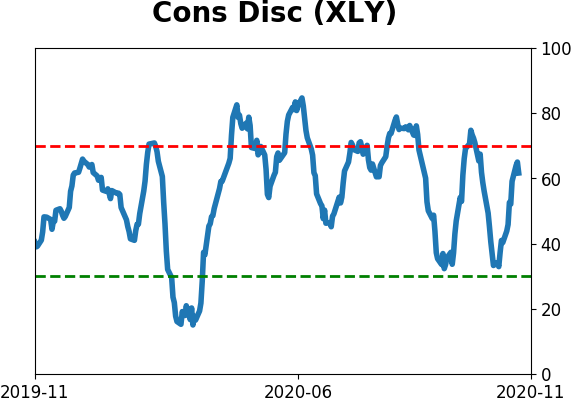
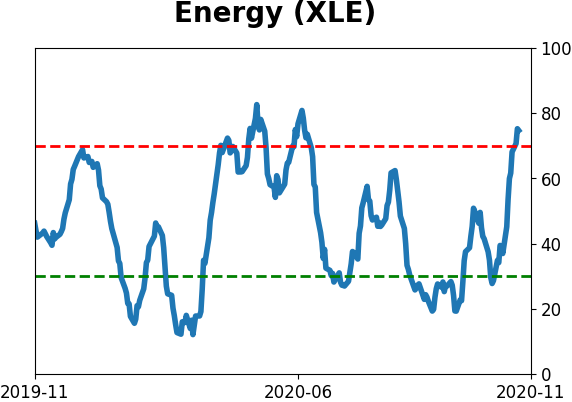
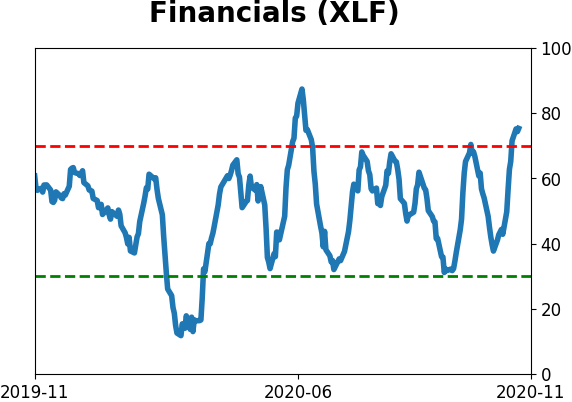
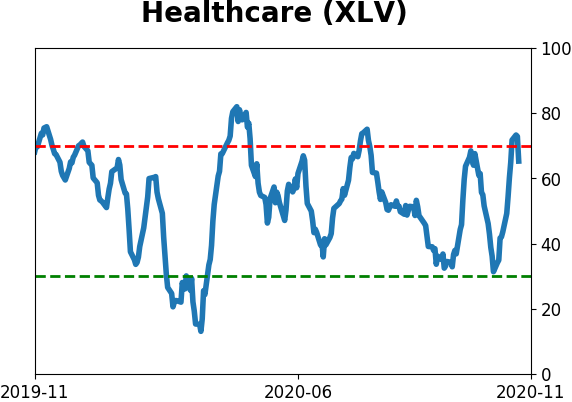
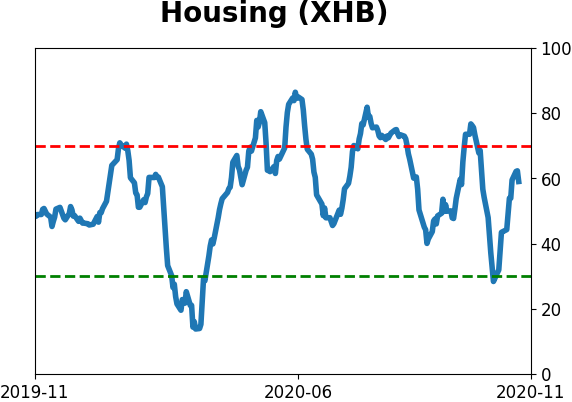
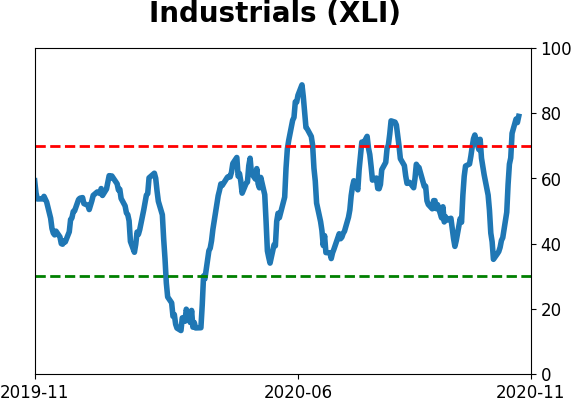
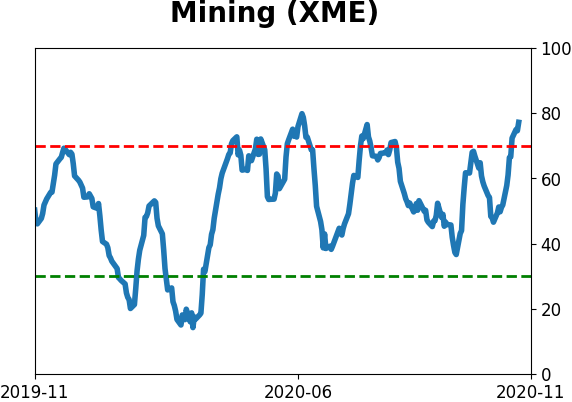
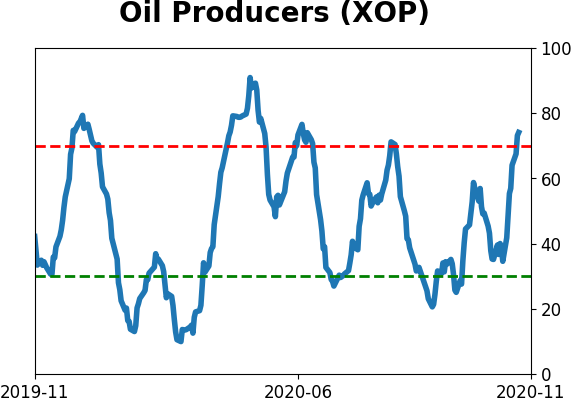
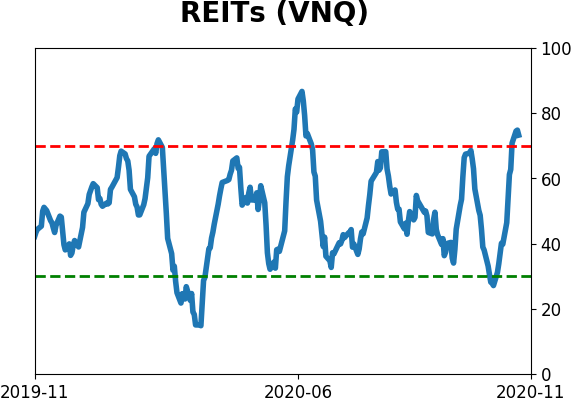
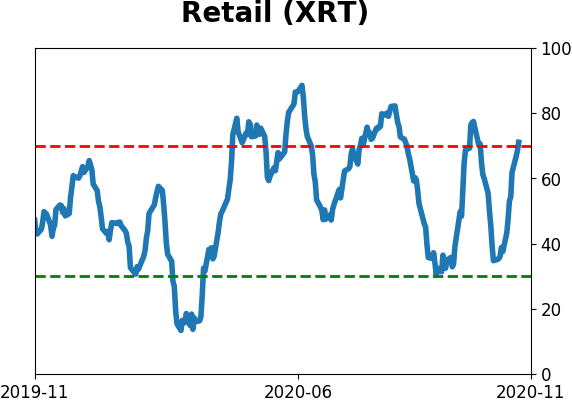
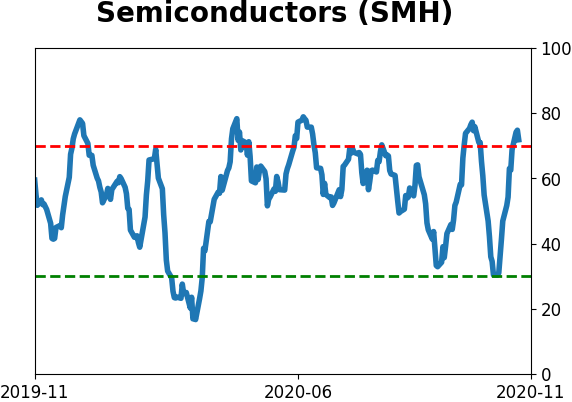
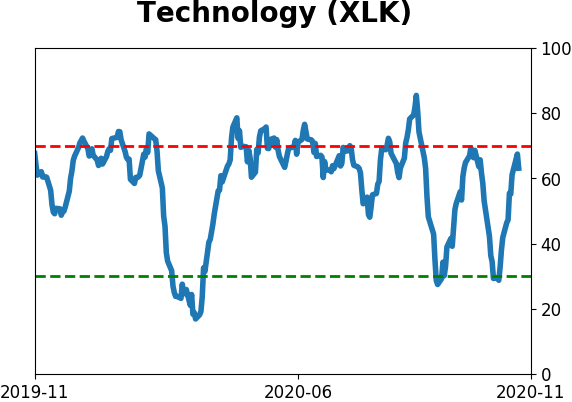
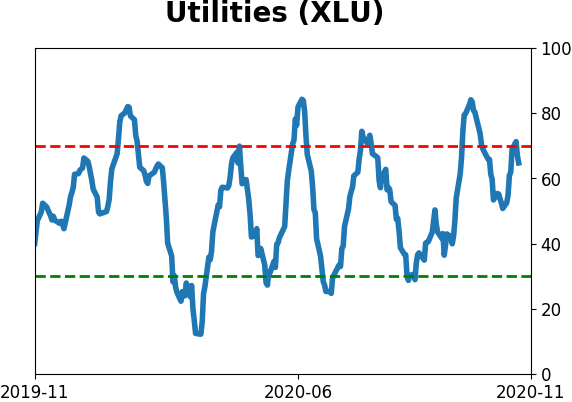
Sector ETF's - 10-Day Moving Average
|
|
|
Country ETF's - 10-Day Moving Average
|
|
|
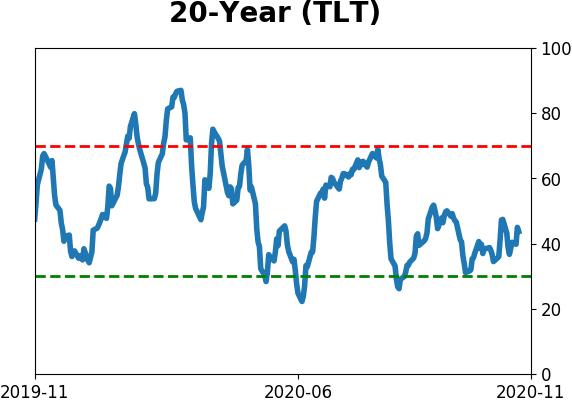
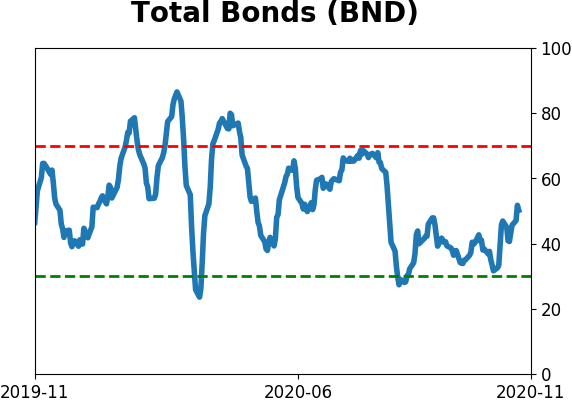
Bond ETF's - 10-Day Moving Average
|
|
|
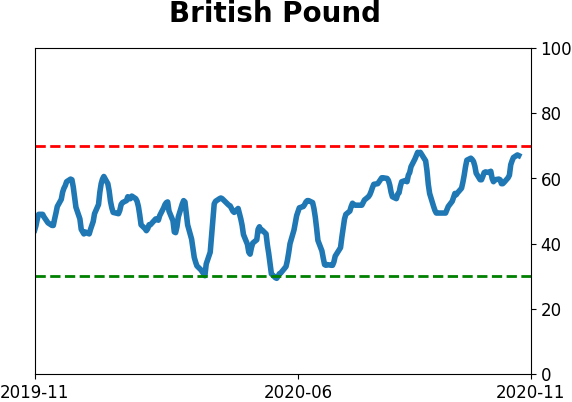
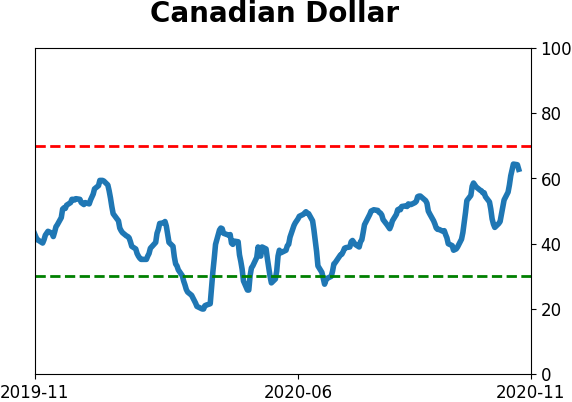
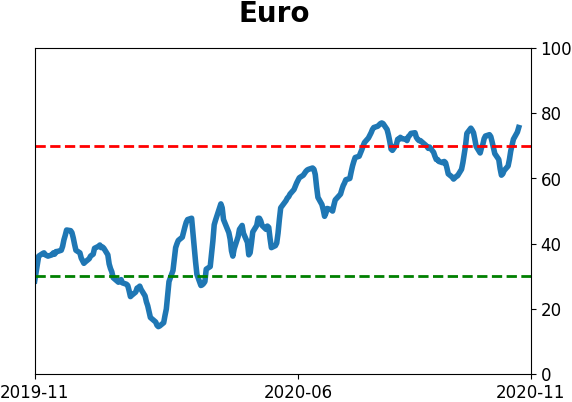
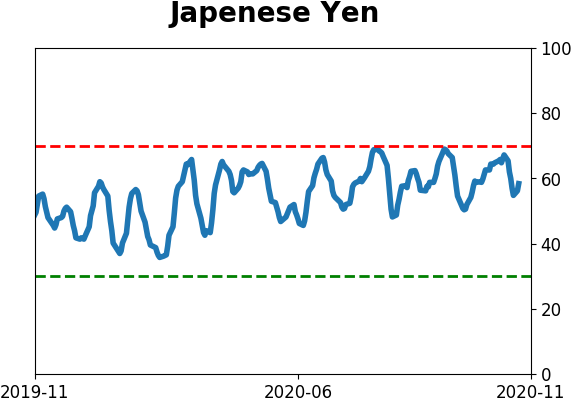
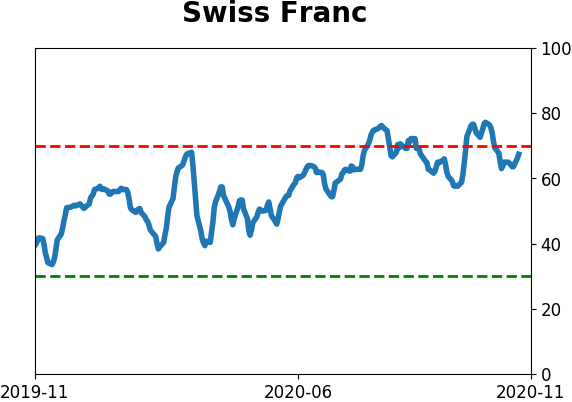
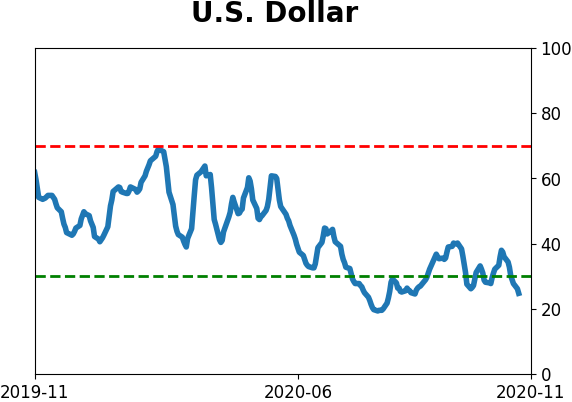
Currency ETF's - 5-Day Moving Average
|
|
|
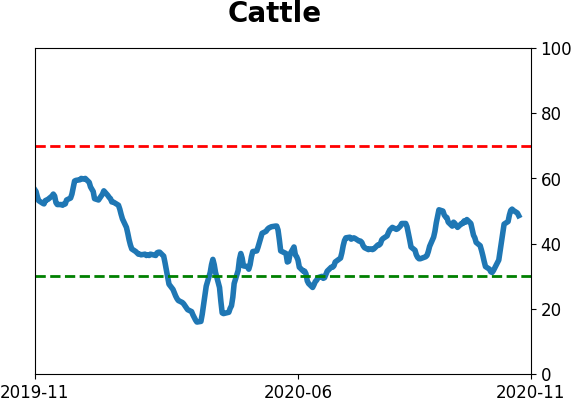
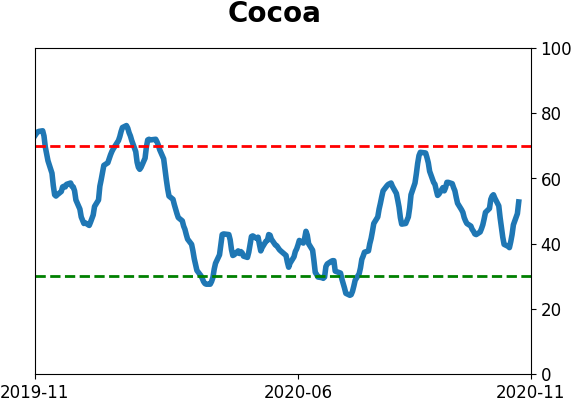
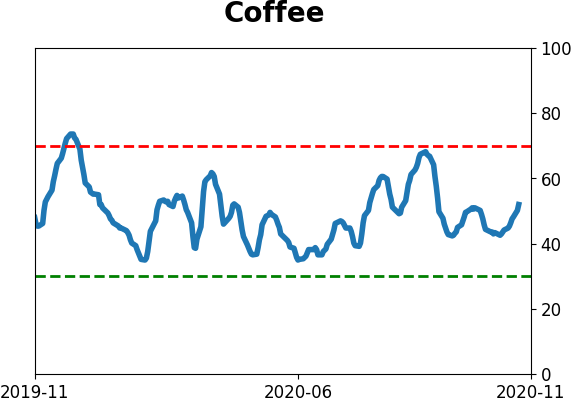
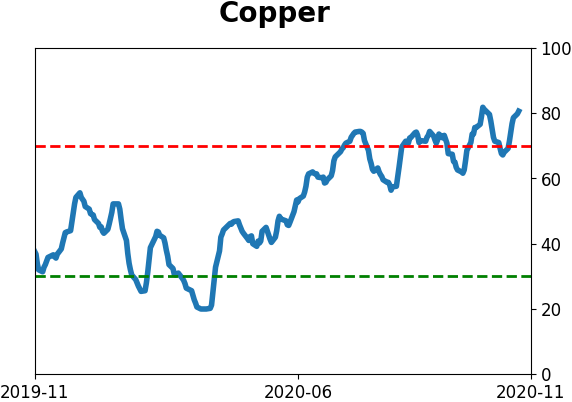
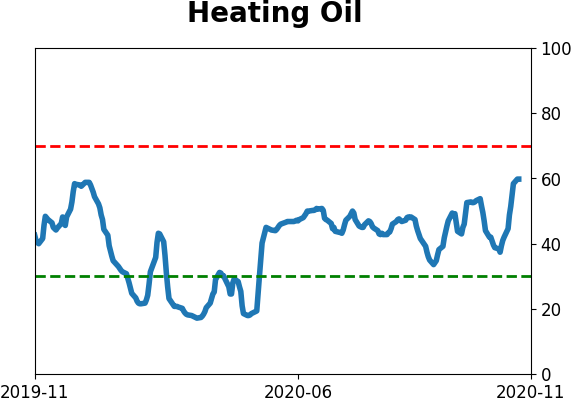
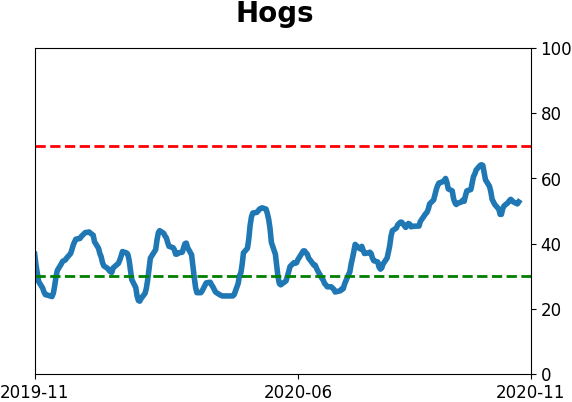
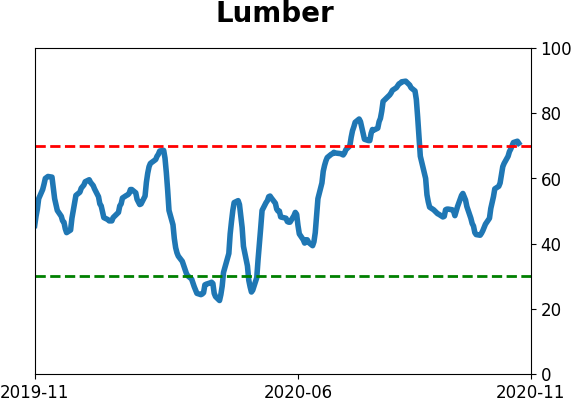
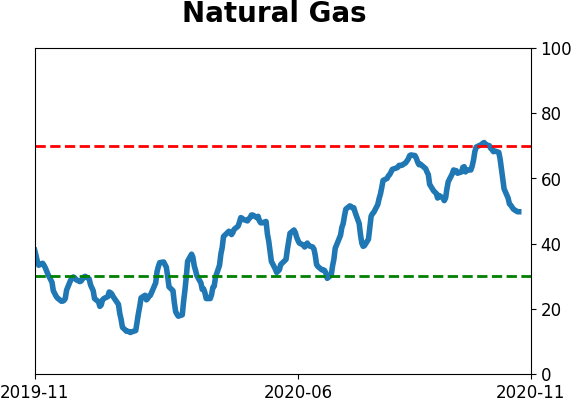
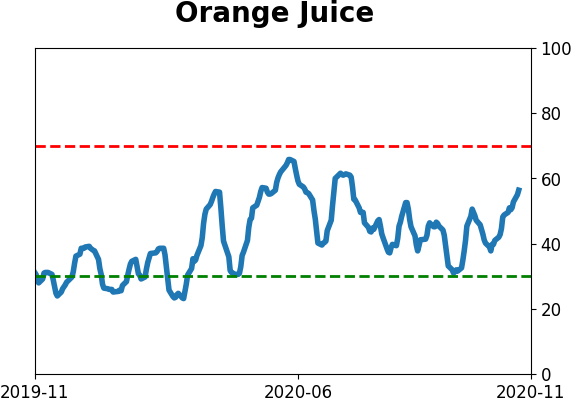
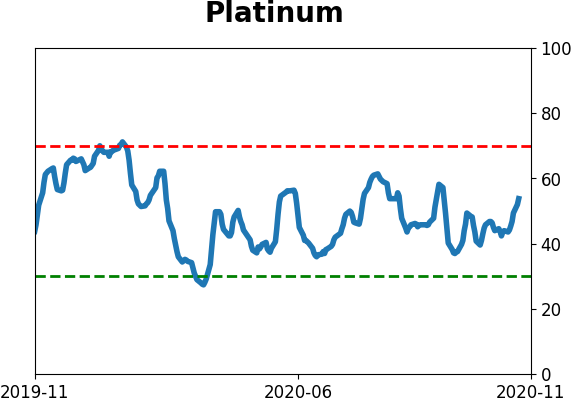
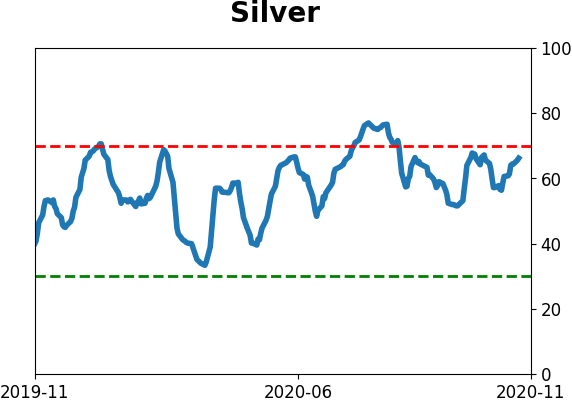
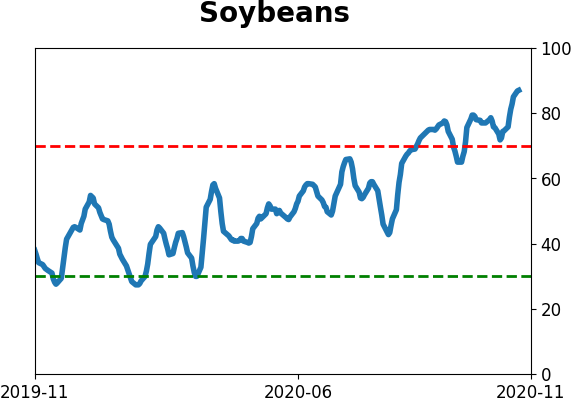
Commodity ETF's - 5-Day Moving Average
|
|