Headlines
|
|
Consumer sentiment drop favors Small Caps and Value:
The latest University of Michigan survey of consumer sentiment showed a shocking drop, falling below 70 for the first time since 2012. Other bouts of pessimism led to the best performance in Small-Cap and Value stocks.
Bottom Line:
STOCKS: Hold By early October, sentiment had reset. Several important momentum streaks ended, which has brought in buyers in the past, and seasonality turned positive. We're now seeing signs that sentiment has quickly shifted, especially among options traders. It's gotten to an extreme that has preceded weaker-than-average returns.
BONDS: Hold In late October, sentiment on bonds - from Treasuries to corporates - entered pessimistic territory. It's now starting to recover, with some quick moves in corporate bonds. We'll see if those bonds, in particular, can hold recent gains.
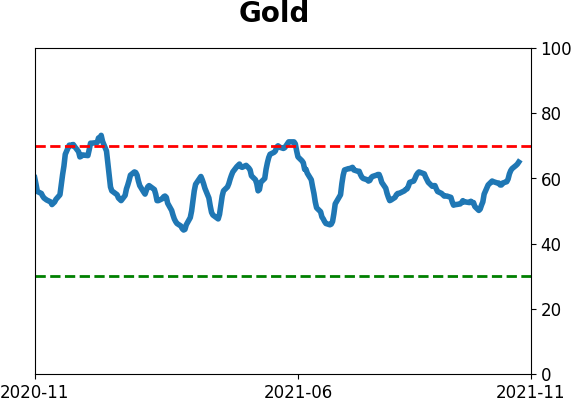
GOLD: Hold
Gold and miners were rejected after trying to recover above their 200-day averages in May. Some oversold extremes in breadth measures among miners triggered in late September, and they've recovered a bit since then. The group still has some proving to do.
|
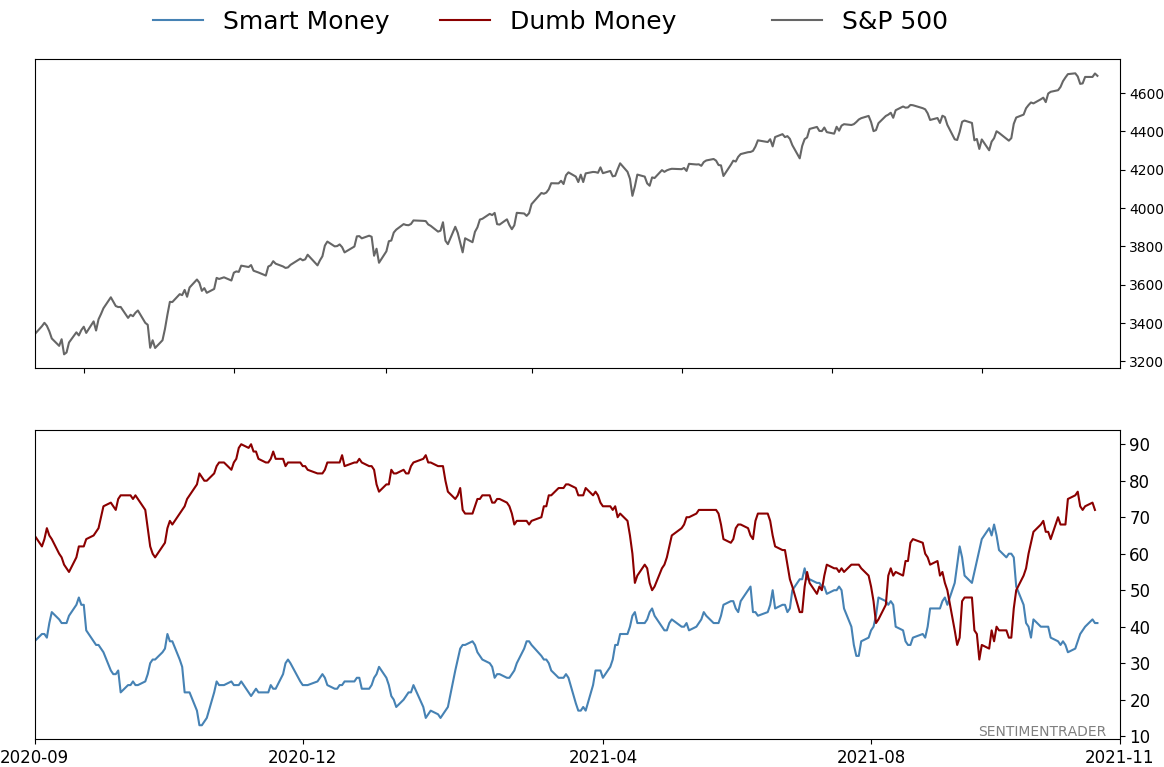
Smart / Dumb Money Confidence
|
Smart Money Confidence: 41%
Dumb Money Confidence: 72%
|
|
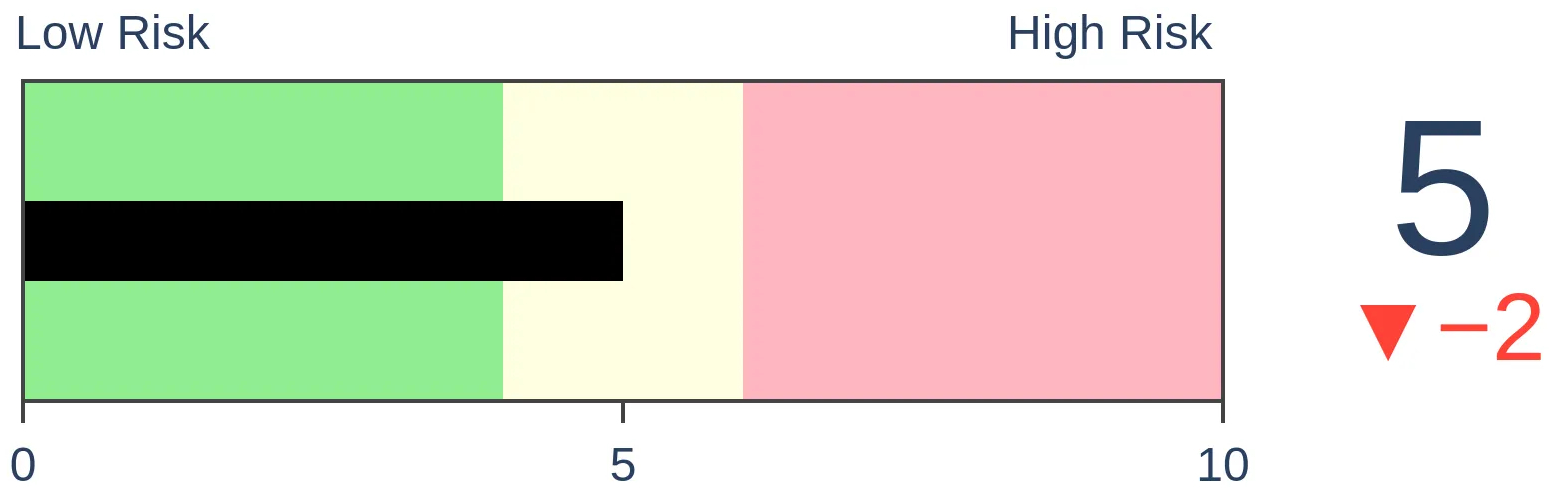
Risk Levels
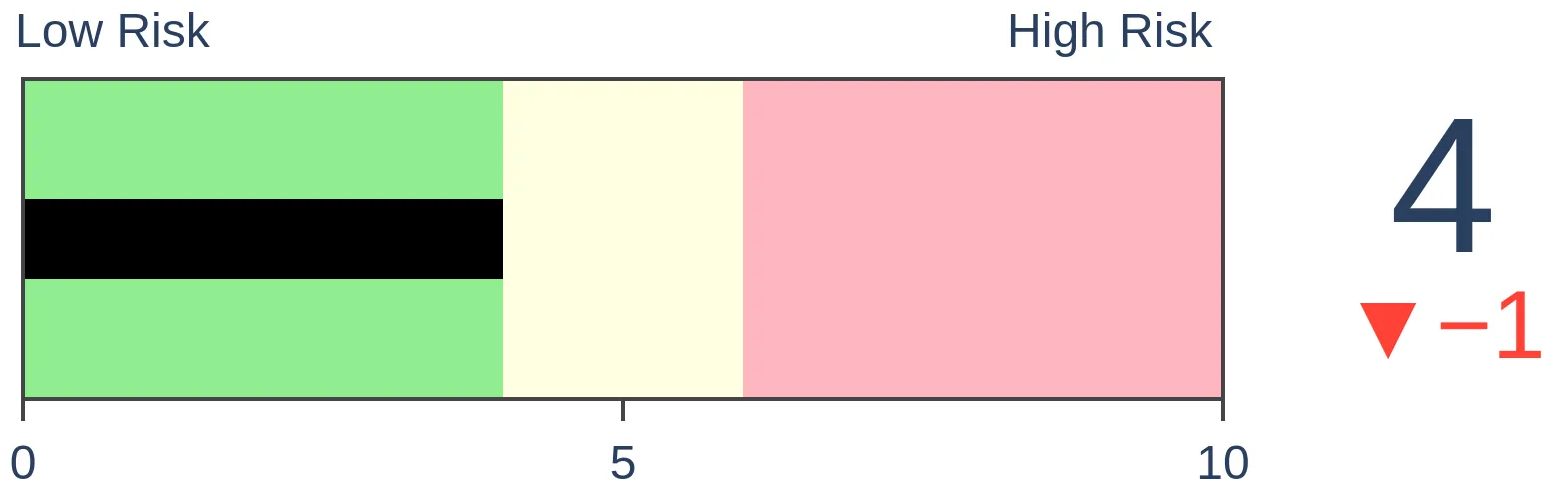
Stocks Short-Term
|
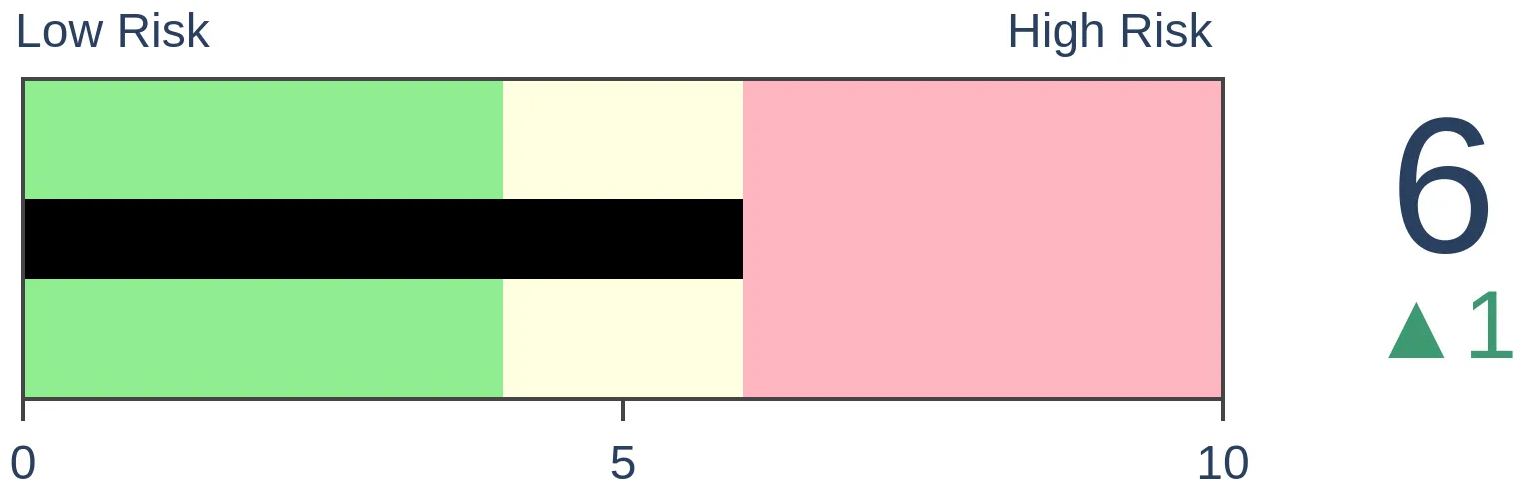
Stocks Medium-Term
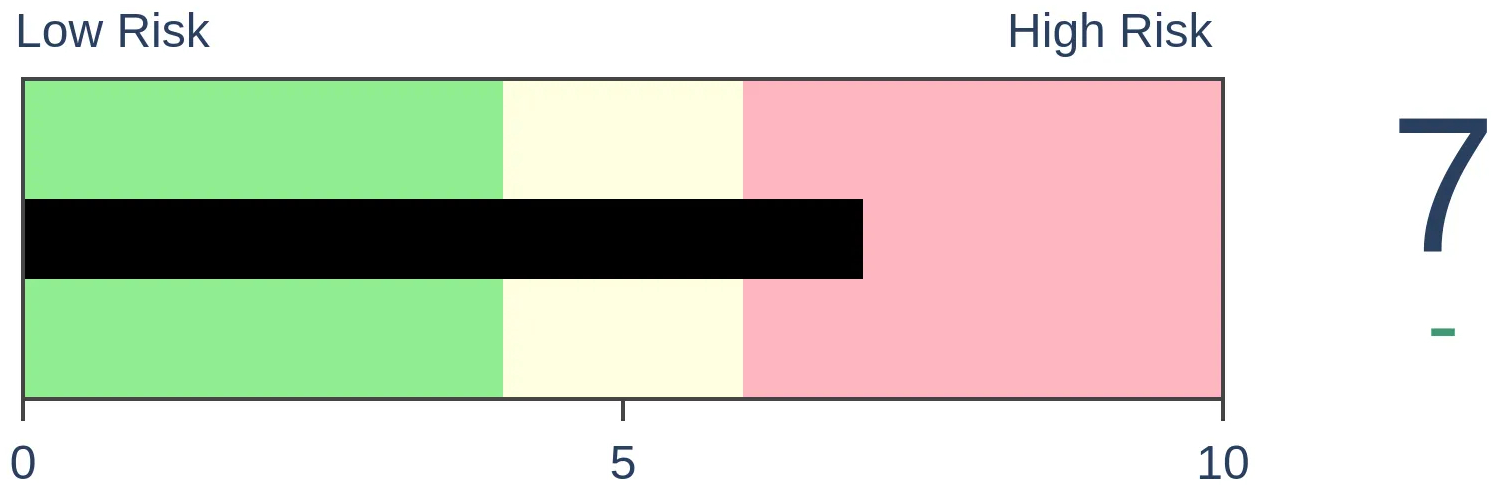
|
|
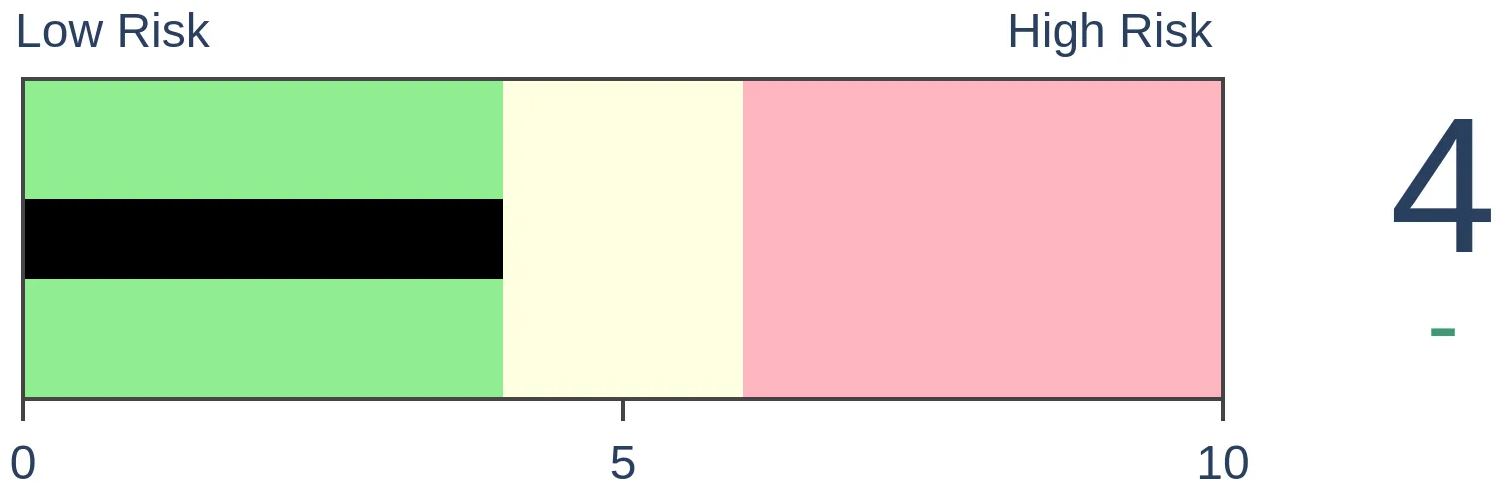
Bonds
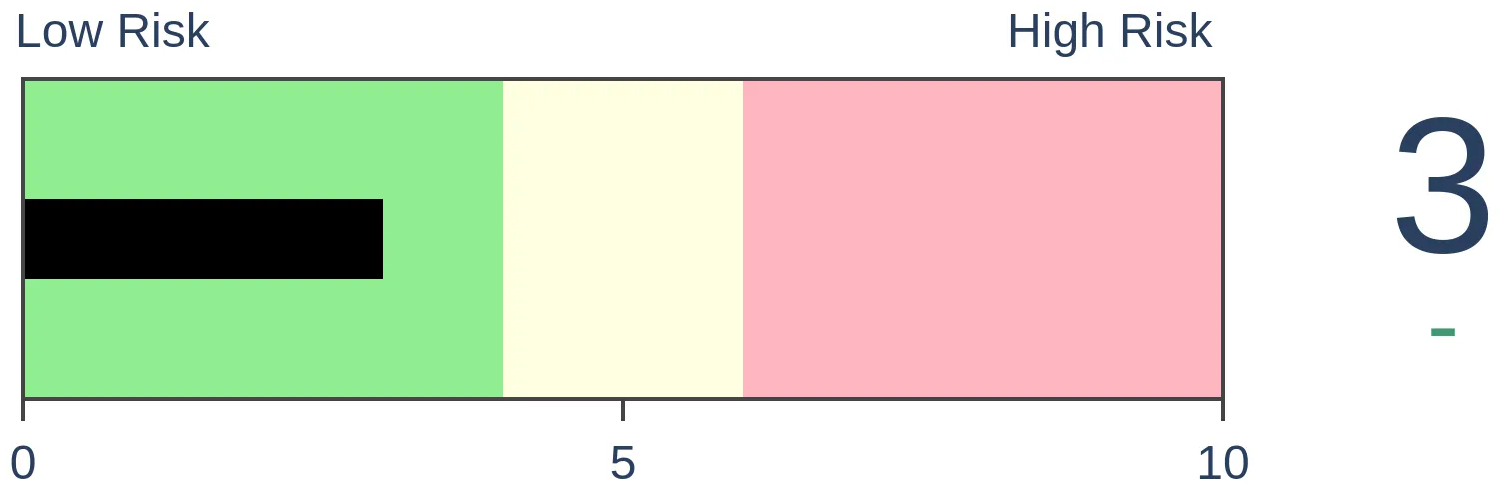
|
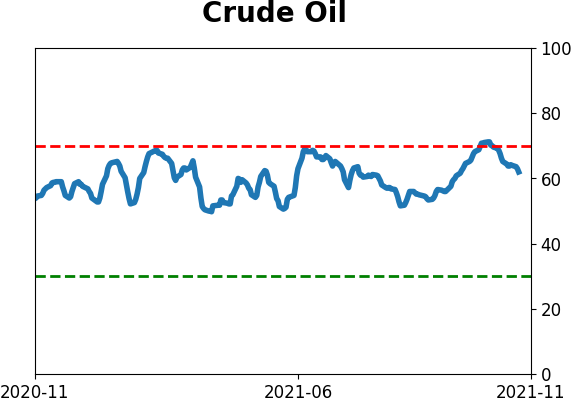
Crude Oil
|
|
Gold
|
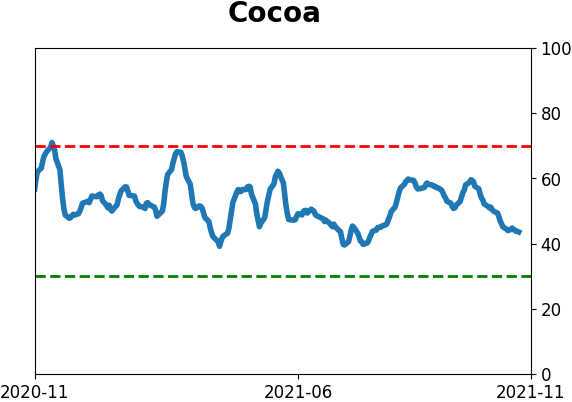
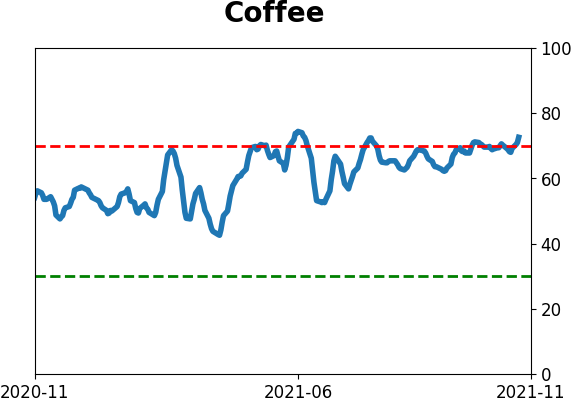
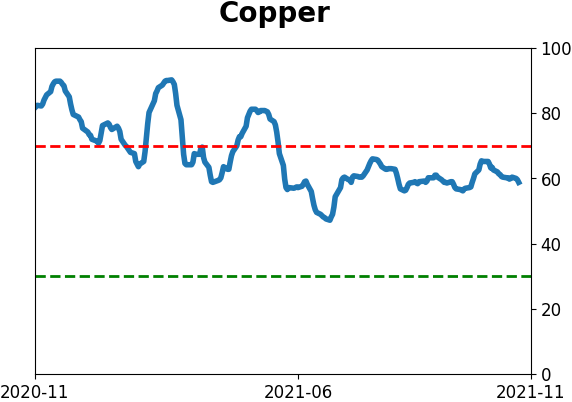
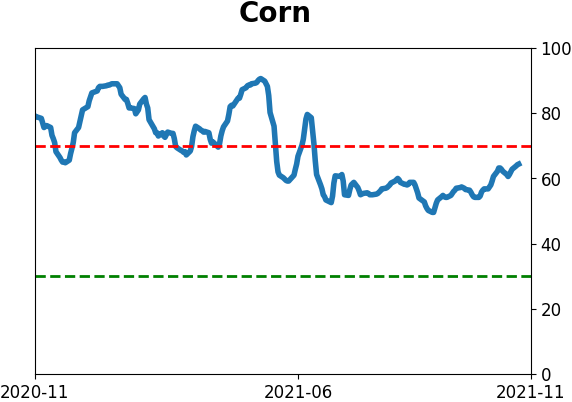
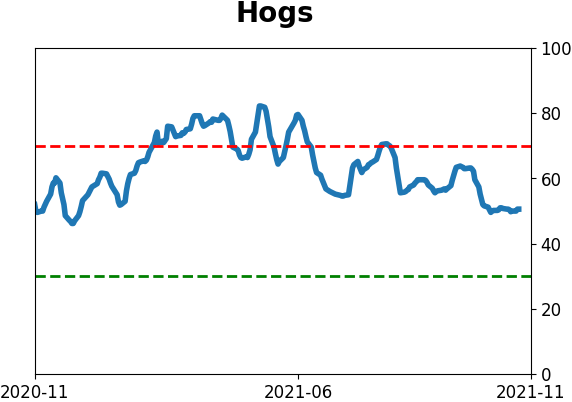
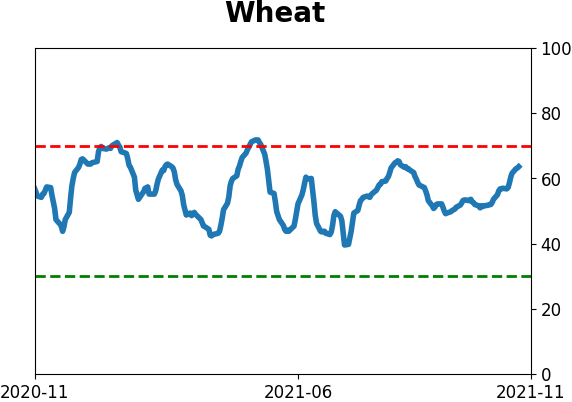
Agriculture
|
|
Research
By Jason Goepfert
BOTTOM LINE
The latest University of Michigan survey of consumer sentiment showed a shocking drop, falling below 70 for the first time since 2012. Other bouts of pessimism led to the best performance in Small-Cap and Value stocks.
FORECAST / TIMEFRAME
None
|
Key points:
- A major survey of U.S. consumer confidence showed a shocking decline this month
- Other times it dropped to this low of a level, stocks soared twice, crashed once
- Among sectors and factors, Small-Cap and Value stocks fared best
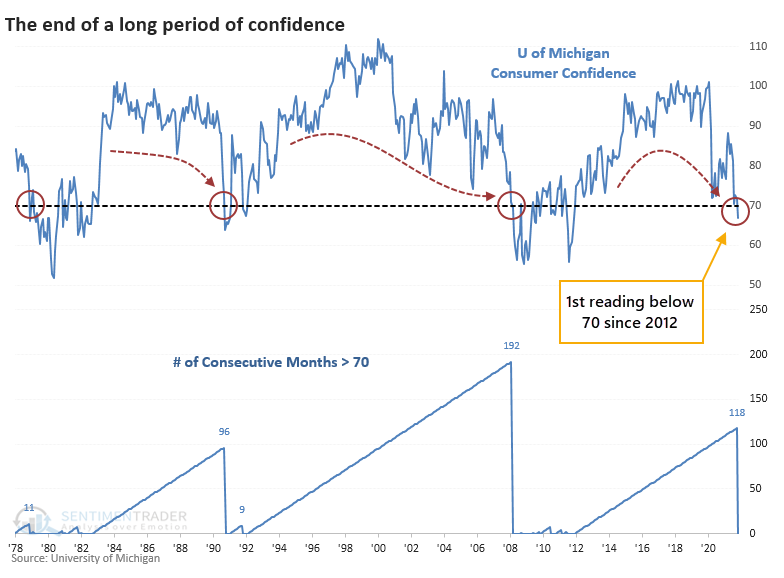
First real pessimism in almost a decade
The latest survey results from the University of Michigan shocked economists.
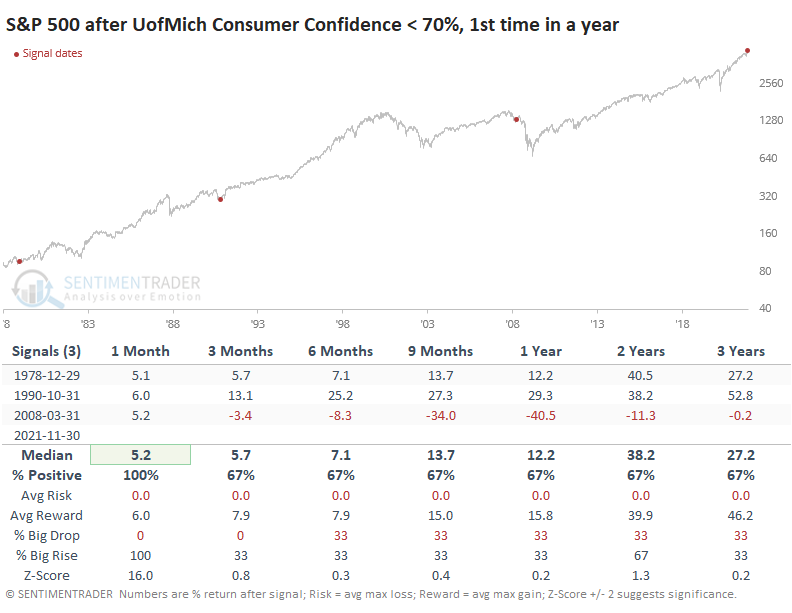
For the first time since 2012, the overall level of consumer confidence was below 70, well below even the most negative economist on Wall Street. If it holds up, it would be the worst miss versus expectations in 22 years.
This ended the 2nd-longest stretch of readings above 70 since 1978, assuming the figures don't change appreciably when they are finalized at the end of the month.
We all know the difficulty of relying on a sample size of 3, so the caveats are huge. It doesn't help that there was no real consensus on future market returns after the other instances, with a couple of big gains and one big loss. The 1978 and 1990 drops in sentiment preceded gains of more than 35% in the S&P 500 over the next couple of years. The 2008 signal was near the beginning of the Global Financial Crisis (GFC) and major losses.
Bonds rose, along with Small-Caps and Value
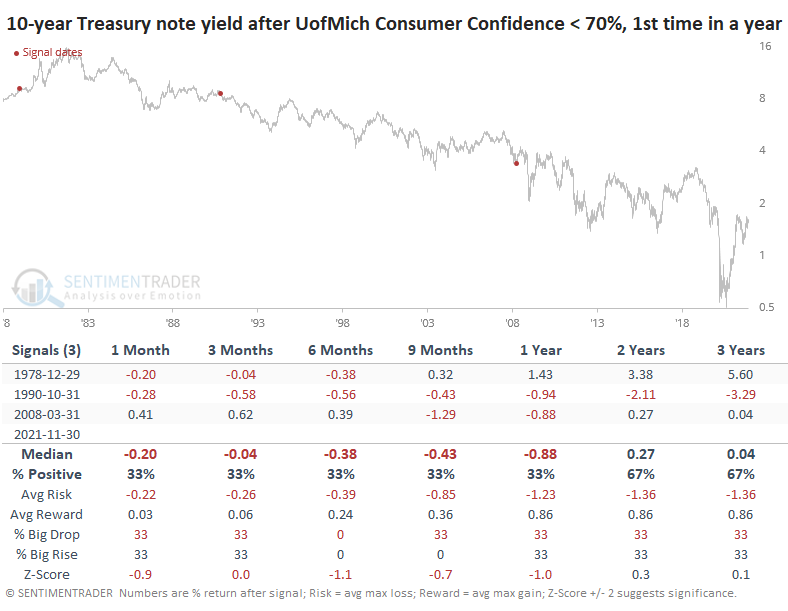
For Treasury yields, these drops in sentiment were also mixed but at least we could note that yields were negative sometime between 6-12 months later each time, so some consistency there. The returns in the table below are in basis points.
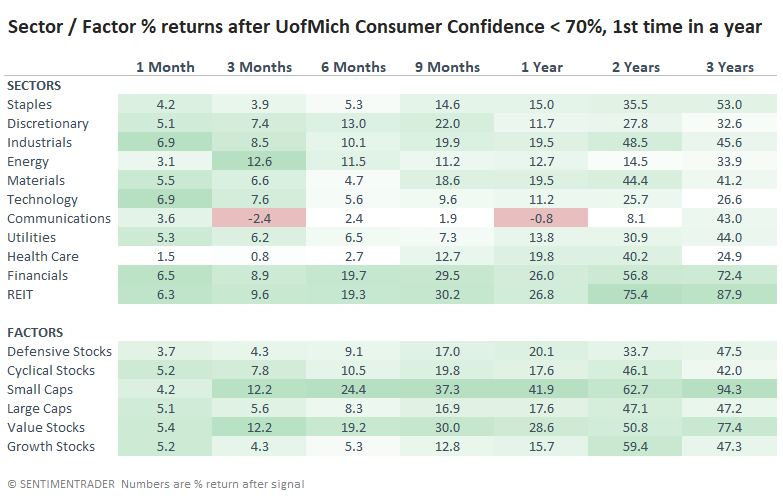
Among sectors and factors, the bear market of 2008 knocked everything for a loop. The strongest returns (darkest green shading) favored Small-Cap and Value stocks across most time frames.
What the research tells us...
There is sometimes a big difference between investors and consumers. We're seeing that now, with extreme optimism among the former and apathy or even pessimism among the latter. Much of this is based on politics and inflationary pressures and less on direct economic prospects. The tiny sample size and inconsistent results make this a tough one to rely on, but it's perhaps a modest point favoring Small-Cap and Value shares.
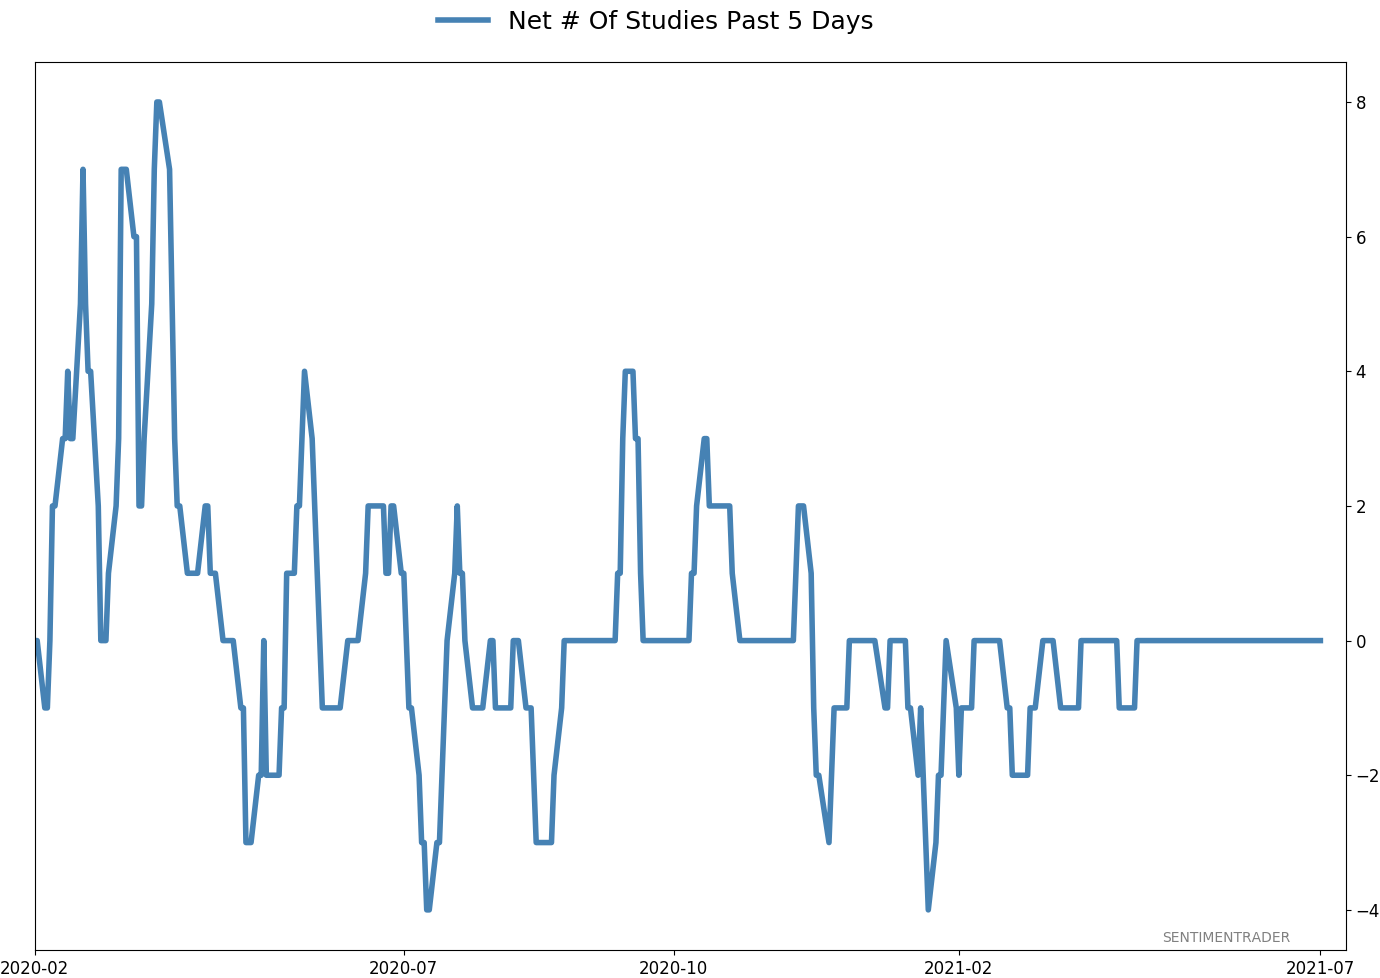
Active Studies
| Time Frame | Bullish | Bearish | | Short-Term | 2 | 0 | | Medium-Term | 11 | 0 | | Long-Term | 13 | 5 |
|
Indicators at Extremes
Portfolio
| Position | Description | Weight % | Added / Reduced | Date | | Stocks | RSP | 10.7 | Added 6.4% | 2021-10-01 | | Bonds | 32.7% BND, 7.1% SCHP | 39.8 | Added 8.3% | 2021-10-26 | | Commodities | GCC | 2.4 | Reduced 2.1%
| 2020-09-04 | | Precious Metals | GDX | 4.6 | Reduced 4.2% | 2021-05-19 | | Special Situations | 9.8% KWEB, 4.7% XLE, 2.9% PSCE | 17.3 | Added 9.78% | 2021-10-01 | | Cash | | 24.1 | | |
|
Updates (Changes made today are underlined)
Much of our momentum and trend work has remained positive for several months, with some scattered exceptions. Almost all sentiment-related work has shown a poor risk/reward ratio for stocks, especially as speculation drove to record highs in exuberance in February. Much of that has worn off, and most of our models are back toward neutral levels. There isn't much to be excited about here. The same goes for bonds and even gold. Gold has been performing well lately and is back above long-term trend lines. The issue is that it has a poor record of holding onto gains when attempting a long-term trend change like this, so we'll take a wait-and-see approach. Momentum has ebbed quickly in recent weeks, and nearing oversold levels in some indicators. This can be a dangerous area, with a lot of short-term volatility, but we'd be more inclined to add medium- to long-term exposure rather than sell on much more of a decline, thanks to already rock-bottom exposure. Other areas look more attractive, including some overseas markets. RETURN YTD: 11.8% 2020: 8.1%, 2019: 12.6%, 2018: 0.6%, 2017: 3.8%, 2016: 17.1%, 2015: 9.2%, 2014: 14.5%, 2013: 2.2%, 2012: 10.8%, 2011: 16.5%, 2010: 15.3%, 2009: 23.9%, 2008: 16.2%, 2007: 7.8%
|
|
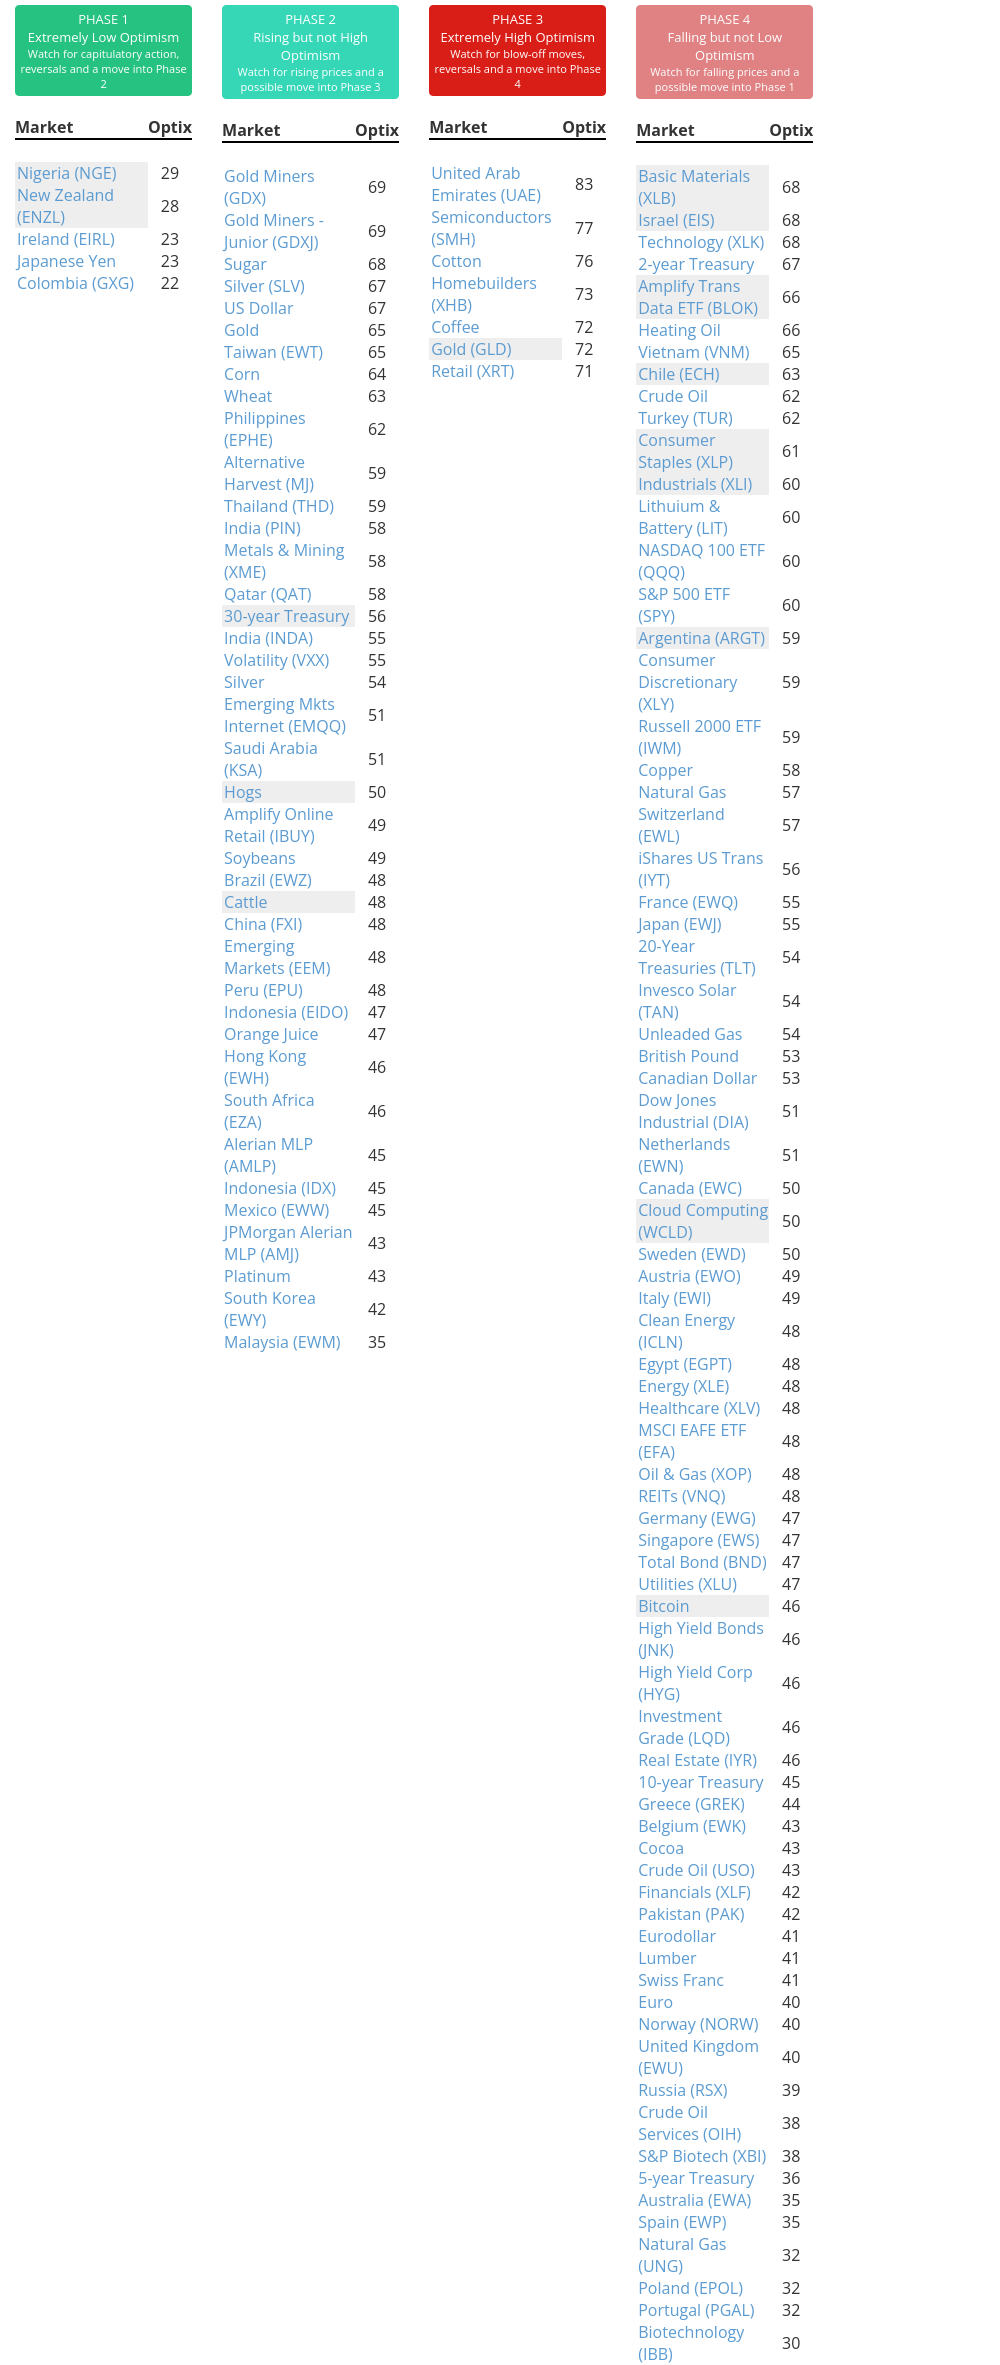
Phase Table
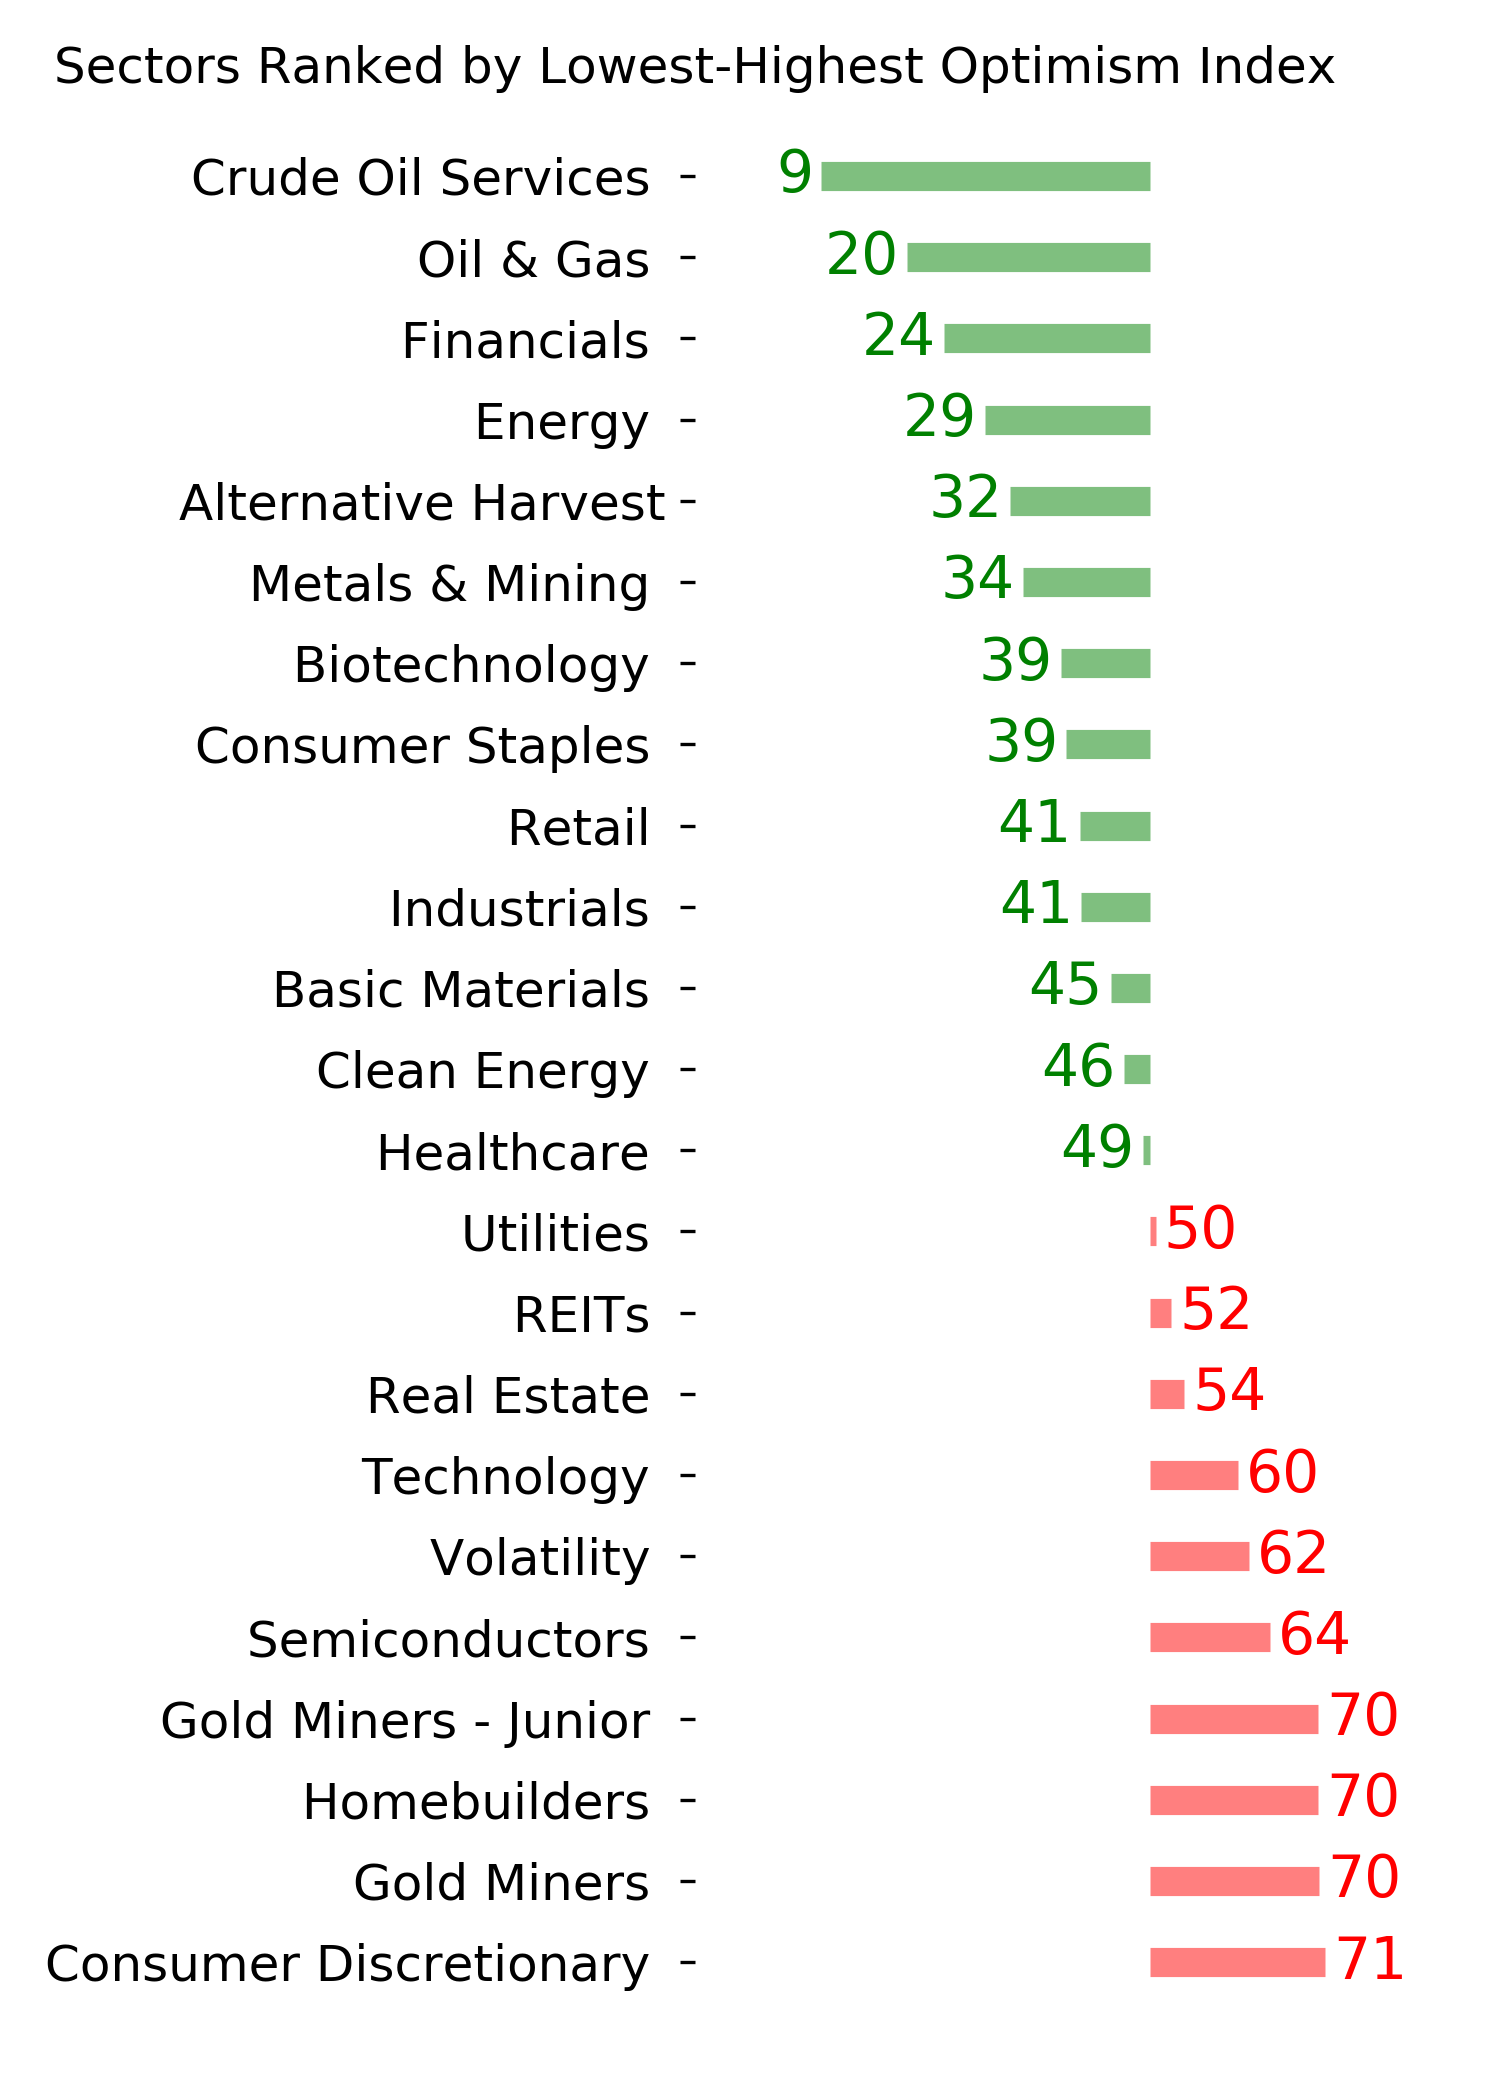
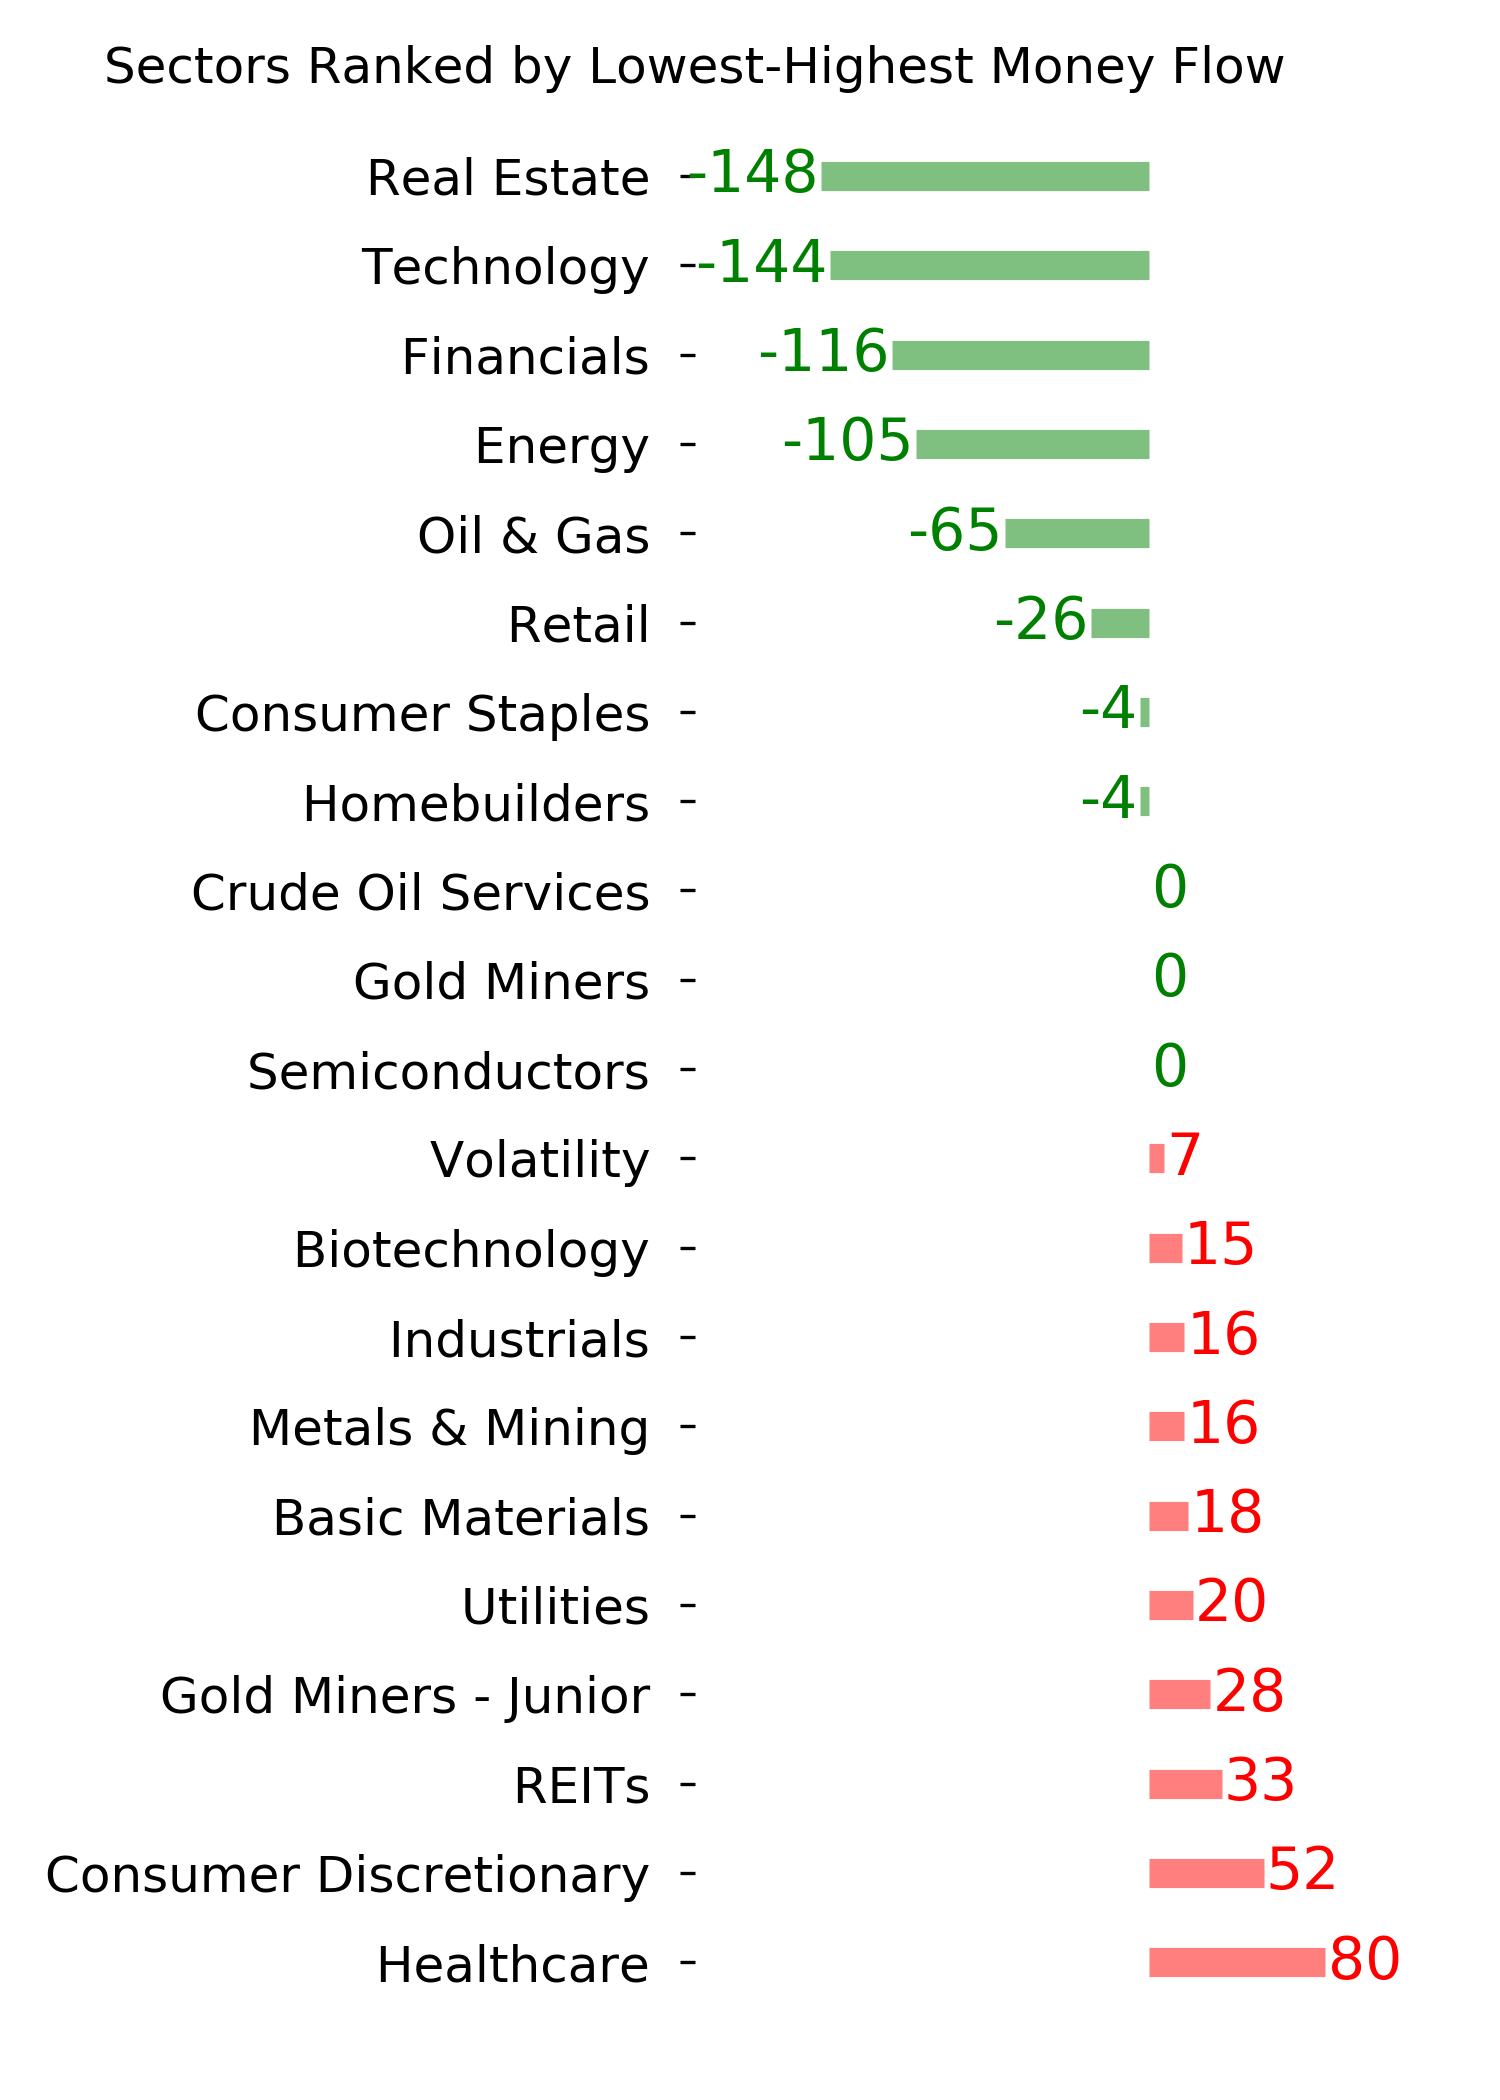
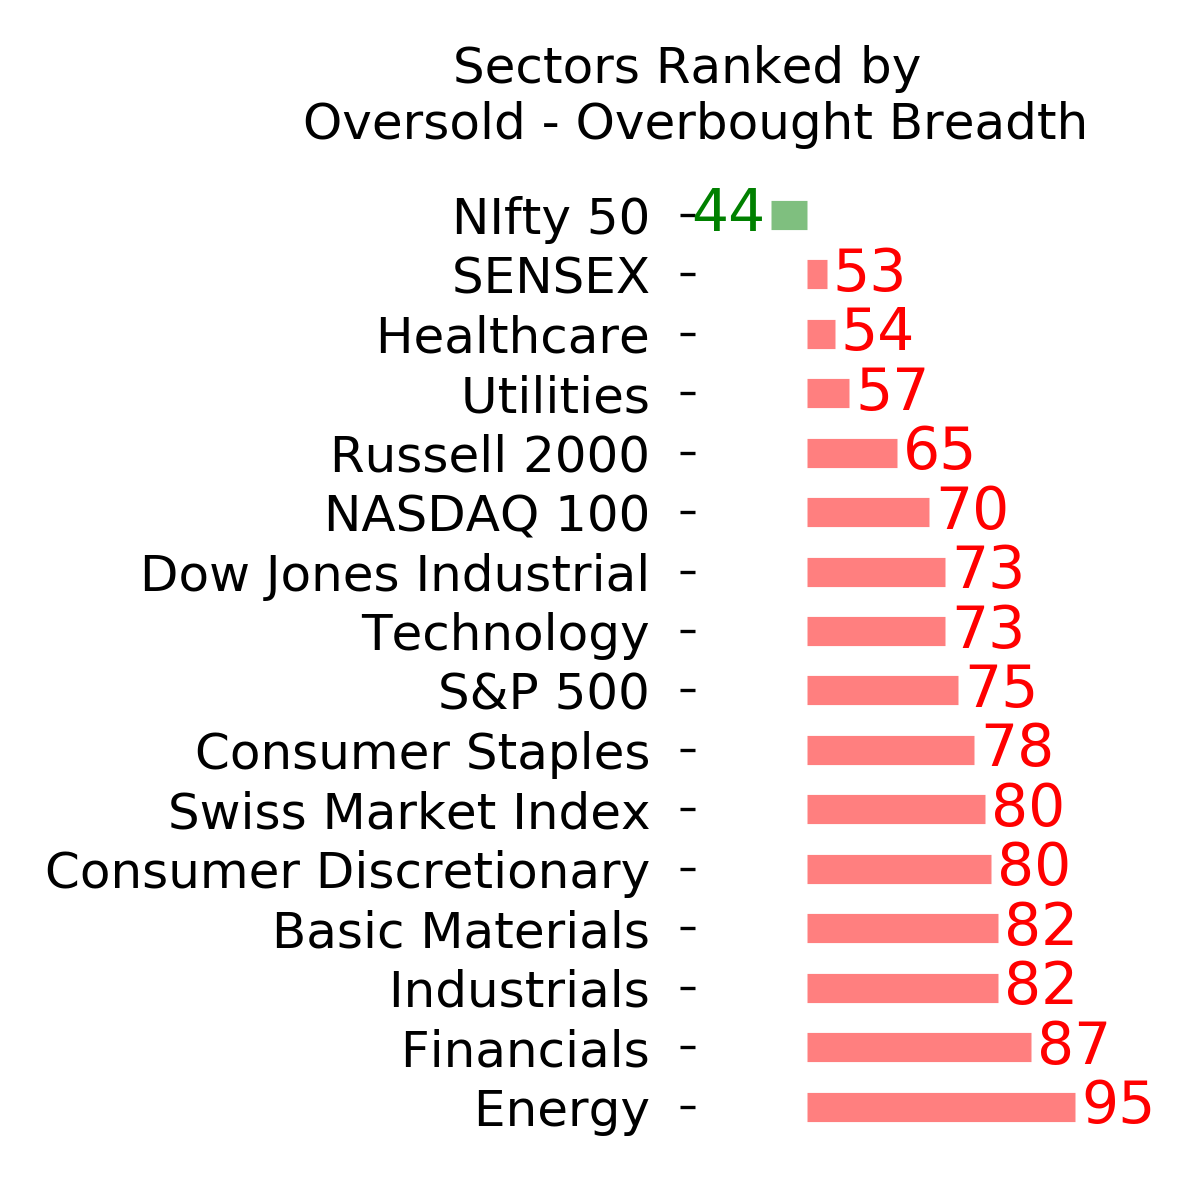
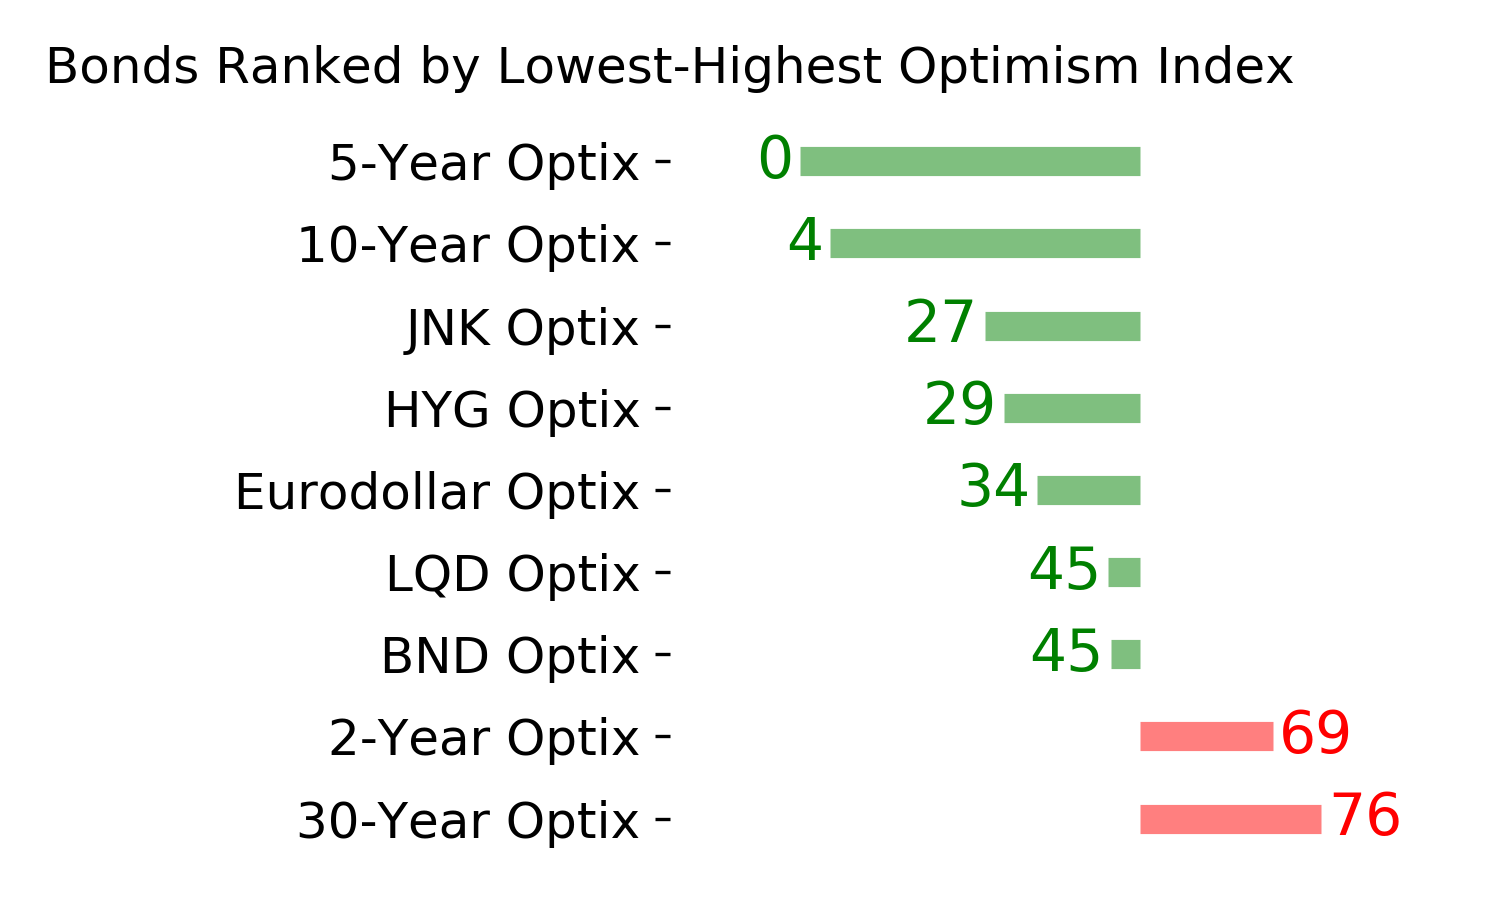
Ranks
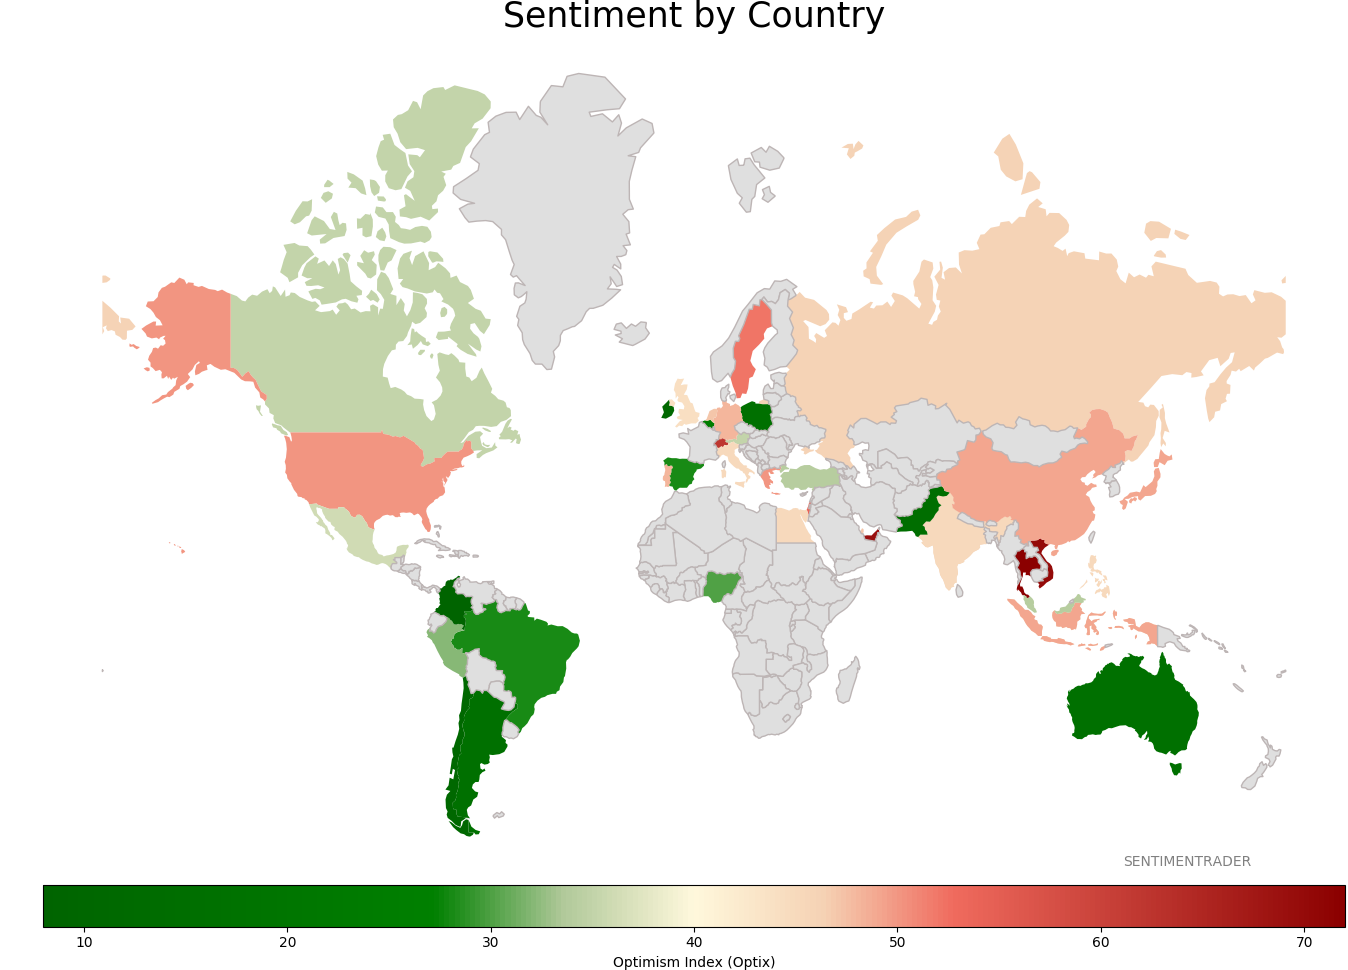
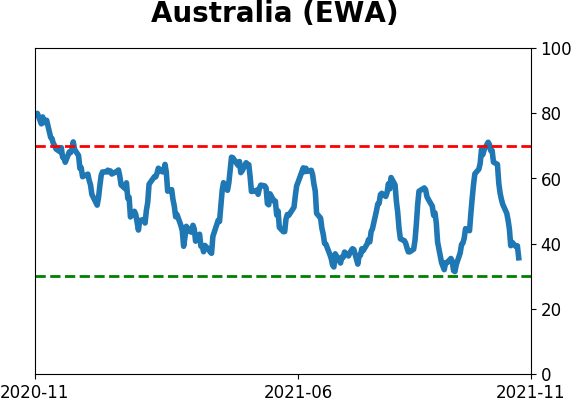
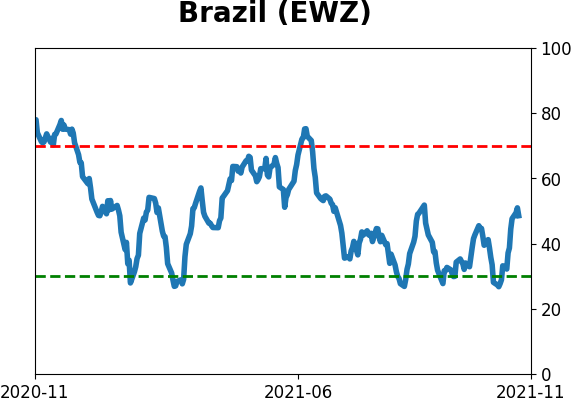
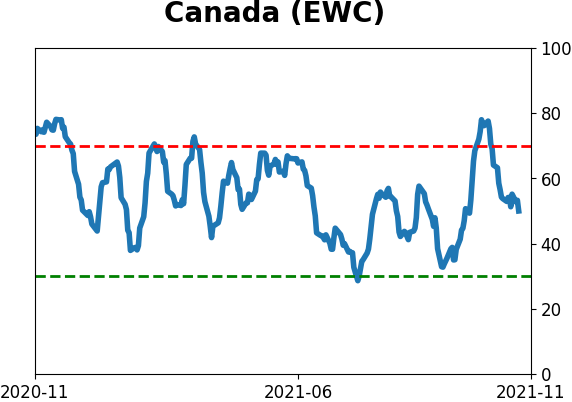
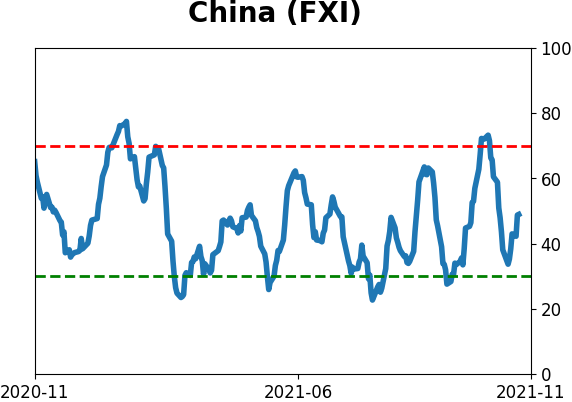
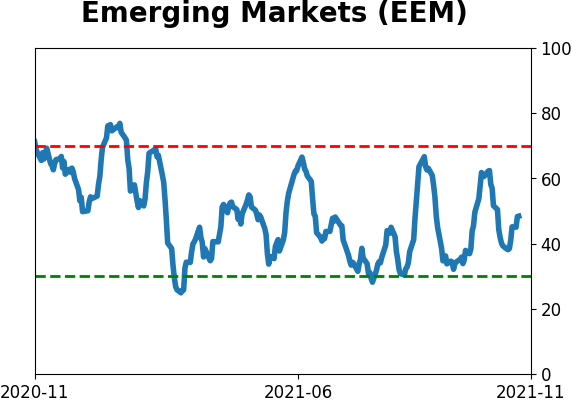
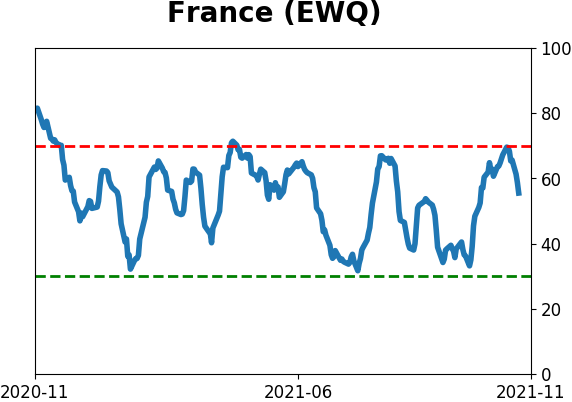
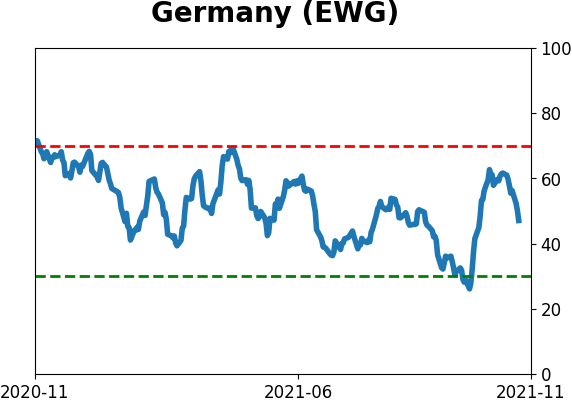
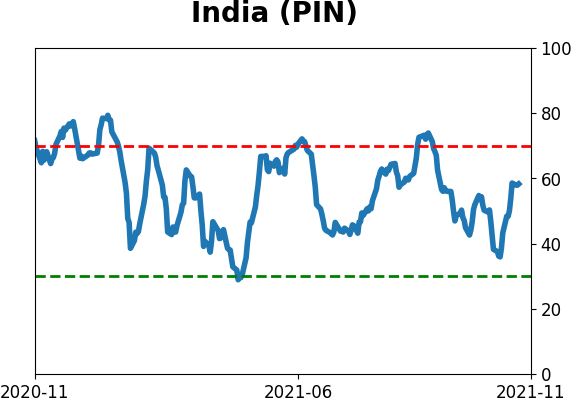
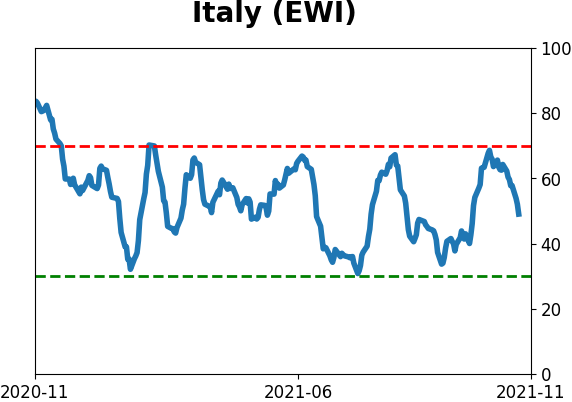
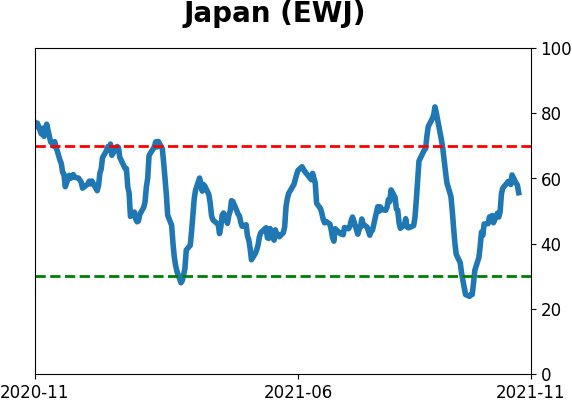
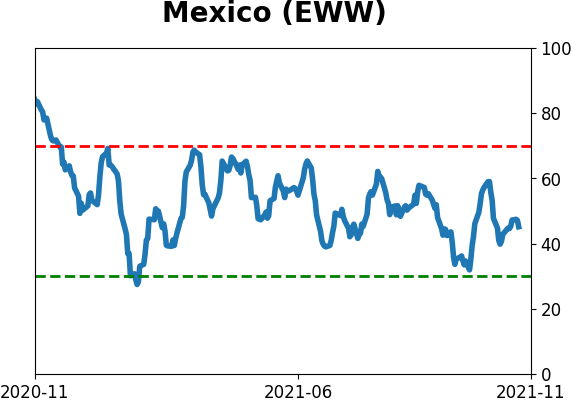
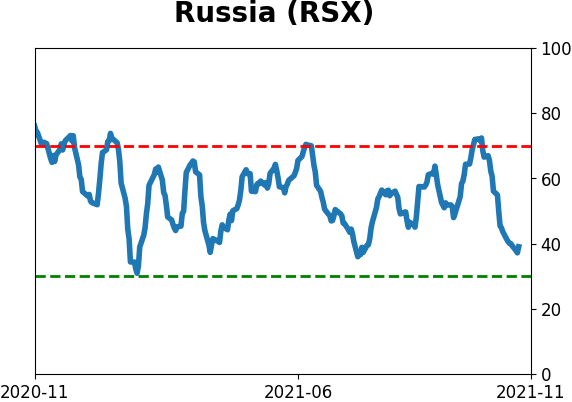
Sentiment Around The World
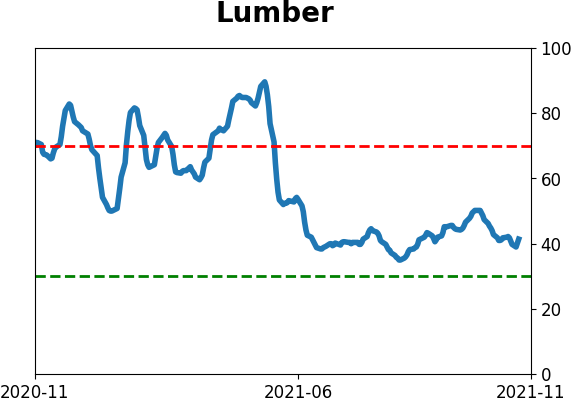
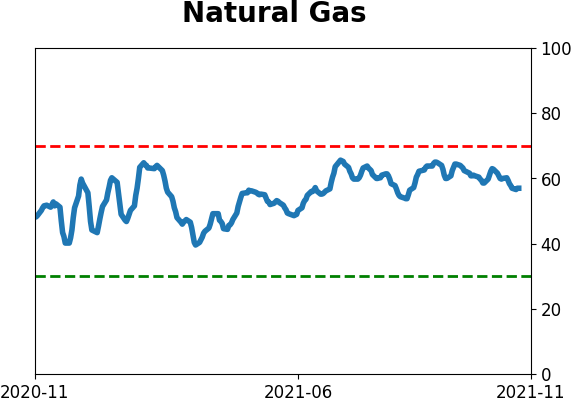
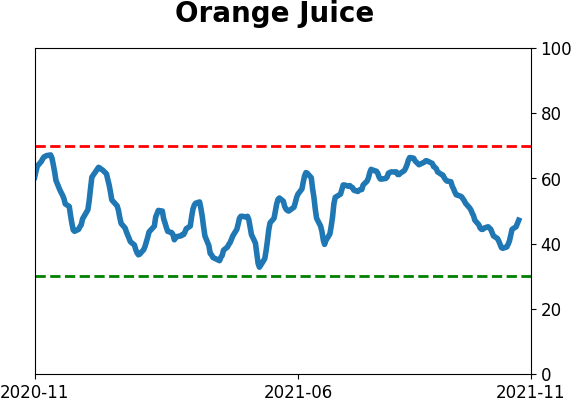
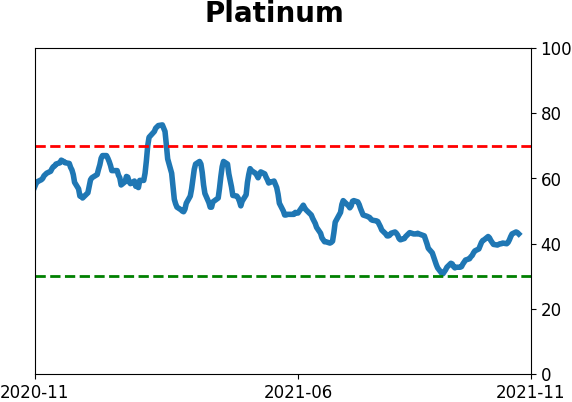
Optimism Index Thumbnails
|
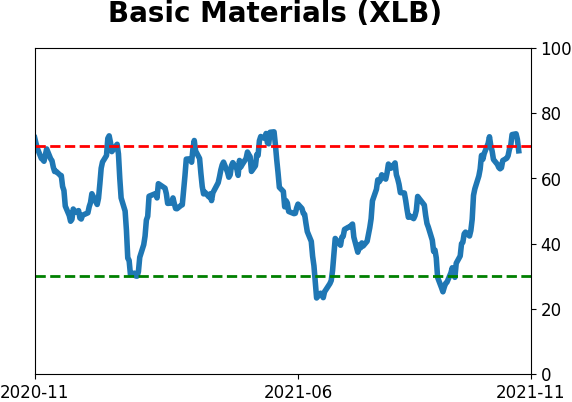
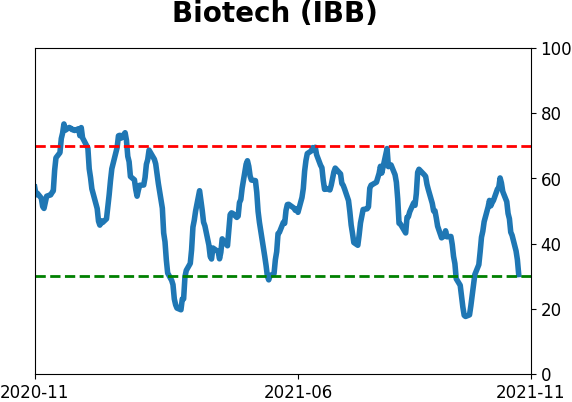
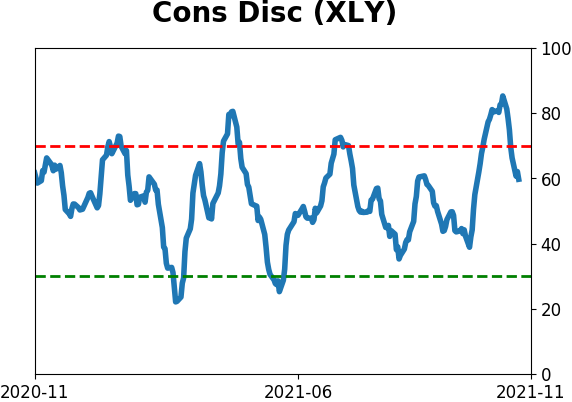
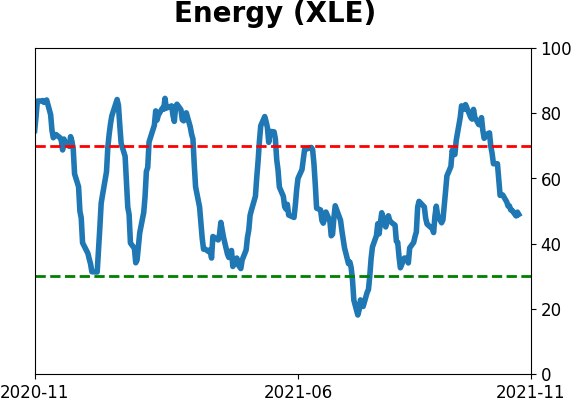
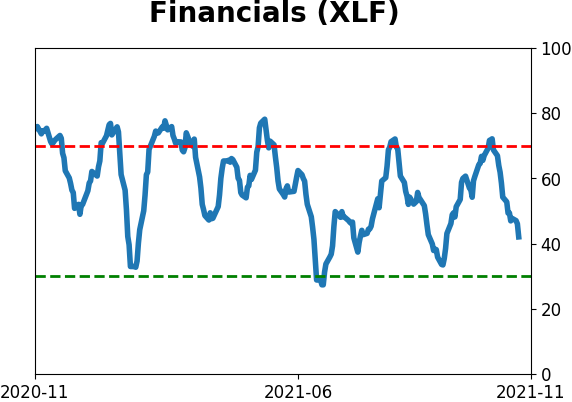
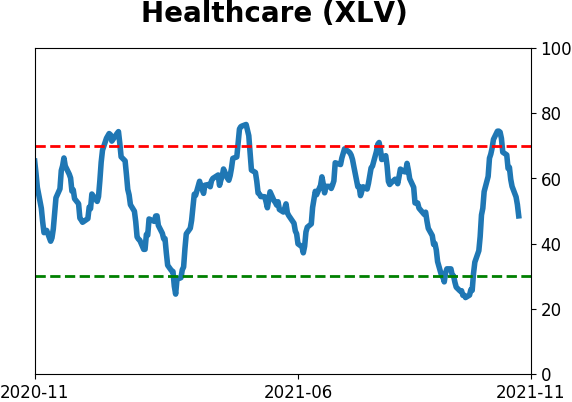
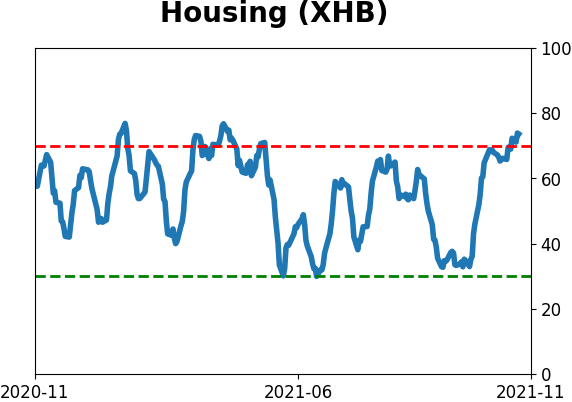
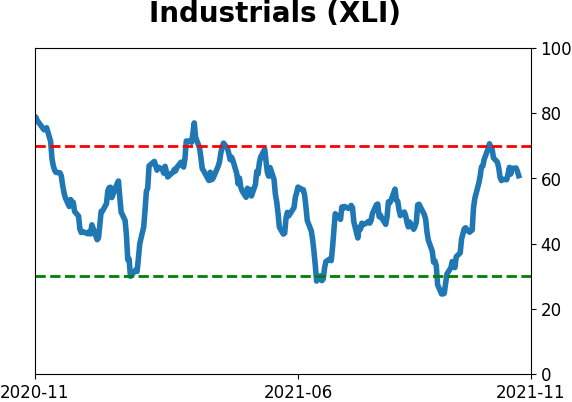
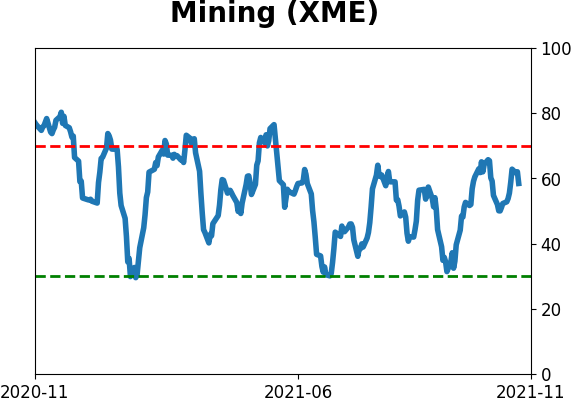
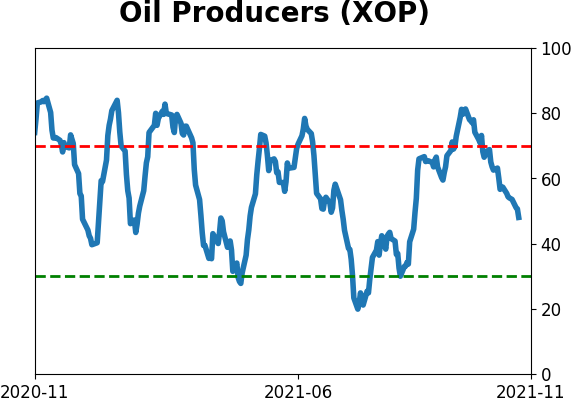
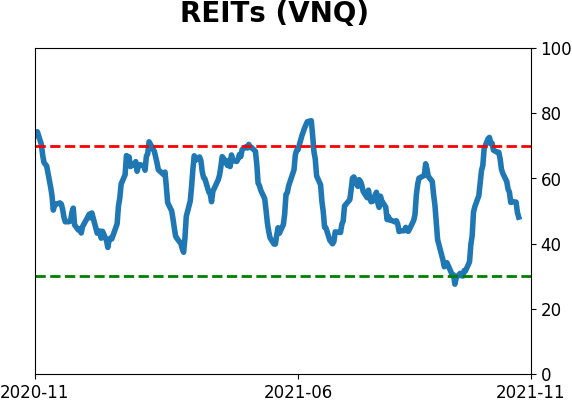
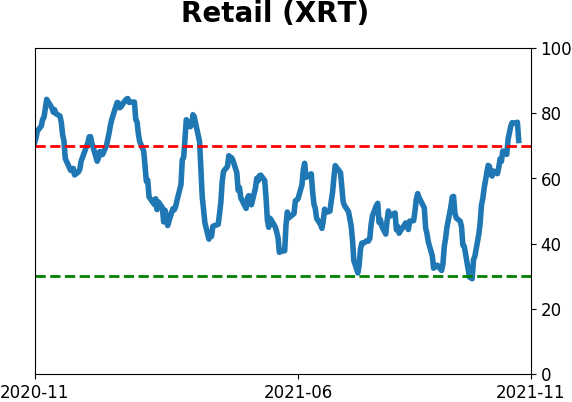
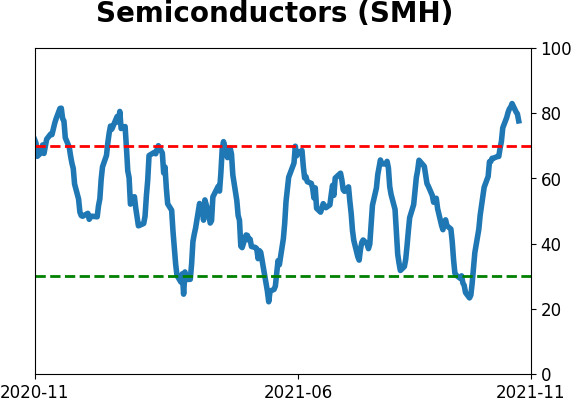
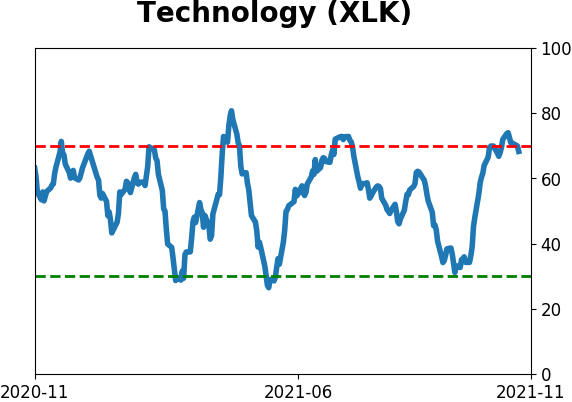
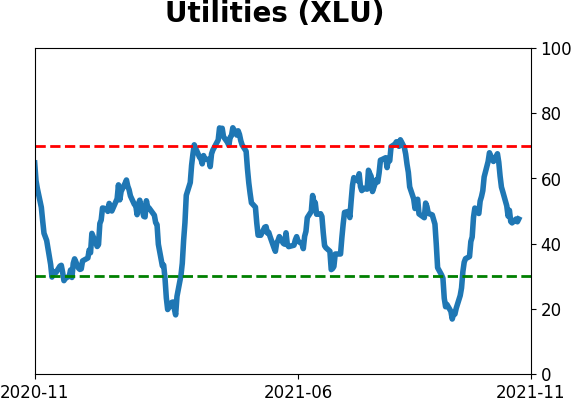
Sector ETF's - 10-Day Moving Average
|
|
|
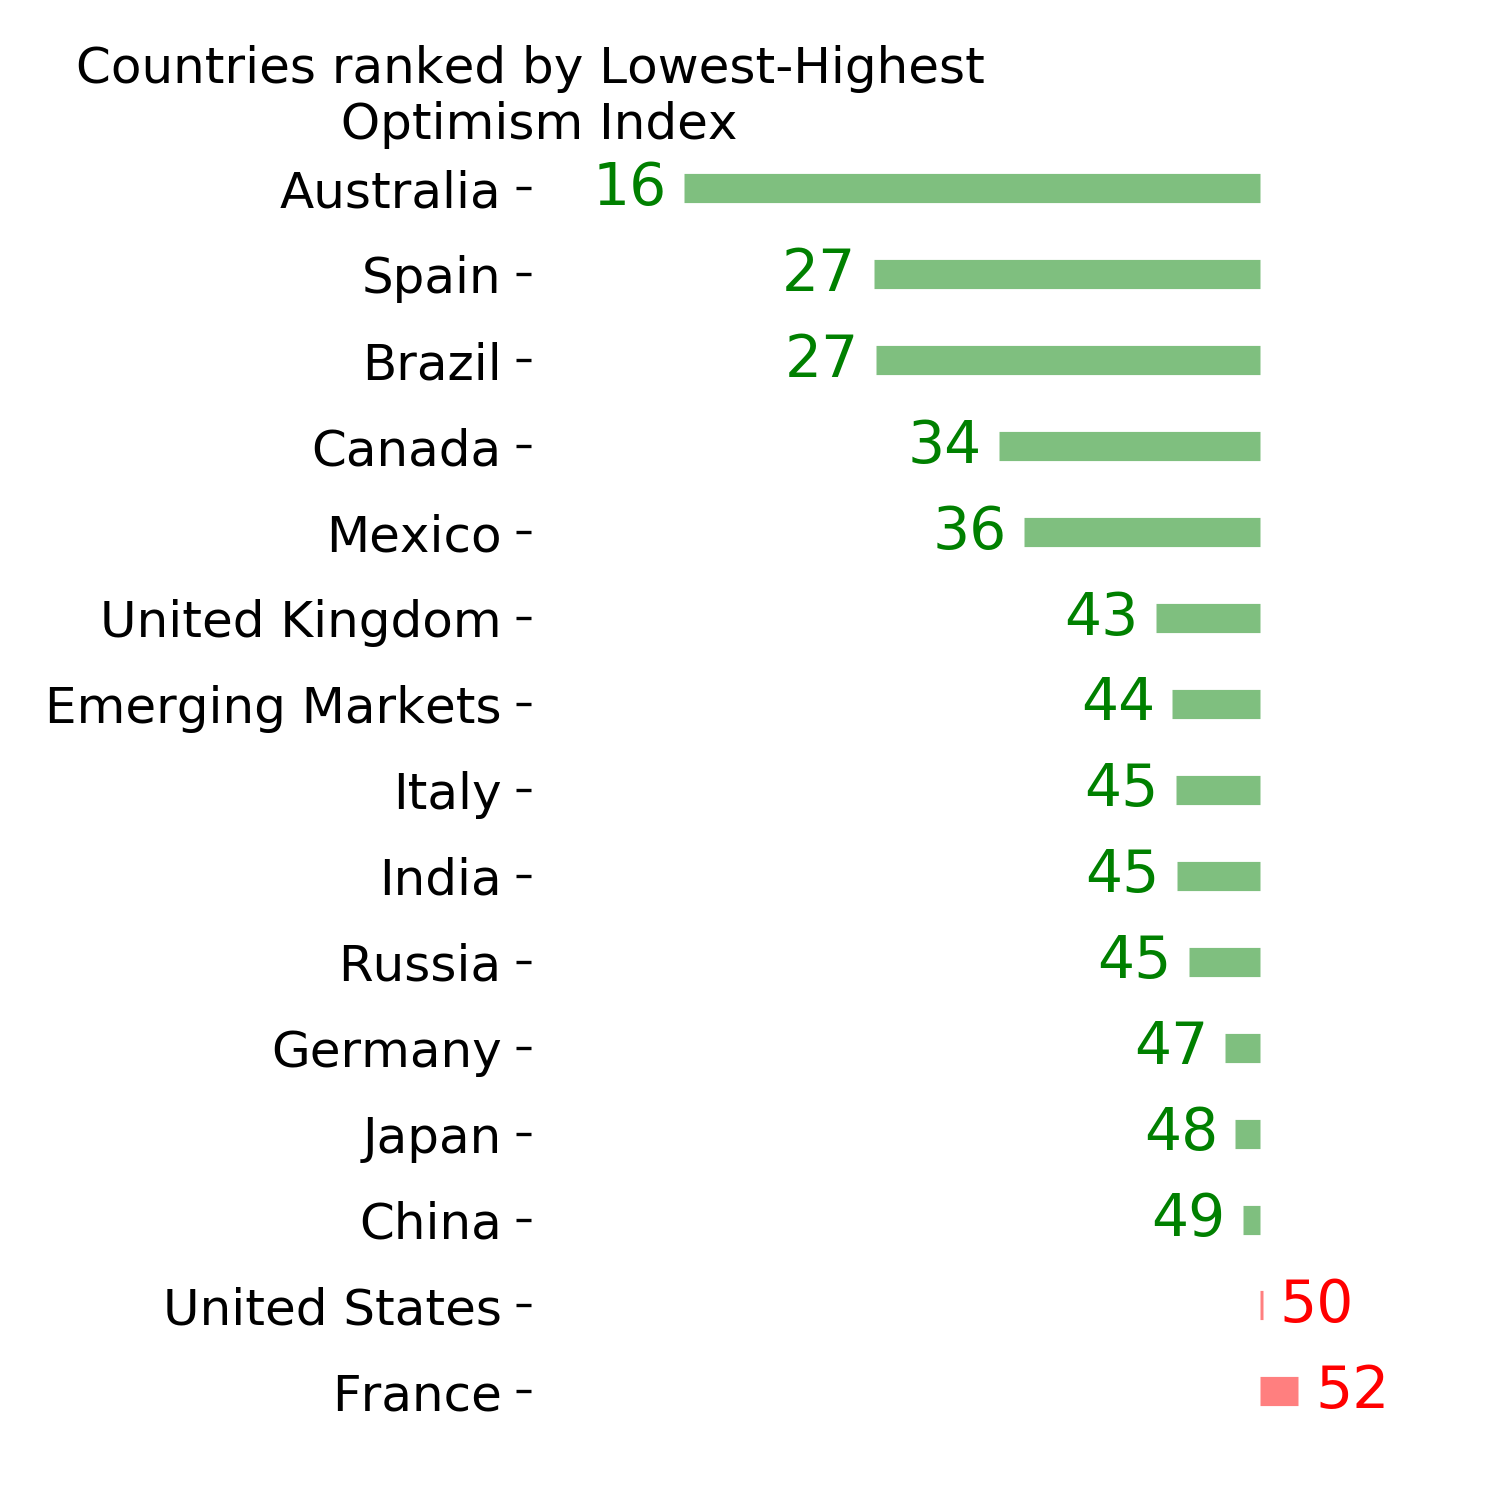
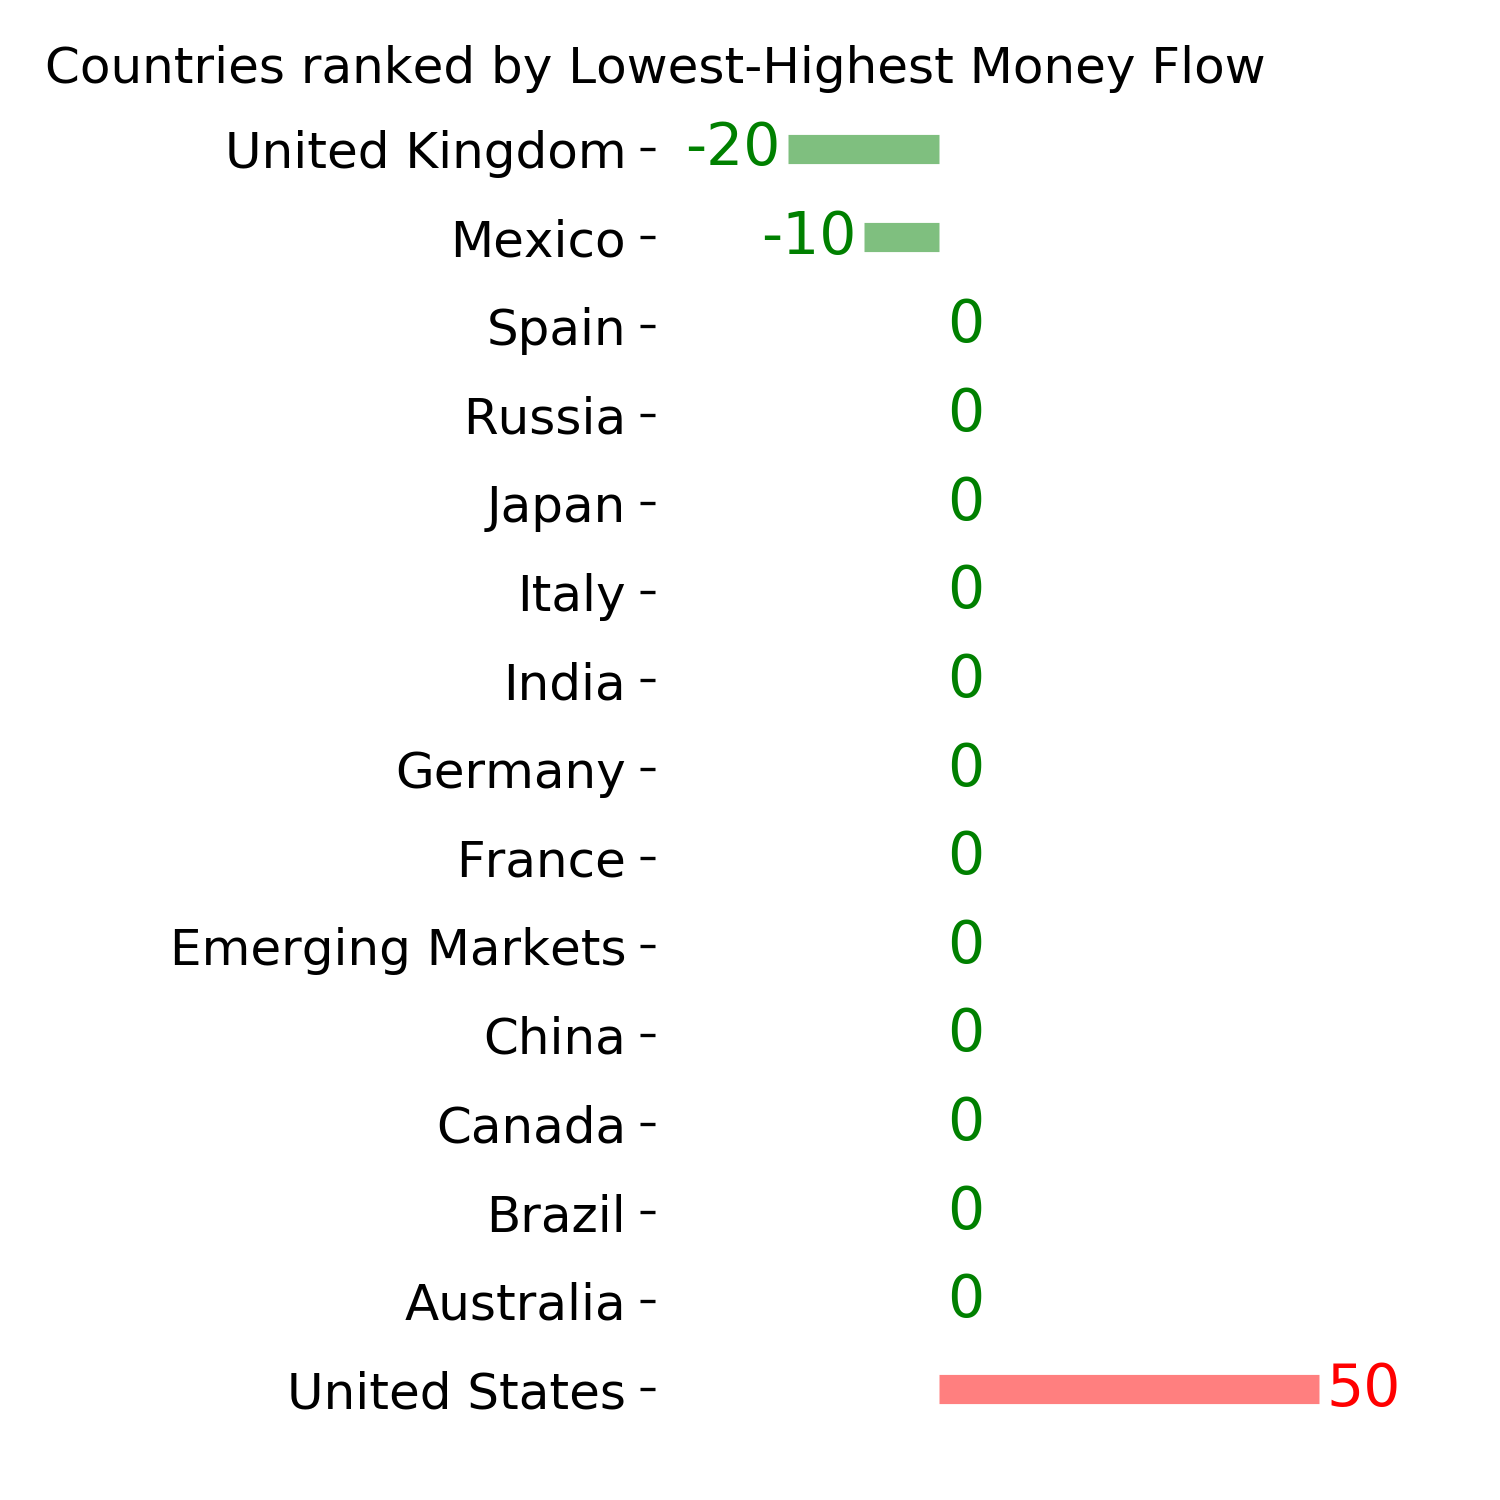
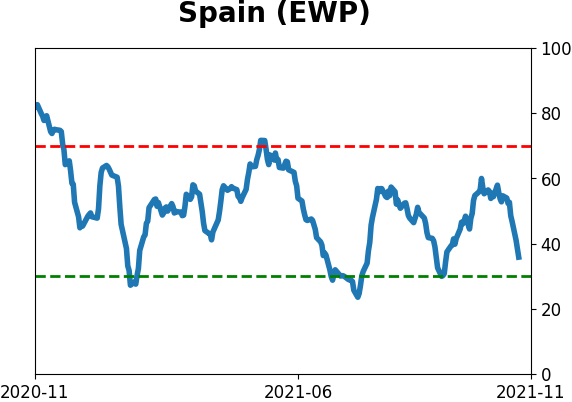
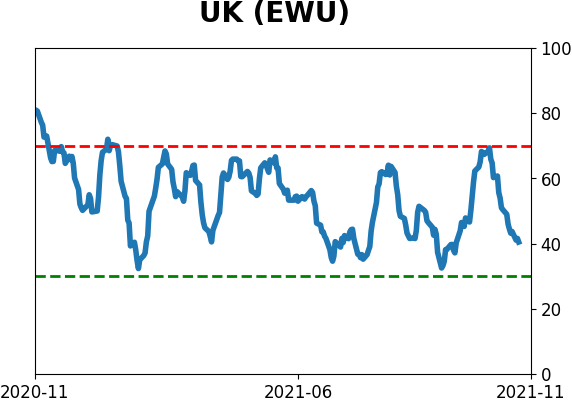
Country ETF's - 10-Day Moving Average
|
|
|
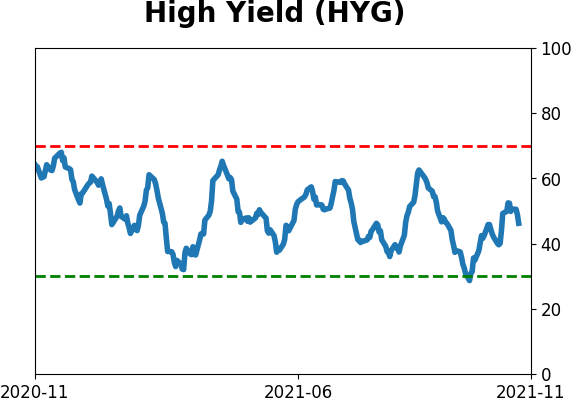
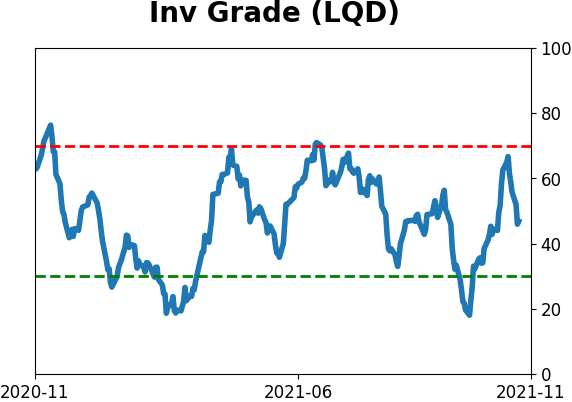
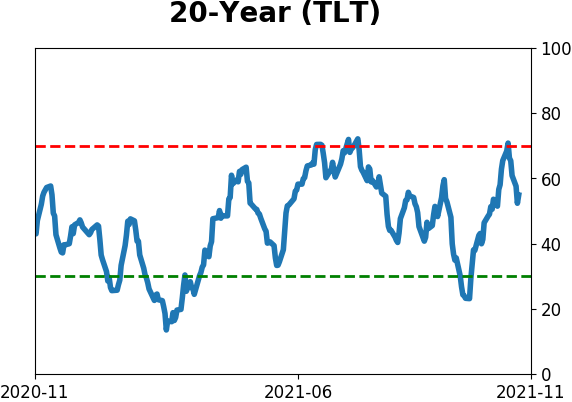
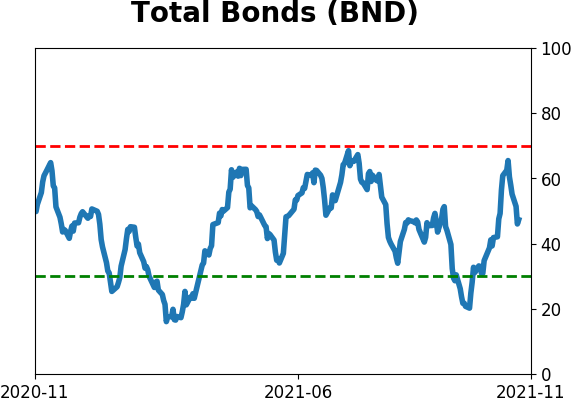
Bond ETF's - 10-Day Moving Average
|
|
|
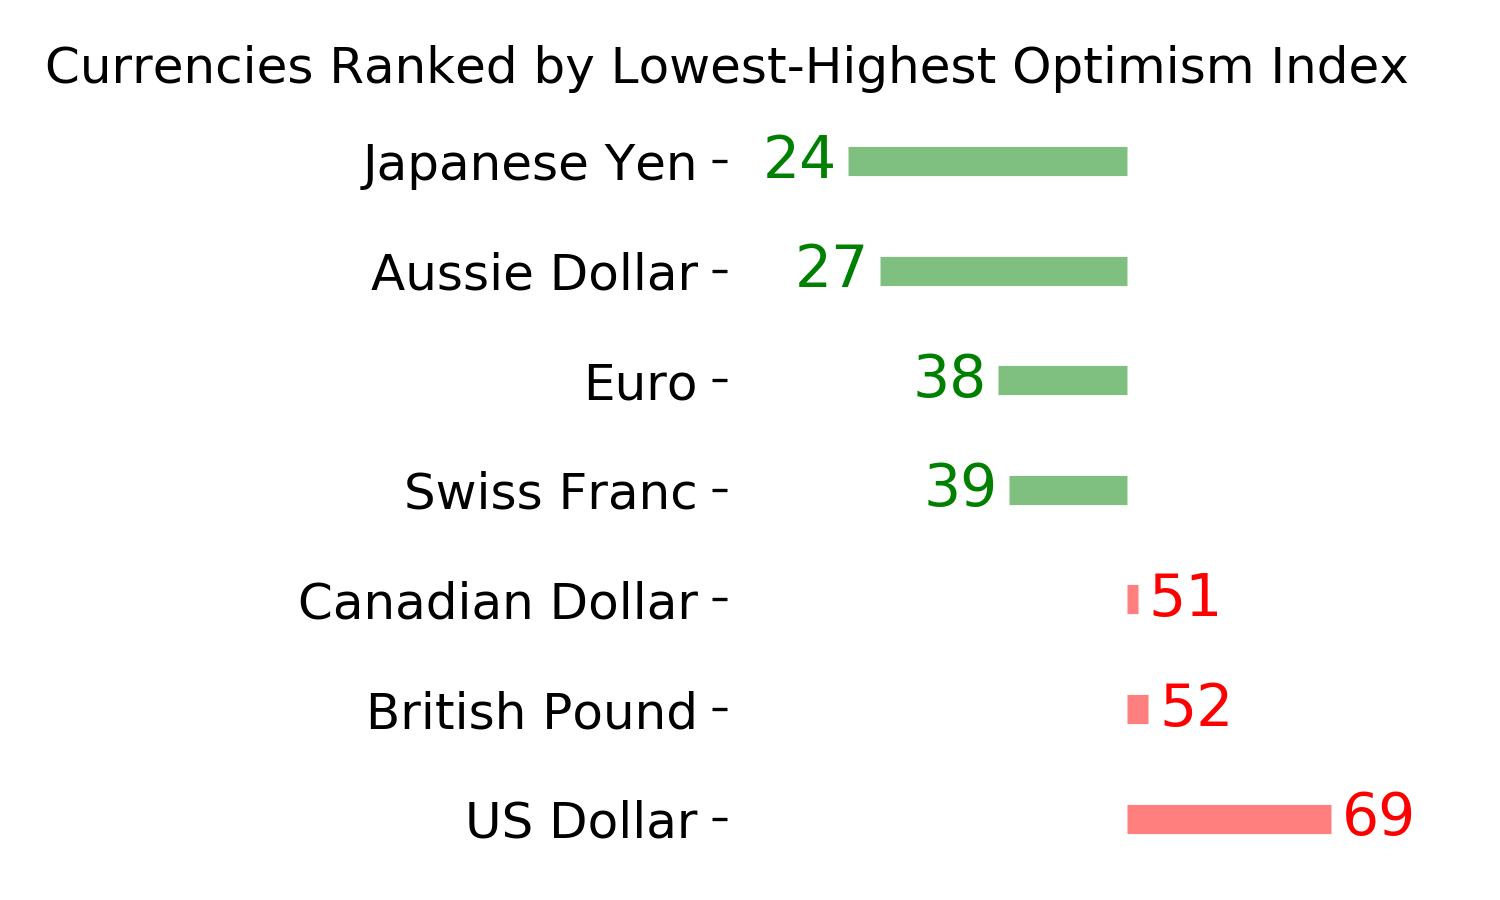
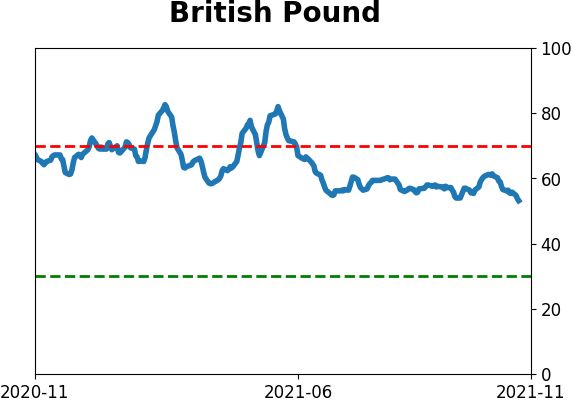
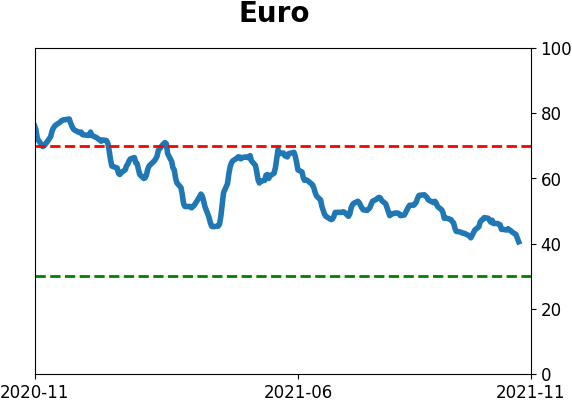
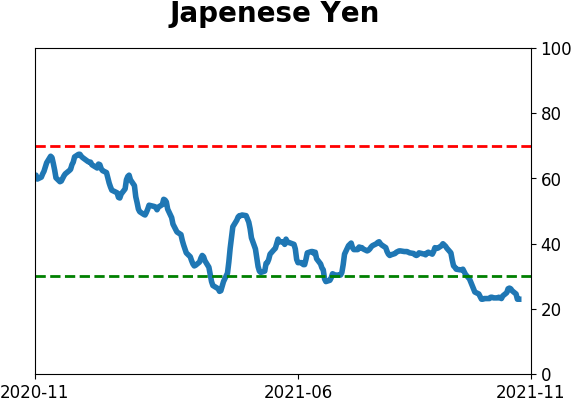
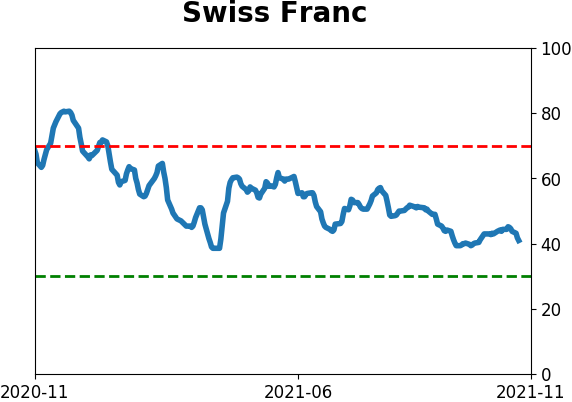
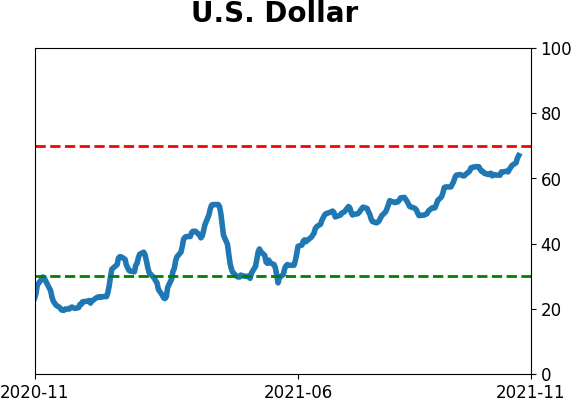
Currency ETF's - 5-Day Moving Average
|
|
|
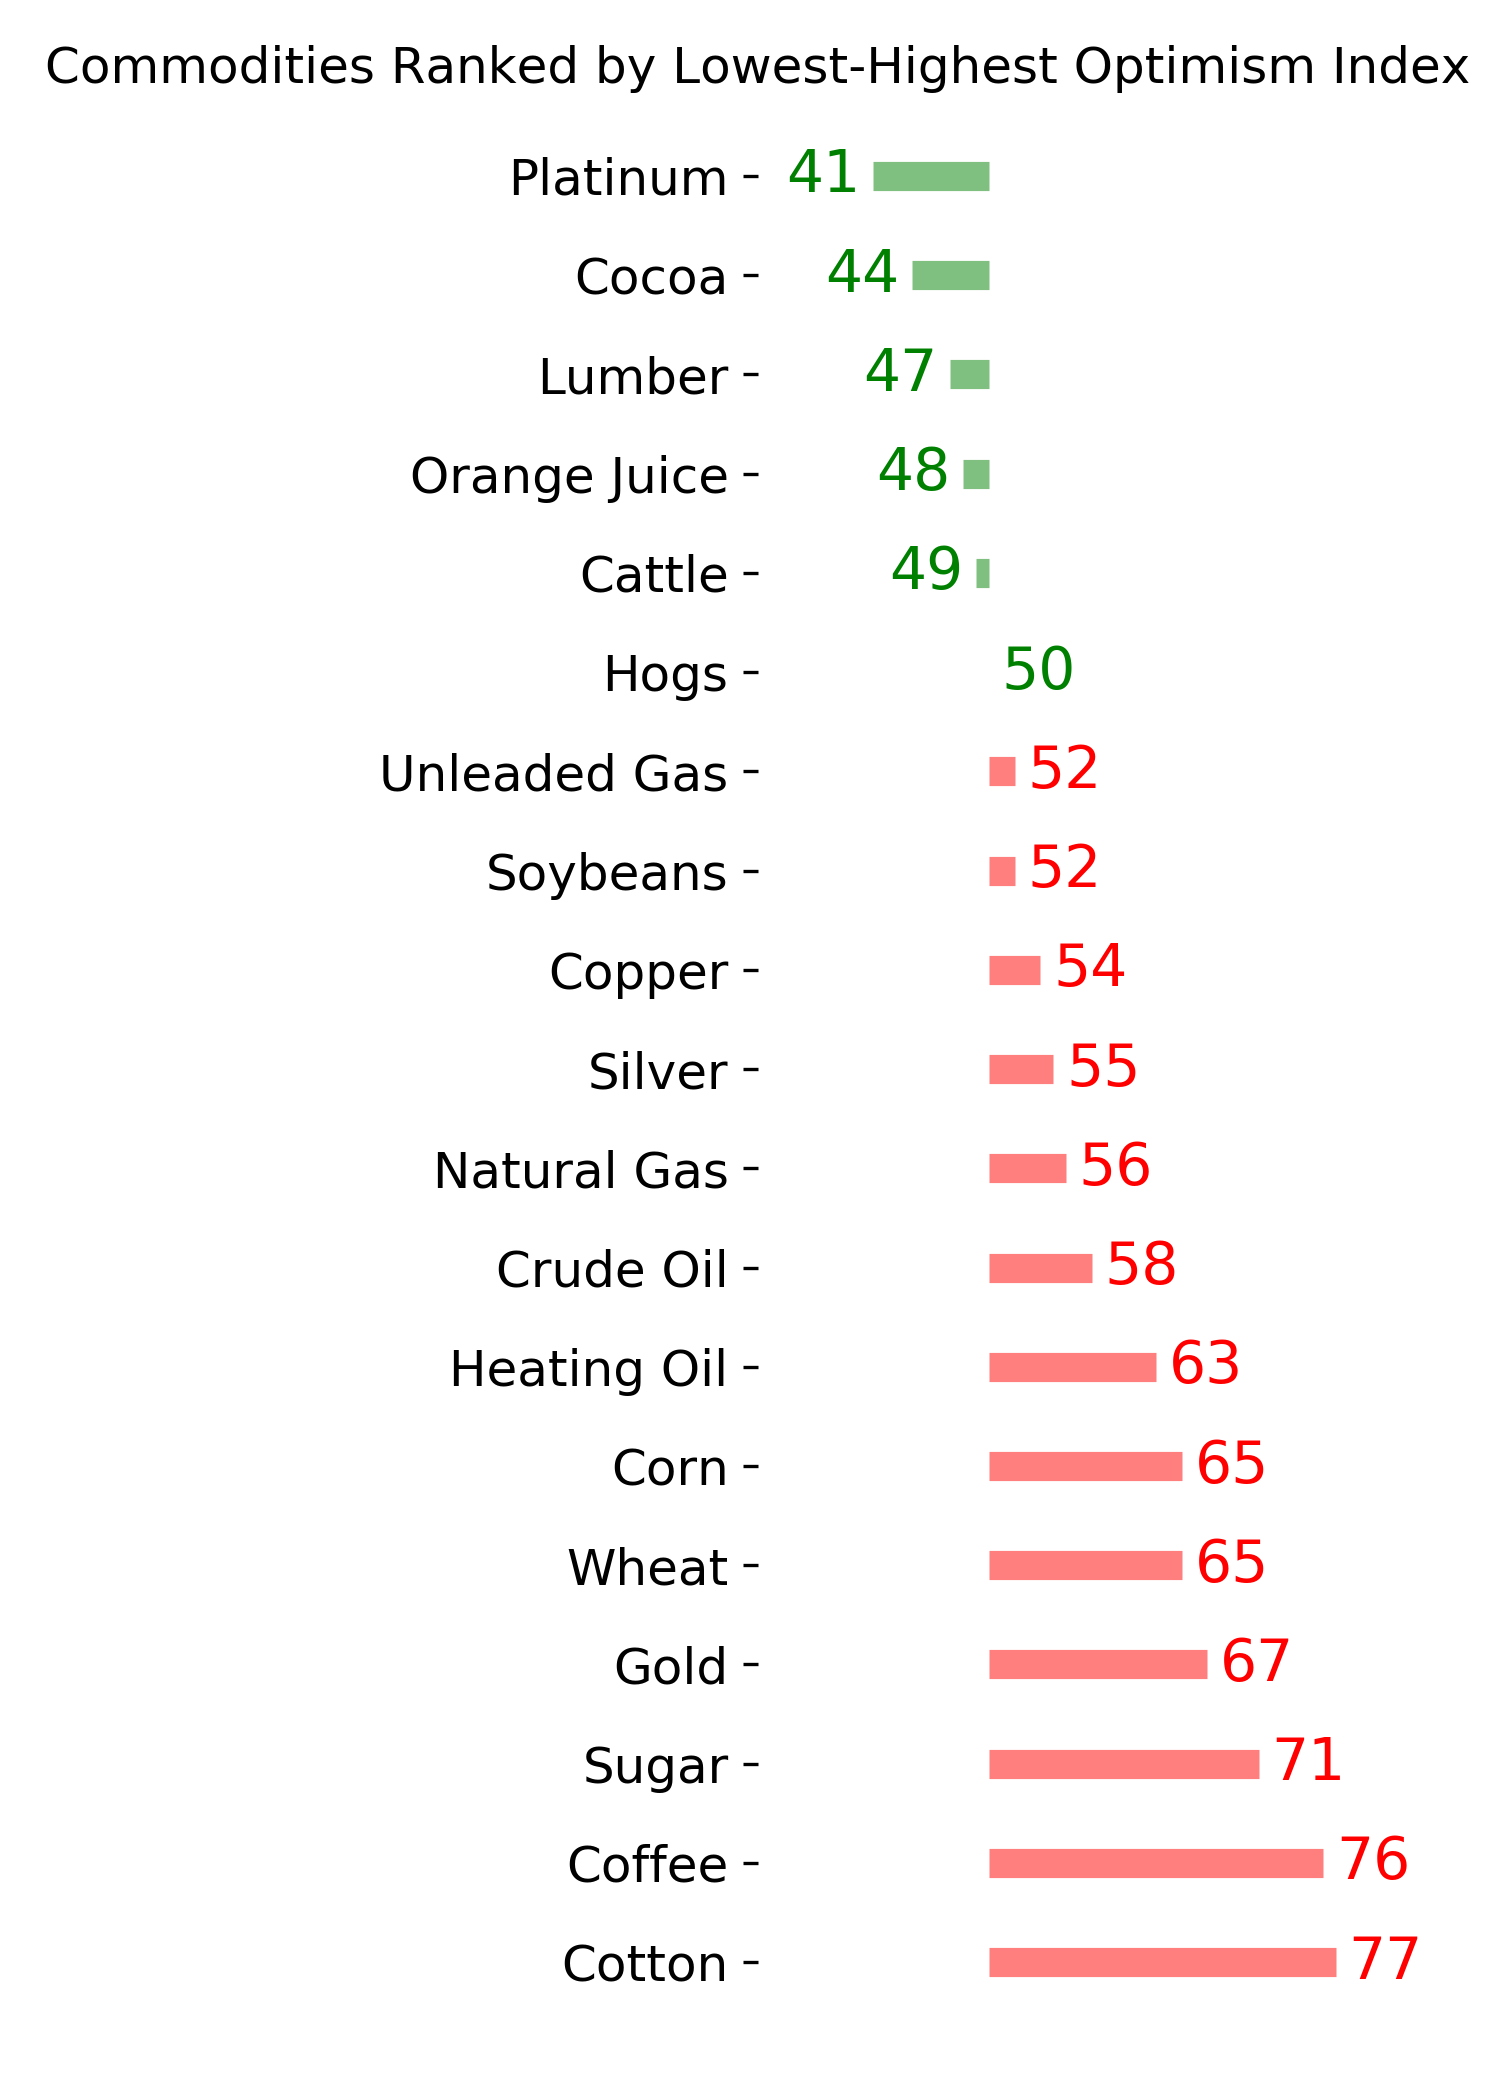
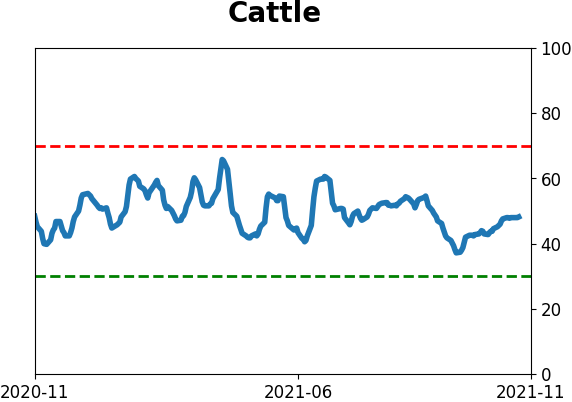
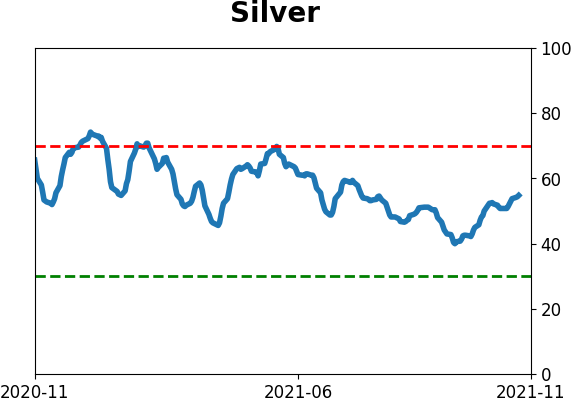
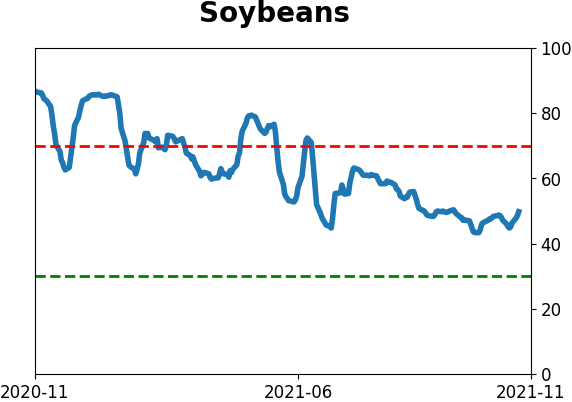
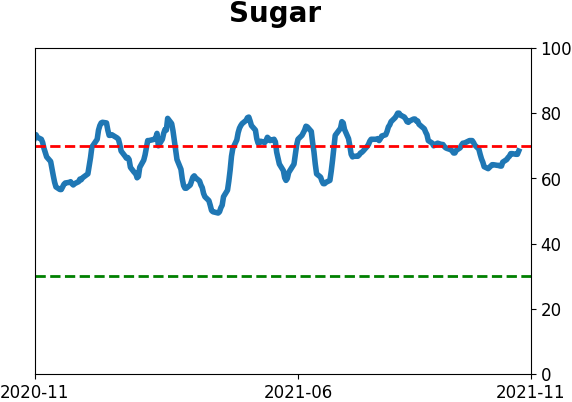
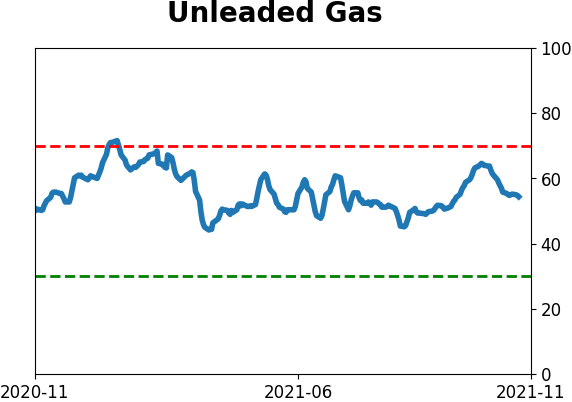
Commodity ETF's - 5-Day Moving Average
|
|