Headlines
|
|
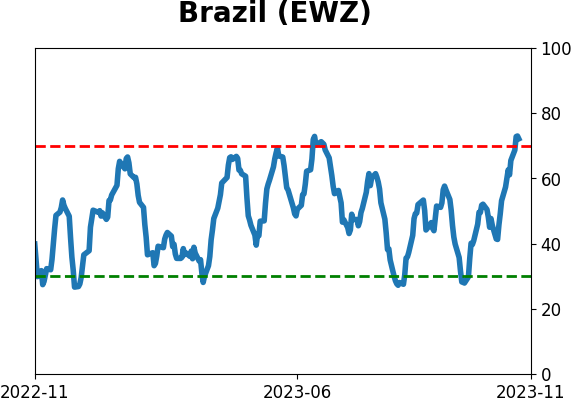
Brazil's Ibovespa finally sees significant participation:
Investors in companies in Brazil's Ibobespa index have participated in broad-based and persistent buying. That has triggered recoveries in some medium-term breadth indicators for the index. Similar behavior tended to precede further gains, but currency risk is real for non-local investors.
|
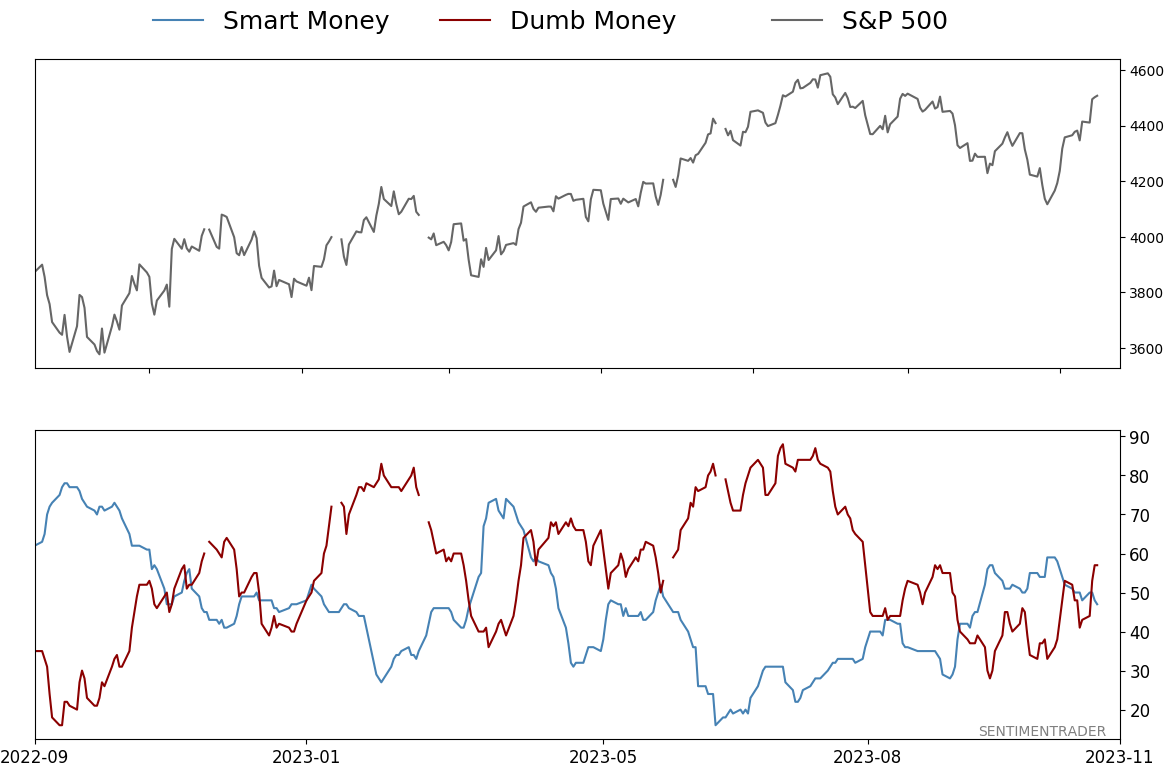
Smart / Dumb Money Confidence
|
Smart Money Confidence: 47%
Dumb Money Confidence: 57%
|
|
Risk Levels
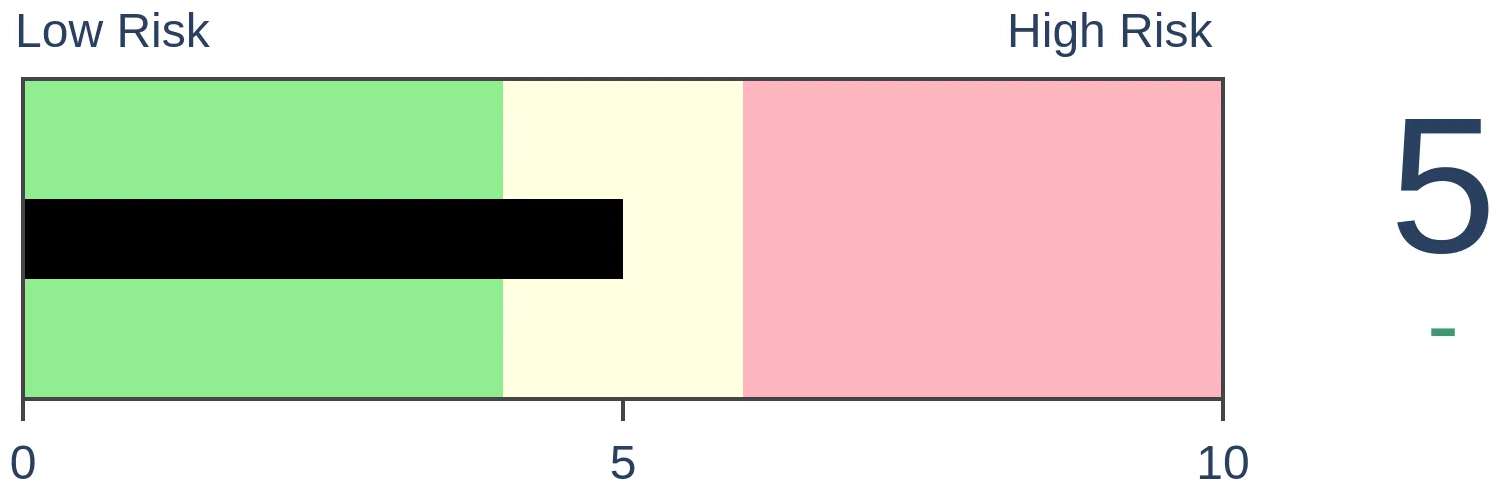
Stocks Short-Term
|
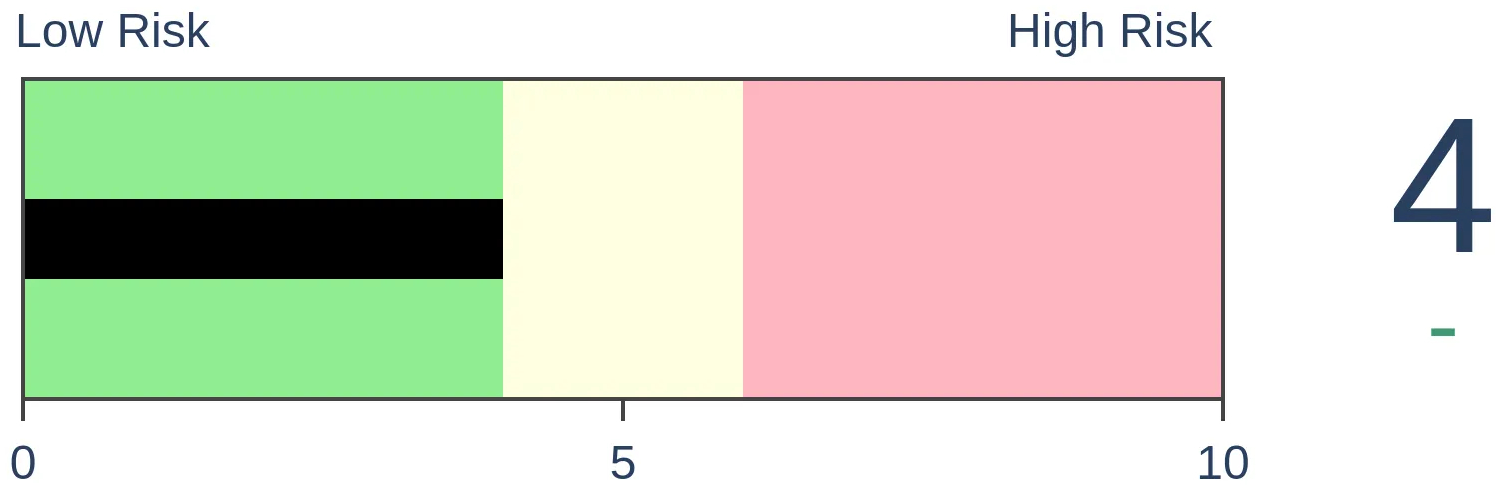
Stocks Medium-Term

|
|
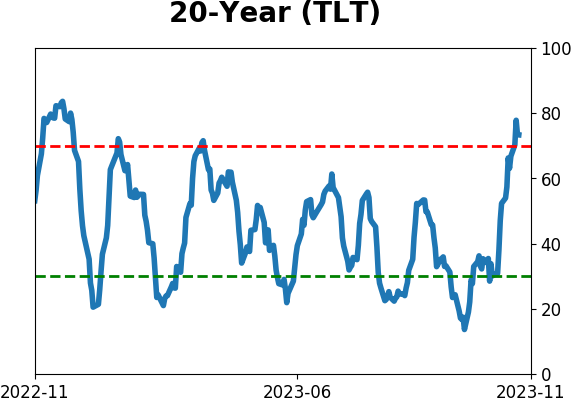
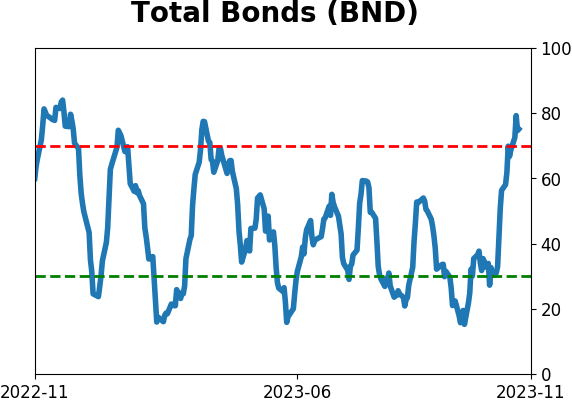
Bonds

|
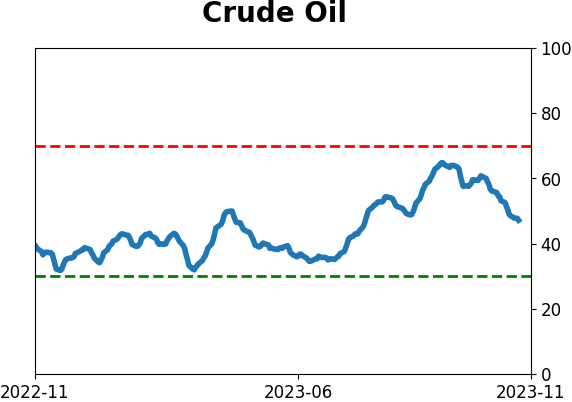
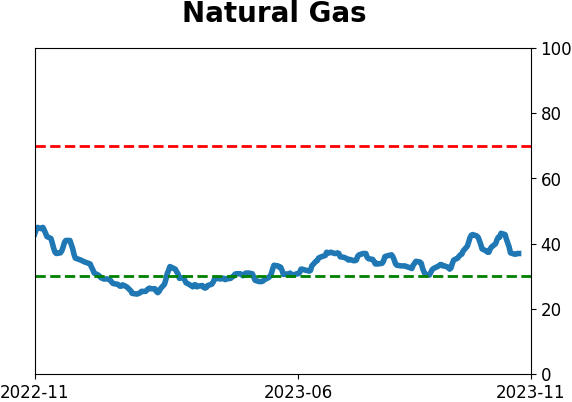
Crude Oil
|
|
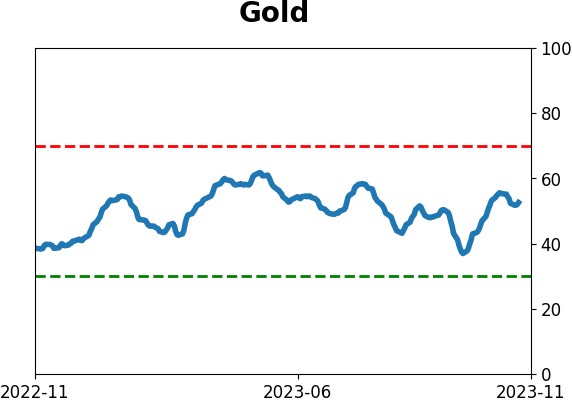
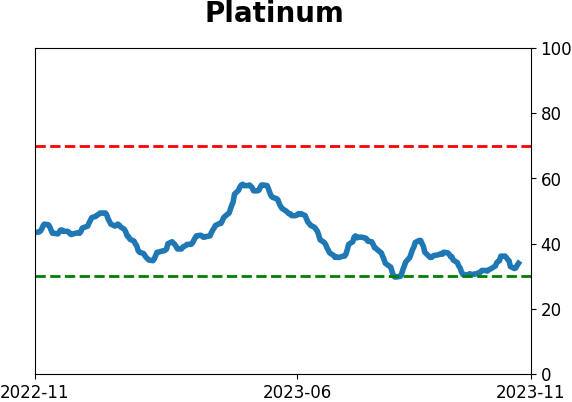
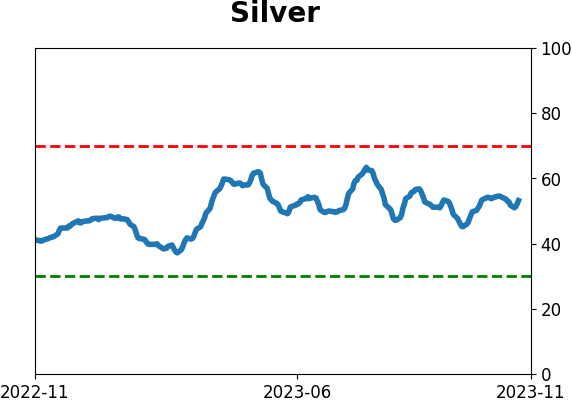
Gold
|
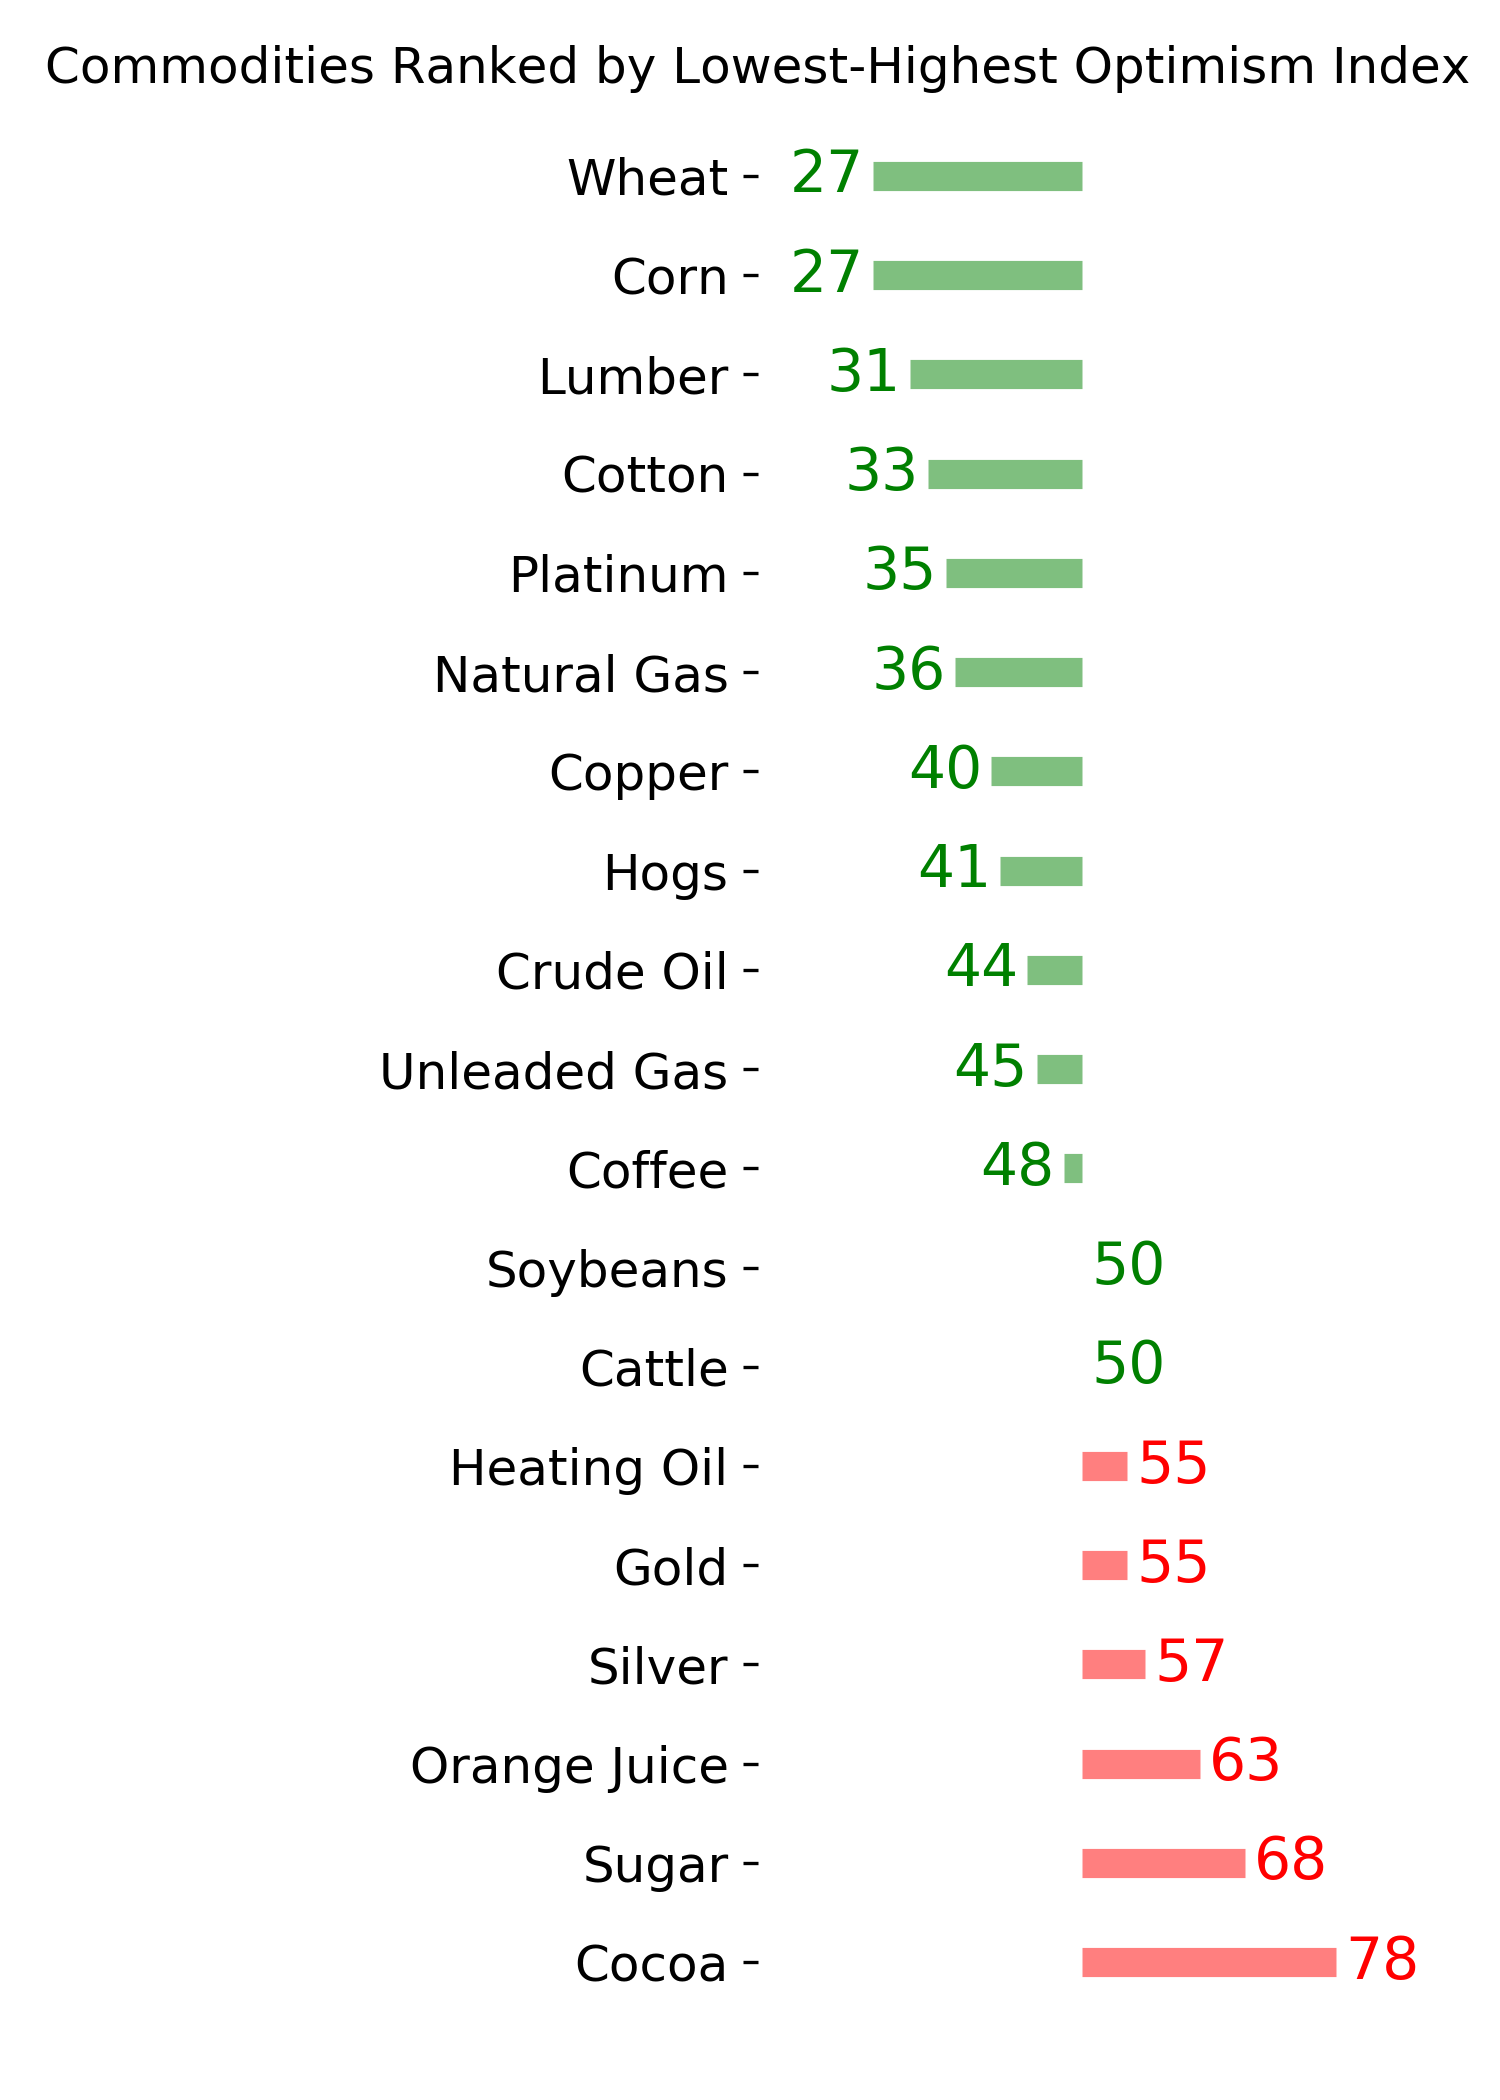
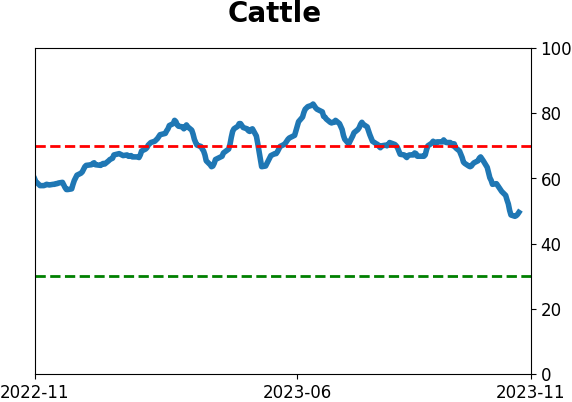
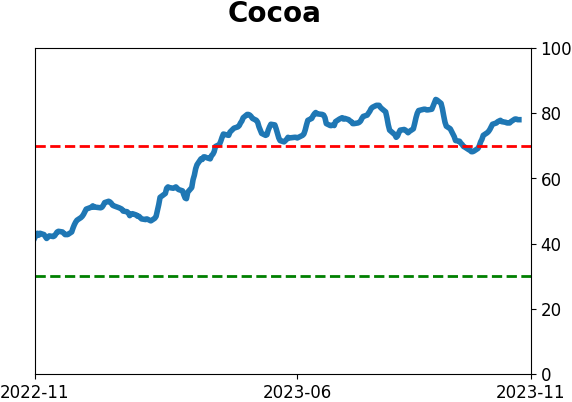
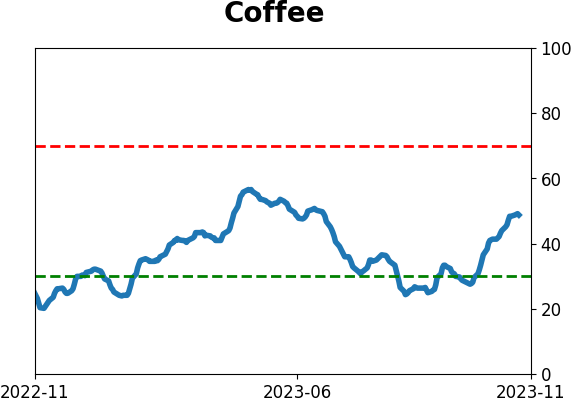
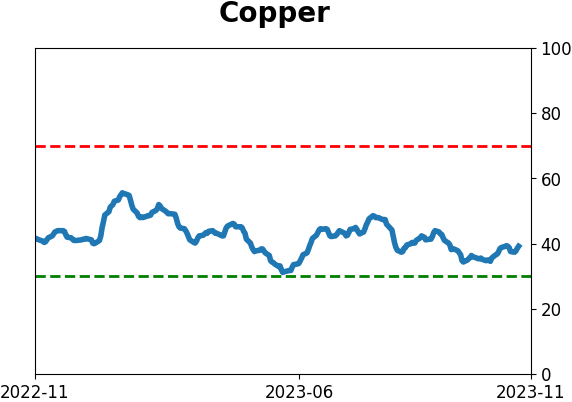
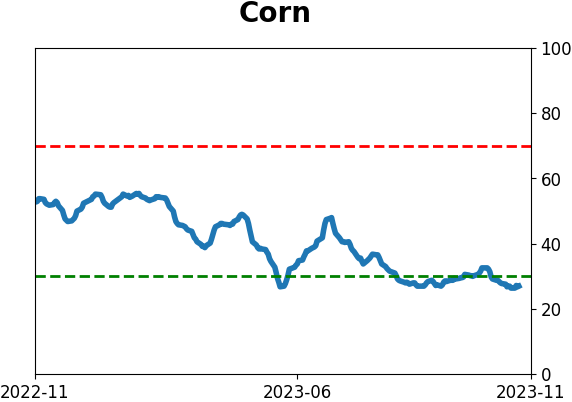
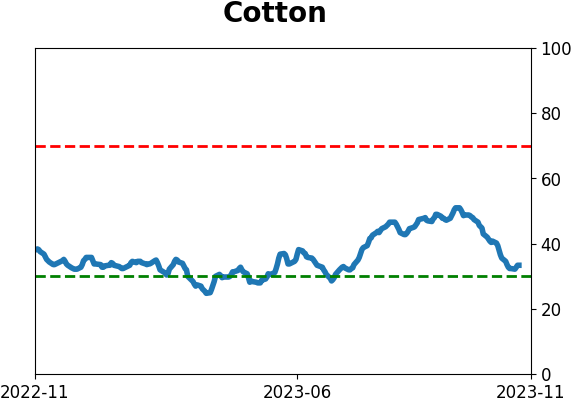
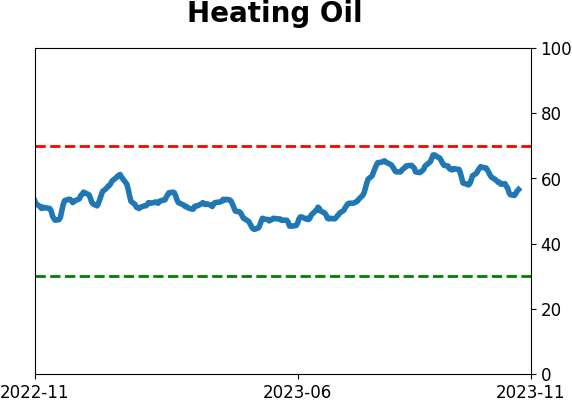
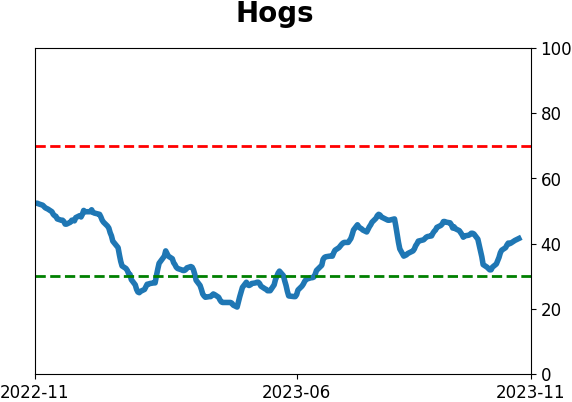
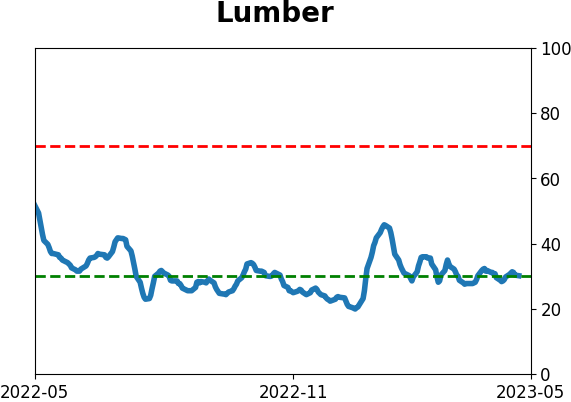
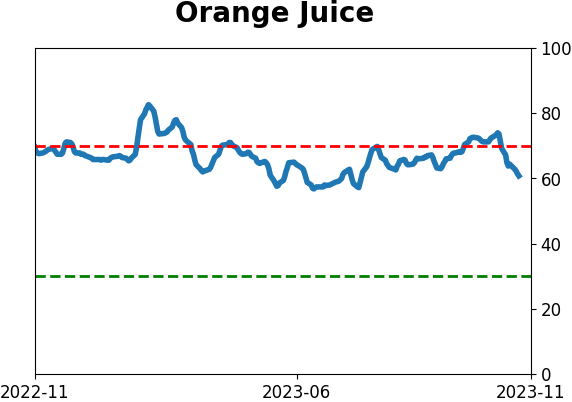
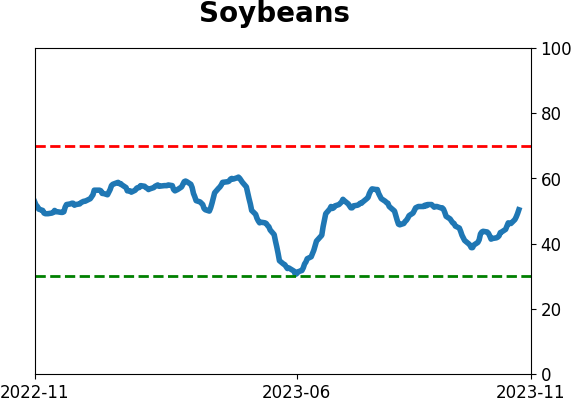
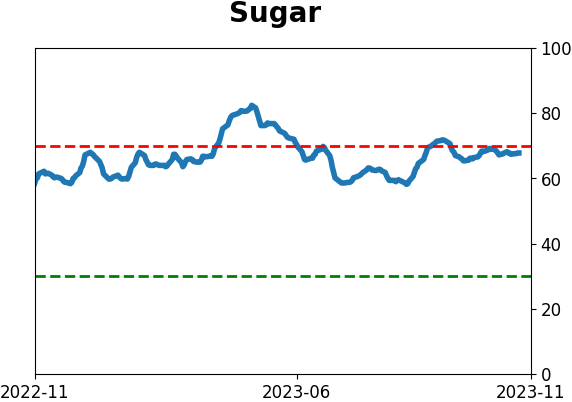
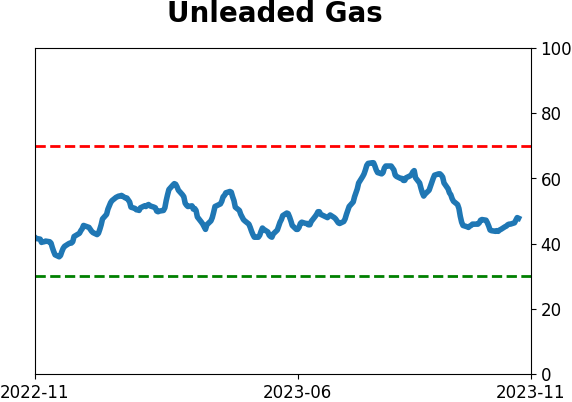
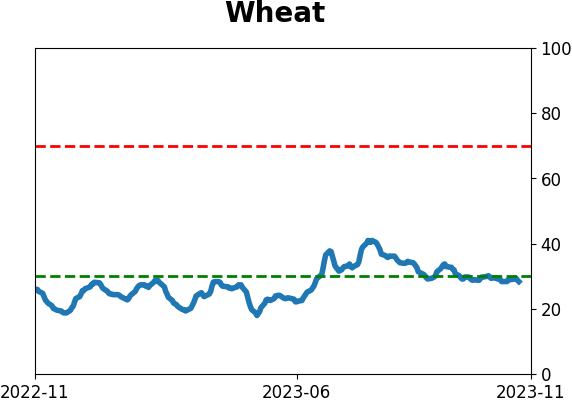
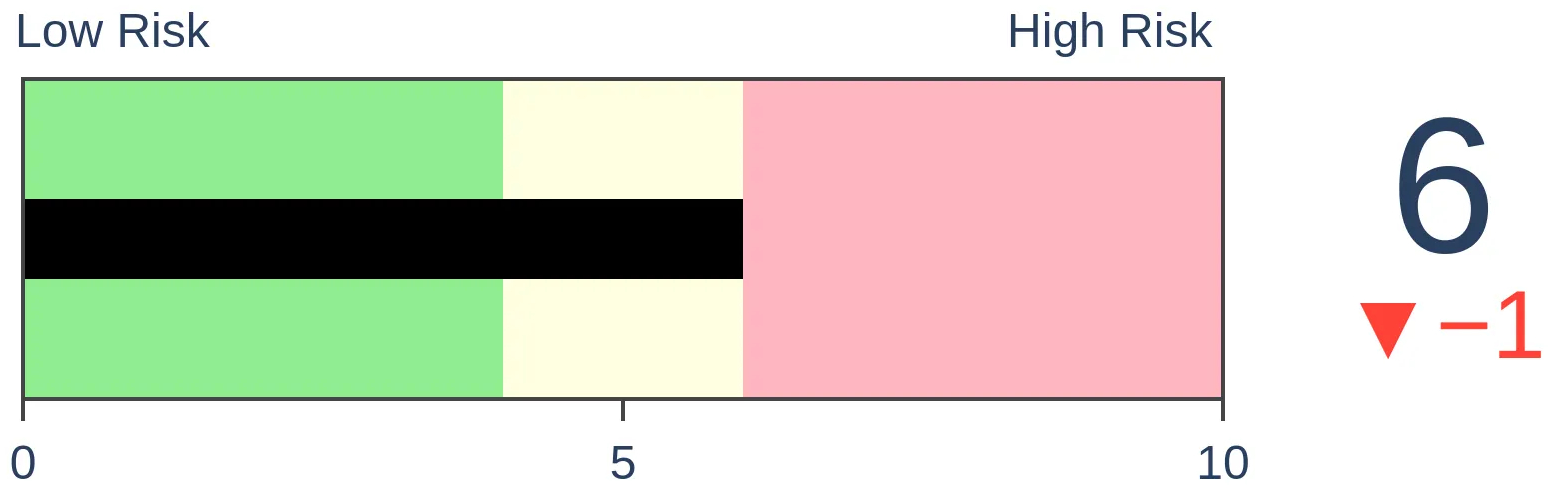
Agriculture

|
|
Research
By Jason Goepfert
BOTTOM LINE
Investors in companies in Brazil's Ibobespa index have participated in broad-based and persistent buying. That has triggered recoveries in some medium-term breadth indicators for the index. Similar behavior tended to precede further gains, but currency risk is real for non-local investors.
FORECAST / TIMEFRAME
None
|
Key points:
- Stocks in Brazil's Ibovespa index have recovered strongly in recent weeks
- The recovery has triggered extremes in some breadth indicators for the first time in months
- Similar surges tended to precede further gains, but non-local investors must consider currency risk
Brazilian stocks are enjoying another resurgence
Brazilian stocks have joined a semi-global recovery. Several of the indicators we follow have rebounded from depressed levels. When we noted a similar recovery in May, it suggested a multi-month continuation, which did occur before giving back some of those gains and triggering another round of extremes.
The jump in stocks in the Ibovespa index triggered a surge in the McClellan Oscillator, which surged above +100. Investors must be willing to buy broadly, persistently, and aggressively for the McOsc to move above that threshold. When triggered for this index, it signaled that investors were willing to stick around for the medium term.
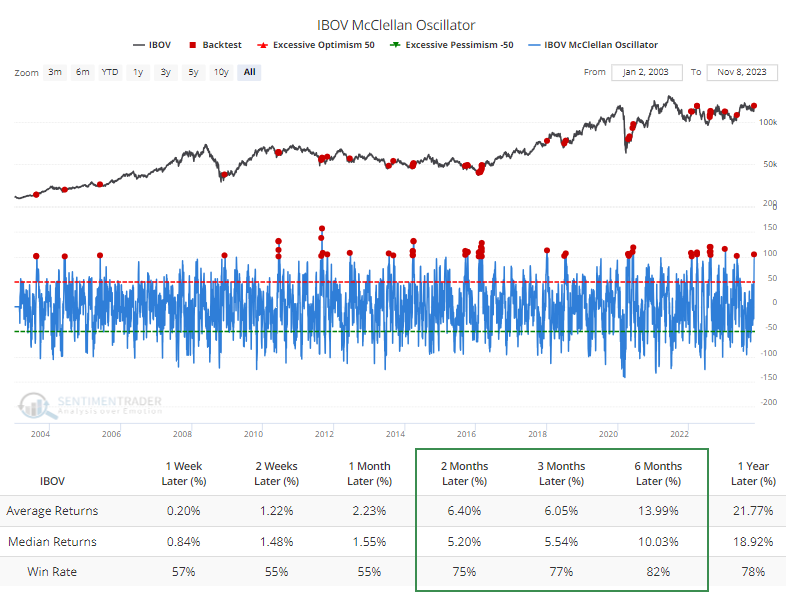
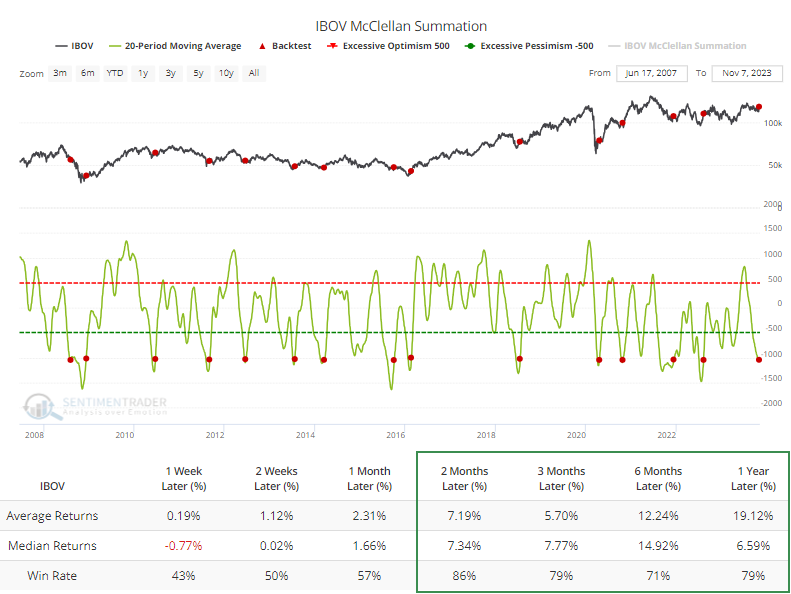
Thanks to a jump in the Oscillator, a 20-day average of the longer-term McClellan Summation Index has turned higher from a severely oversold condition. Two months after similar recoveries, the Ibovespa was higher 86% of the time.
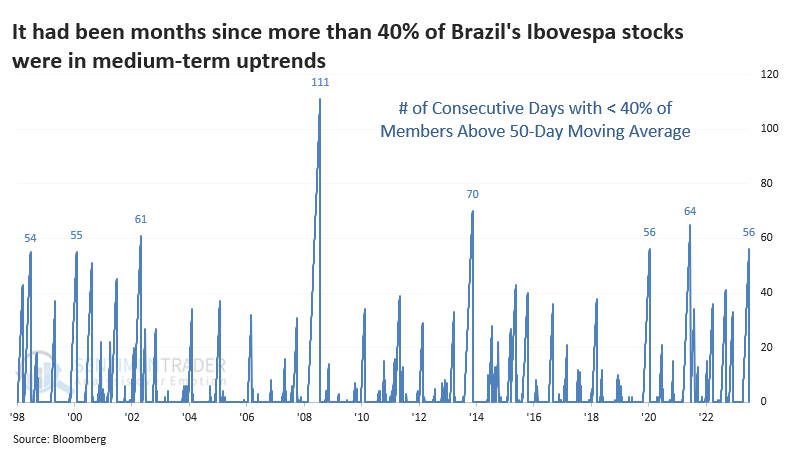
The percentage of member stocks in the index trading above their 50-day averages hadn't been able to rise above 40% for months before finally doing so recently. The other two times this happened in the past five years, it was near or already past a long-term trough.
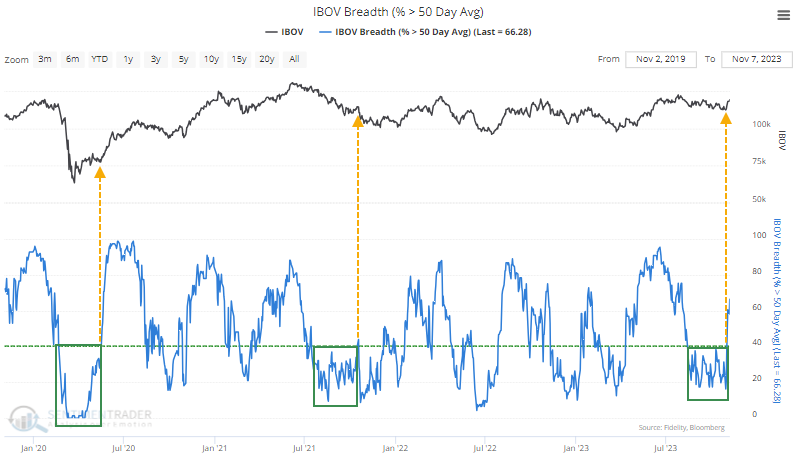
The streak of nearly three months without more than 40% of stocks trading above their 50-day average was tied for the 5th-longest streak in the past 25 years.
Broad medium-term recoveries have tended to keep going
The table below shows returns in the Ibvospa after it finally saw more than 40% of stocks trade above their medium-term averages. It wasn't a perfect buy signal, with a couple of double-digit losses within a month. All but one of them preceded long-term recoveries, however.
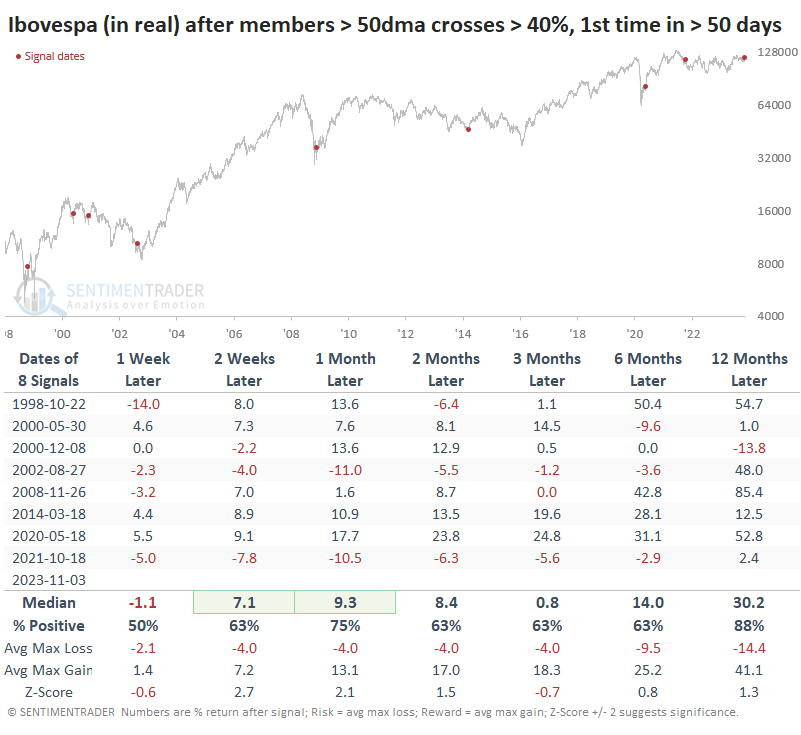
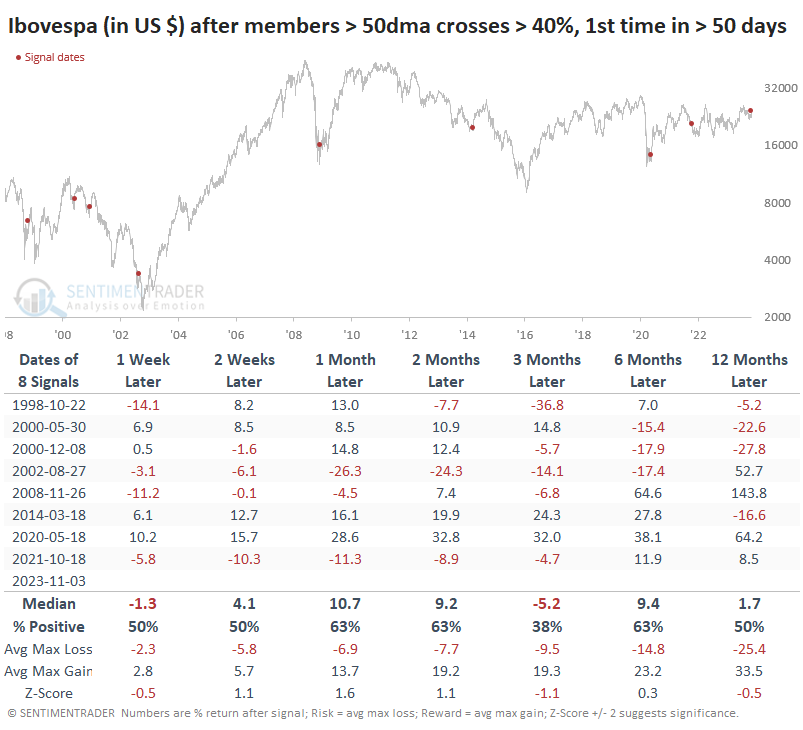
For U.S.-based investors, currency swings have a significant impact on this index. The only currency-hedged ETF I could find has liquidated, and I'm unaware of another good option. In dollar terms, and for a popular fund like EWZ, these signals were not nearly as effective. Five of the eight signals showed a loss over the next three months, and 6-12 months later, three sported double-digit losses.
What the research tells us...
Emerging markets tend to enjoy quick bouts of impressive momentum, only to roll over soon after. Volatility has been a hallmark of these markets for decades and shows no sign of abating. That makes investing based on momentum indicators fraught with risk, as false positives tend to be higher than in more developed markets. That's especially true when also incorporating currency risk.
For Brazilian markets, in particular, similar rebounds in broad-based momentum as they've enjoyed in recent weeks have a decent track record of preceding further gains when triggering after a prolonged decline. The main problem for non-local investors is currency swings, which must be considered before trying to take advantage of a potential trend change in this market.
Indicators at Extremes
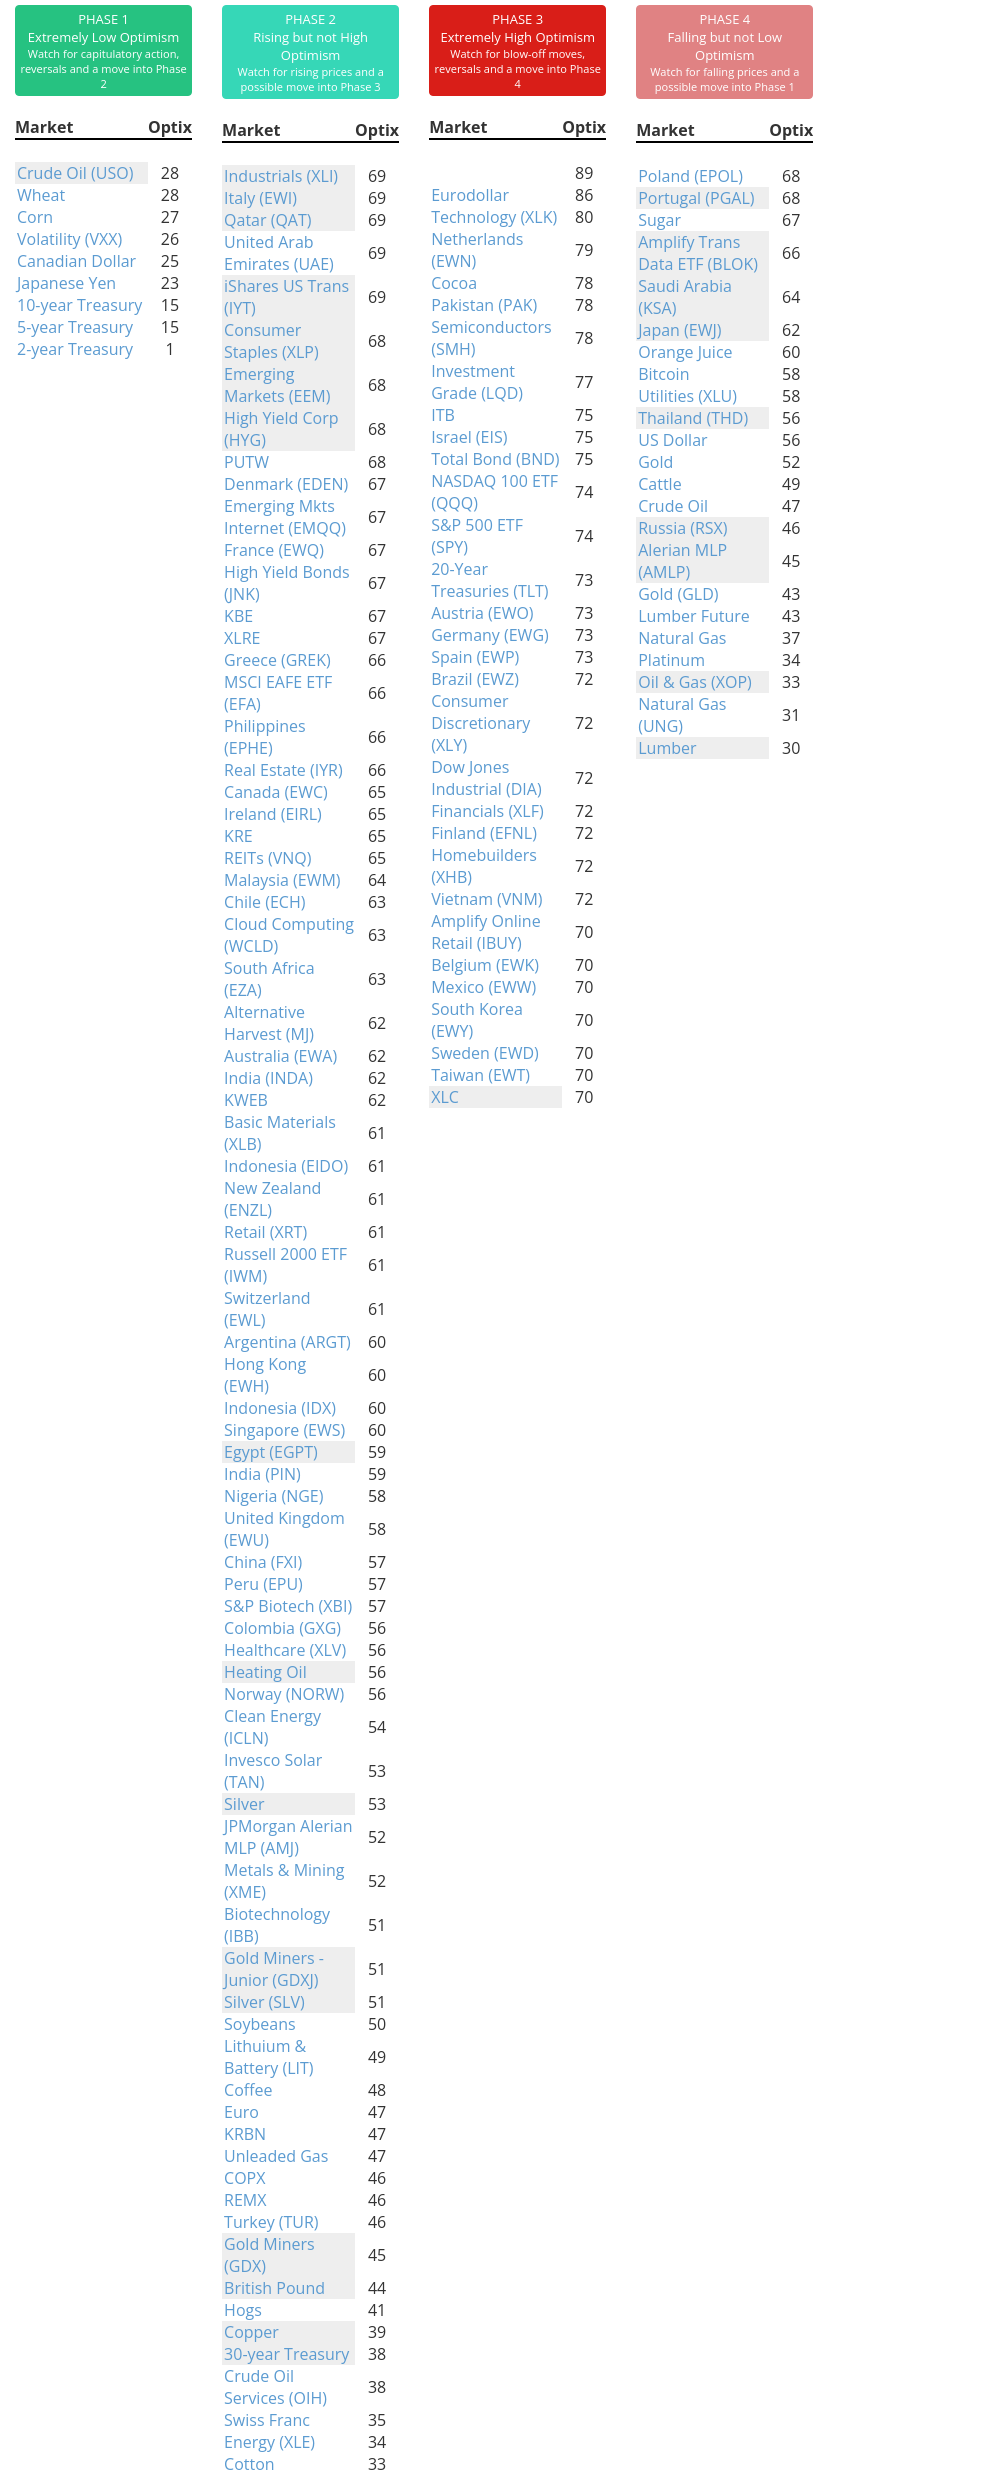
Phase Table
Ranks
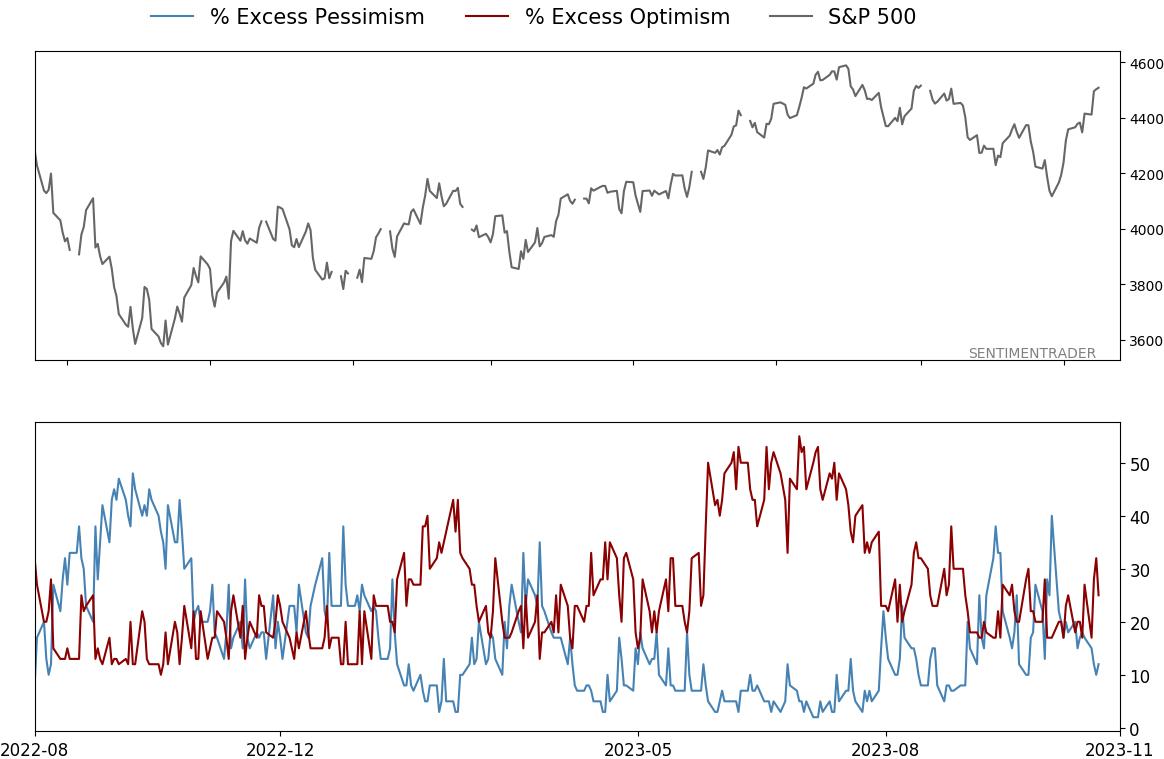
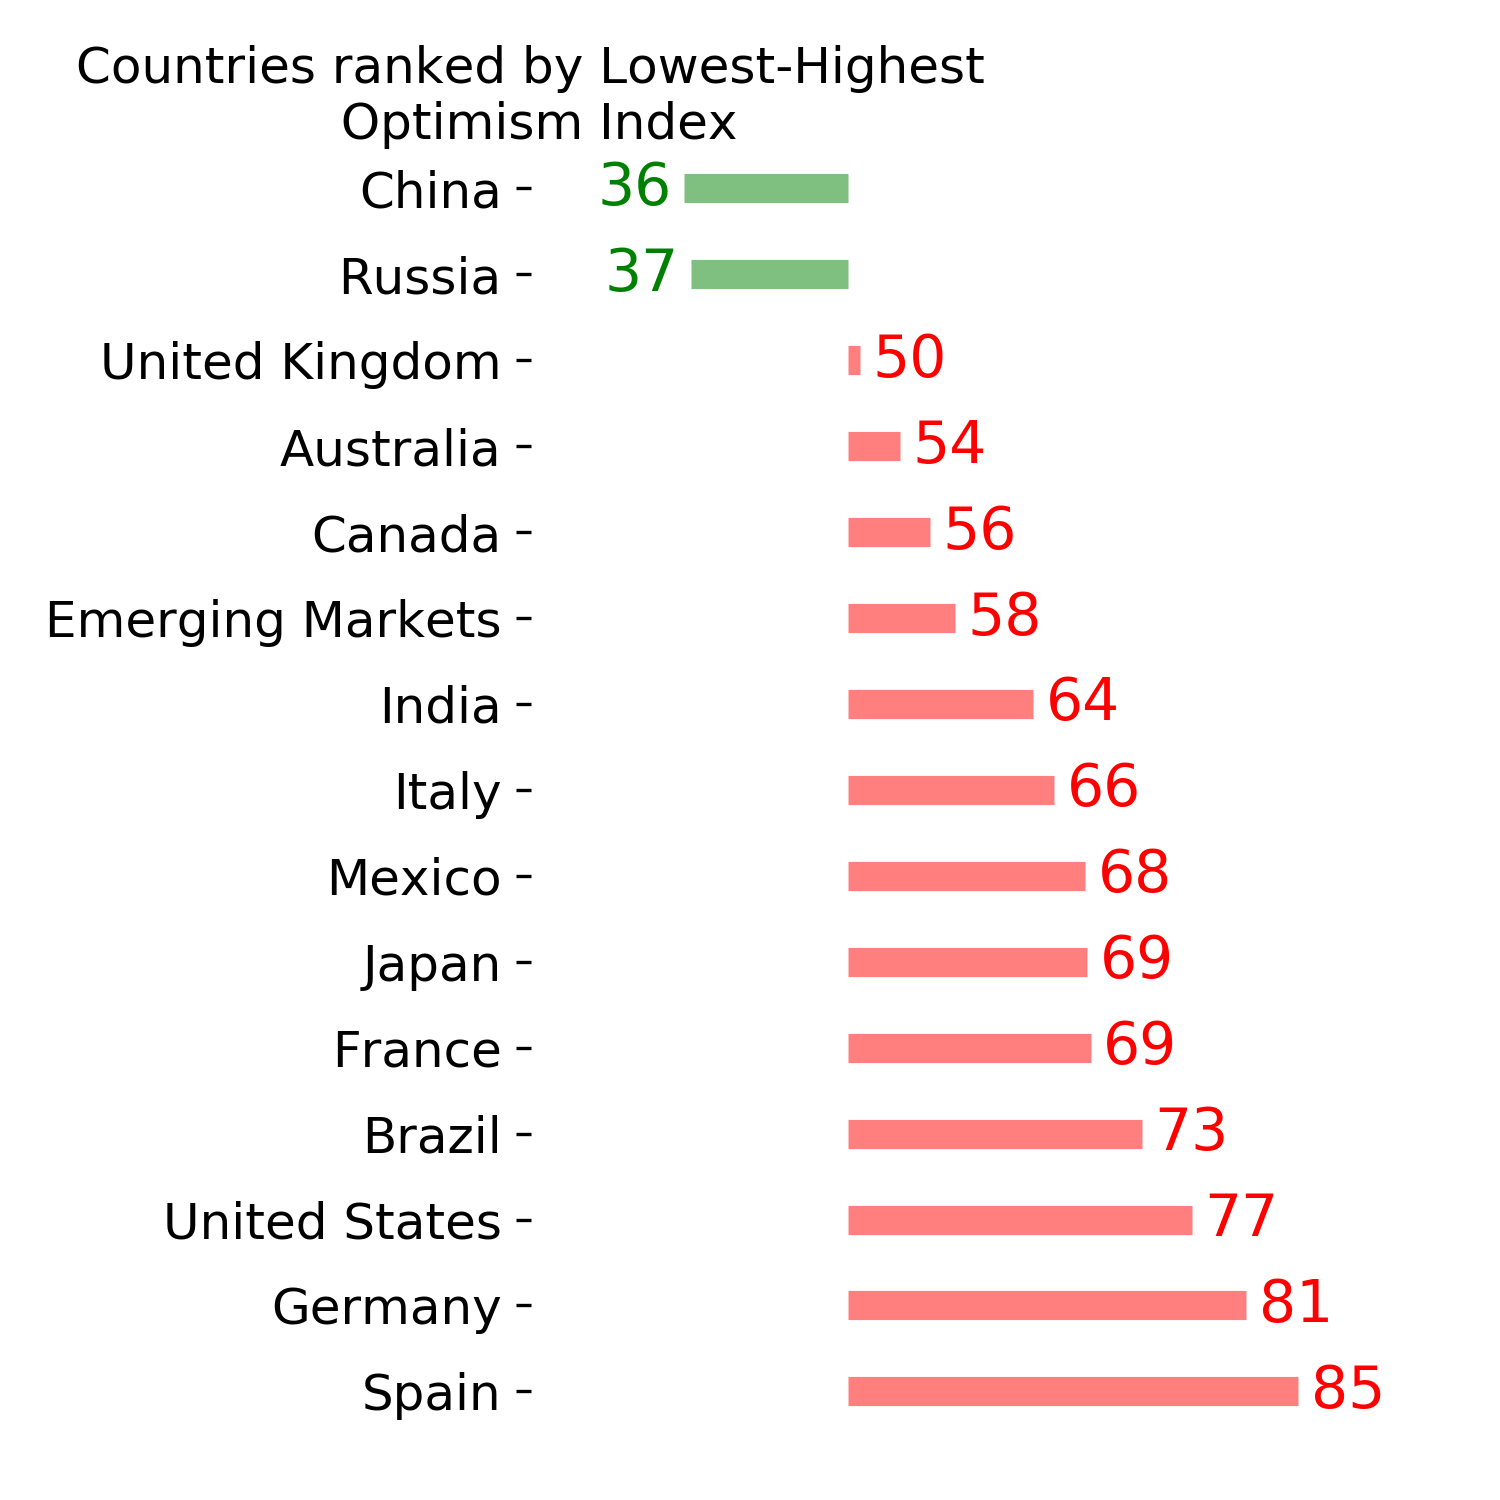
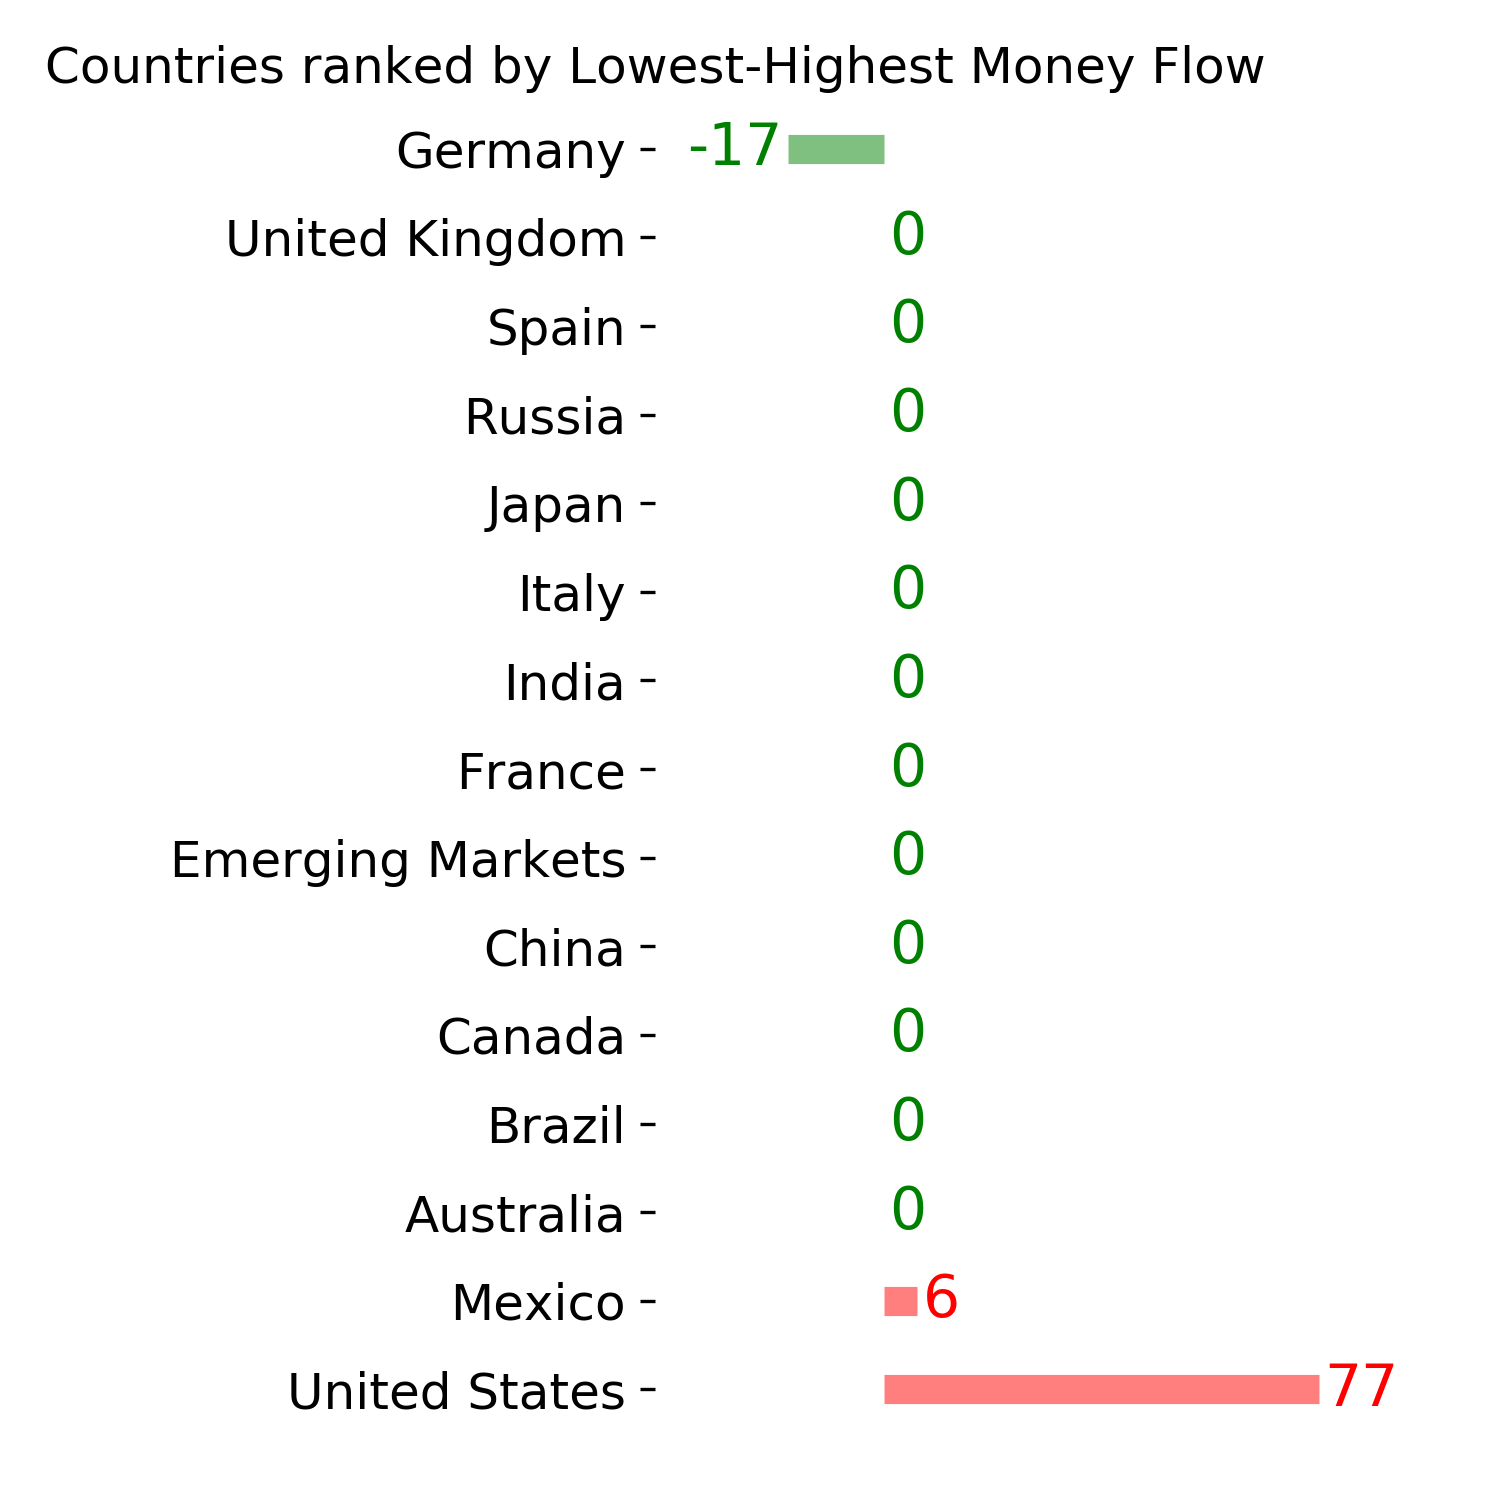
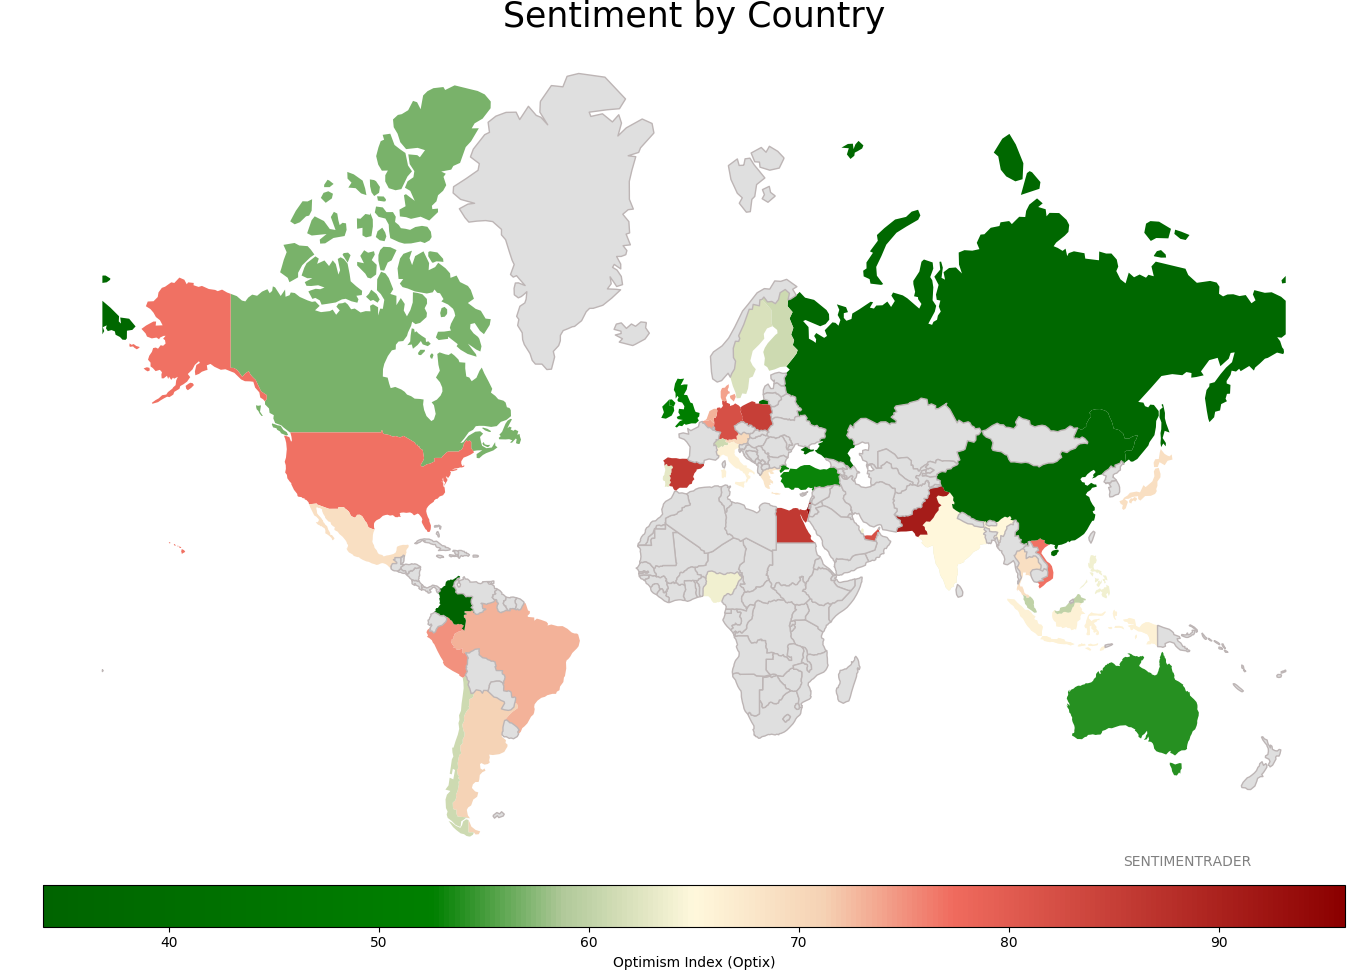
Sentiment Around The World
Optimism Index Thumbnails
|
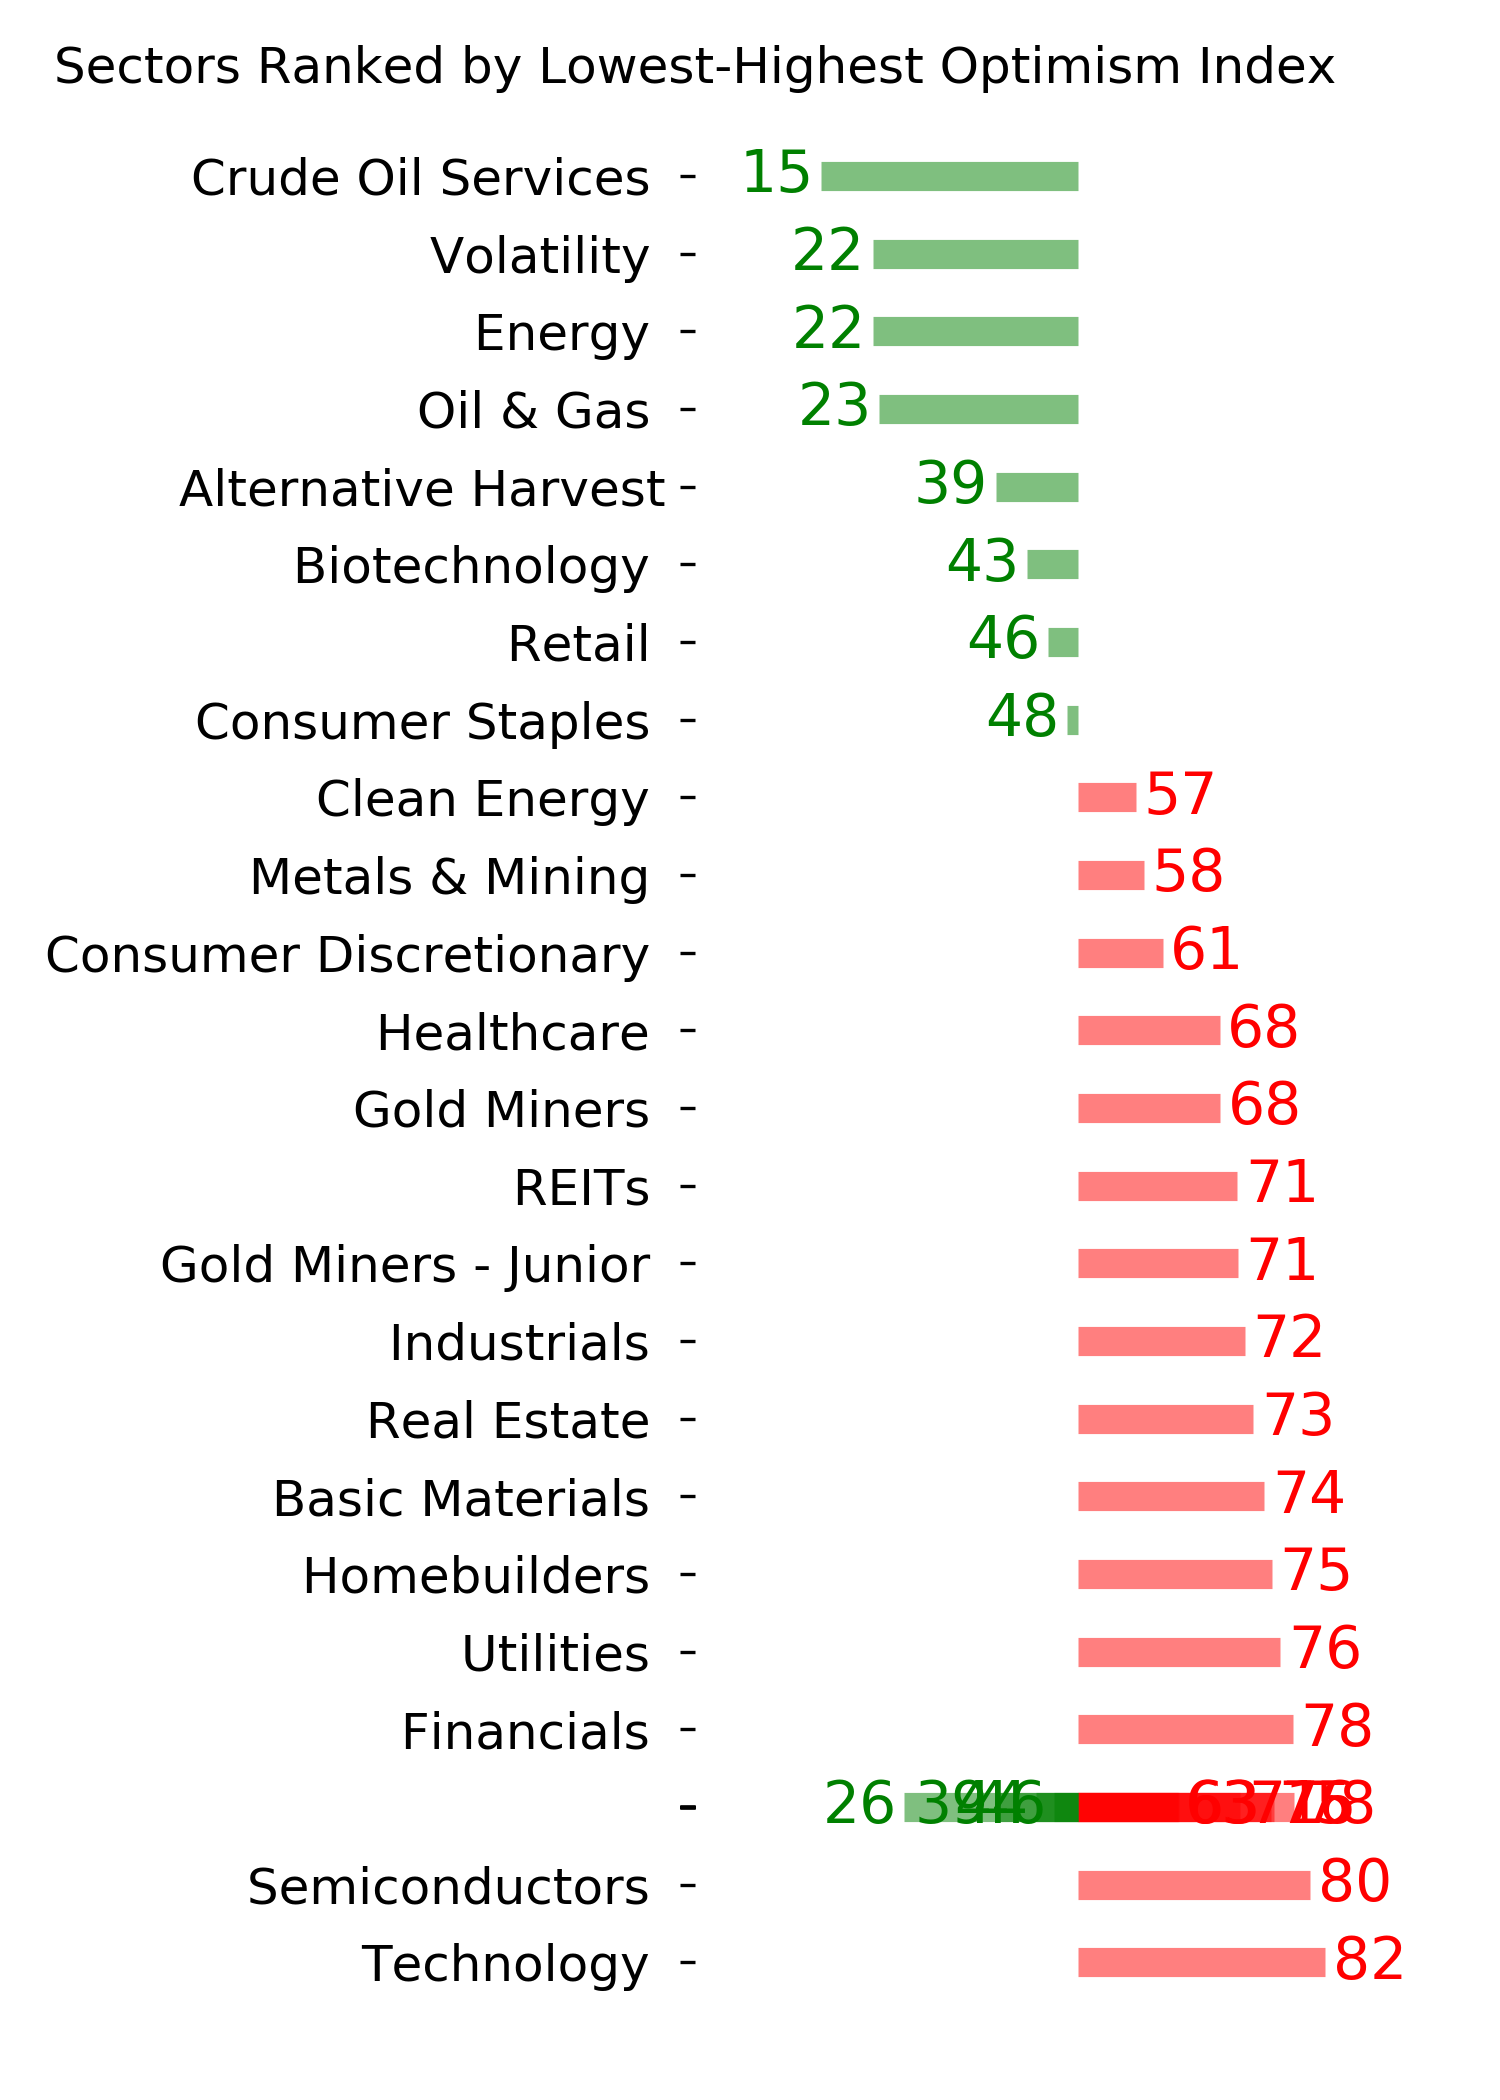
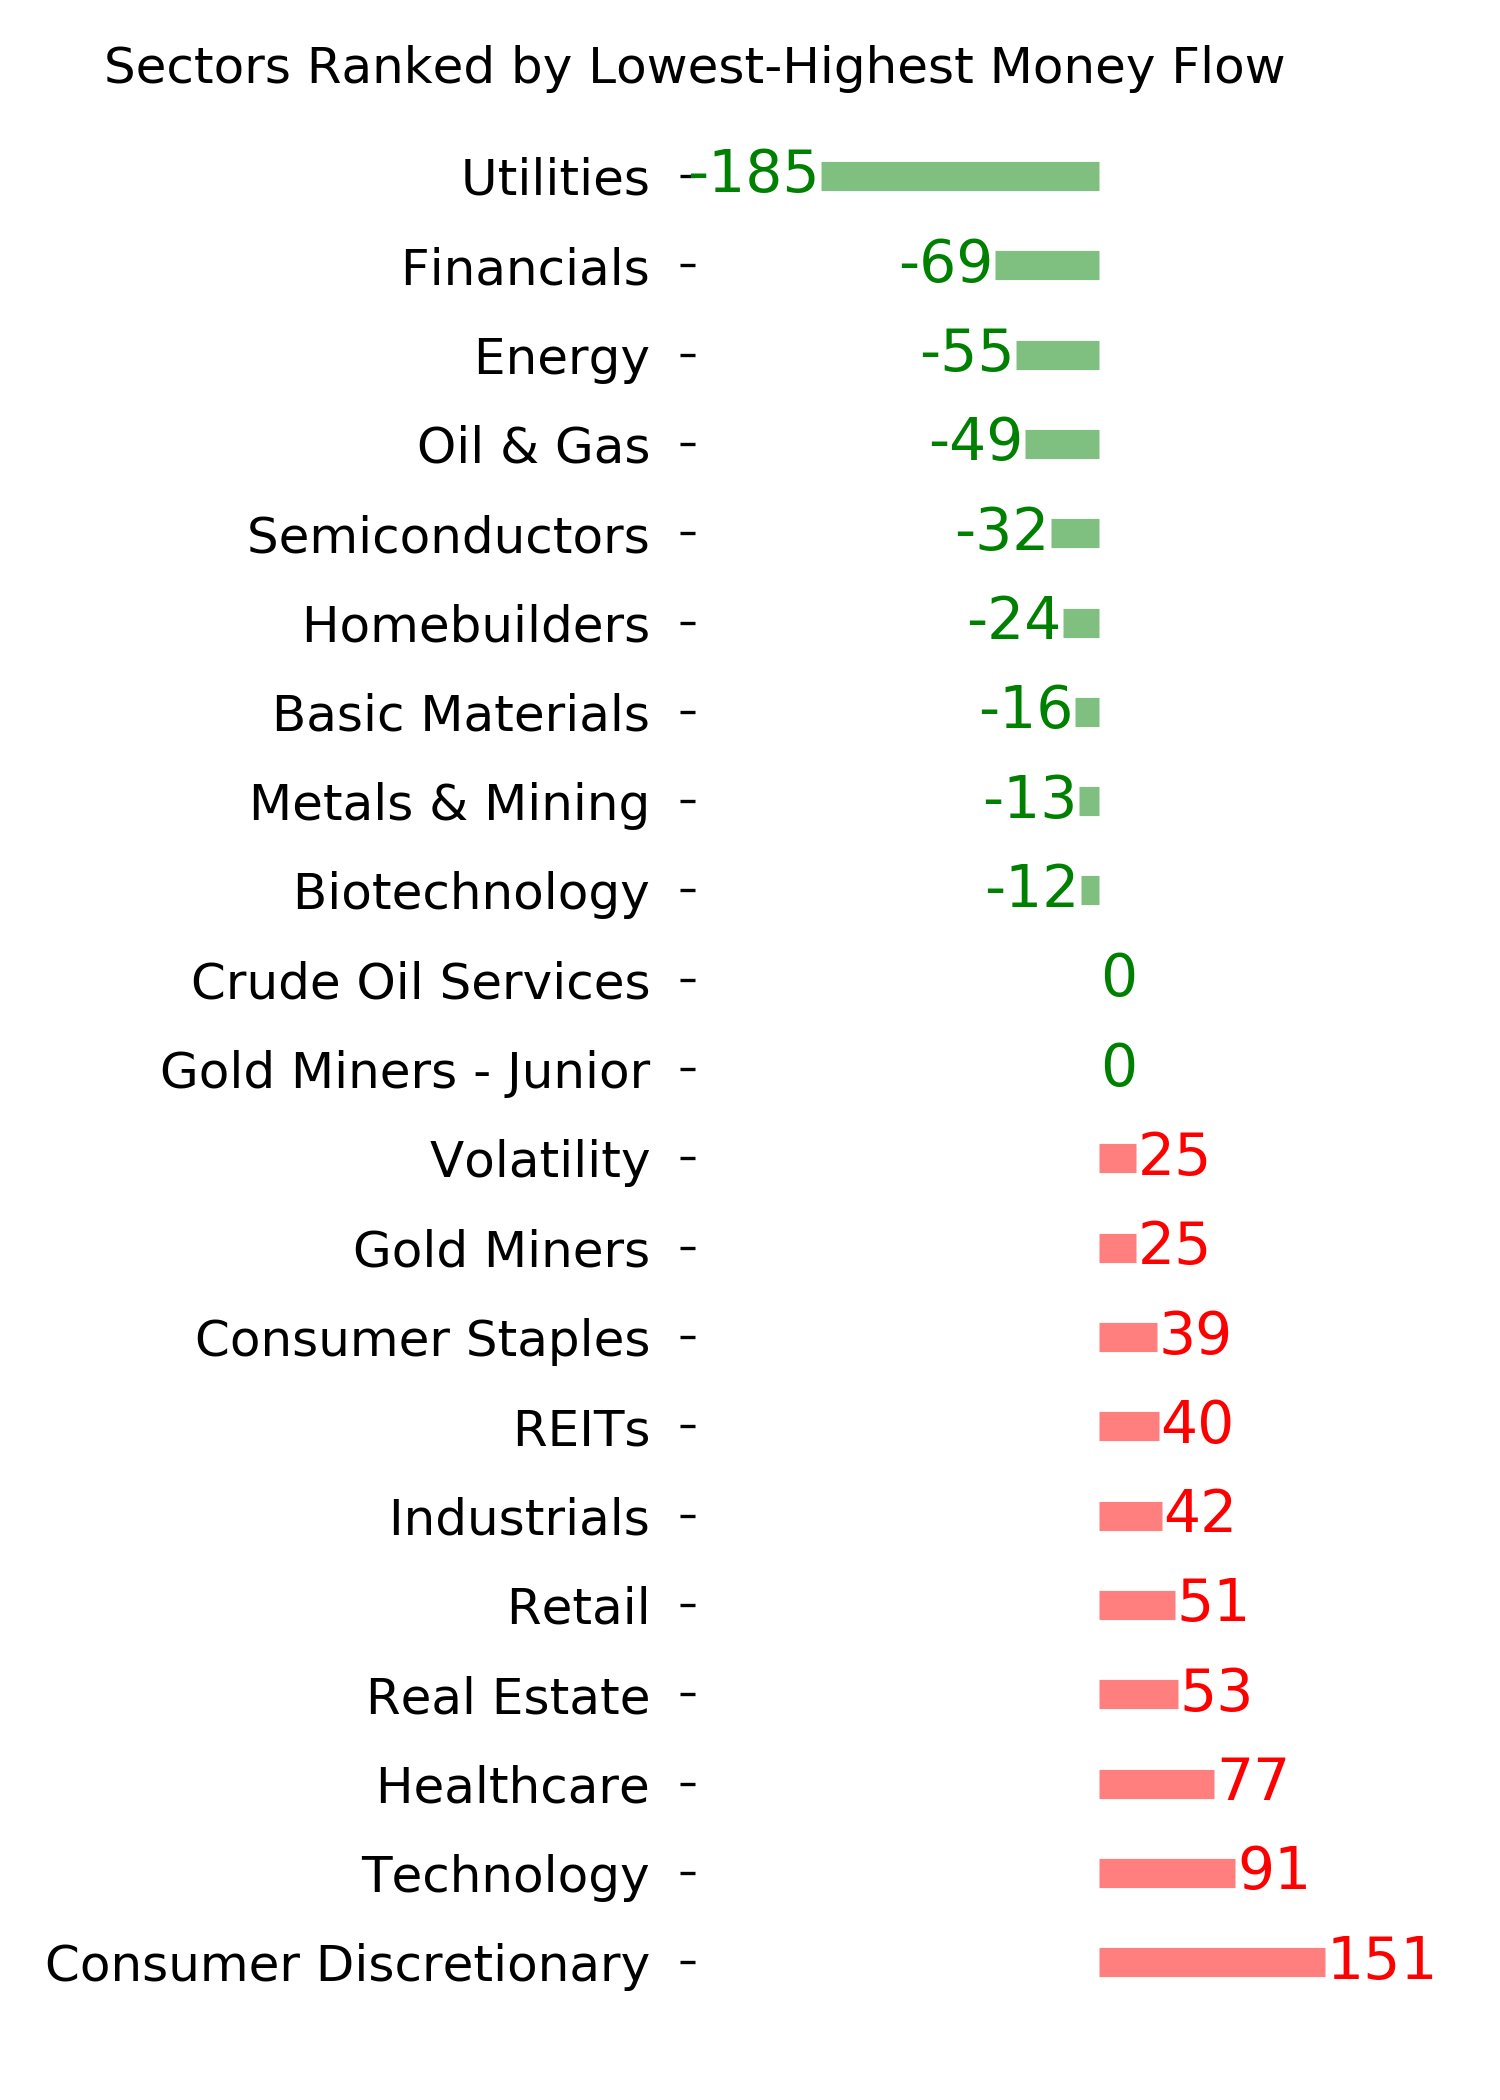
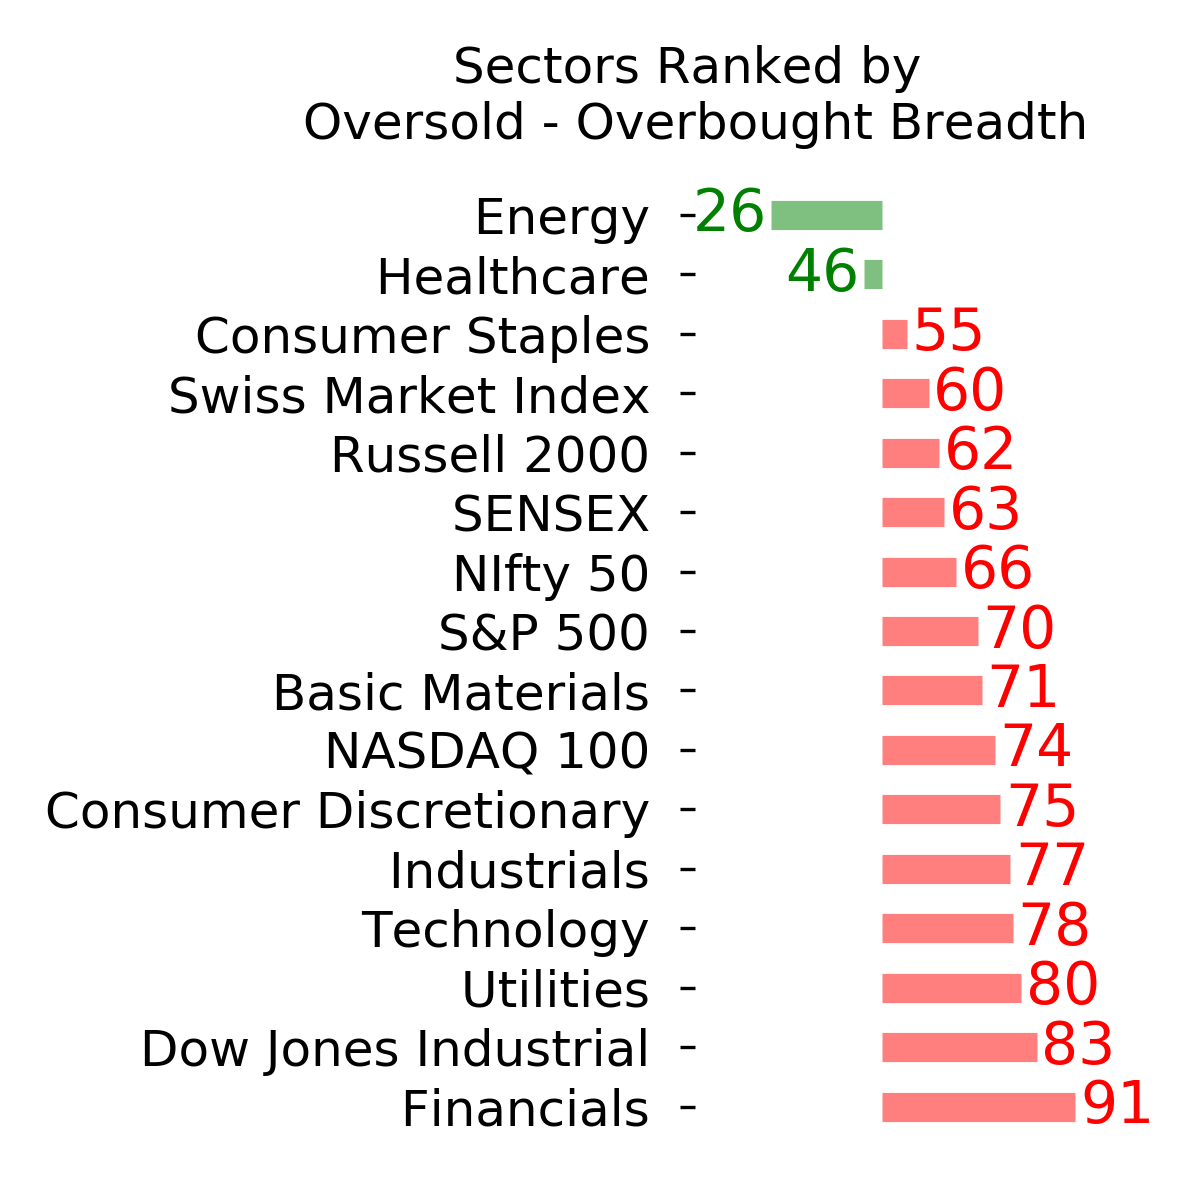
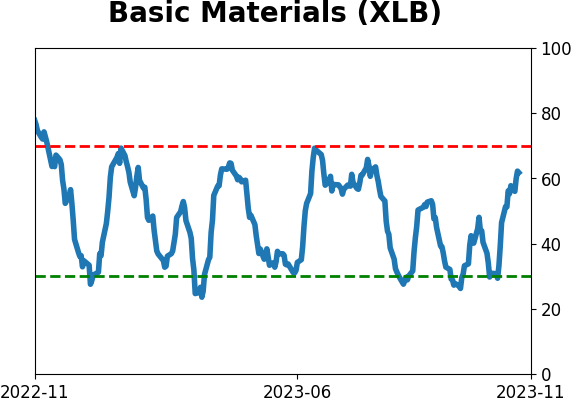
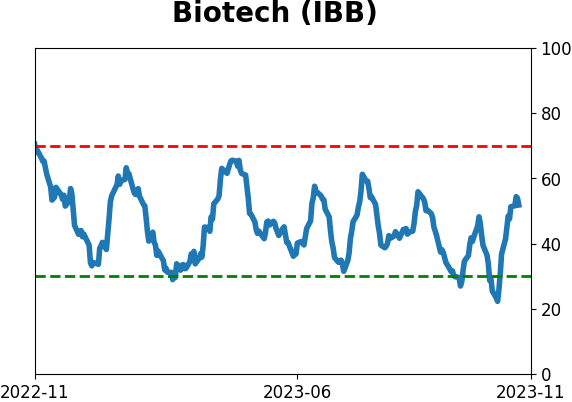
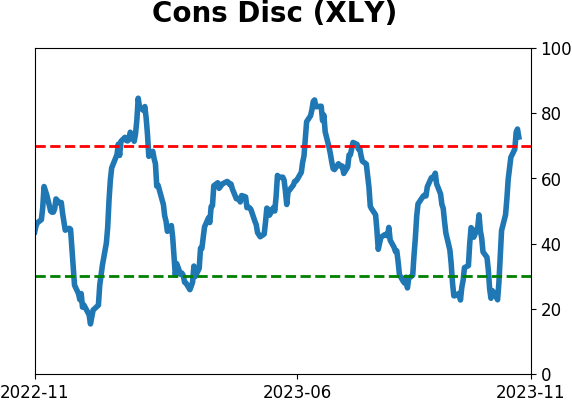
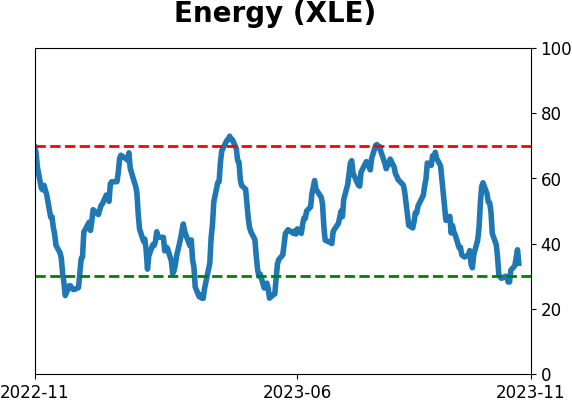
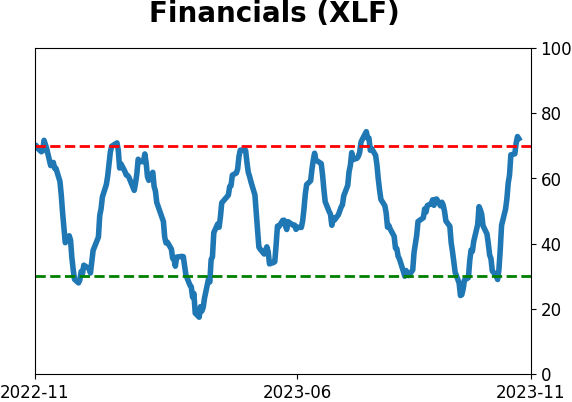
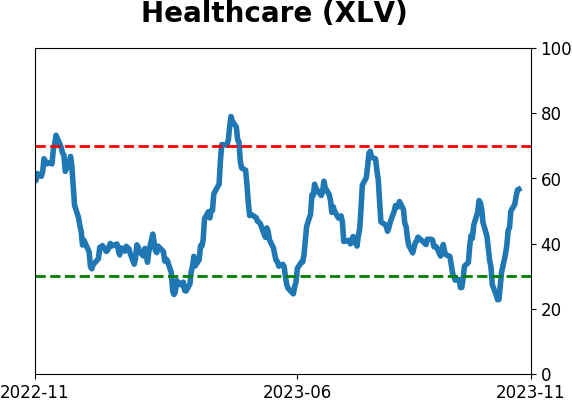
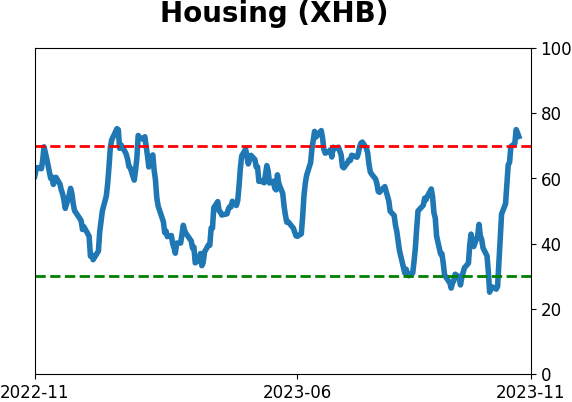
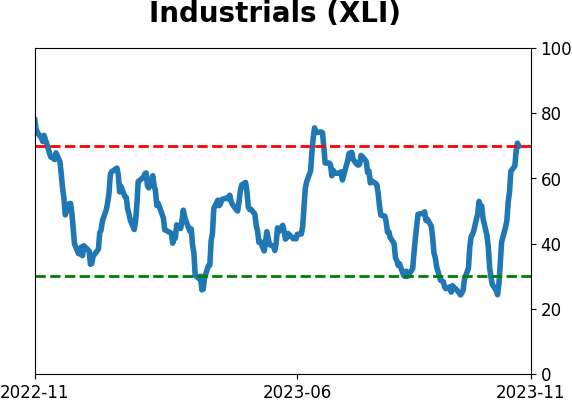
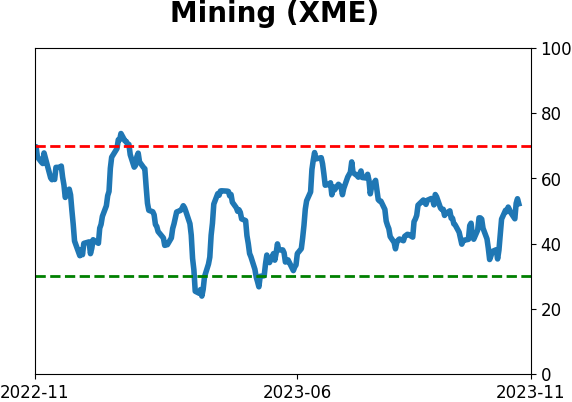
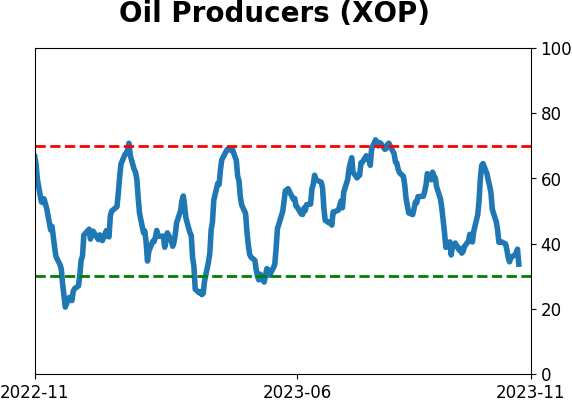
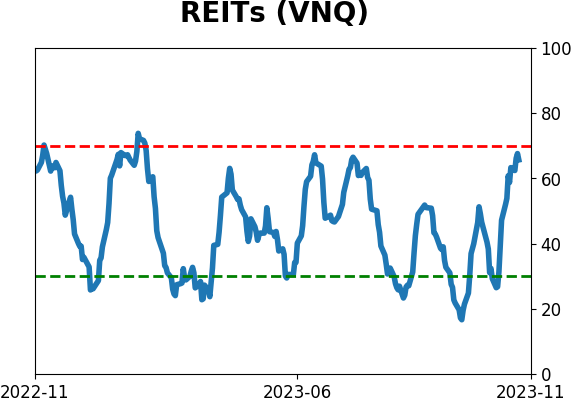
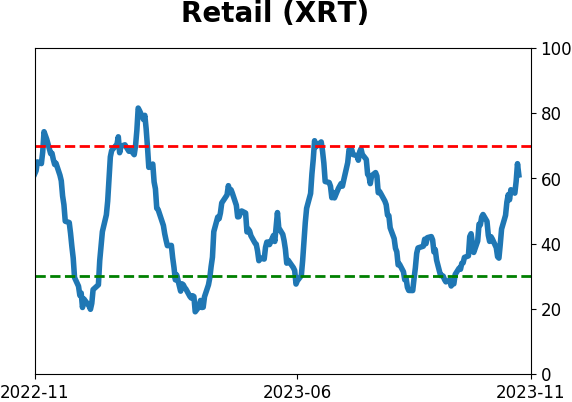
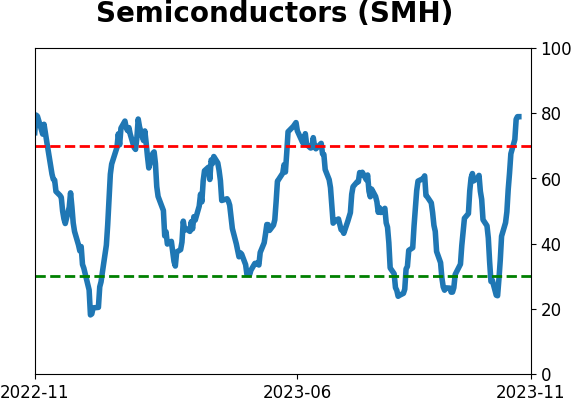
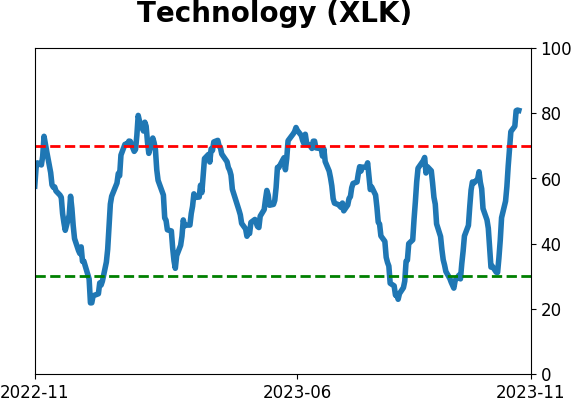
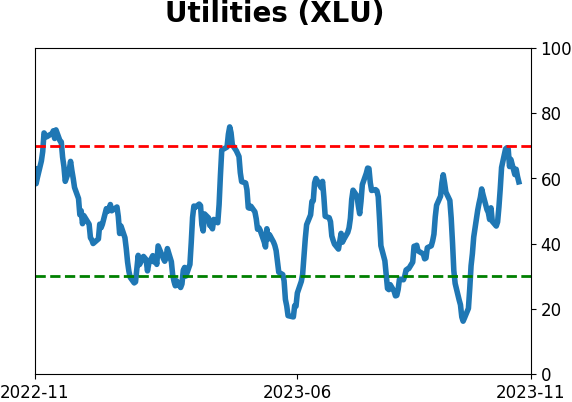
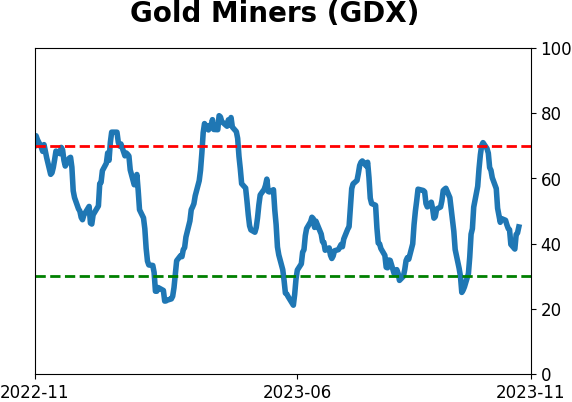
Sector ETF's - 10-Day Moving Average
|
|
|
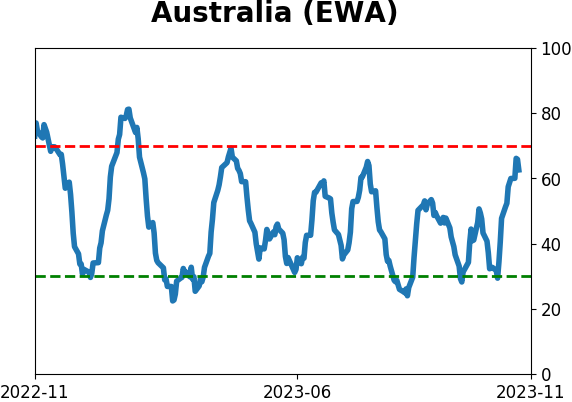
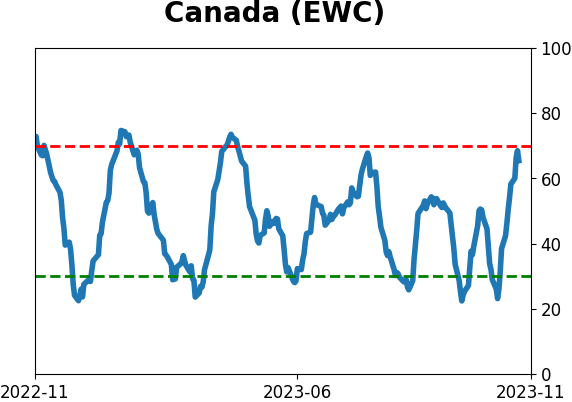
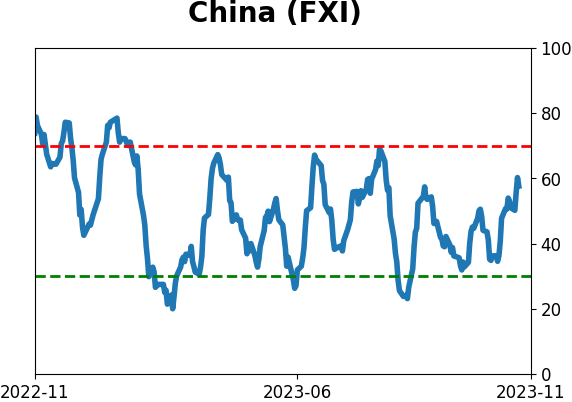
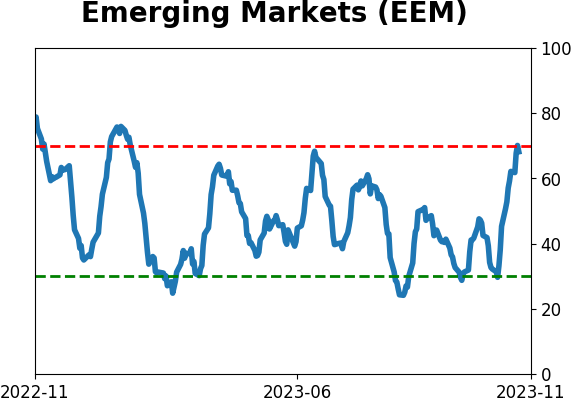
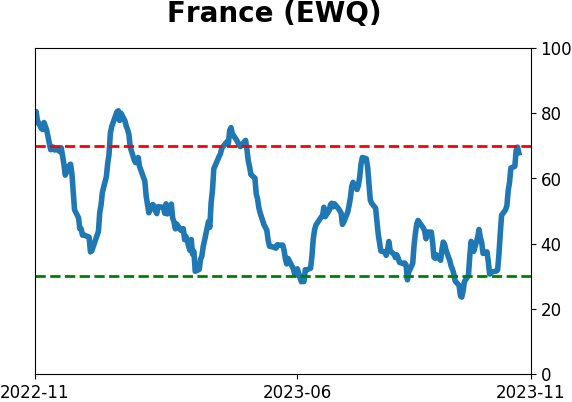
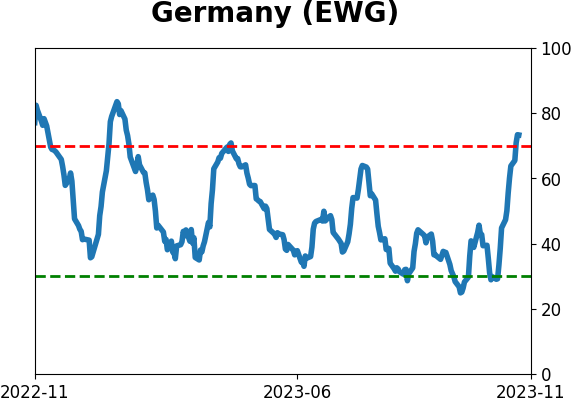
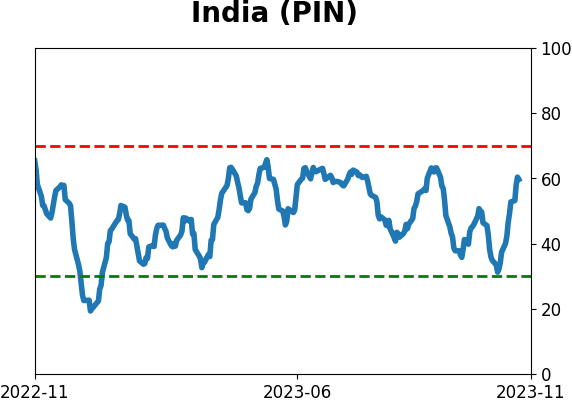
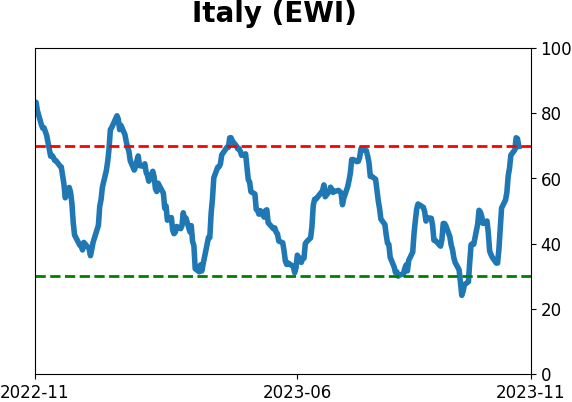
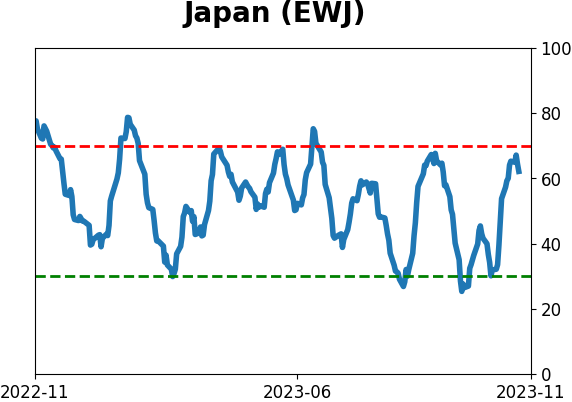
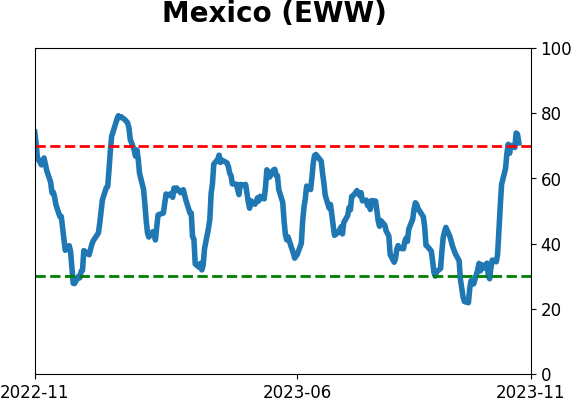
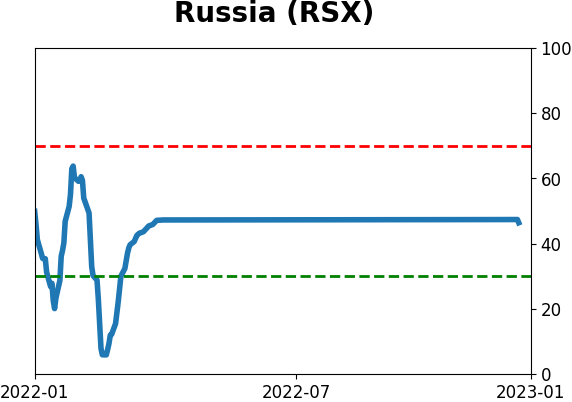
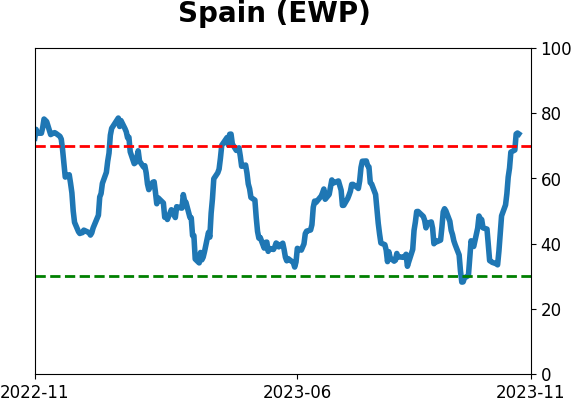
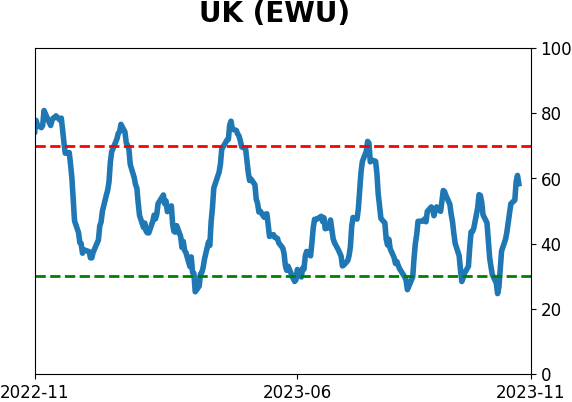
Country ETF's - 10-Day Moving Average
|
|
|
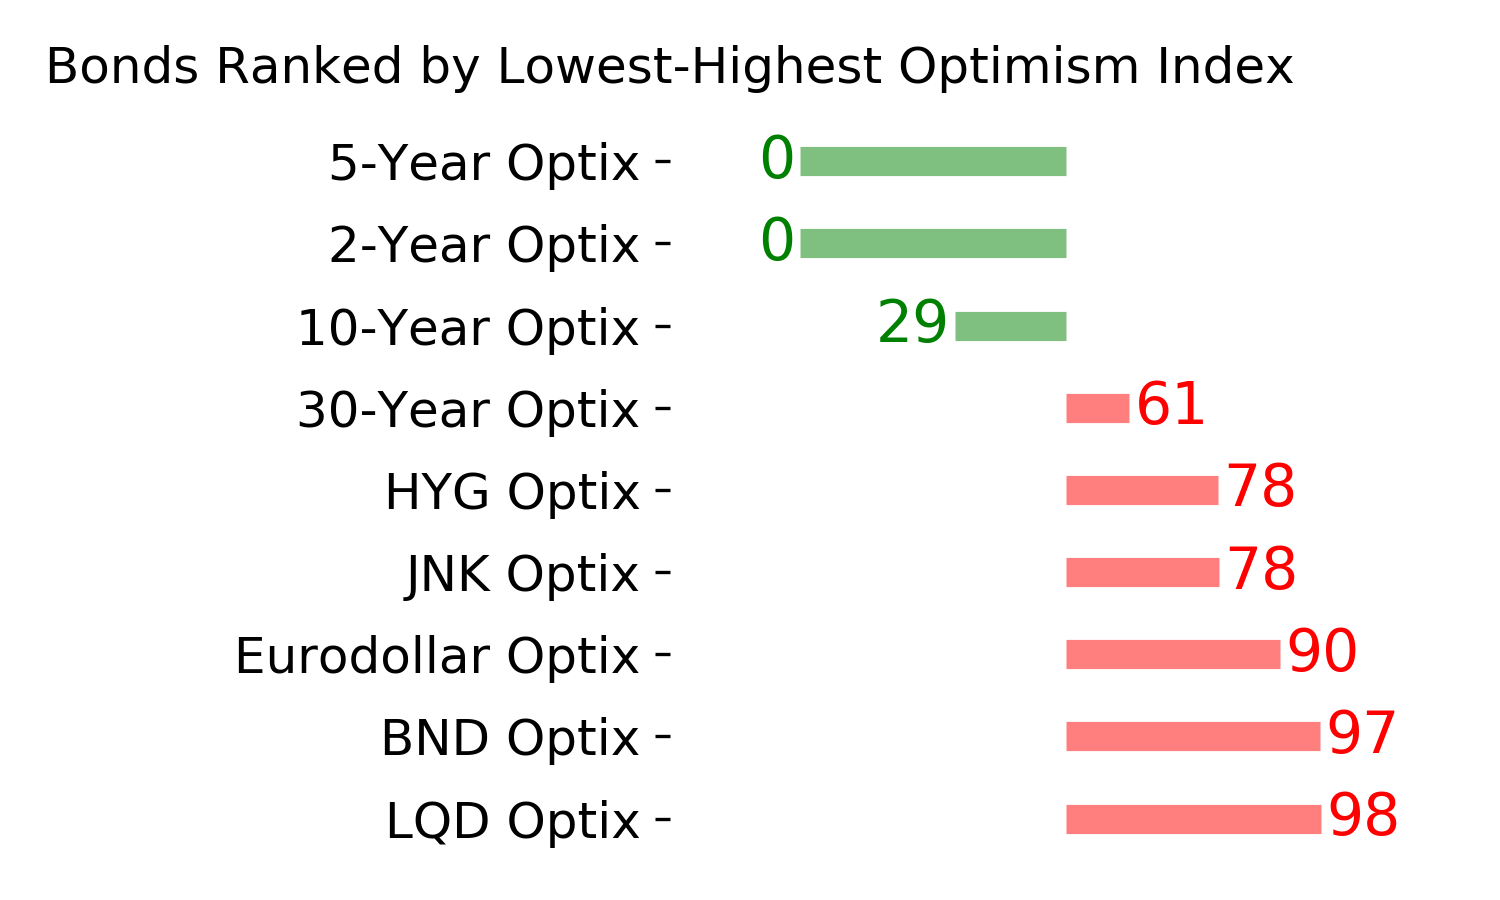
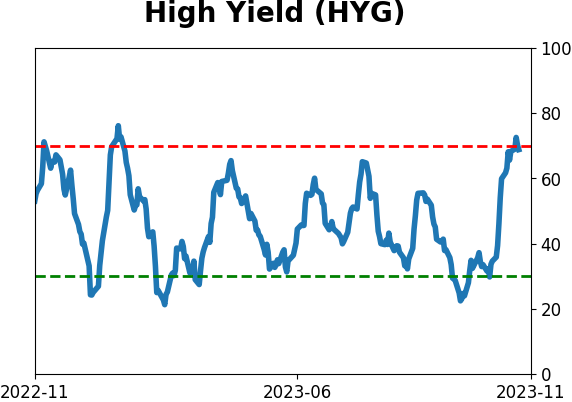
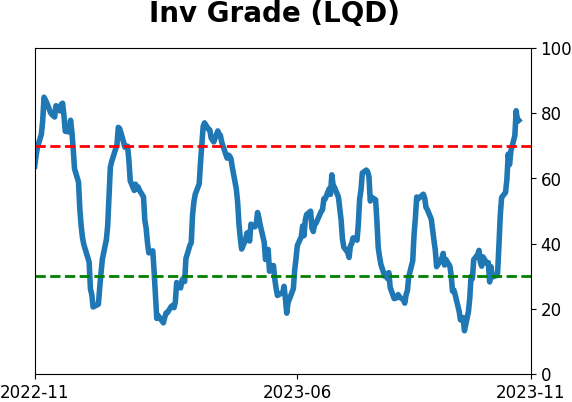
Bond ETF's - 10-Day Moving Average
|
|
|
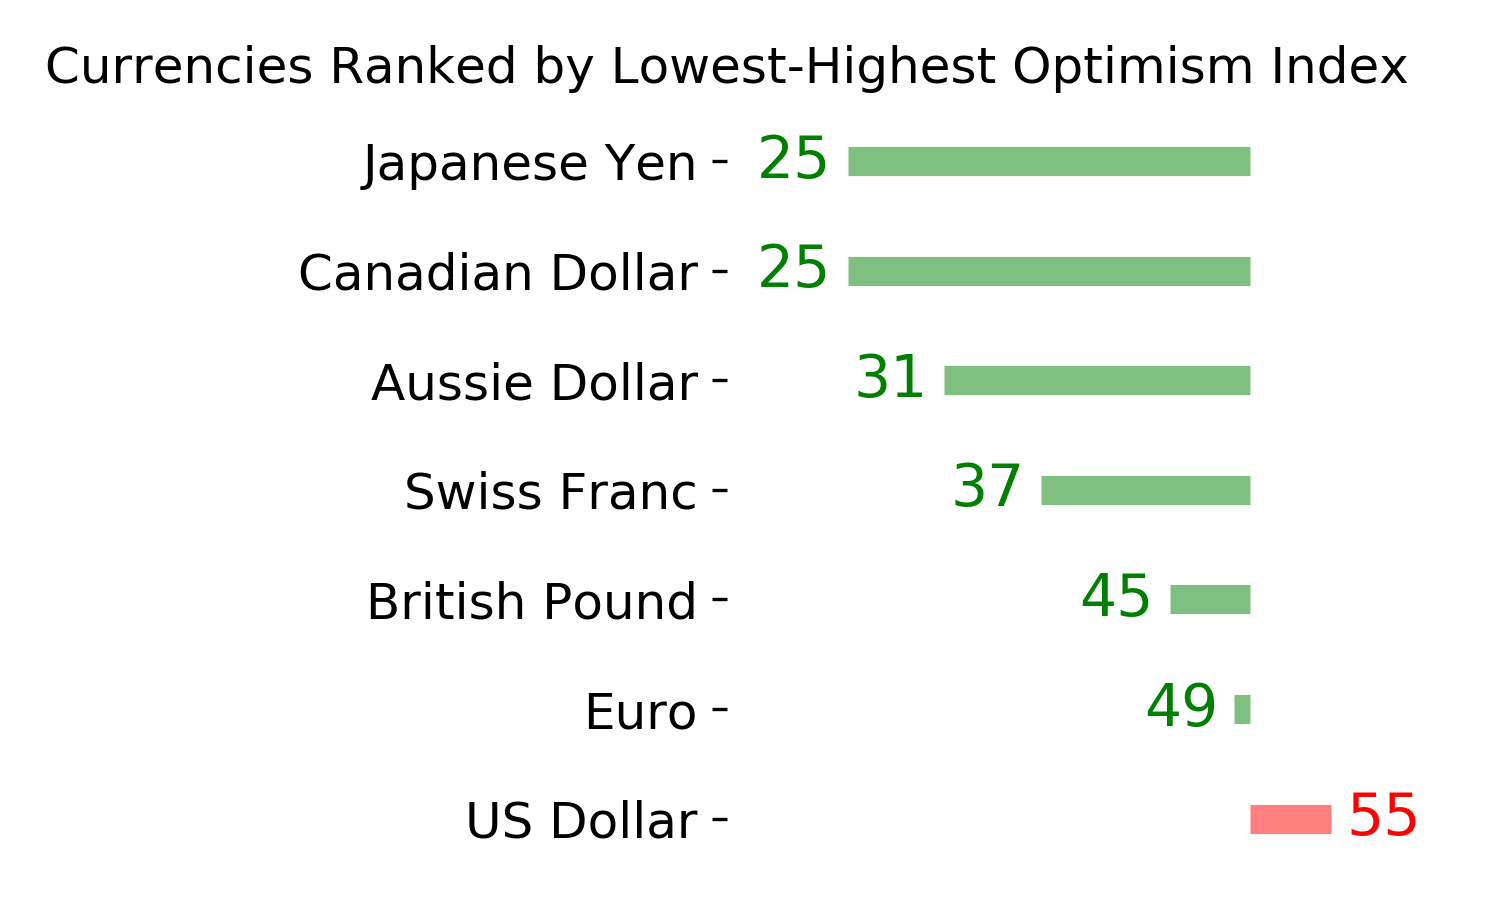
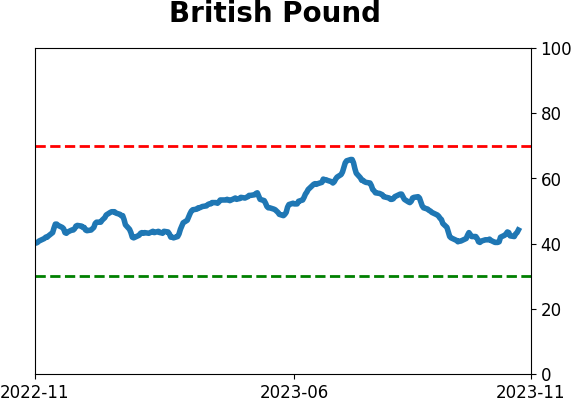
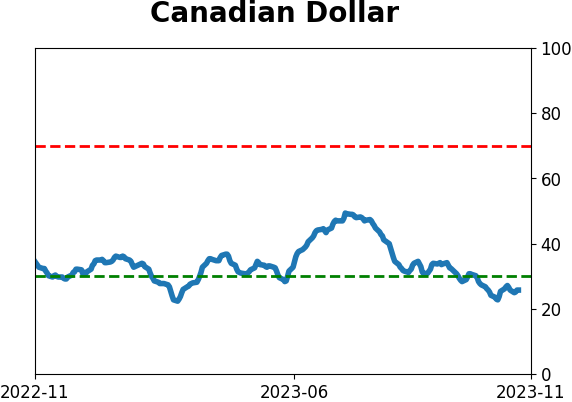
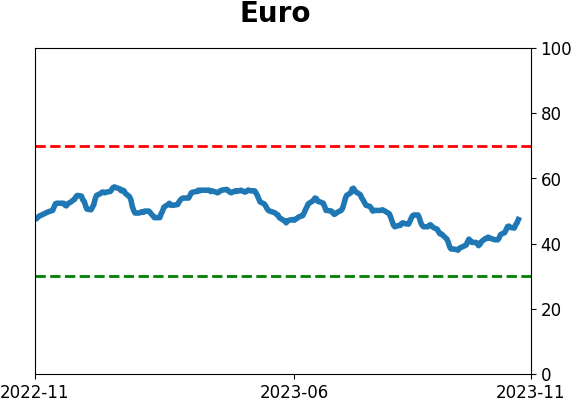
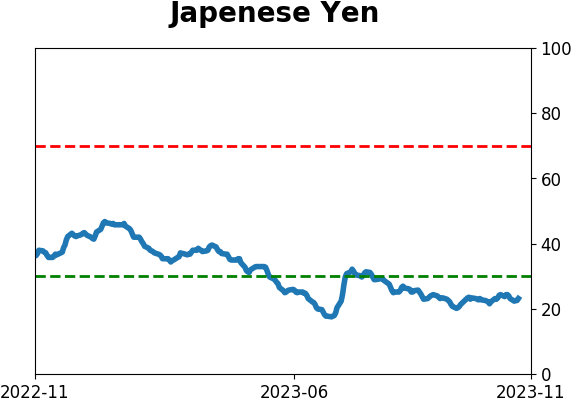
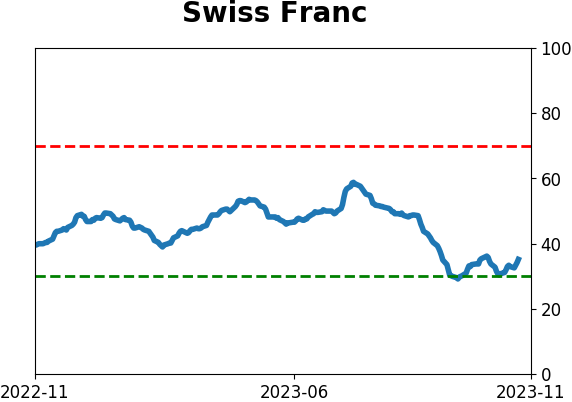
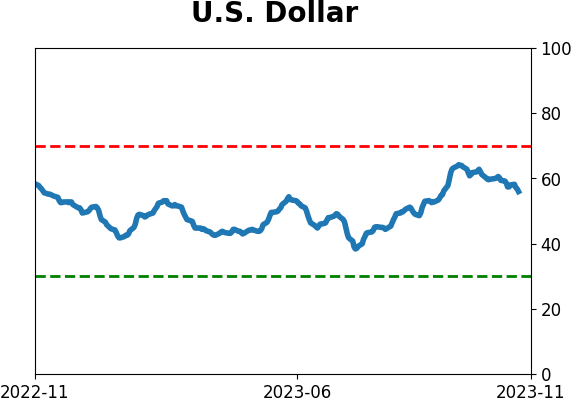
Currency ETF's - 5-Day Moving Average
|
|
|
Commodity ETF's - 5-Day Moving Average
|
|