Headlines
|
|
The probability of a new bear market is rising, but...:
Some fundamental inputs in the Bear Market Probability Model have improved for the first time in months. That comes as fewer stocks, industries, sectors, and global equity indexes fall more than 20% off their 52-week highs.
Bitcoin bulls have never been greedier: The Crypto Fear & Greed Index has surged along with bitcoin, and the 5-day average of the indicator has just hit a record high. It just passed the prior record 5-day Greed reading from June 27, 2019, after which most cryptocurrencies suffered losses in the months ahead. The Backtest Engine shows that there have been 64 days when Crypto Fear & Greed had a daily reading above 70. Over the next 2 months, bitcoin enjoyed a positive return after only 17 of them, a 27% win rate, with a median return of -6.2%.
Bottom Line:
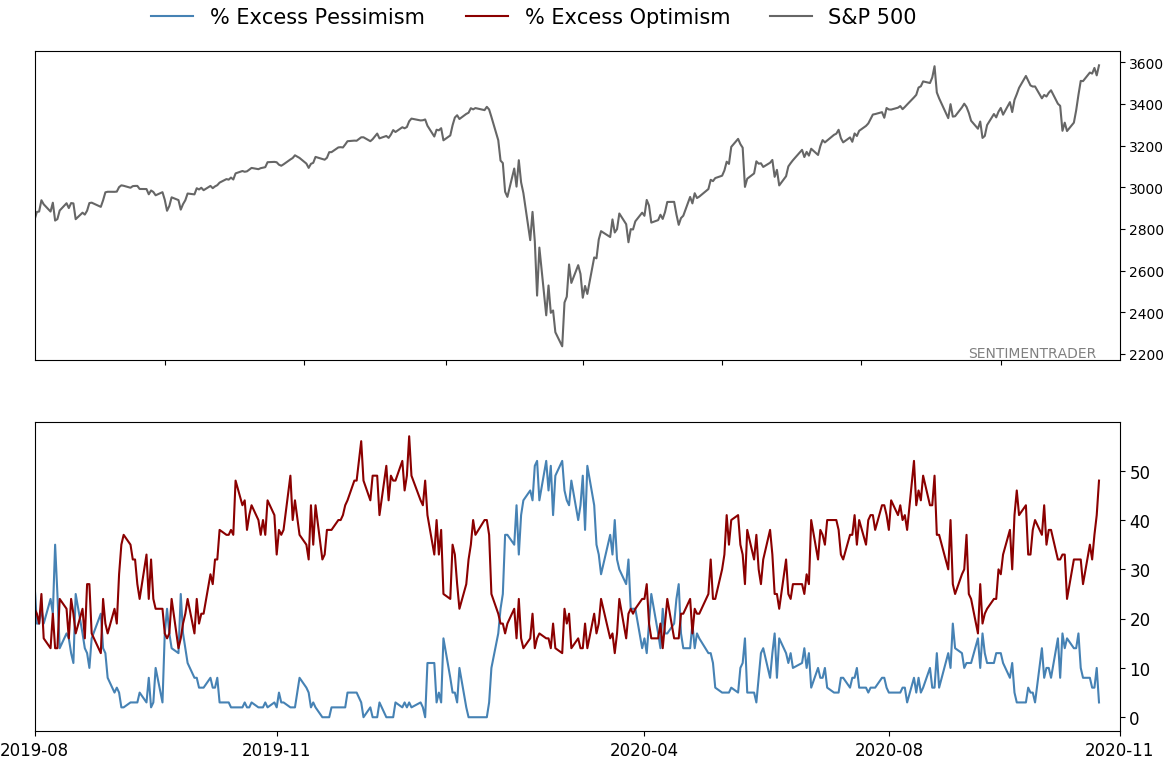
- A positive environment favors becoming aggressive on signs of excessive pessimism, of which there are few yet.
|
Smart / Dumb Money Confidence
|
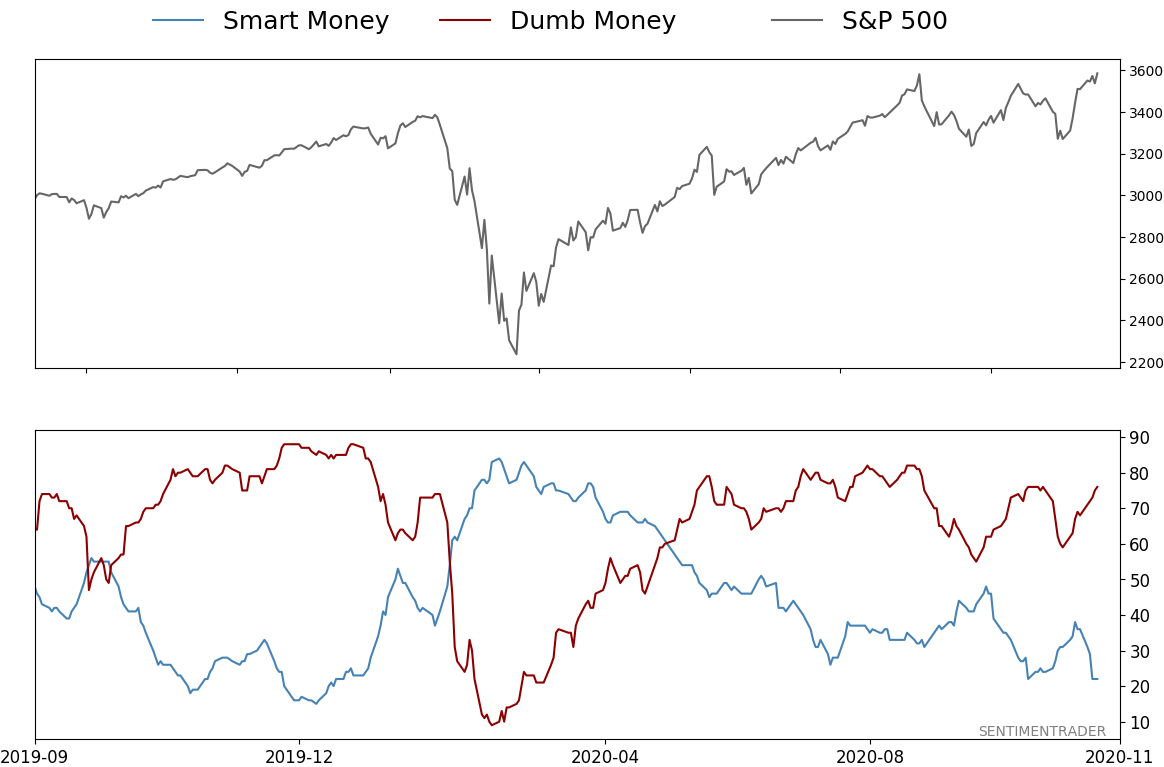
Smart Money Confidence: 22%
Dumb Money Confidence: 76%
|
|
Risk Levels
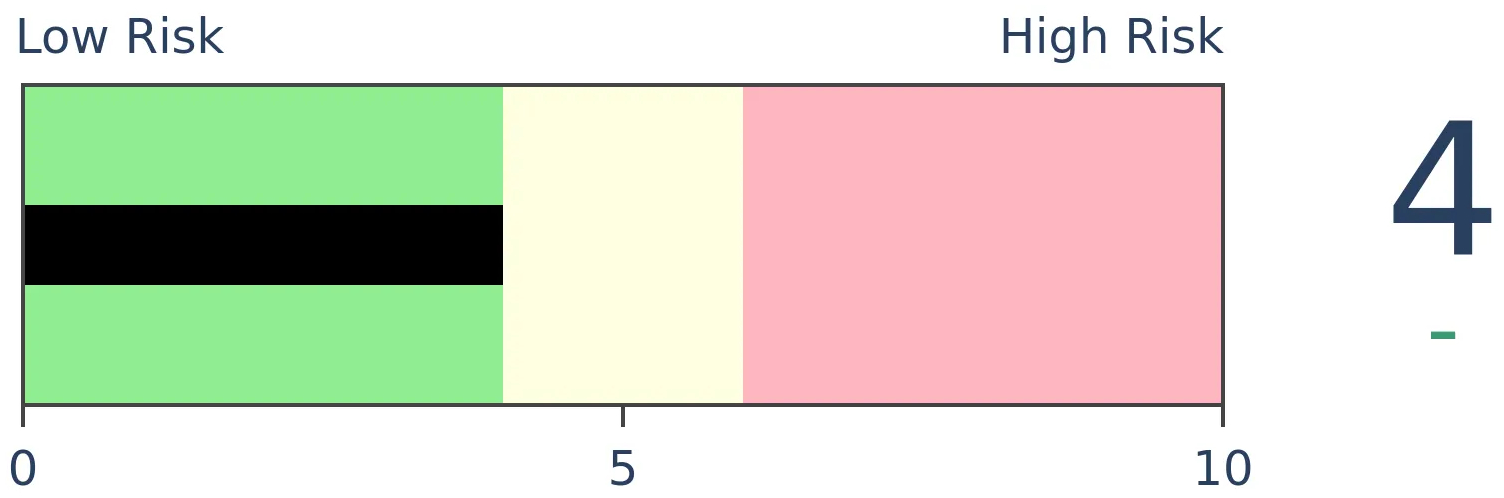
Stocks Short-Term
|
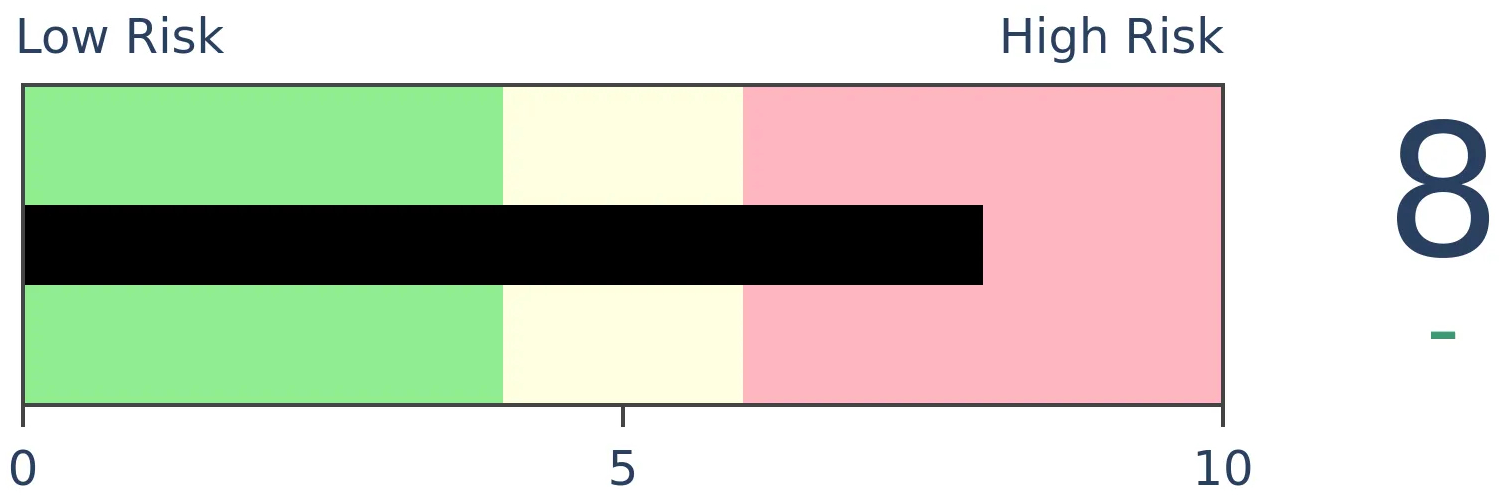
Stocks Medium-Term
|
|
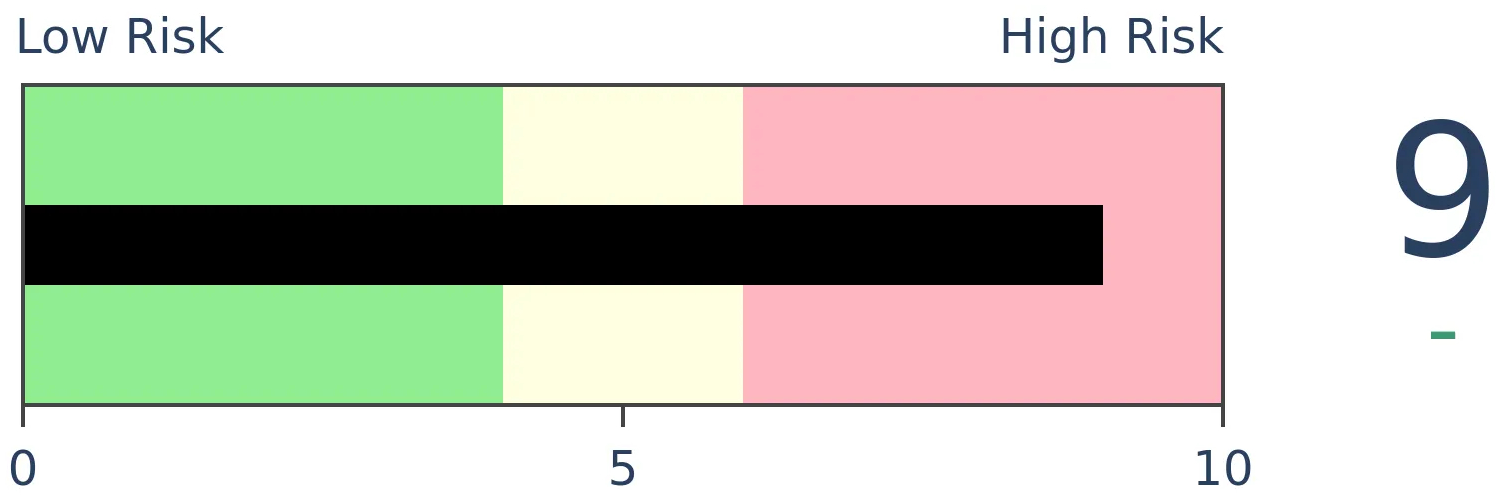
Bonds
|
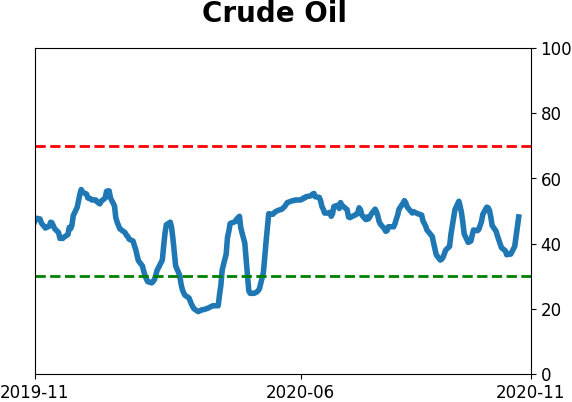
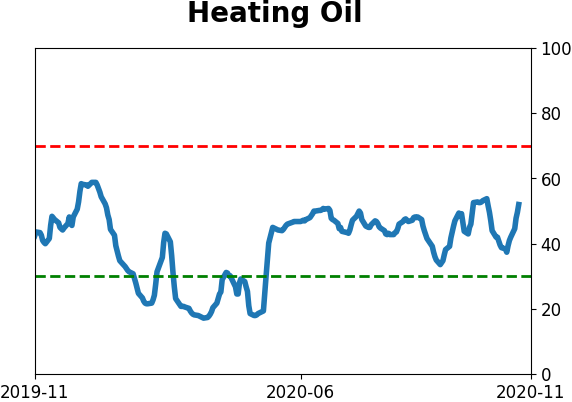
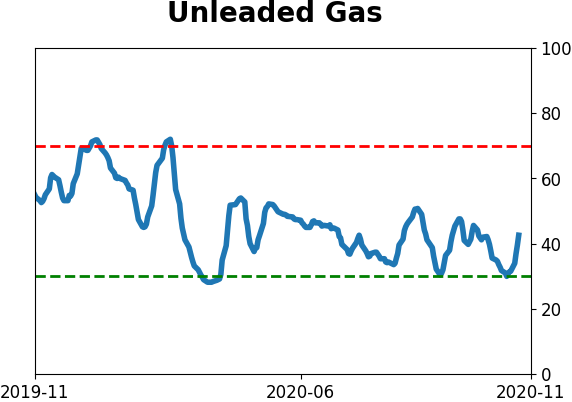
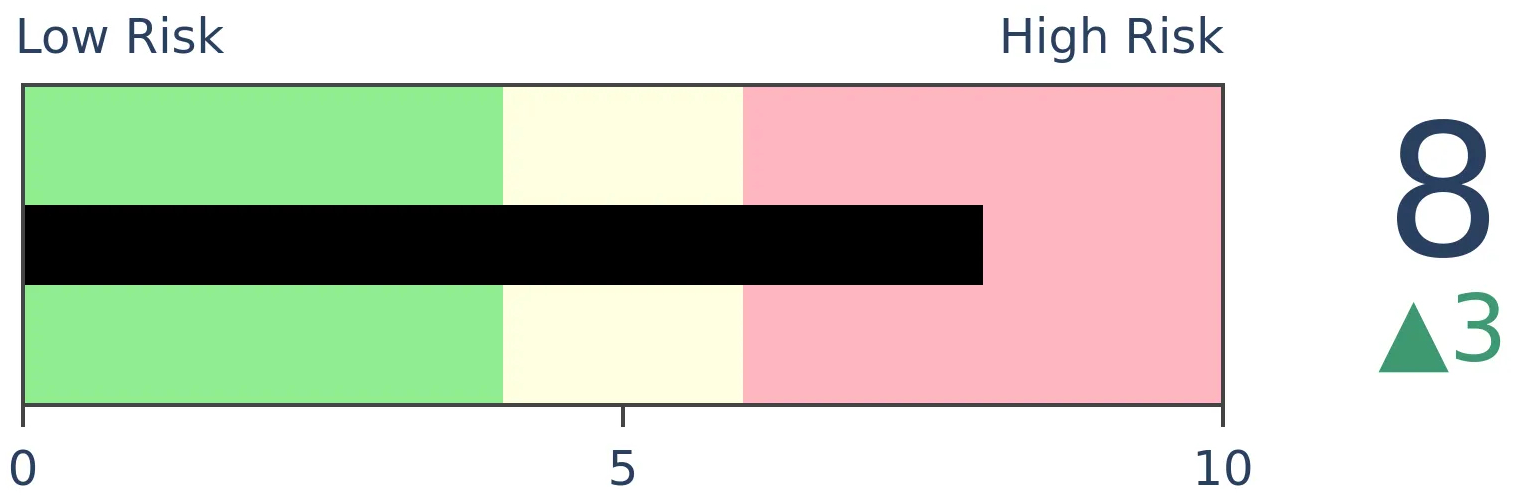
Crude Oil
|
|
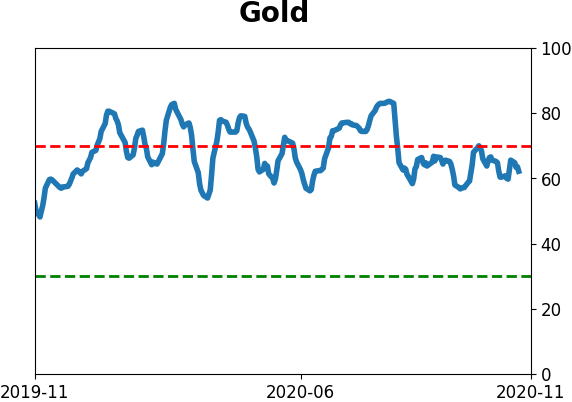
Gold

|
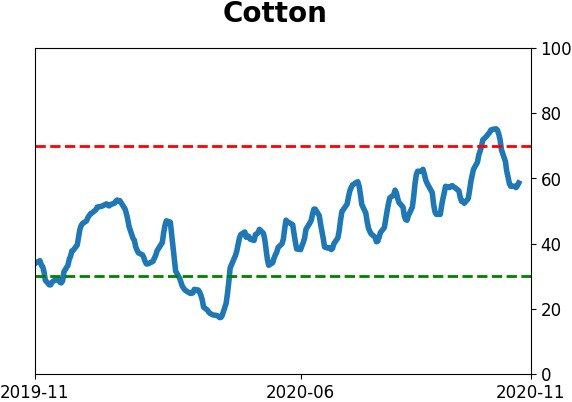
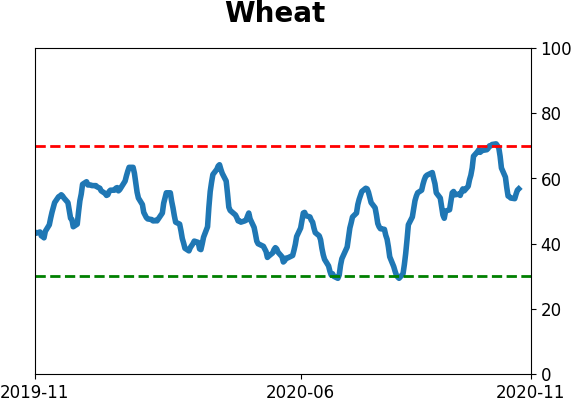
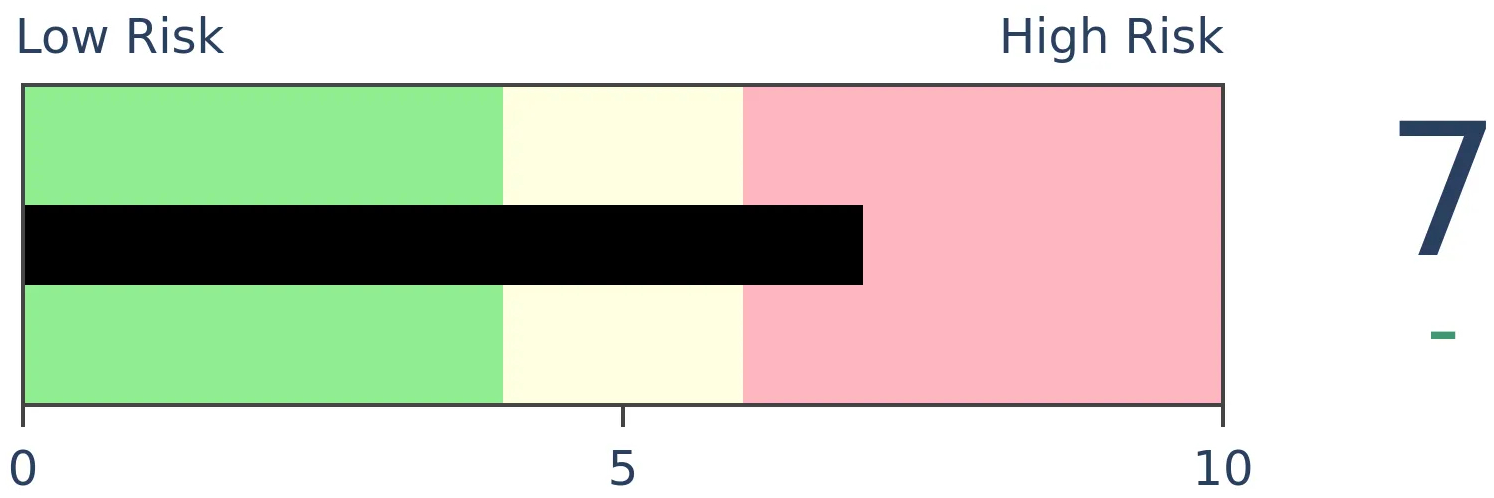
Agriculture
|
|
Research
BOTTOM LINE
Some fundamental inputs in the Bear Market Probability Model have improved for the first time in months. That comes as fewer stocks, industries, sectors, and global equity indexes fall more than 20% off their 52-week highs.
FORECAST / TIMEFRAME
ACWI -- Up, Long-Term
|
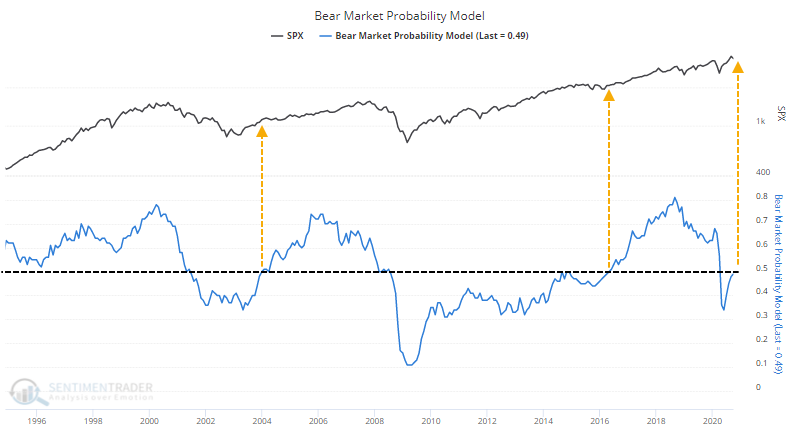
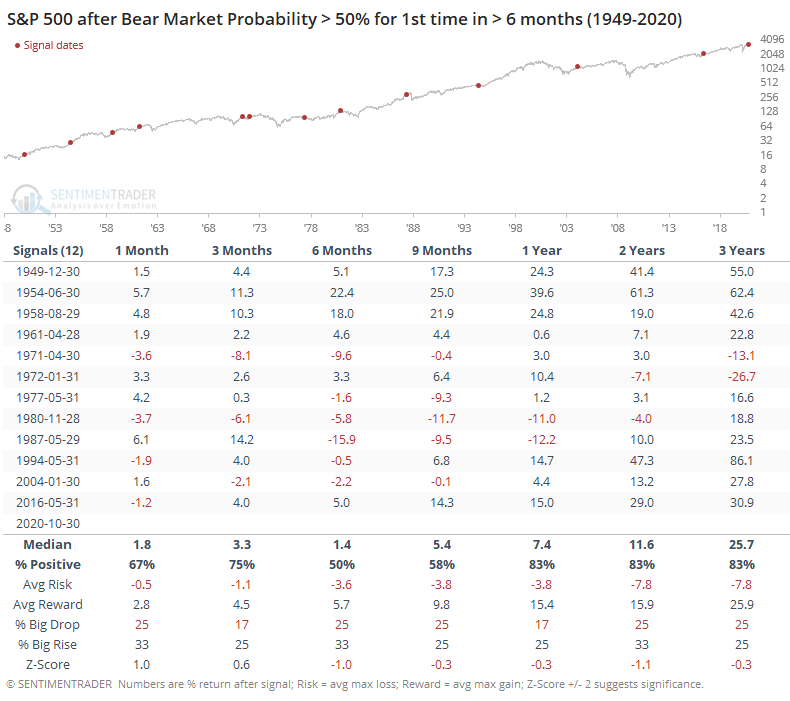
For the first time in half a year, there is more than a 50% probability that stocks will fall into a bear market in the coming months.
The Bear Market Probability Model climbed to a 50-year high in August 2018, then plunged to a 7-year low by May of this year. This is a model outlined by Goldman Sachs using five inputs covering fundamental, valuation, and price-based metrics:
- U.S. Unemployment rate
- ISM Manufacturing Index
- Yield Curve
- Inflation Rate
- P/E Ratio
Each month's reading is ranked versus all other historical readings and assigned a score. The higher the score, the higher the probability of a bear market in the months ahead. As outlined in a report from September 5, 2018, when the model was between 20% - 29%, the S&P's average one-year return was +21%. But when the model was 80% - 89%, that average return plunged to -2%. So the higher the model, the greater the chance for a bear market, or at least negative forward returns.
The model will drop as conditions deteriorate until it reaches a trough during bear markets (usually). It will rise as conditions improve. This seems counter-intuitive, but a rising probability of a bear market tends to be a good thing, until it reaches a very high level.
When the model had been below 50% for at least 6 months and then recovered, forward returns were mostly positive. Over the next 1-3 years, 10 of the 12 signals sported a positive return, though the average returns weren't very impressive.
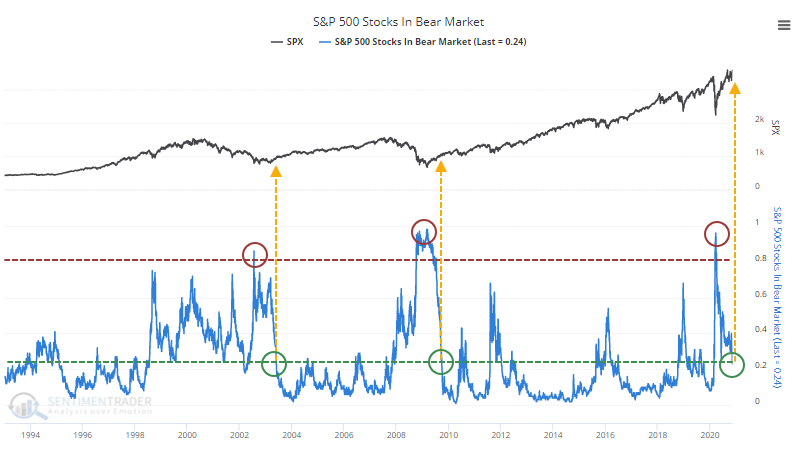
Because the Bear Market Probability tends to rise as markets recover, it typically goes inverse to the percentage of stocks themselves that are currently in bear markets. The more stocks that are already in a bear market, the lower the probability that more of them will fall into one going forward. It's kind of a mind-twister.
We certainly see that now with fewer and fewer stocks in the S&P 500 that are more than 20% off their highs. In March, more than 95% of stocks were in bear markets; now that is dropping close to 20% of stocks. The only other times that happened marked the end of the last two protracted bear markets.
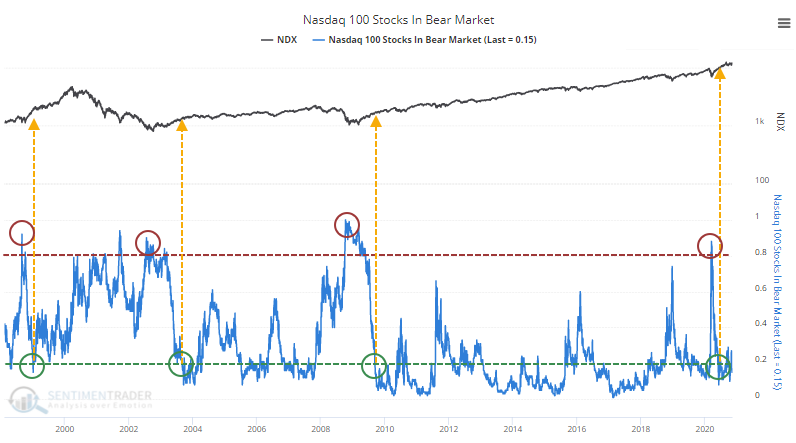
Same goes for the Nasdaq 100, with the added signal in 1998-99.
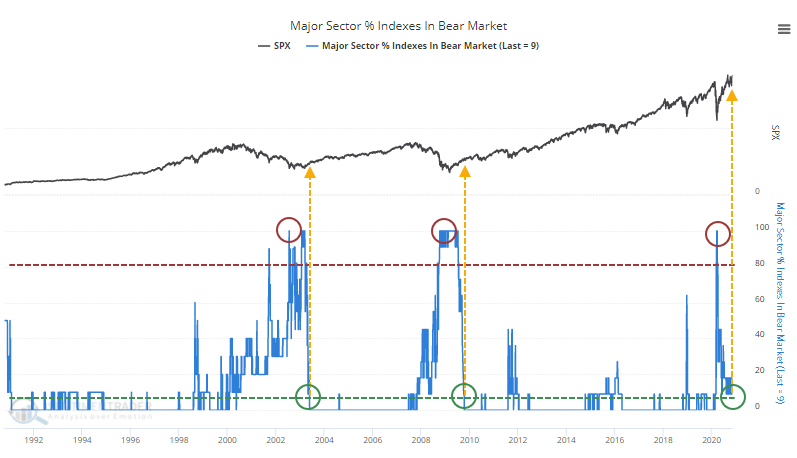
Not surprisingly, the percentage of sectors in bear markets followed the same pattern as the broader market.
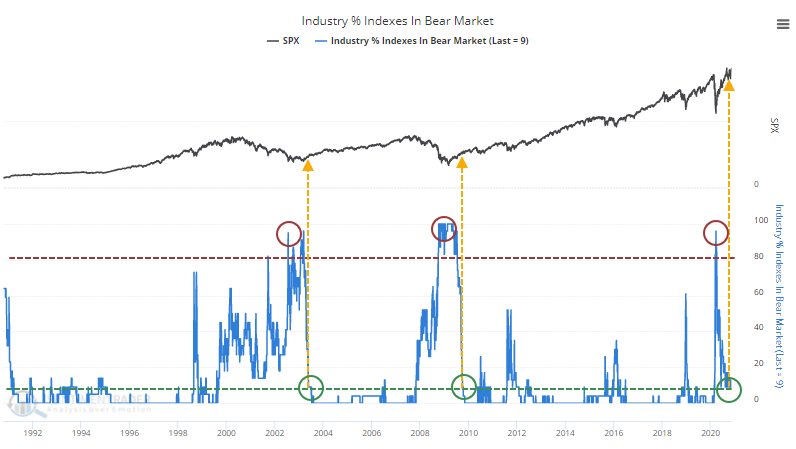
As well as the more granular industry data.
Perhaps more importantly, this has been a worldwide recovery, with a massive shift in major global indexes from being in bear markets to not.
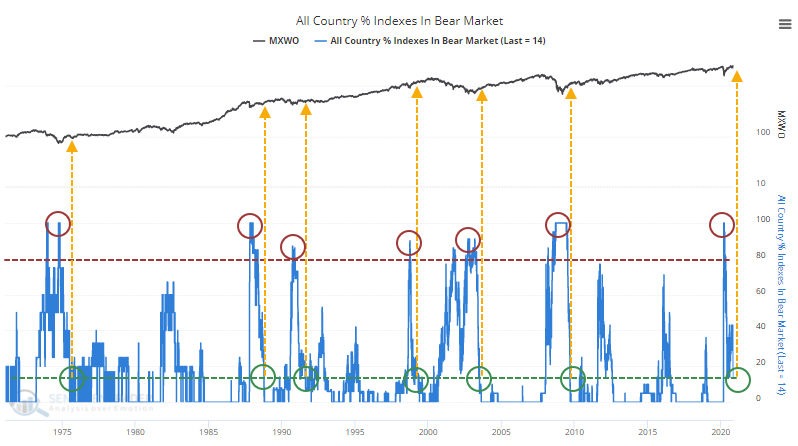
This actually triggered in June when the percentage of indexes in bear markets cycled from more than 80% of them to fewer than 15%. After rising a bit into October, it has since retreated to below 15% again.
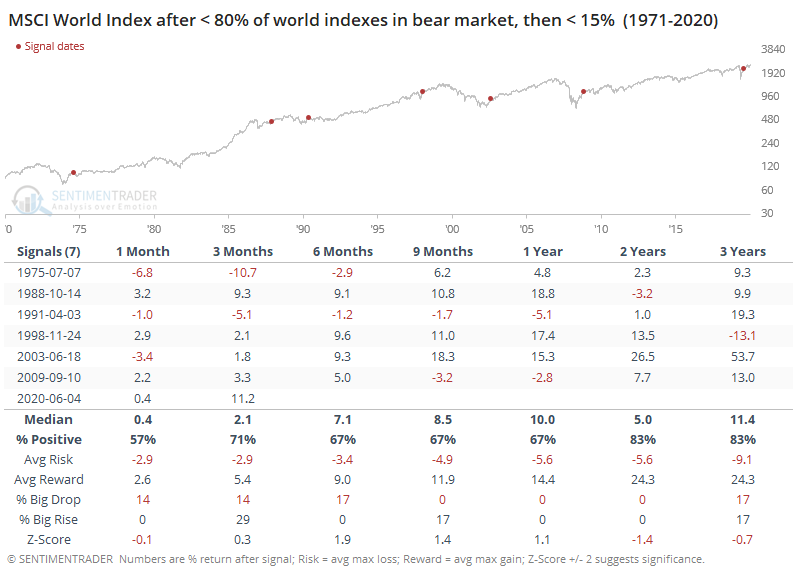
Over a longer time frame, forward returns in the MSCI World Index were fairly positive, with the most impressive part being the risk/reward ratio. There were some declines, but losses were muted relative to the recoveries that continued in the year(s) ahead.
The improvement in stocks, and some of the inputs driving them, should be a continued positive over the longer-term, given the losses they showed in March.
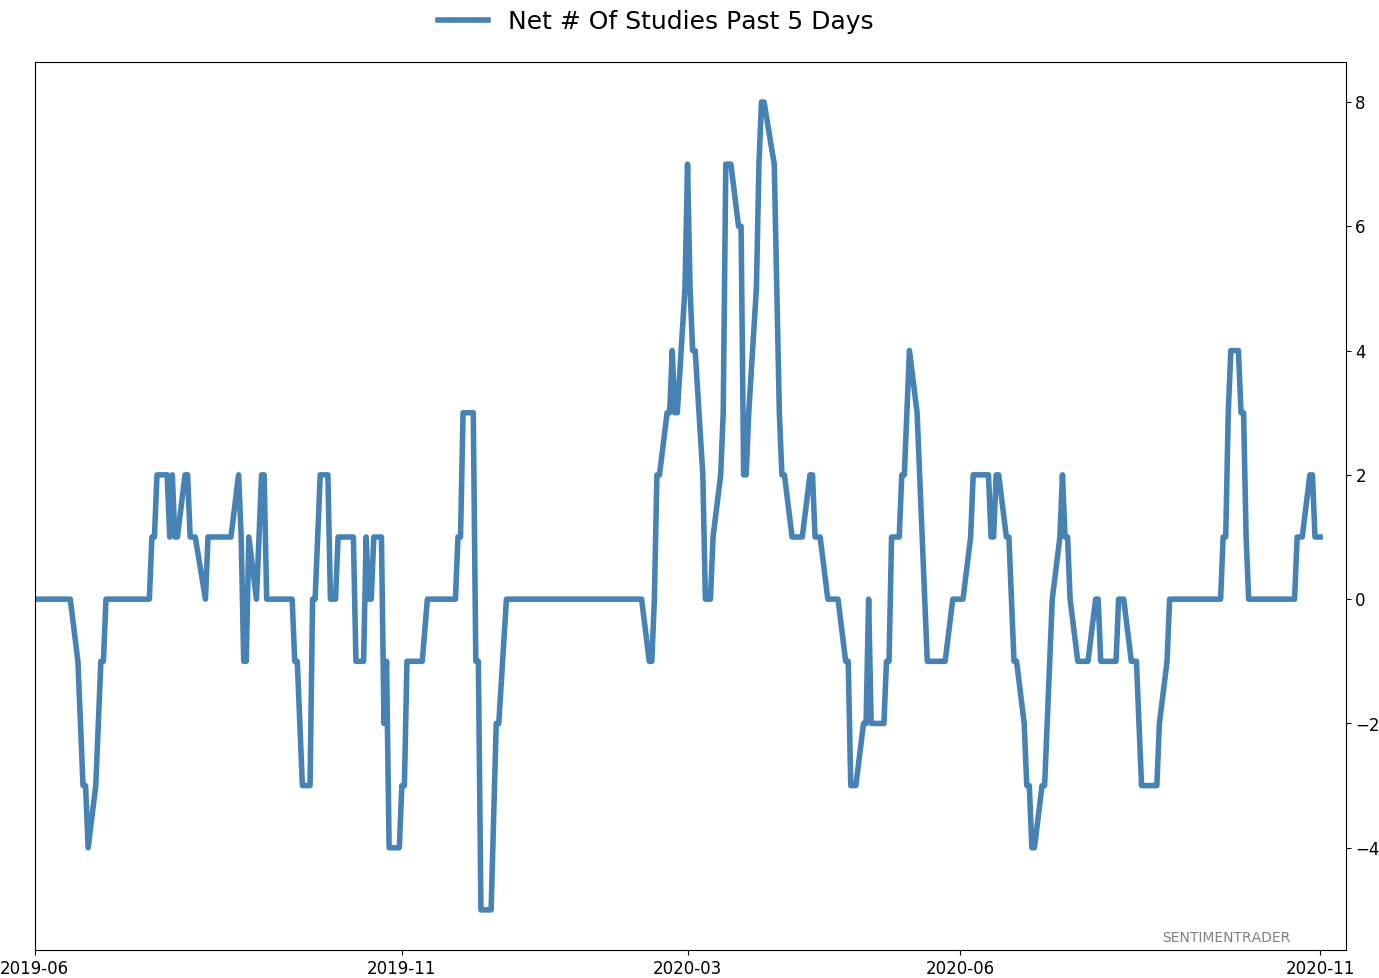
Active Studies
| Time Frame | Bullish | Bearish | | Short-Term | 0 | 0 | | Medium-Term | 5 | 8 | | Long-Term | 50 | 2 |
|
Indicators at Extremes
Portfolio
| Position | Description | Weight % | Added / Reduced | Date | | Stocks | 15.6% RSP, 10.1% VWO, 7.5% XLE, 5.1% PSCE | 38.2 | Added 5% | 2020-10-15 | | Bonds | 10% BND, 10% SCHP, 10% ANGL | 29.7 | Reduced 0.1% | 2020-10-02 | | Commodities | GCC | 2.4 | Reduced 2.1%
| 2020-09-04 | | Precious Metals | GDX | 4.7 | Added 5% | 2020-09-09 | | Special Situations | | 0.0 | Reduced 5% | 2020-10-02 | | Cash | | 25.0 | | |
|
Updates (Changes made today are underlined)
After the September swoon wrung some of the worst of the speculation out of stocks, there are some signs that it's returning, especially in the options market. It's helped to push Dumb Money Confidence above 70%. A big difference between now and August is that in August, there was a multitude of days with exceptionally odd breadth readings. Some of the biggest stocks were masking underlying weakness. Combined with heavy speculative activity, it was a dangerous setup. Now, we've seen very strong internal strength, in the broad market, as well as tech and small-cap stocks. Prior signals almost invariably led to higher prices. That's hard to square with the idea that forward returns tend to be subdued when Confidence is high, but that's less reliable during healthy market conditions, which we're seeing now (for the most part). I added some risk with small-cap energy stocks, due to an increasing number of positive signs in both small-caps and energy. This is intended as a long-term position.
RETURN YTD: 2.6% 2019: 12.6%, 2018: 0.6%, 2017: 3.8%, 2016: 17.1%, 2015: 9.2%, 2014: 14.5%, 2013: 2.2%, 2012: 10.8%, 2011: 16.5%, 2010: 15.3%, 2009: 23.9%, 2008: 16.2%, 2007: 7.8%
|
|
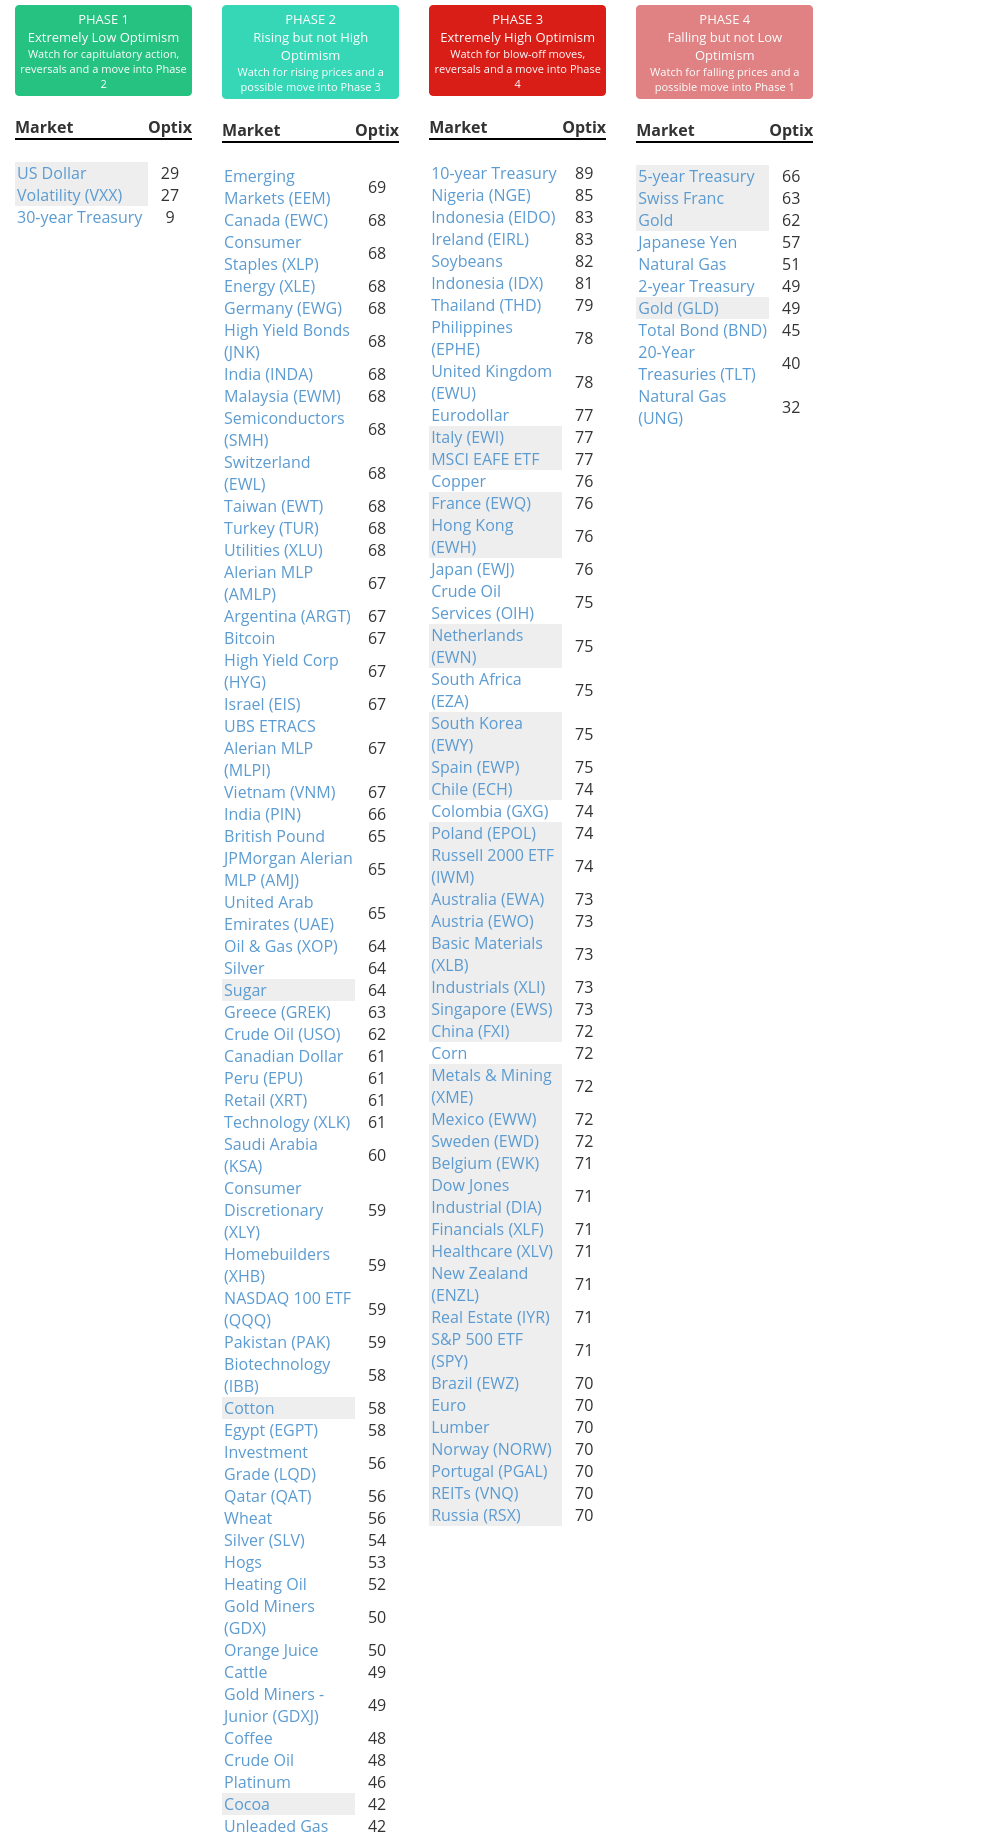
Phase Table
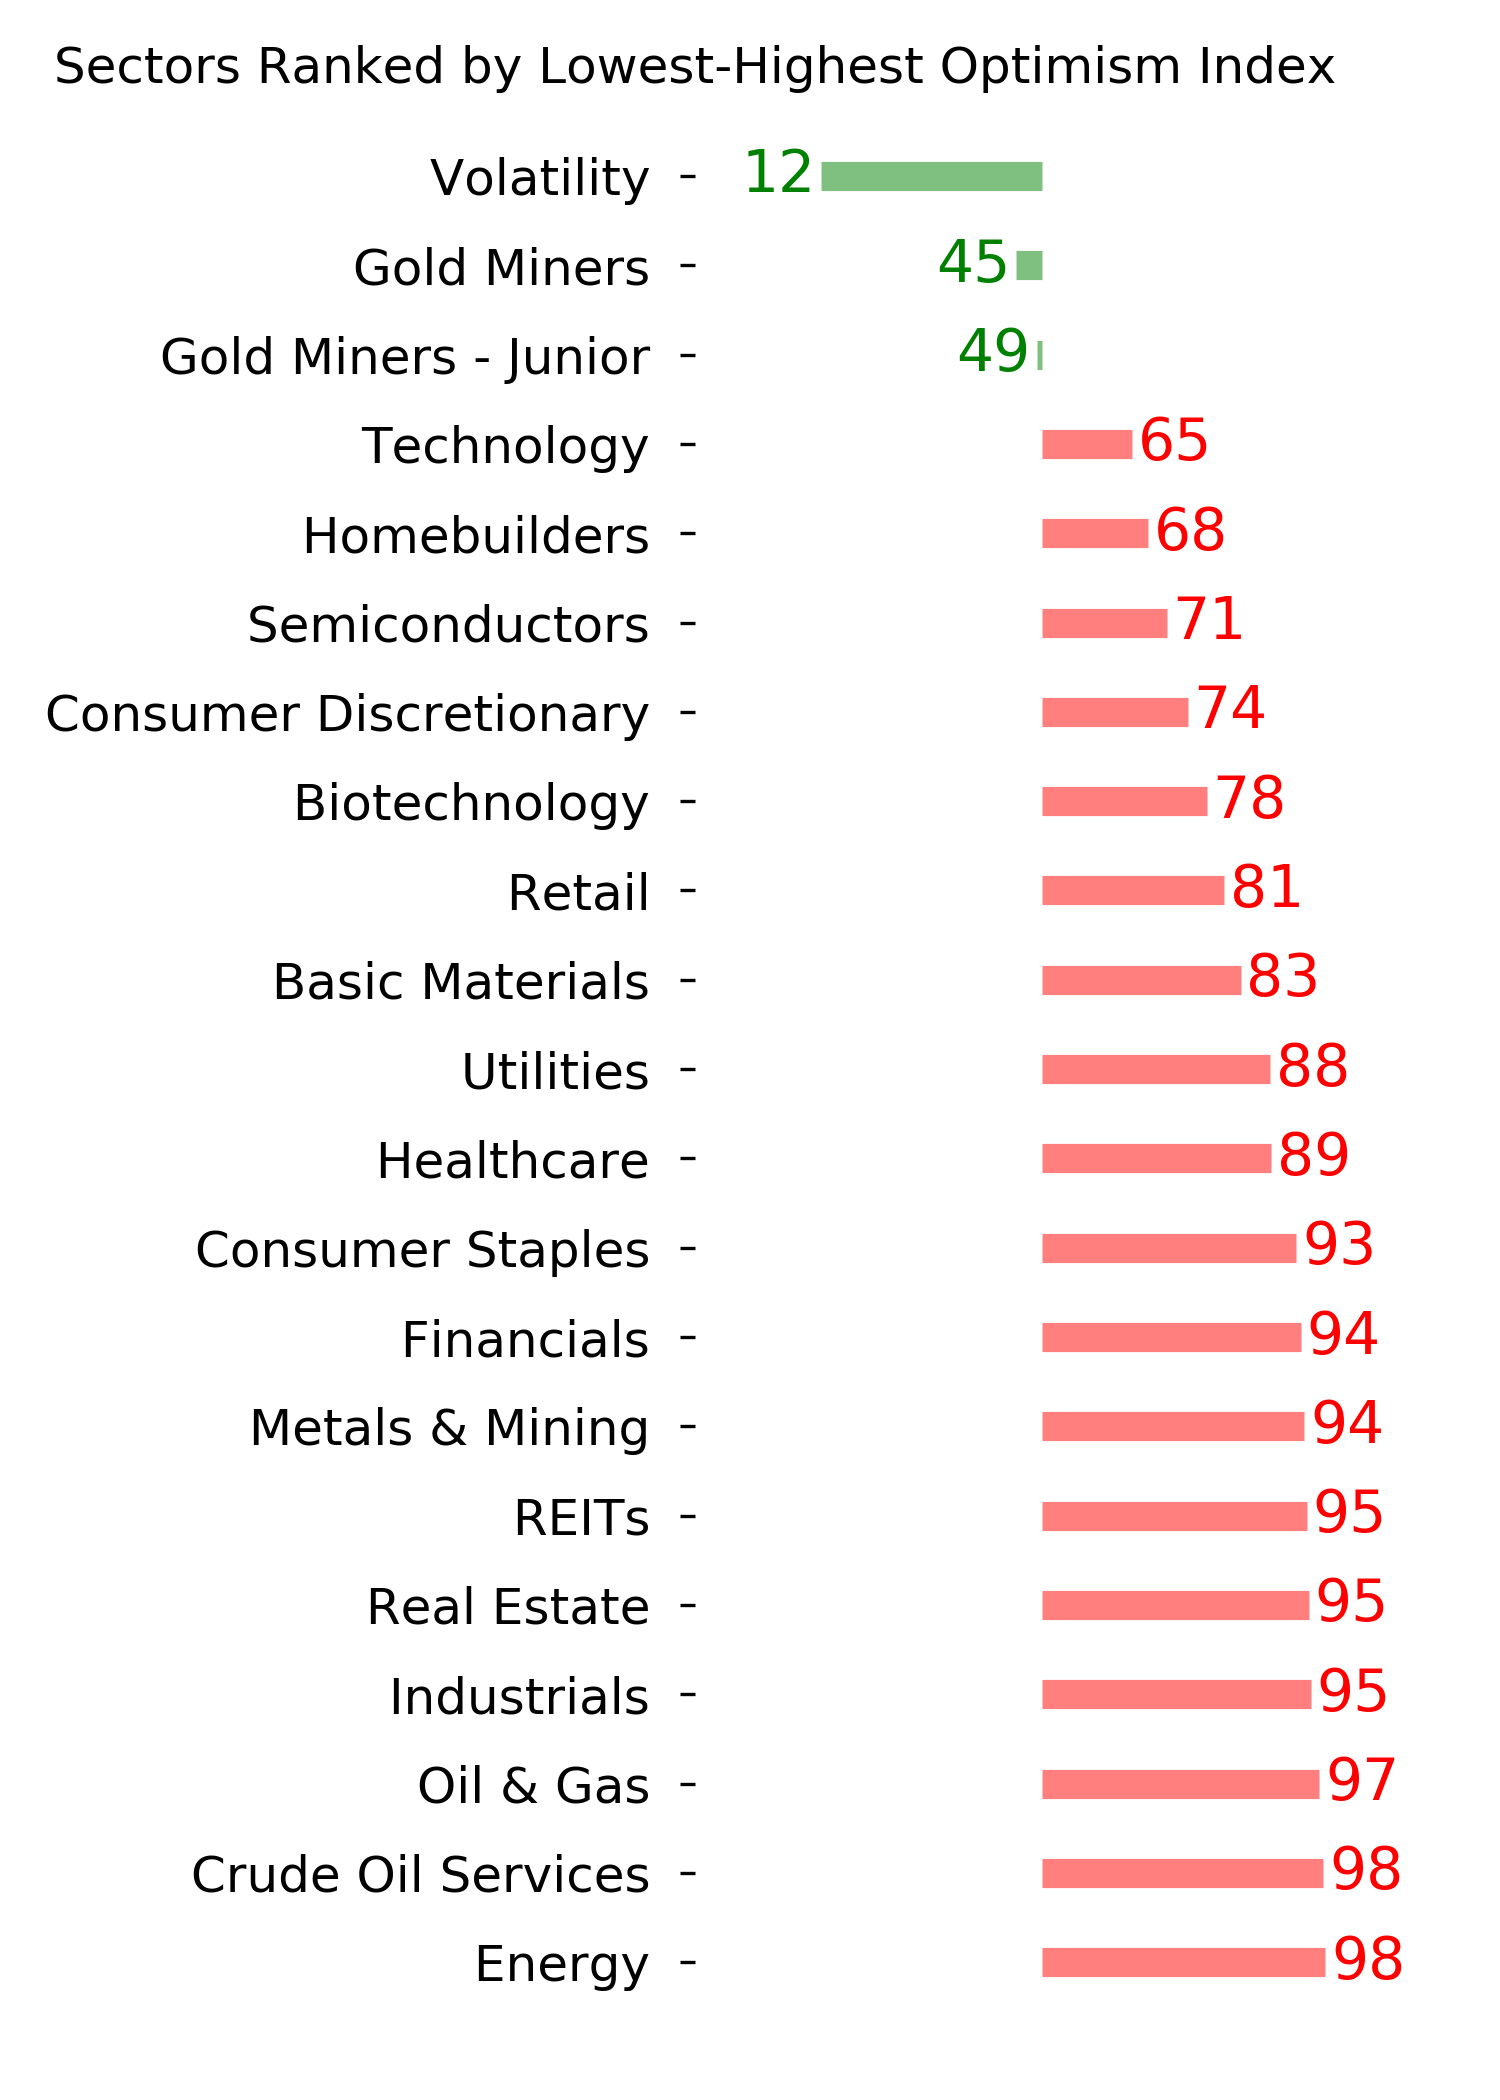
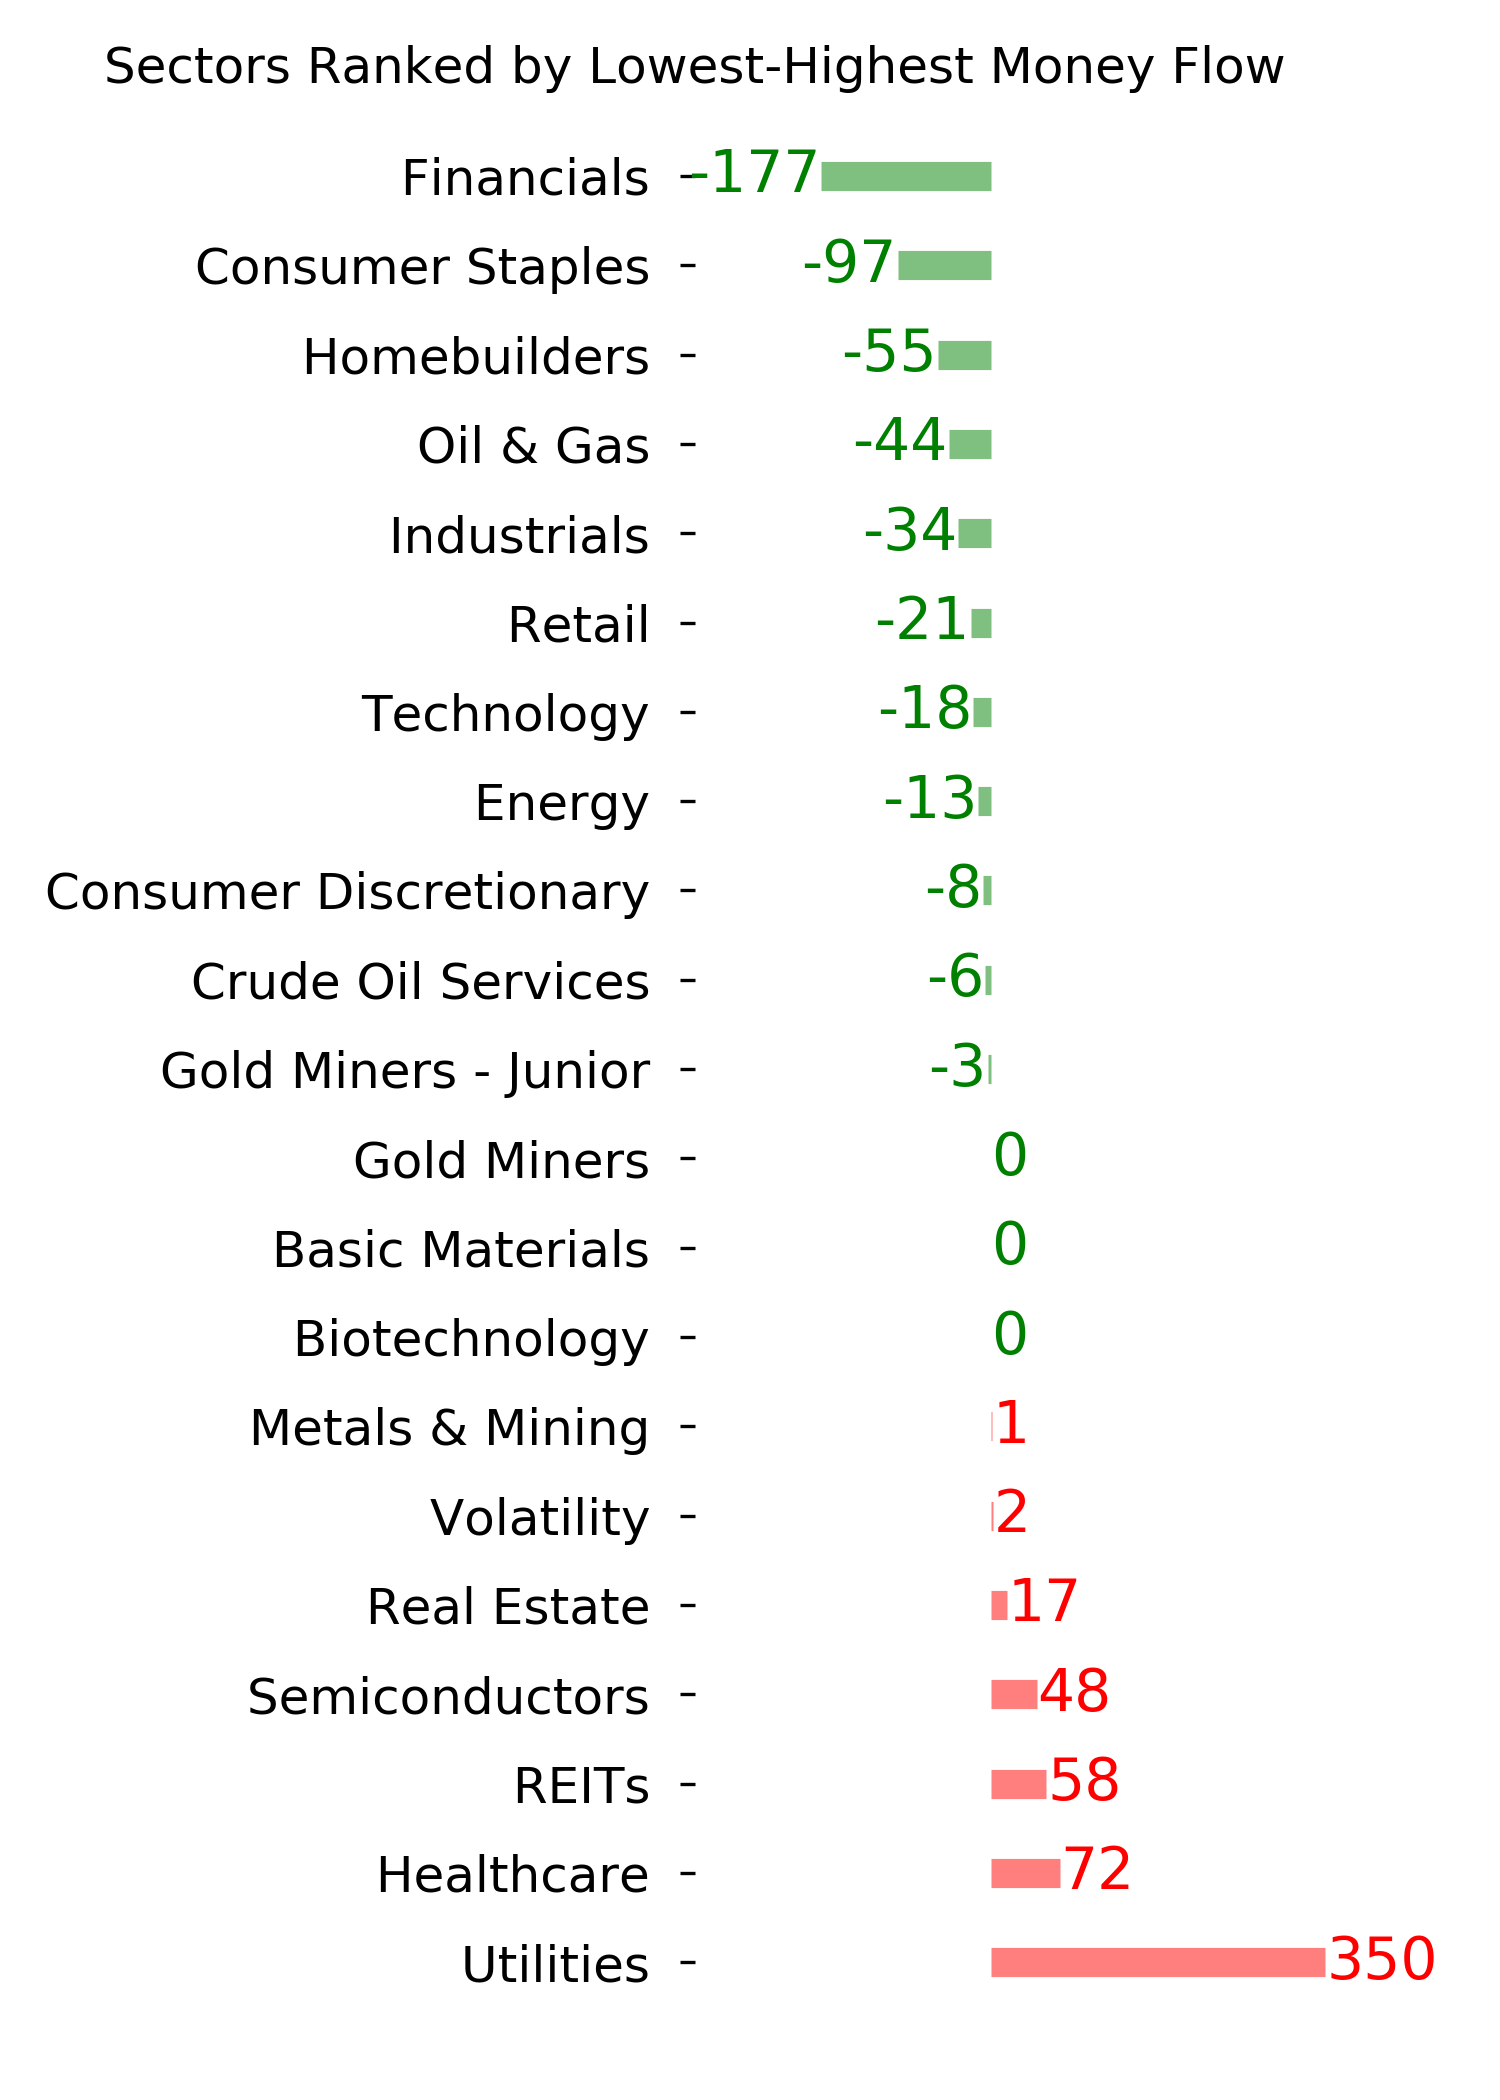
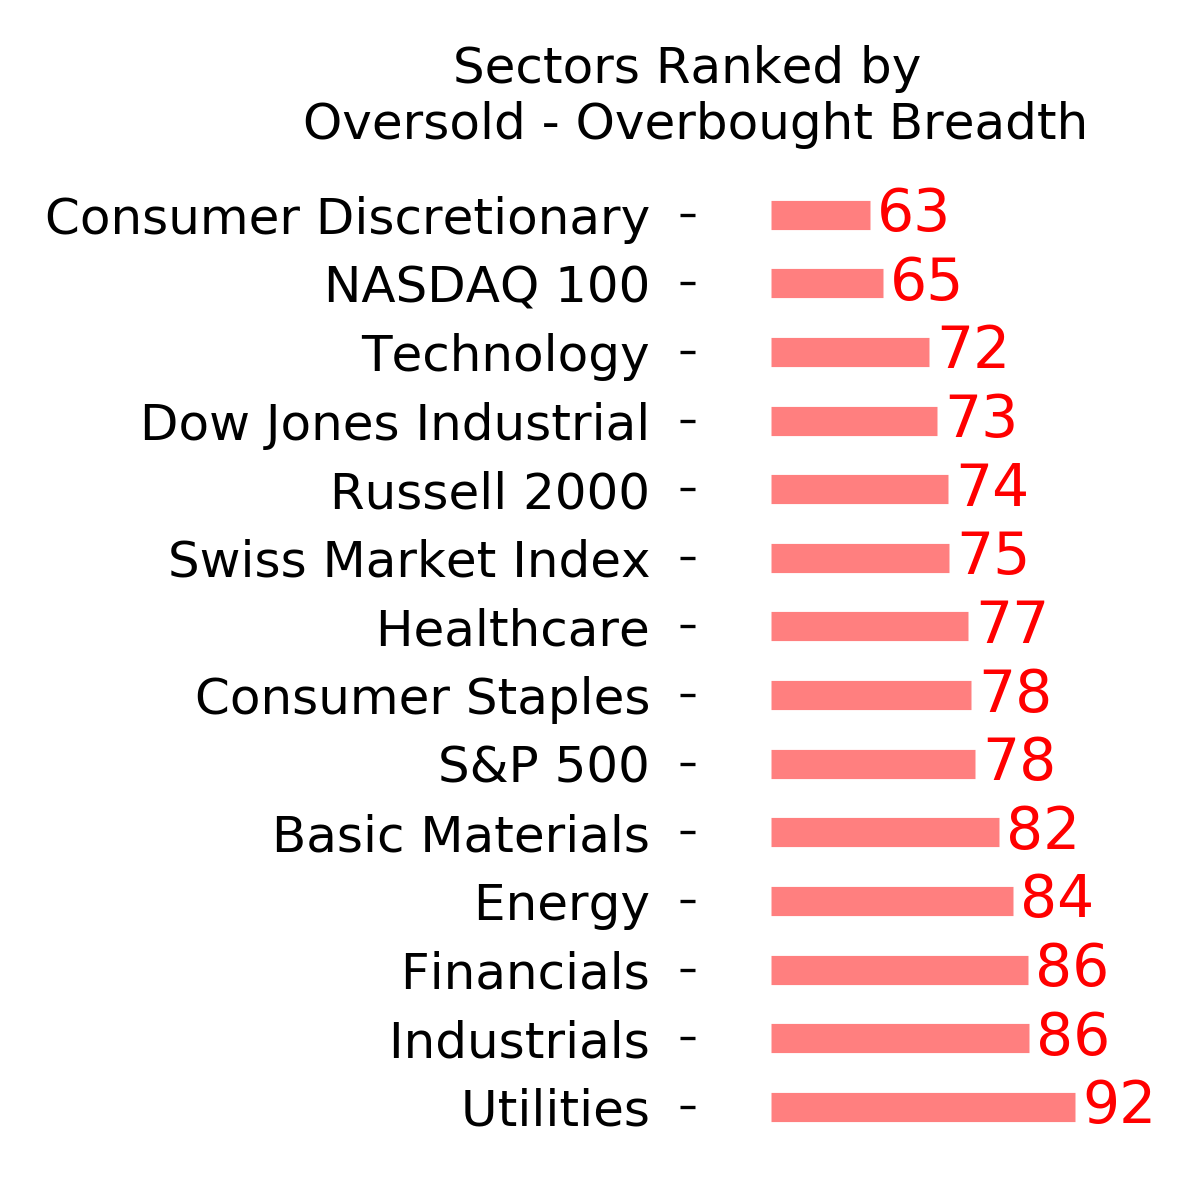
Ranks
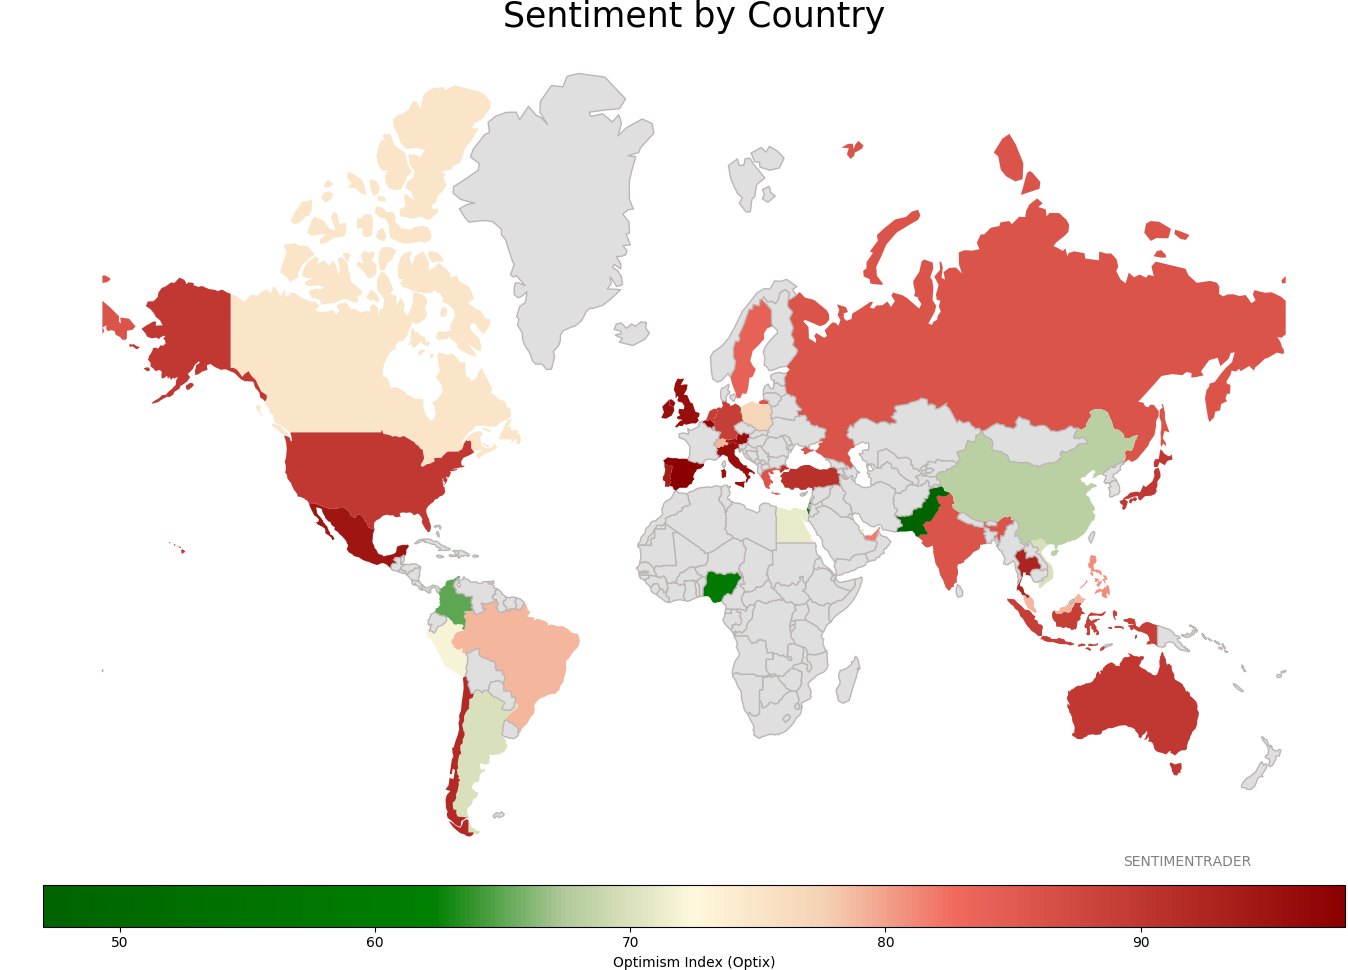
Sentiment Around The World
Optimism Index Thumbnails
|
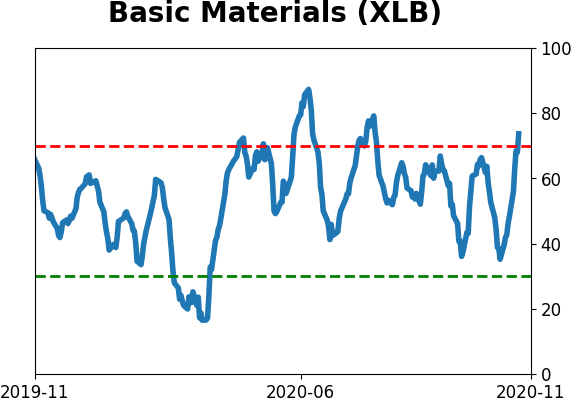
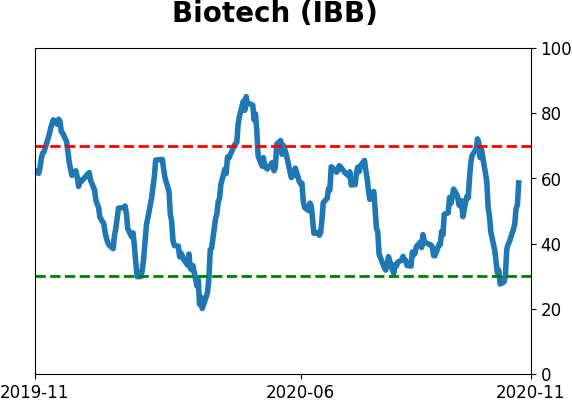
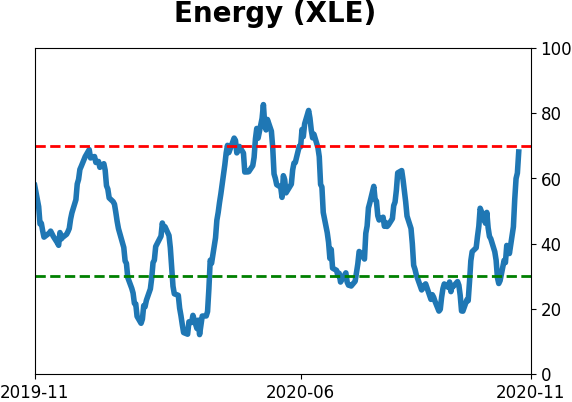
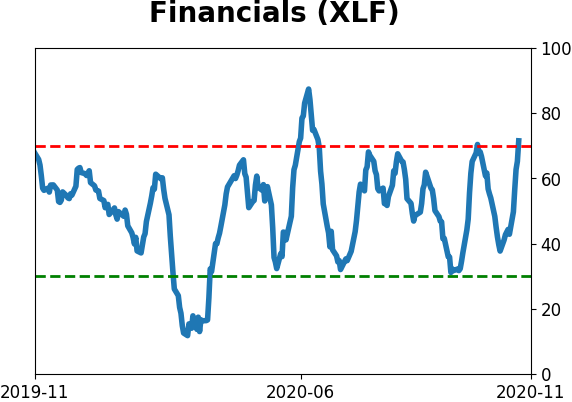
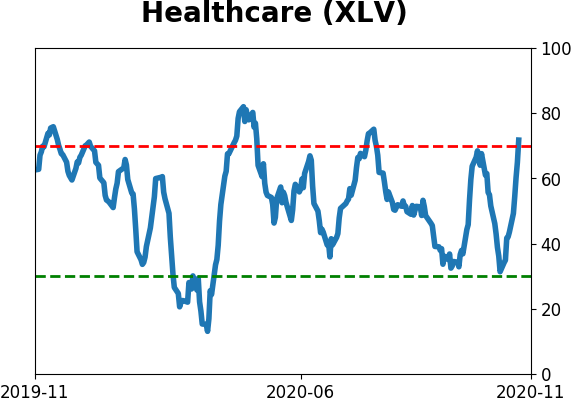
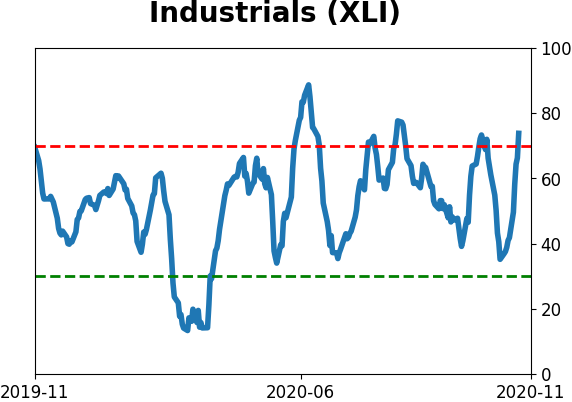
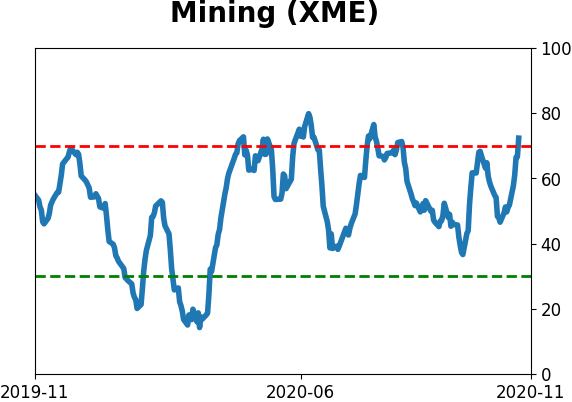
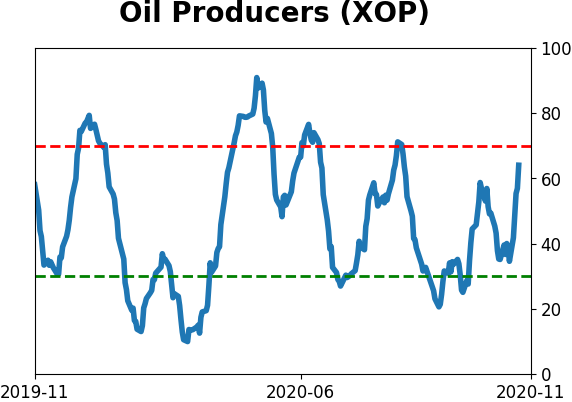
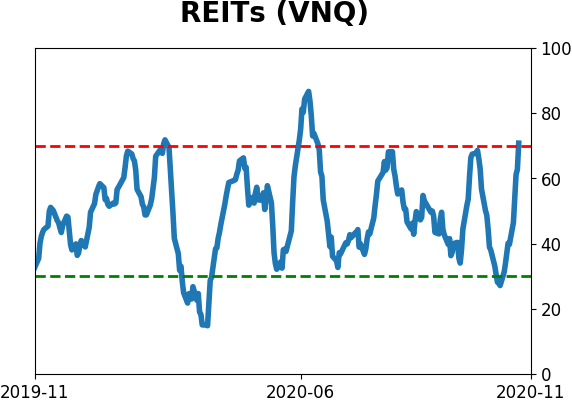
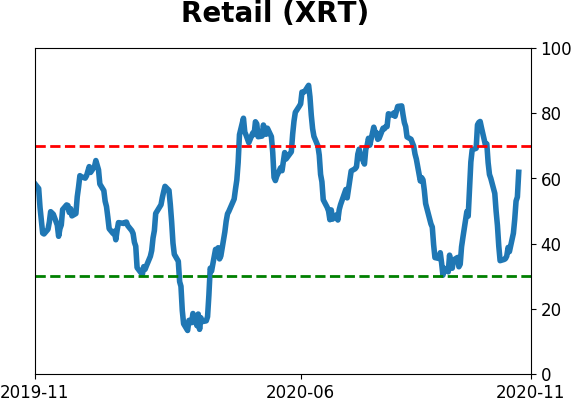
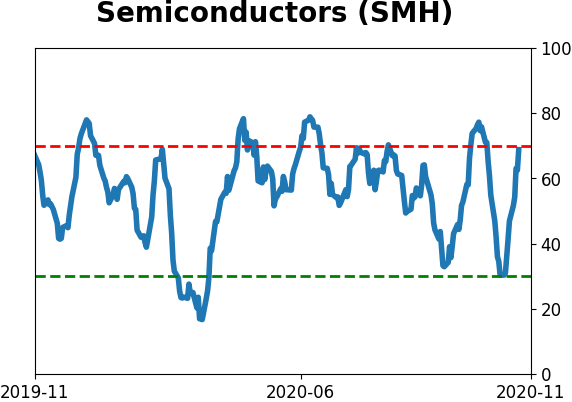
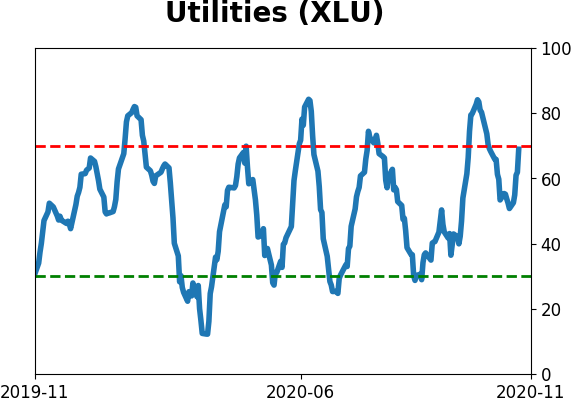
Sector ETF's - 10-Day Moving Average
|
|
|
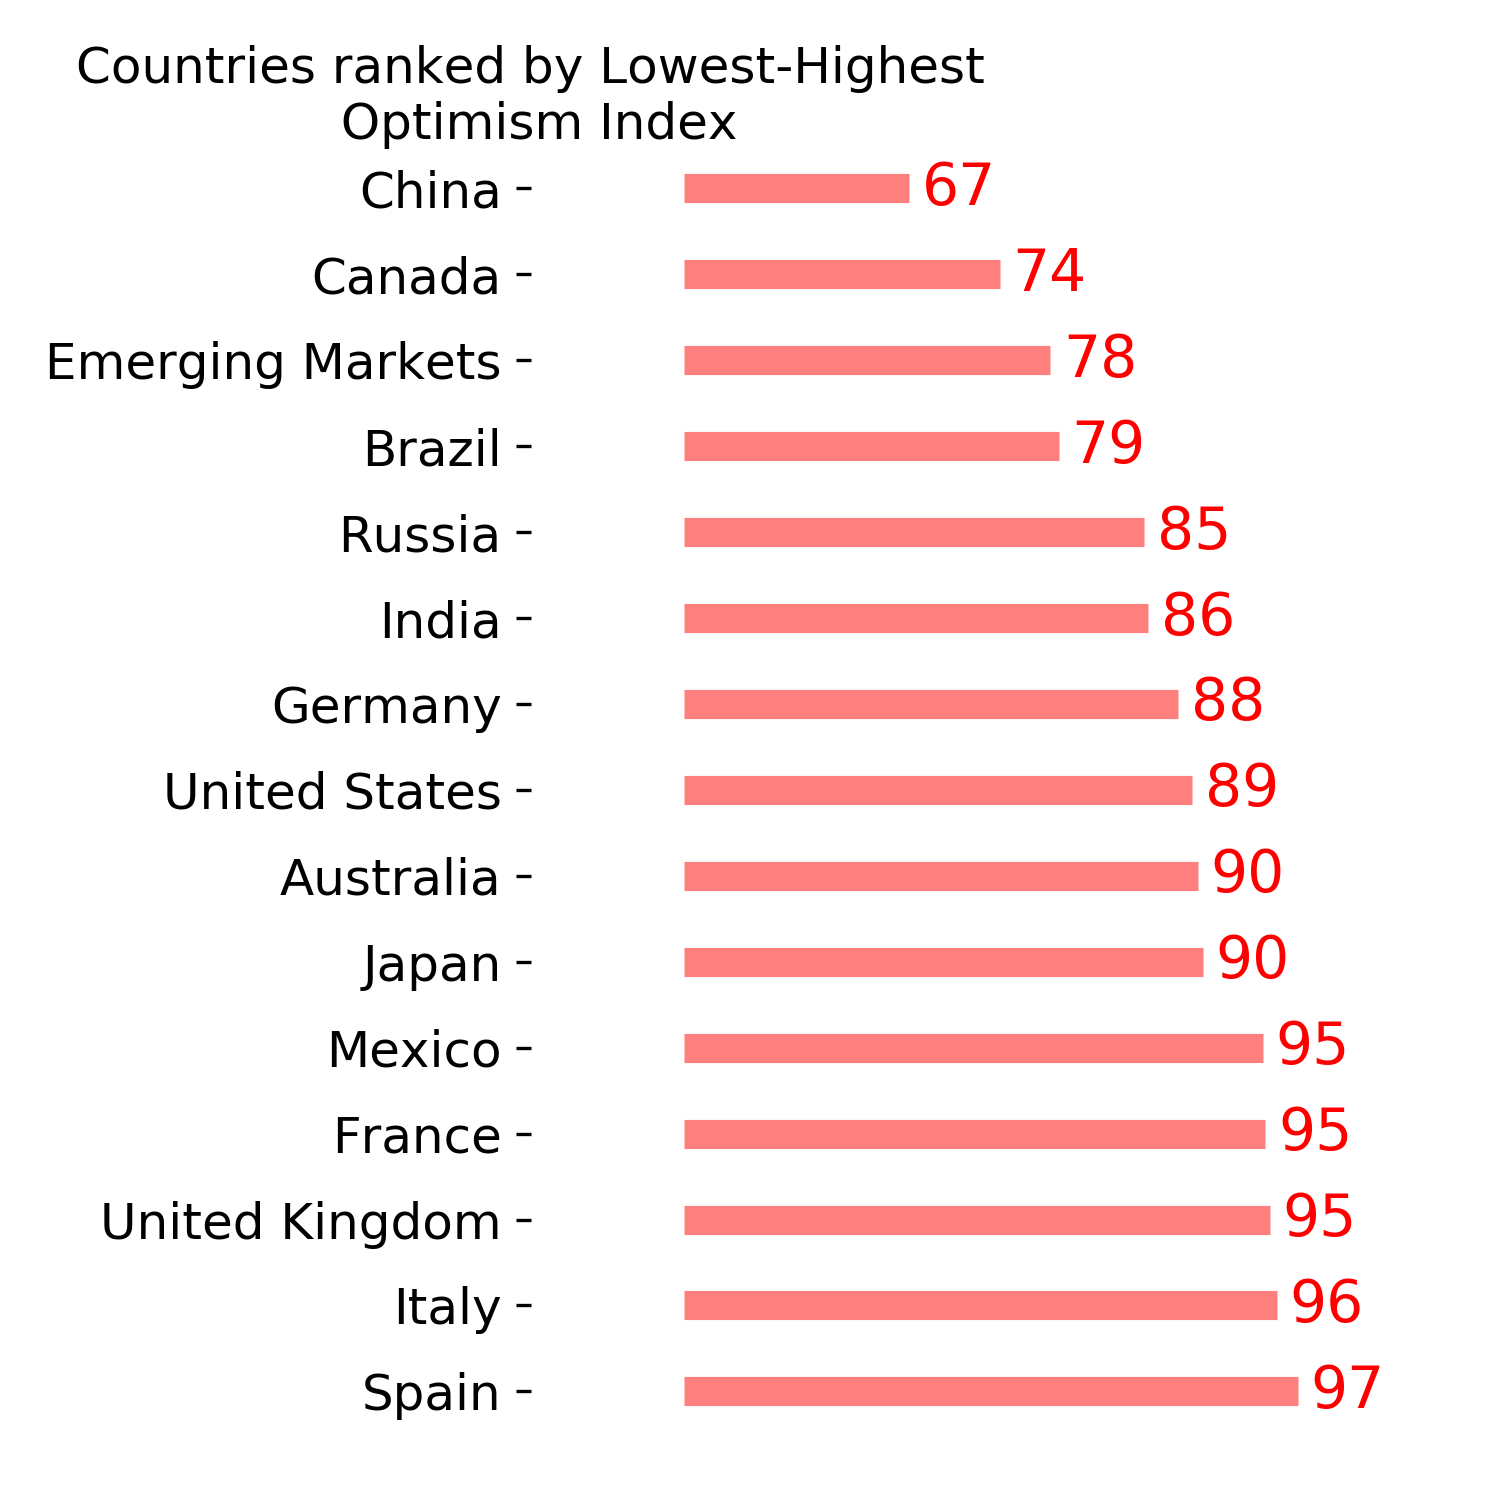
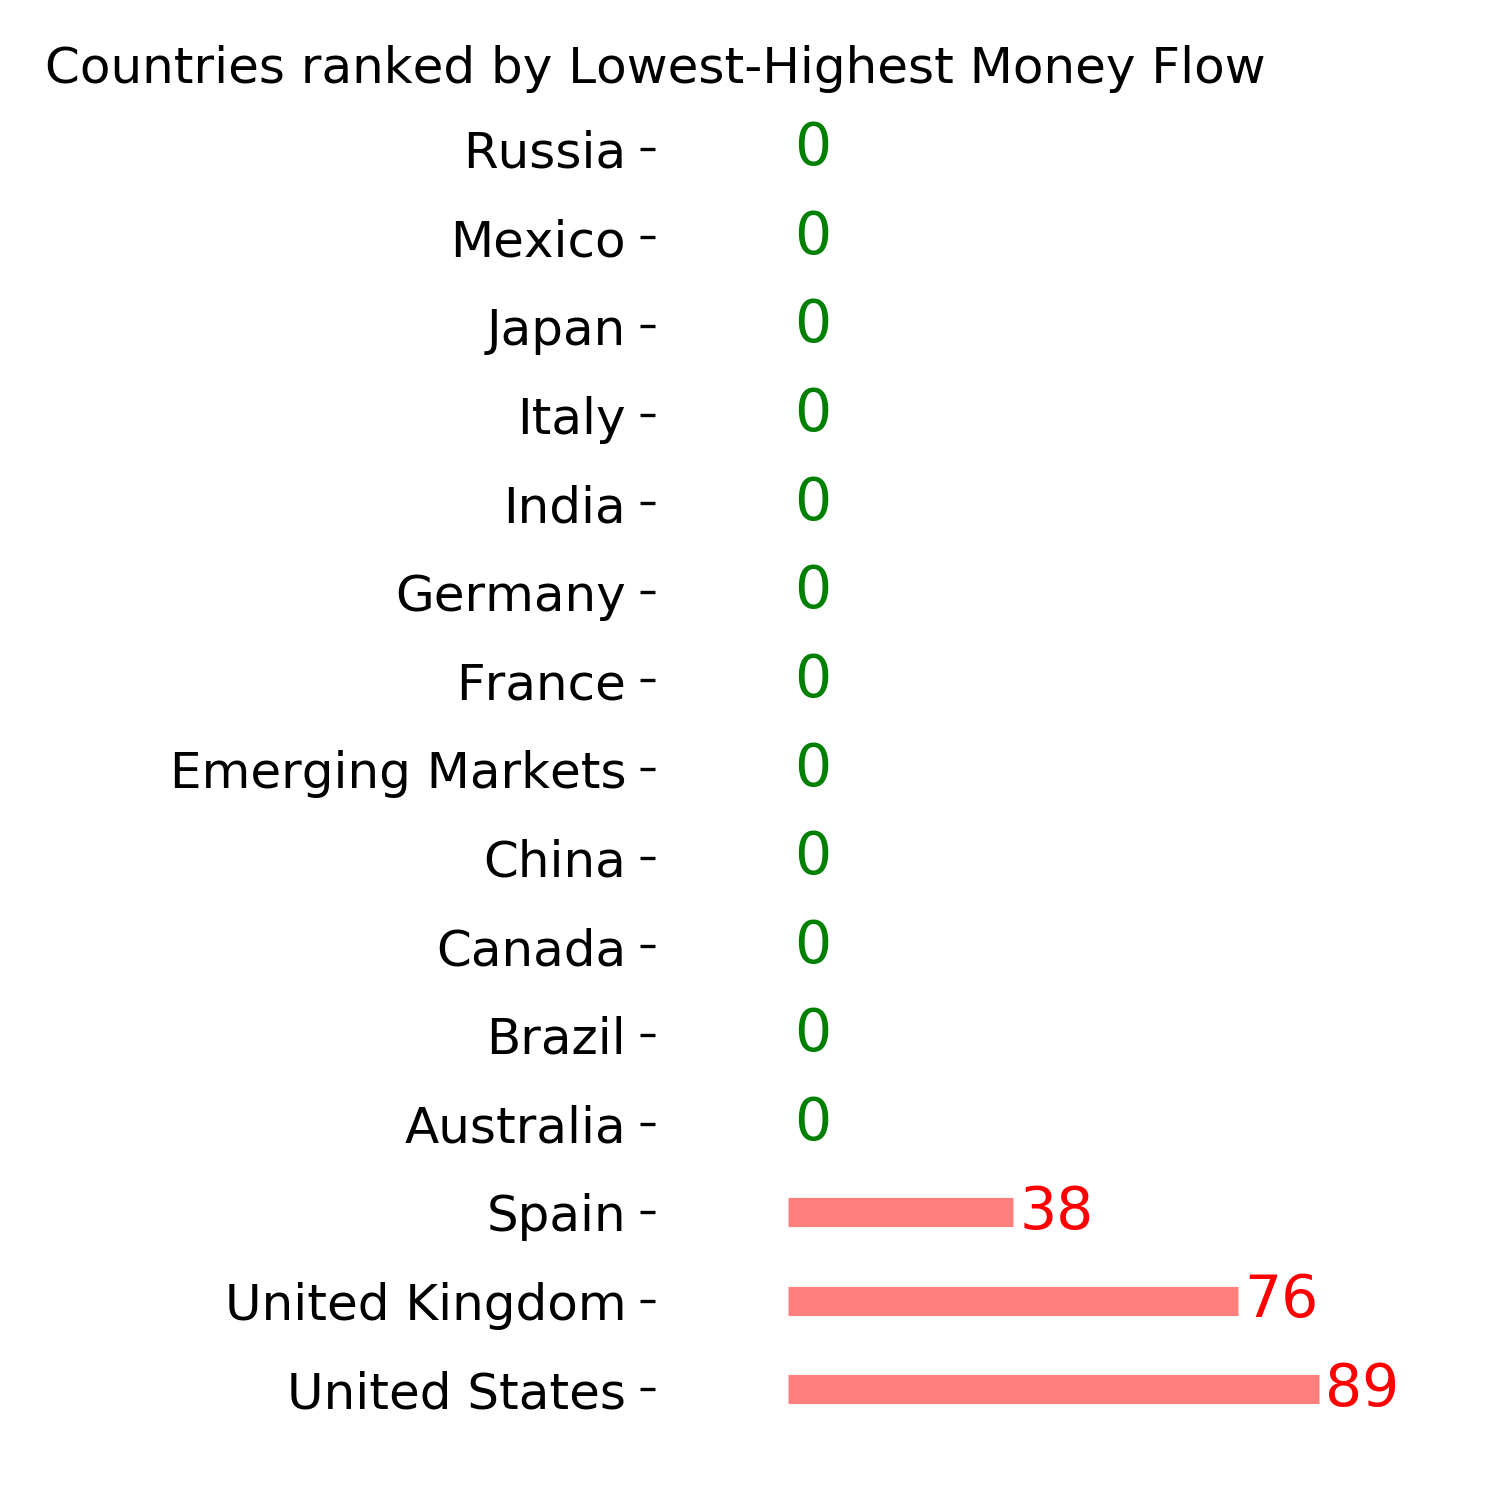
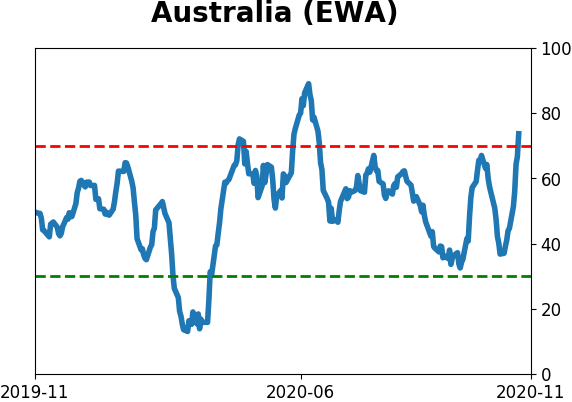
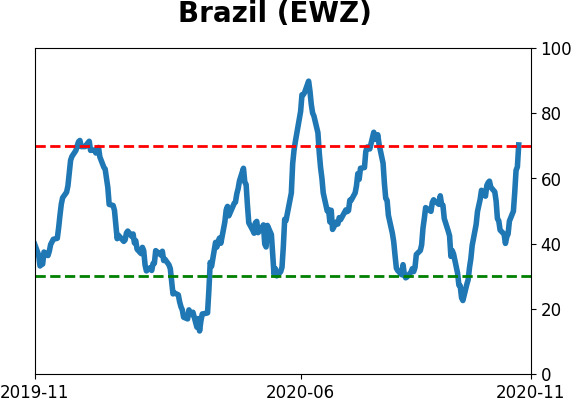
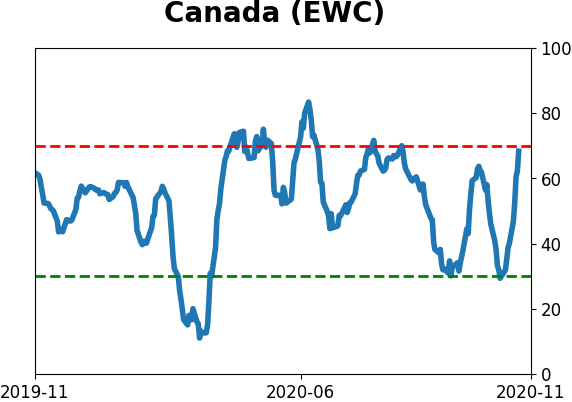
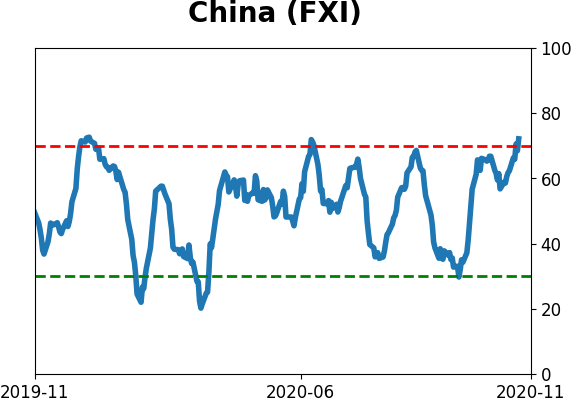
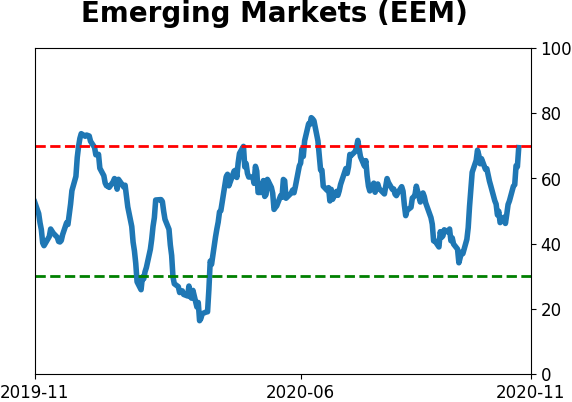
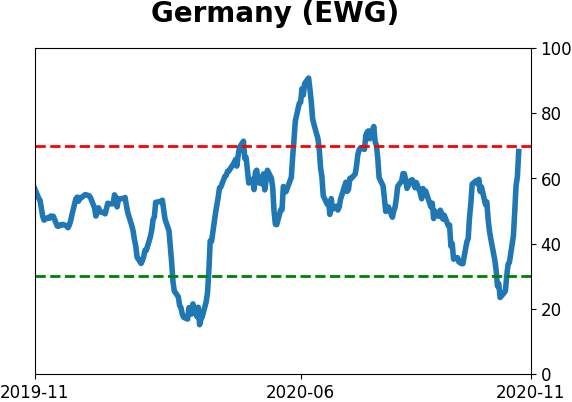
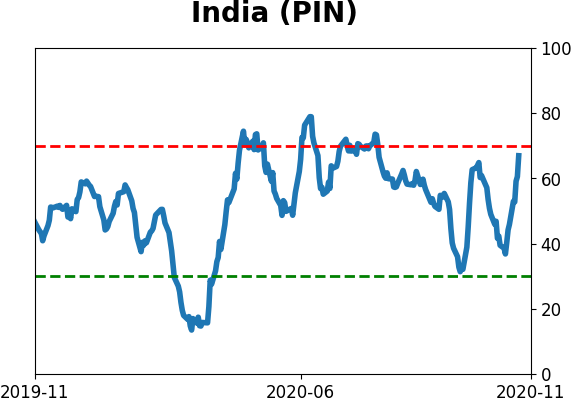
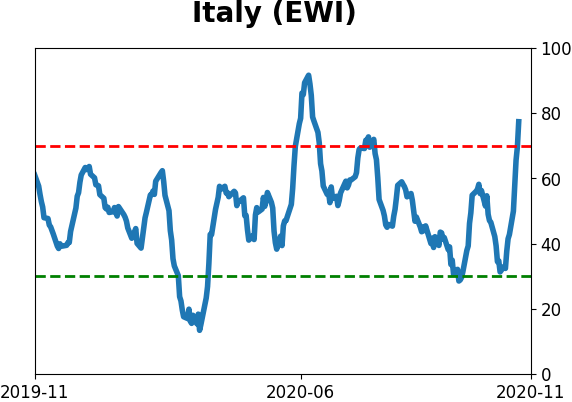
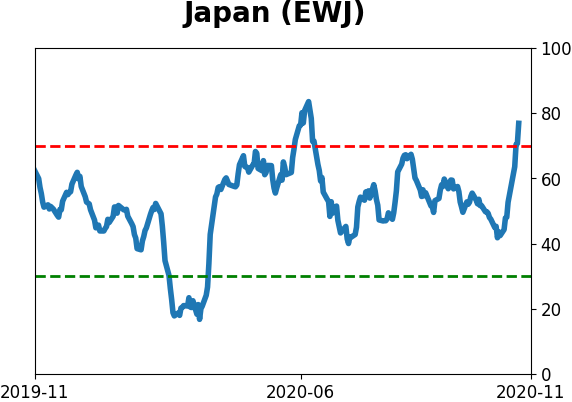
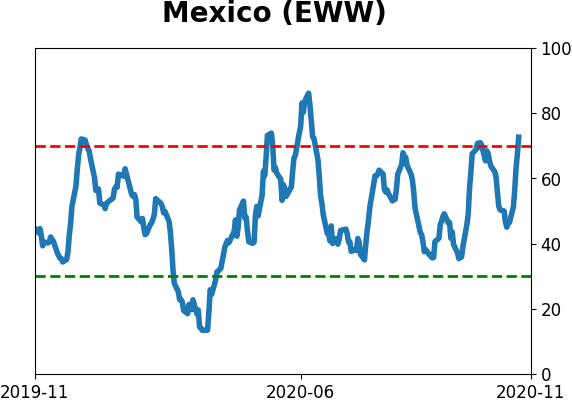
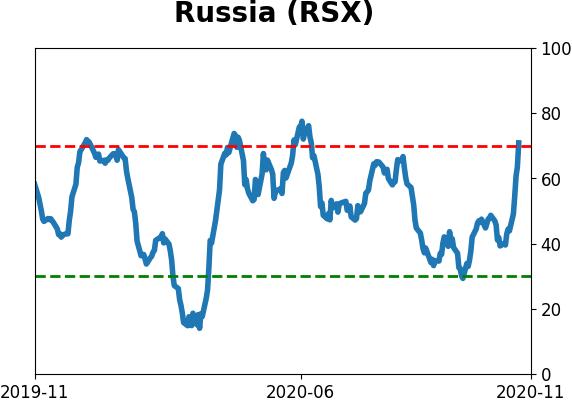
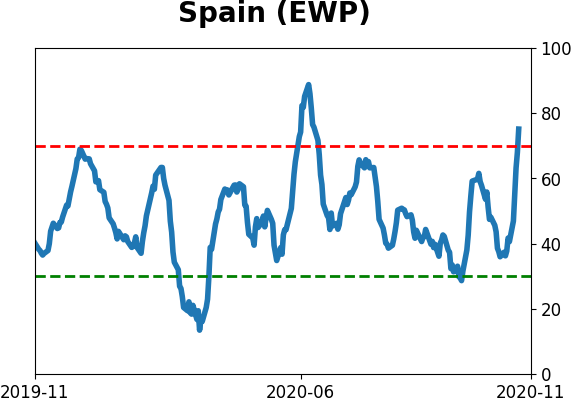
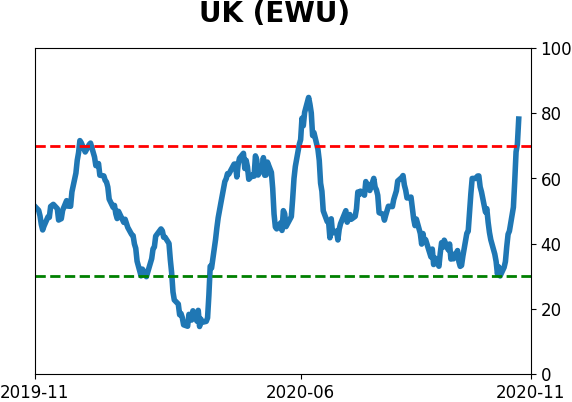
Country ETF's - 10-Day Moving Average
|
|
|
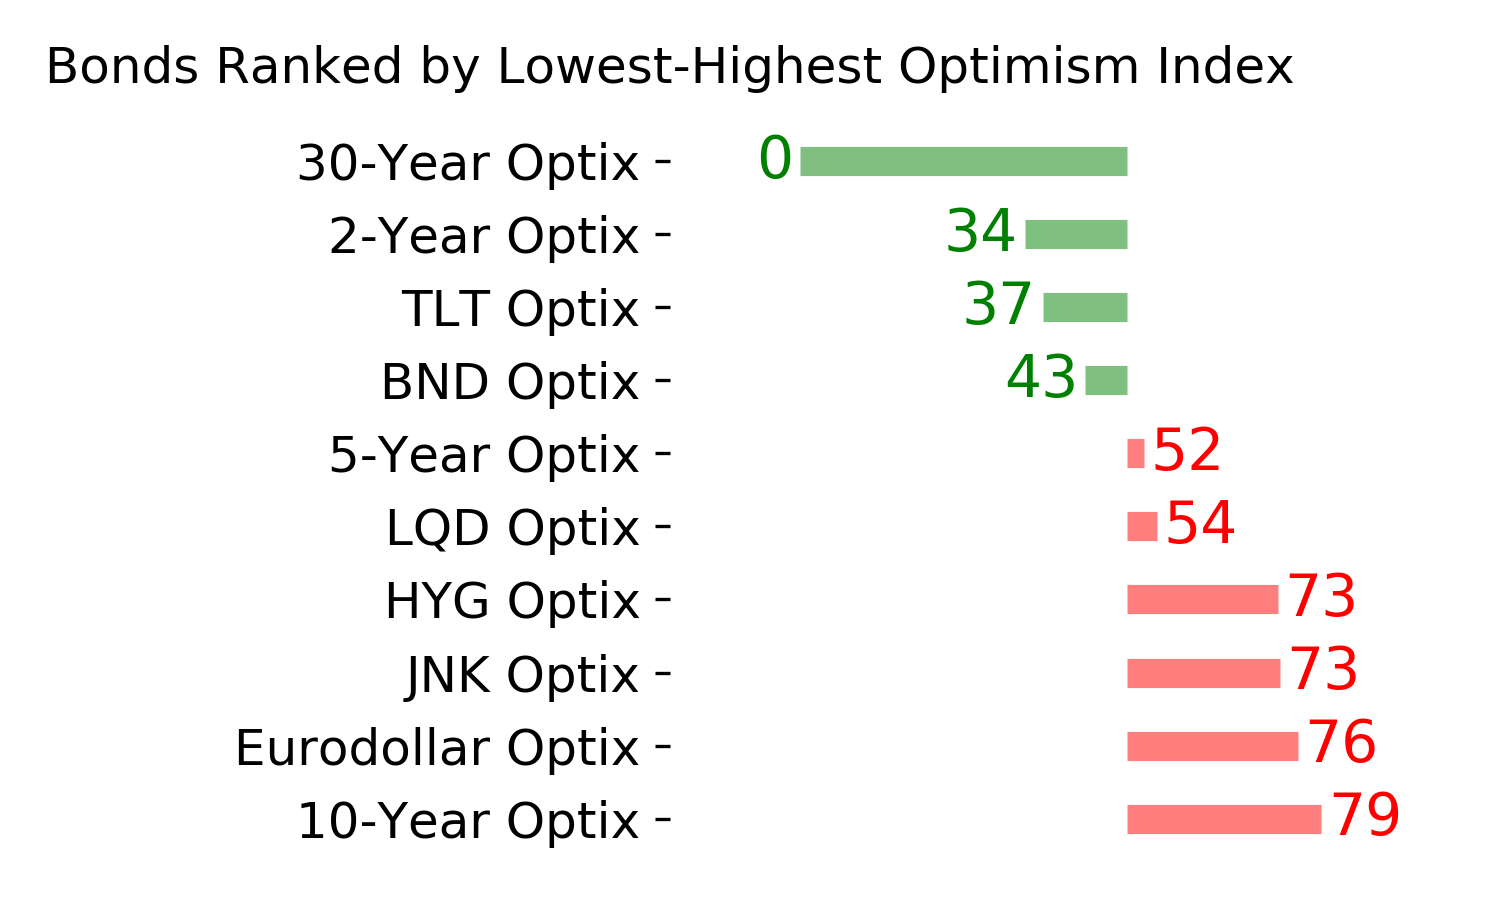
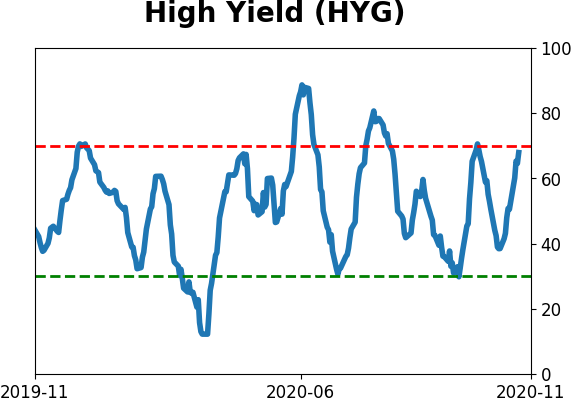
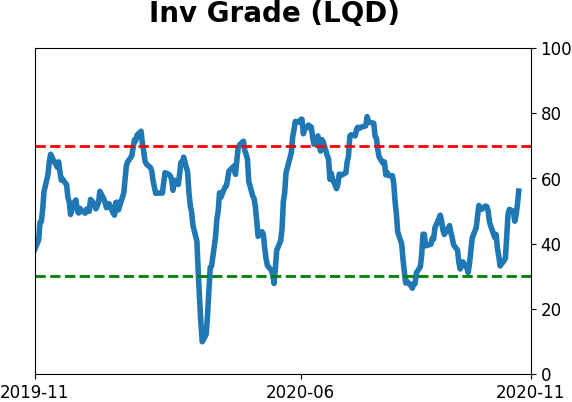
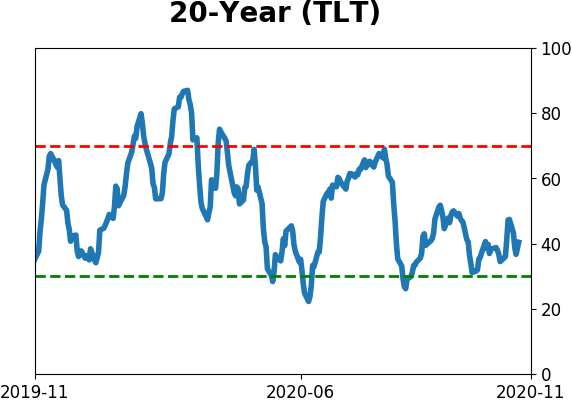
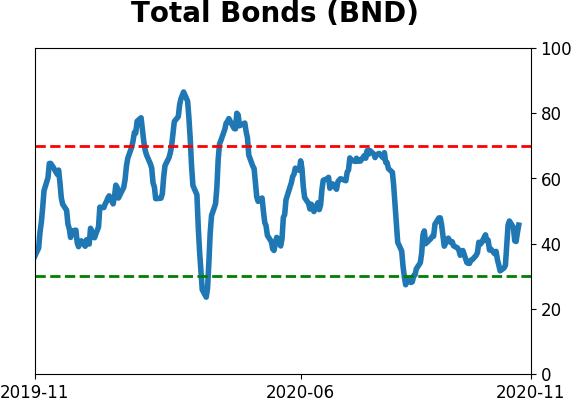
Bond ETF's - 10-Day Moving Average
|
|
|
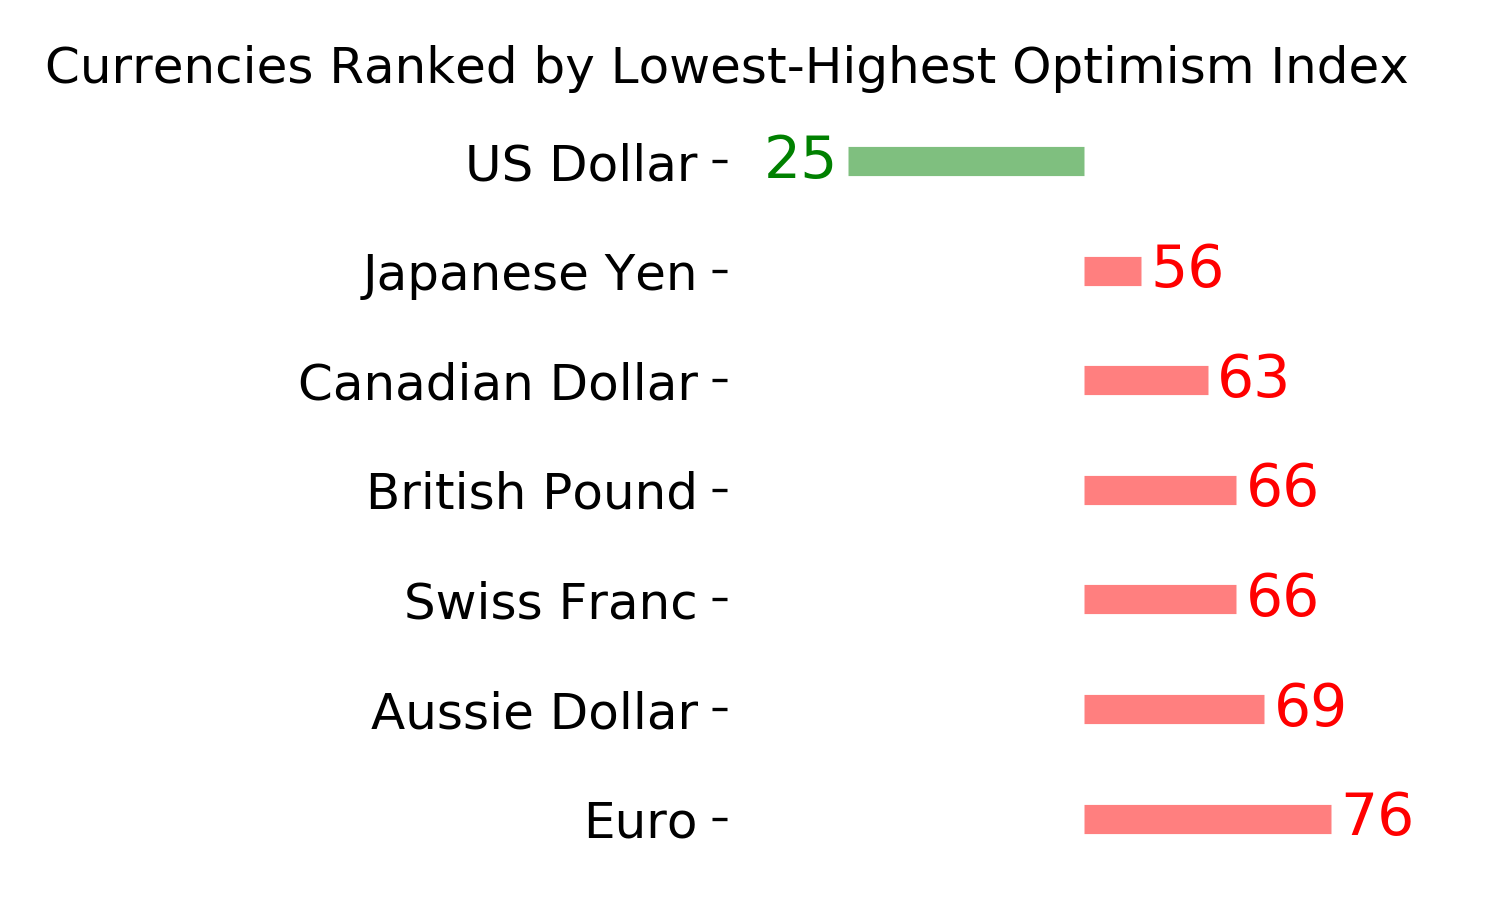
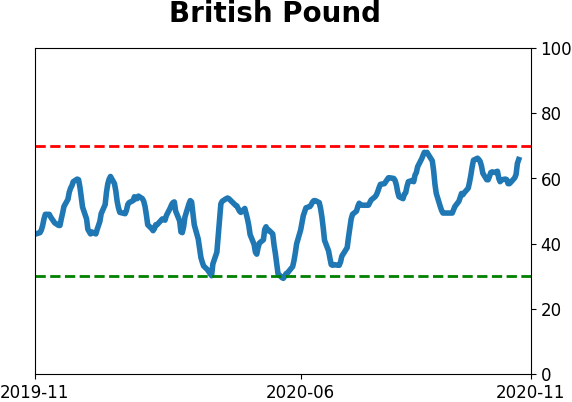
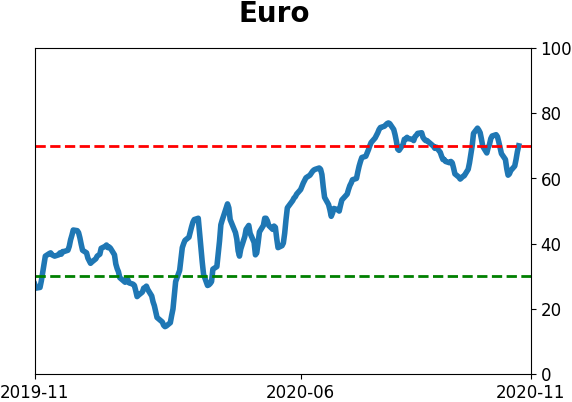
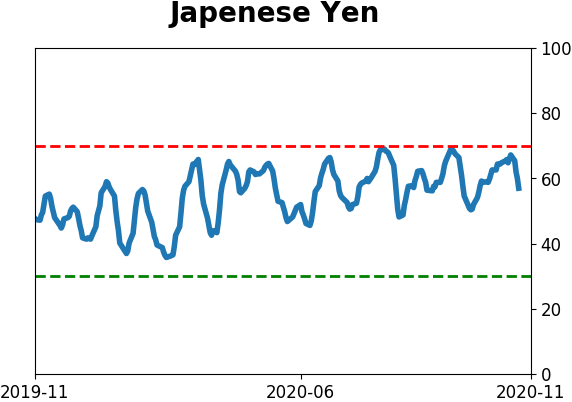
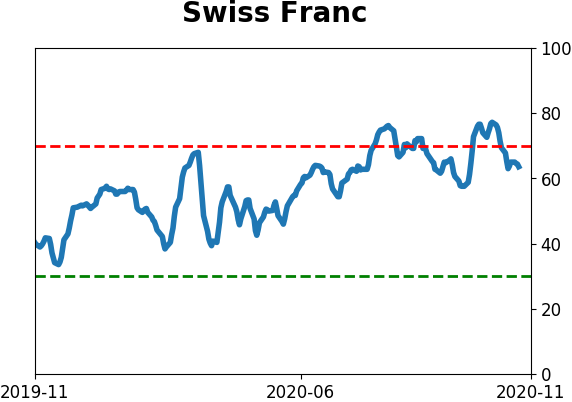
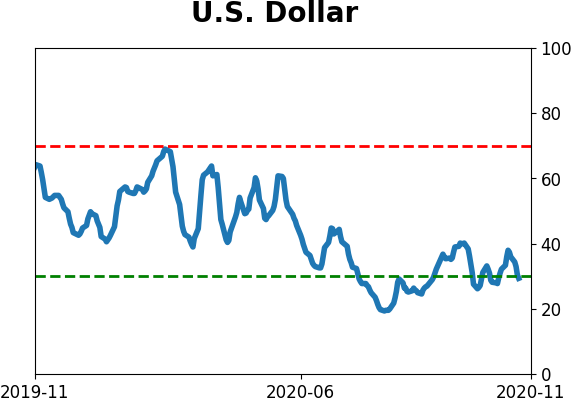
Currency ETF's - 5-Day Moving Average
|
|
|
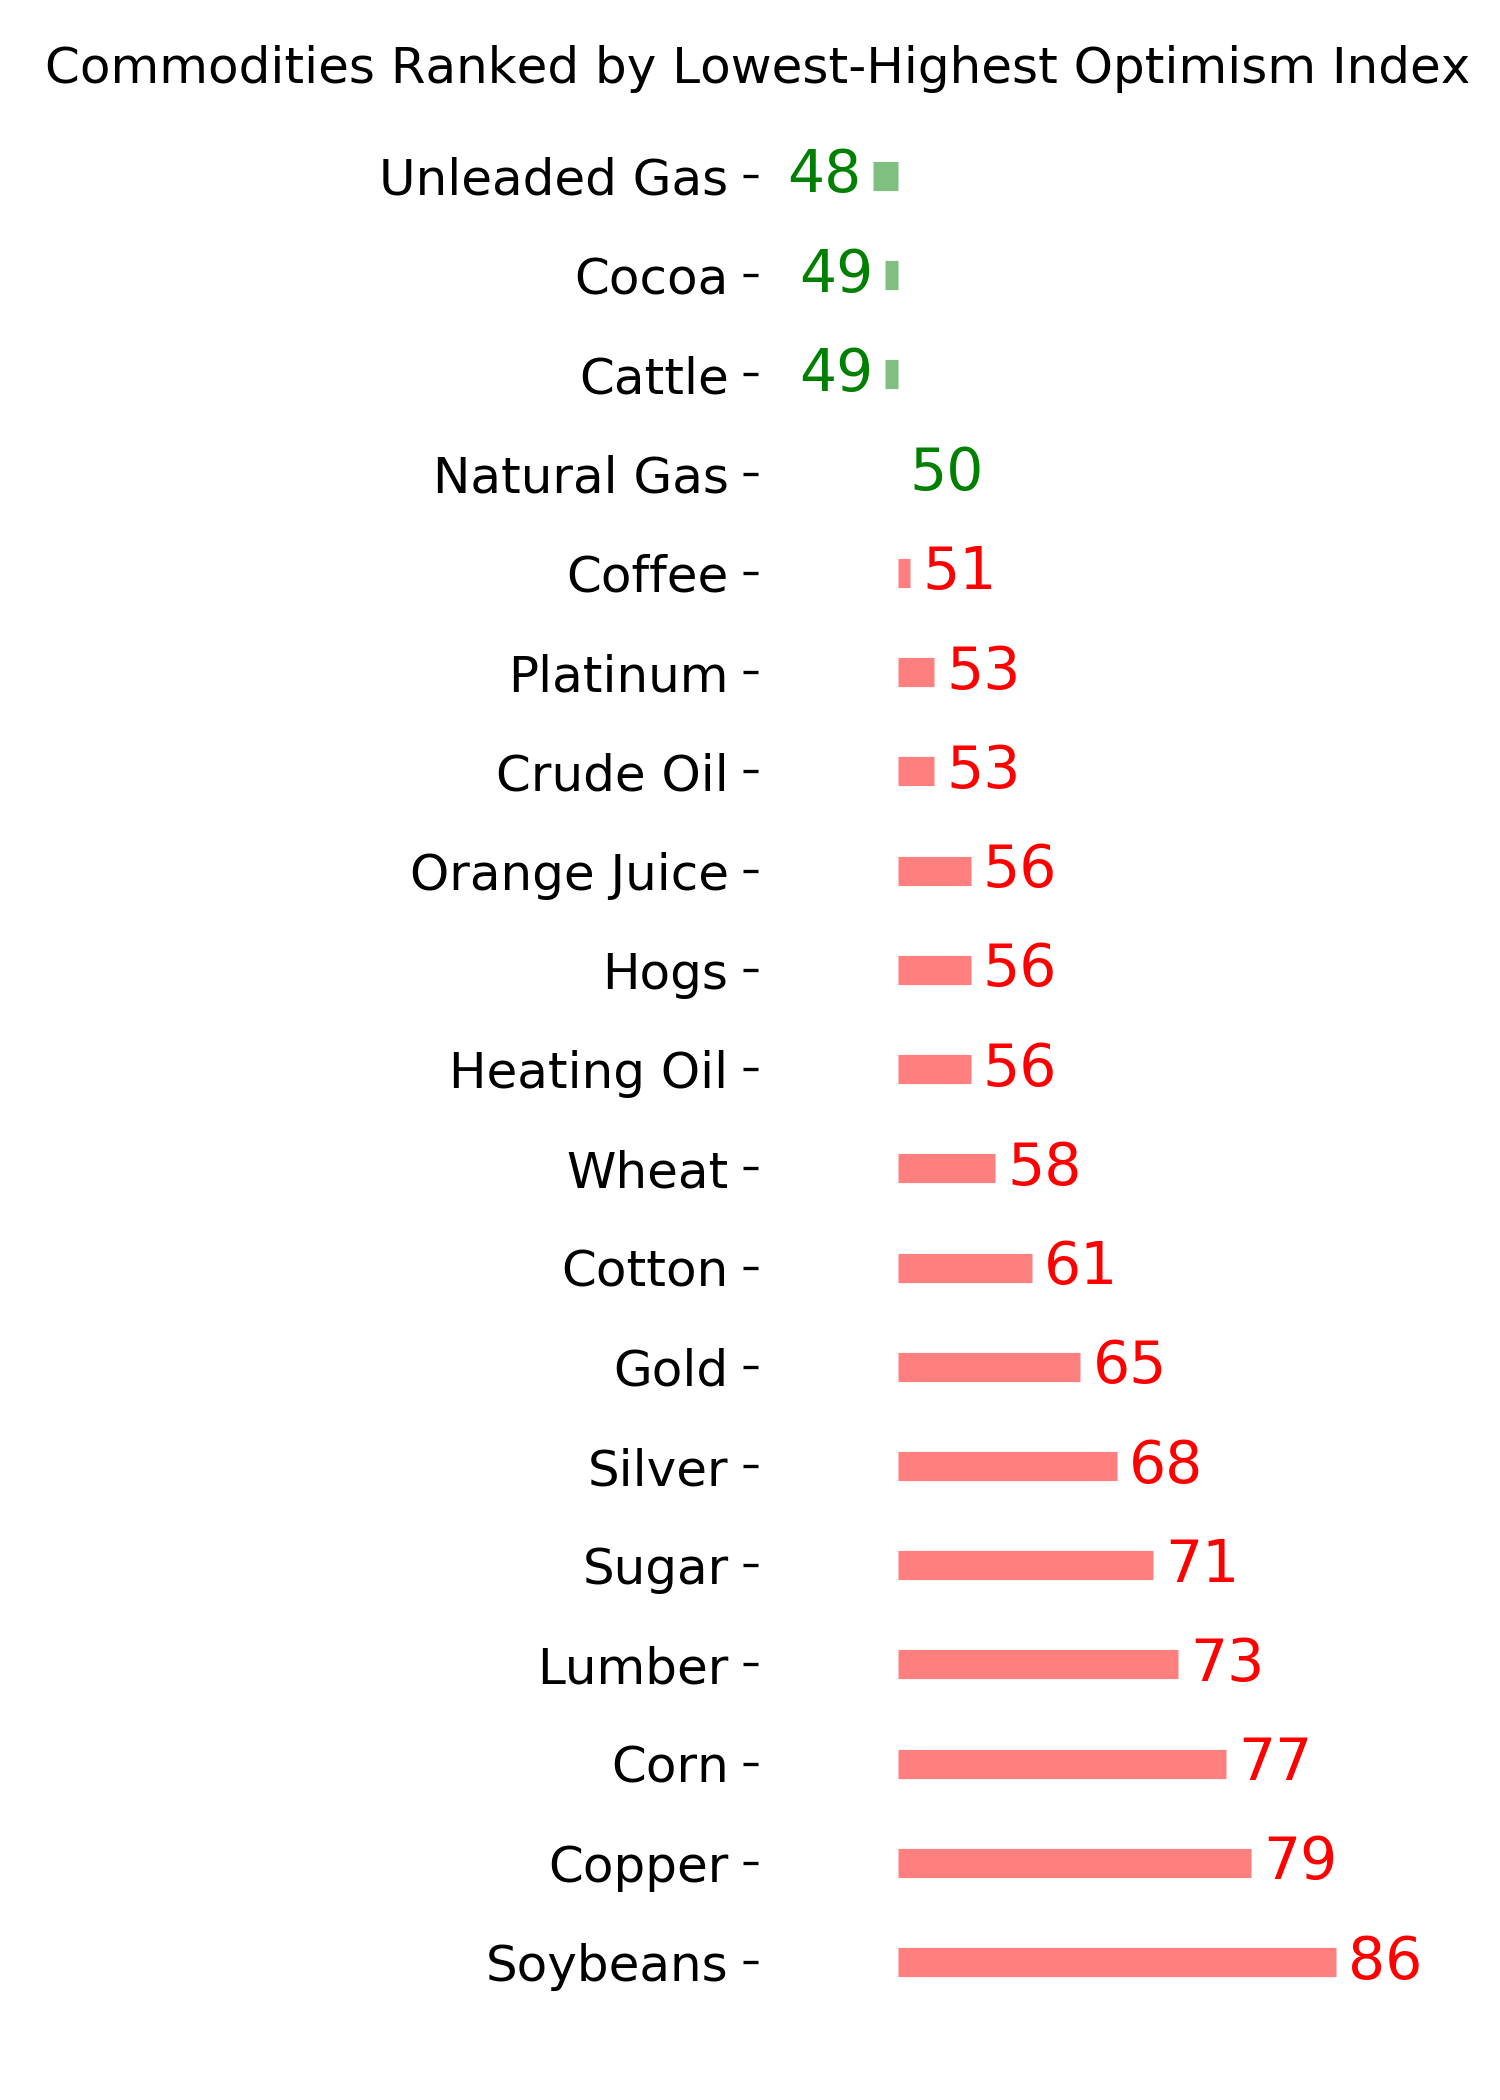
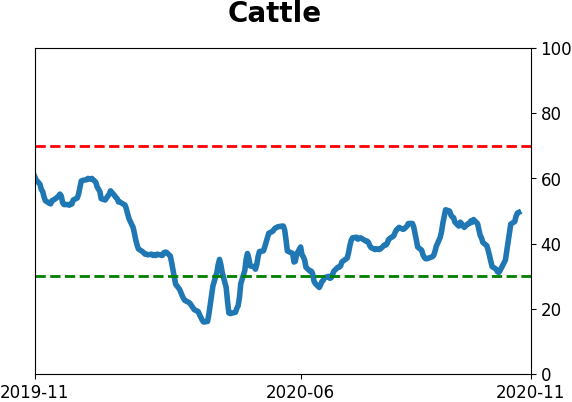
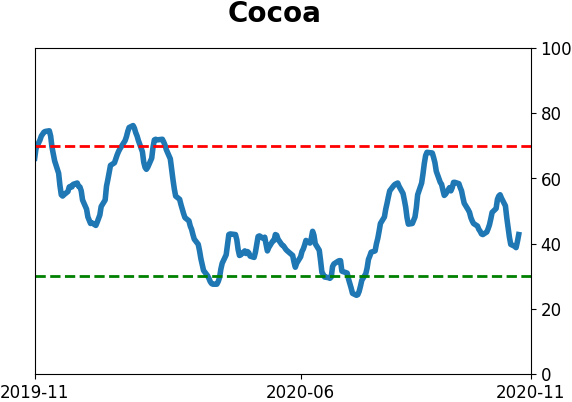
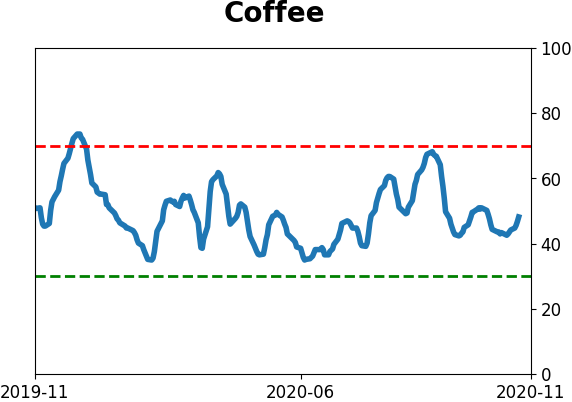
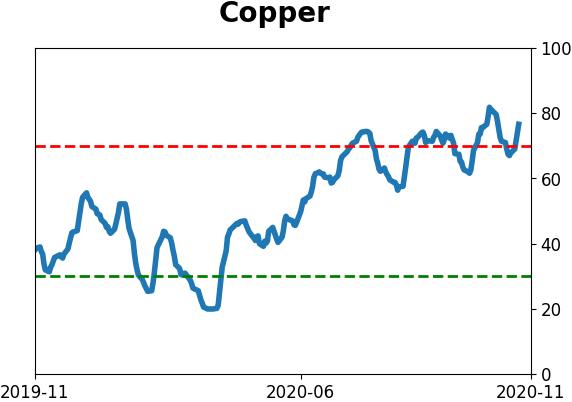
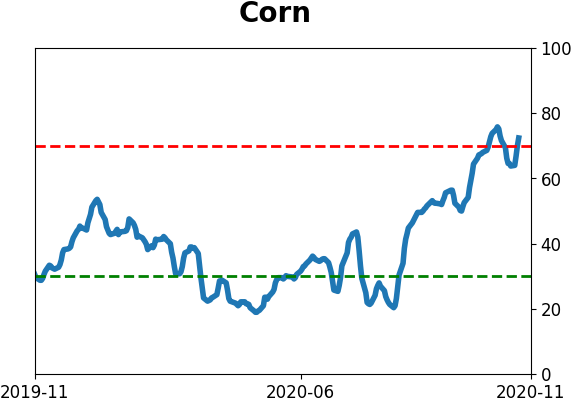
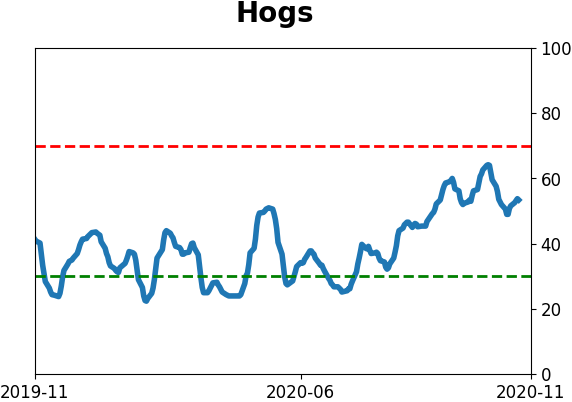
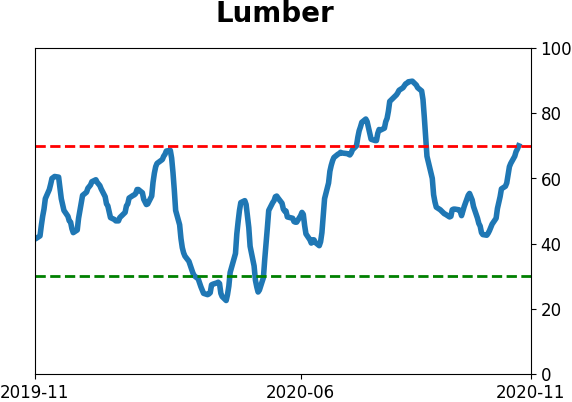
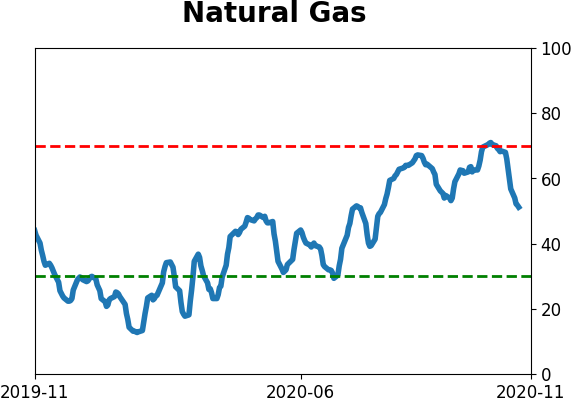
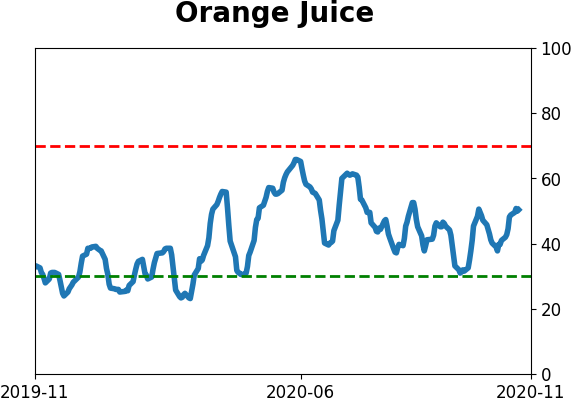
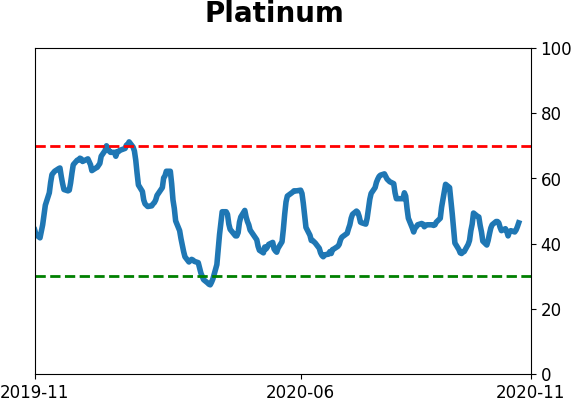
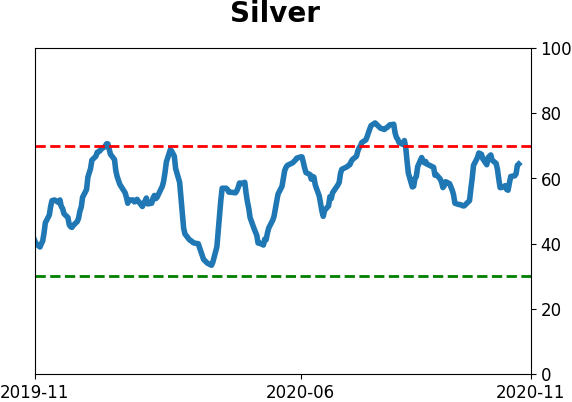
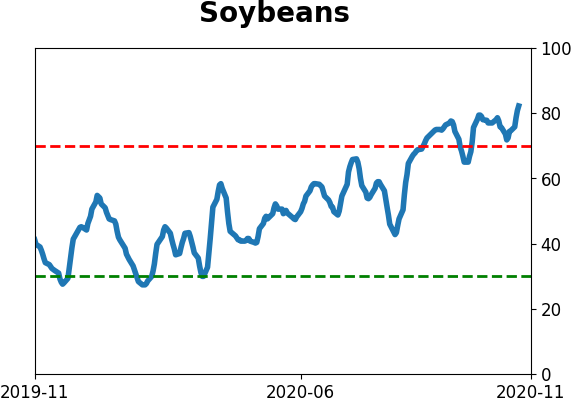
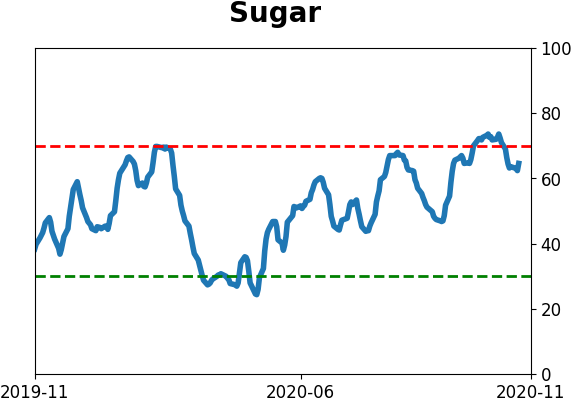
Commodity ETF's - 5-Day Moving Average
|
|