Headlines
|
|
4 sentiment models are showing extreme optimism:
Four major models of sentiment are all showing excessive optimism. Combining them into a single composite shows one of the highest readings in 23 years. The S&P 500's annualized returns after other high readings were abysmal.
Bottom Line:
STOCKS: Hold By early October, sentiment had reset. Several important momentum streaks ended, which has brought in buyers in the past, and seasonality turned positive. We're now seeing signs that sentiment has quickly shifted, especially among options traders. It's gotten to an extreme that has preceded weaker-than-average returns.
BONDS: Hold In late October, sentiment on bonds - from Treasuries to corporates - entered pessimistic territory. It's now starting to recover, with some quick moves in corporate bonds. We'll see if those bonds, in particular, can hold recent gains.
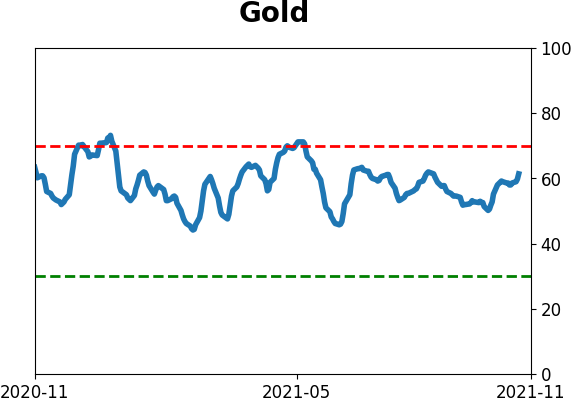
GOLD: Hold
Gold and miners were rejected after trying to recover above their 200-day averages in May. Some oversold extremes in breadth measures among miners triggered in late September, and they've recovered a bit since then. The group still has some proving to do.
|
Smart / Dumb Money Confidence
|
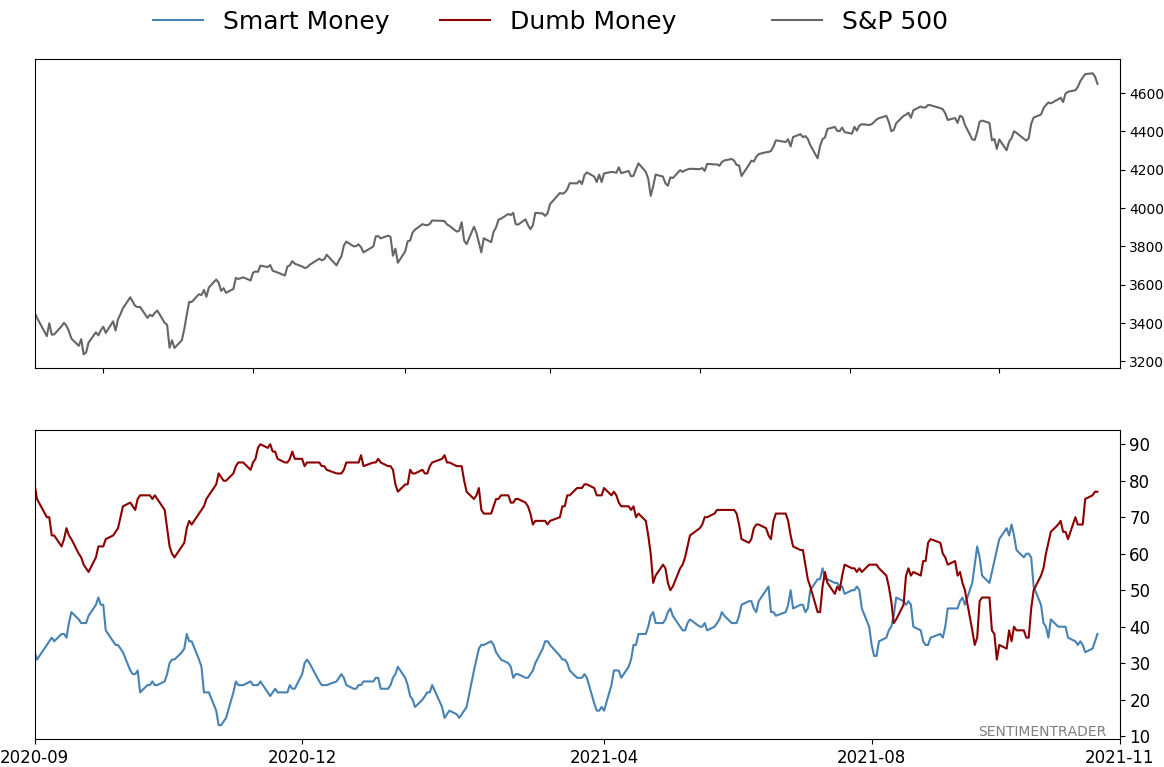
Smart Money Confidence: 38%
Dumb Money Confidence: 77%
|
|
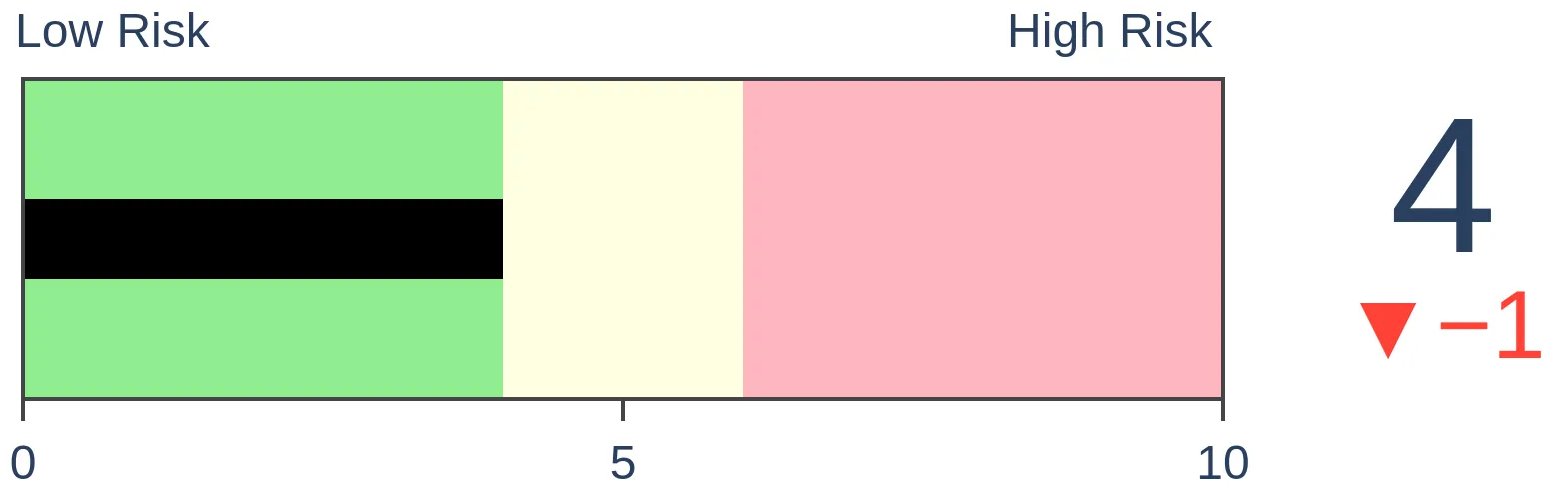
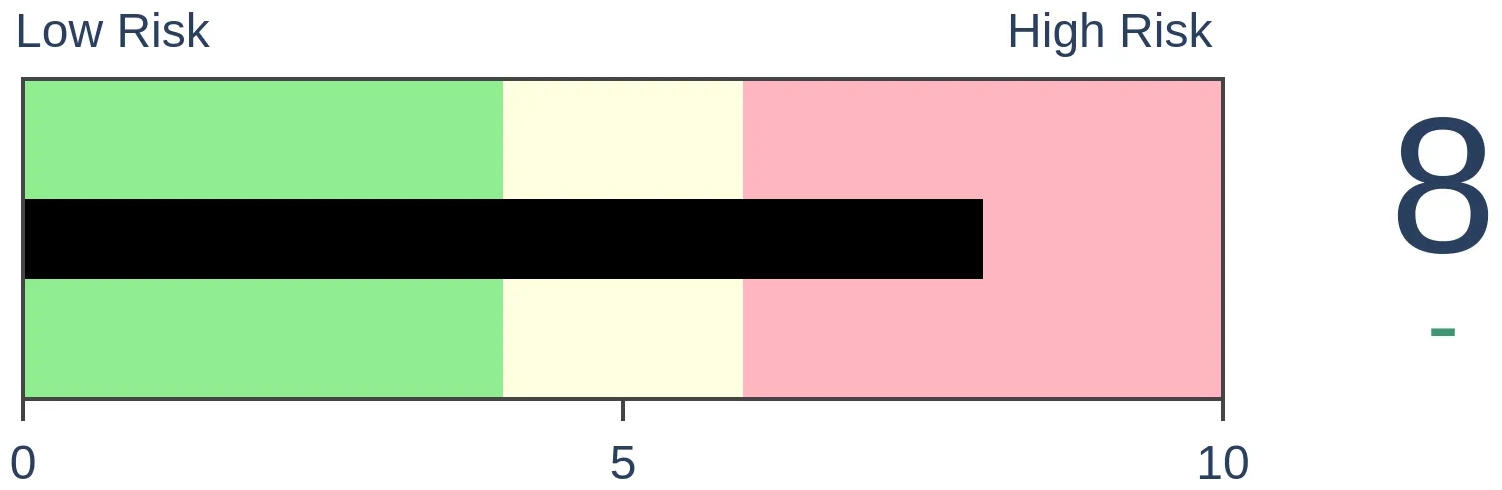
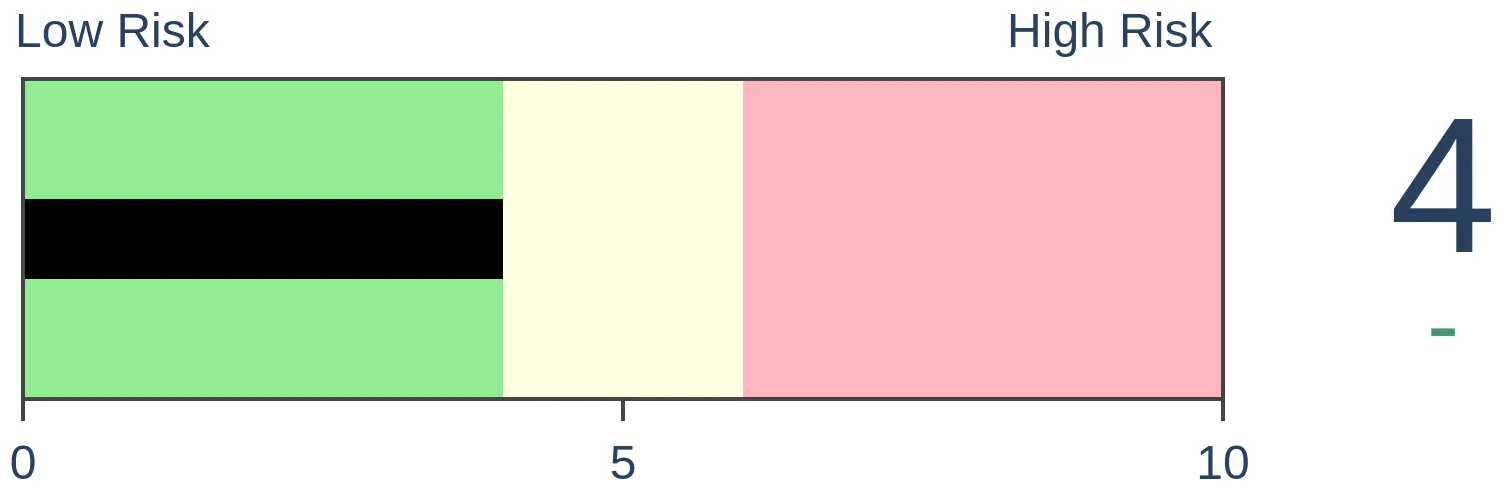
Risk Levels
Stocks Short-Term
|
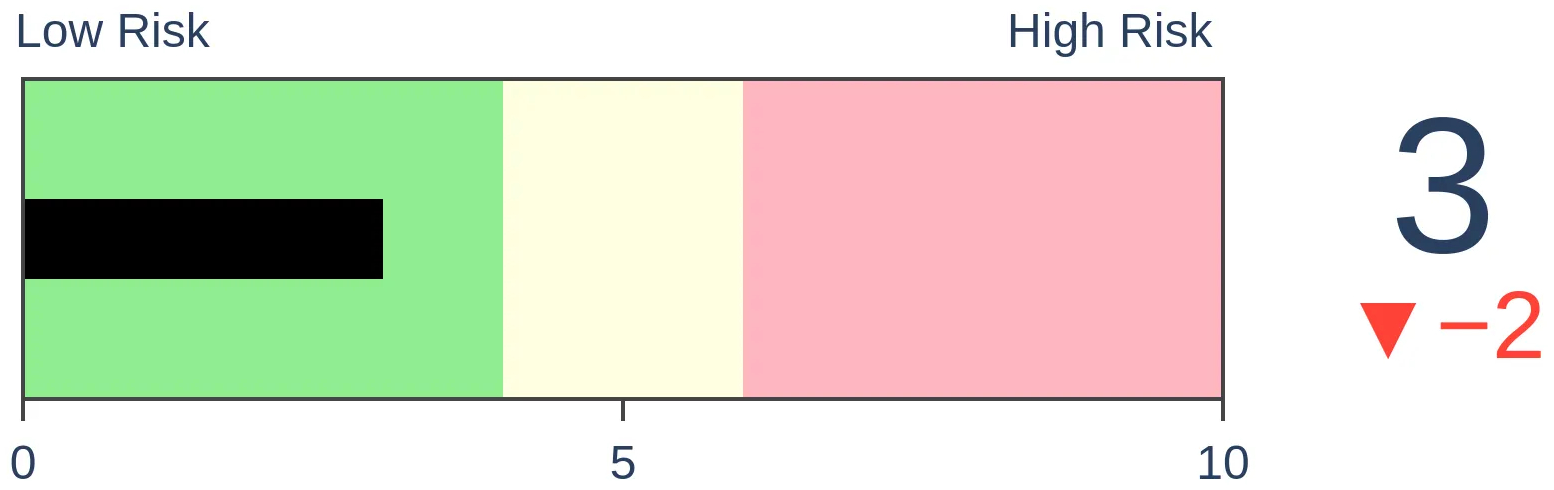
Stocks Medium-Term
|
|
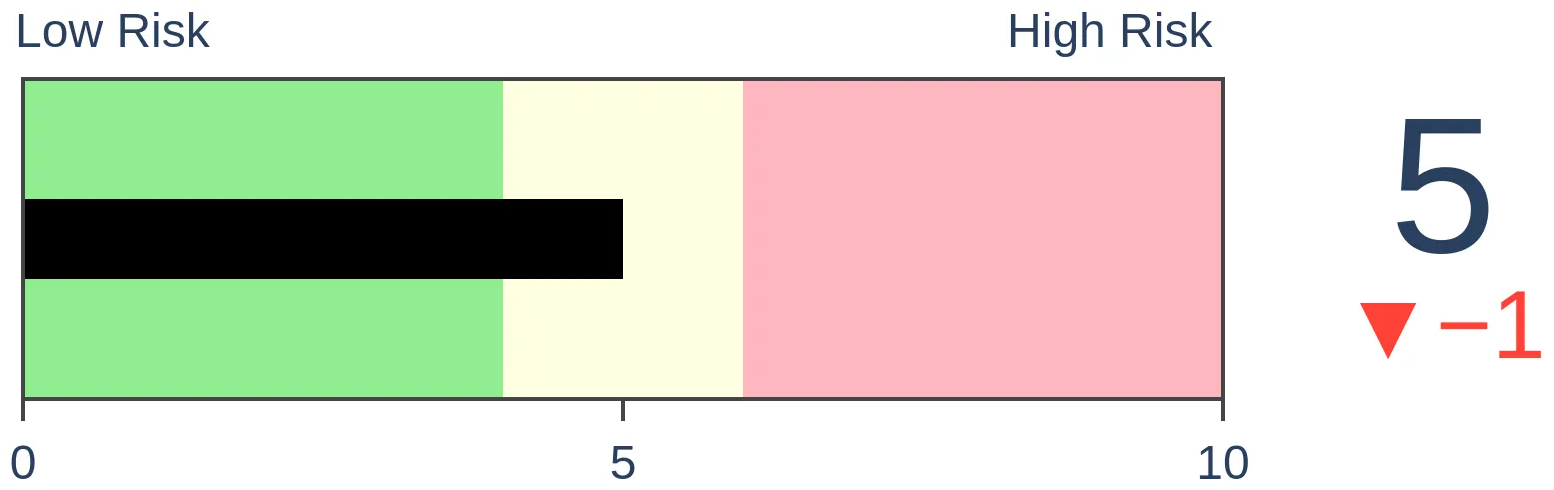
Bonds
|
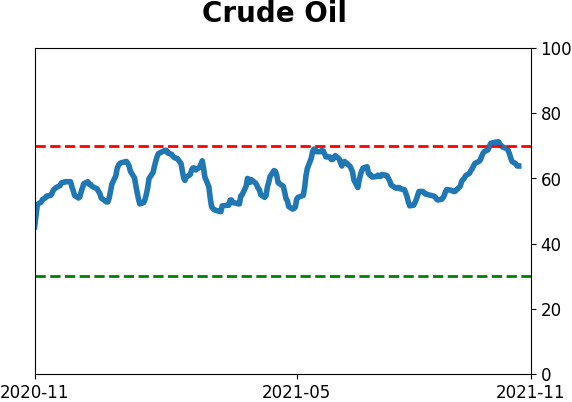
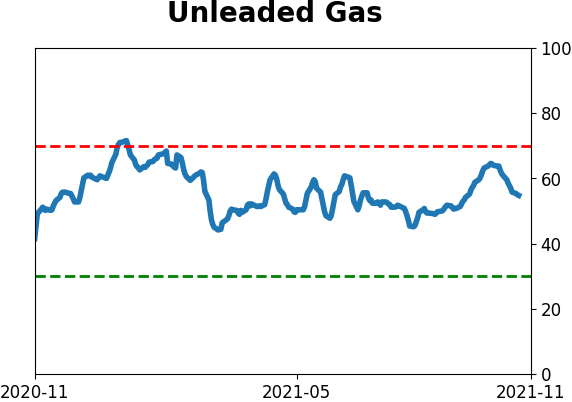
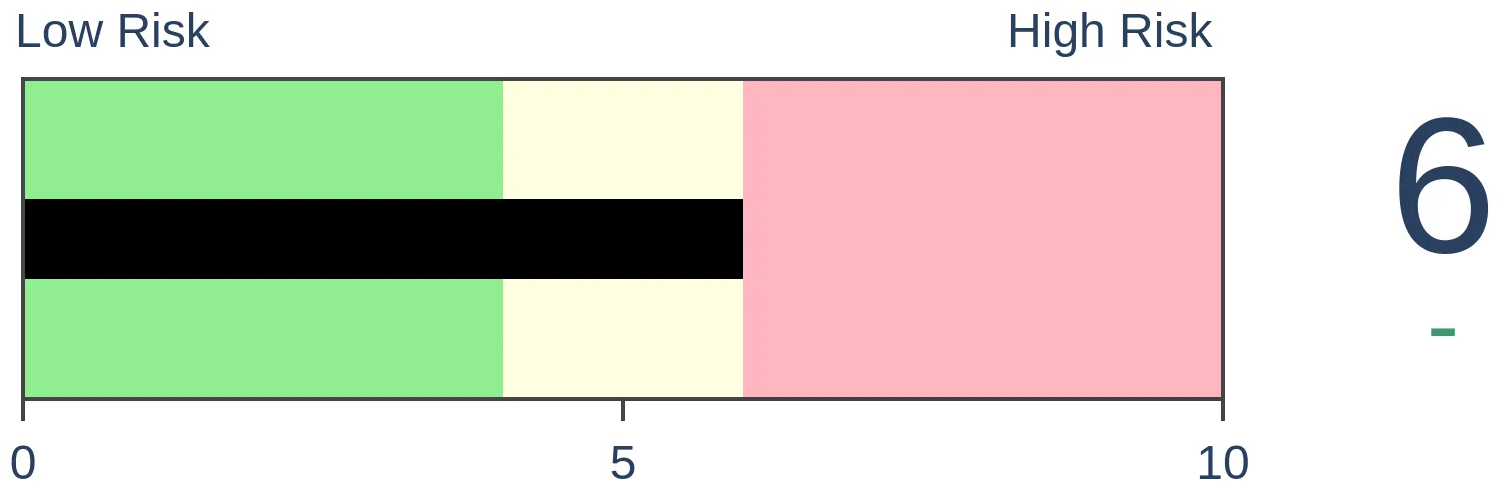
Crude Oil
|
|
Gold
|
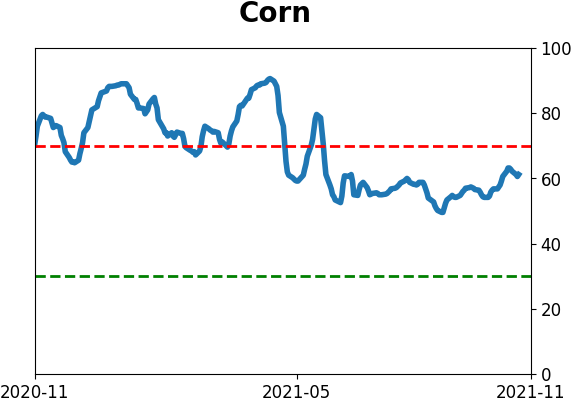
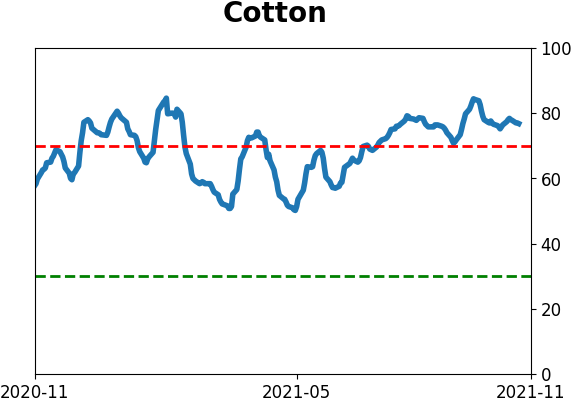
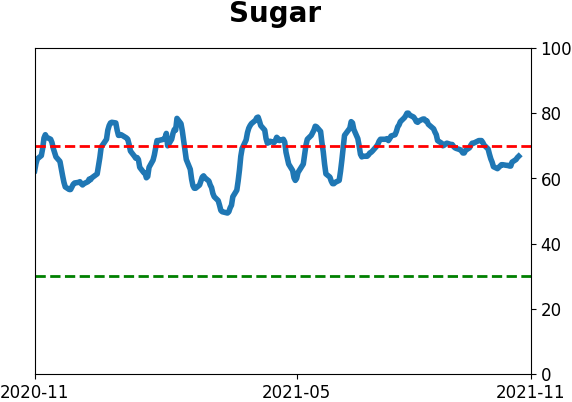
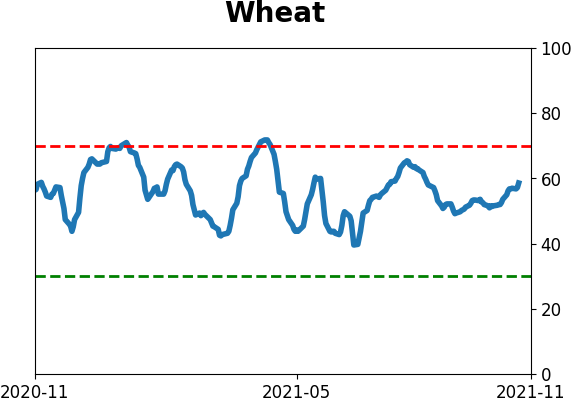
Agriculture
|
|
Research
By Jason Goepfert
BOTTOM LINE
Four major models of sentiment are all showing excessive optimism. Combining them into a single composite shows one of the highest readings in 23 years. The S&P 500's annualized returns after other high readings were abysmal.
FORECAST / TIMEFRAME
None
|
Key points:
- Four sentiment models are all showing extreme optimism
- Combining them into a composite shows one of the highest readings in 23 years
- The S&P 500's annualized return after similar readings was -15.6%
Four major models are all showing excessive optimism
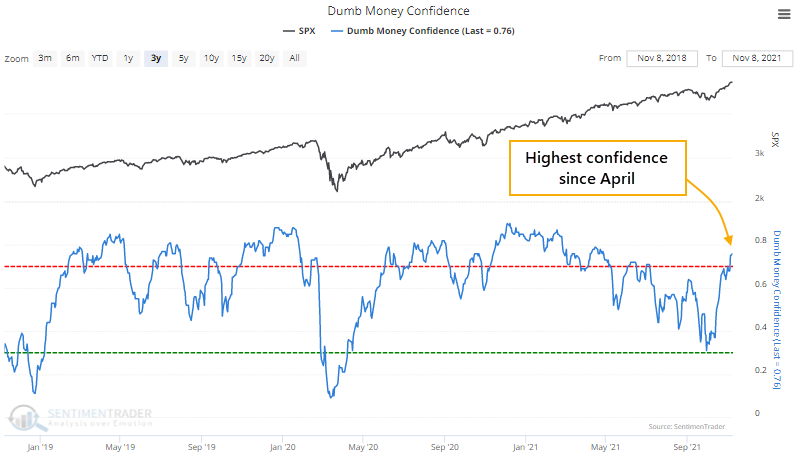
After a streak of optimism, Dumb Money Confidence turned pessimistic at the end of September. The ends of other long streaks of optimism led to higher prices, as buyers finally saw a good chance to step in.
The lack of optimism didn't last long, and now it's back to an extreme. On the lower end of that threshold, but still.
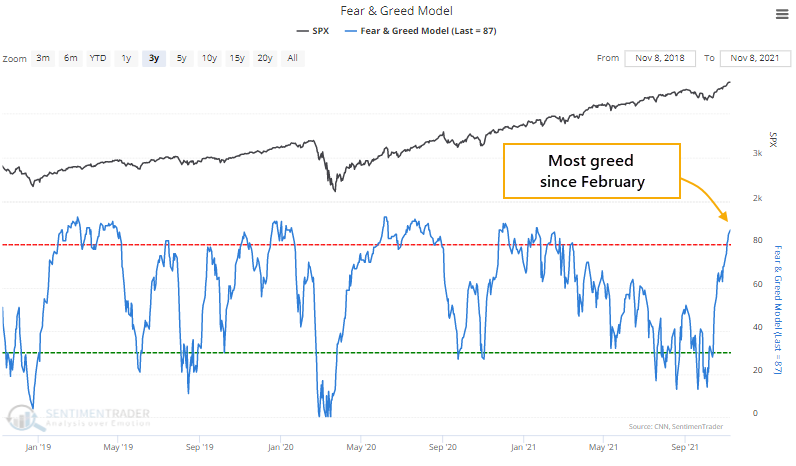
The Fear & Greed Model, based on similar inputs and methodology to the one published by CNN, has also made a furious comeback and is now pushing well into Greed.
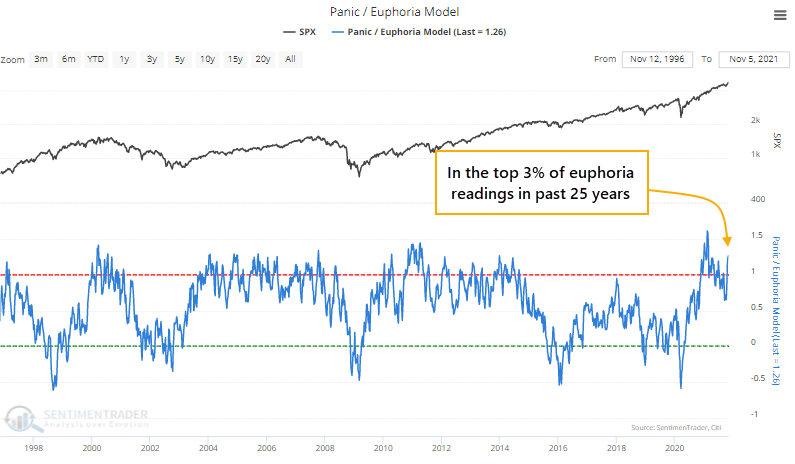
The Panic/Euphoria Model, constructed using a methodology described by Citigroup in public posts, has rebounded and is once again above its "euphoria" threshold.
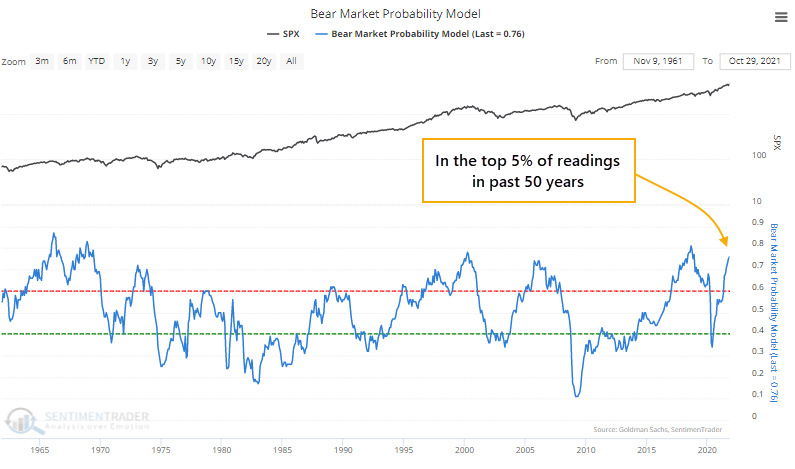
And the Bear Market Probability Model, described in interviews by Goldman Sachs, has soared to one of the highest levels in 50 years.
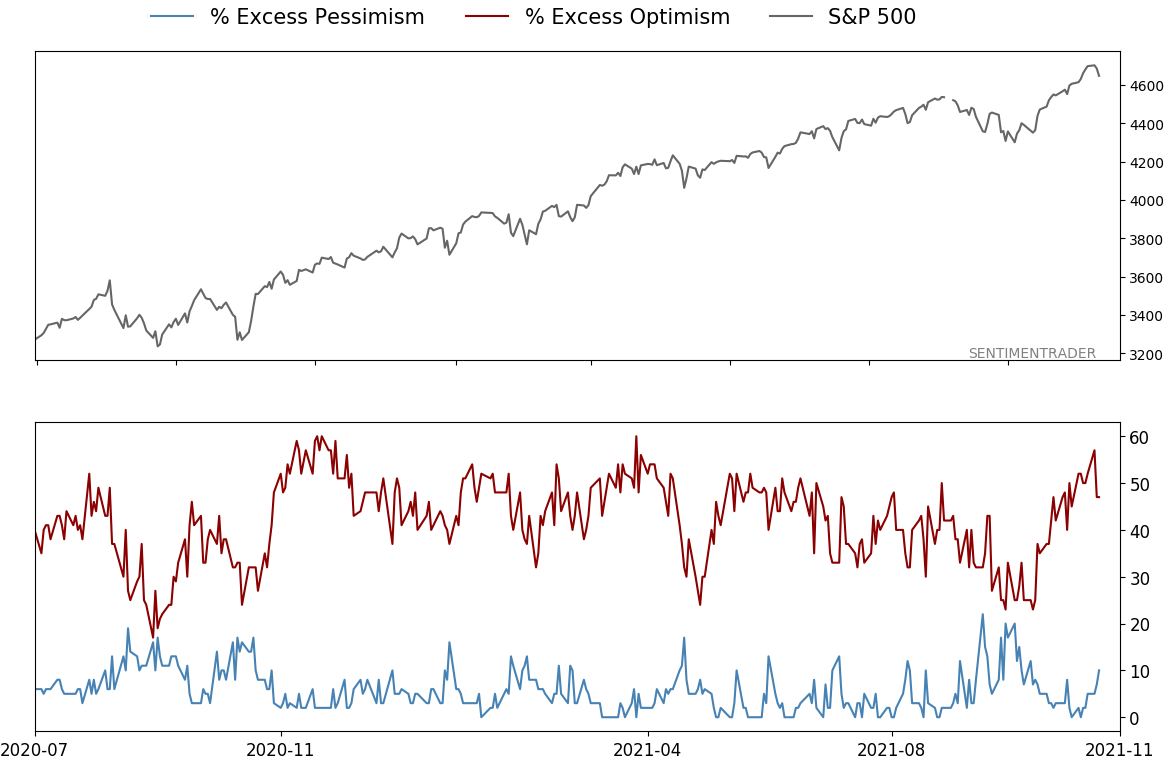
A combined model shows abysmal annualized returns
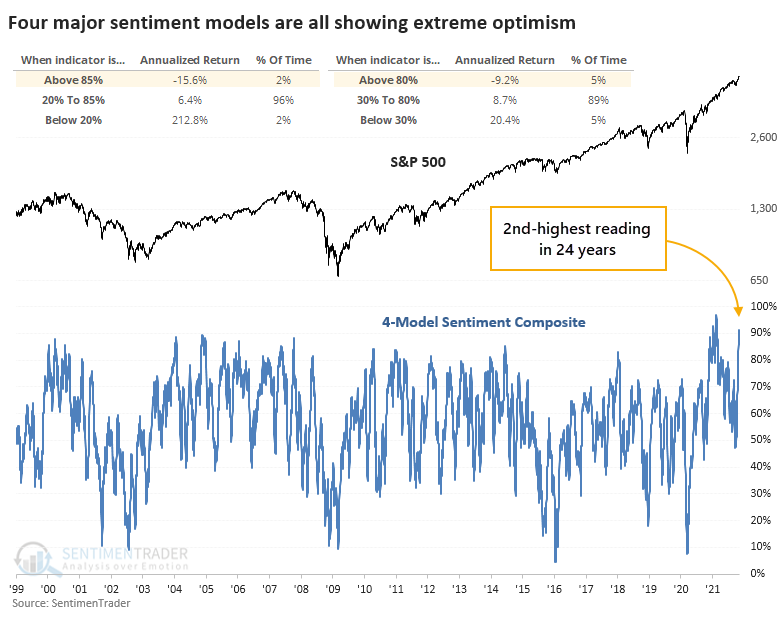
If we combine all four models into one, we can see how a broad cross-section of sentiment-related measures compares versus other periods. And there are almost no precedents.
This composite model never got above 90% from 1998 through 2020. Then speculative orgy at the start of 2021 thrust it above 90% in January and February.
Clearly, such high optimism had no long-term impact on the prospects for stocks. A 5-year-old child could point to an S&P 500 price chart and tell that it's still going up and to the right.
Even so, choppiness among stocks within indexes pushed the composite model below 50% in late September. Now, enthusiasm is back, and the model is above 90%, challenging the highest readings in 23 years.
The chart shows us that the S&P 500's annualized return when the composite model was above 80% was a miserly -9.2%. When the model was above 85%, accounting for about 2% of all days since 1998, that return was a horrid -15.6%.
What the research tells us...
At the end of September and early October, most of what we looked at showed a high probability of higher stock prices. Momentum streaks were ending, and sentiment showed hints of pessimism during a seasonally favorable time. The "easy" call was for prices to rise in line with historical behavior.
Now, we're back with the unpleasant conflict of positive momentum, new breakouts, and still-positive seasonality, but the potential headwind of excessively optimistic sentiment. This has been among the least effective years ever in terms of sentiment analysis, with extremes from January and February having limited impact on the S&P though higher-risk areas saw bigger and longer-lasting declines. There are few signs that the environment has changed, so it may be riskier than usual be use excessive optimism as the sole reason to sell. We'd be leery of becoming too aggressive with long positions just now, however, especially in high-beta sectors.
Active Studies
| Time Frame | Bullish | Bearish | | Short-Term | 2 | 0 | | Medium-Term | 11 | 0 | | Long-Term | 12 | 5 |
|
Indicators at Extremes
Portfolio
| Position | Description | Weight % | Added / Reduced | Date | | Stocks | RSP | 10.7 | Added 6.4% | 2021-10-01 | | Bonds | 32.7% BND, 7.1% SCHP | 39.8 | Added 8.3% | 2021-10-26 | | Commodities | GCC | 2.4 | Reduced 2.1%
| 2020-09-04 | | Precious Metals | GDX | 4.6 | Reduced 4.2% | 2021-05-19 | | Special Situations | 9.8% KWEB, 4.7% XLE, 2.9% PSCE | 17.3 | Added 9.78% | 2021-10-01 | | Cash | | 24.1 | | |
|
Updates (Changes made today are underlined)
Much of our momentum and trend work has remained positive for several months, with some scattered exceptions. Almost all sentiment-related work has shown a poor risk/reward ratio for stocks, especially as speculation drove to record highs in exuberance in February. Much of that has worn off, and most of our models are back toward neutral levels. There isn't much to be excited about here. The same goes for bonds and even gold. Gold has been performing well lately and is back above long-term trend lines. The issue is that it has a poor record of holding onto gains when attempting a long-term trend change like this, so we'll take a wait-and-see approach. Momentum has ebbed quickly in recent weeks, and nearing oversold levels in some indicators. This can be a dangerous area, with a lot of short-term volatility, but we'd be more inclined to add medium- to long-term exposure rather than sell on much more of a decline, thanks to already rock-bottom exposure. Other areas look more attractive, including some overseas markets. RETURN YTD: 11.2% 2020: 8.1%, 2019: 12.6%, 2018: 0.6%, 2017: 3.8%, 2016: 17.1%, 2015: 9.2%, 2014: 14.5%, 2013: 2.2%, 2012: 10.8%, 2011: 16.5%, 2010: 15.3%, 2009: 23.9%, 2008: 16.2%, 2007: 7.8%
|
|
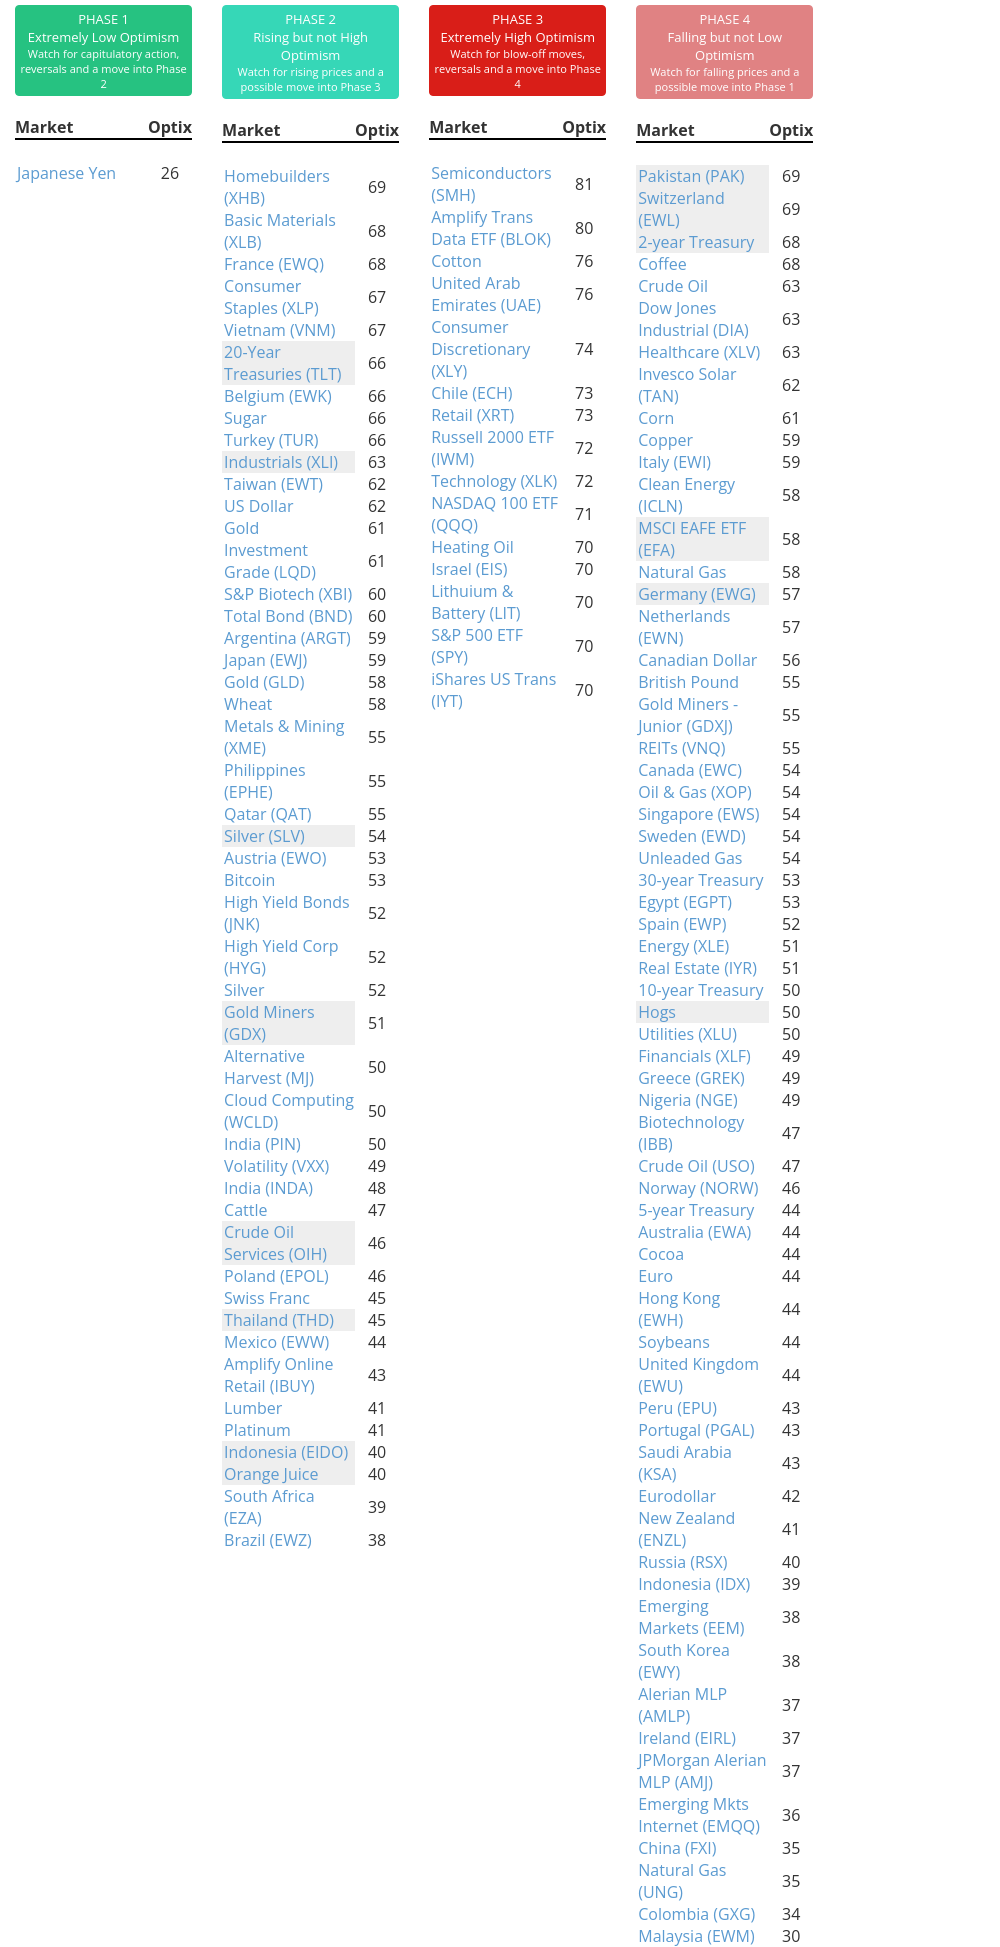
Phase Table
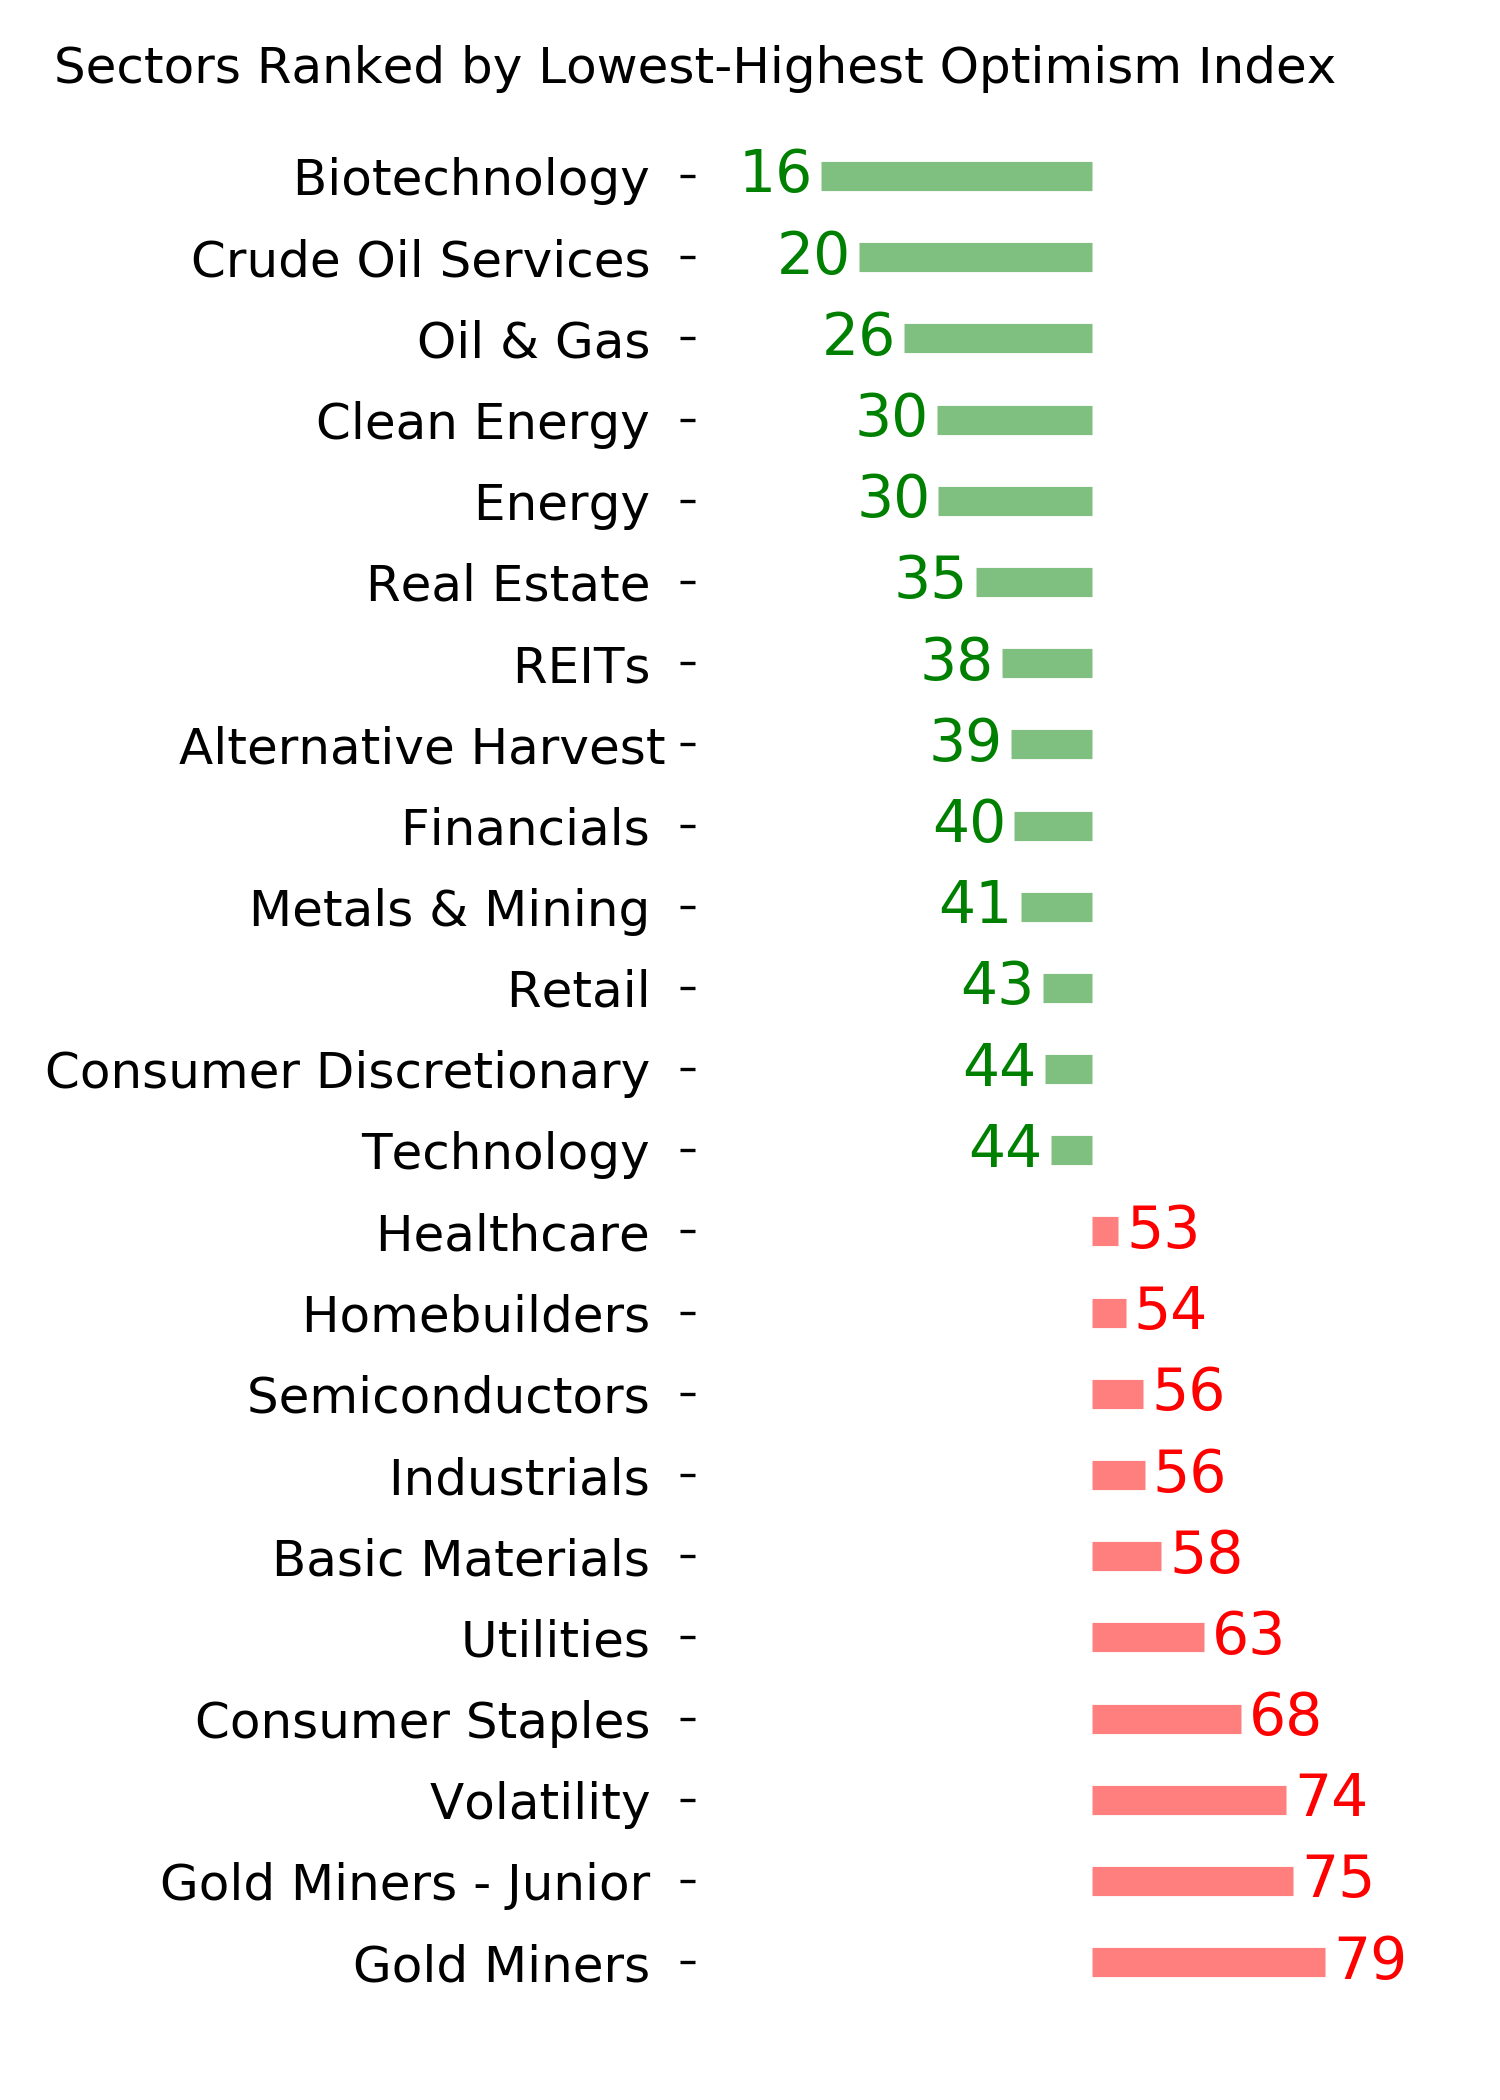
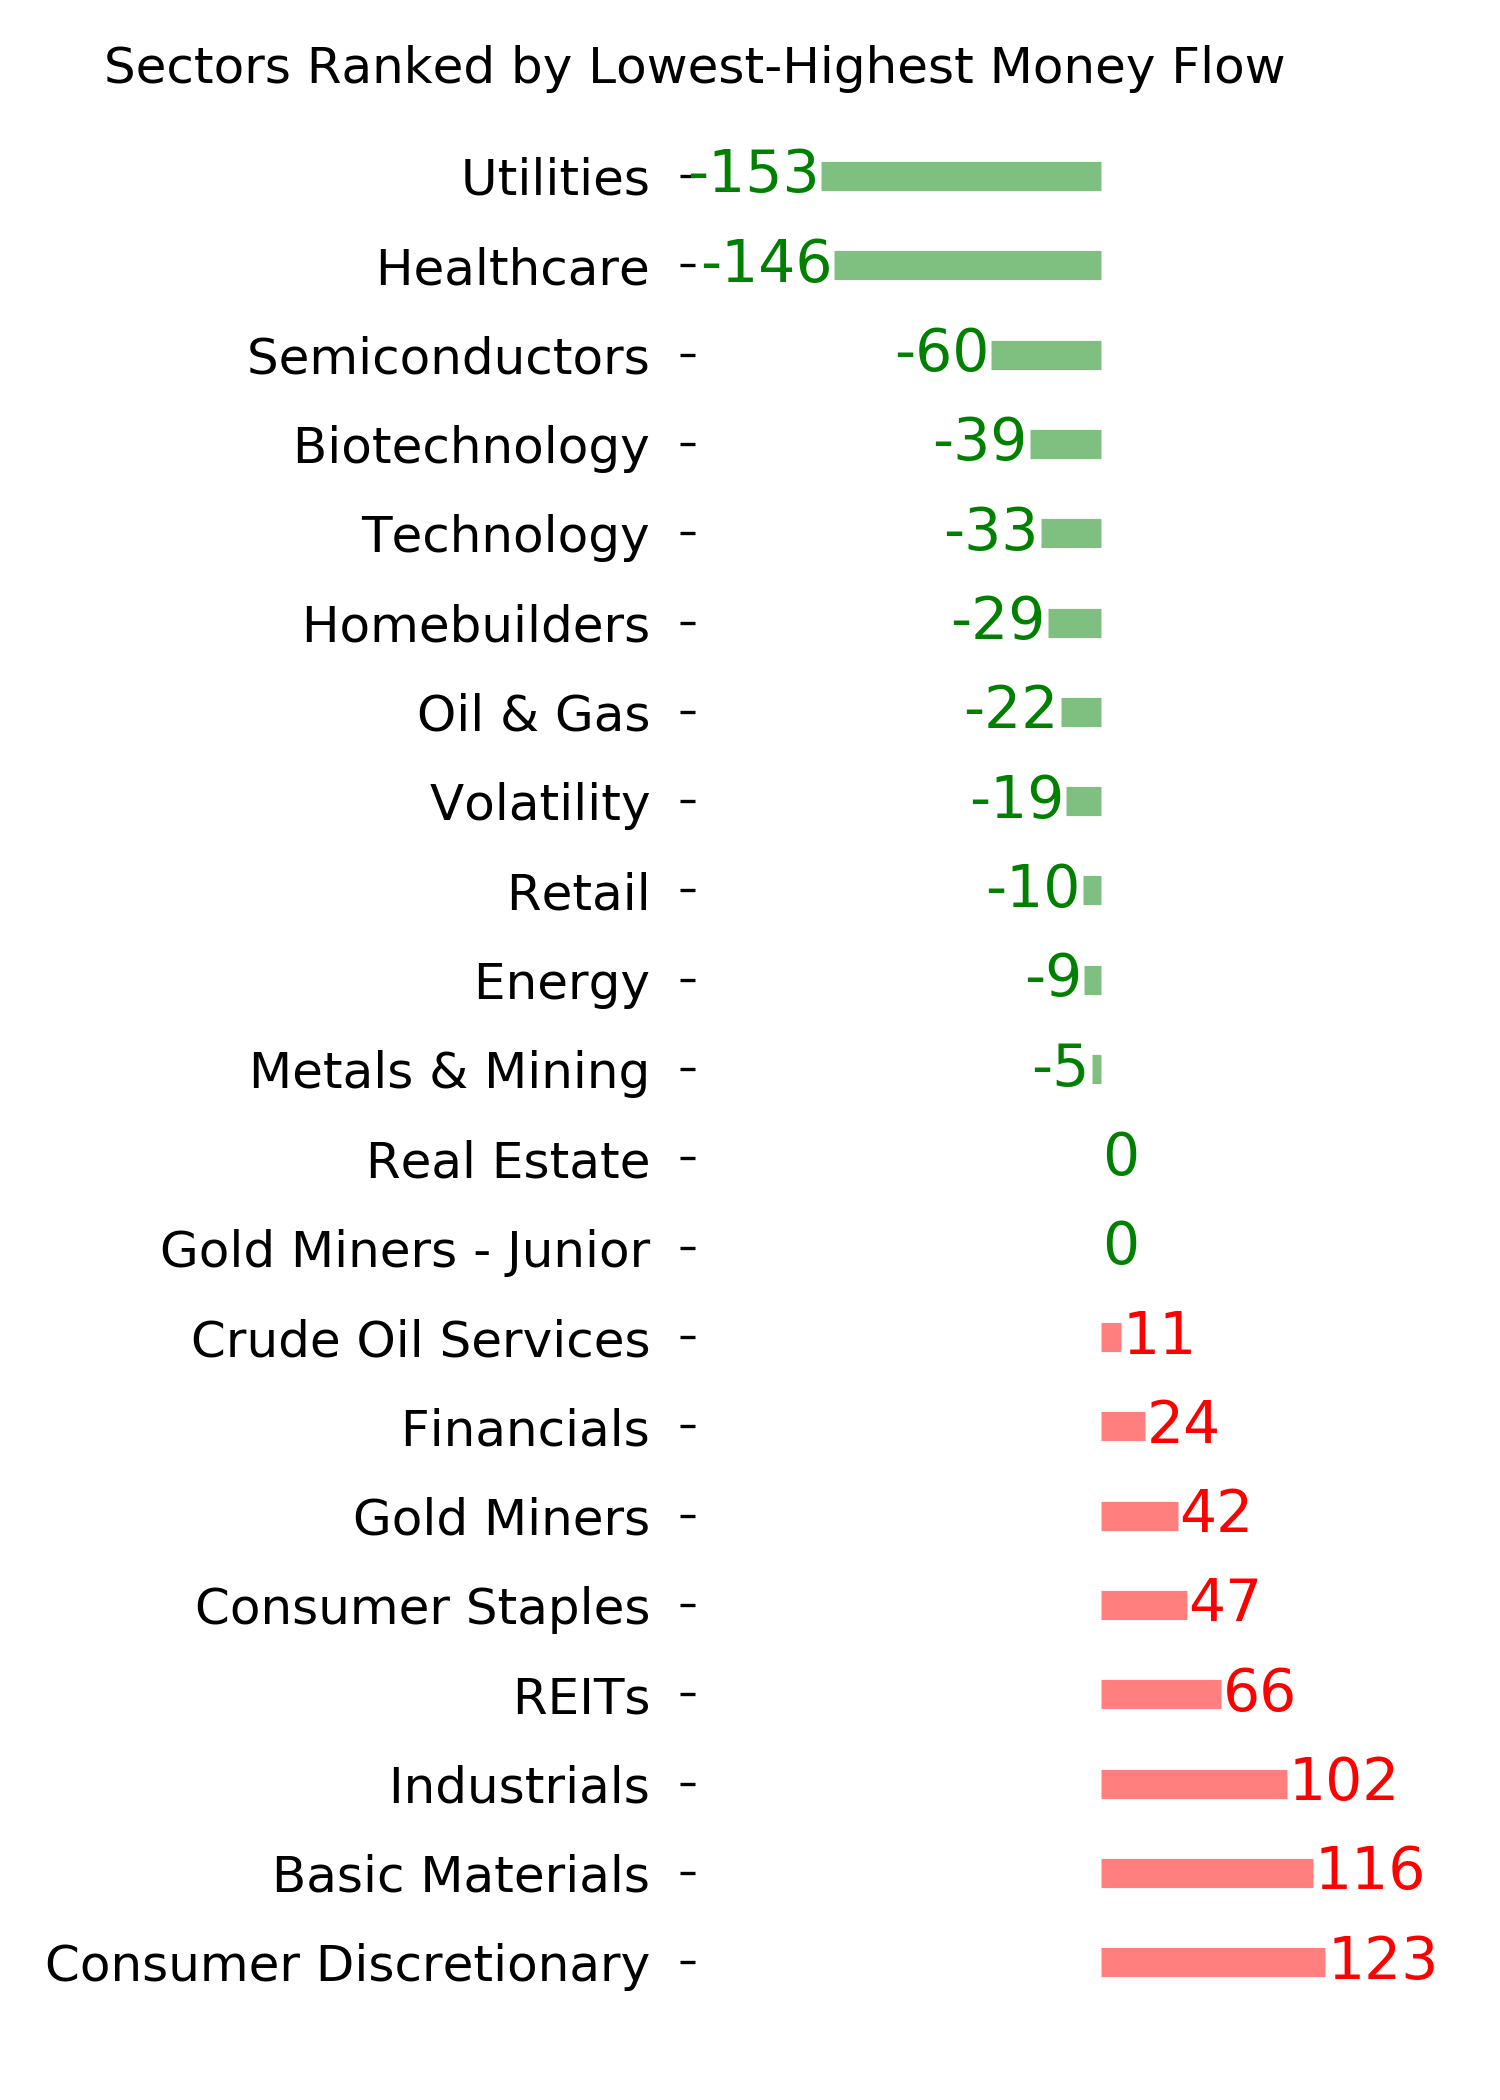
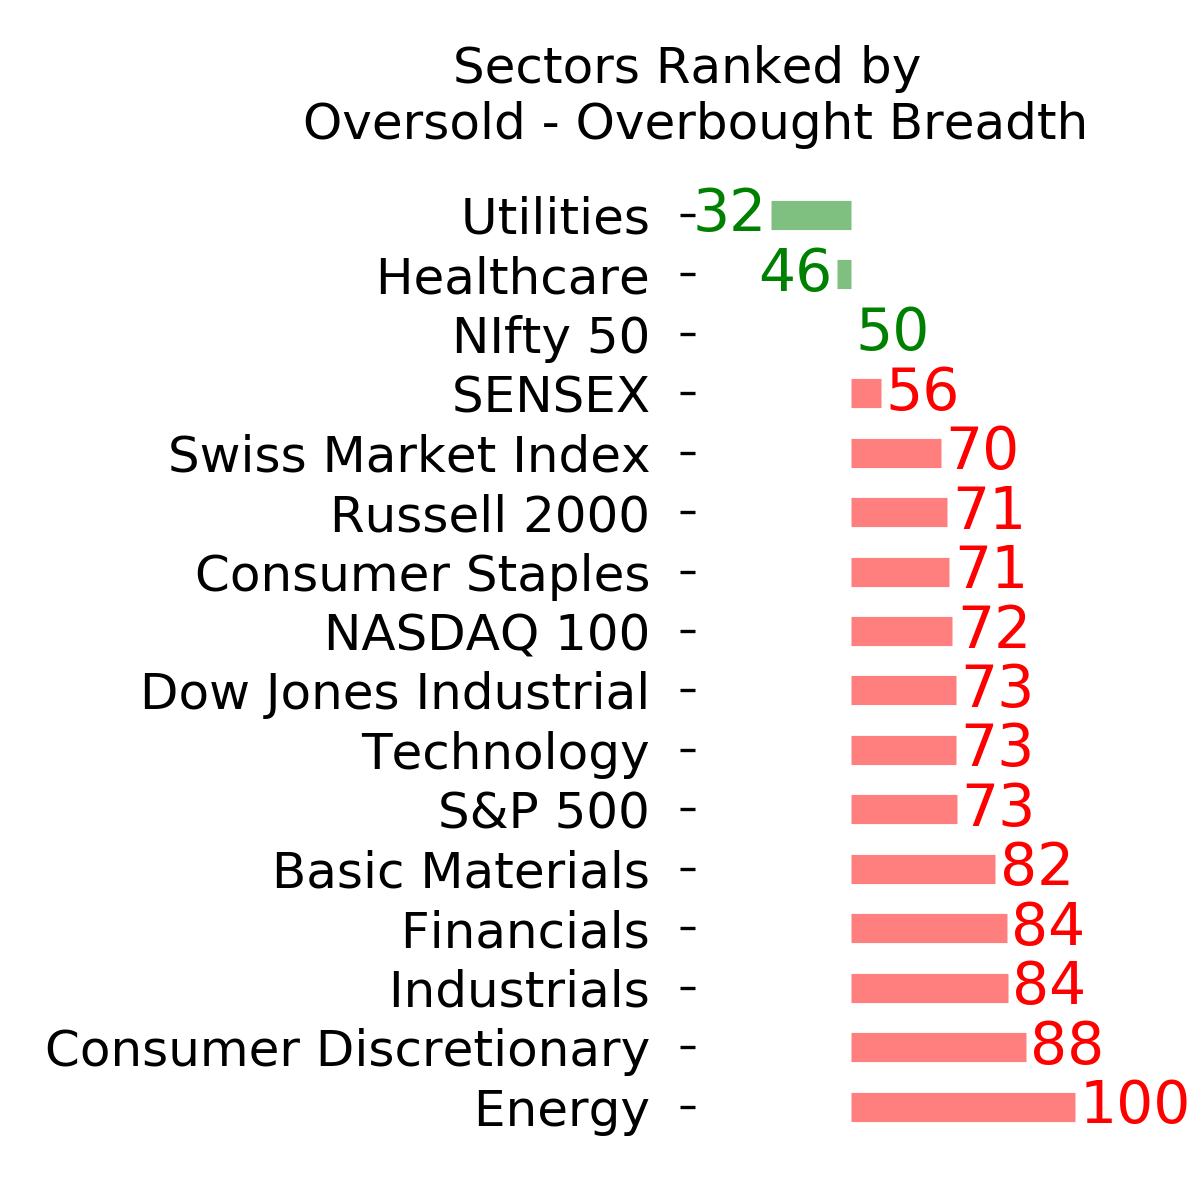
Ranks
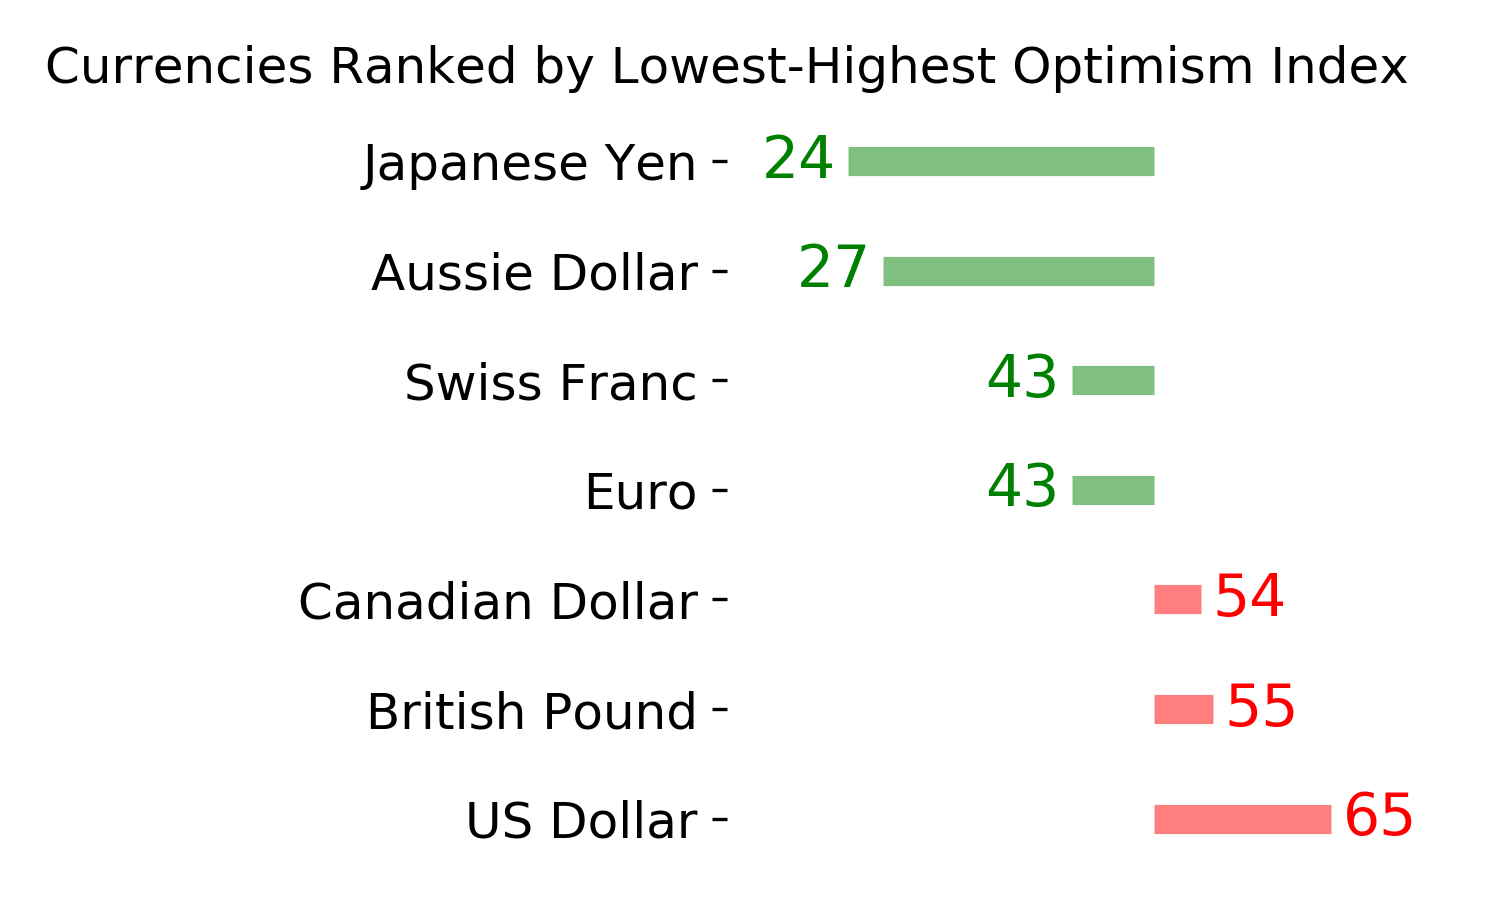
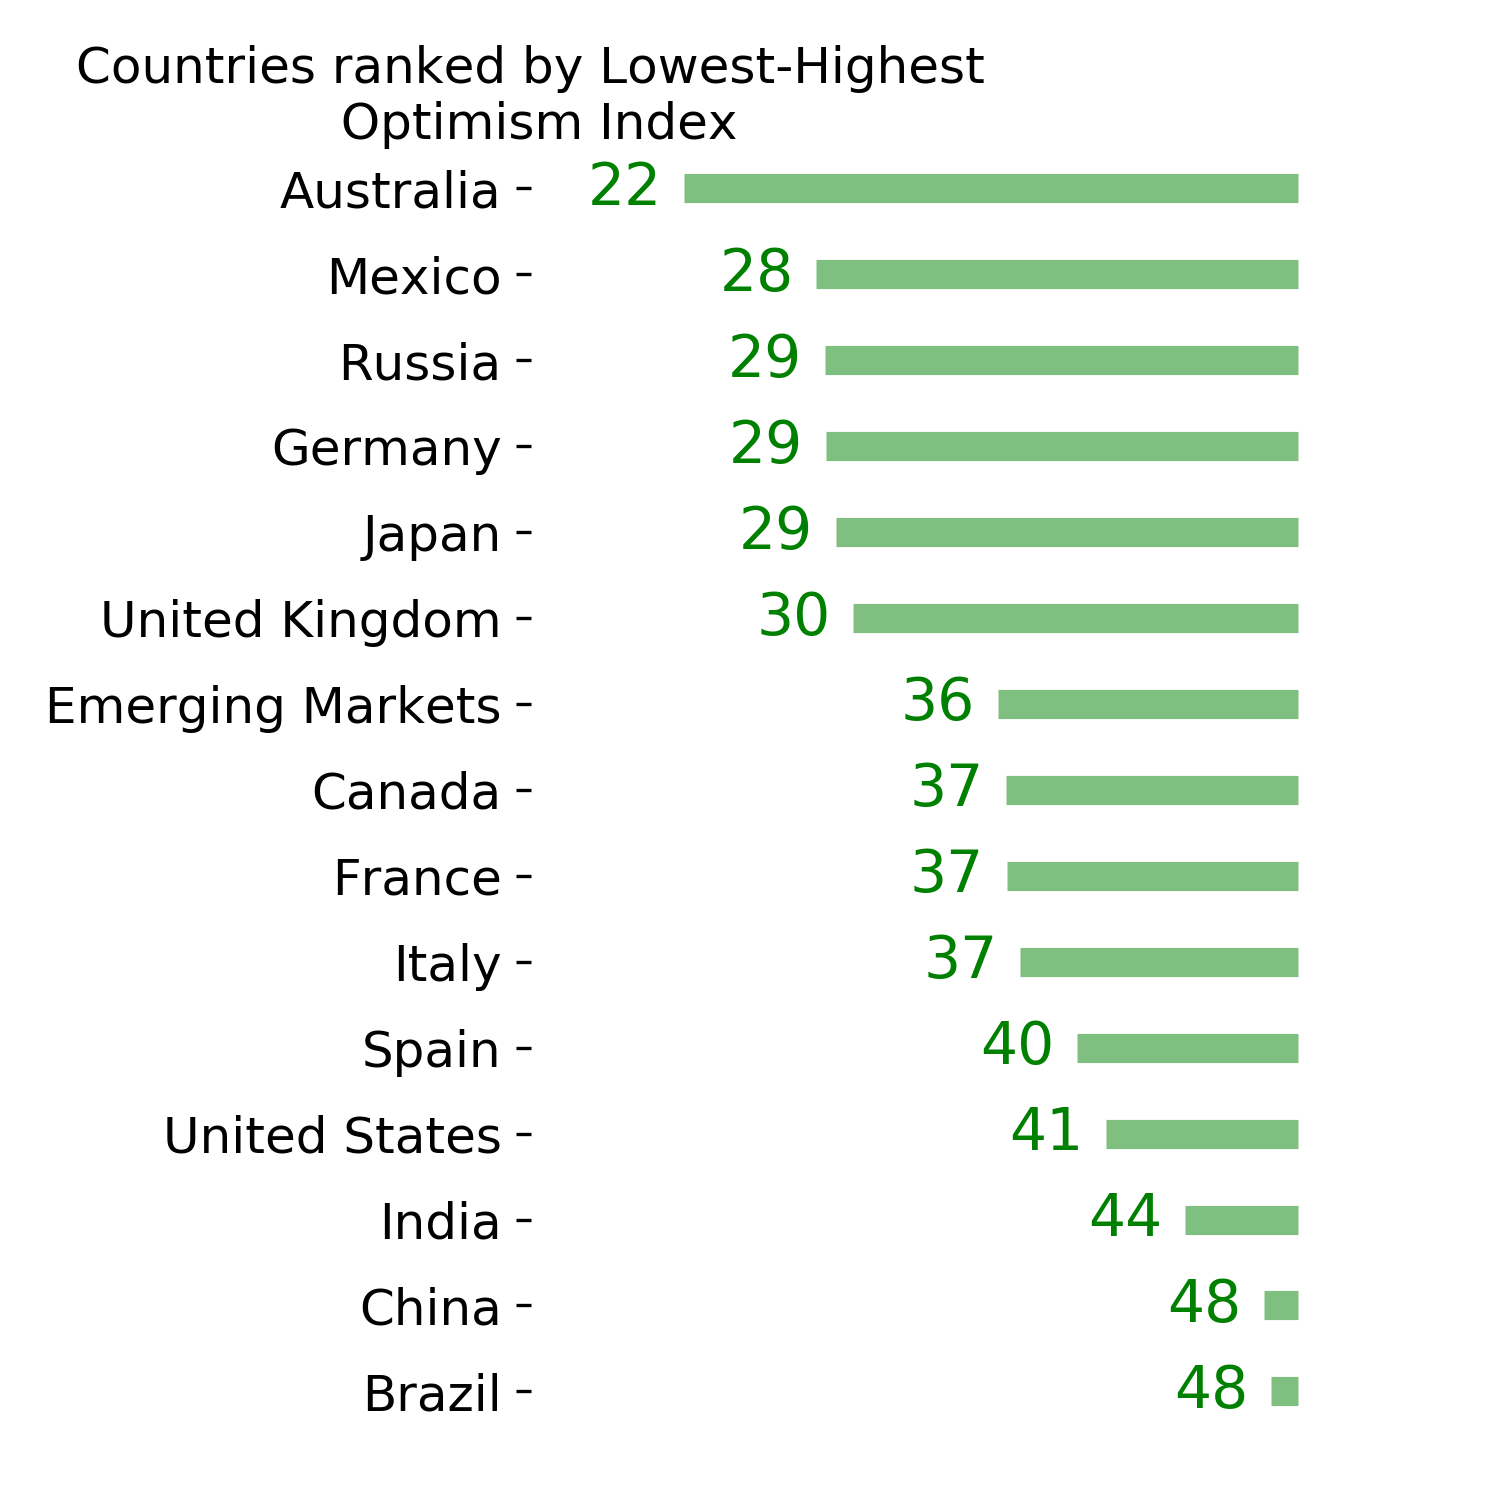
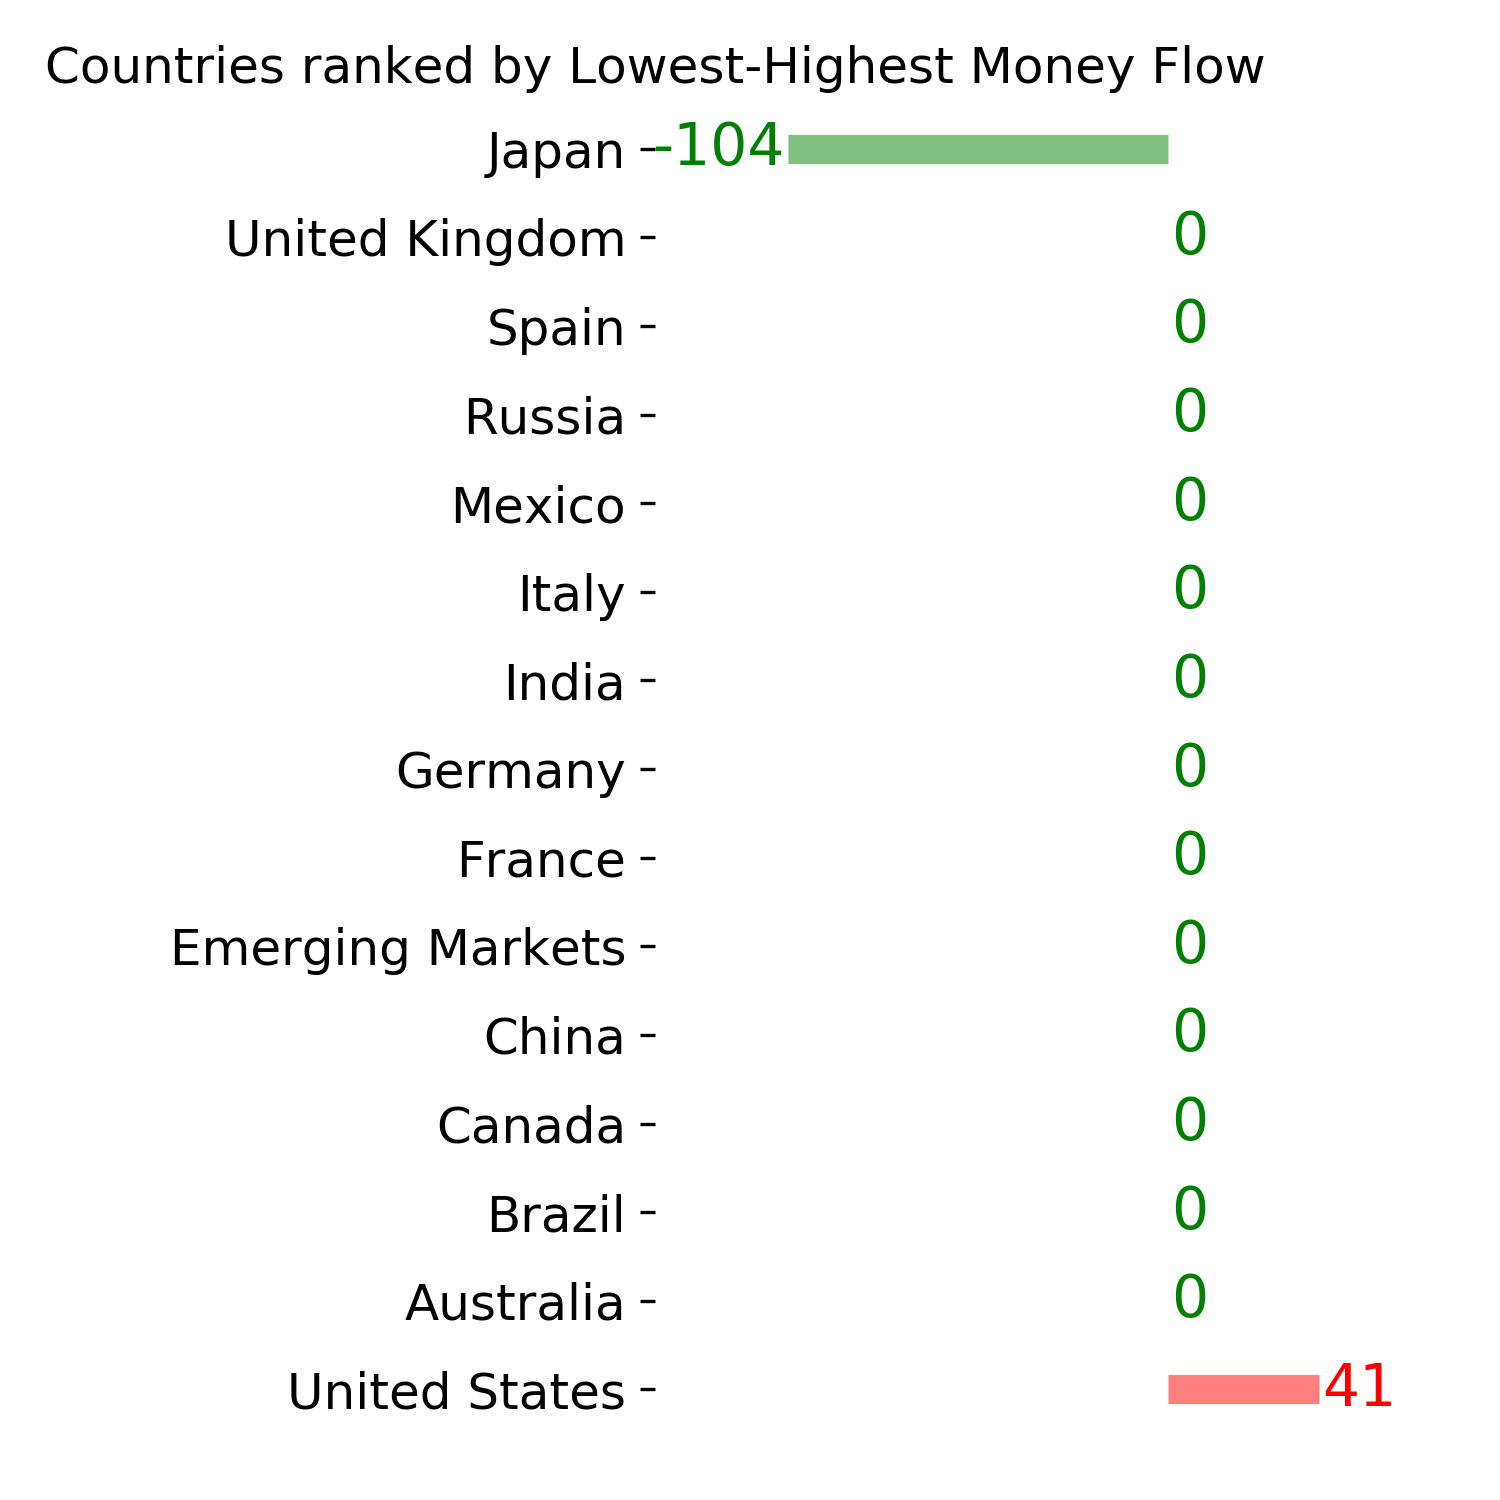
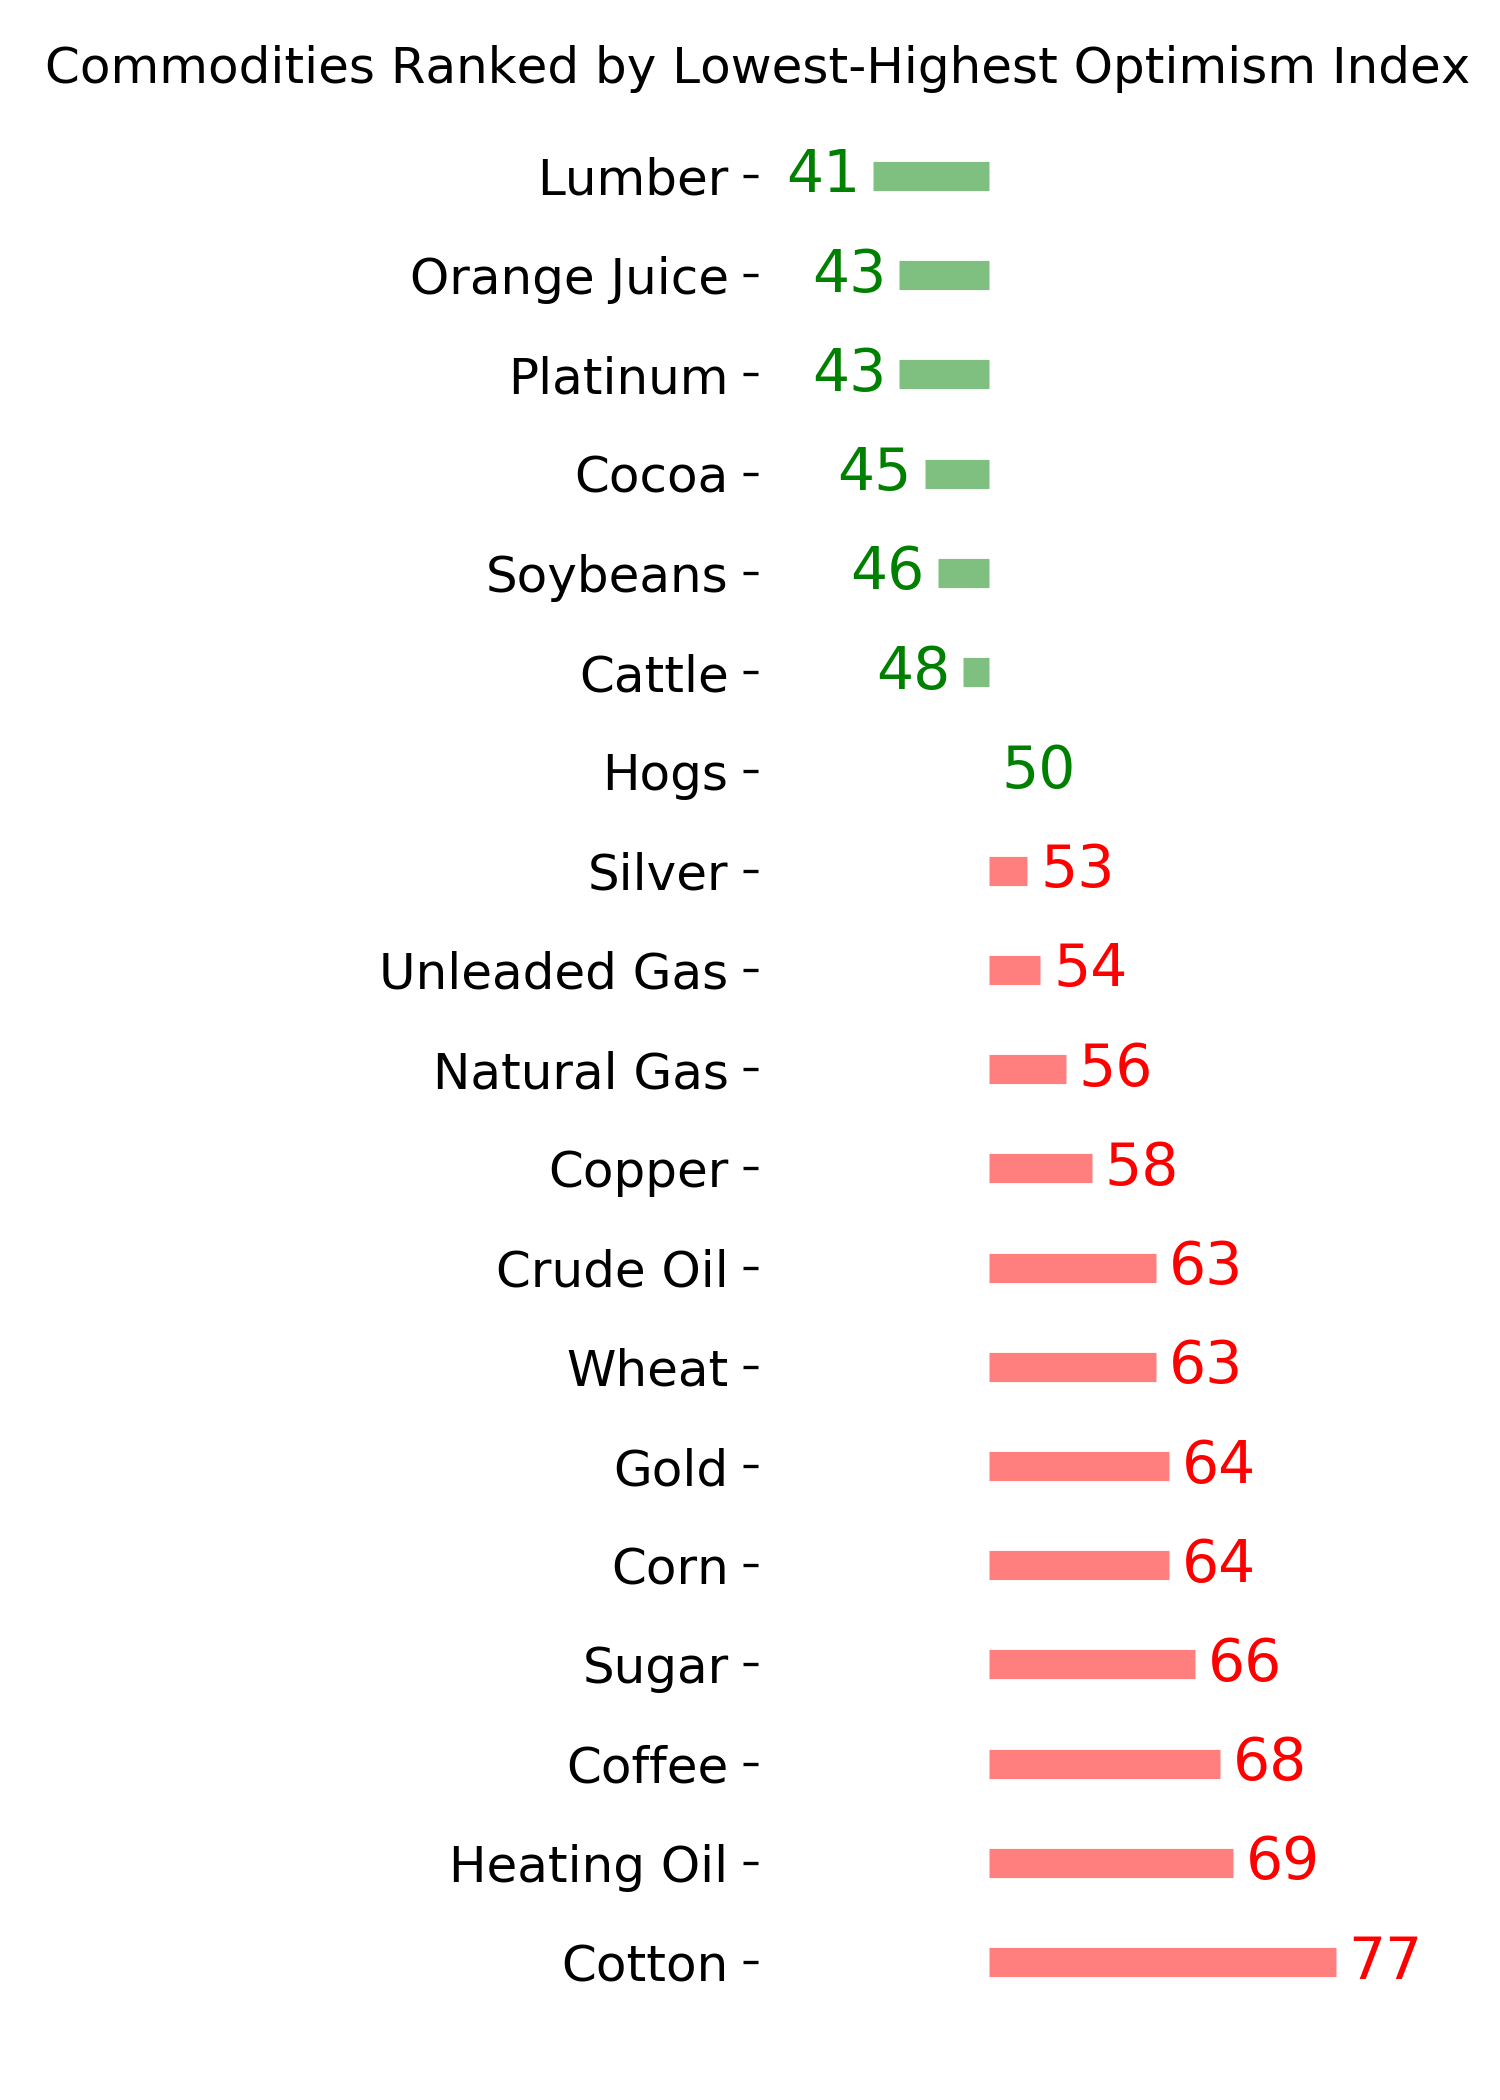
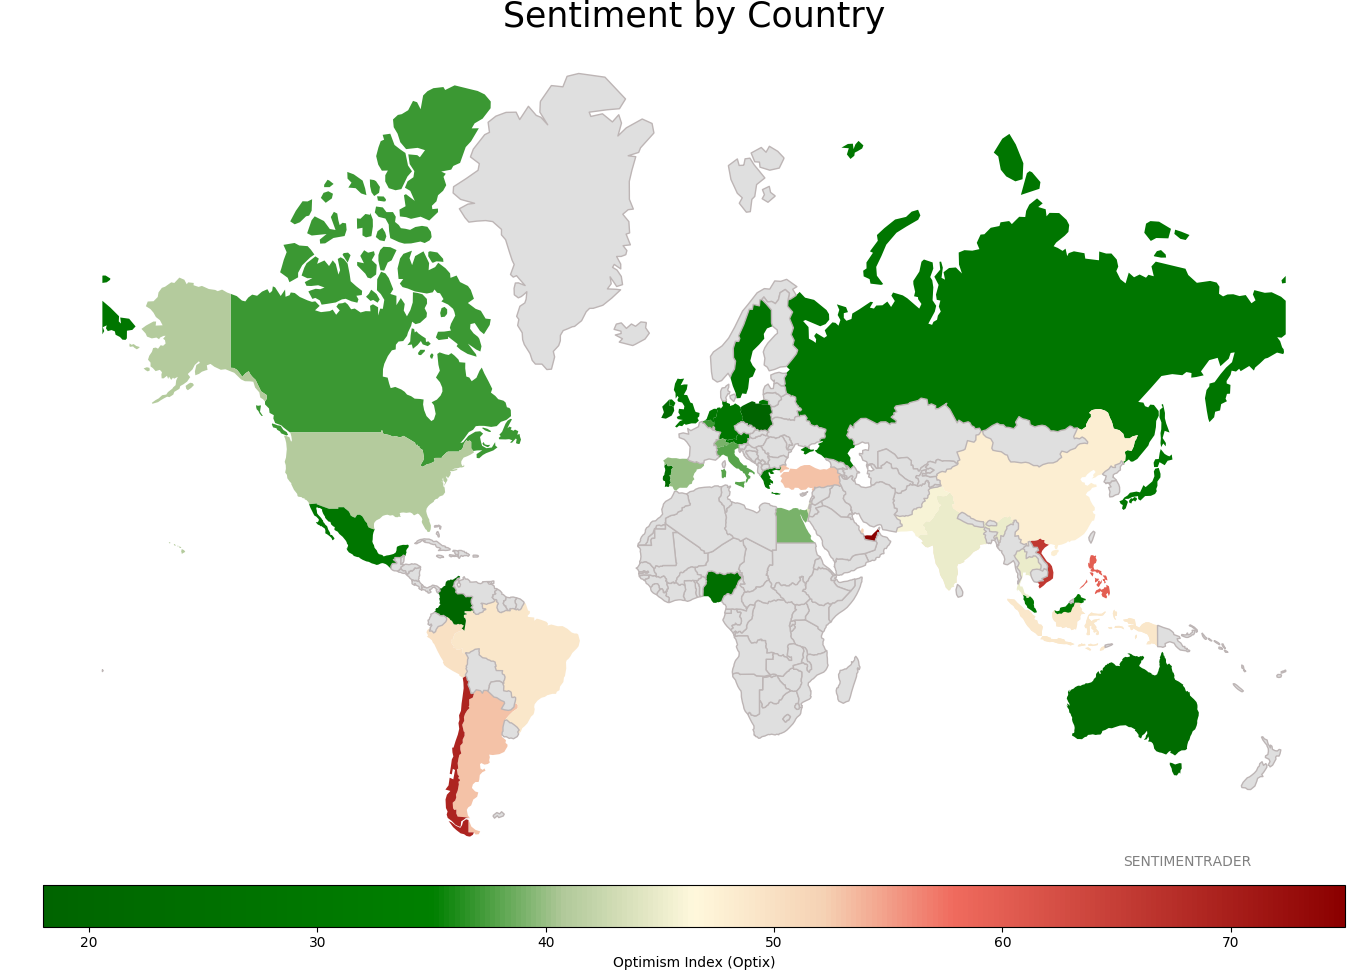
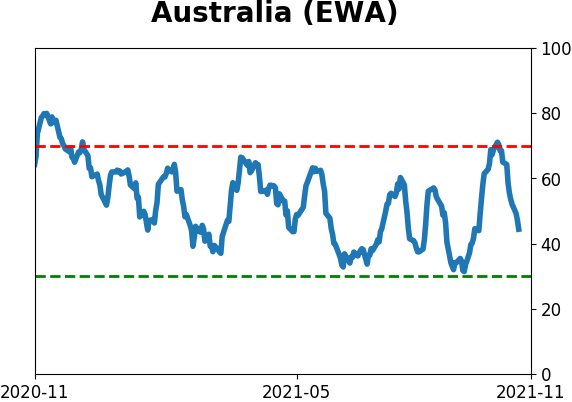
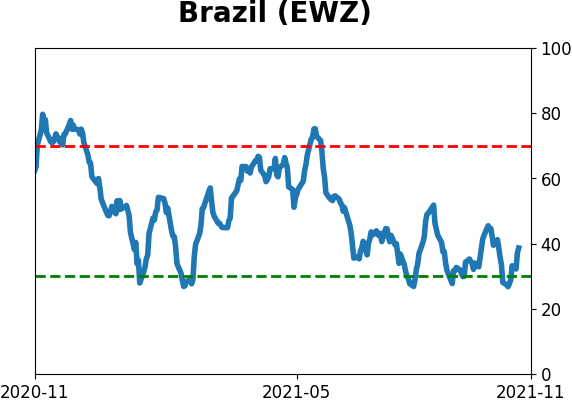
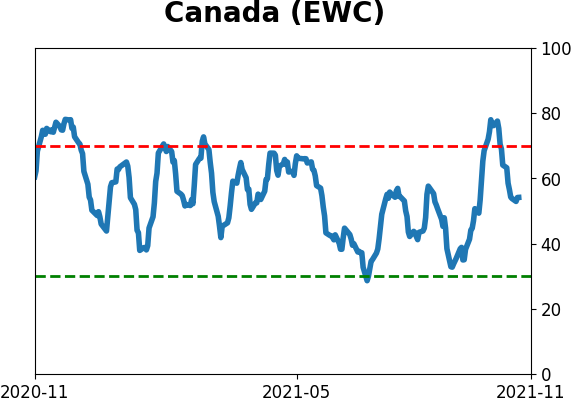
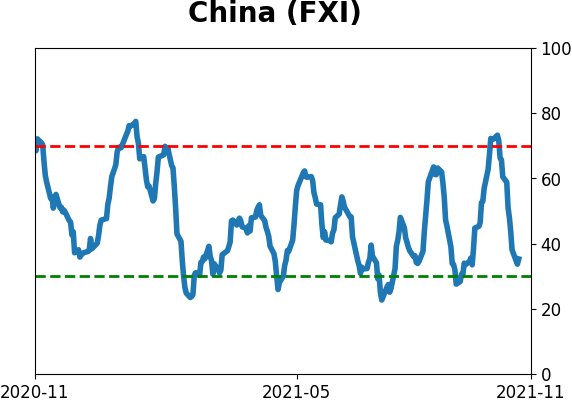
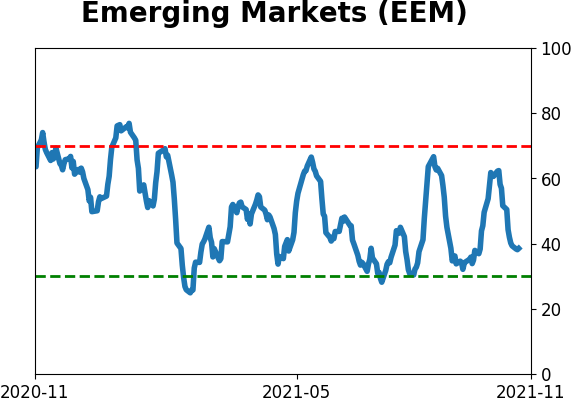
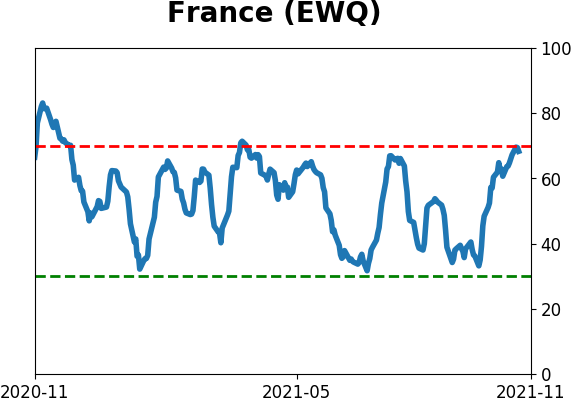
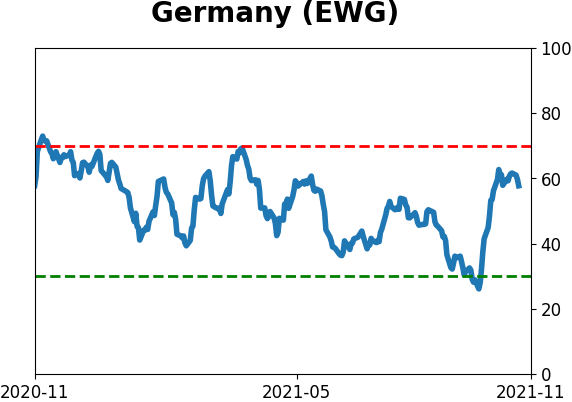
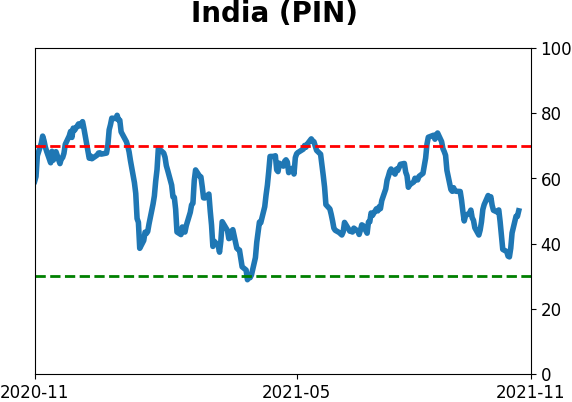
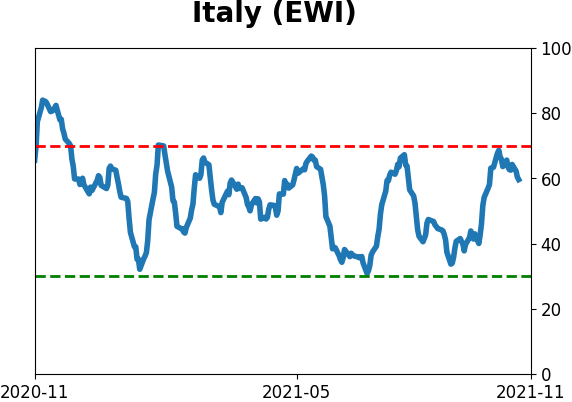
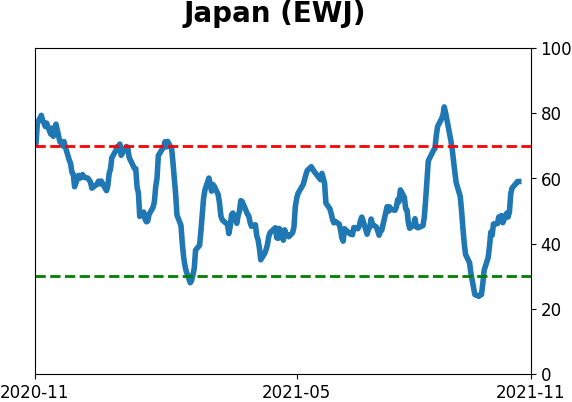
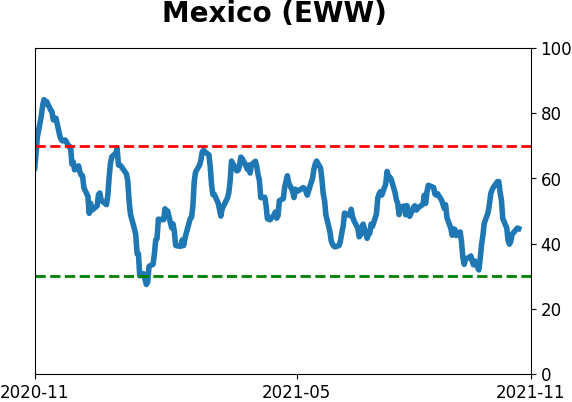
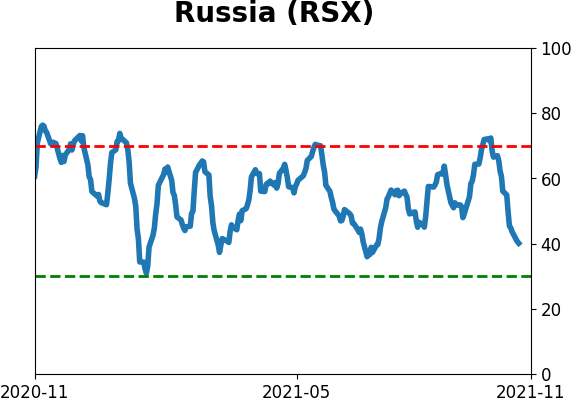
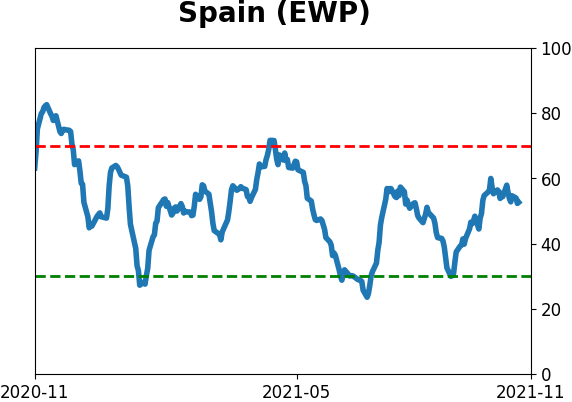
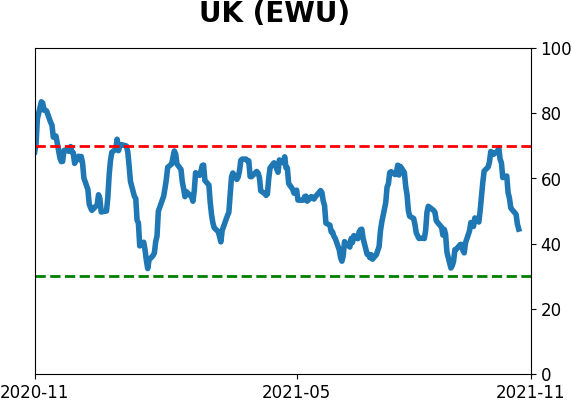
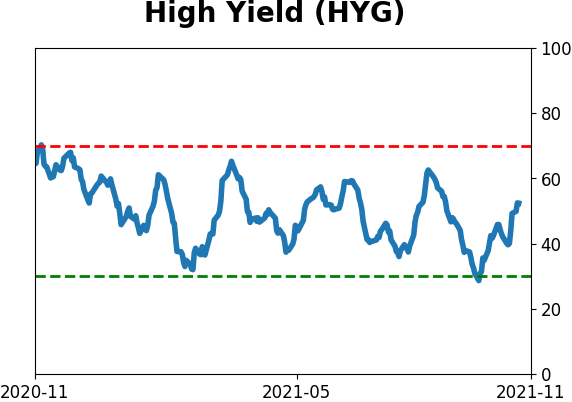
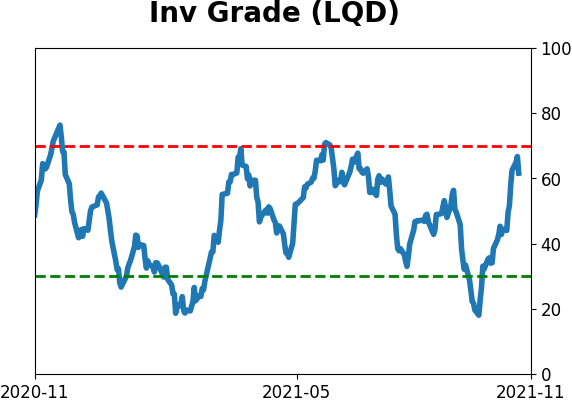
Sentiment Around The World
Optimism Index Thumbnails
|
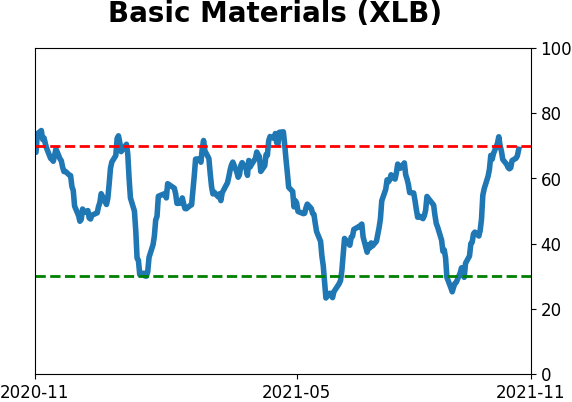
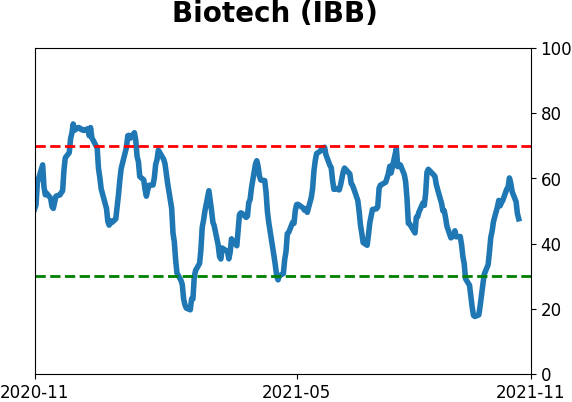
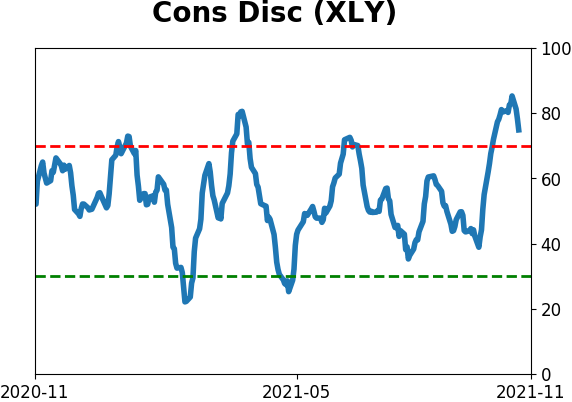
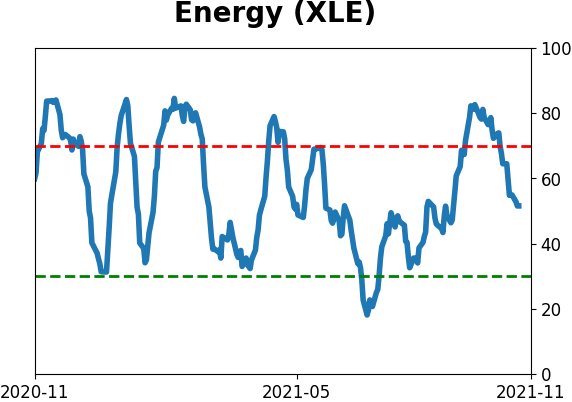
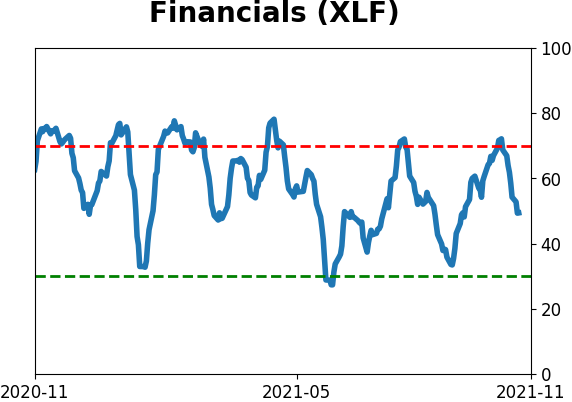
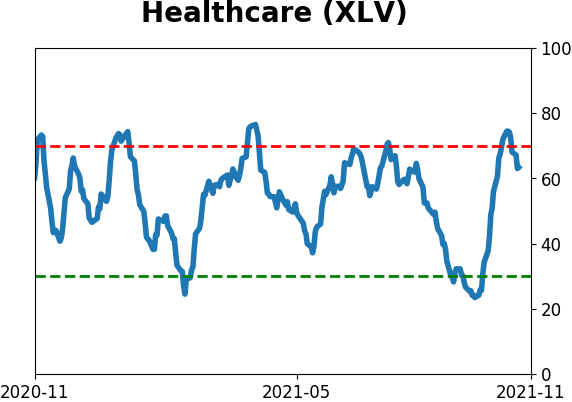
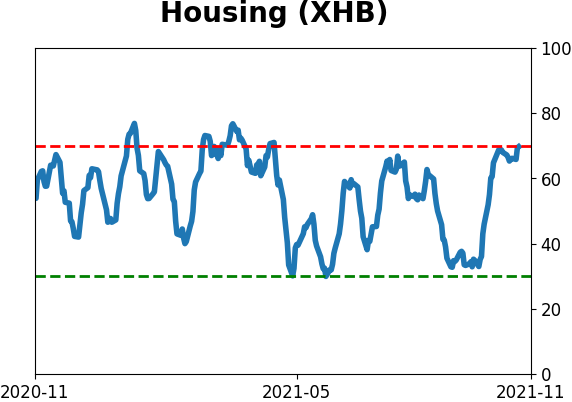
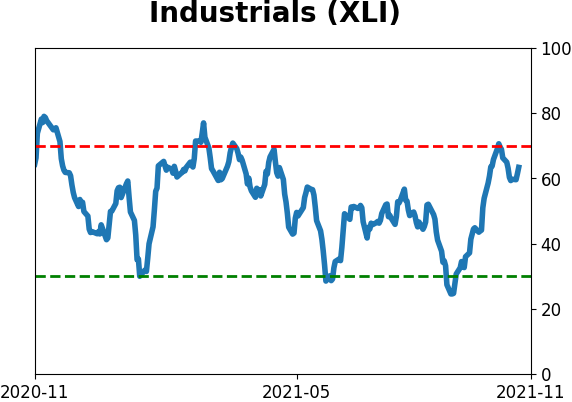
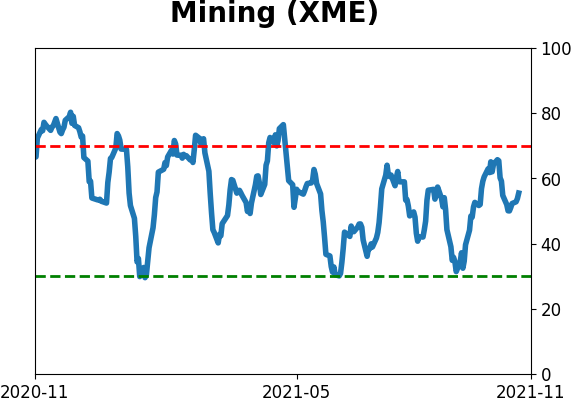
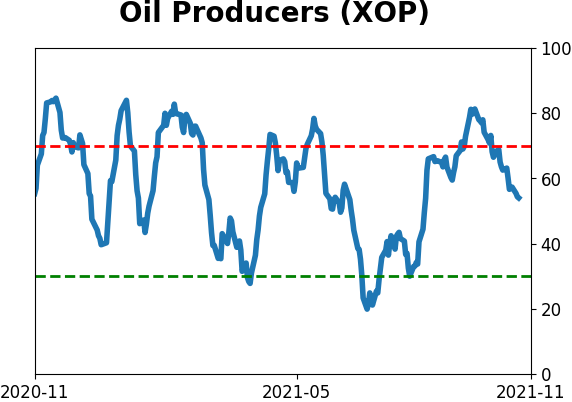
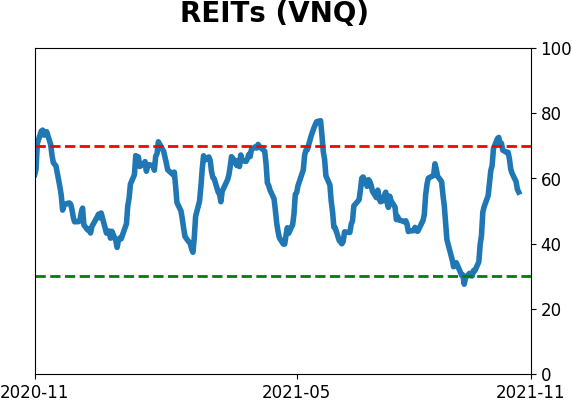
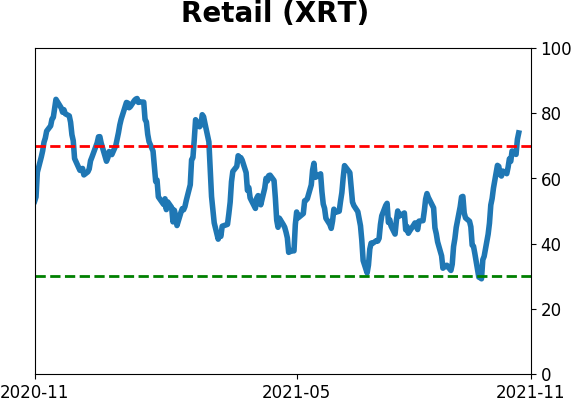
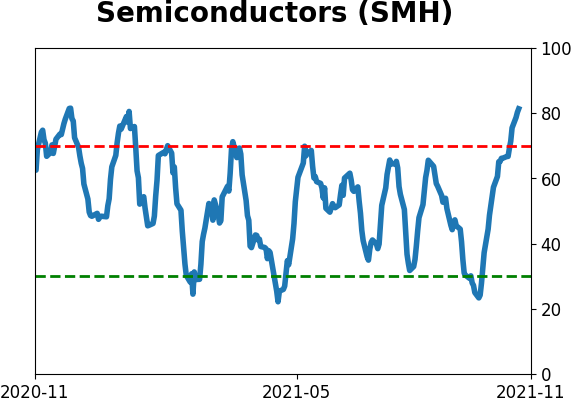
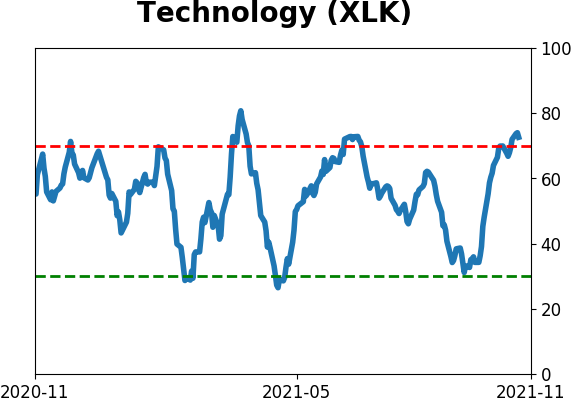
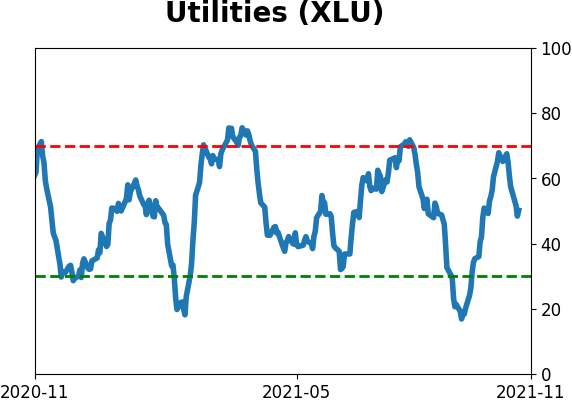
Sector ETF's - 10-Day Moving Average
|
|
|
Country ETF's - 10-Day Moving Average
|
|
|
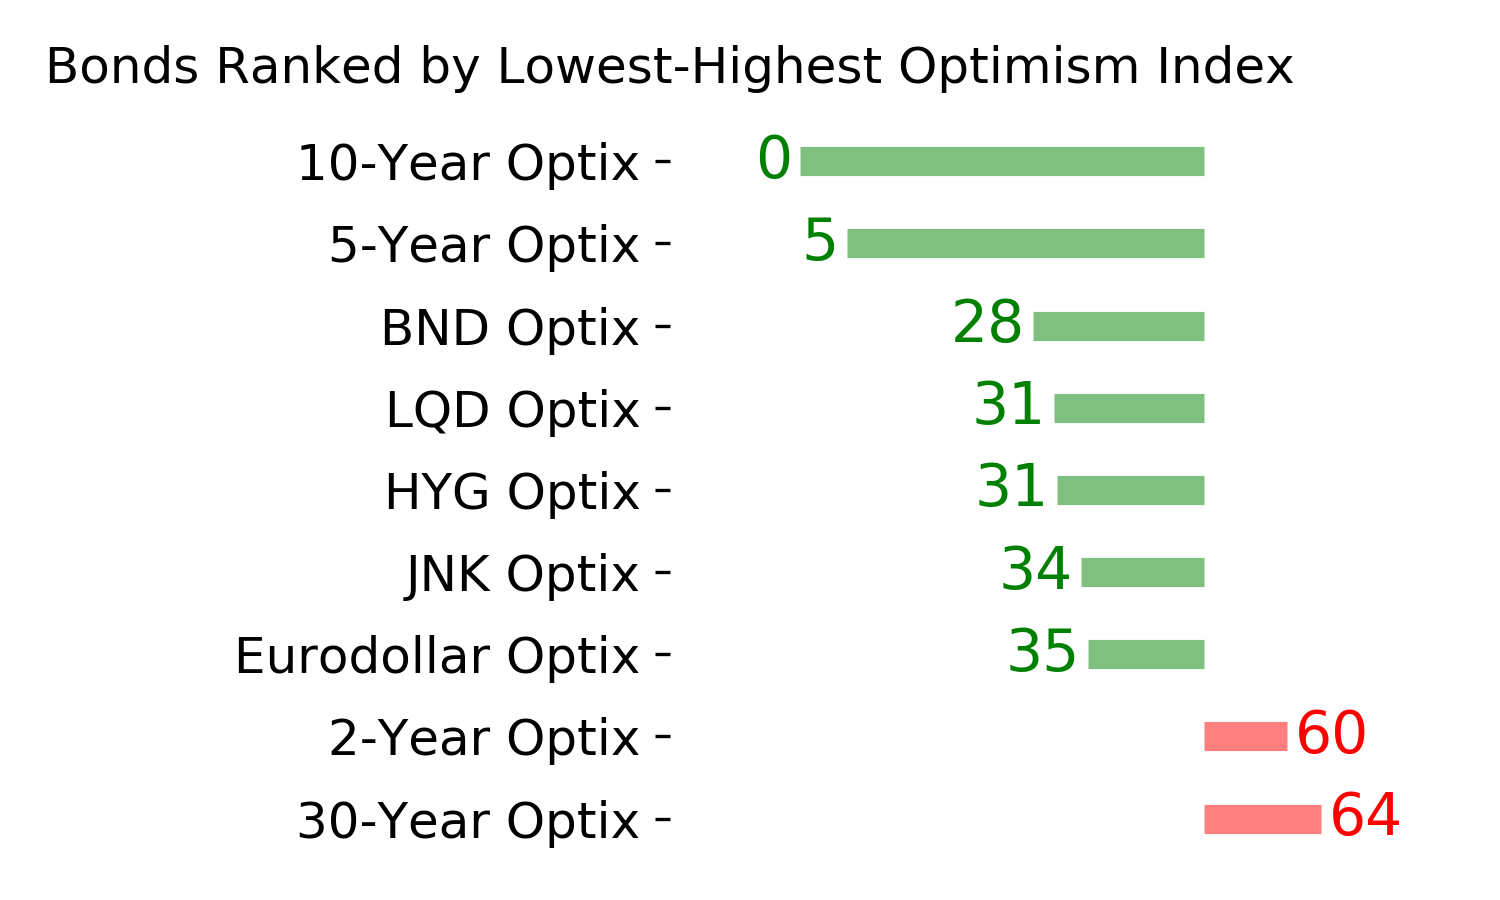
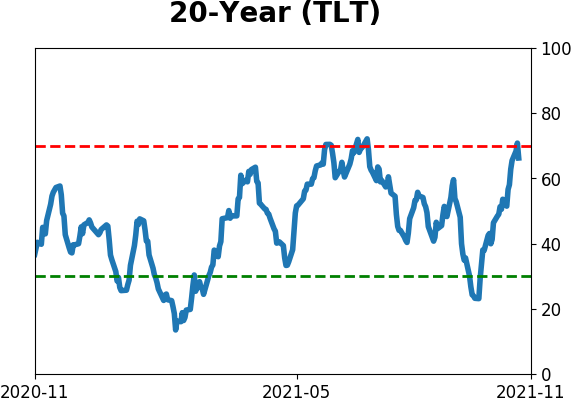
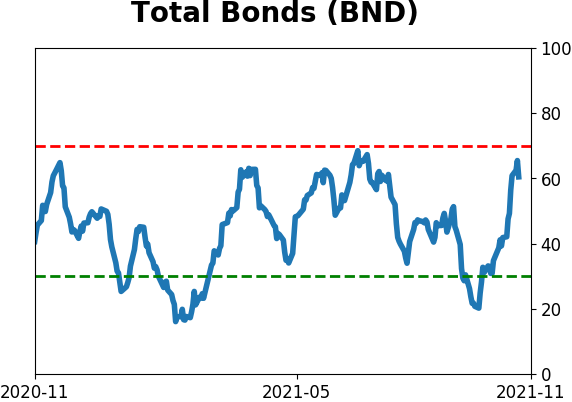
Bond ETF's - 10-Day Moving Average
|
|
|
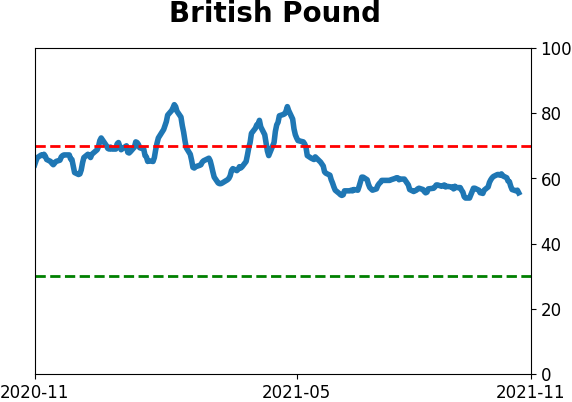
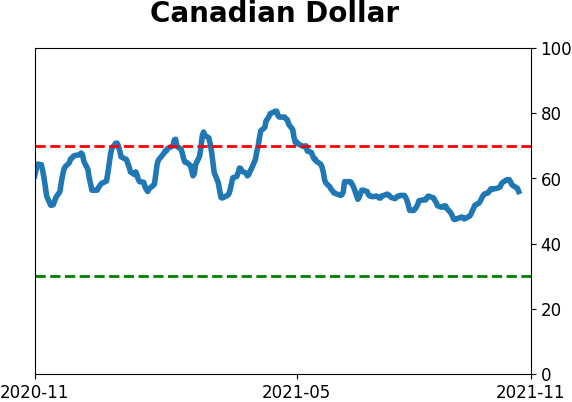
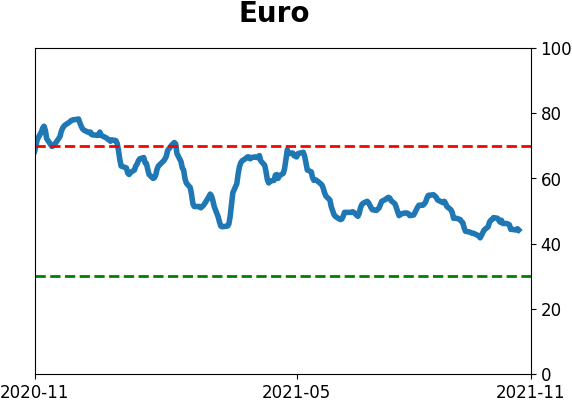
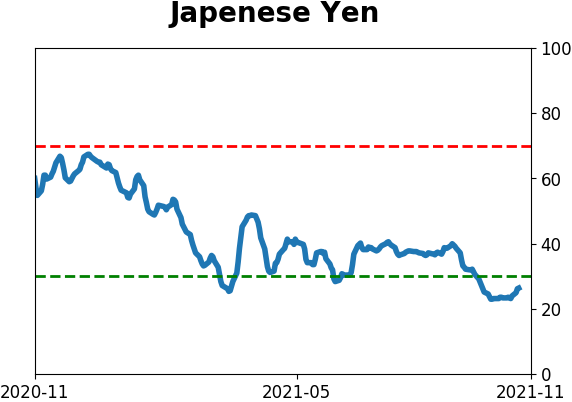
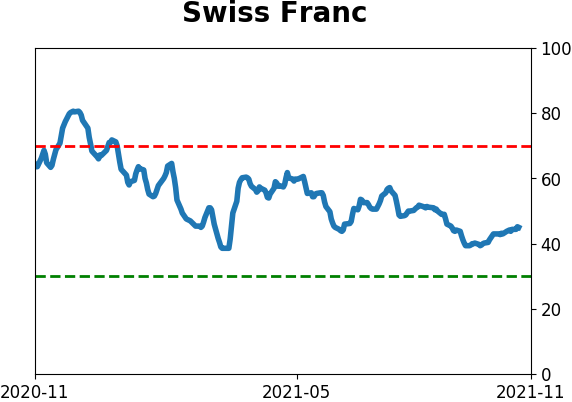
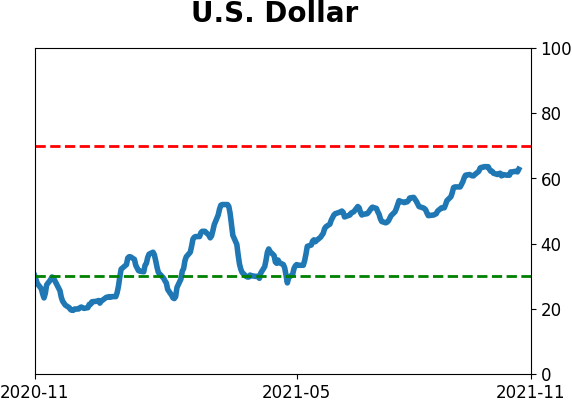
Currency ETF's - 5-Day Moving Average
|
|
|
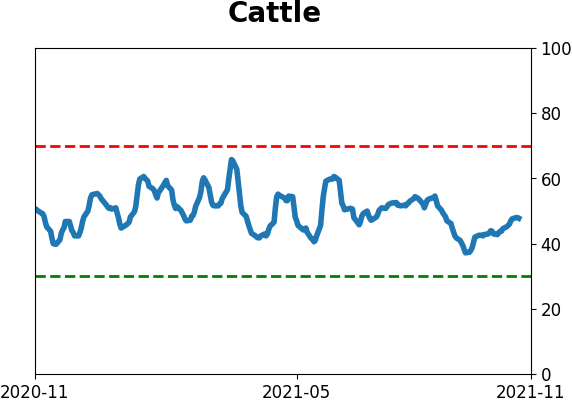
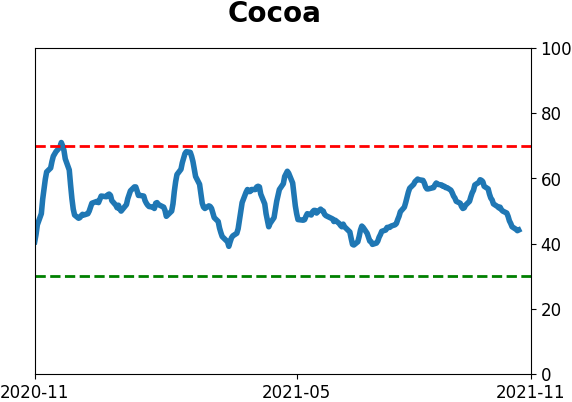
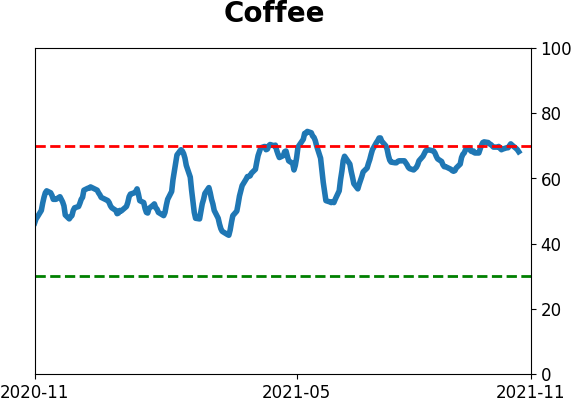
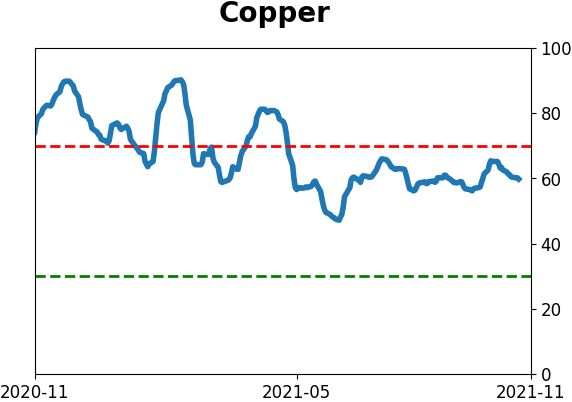
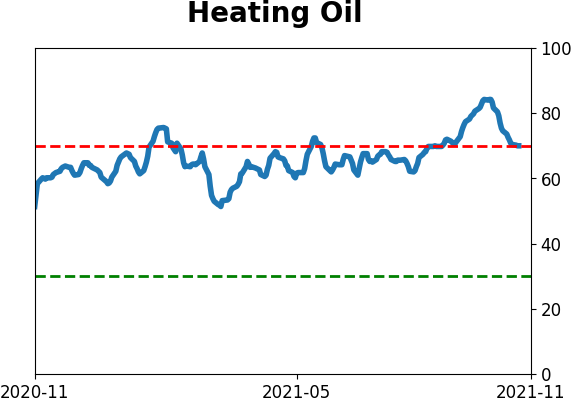
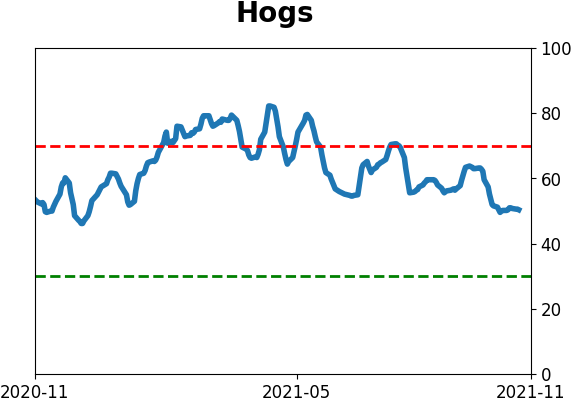
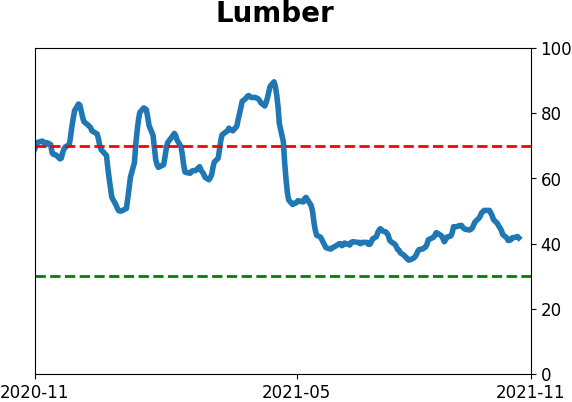
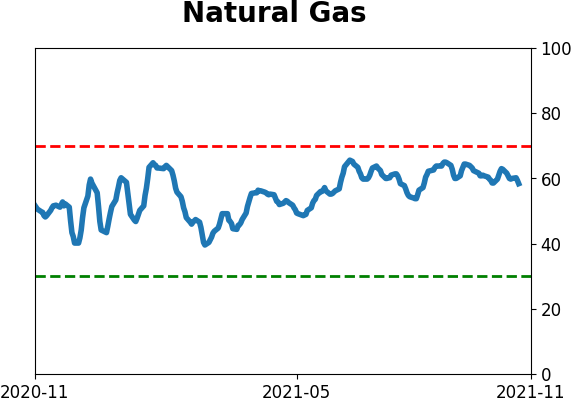
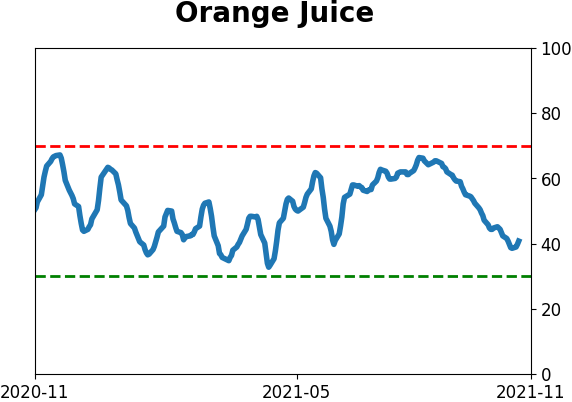
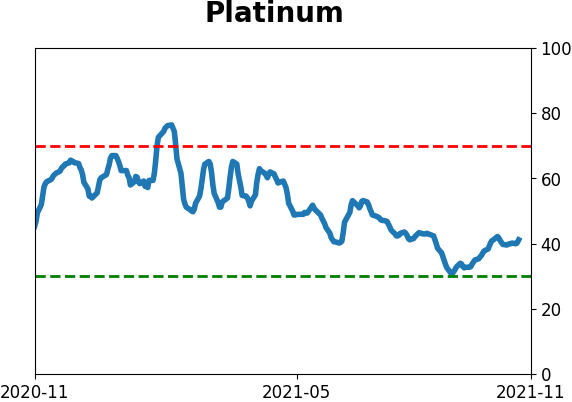
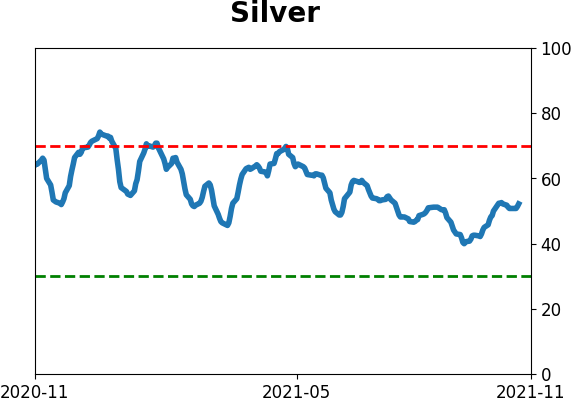
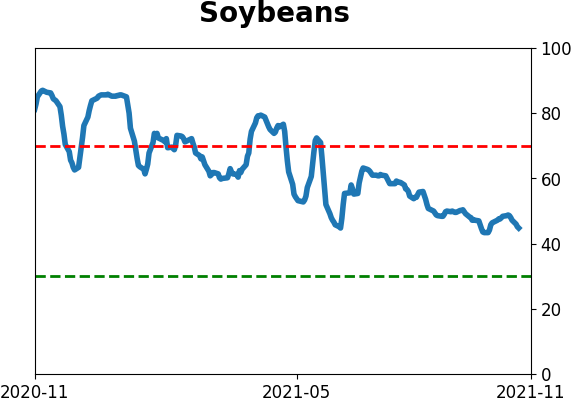
Commodity ETF's - 5-Day Moving Average
|
|