Headlines
|
|
Nasdaq's Summation Index turns positive for first time in months:
Momentum in stocks on the Nasdaq exchange has been positive enough to turn its McClellan Summation Index positive for the first time in months. Previous signals preceded long-term gains in the Composite index.
Bottom Line:
STOCKS: Hold By early October, sentiment had reset. Several important momentum streaks ended, which has brought in buyers in the past, and seasonality turned positive. We're now seeing signs that sentiment has quickly shifted, especially among options traders. It's gotten to an extreme that has preceded weaker-than-average returns.
BONDS: Hold In late October, sentiment on bonds - from Treasuries to corporates - entered pessimistic territory. It's now starting to recover, with some quick moves in corporate bonds. We'll see if those bonds, in particular, can hold recent gains.
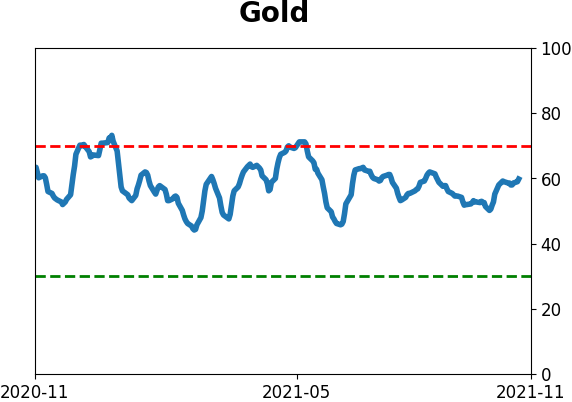
GOLD: Hold
Gold and miners were rejected after trying to recover above their 200-day averages in May. Some oversold extremes in breadth measures among miners triggered in late September, and they've recovered a bit since then. The group still has some proving to do.
|
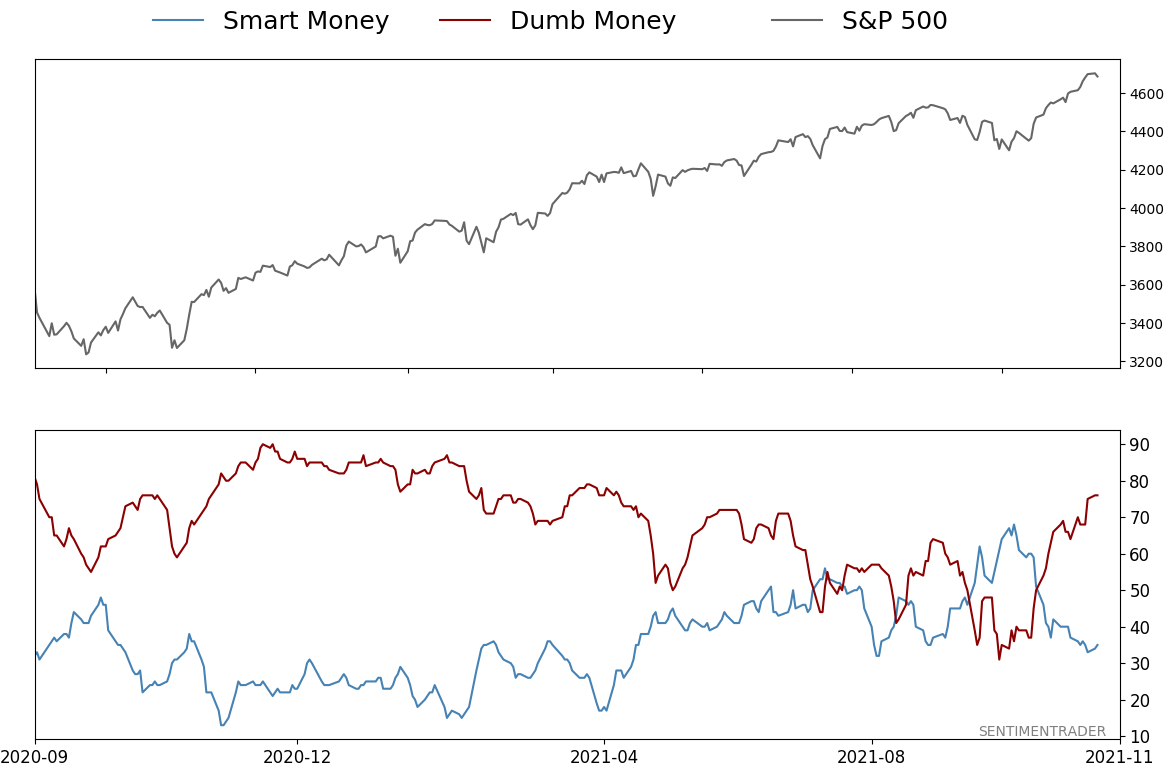
Smart / Dumb Money Confidence
|
Smart Money Confidence: 35%
Dumb Money Confidence: 76%
|
|
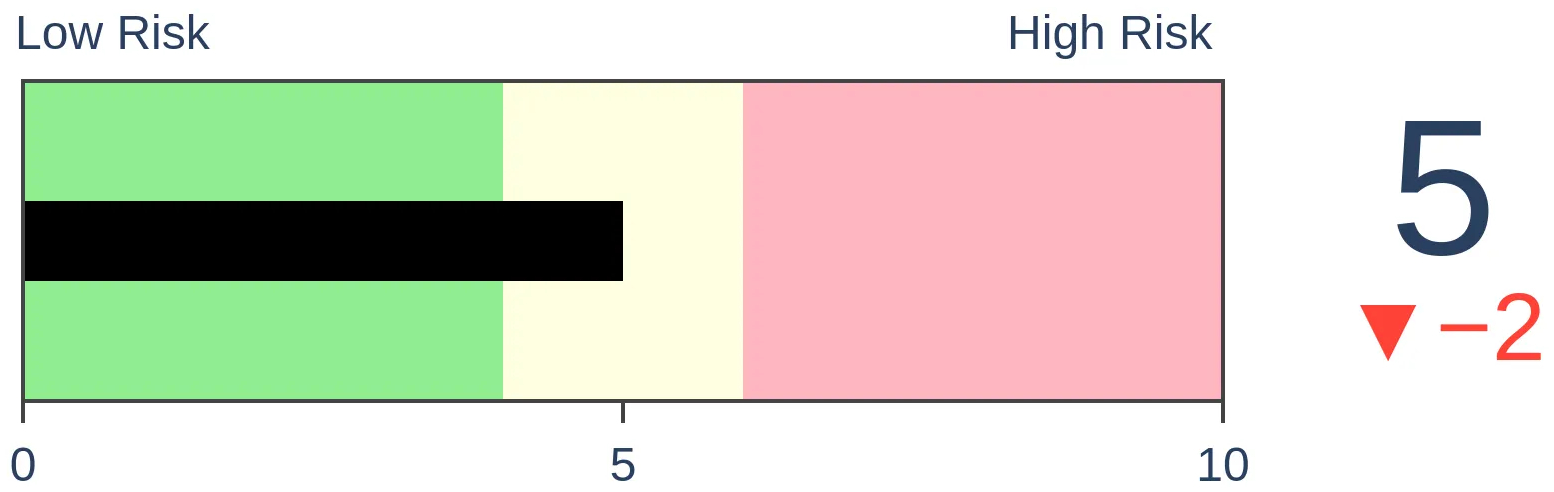
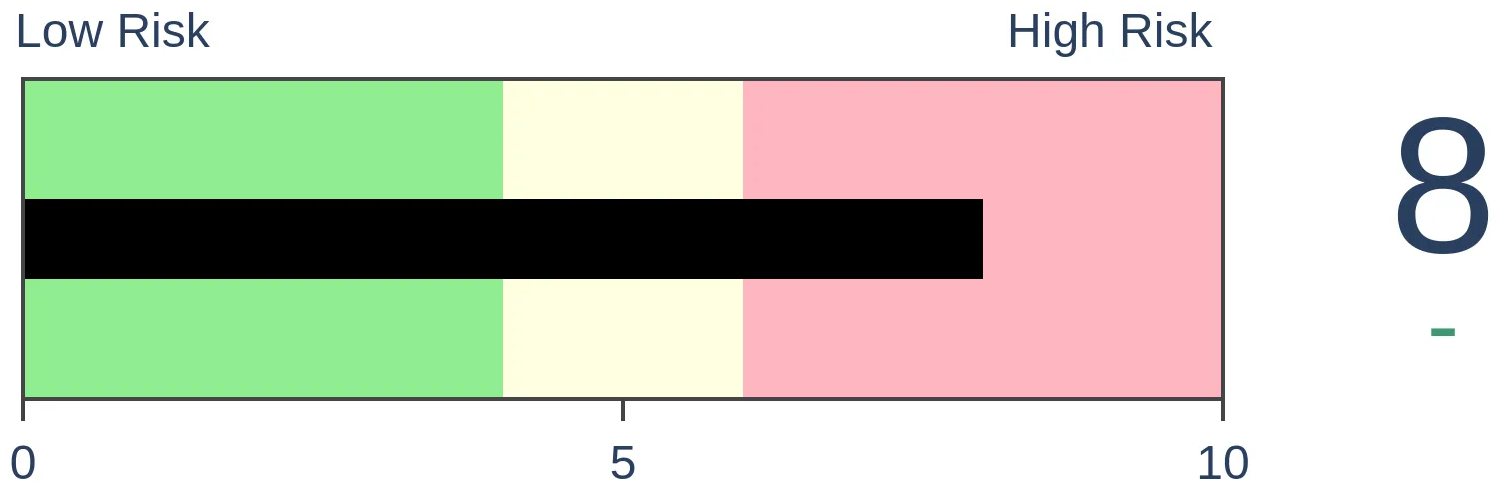
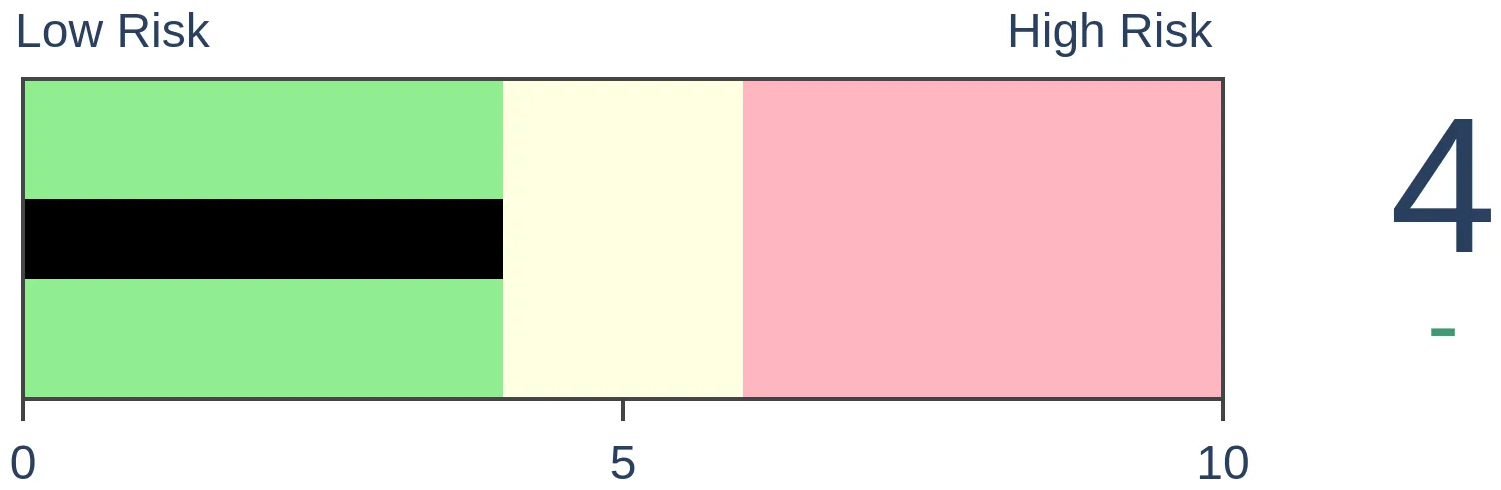
Risk Levels
Stocks Short-Term
|
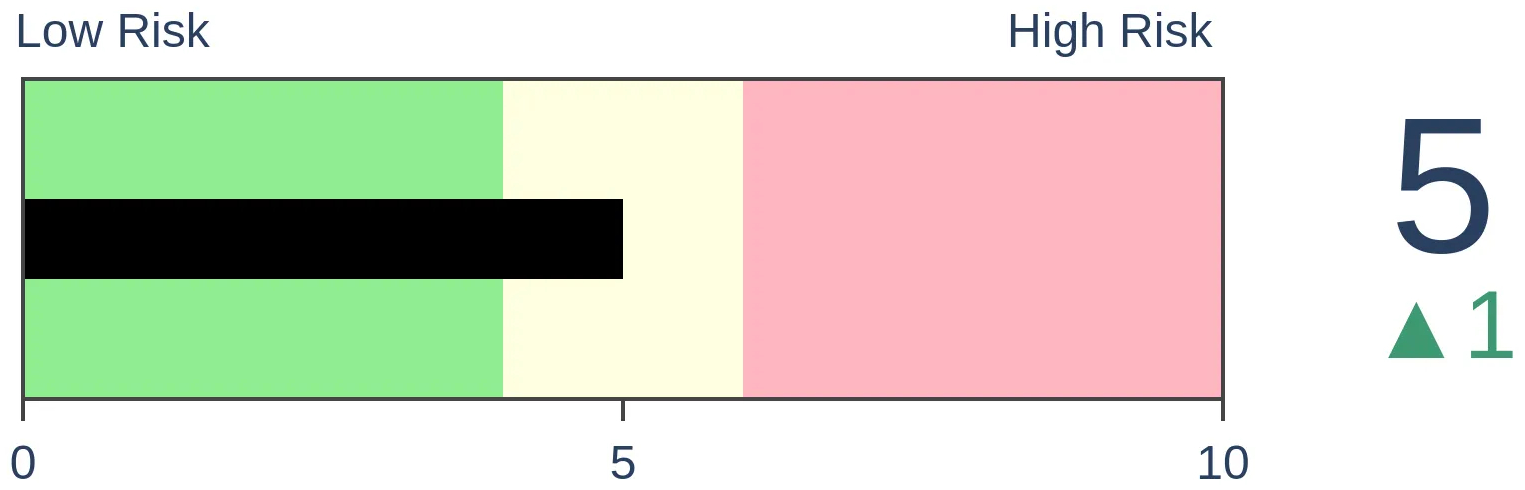
Stocks Medium-Term
|
|
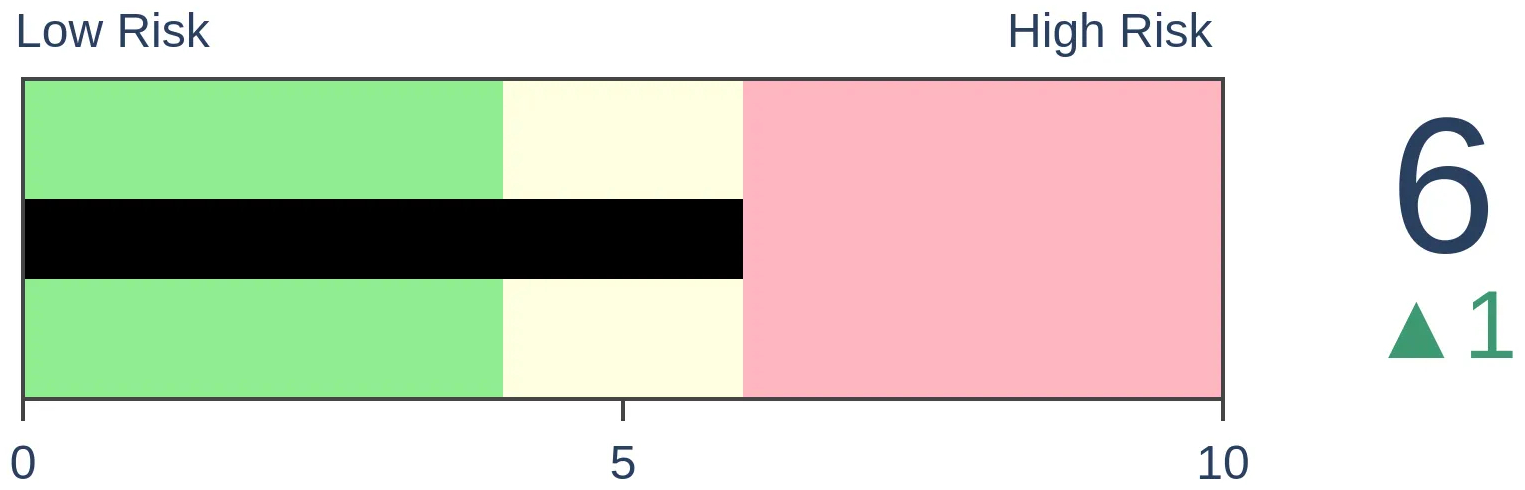
Bonds
|
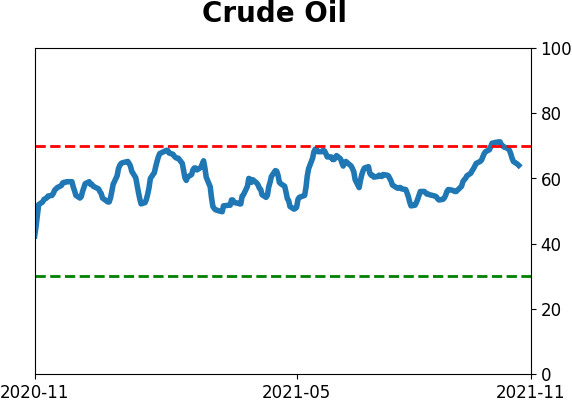
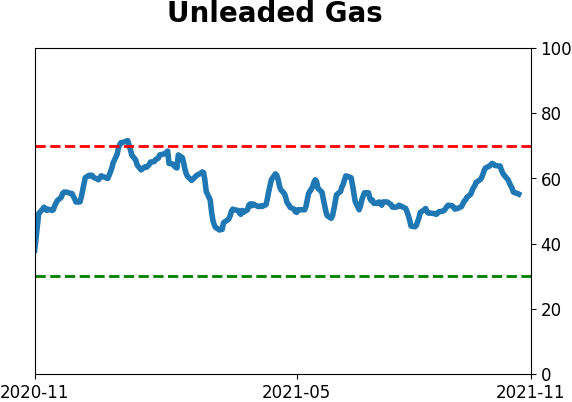
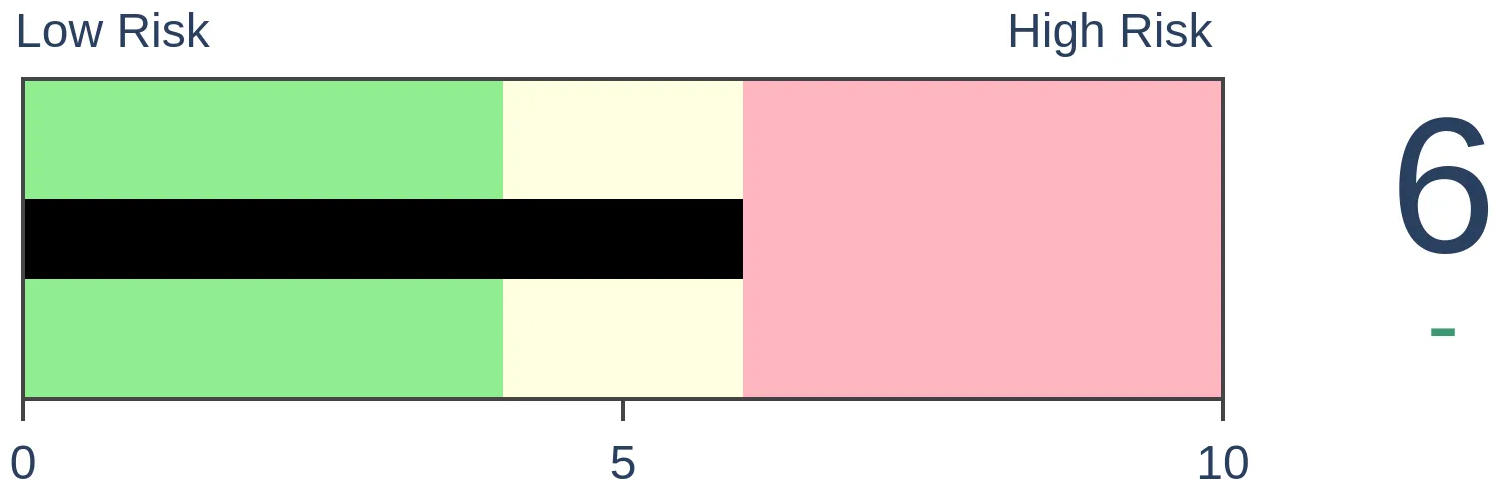
Crude Oil
|
|
Gold
|
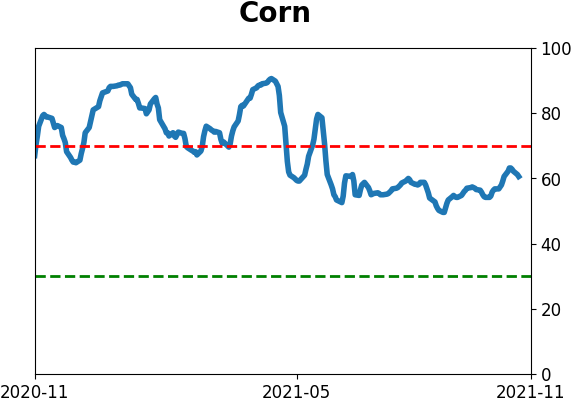
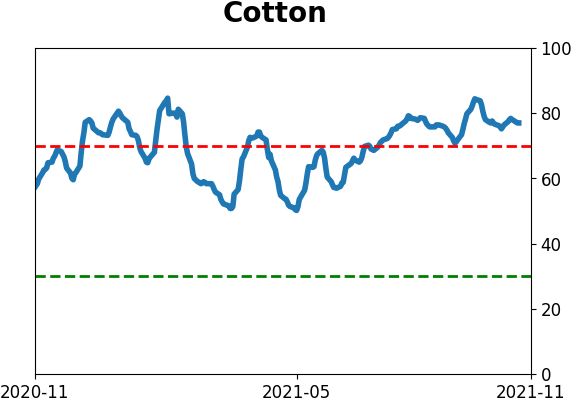
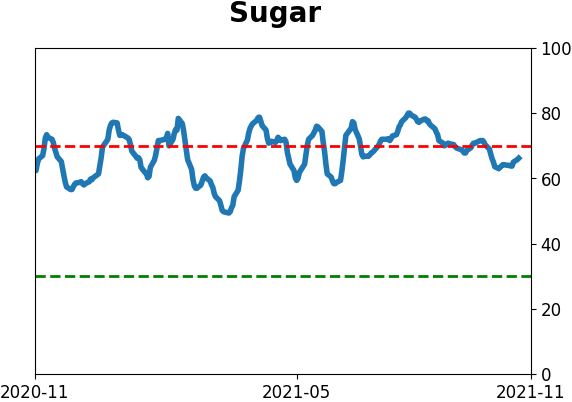
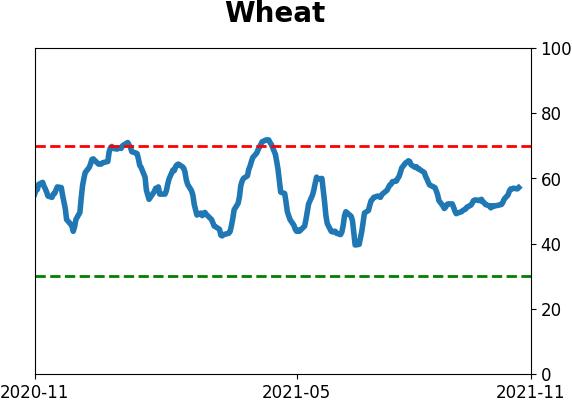
Agriculture
|
|
Research
By Jason Goepfert
BOTTOM LINE
Momentum in stocks on the Nasdaq exchange has been positive enough to turn its McClellan Summation Index positive for the first time in months. Previous signals preceded long-term gains in the Composite index.
FORECAST / TIMEFRAME
XLK -- Up, Long-Term
|
Key points:
- The McClellan Summation Index for the Nasdaq has turned positive
- This ends a streak of several months in negative territory
- Moves above zero have led to strong 1-year forward returns in the Composite
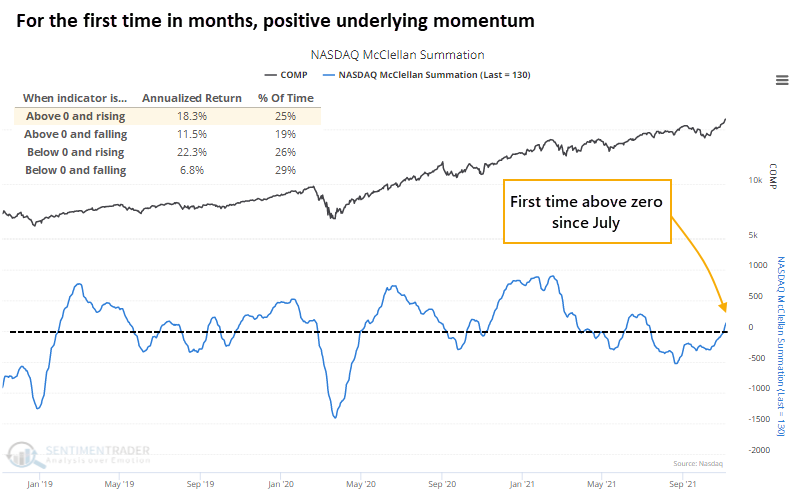
Internal Nasdaq momentum is positive for the first time since July
For the first time in months, the momentum in securities traded on the Nasdaq exchange has turned positive. After a furious rally to start the year, so many stocks were churning that breadth on the Nasdaq couldn't surpass its highs at the start of the year. By mid-summer, it turned outright negative and stayed there until last week.
This has ended a streak of 77 days in negative territory for the Nasdaq McClellan Summation Index, among the longest streaks since the end of the Global Financial Crisis.
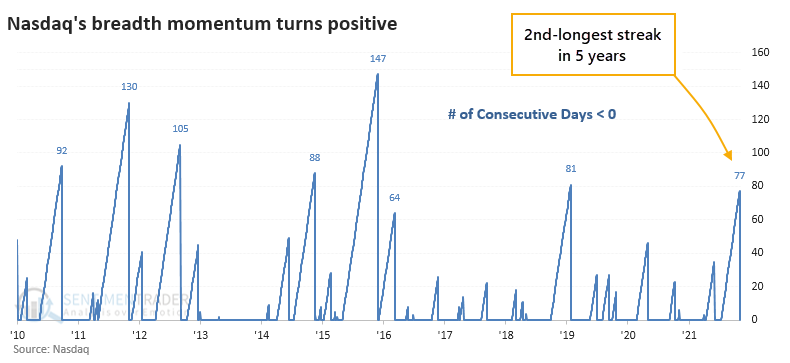
Only 6 other periods saw the Nasdaq's Summation Index stay in negative territory for longer. After those streaks ended, the Nasdaq Composite gained an average of nearly 19% at some point within the next year.
Returning momentum coincides with new highs
What's especially notable about the current flip to positive momentum is that it triggered as the Nasdaq Composite was on a run to new highs. Since 1986, there have been 8 similar signals.
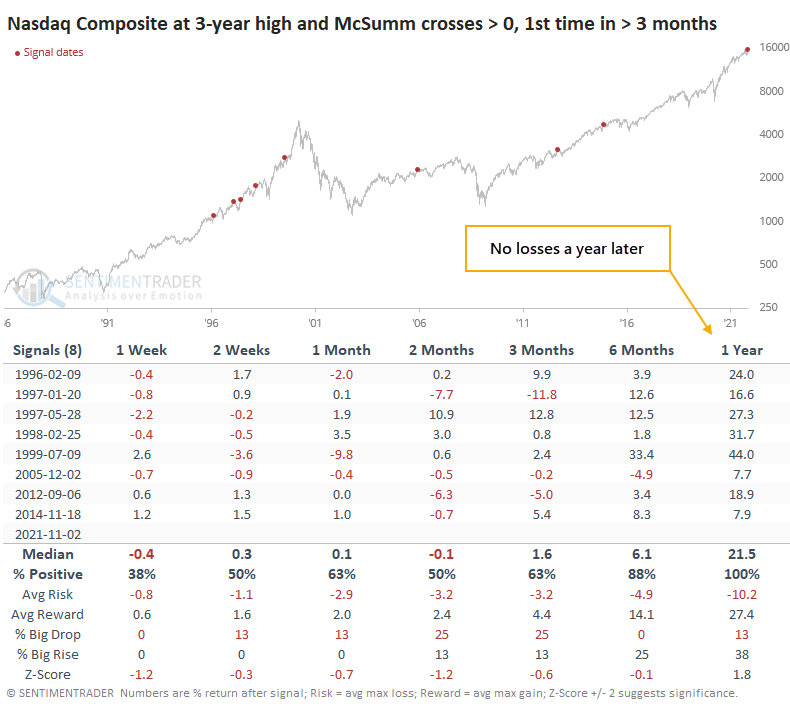
After those signals, the Nasdaq tended to chop around for a while. All 8 of them saw a negative return in the Composite at some point over the next 2-8 weeks. But all 8 of them also recovered strongly, showing a positive return over the next year each time. The Composite's median return a year later was 21.5%, nearly 2 standard deviations above random.
If we expand the sample size by including times when the Nasdaq was at least out of correction territory, results were similar.
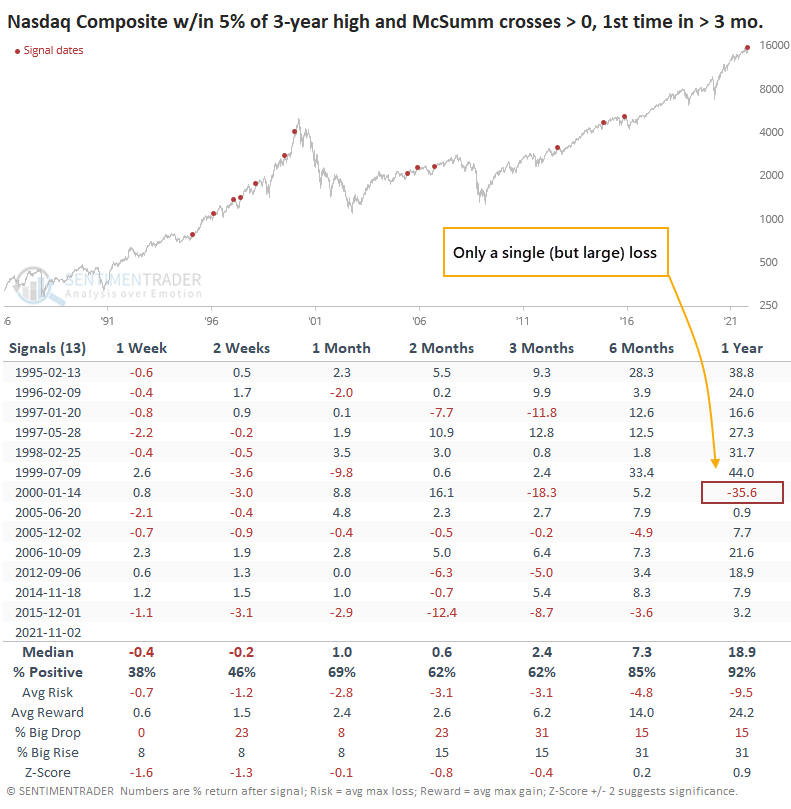
After these signals, the Nasdaq often encountered some short-term pushback as sellers saw a chance to get out after suffering losses. But over the next 6-12 months, positive results were the norm. A year later there was only a single loss, though it was a massive one.
What the research tells us...
When the McClellan Summation Index for any sector or index is in positive territory and rising, it tends to be the best possible scenario for future returns. That's where the Nasdaq is sitting now. While short-term returns can be poor, or inconsistent at best, long-term returns have been very positive after the Summation Index turns positive following months in negative territory.
Active Studies
| Time Frame | Bullish | Bearish | | Short-Term | 2 | 0 | | Medium-Term | 11 | 0 | | Long-Term | 11 | 5 |
|
Indicators at Extremes
Portfolio
| Position | Description | Weight % | Added / Reduced | Date | | Stocks | RSP | 10.7 | Added 6.4% | 2021-10-01 | | Bonds | 32.7% BND, 7.1% SCHP | 39.8 | Added 8.3% | 2021-10-26 | | Commodities | GCC | 2.4 | Reduced 2.1%
| 2020-09-04 | | Precious Metals | GDX | 4.6 | Reduced 4.2% | 2021-05-19 | | Special Situations | 9.8% KWEB, 4.7% XLE, 2.9% PSCE | 17.3 | Added 9.78% | 2021-10-01 | | Cash | | 24.1 | | |
|
Updates (Changes made today are underlined)
Much of our momentum and trend work has remained positive for several months, with some scattered exceptions. Almost all sentiment-related work has shown a poor risk/reward ratio for stocks, especially as speculation drove to record highs in exuberance in February. Much of that has worn off, and most of our models are back toward neutral levels. There isn't much to be excited about here. The same goes for bonds and even gold. Gold has been performing well lately and is back above long-term trend lines. The issue is that it has a poor record of holding onto gains when attempting a long-term trend change like this, so we'll take a wait-and-see approach. Momentum has ebbed quickly in recent weeks, and nearing oversold levels in some indicators. This can be a dangerous area, with a lot of short-term volatility, but we'd be more inclined to add medium- to long-term exposure rather than sell on much more of a decline, thanks to already rock-bottom exposure. Other areas look more attractive, including some overseas markets. RETURN YTD: 11.4% 2020: 8.1%, 2019: 12.6%, 2018: 0.6%, 2017: 3.8%, 2016: 17.1%, 2015: 9.2%, 2014: 14.5%, 2013: 2.2%, 2012: 10.8%, 2011: 16.5%, 2010: 15.3%, 2009: 23.9%, 2008: 16.2%, 2007: 7.8%
|
|
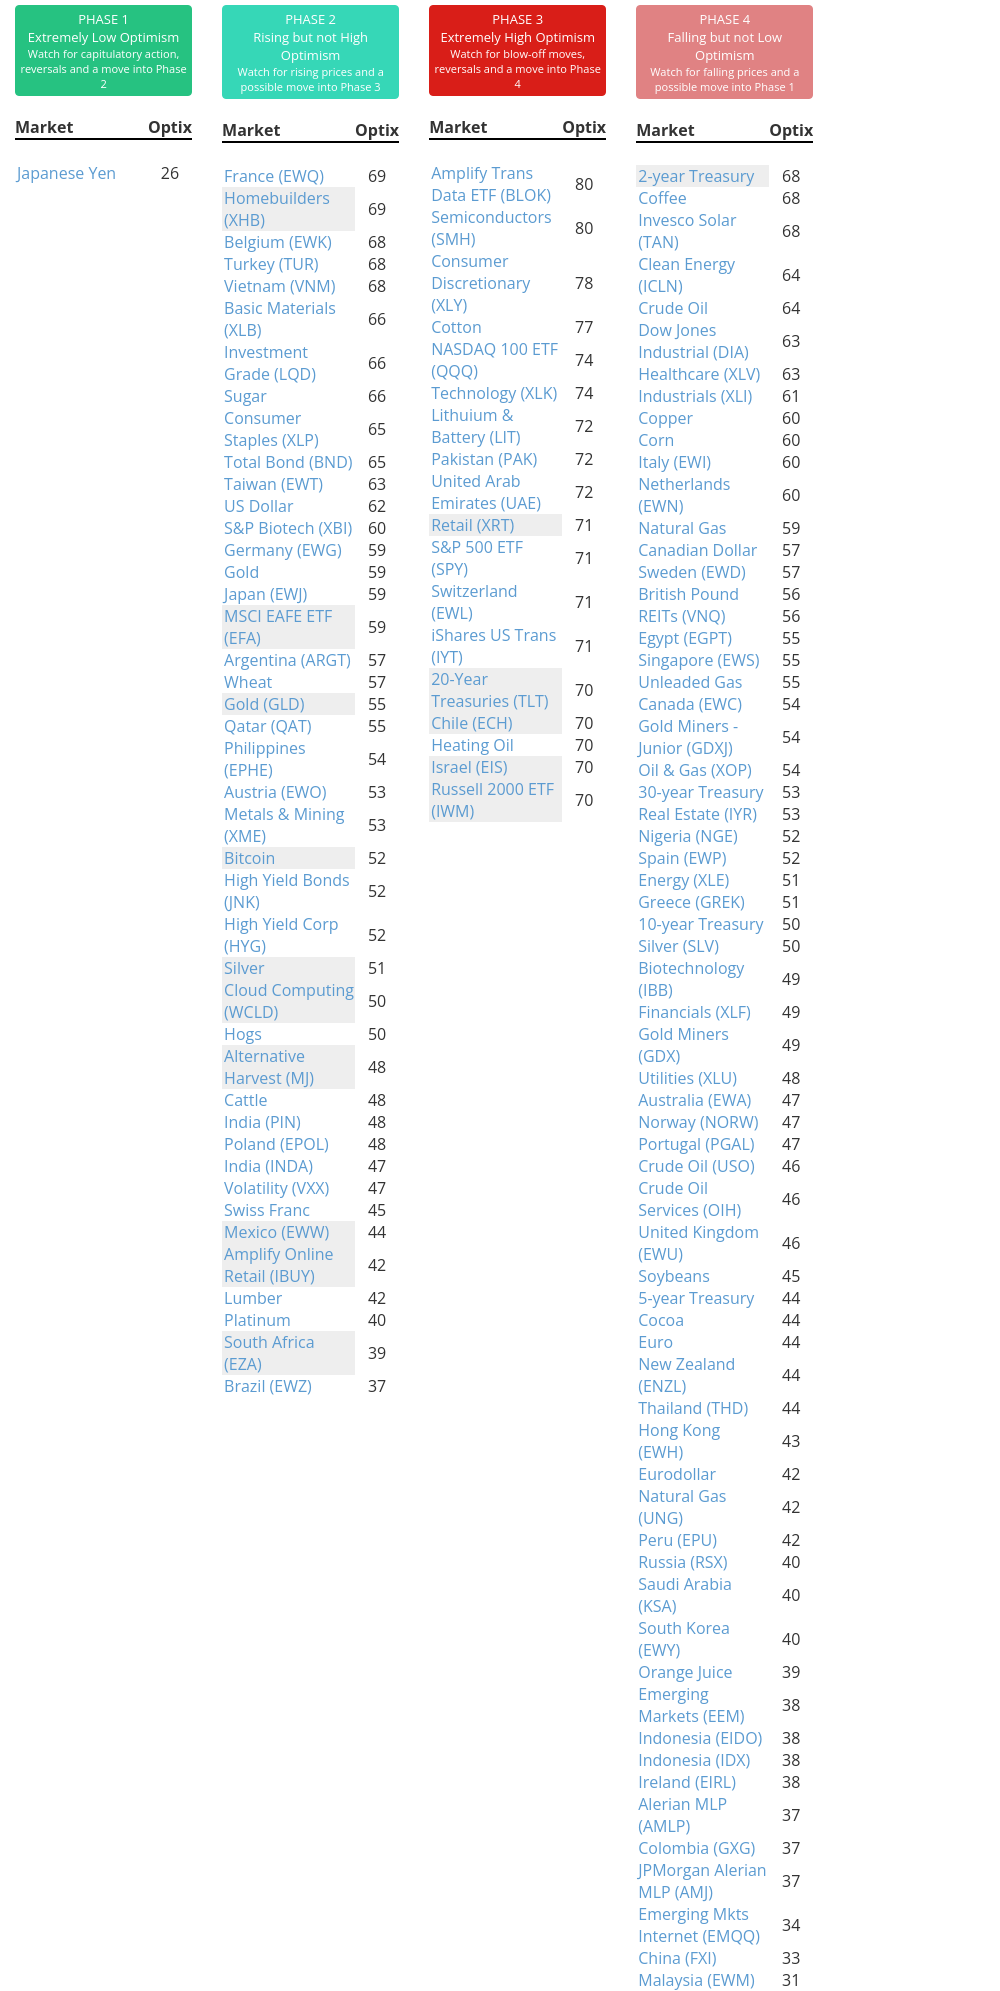
Phase Table
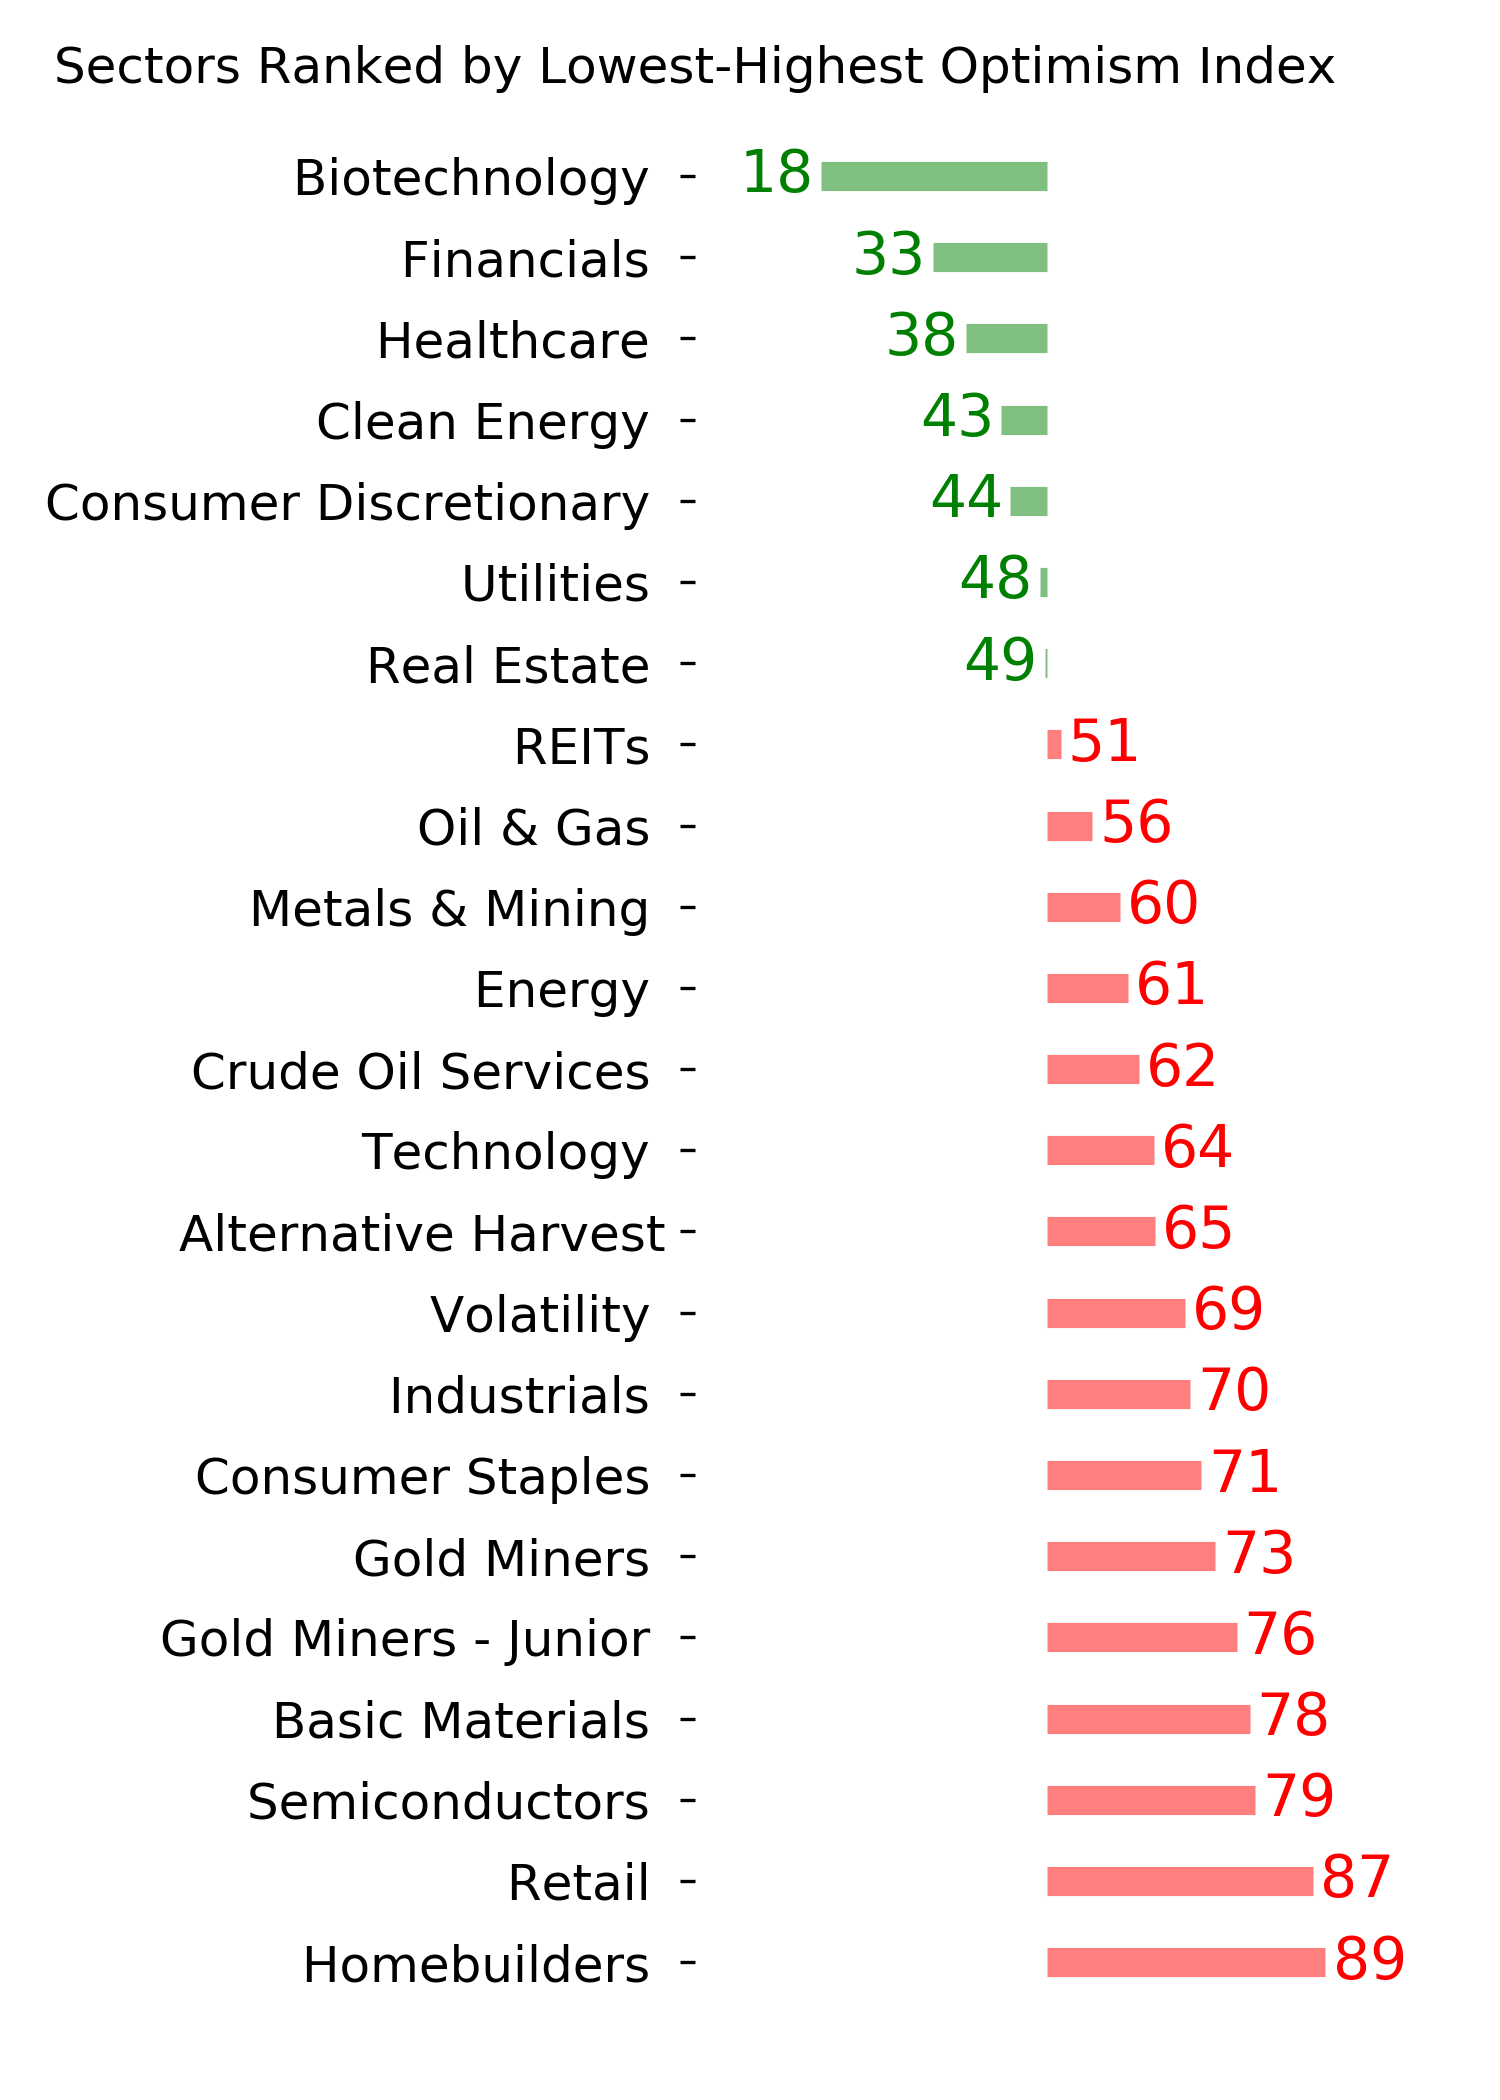
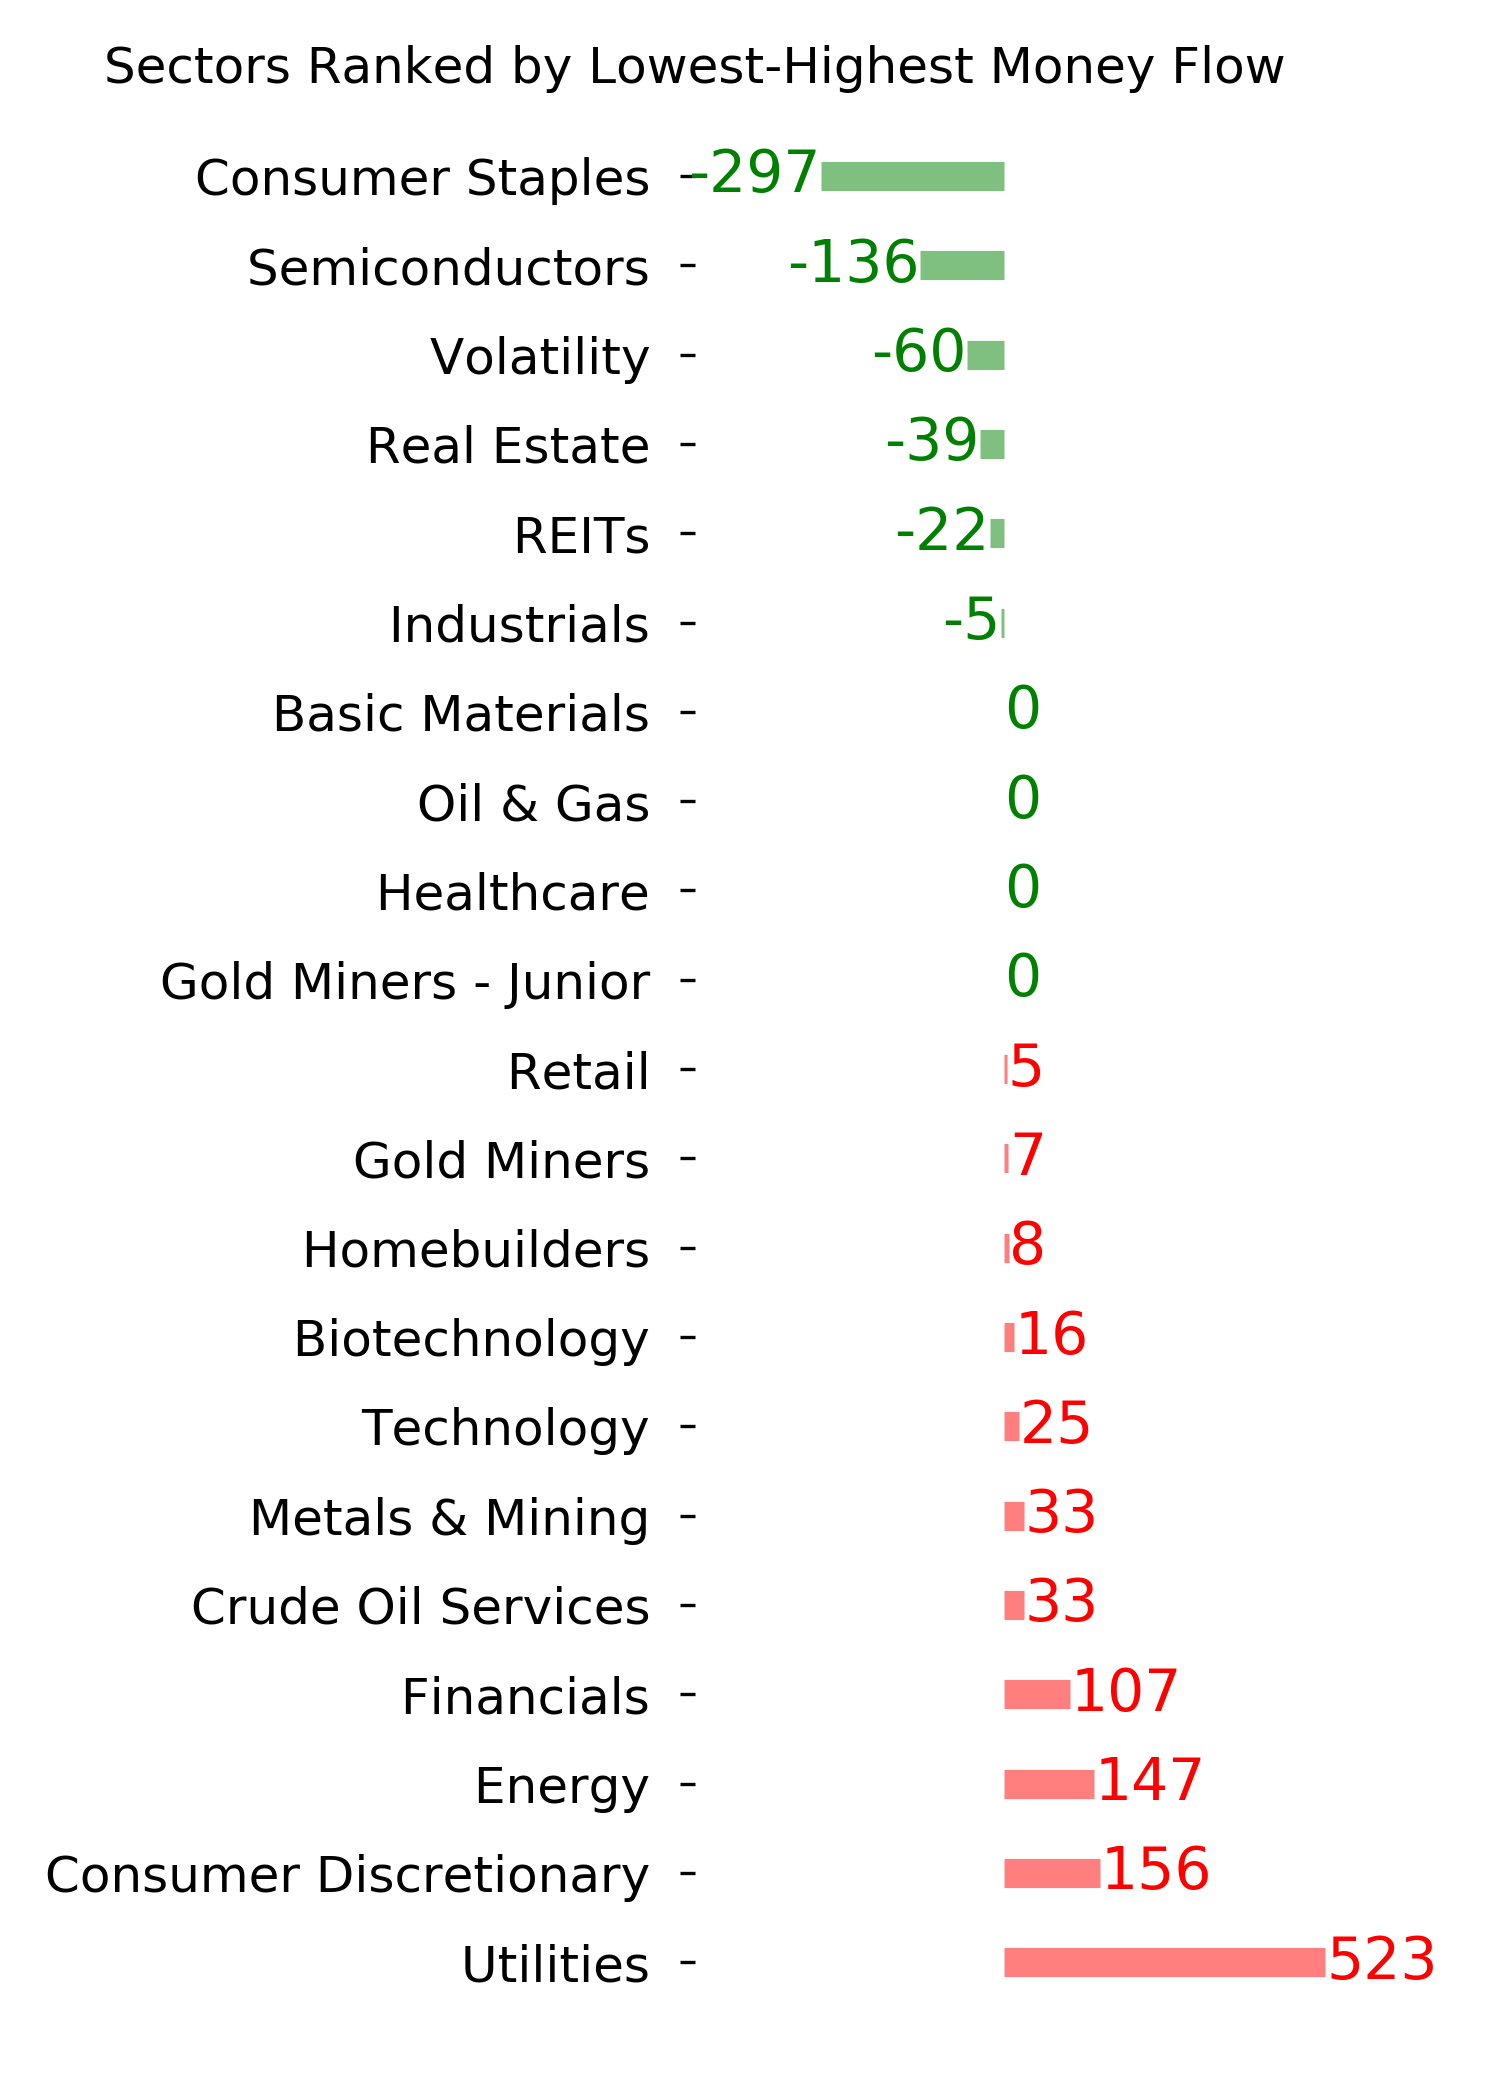
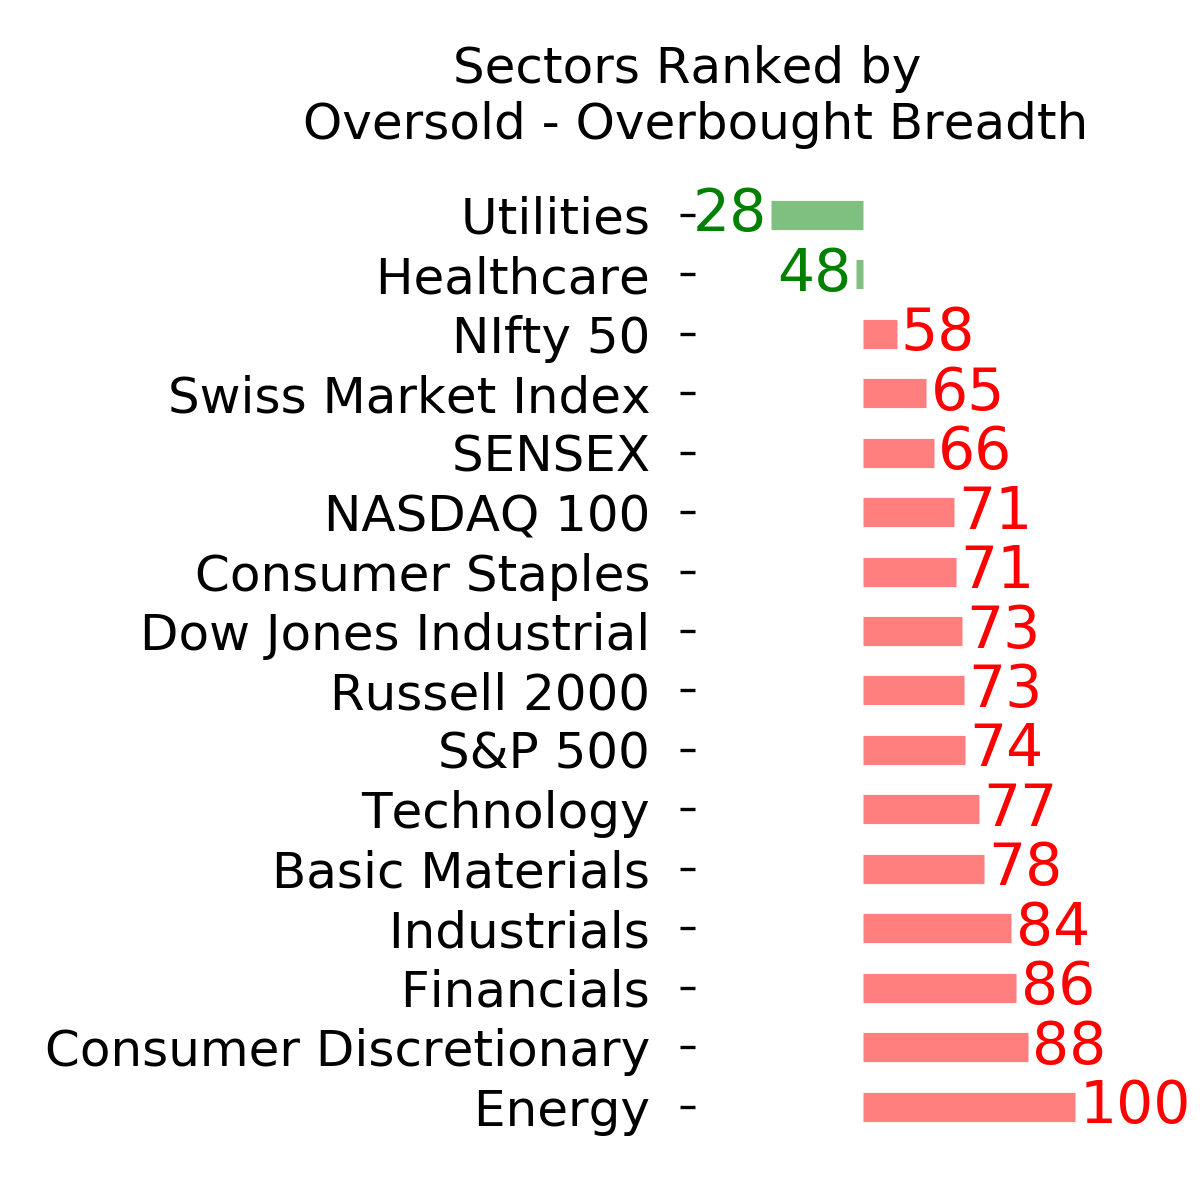
Ranks
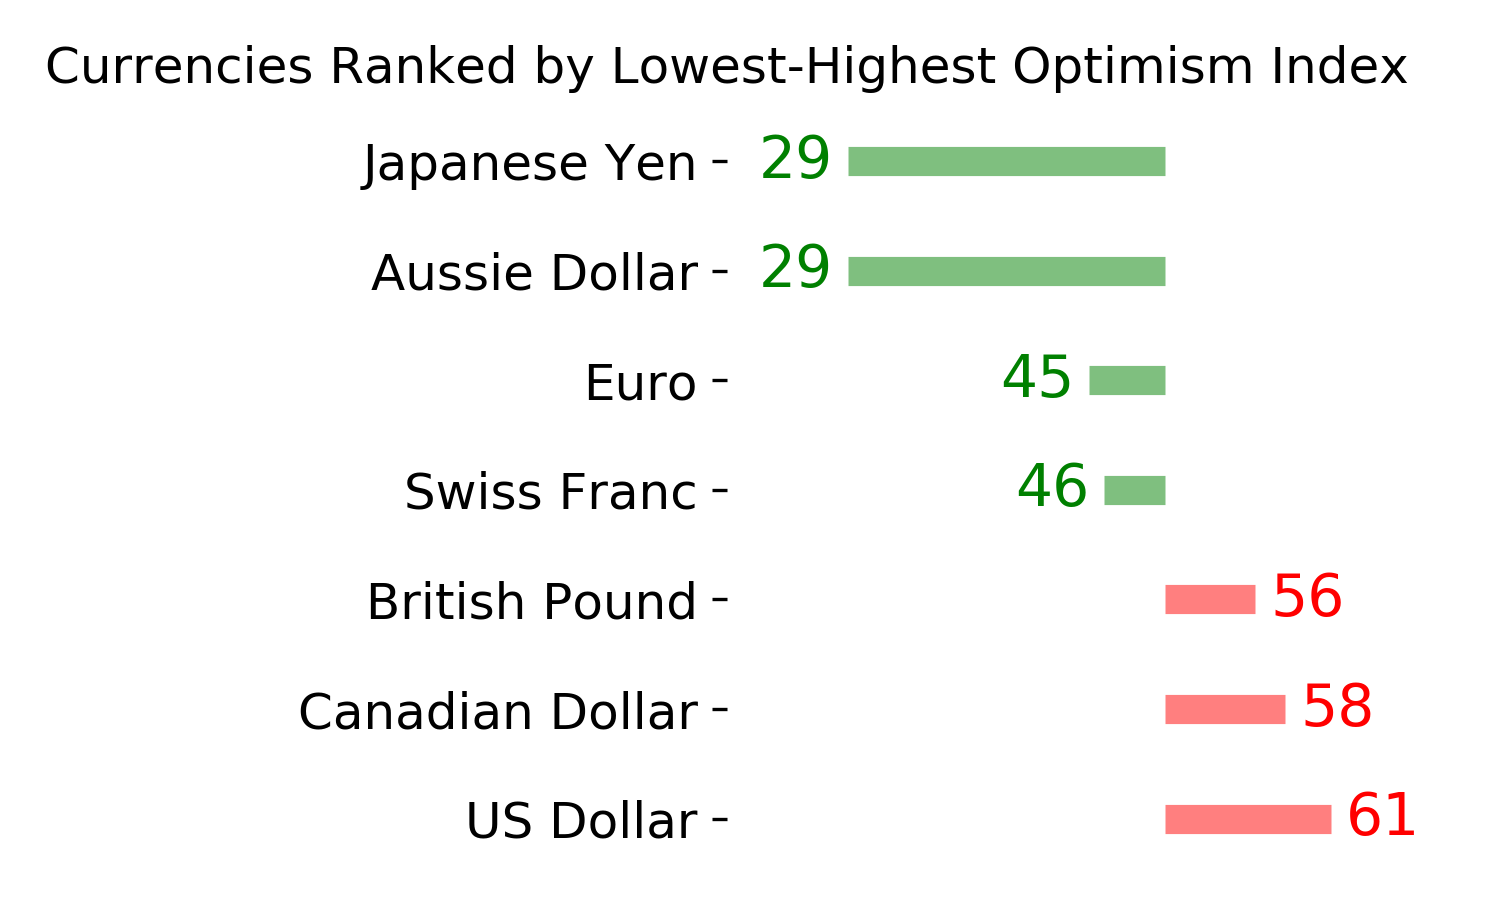
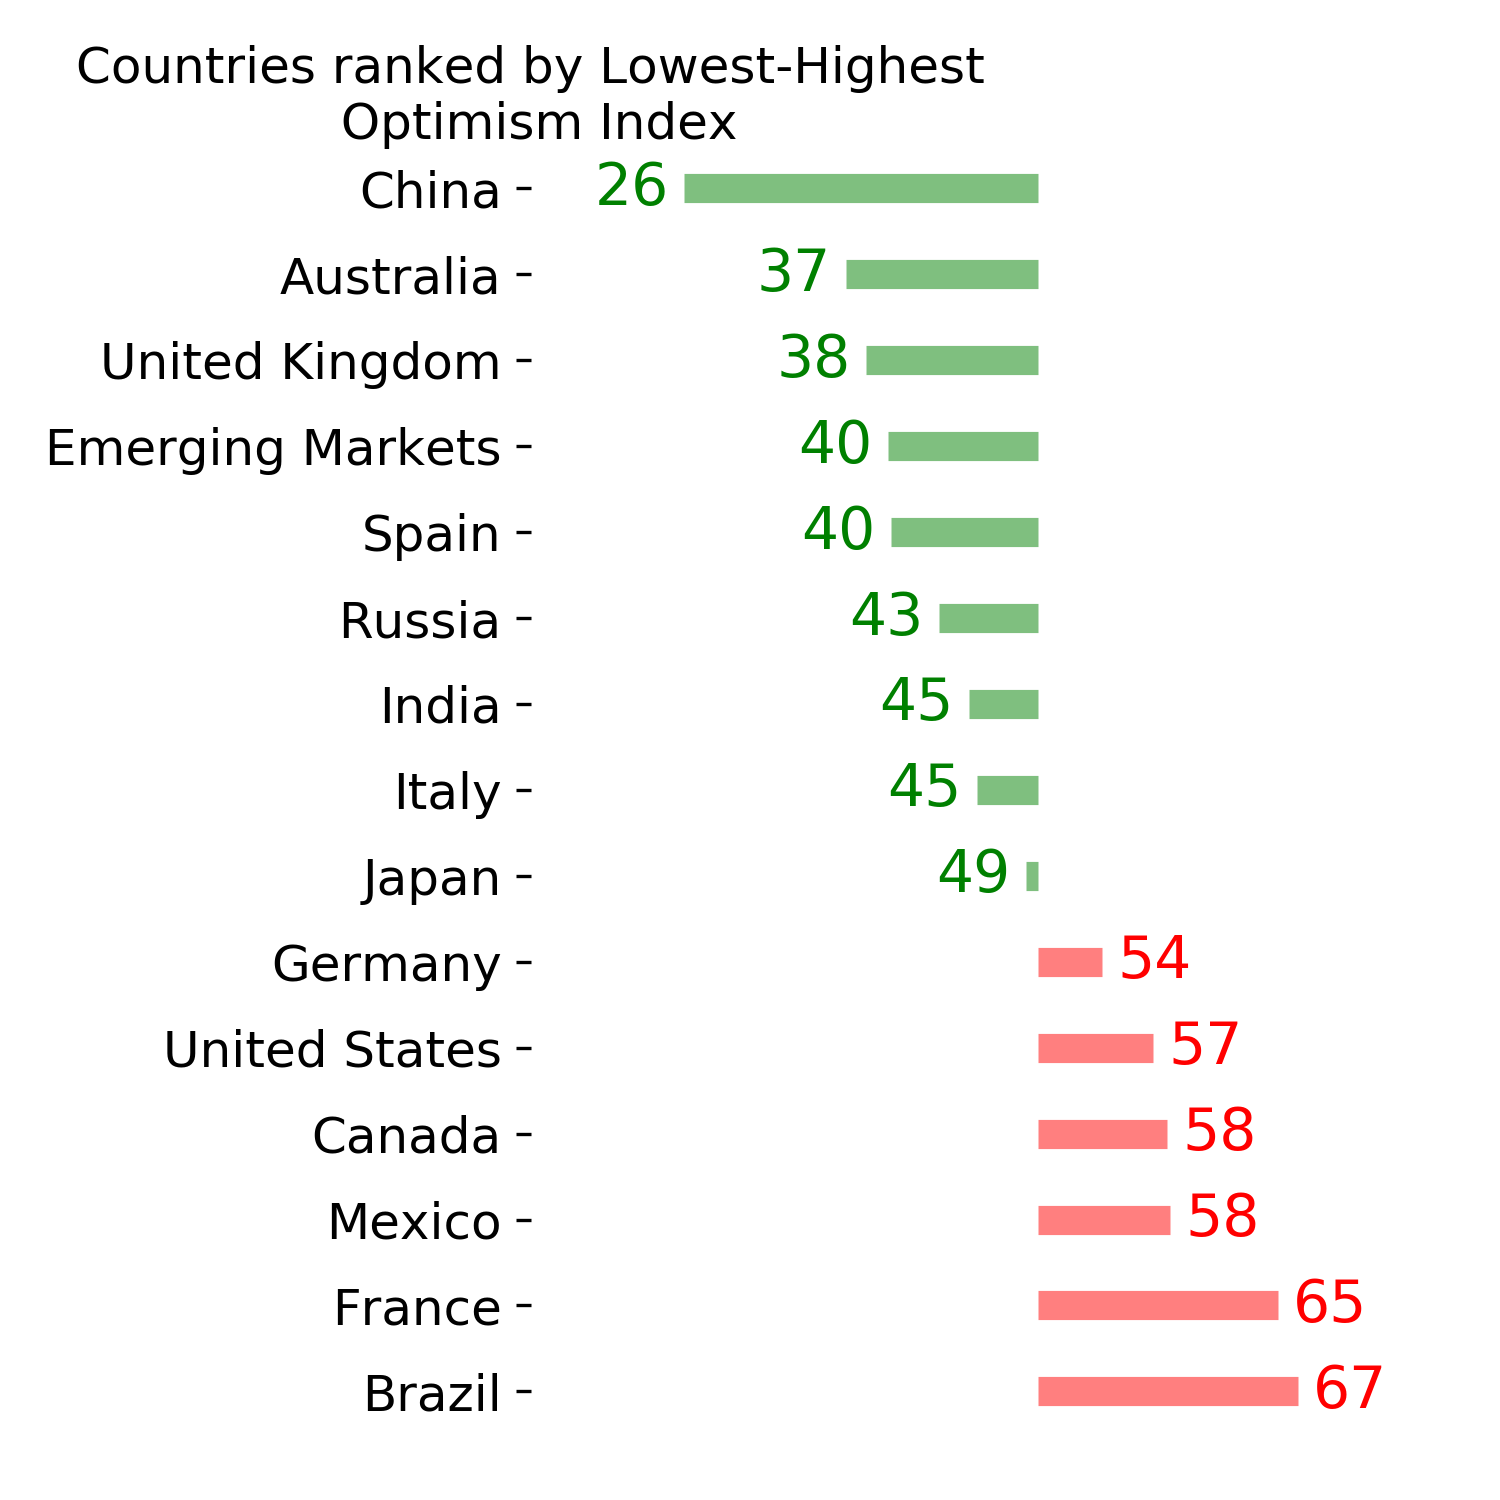
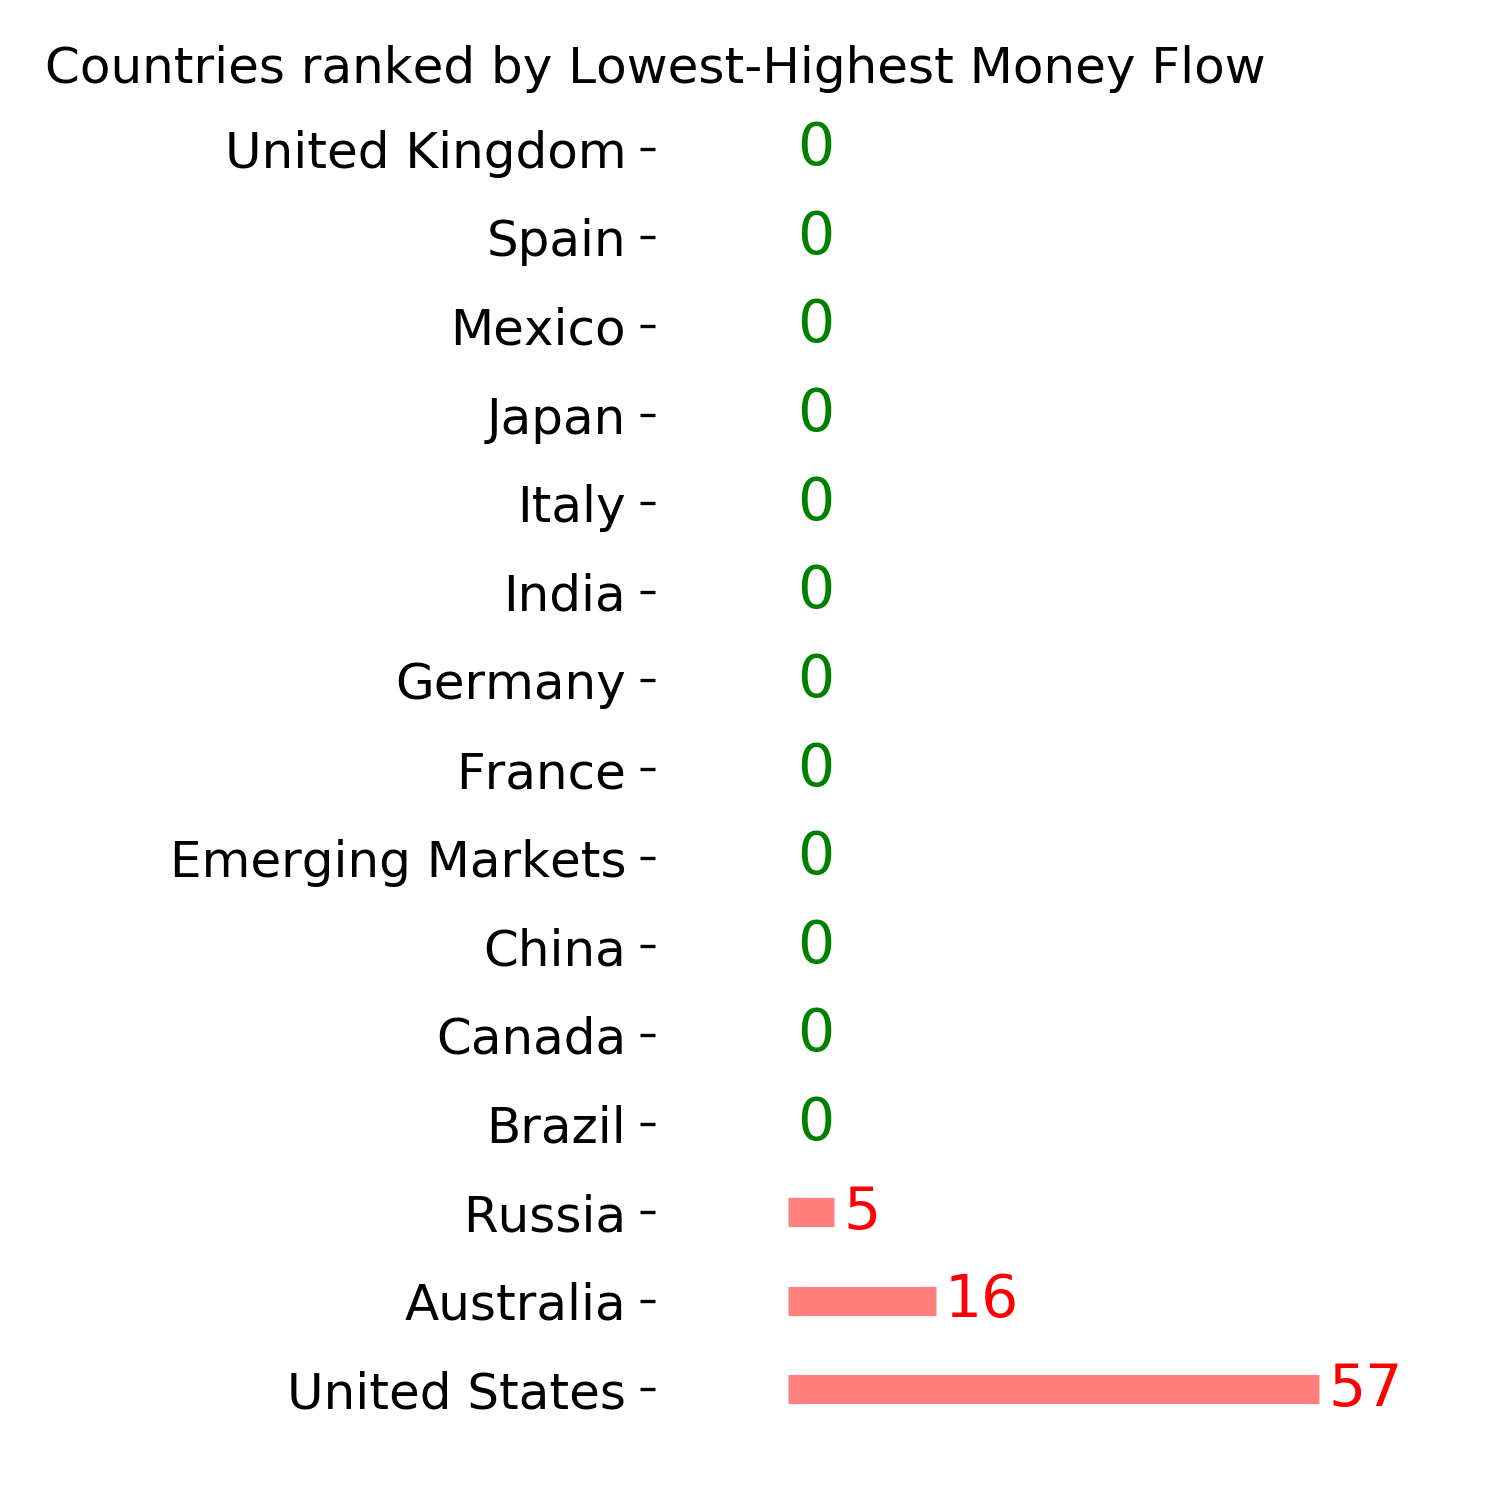
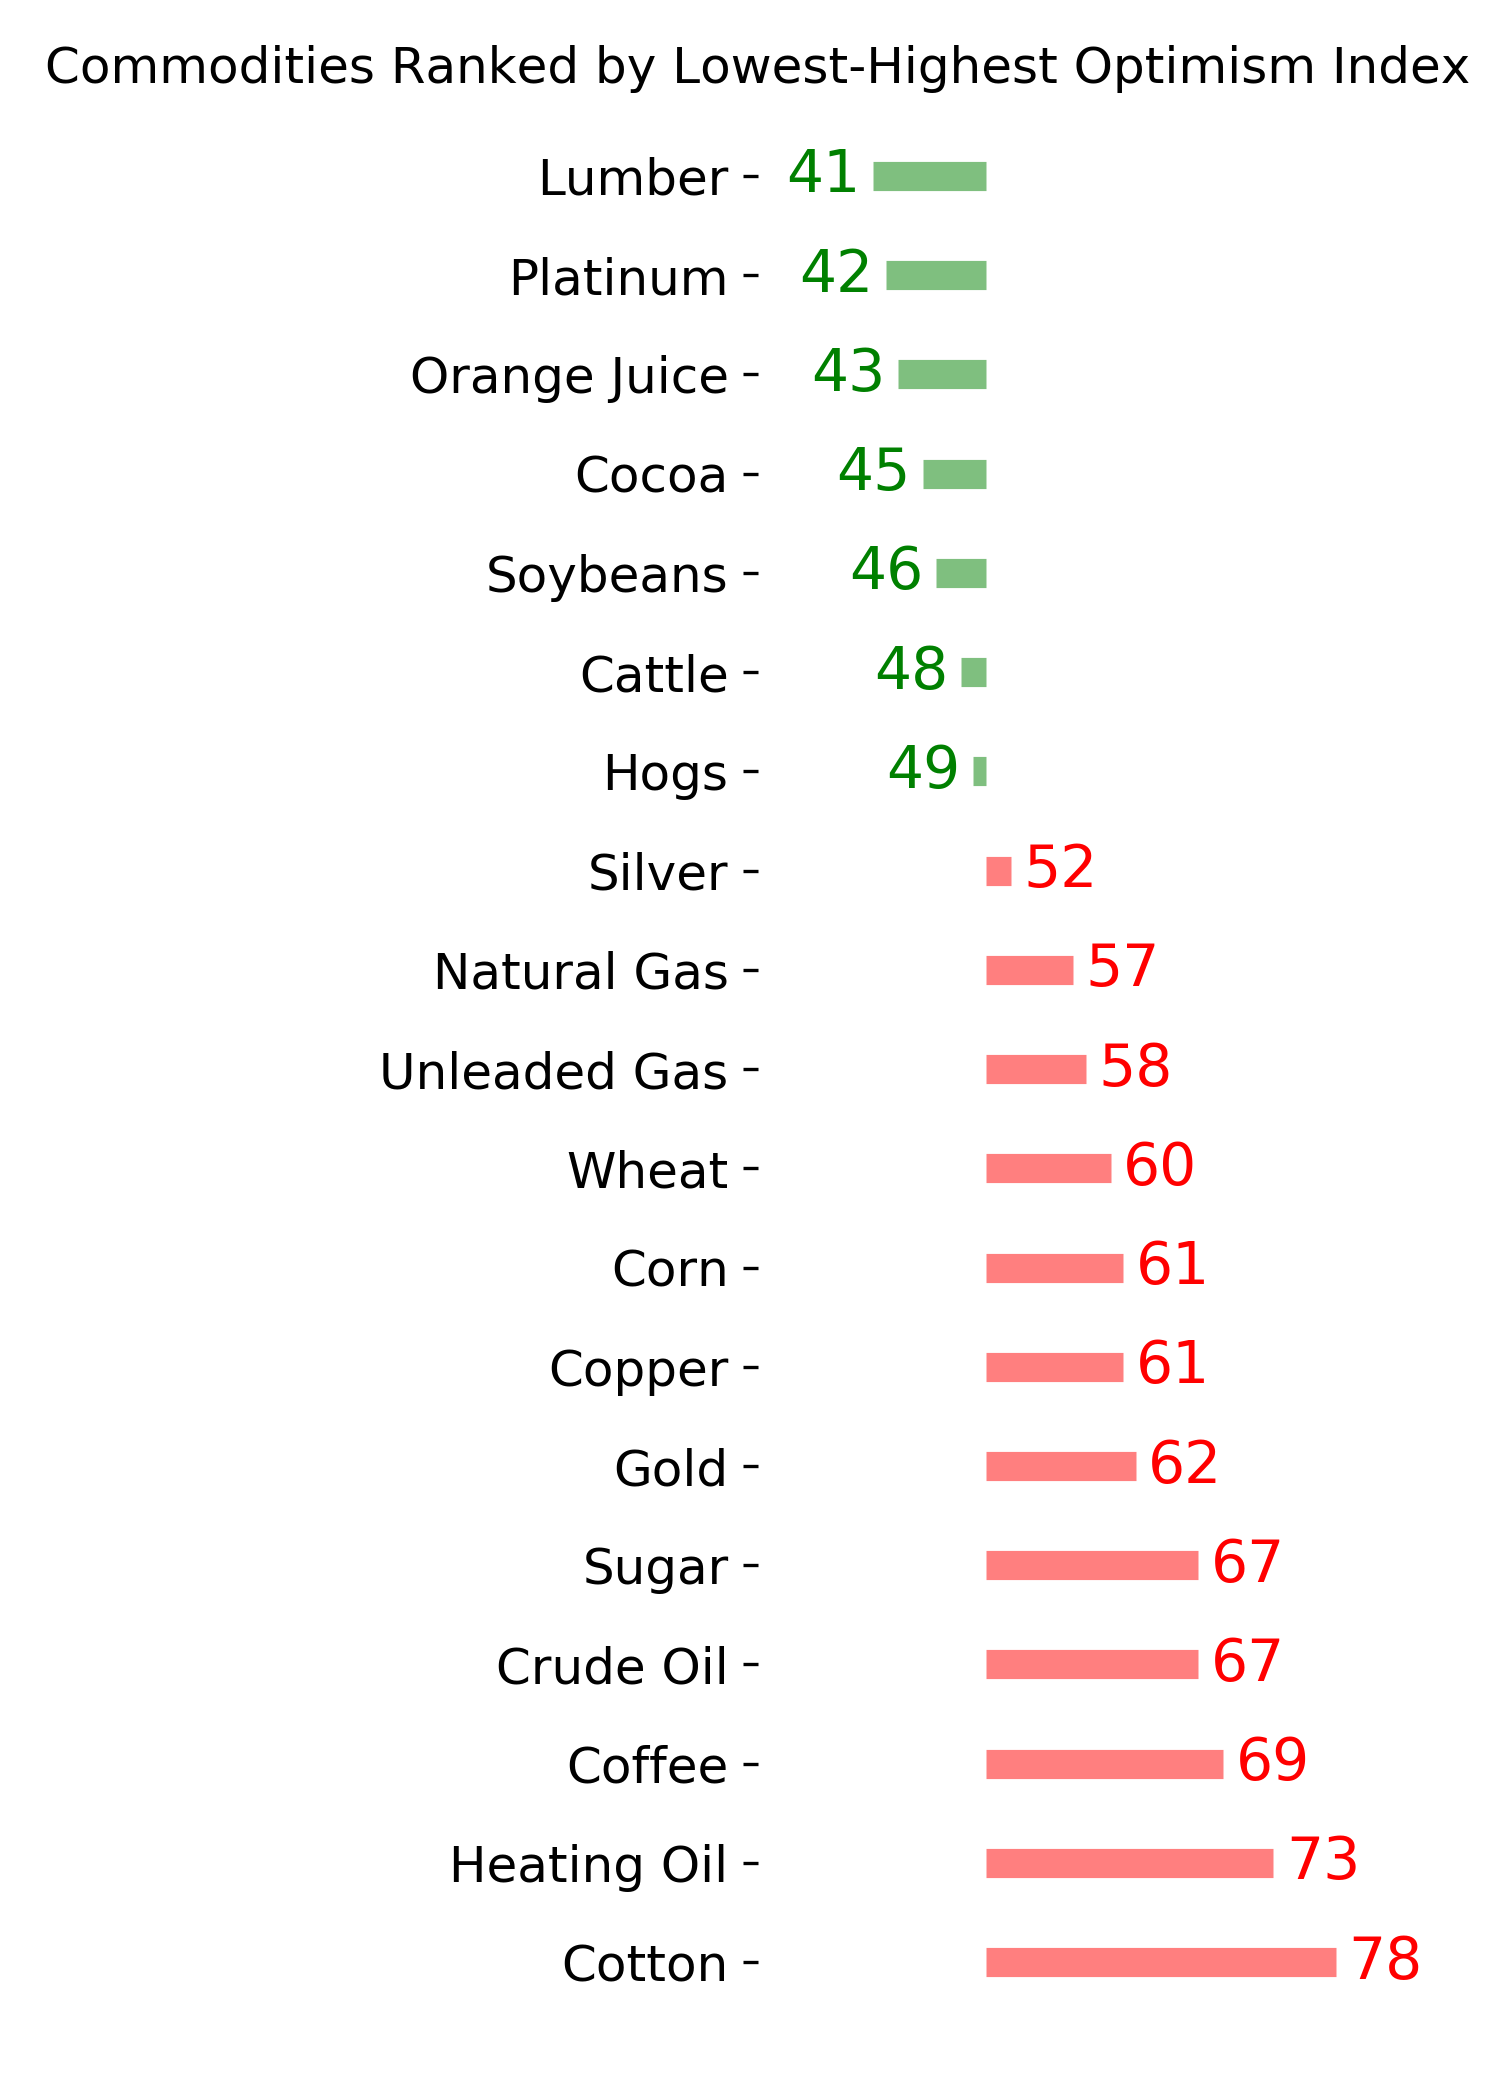
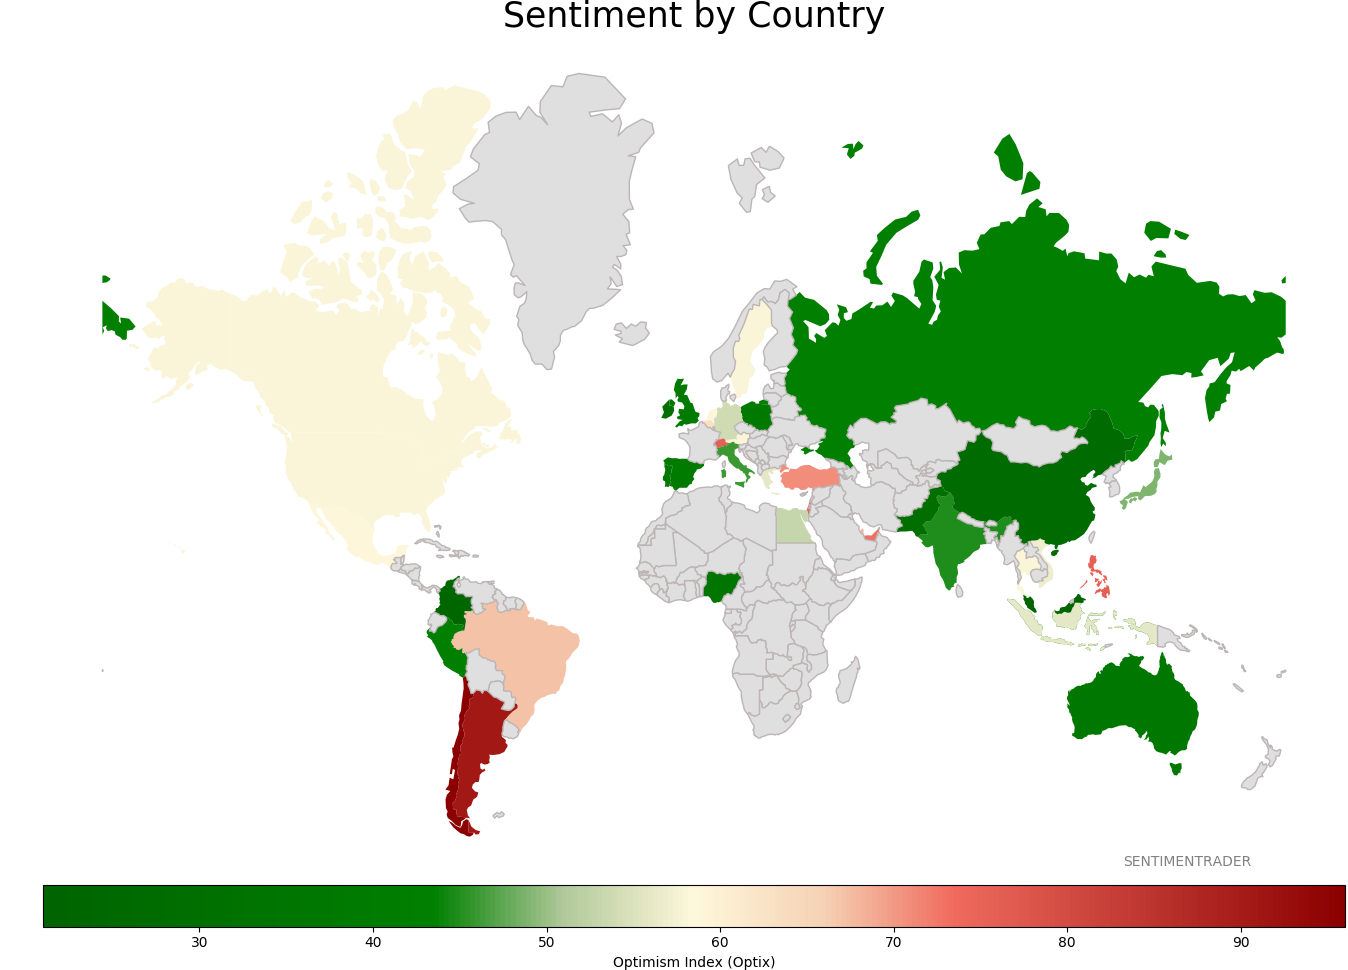
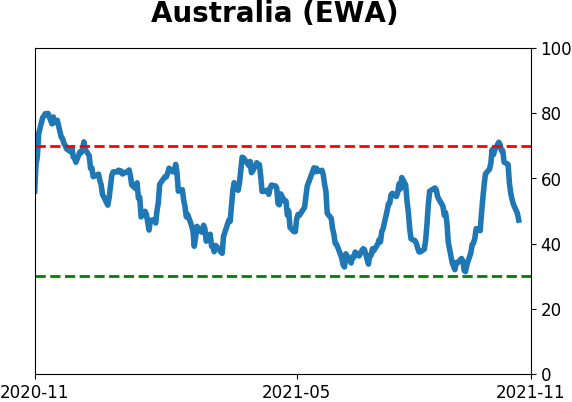
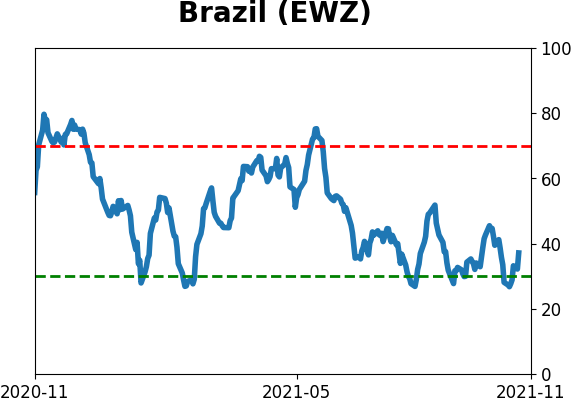
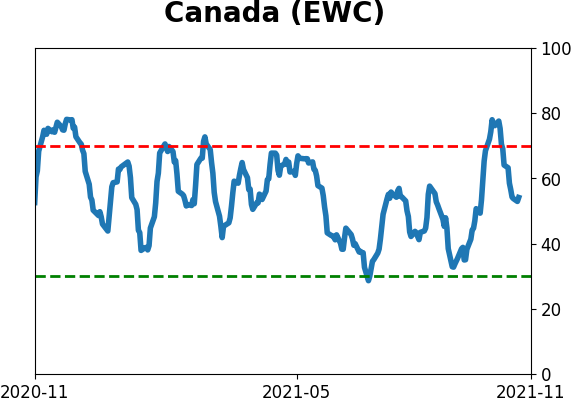
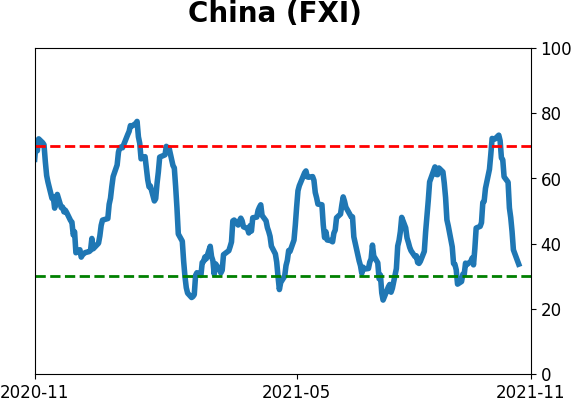
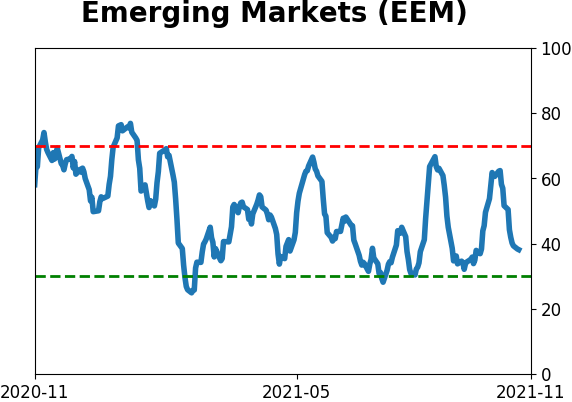
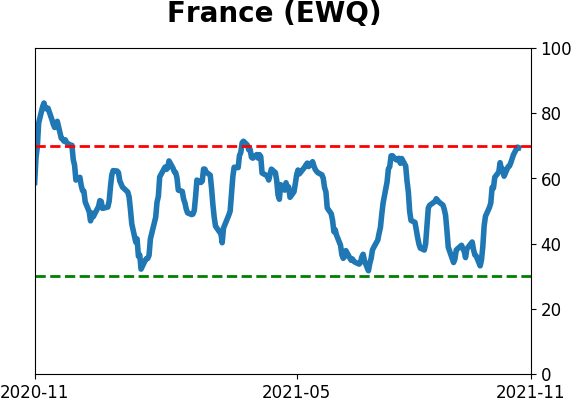
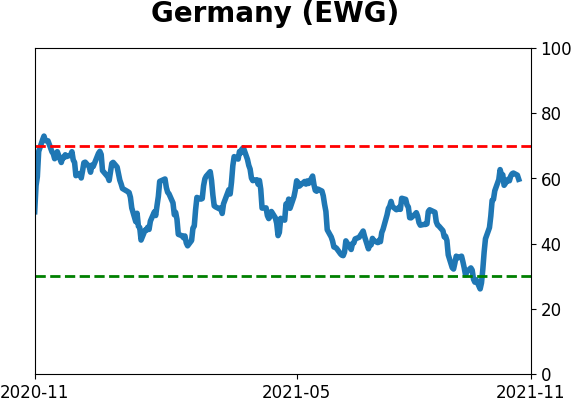
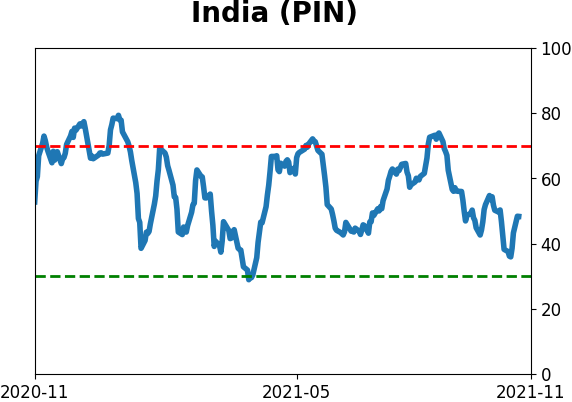
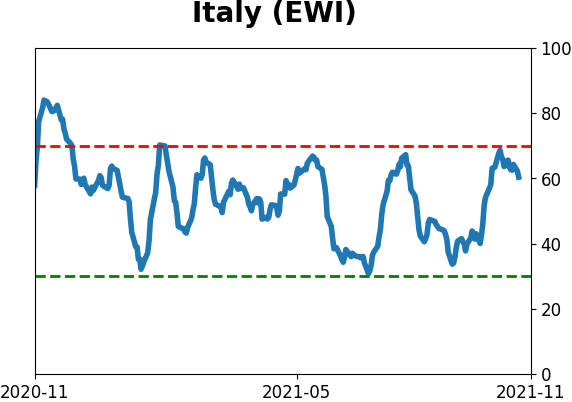
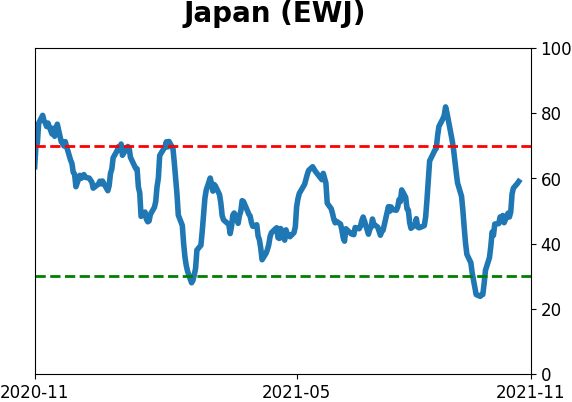
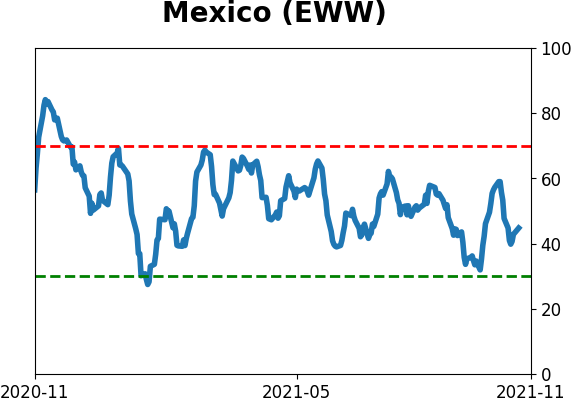
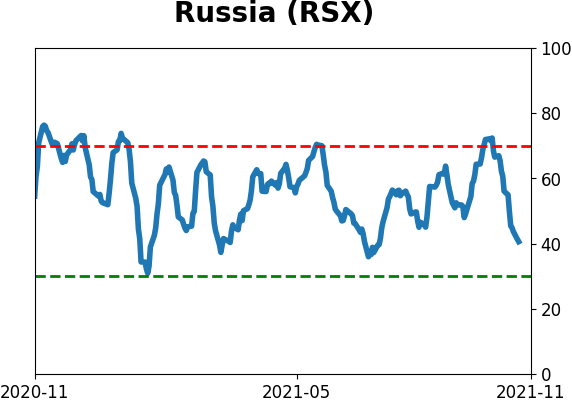
Sentiment Around The World
Optimism Index Thumbnails
|
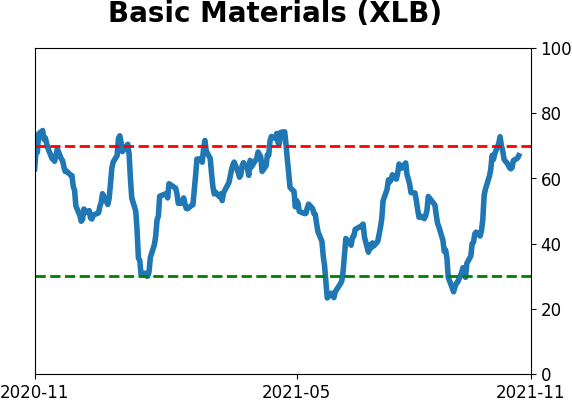
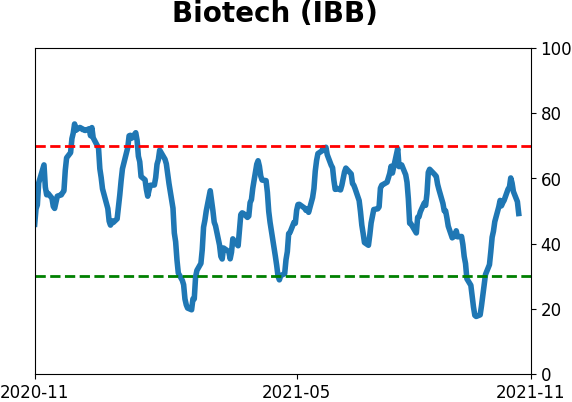
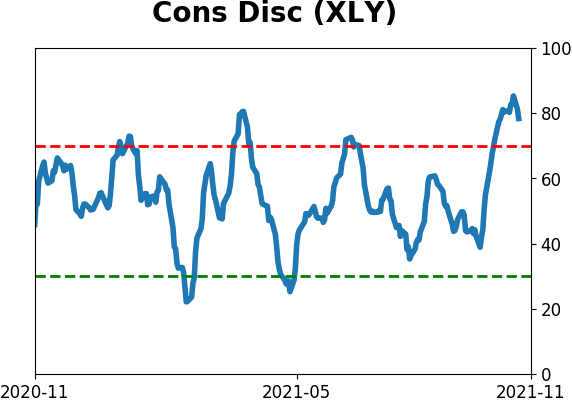
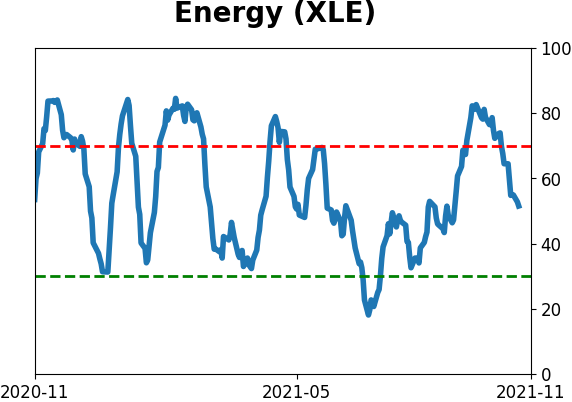
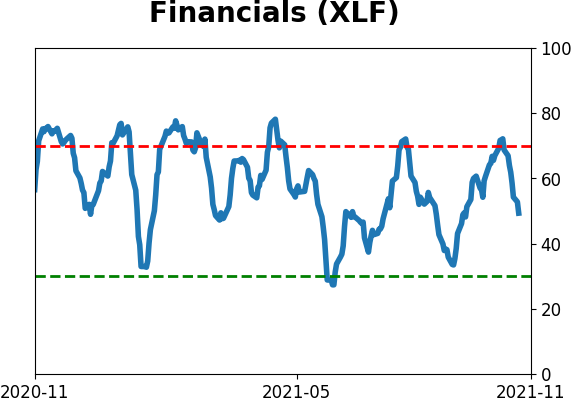
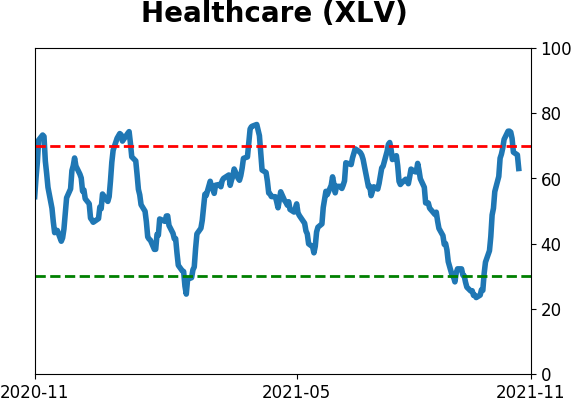
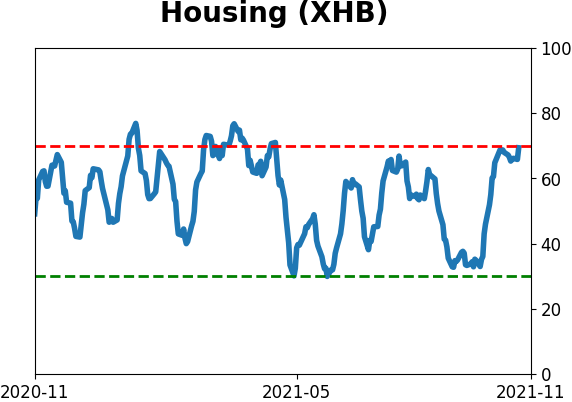
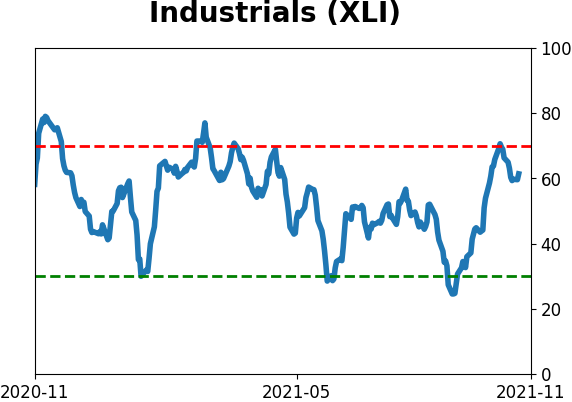
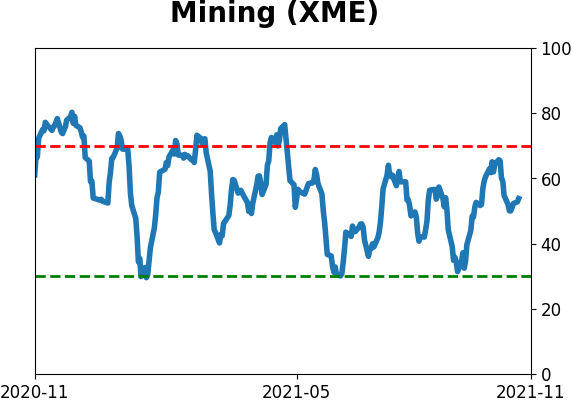
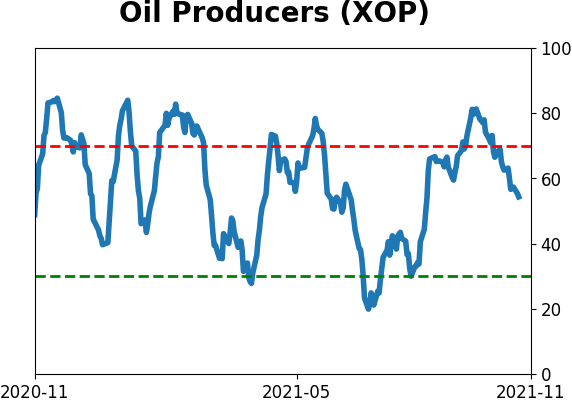
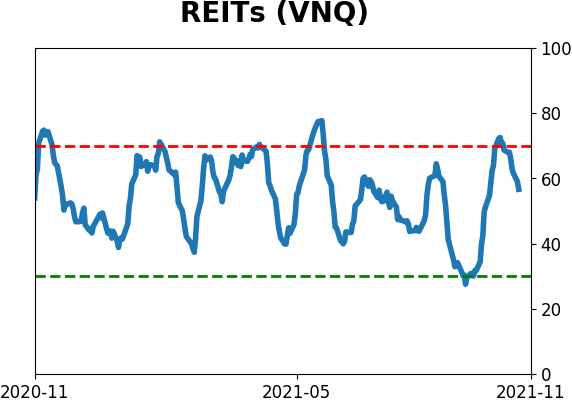
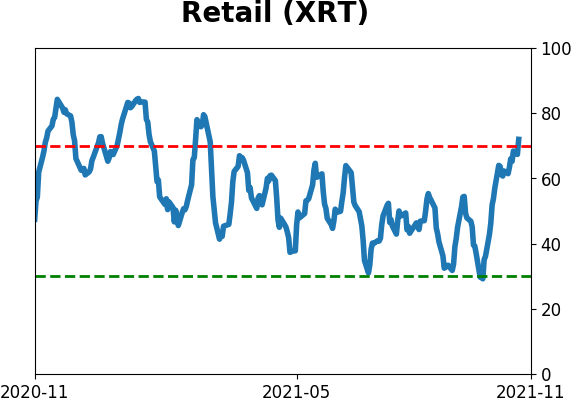
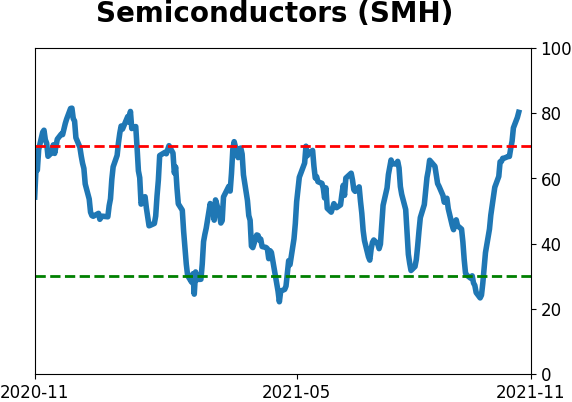
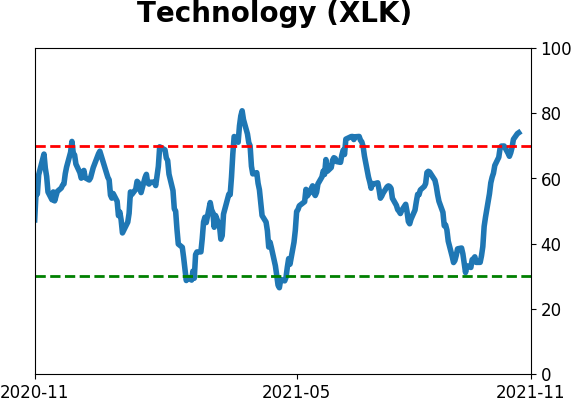
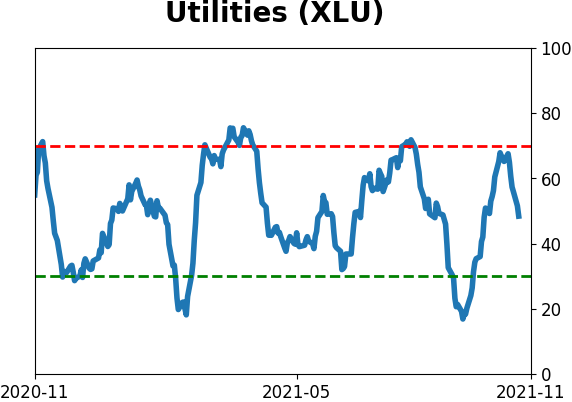
Sector ETF's - 10-Day Moving Average
|
|
|
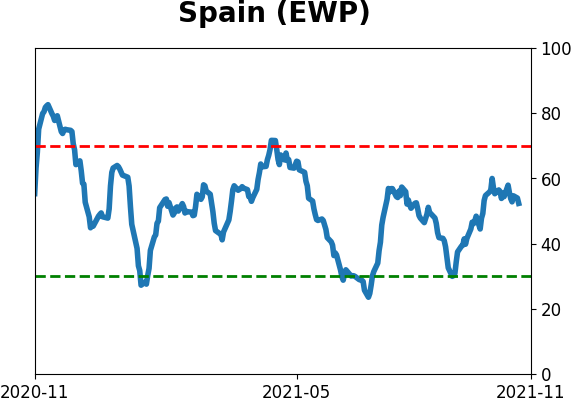
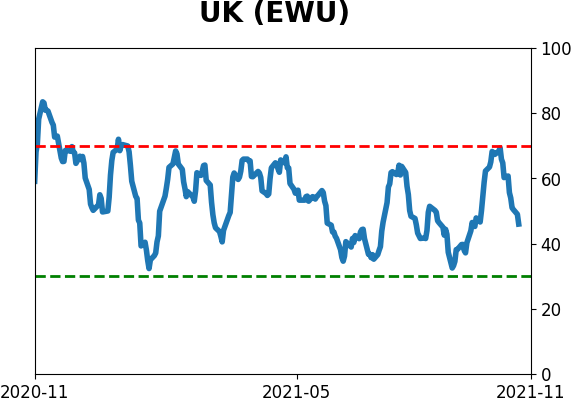
Country ETF's - 10-Day Moving Average
|
|
|
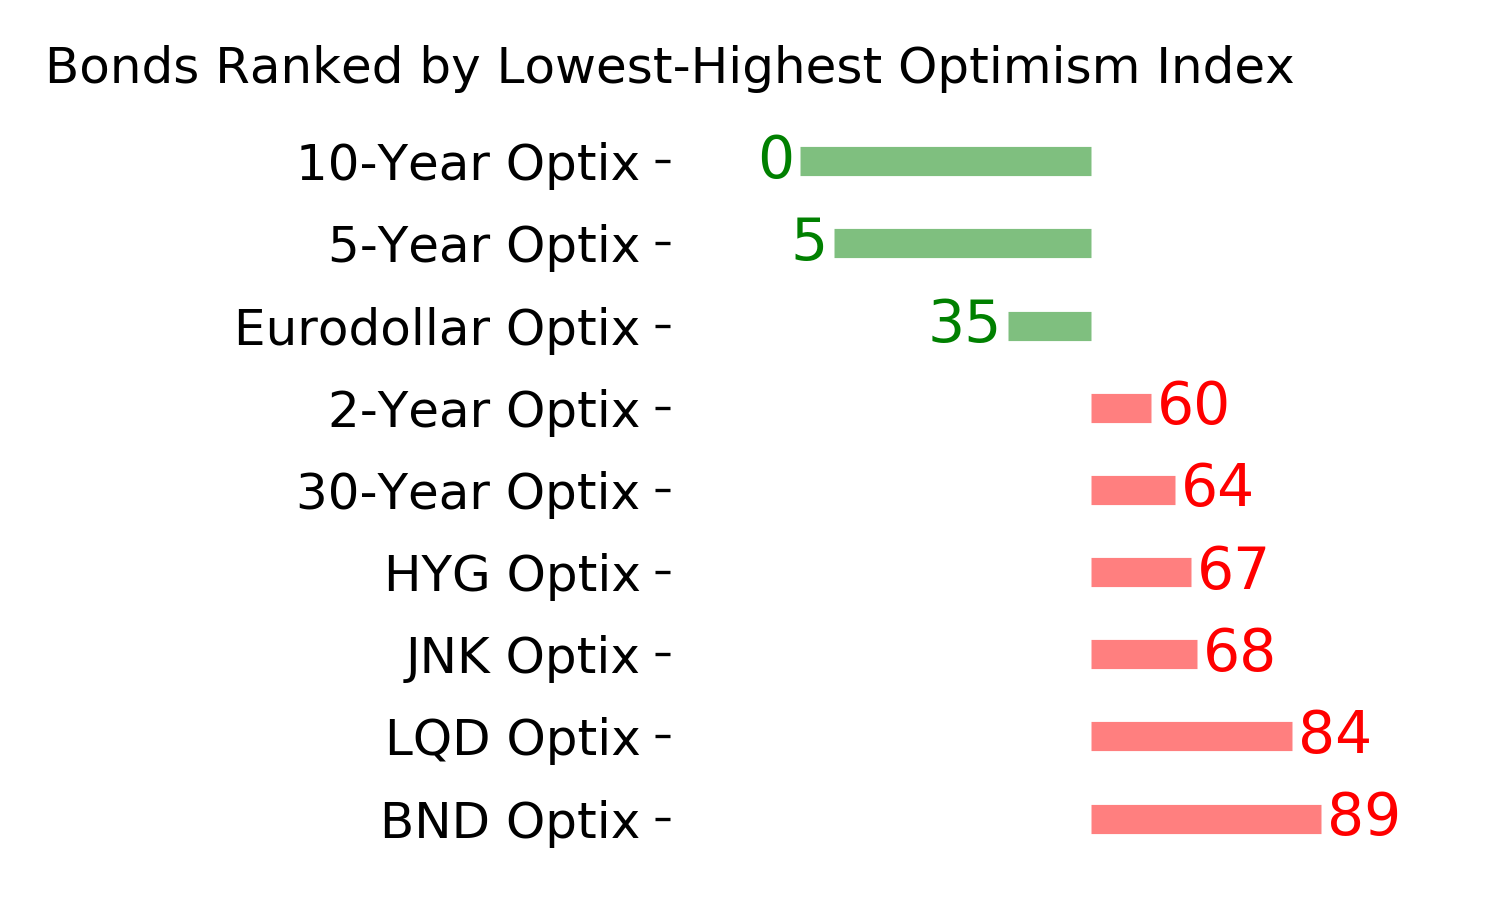
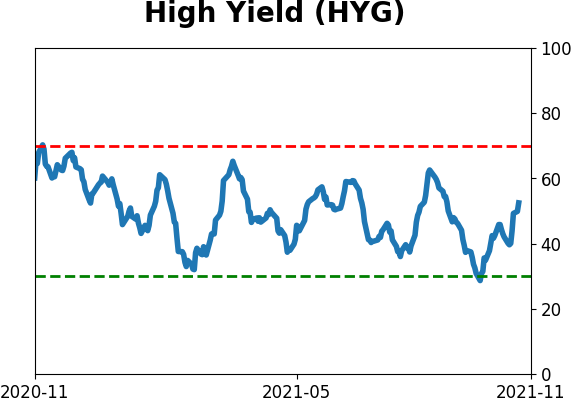
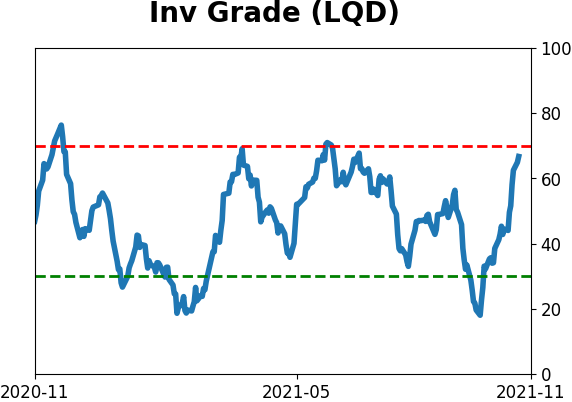
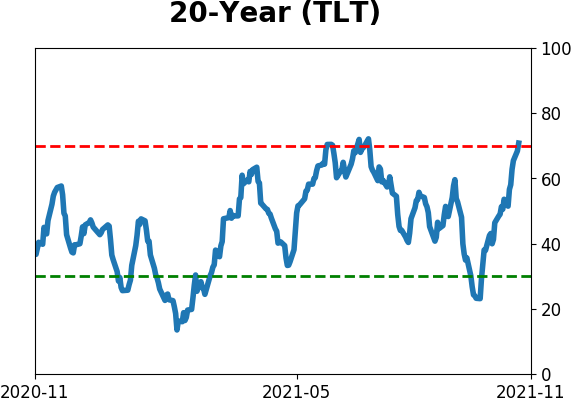
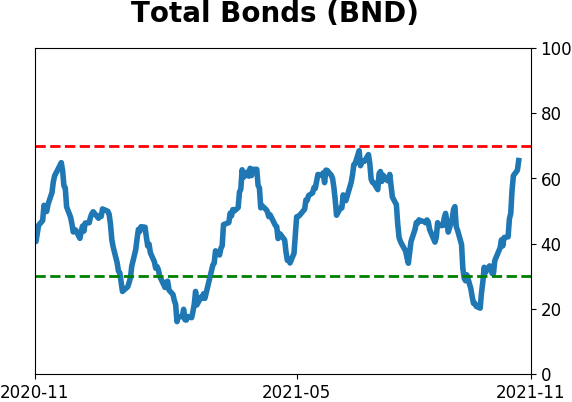
Bond ETF's - 10-Day Moving Average
|
|
|
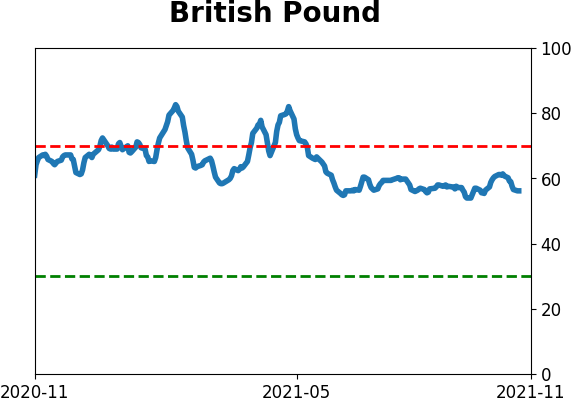
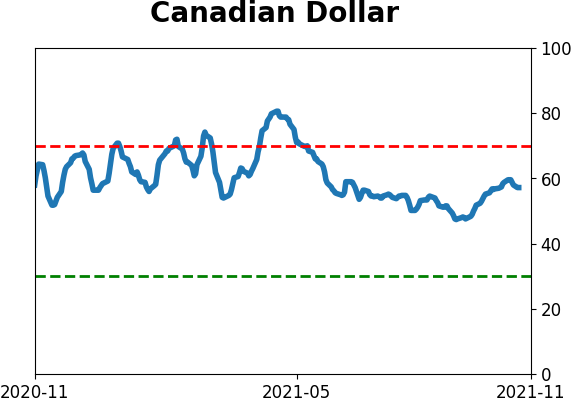
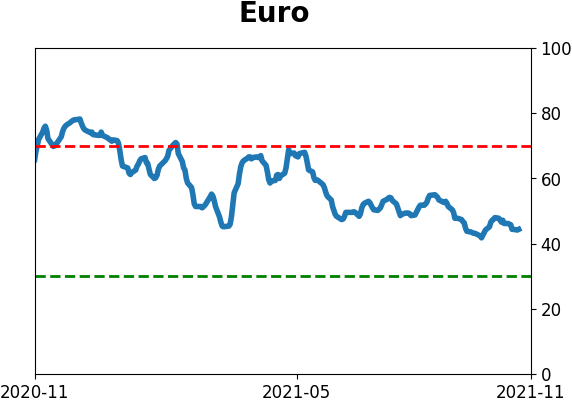
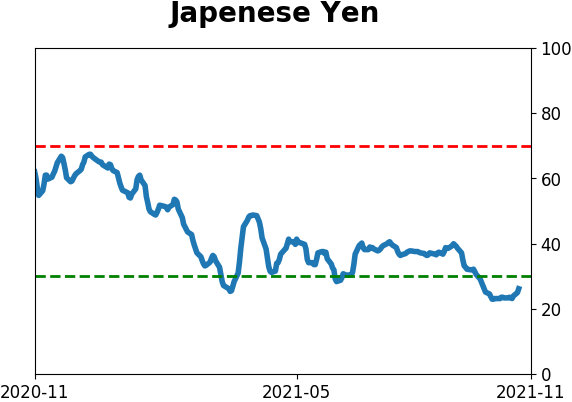
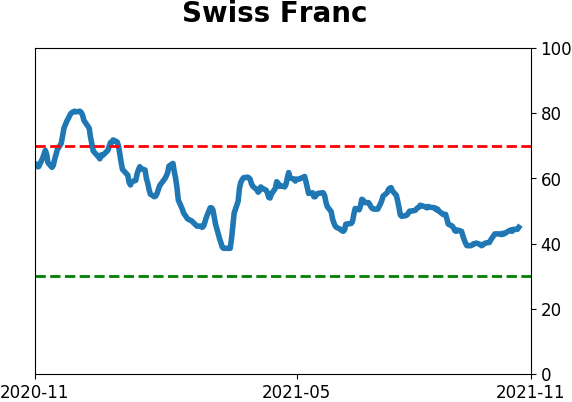
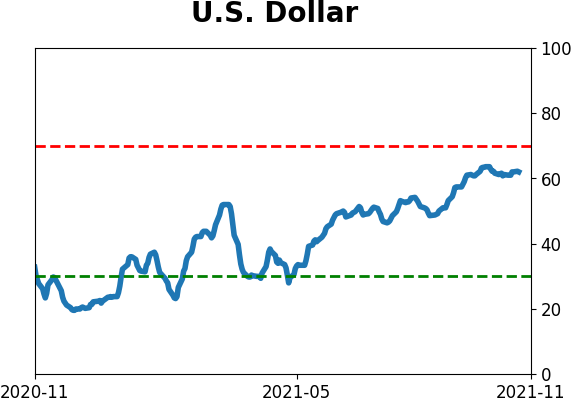
Currency ETF's - 5-Day Moving Average
|
|
|
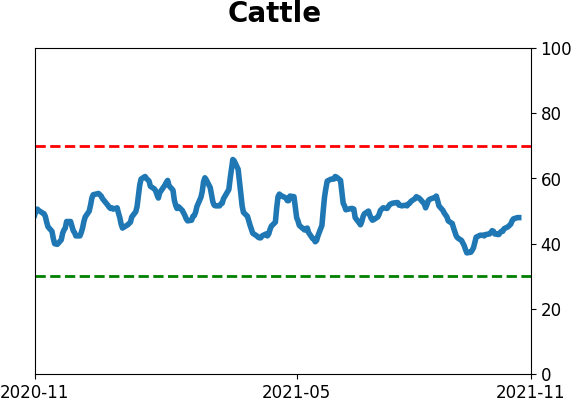
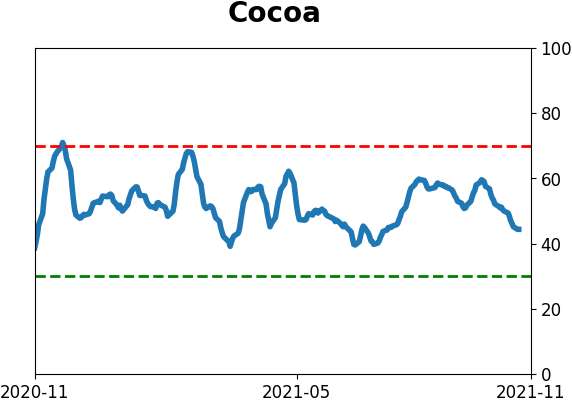
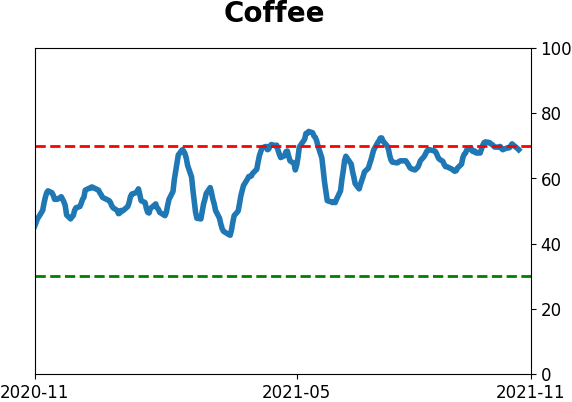
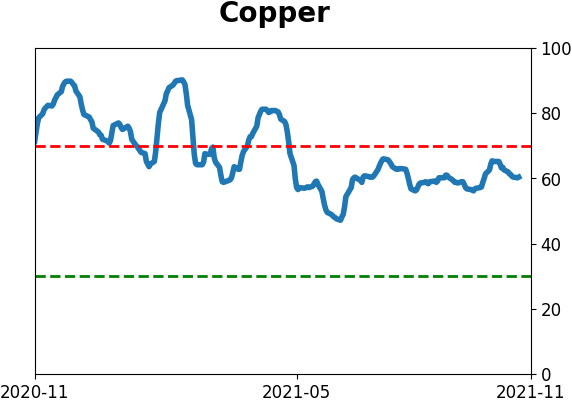
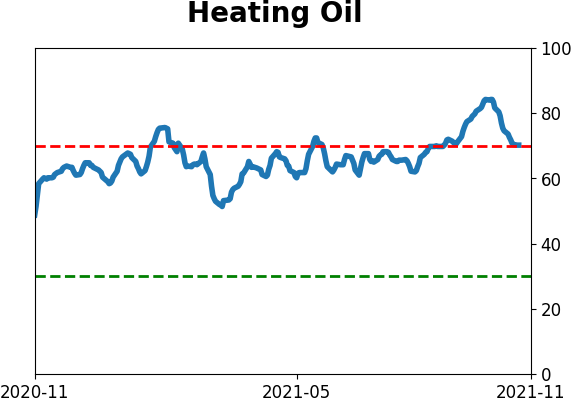
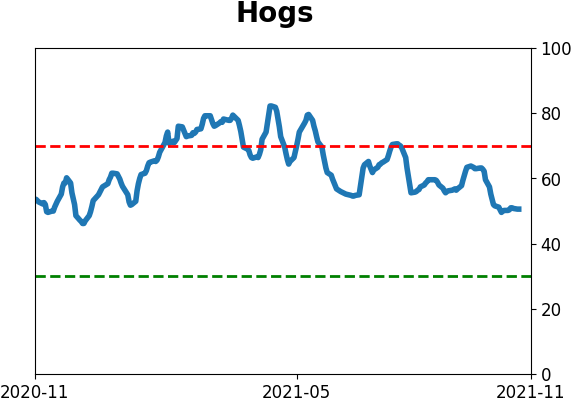
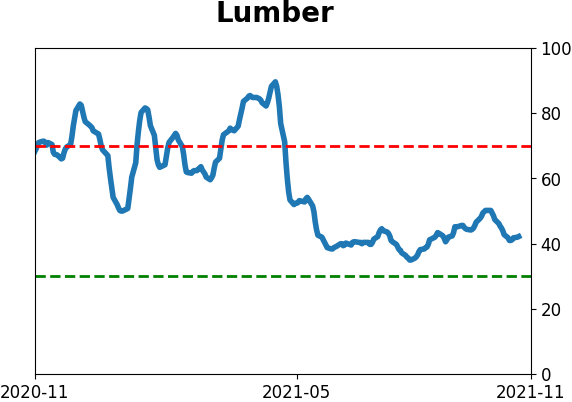
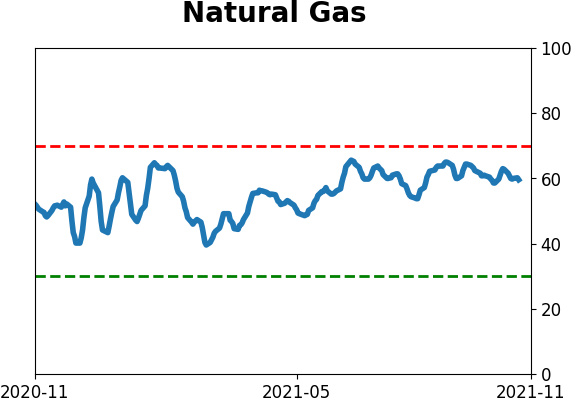
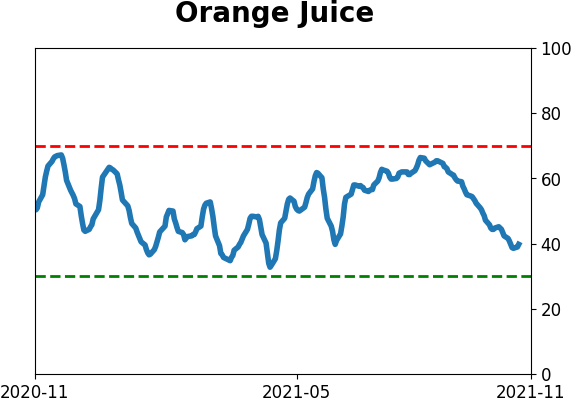
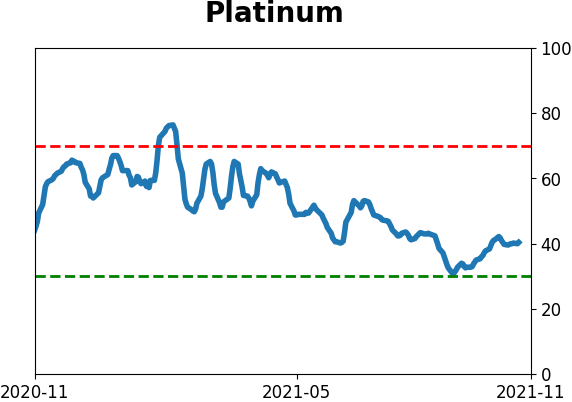
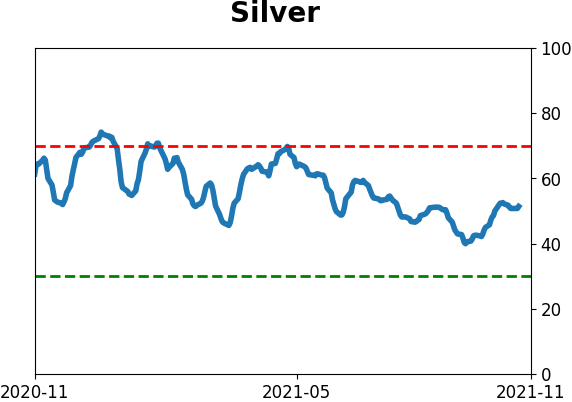
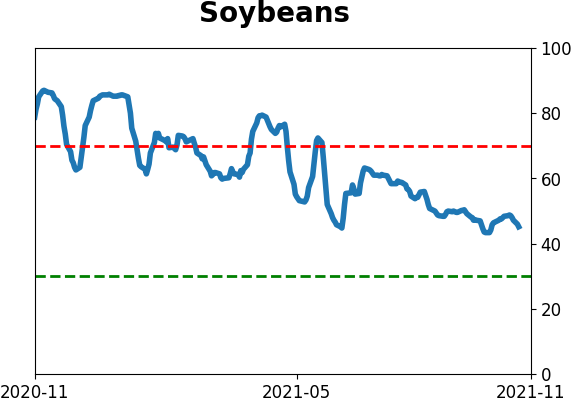
Commodity ETF's - 5-Day Moving Average
|
|