Headlines
|
|
Speculative options volume raises danger for riskier assets:
Small and large options traders bought a near-record amount of call options last week. Among all traders, net speculative volume neared the prior record from mid-February, after which higher-beta sectors saw poor returns.
Bottom Line:
STOCKS: Hold By early October, sentiment had reset. Several important momentum streaks ended, which has brought in buyers in the past, and seasonality turned positive. We're now seeing signs that sentiment has quickly shifted, especially among options traders. It's gotten to an extreme that has preceded weaker-than-average returns.
BONDS: Hold In late October, sentiment on bonds - from Treasuries to corporates - entered pessimistic territory. It's now starting to recover, with some quick moves in corporate bonds. We'll see if those bonds, in particular, can hold recent gains.
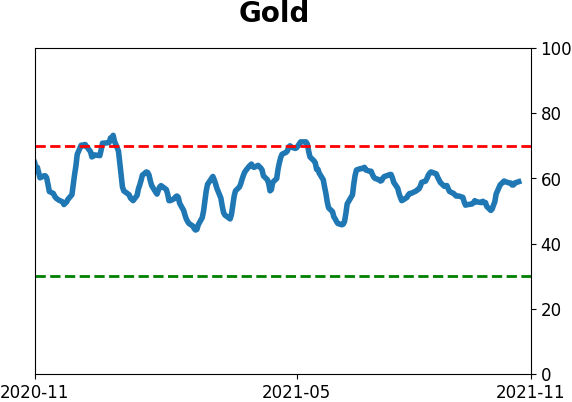
GOLD: Hold
Gold and miners were rejected after trying to recover above their 200-day averages in May. Some oversold extremes in breadth measures among miners triggered in late September, and they've recovered a bit since then. The group still has some proving to do.
|
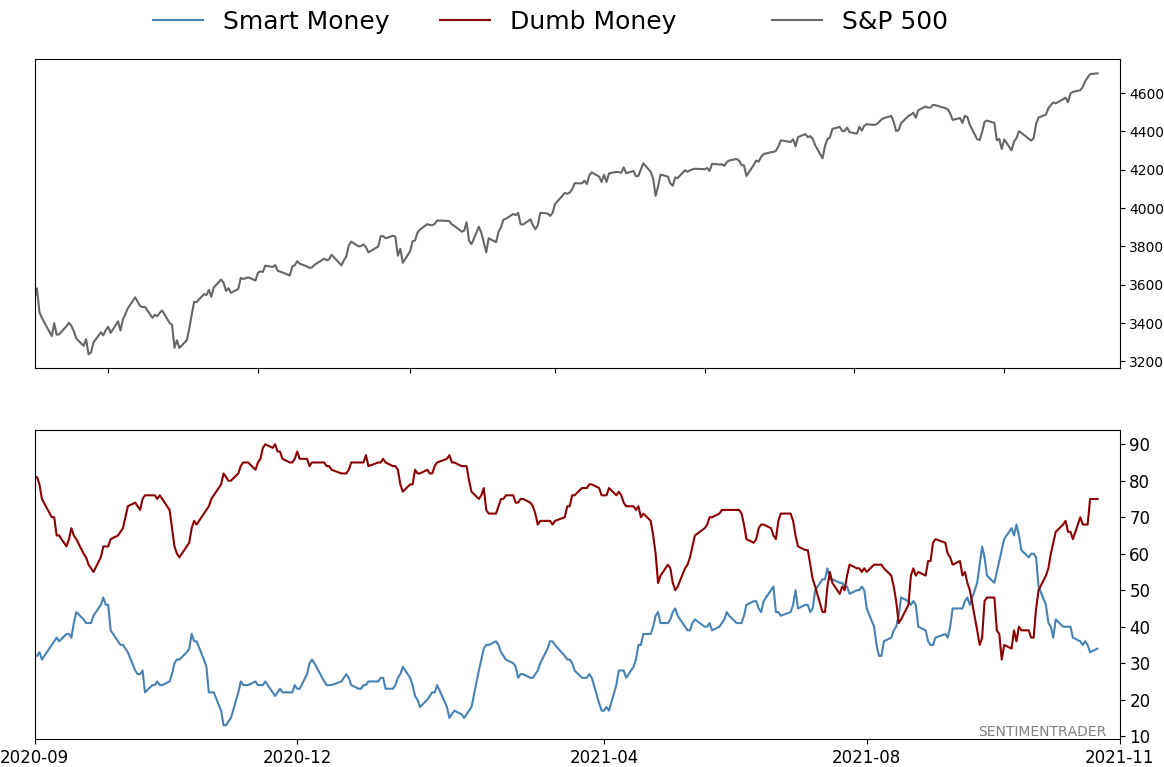
Smart / Dumb Money Confidence
|
Smart Money Confidence: 34%
Dumb Money Confidence: 75%
|
|
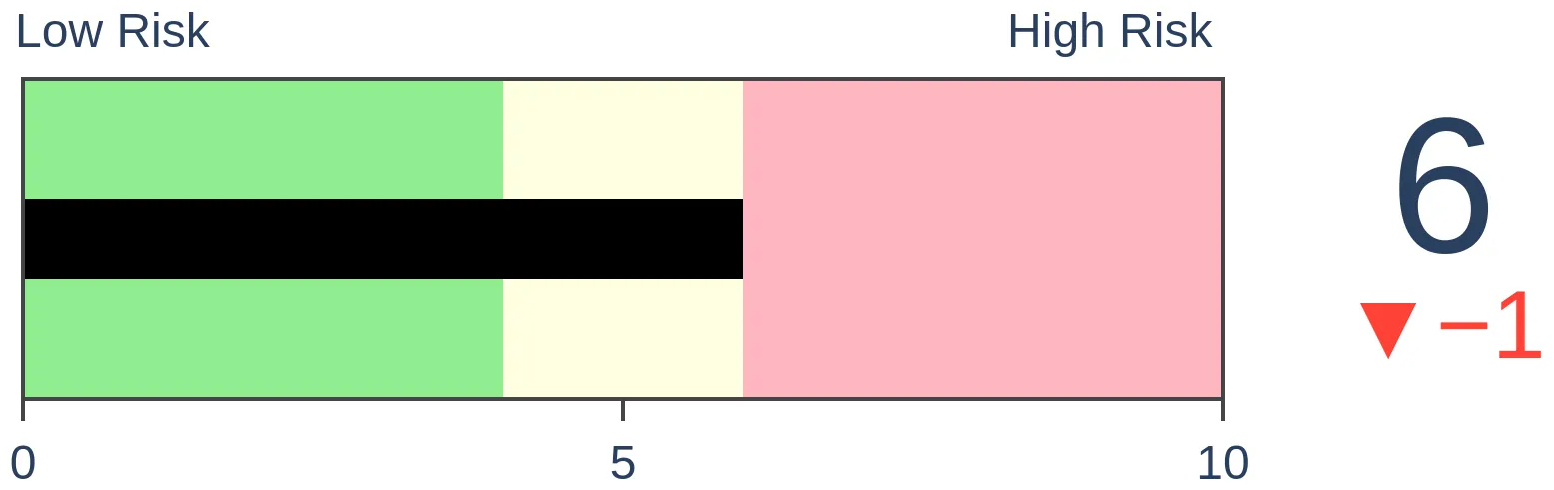
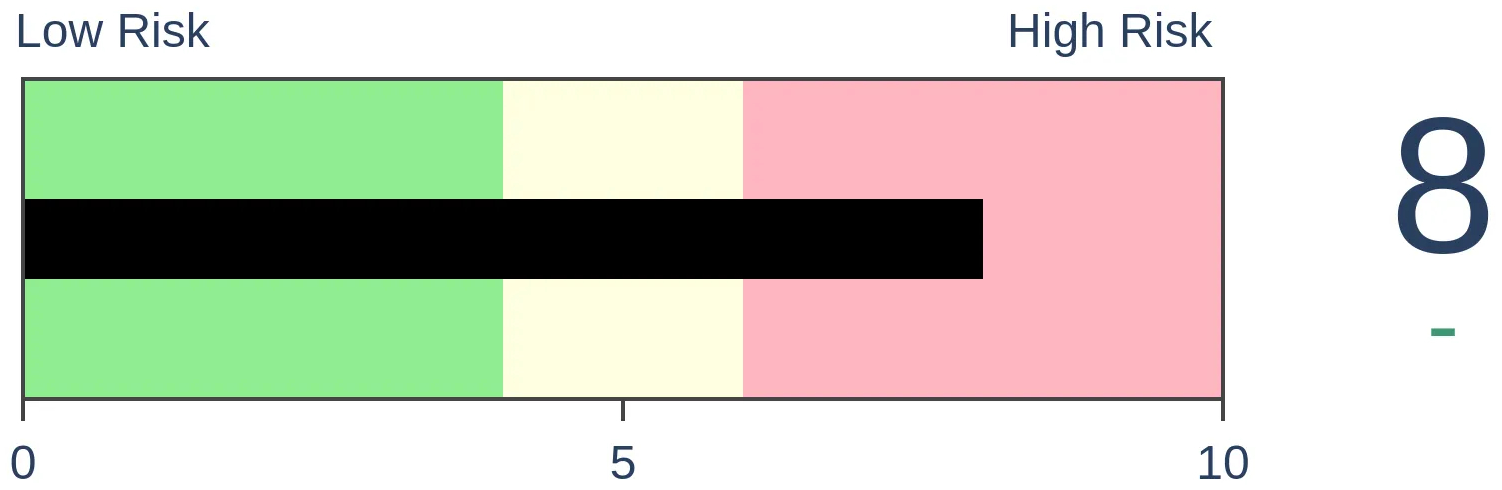
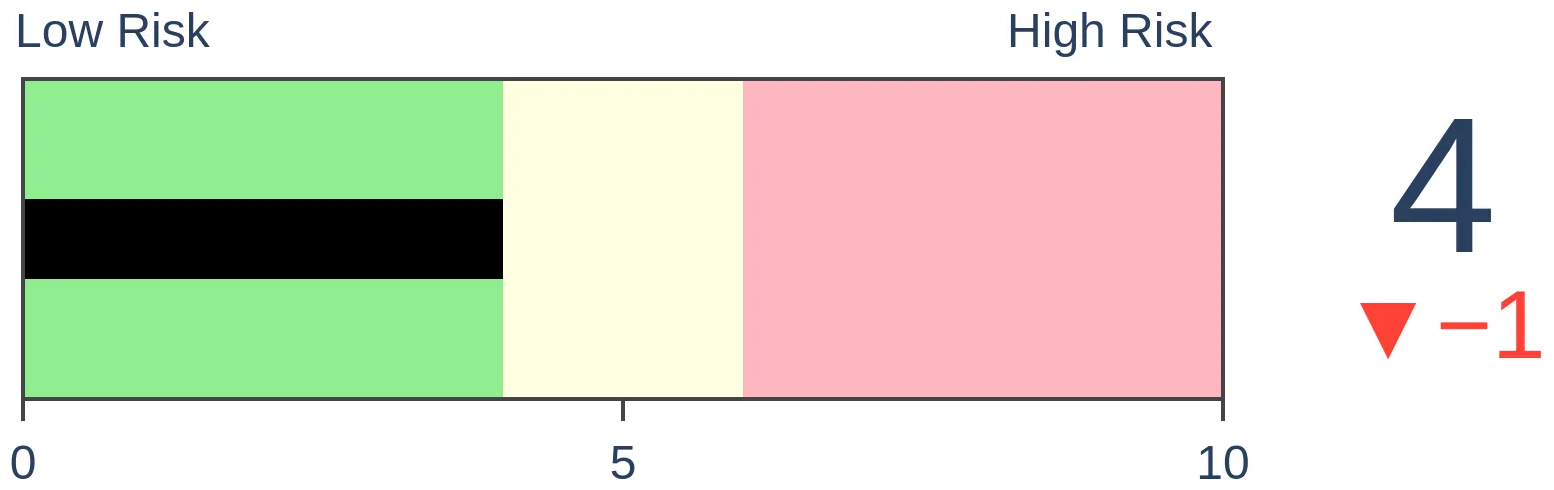
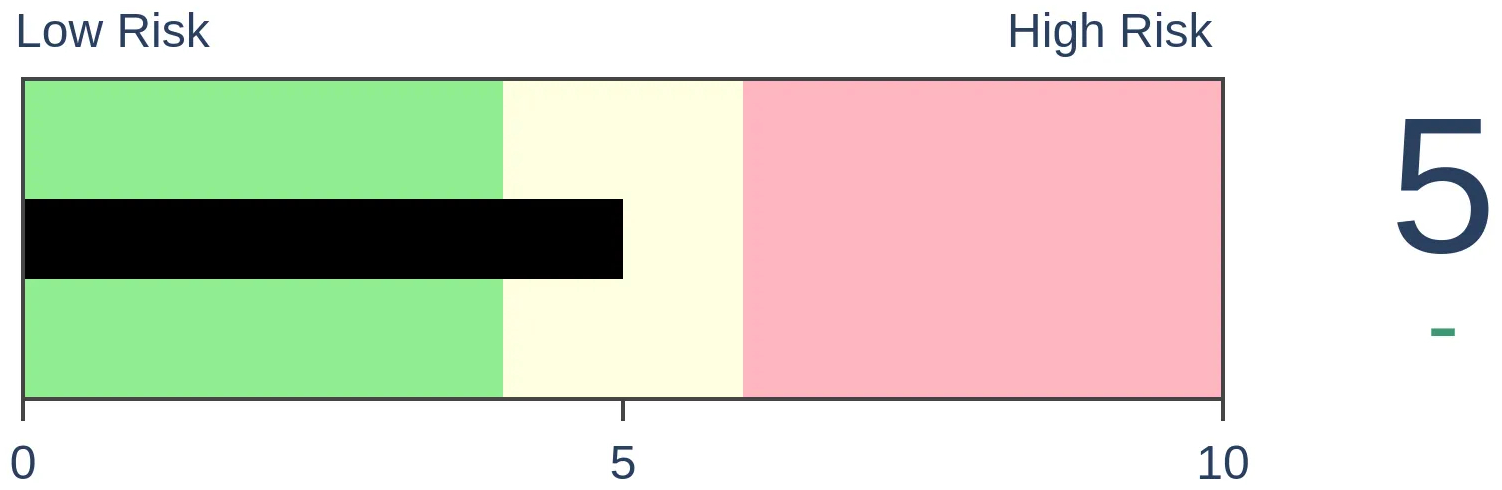
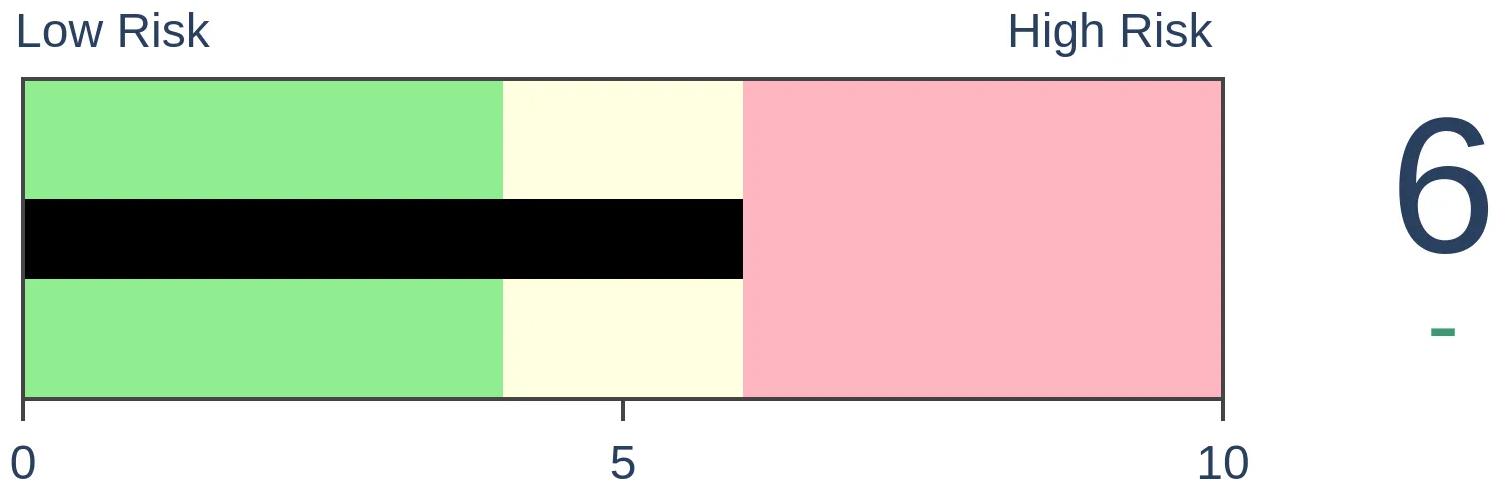
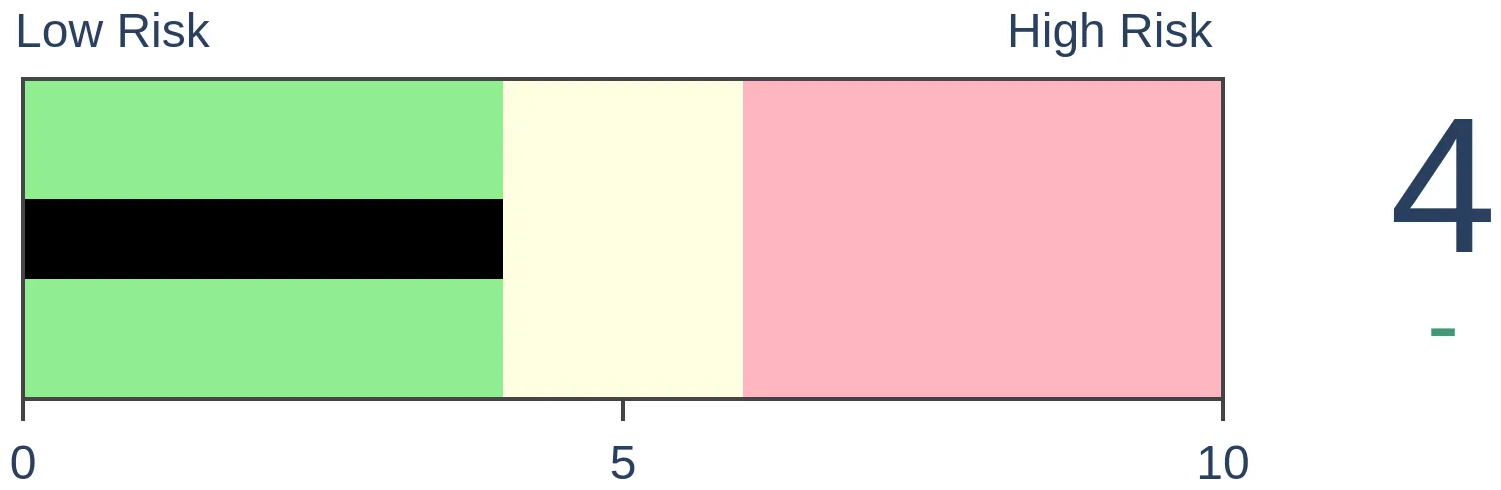
Risk Levels
Stocks Short-Term
|
Stocks Medium-Term
|
|
Bonds
|
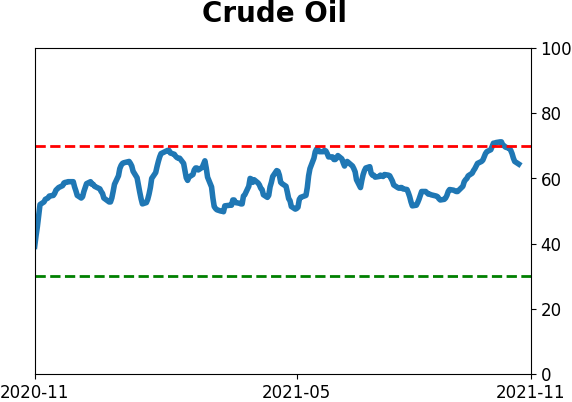
Crude Oil
|
|
Gold
|
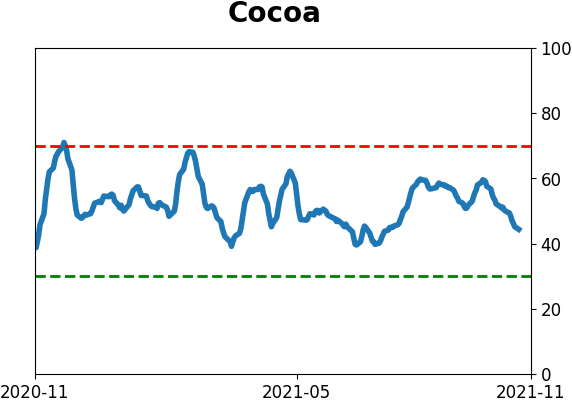
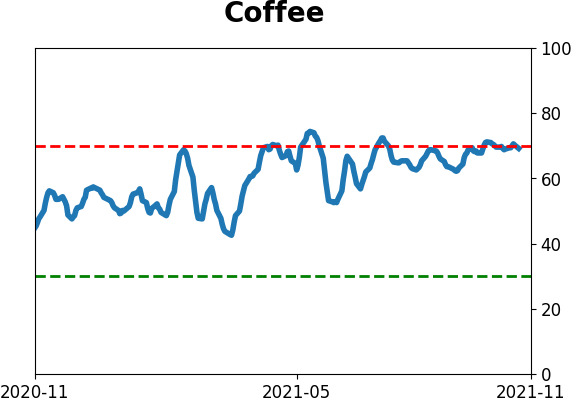
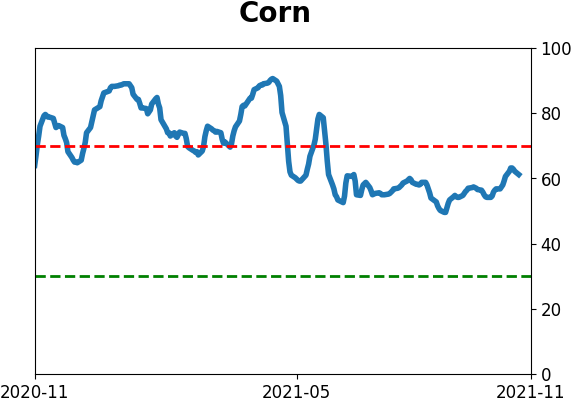
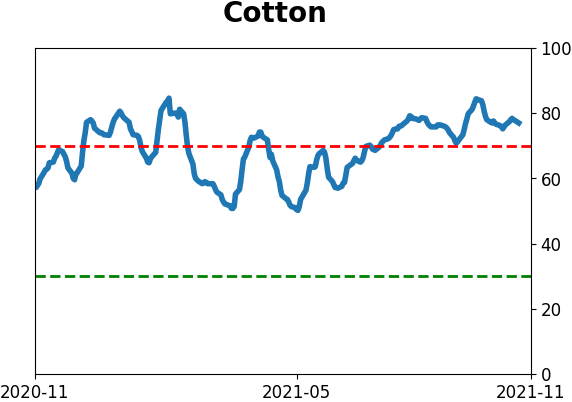
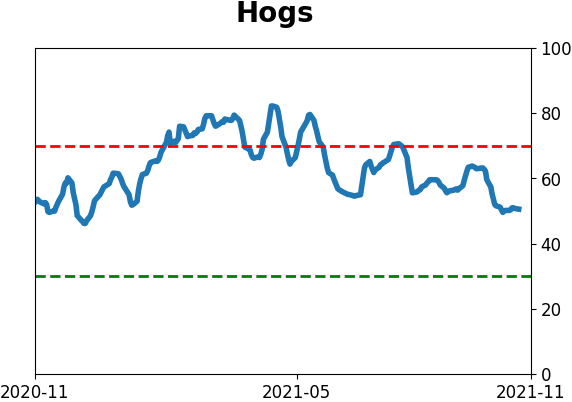
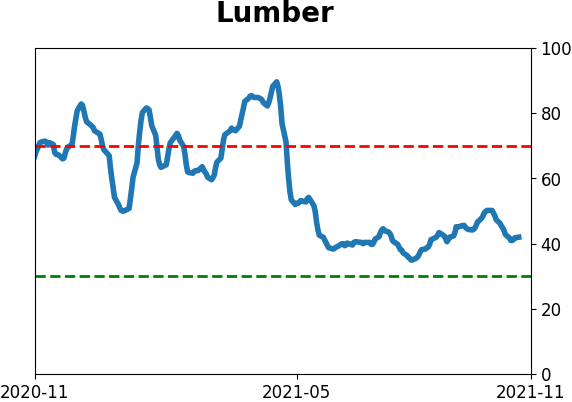
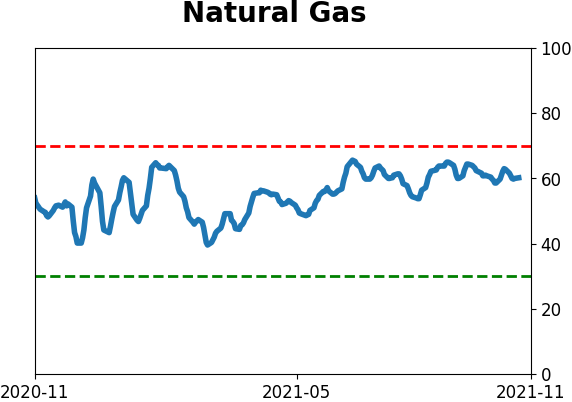
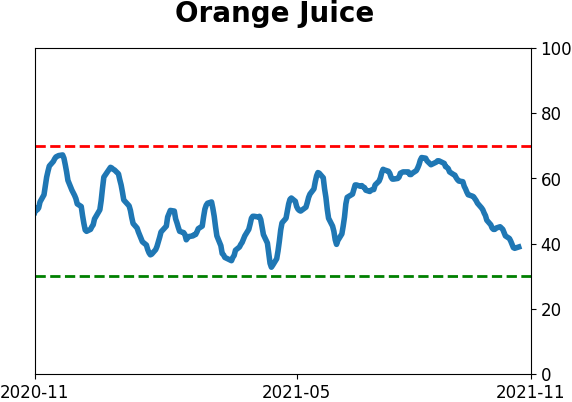
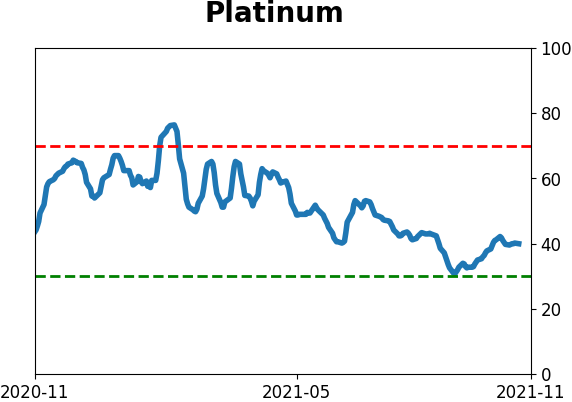
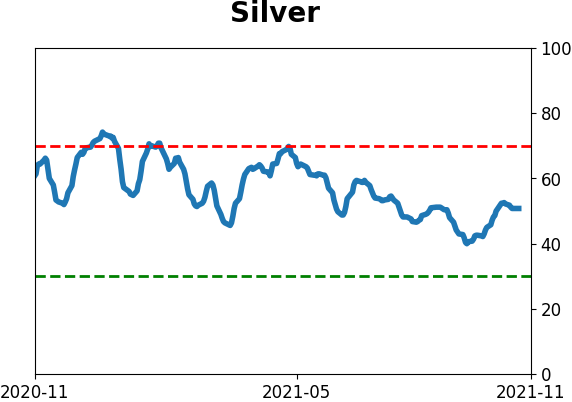
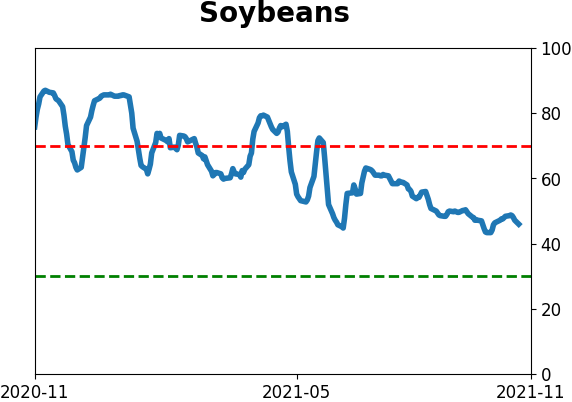
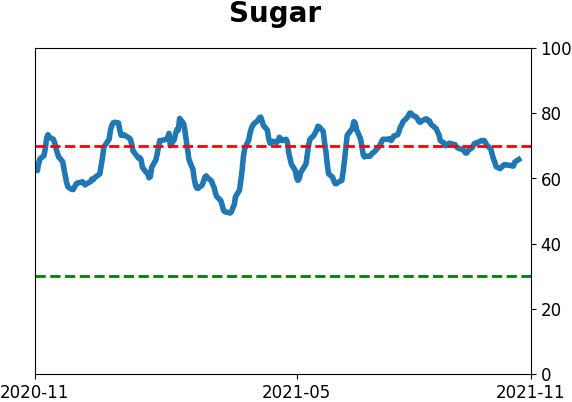
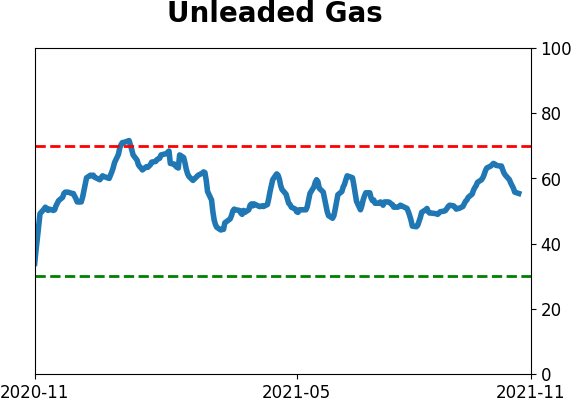
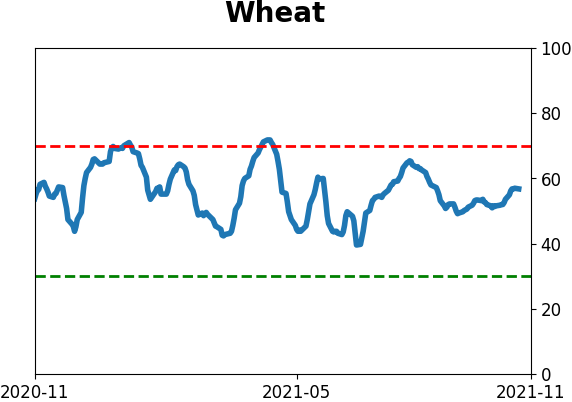
Agriculture
|
|
Research
By Jason Goepfert
BOTTOM LINE
Small and large options traders bought a near-record amount of call options last week. Among all traders, net speculative volume neared the prior record from mid-February, after which higher-beta sectors saw poor returns.
FORECAST / TIMEFRAME
None
|
Key points:
- Small and large traders spent much of their options volume on buying calls to open
- Net speculative volume among all traders neared the 22-year peak from February
- After that peak, higher-beta sectors and funds saw the worst returns
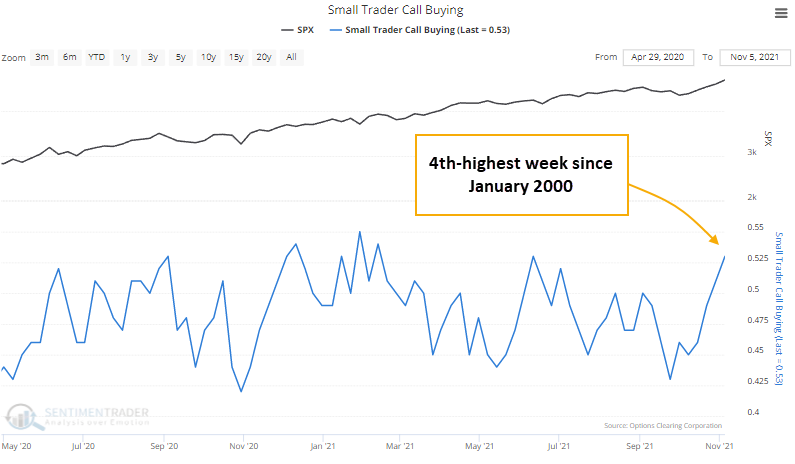
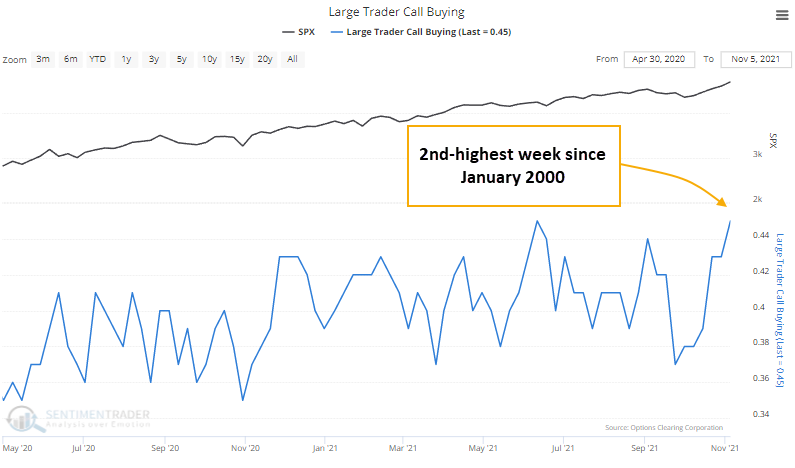
Small and large traders' call buying approaches records
Last week, we noted that options traders were quickly becoming more speculative. It hadn't reached the extremes from September 2020 or January/February 2021, but it was a stark change from the relative pessimism of just a little over a month ago.
Now, they're nearing the all-time speculative blow-off peak from February, with the smallest of traders spending 53% of their volume on buying calls to open. That ranks as the 4th-most out of the 1,141 weeks since January 2000.
It's even more extreme among large traders. They spent 45% of their volume on buying calls to open, ranking 2nd out of all weeks since January 2000.
Net speculative options volume on par with February peak
Among all traders on all U.S. exchanges, net speculative volume is equal to the peak during the week ending February 12. There's no point showing the complete history as we did last week because extremes over the past year are so far beyond anything seen in the prior 20 years that it completely distorts a chart.

Implied volatility declined last week, so options prices were a little cheaper, but overall premiums spent on speculative trading remained near record highs.
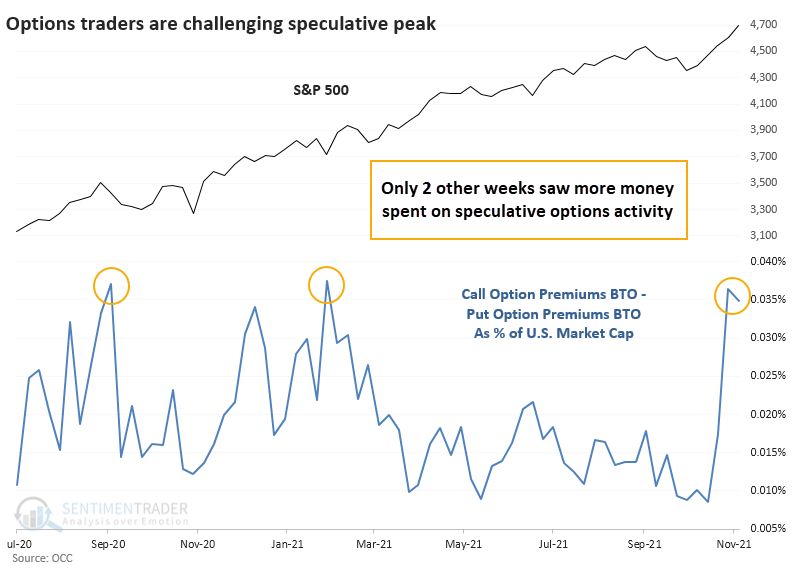
The prior peaks didn't precede any significant damage in the S&P 500 - its price chart has been solidly up and to the right. But there were periods of several weeks following the other two speculative spikes where prices chopped around. And, it disguises some more notable weakness in other areas of the market.
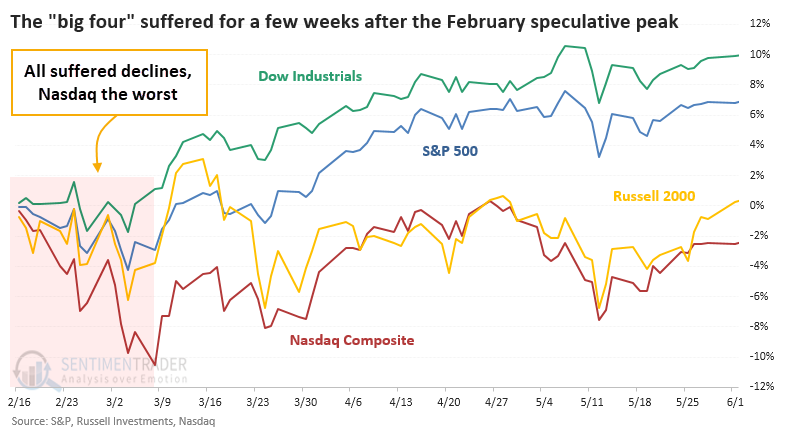
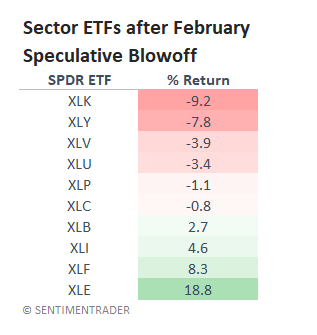
February peak led to under-performing risky assets
The only true comparison to the type of speculative options behavior last week is the week ending February 12. After that blow-off, each of the "big four" indexes suffered declines lasting about 3 weeks. The Dow suffered the least; the Nasdaq lost the most.
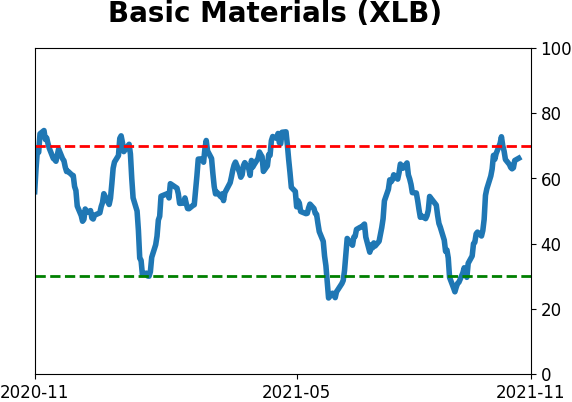
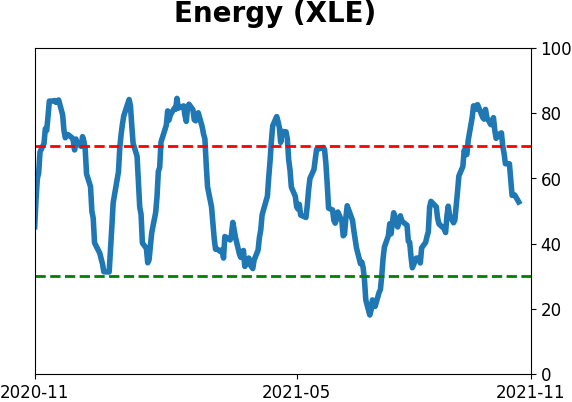
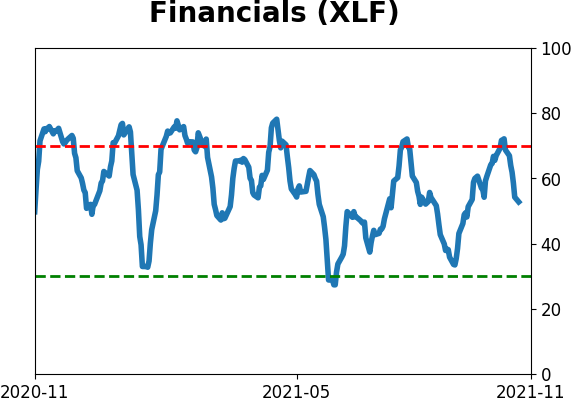
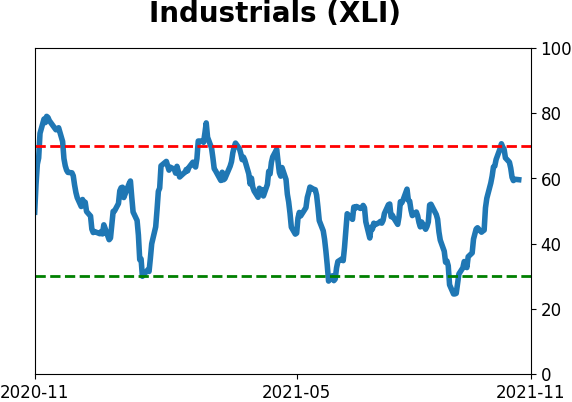
Looking at the major SPDR sector ETFs, Technology (XLK) and Discretionary (XLY) took the brunt of the losses while Financials (XLF) and Energy (XLE) did very well. The table shows returns for each fund in the 15 trading days following the February 12 peak in speculative options volume.
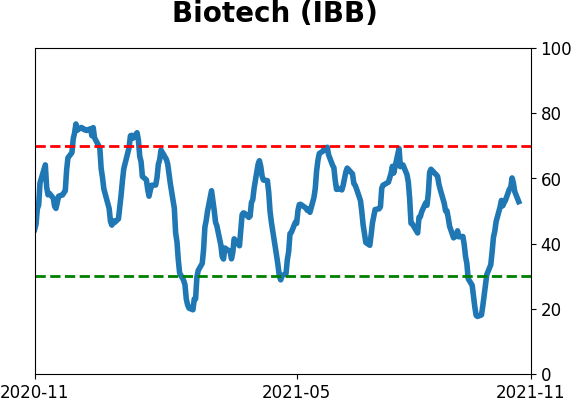
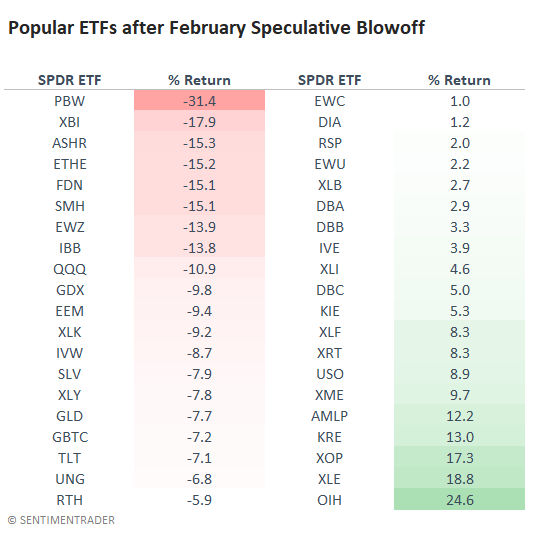
Among popular ETFs, some of the most speculative names, that required investors to have the most faith in future returns instead of present earnings, took some of the largest haircuts. Among them were Clean Energy (PBW), Biotech (XBI and IBB), Tech (FDN, SMH, QQQ), and Crypto (ETHE, GBTC). Winners were once again in Financials (KRE) and Energy (AMLP, XLP, XLE, OIH).
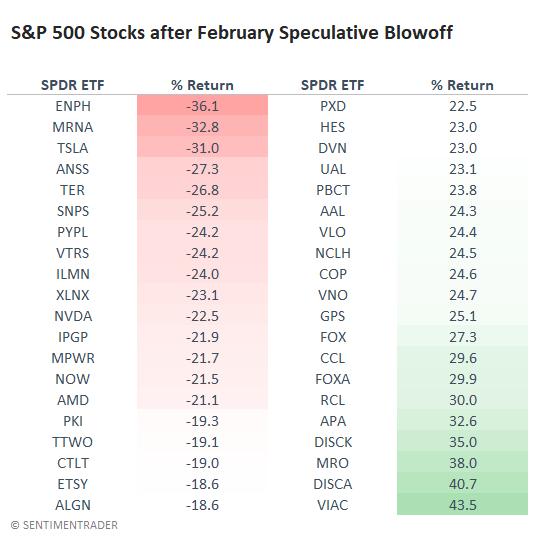
And among individual stocks in the S&P 500, a couple of standout losers were Moderna (MRNA) and Tesla (TSLA), while several entertainment companies were at or near the top of the best performers.
What the research tells us...
It's dangerous to try to extrapolate too much about the next few weeks based on a sample size of one, especially when we're dealing with individual stocks. When looking at some of the most popular funds, and the sector SPDRs, the clear pattern is that some of the most speculative areas of the market took the biggest hits and took the longest to recover.
That makes a lot of sense following a speculative peak. We don't know if last week's options trading activity is a peak yet, only that it rivals others seen during the past year and a half. But it's a good bet that it is and that speculative stocks are in the danger zone now.
Active Studies
| Time Frame | Bullish | Bearish | | Short-Term | 2 | 0 | | Medium-Term | 10 | 0 | | Long-Term | 11 | 5 |
|
Indicators at Extremes
Portfolio
| Position | Description | Weight % | Added / Reduced | Date | | Stocks | RSP | 10.7 | Added 6.4% | 2021-10-01 | | Bonds | 32.7% BND, 7.1% SCHP | 39.8 | Added 8.3% | 2021-10-26 | | Commodities | GCC | 2.4 | Reduced 2.1%
| 2020-09-04 | | Precious Metals | GDX | 4.6 | Reduced 4.2% | 2021-05-19 | | Special Situations | 9.8% KWEB, 4.7% XLE, 2.9% PSCE | 17.3 | Added 9.78% | 2021-10-01 | | Cash | | 24.1 | | |
|
Updates (Changes made today are underlined)
Much of our momentum and trend work has remained positive for several months, with some scattered exceptions. Almost all sentiment-related work has shown a poor risk/reward ratio for stocks, especially as speculation drove to record highs in exuberance in February. Much of that has worn off, and most of our models are back toward neutral levels. There isn't much to be excited about here. The same goes for bonds and even gold. Gold has been performing well lately and is back above long-term trend lines. The issue is that it has a poor record of holding onto gains when attempting a long-term trend change like this, so we'll take a wait-and-see approach. Momentum has ebbed quickly in recent weeks, and nearing oversold levels in some indicators. This can be a dangerous area, with a lot of short-term volatility, but we'd be more inclined to add medium- to long-term exposure rather than sell on much more of a decline, thanks to already rock-bottom exposure. Other areas look more attractive, including some overseas markets. RETURN YTD: 11.4% 2020: 8.1%, 2019: 12.6%, 2018: 0.6%, 2017: 3.8%, 2016: 17.1%, 2015: 9.2%, 2014: 14.5%, 2013: 2.2%, 2012: 10.8%, 2011: 16.5%, 2010: 15.3%, 2009: 23.9%, 2008: 16.2%, 2007: 7.8%
|
|
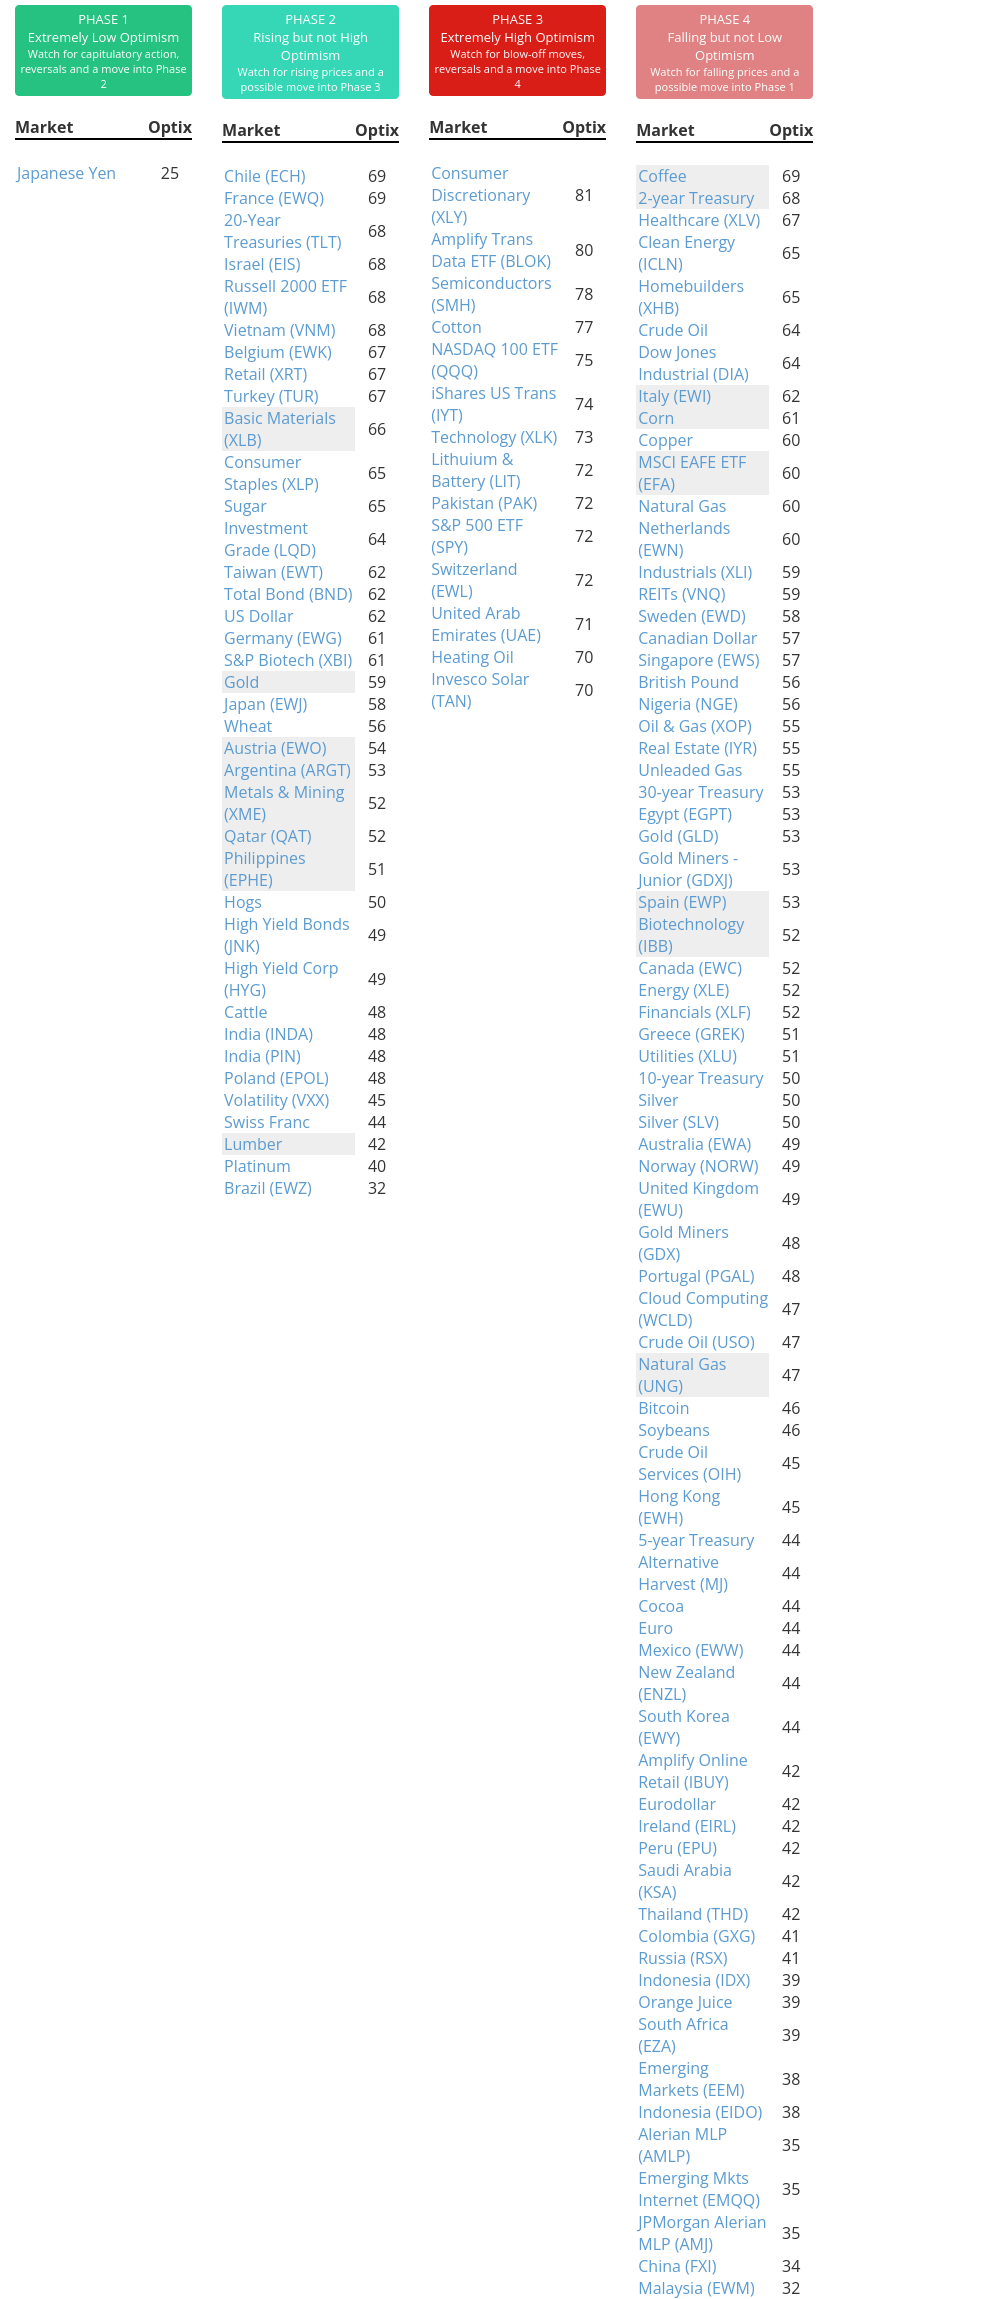
Phase Table
Ranks
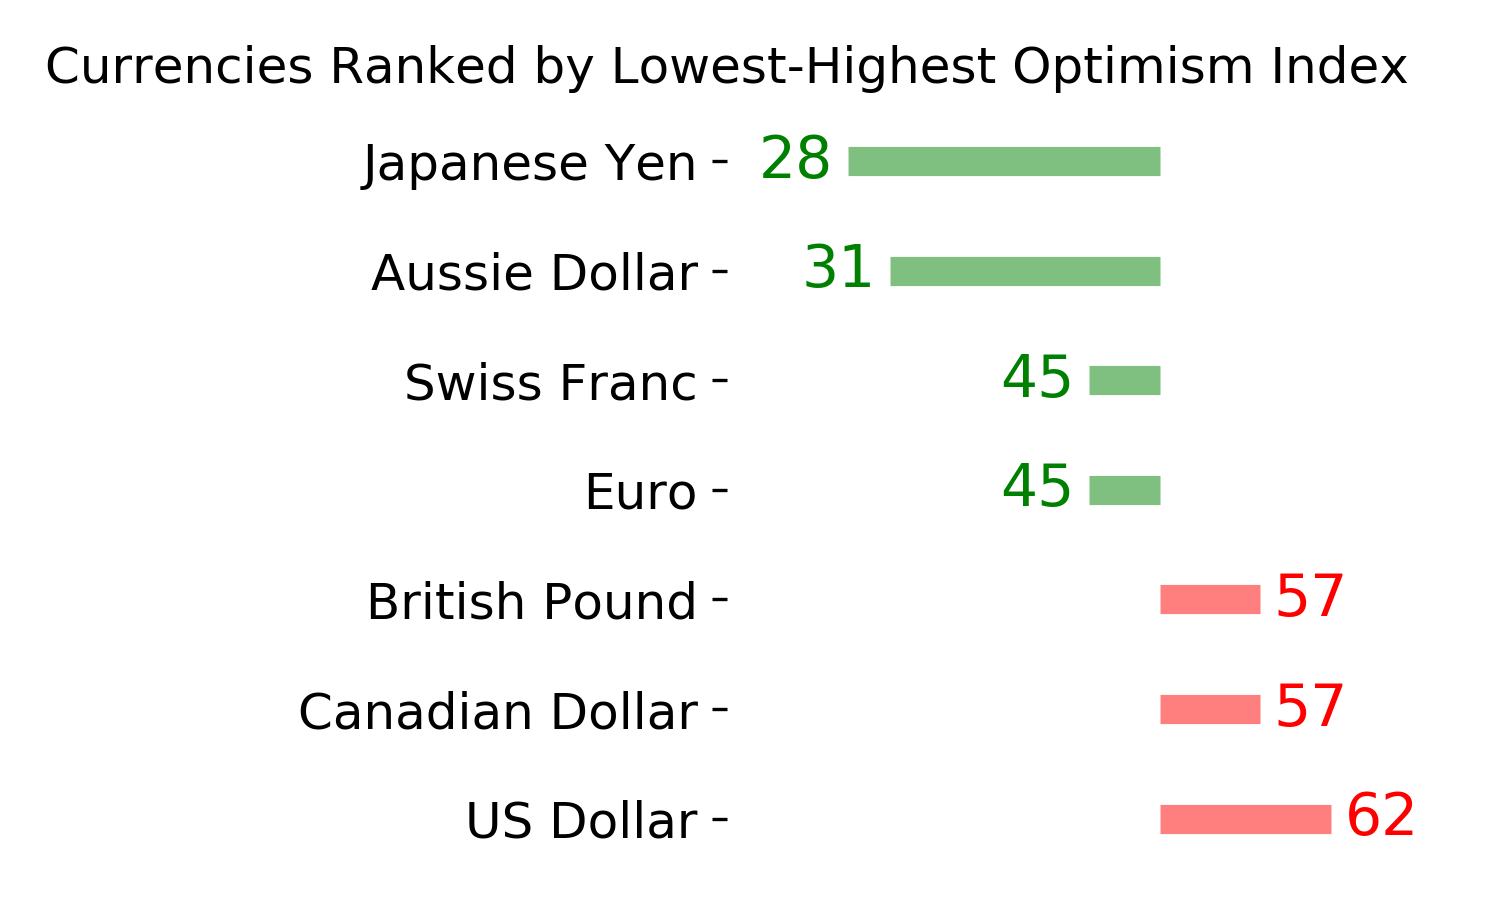
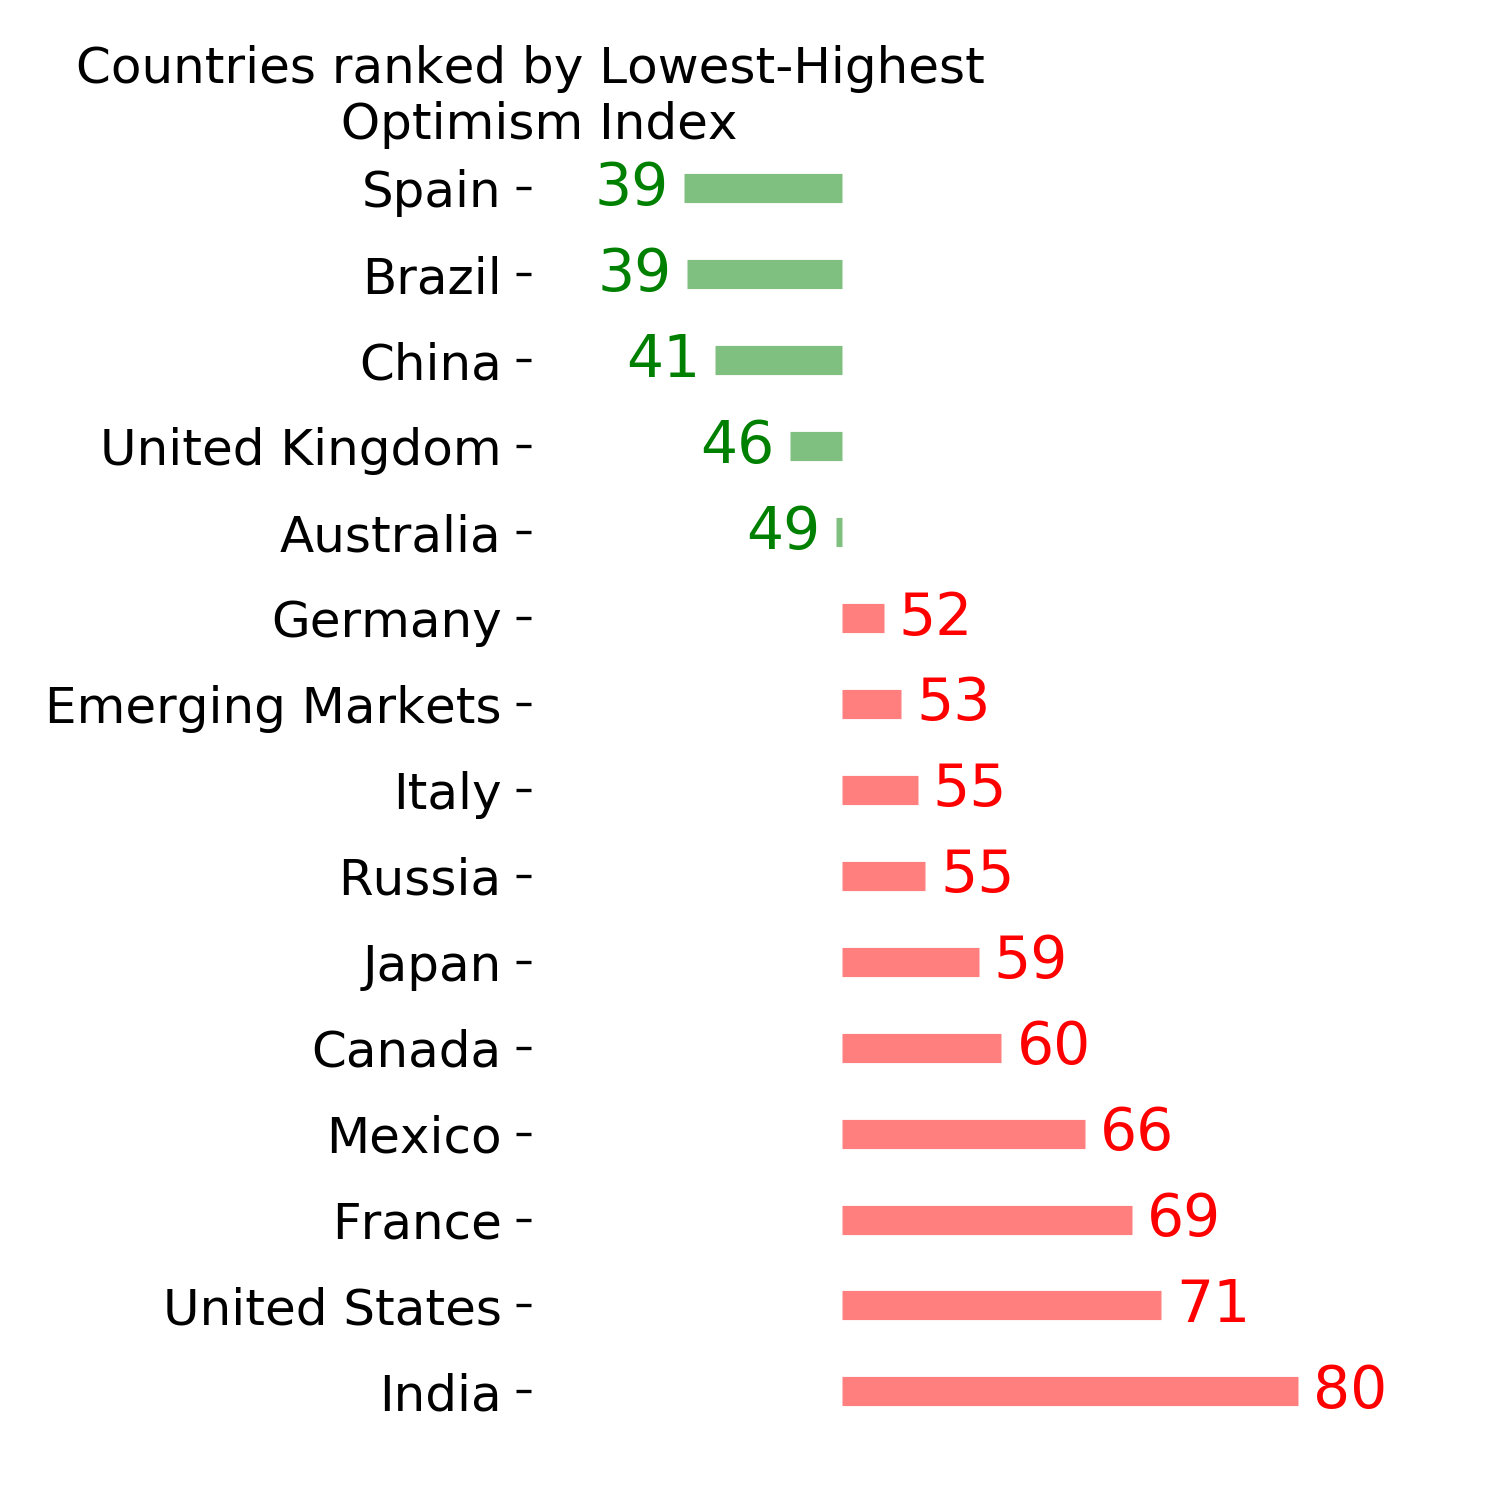
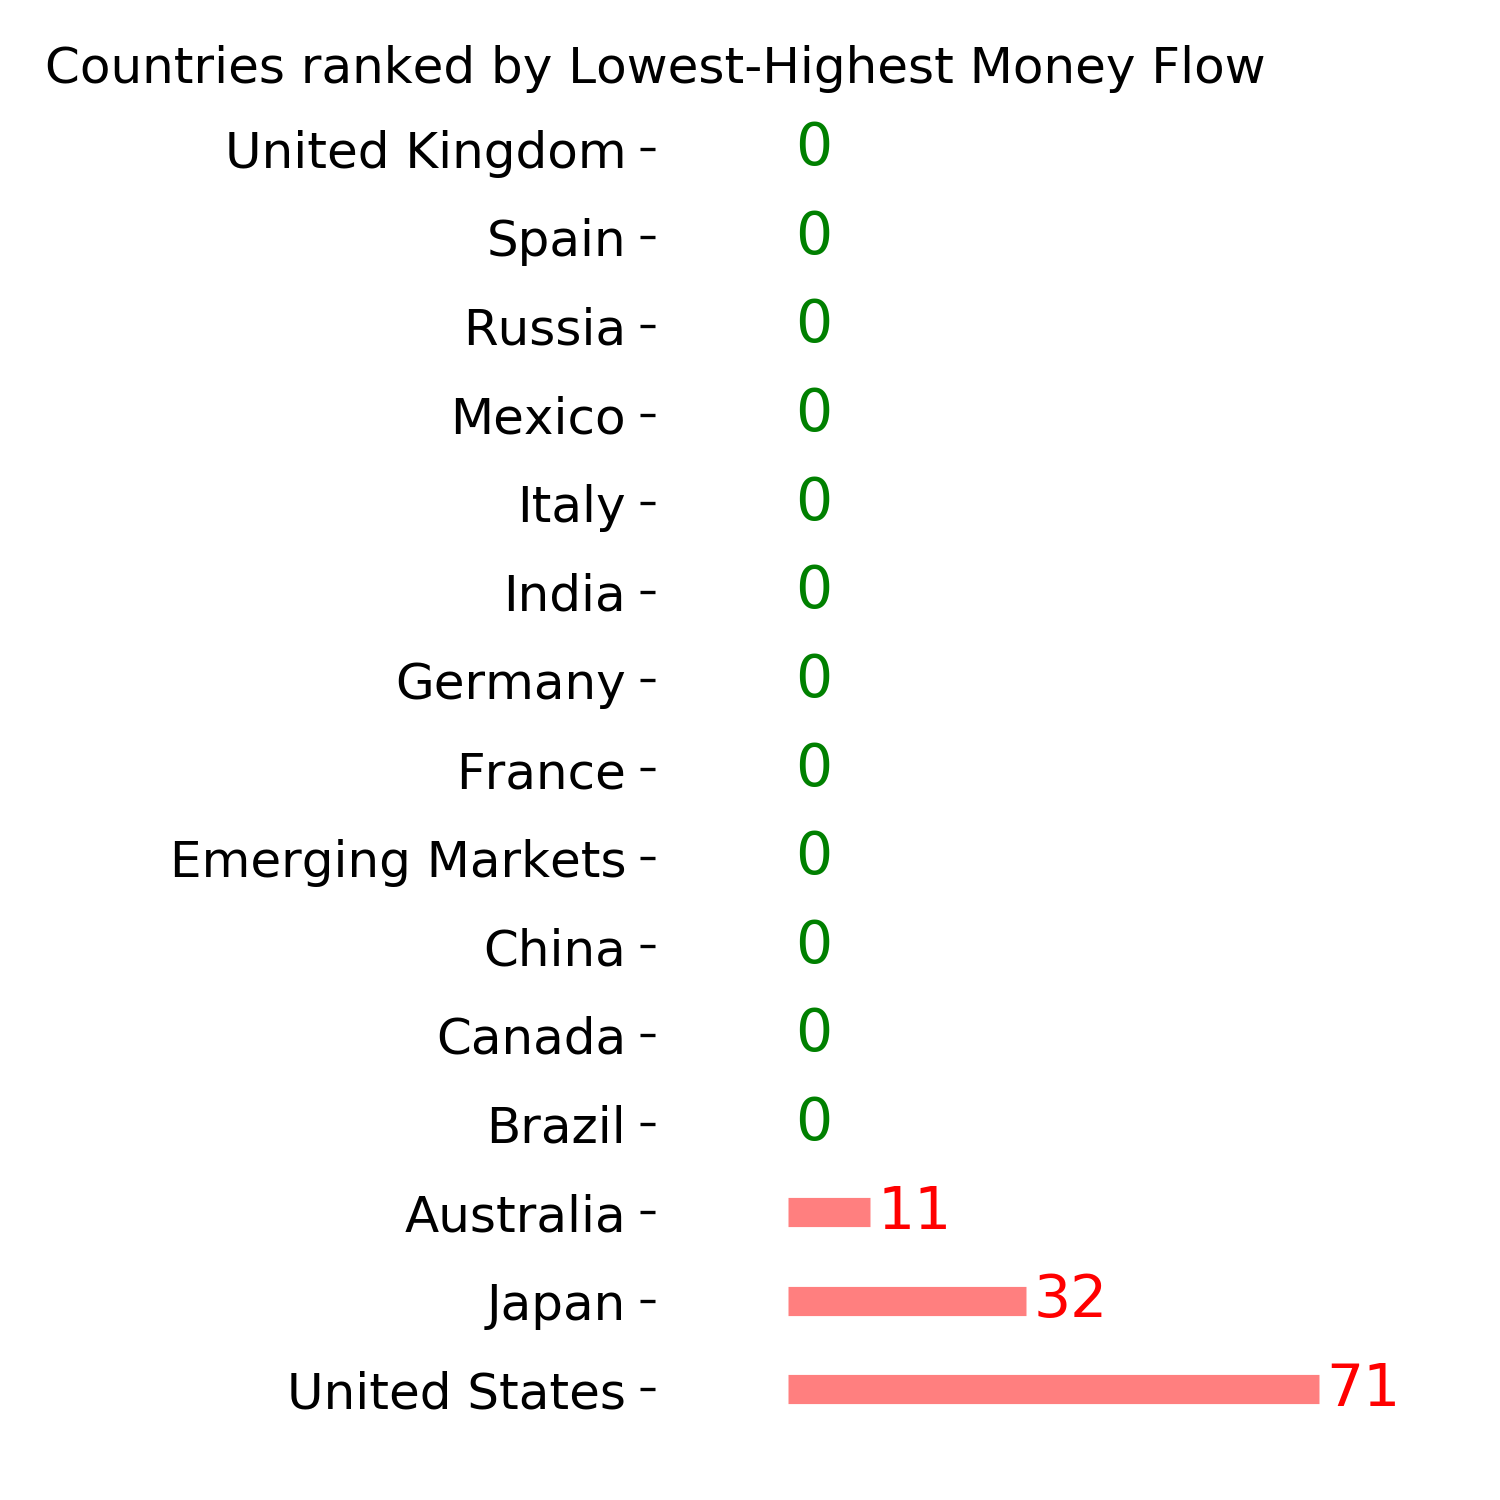
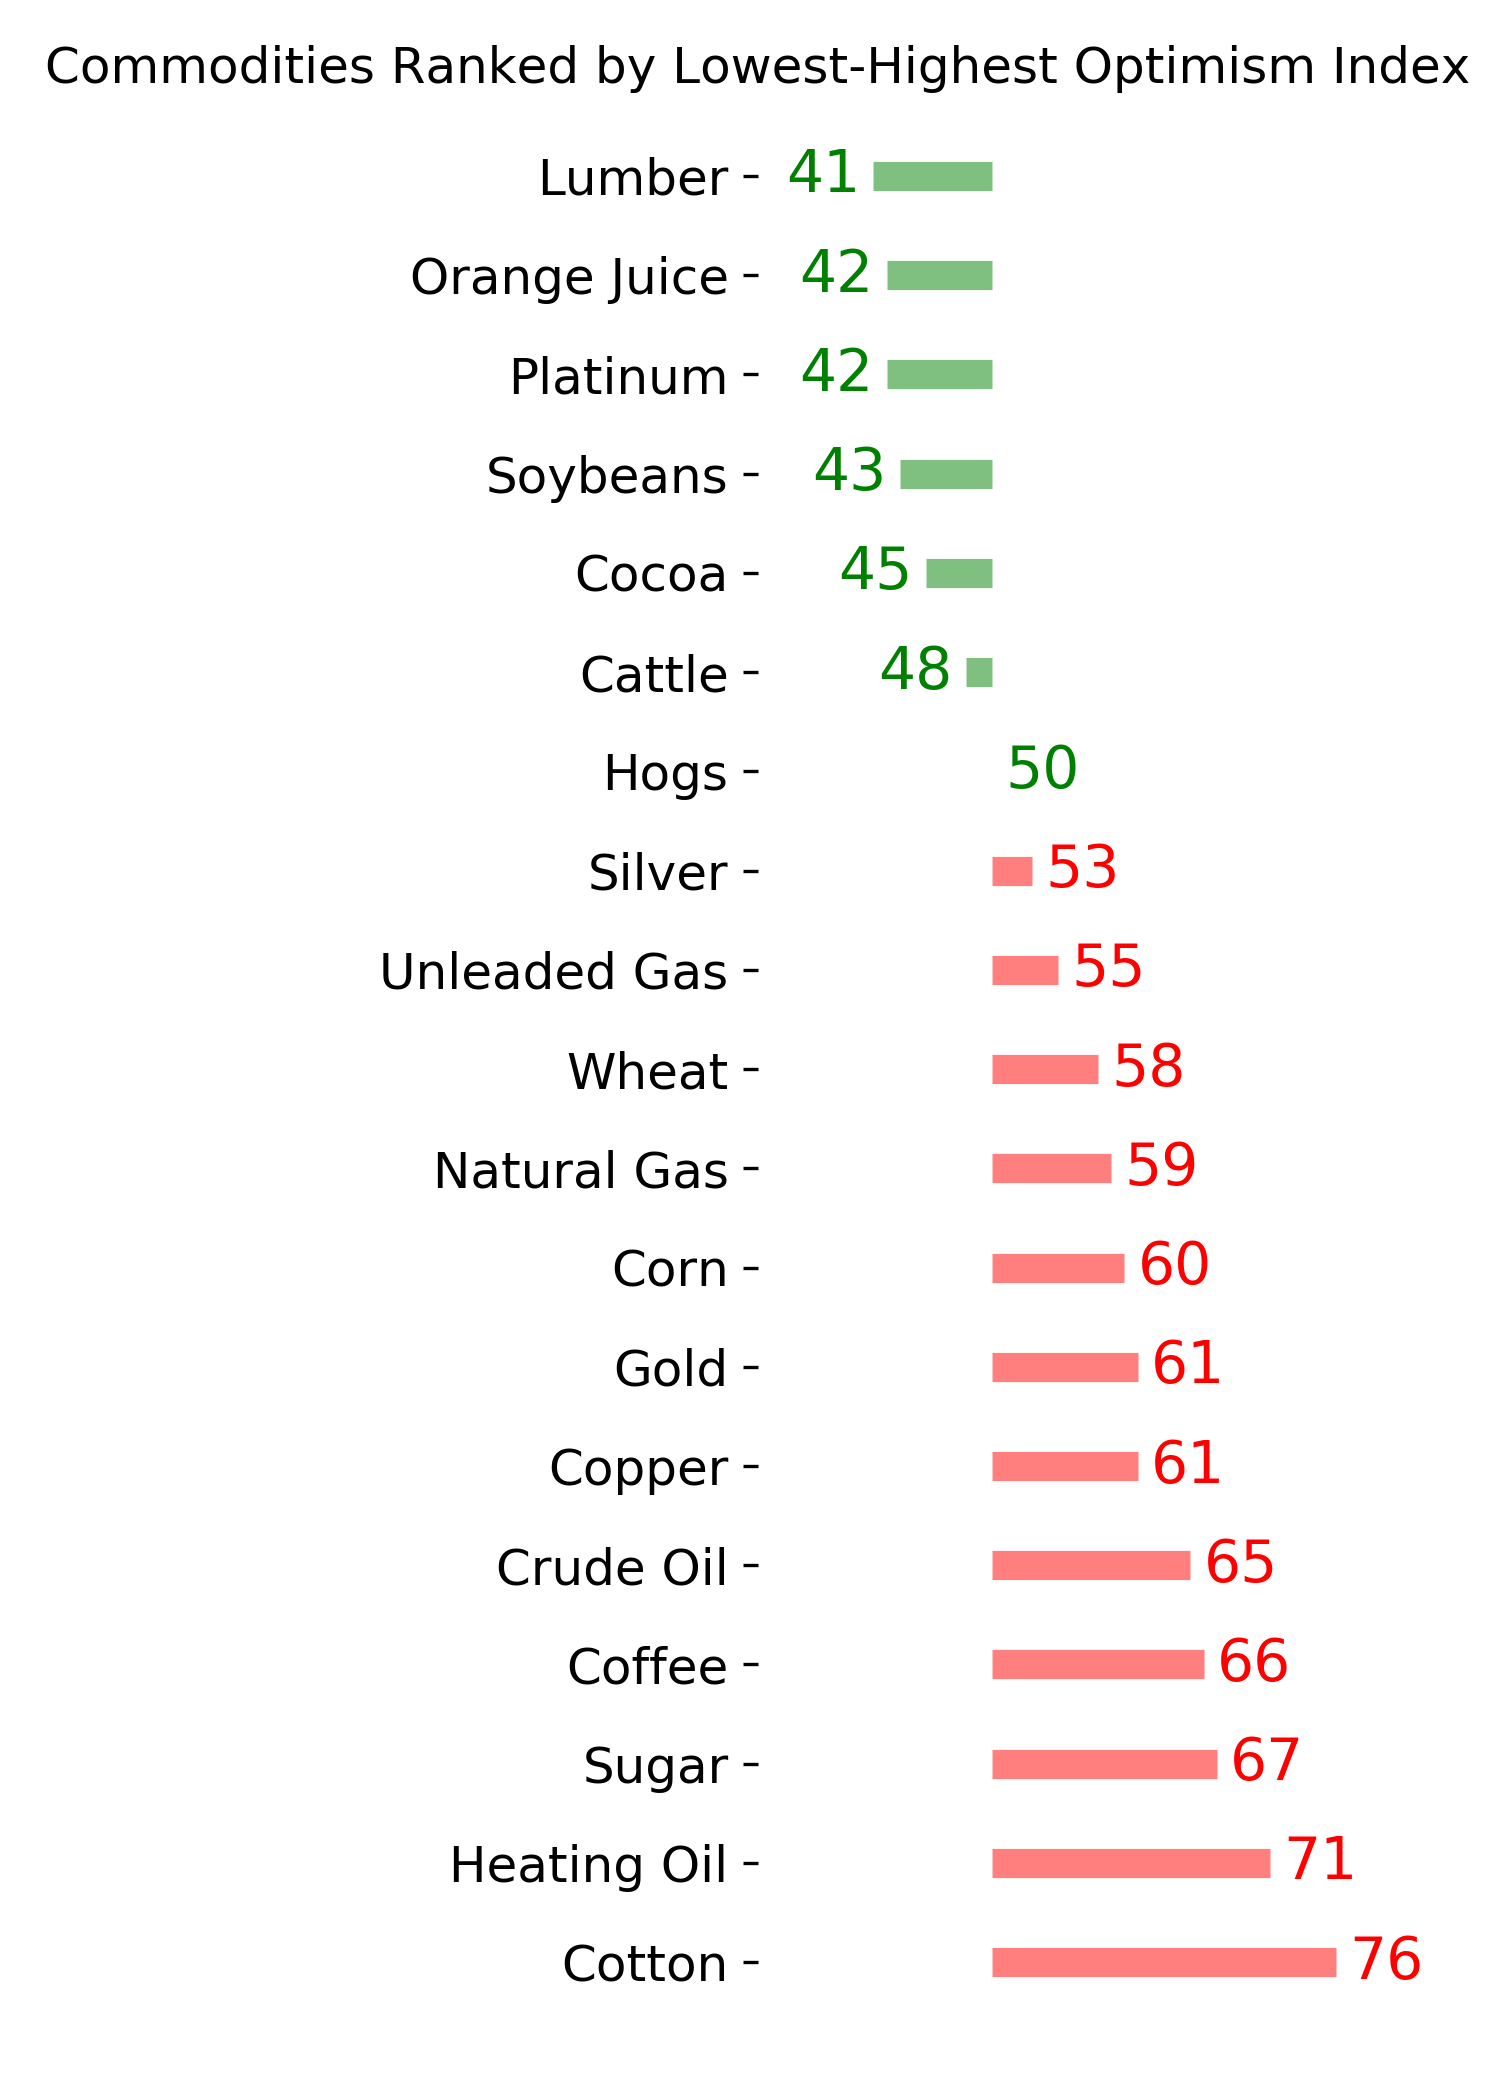
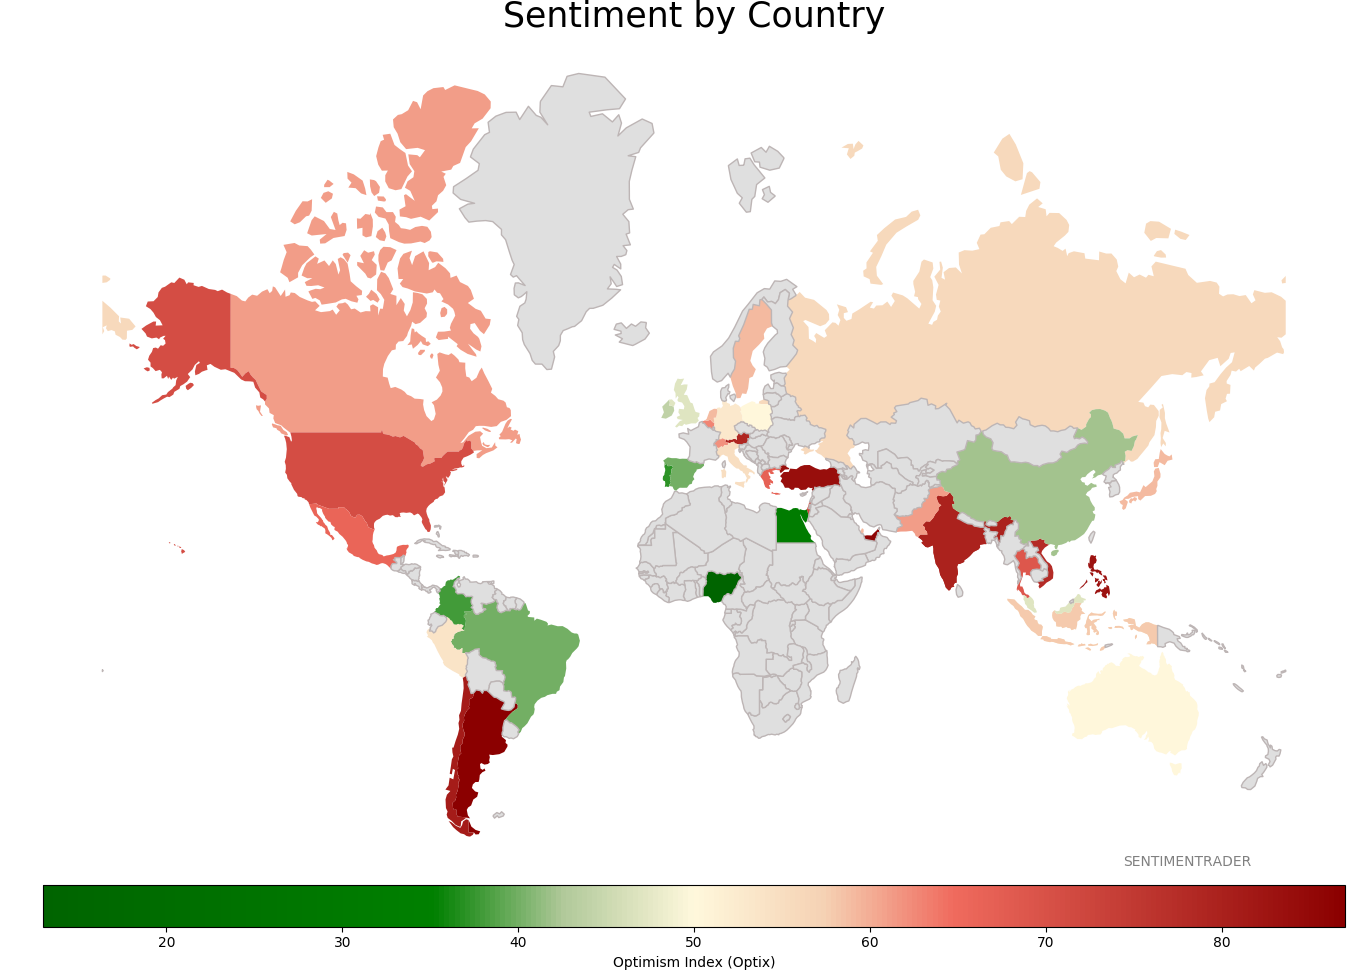
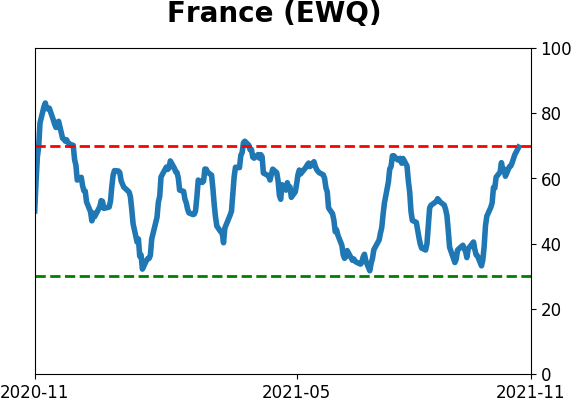
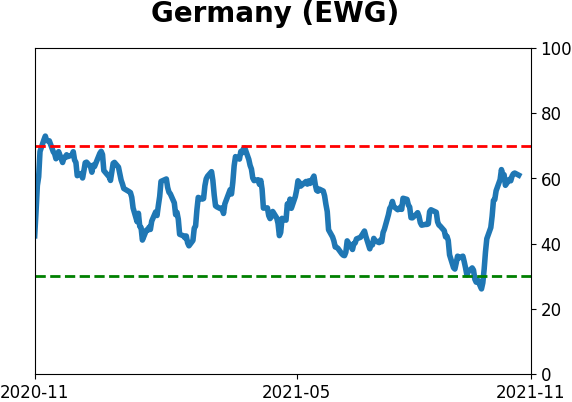
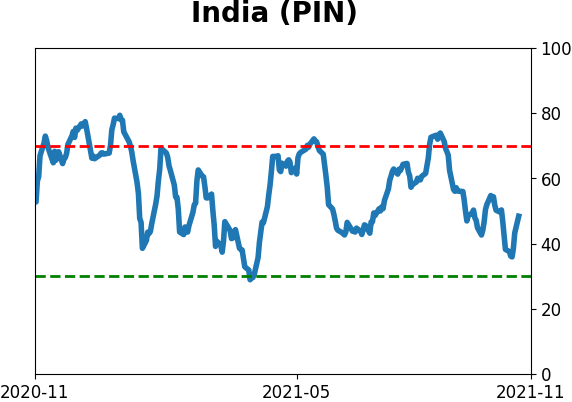
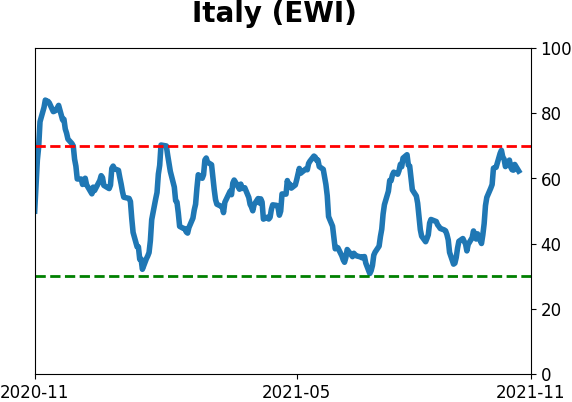
Sentiment Around The World
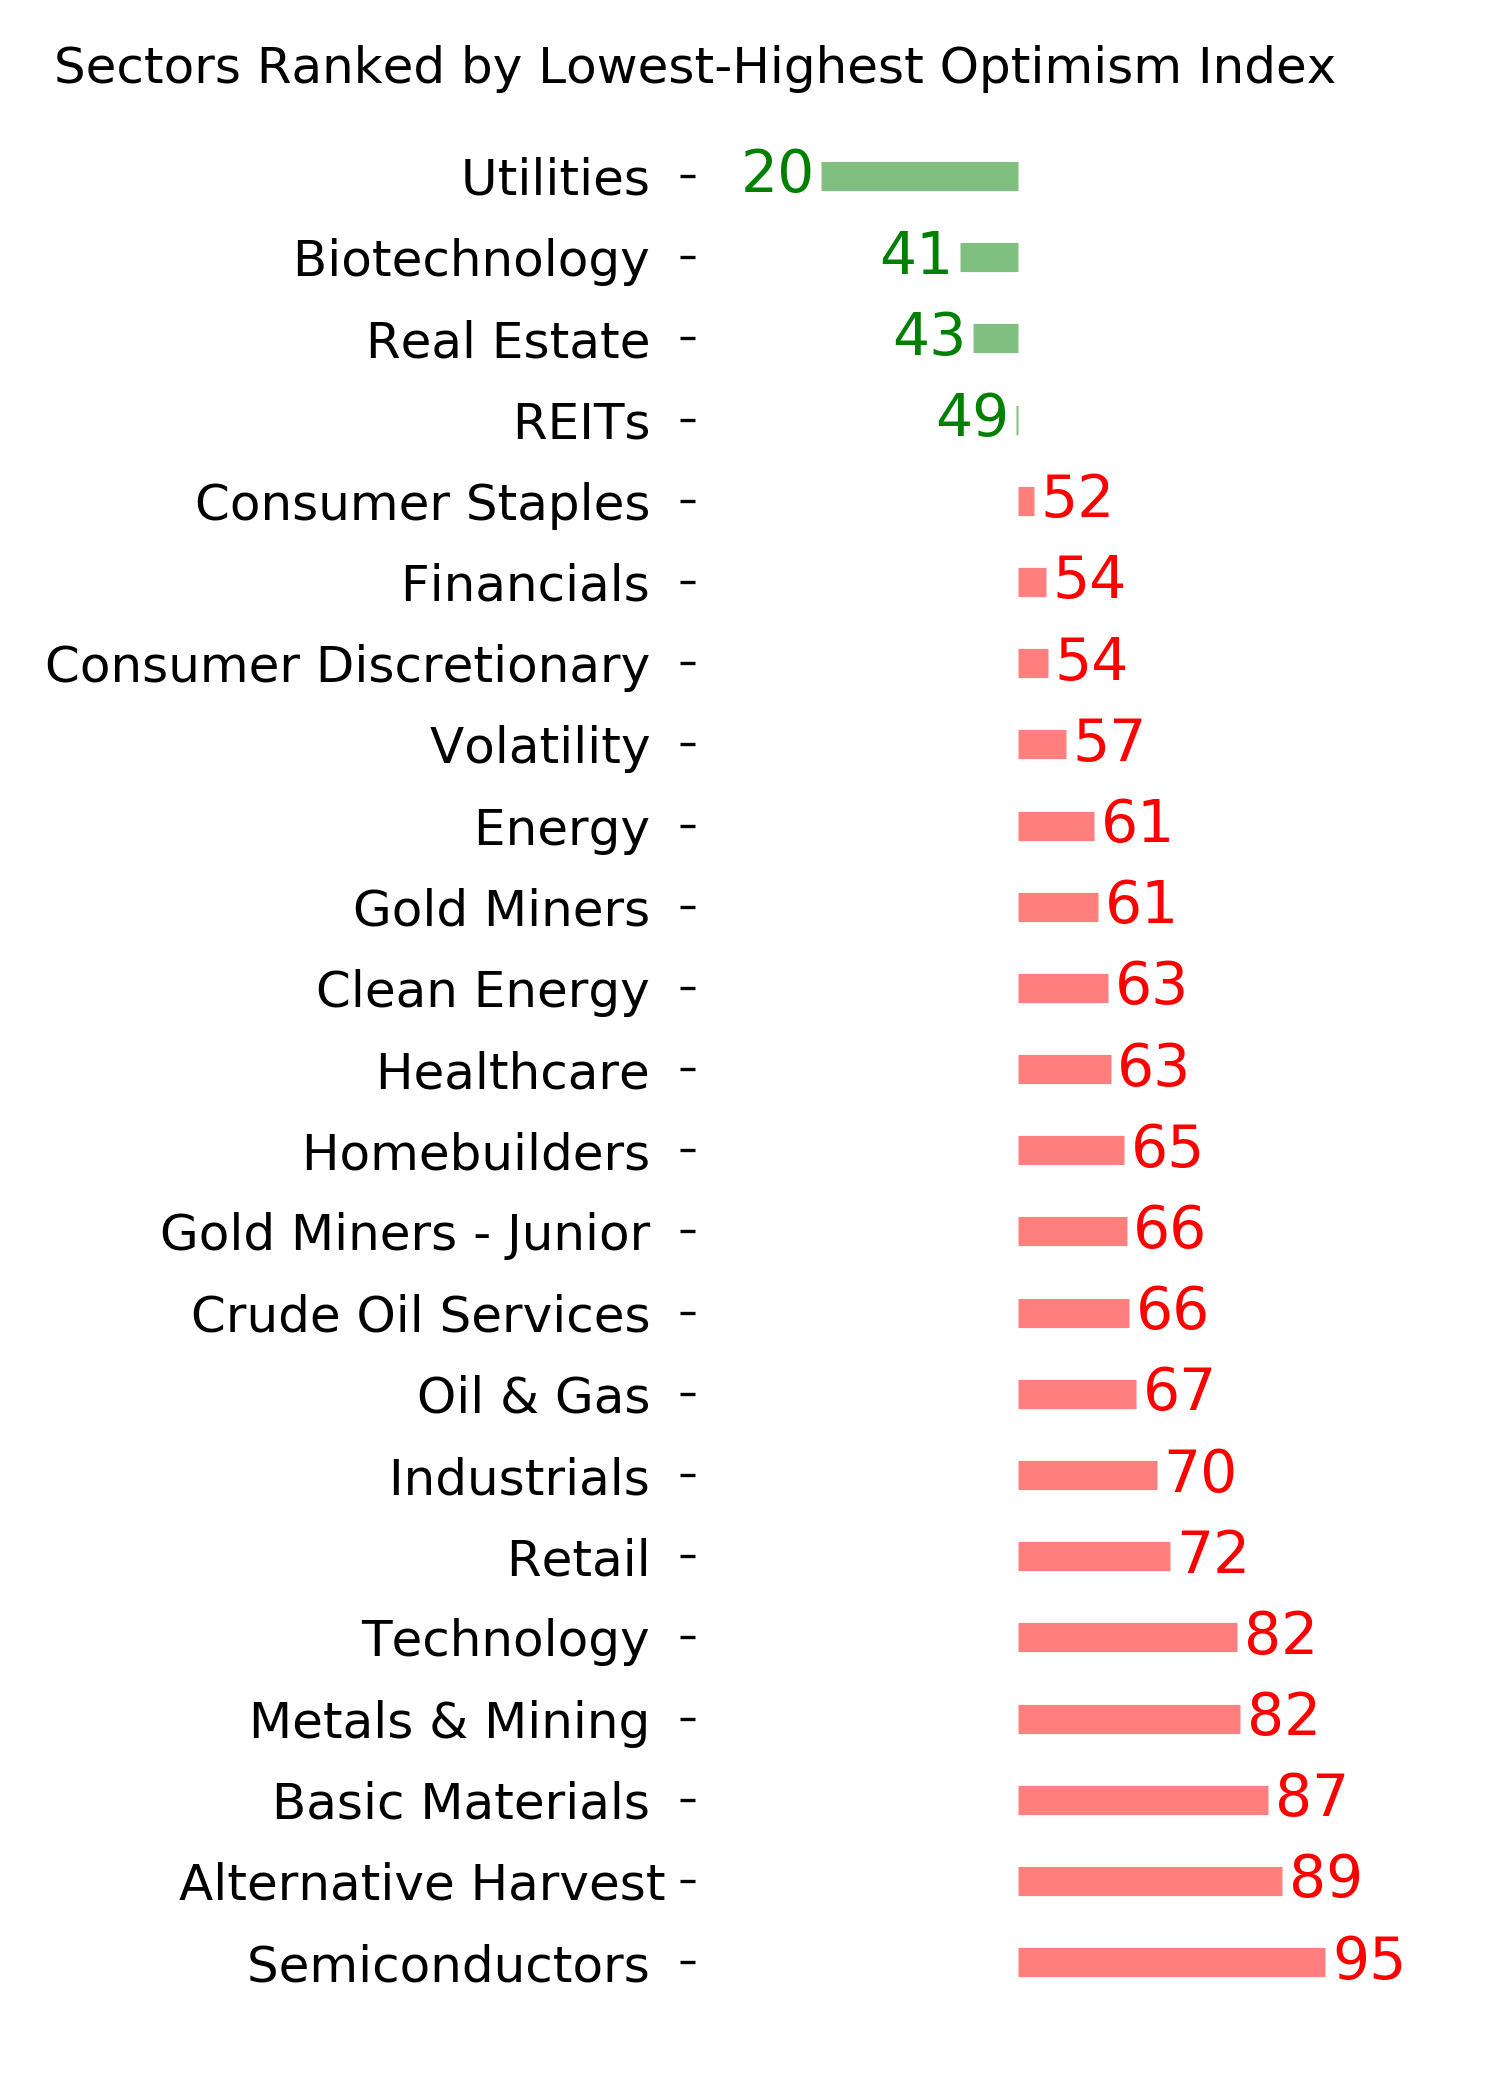
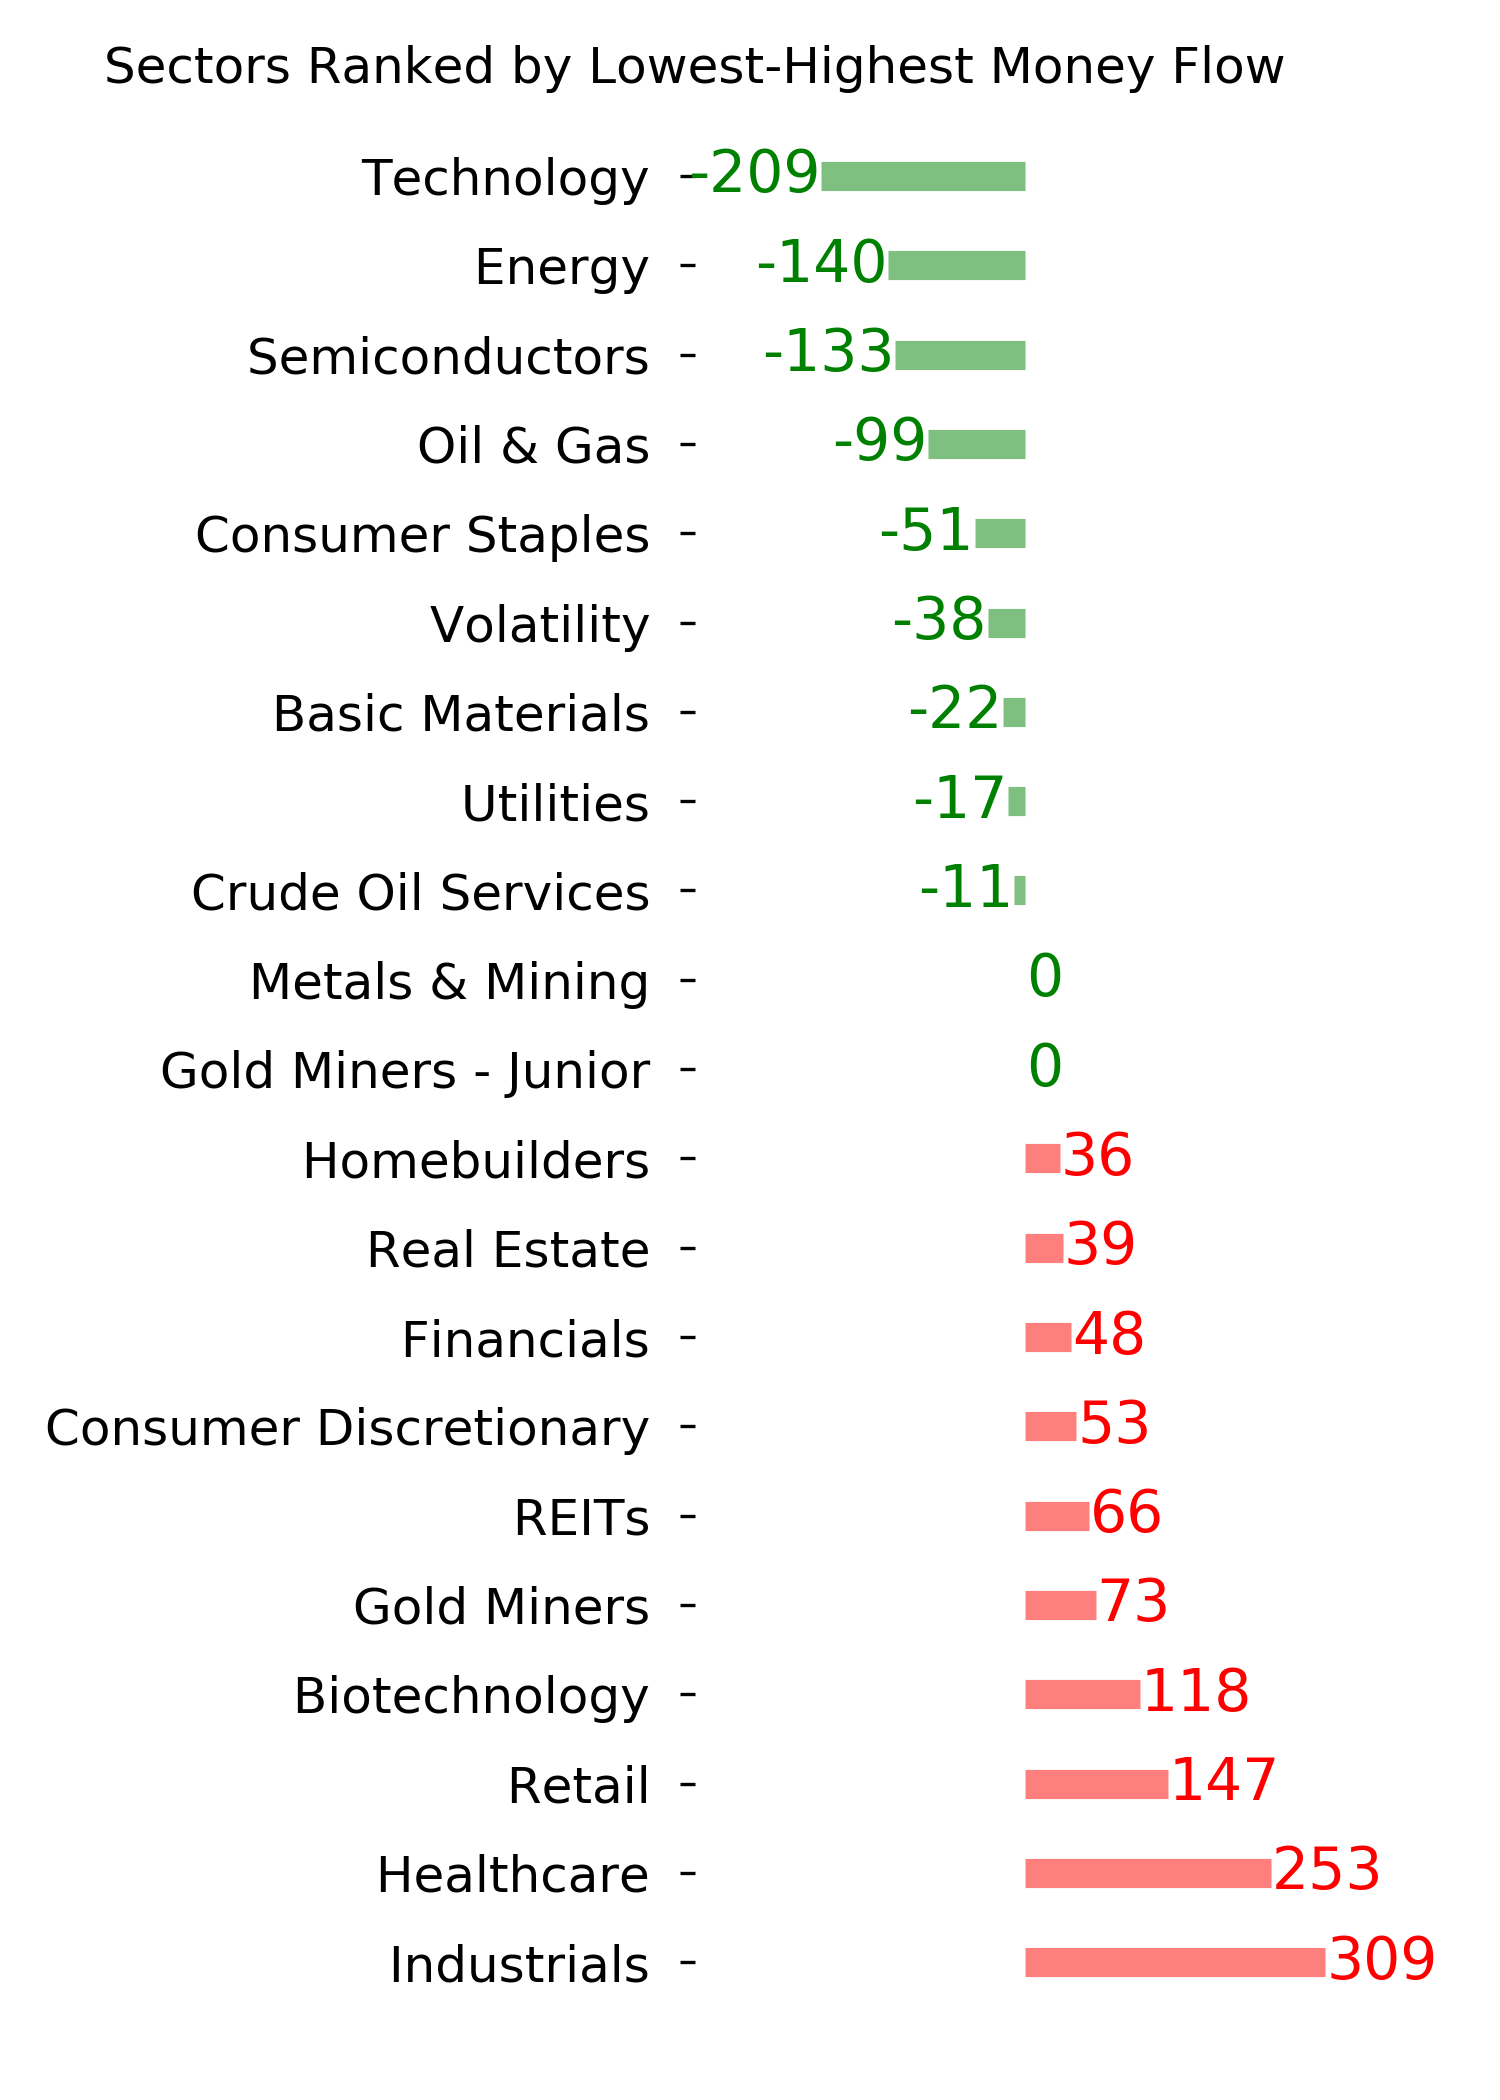
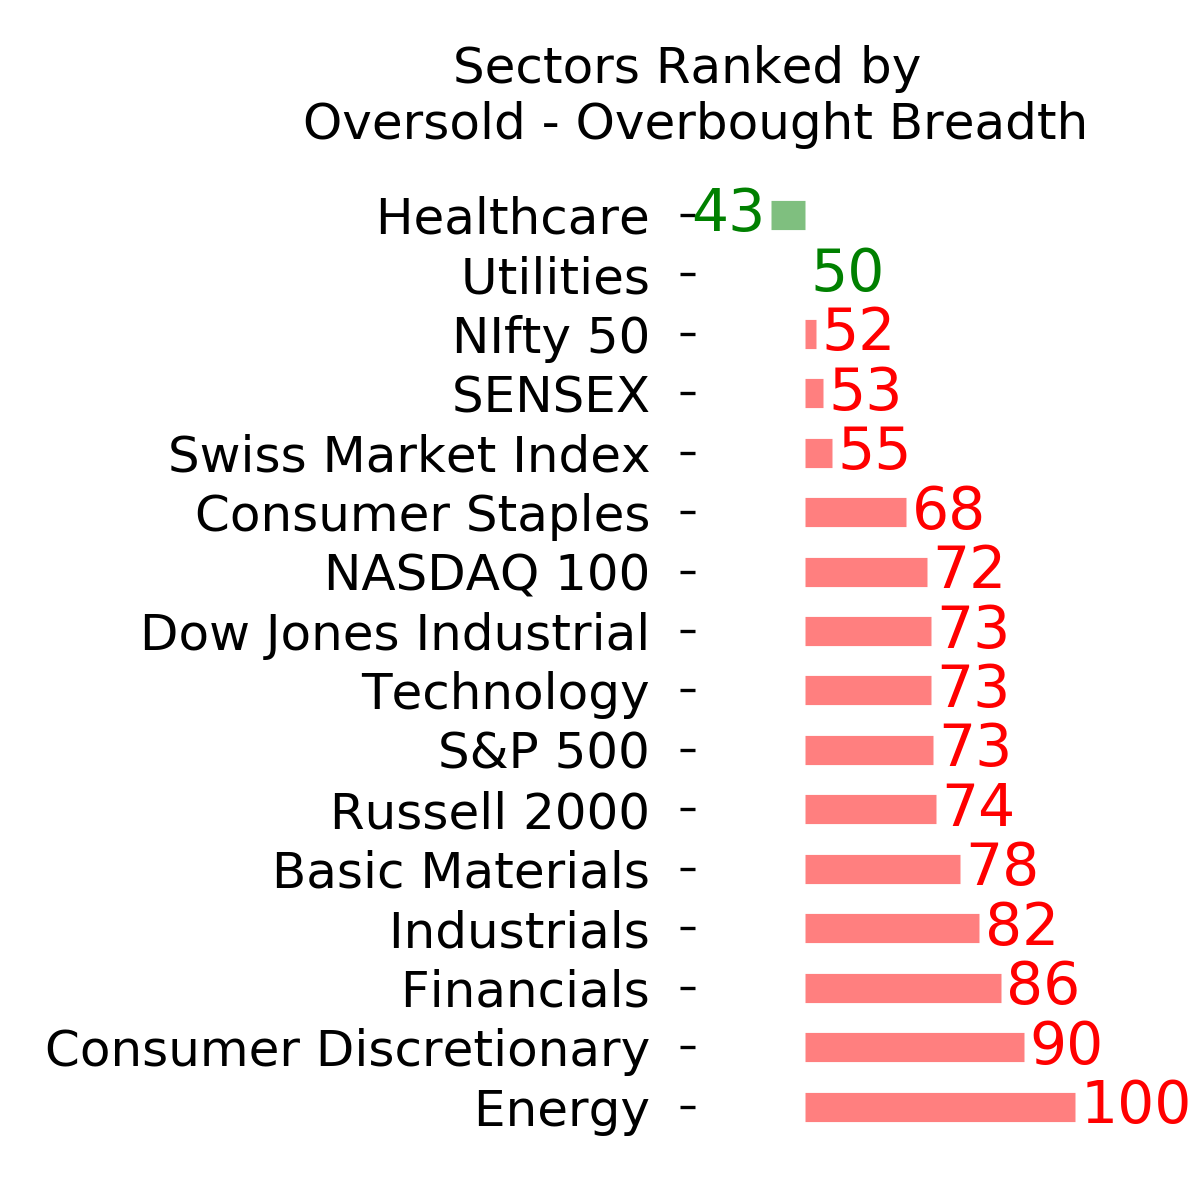
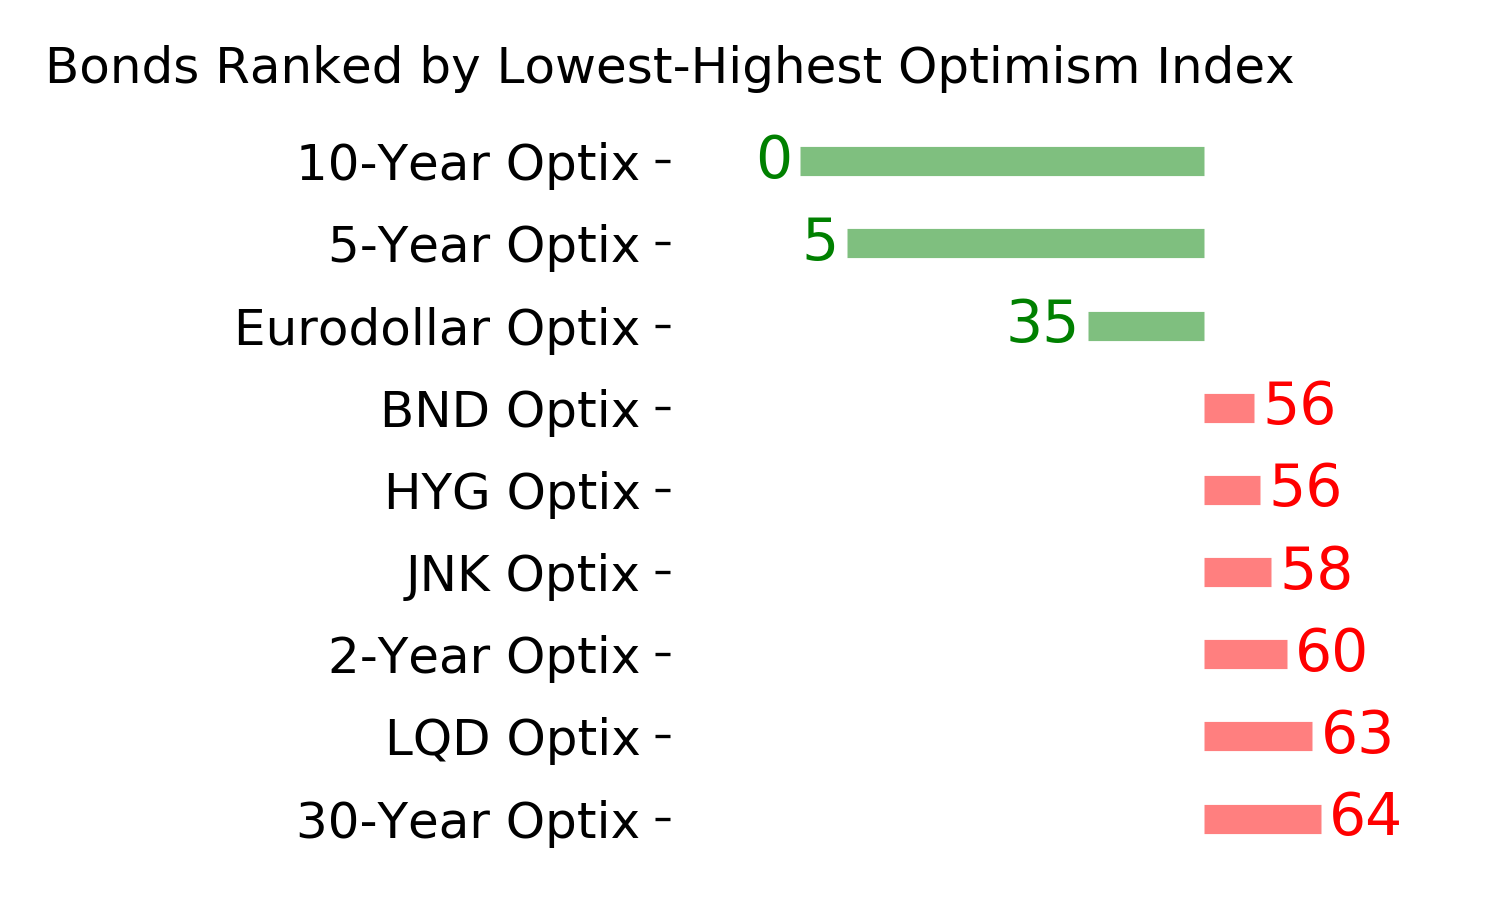
Optimism Index Thumbnails
|
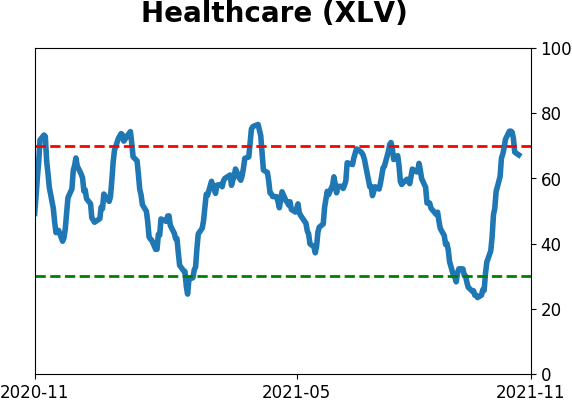
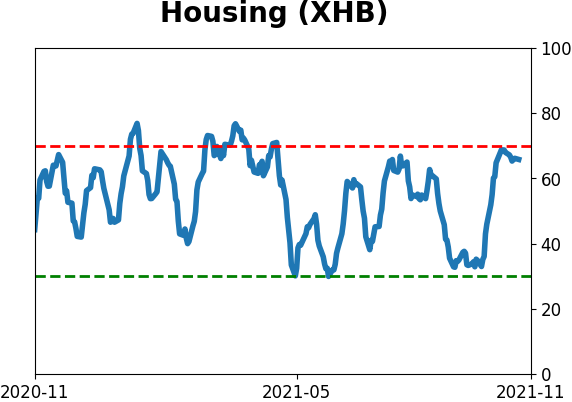
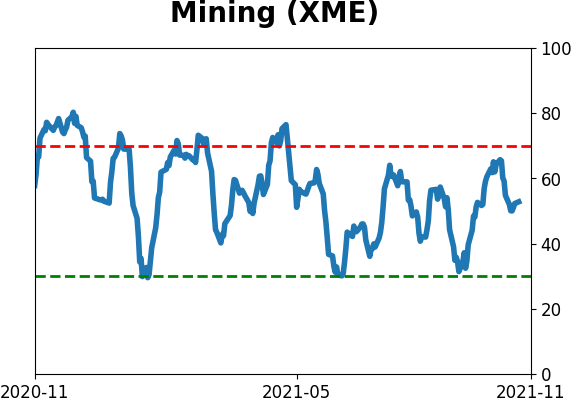
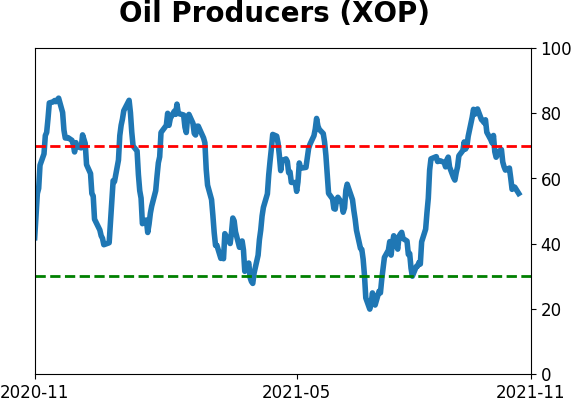
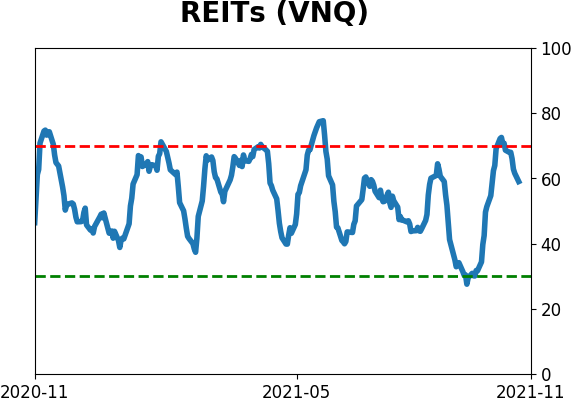
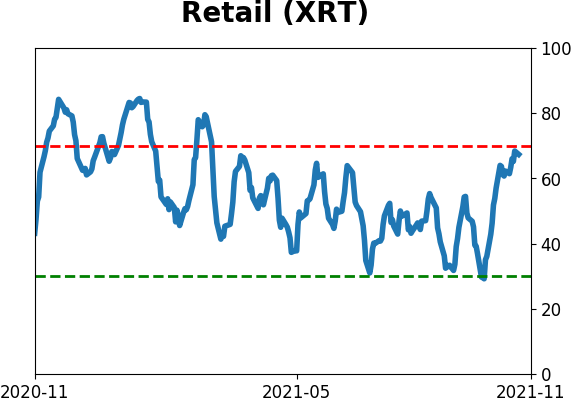
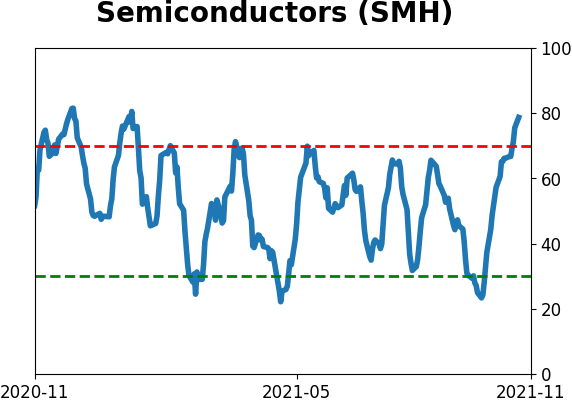
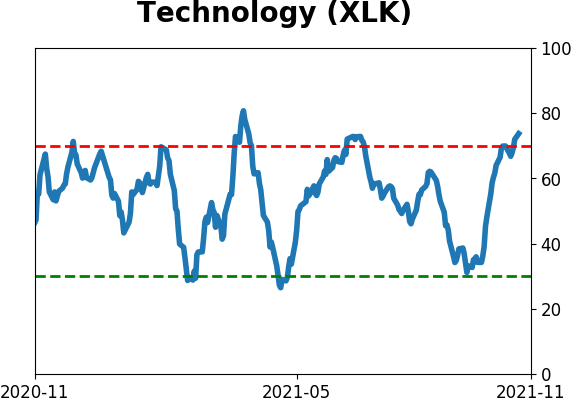
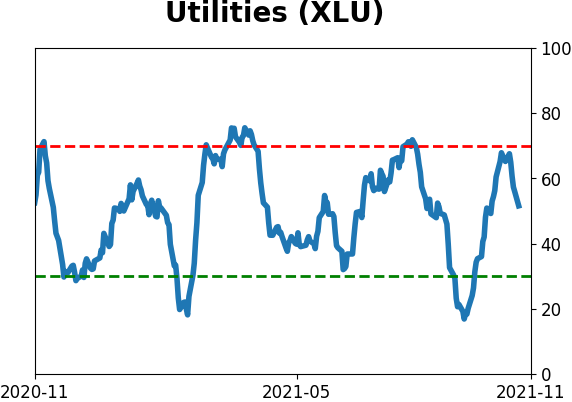
Sector ETF's - 10-Day Moving Average
|
|
|
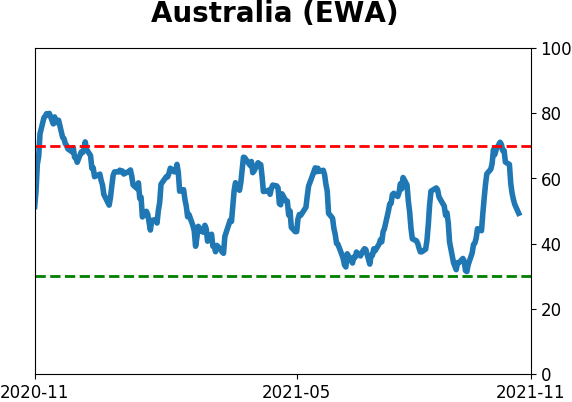
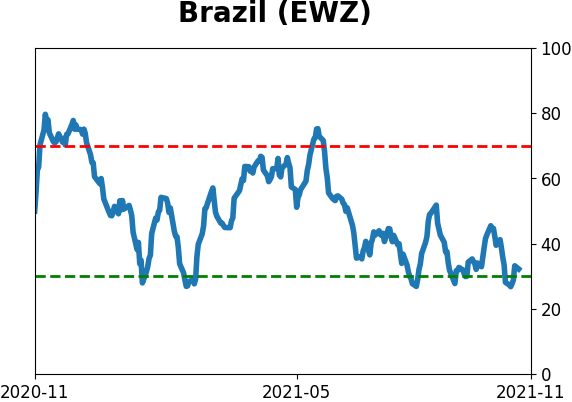
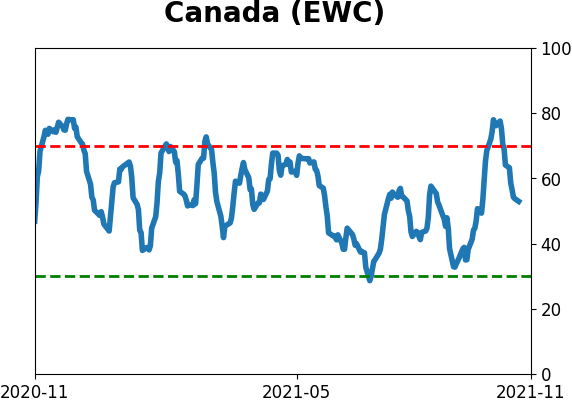
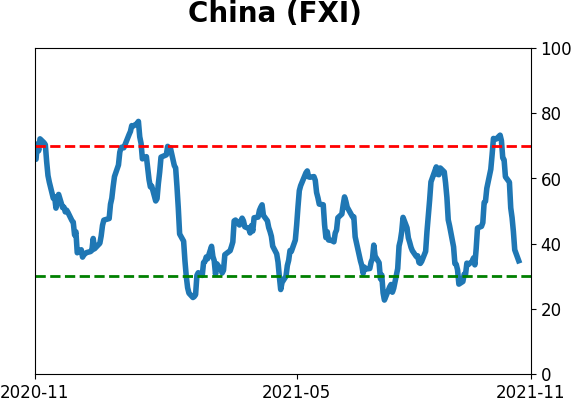
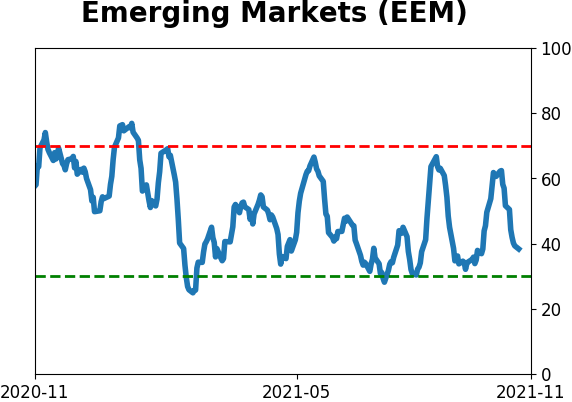
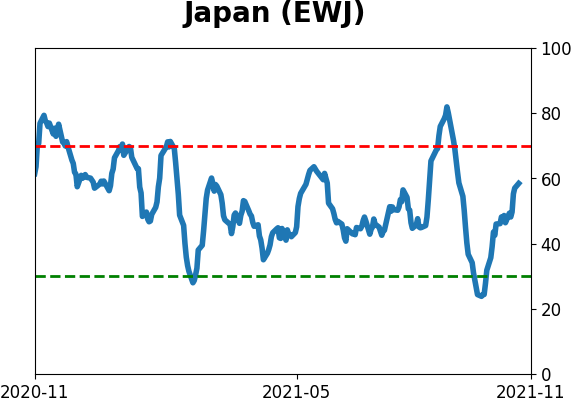
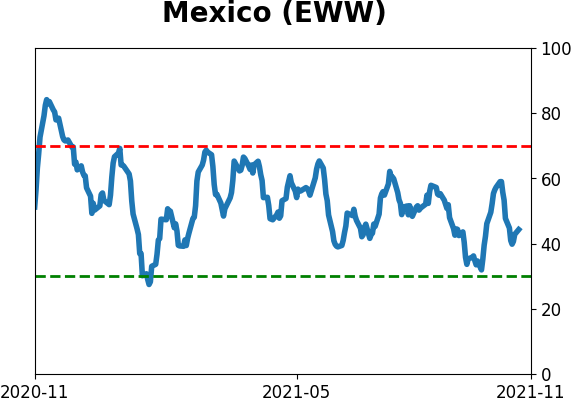
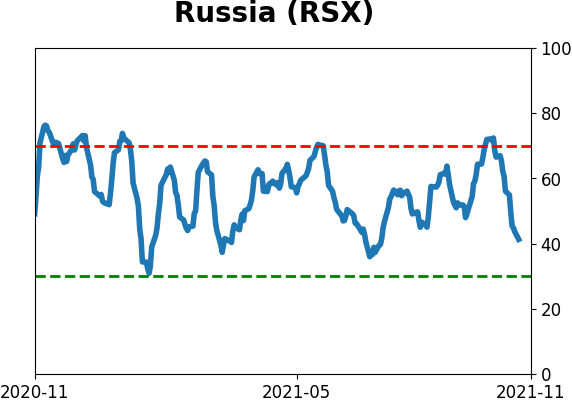
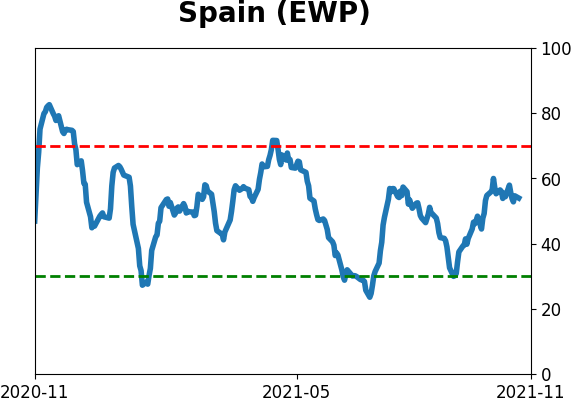
Country ETF's - 10-Day Moving Average
|
|
|
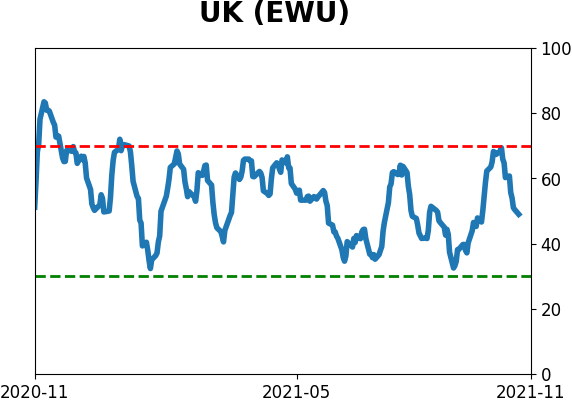
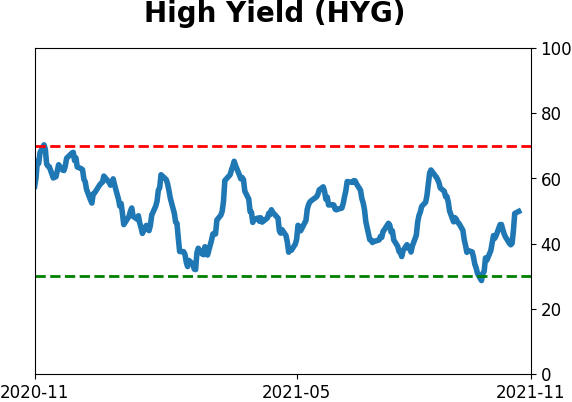
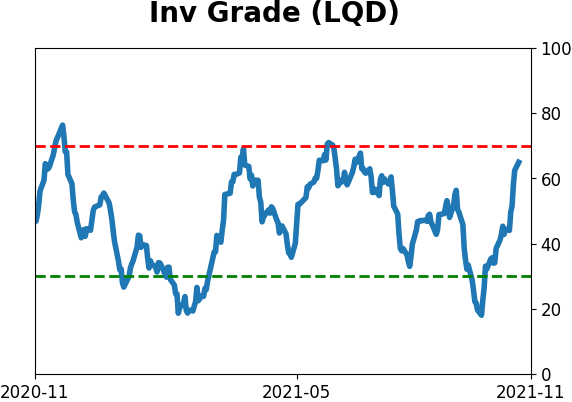
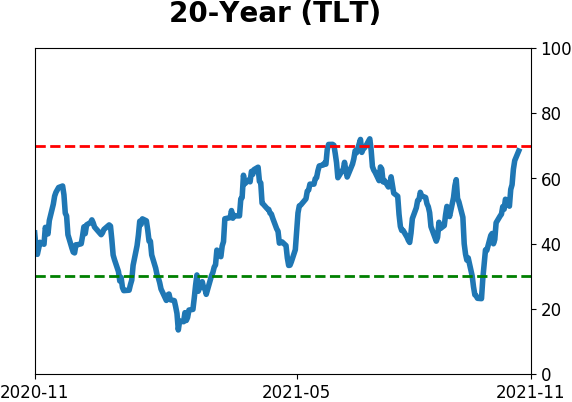
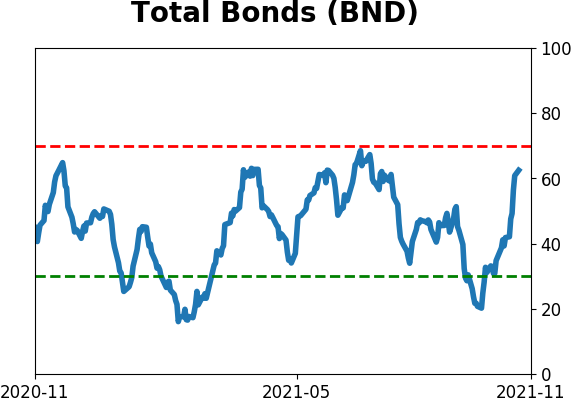
Bond ETF's - 10-Day Moving Average
|
|
|
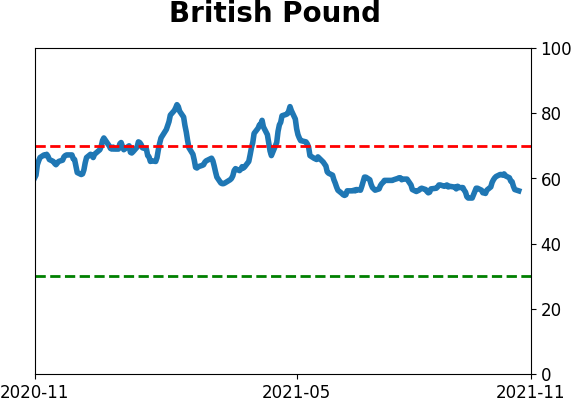
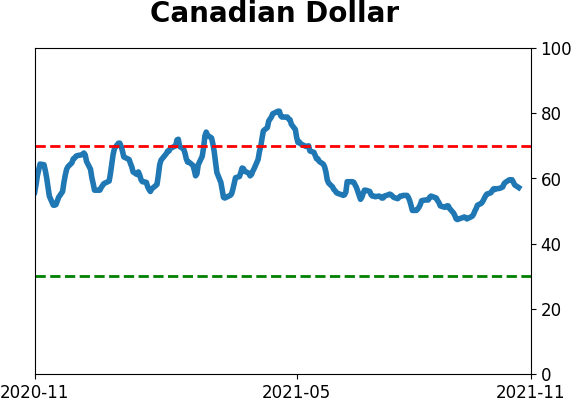
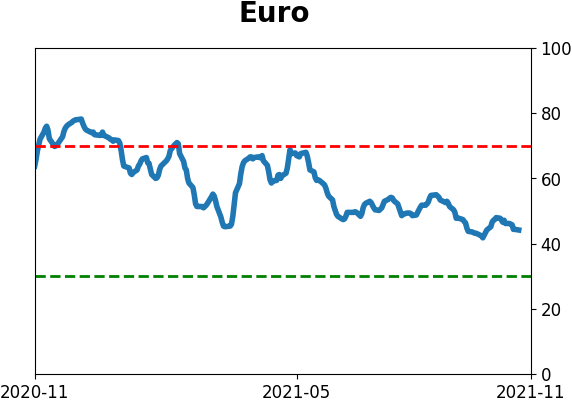
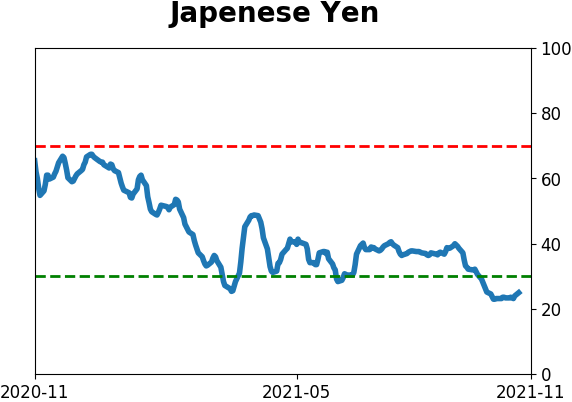
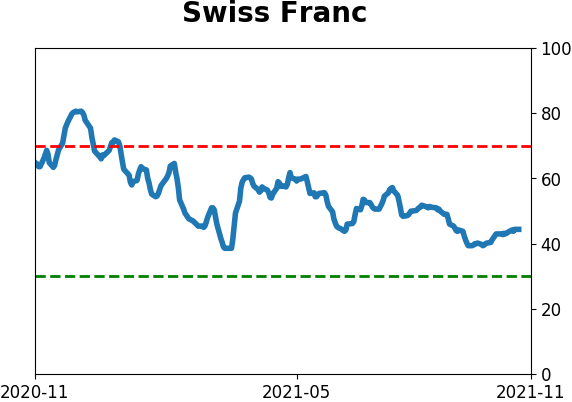
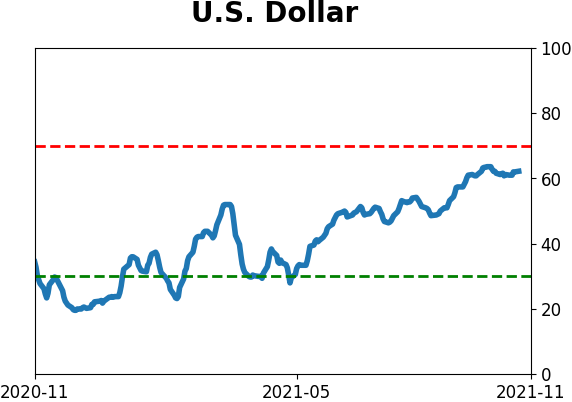
Currency ETF's - 5-Day Moving Average
|
|
|
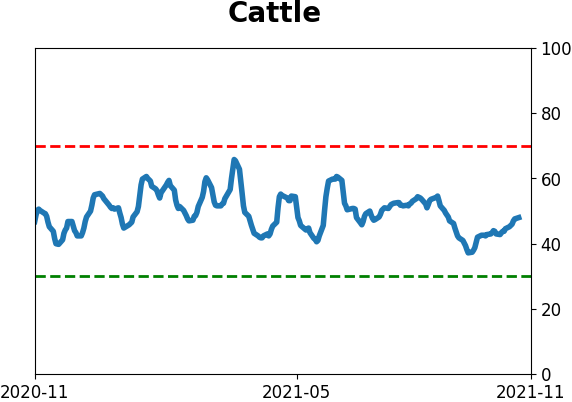
Commodity ETF's - 5-Day Moving Average
|
|