Daily Report : Weekly Wrap for Nov 5 - Small caps break out, volatility contracts, and consumers turn bearish

| View/Print a PDF version of this Report |
Headlines
|
Weekly Wrap for Nov 5 - Small caps break out, volatility contracts, and consumers turn bearish: This week, the small-cap Russell 2000 finally broke out to a new high, ending 161 days without one. Volatility expectations are plunging, and investors are fully back in risk-on mode. All of these tend to lead to higher prices for stocks. The latest Commitments of Traders report was released, covering positions through Tuesday: The 3-Year Min/Max Screen shows that "smart money" commercial hedgers continued to aggressively add to positions in 10-year Treasury notes, now holding more than 15% of open interest net long. The Backtest Engine shows that TLT rose after 95 out of 115 weeks in the 3 months following similar extremes, averaging a return of +3.6%. Hedgers also continued to add to a multi-year extreme in long exposure to the Mexican peso, but the currency tends to embark on sustained rallies only after hedgers start to reverse their positions. In major equity index futures, hedgers moved to an all-time record short position of more than $78 billion. This is perhaps not as reliable a signal as it had been prior to the last year, but it's still a worry. Bottom Line: STOCKS: Weak buy BONDS: Hold GOLD: Hold |
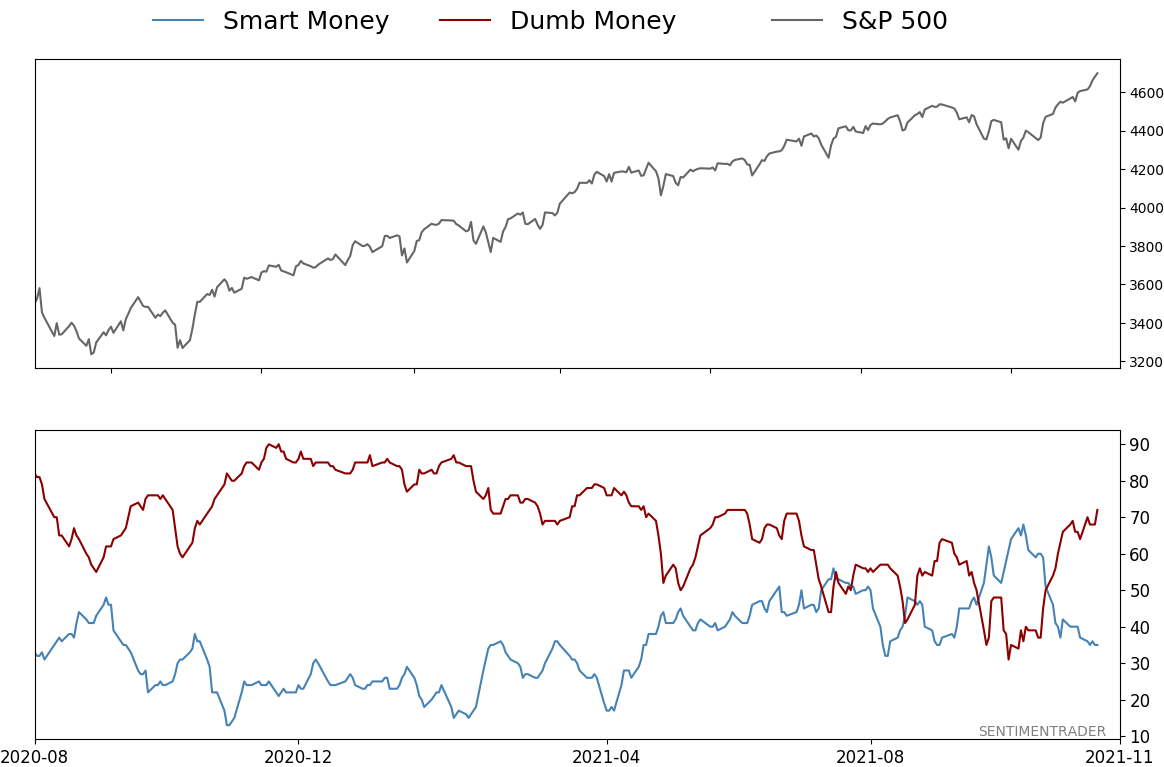
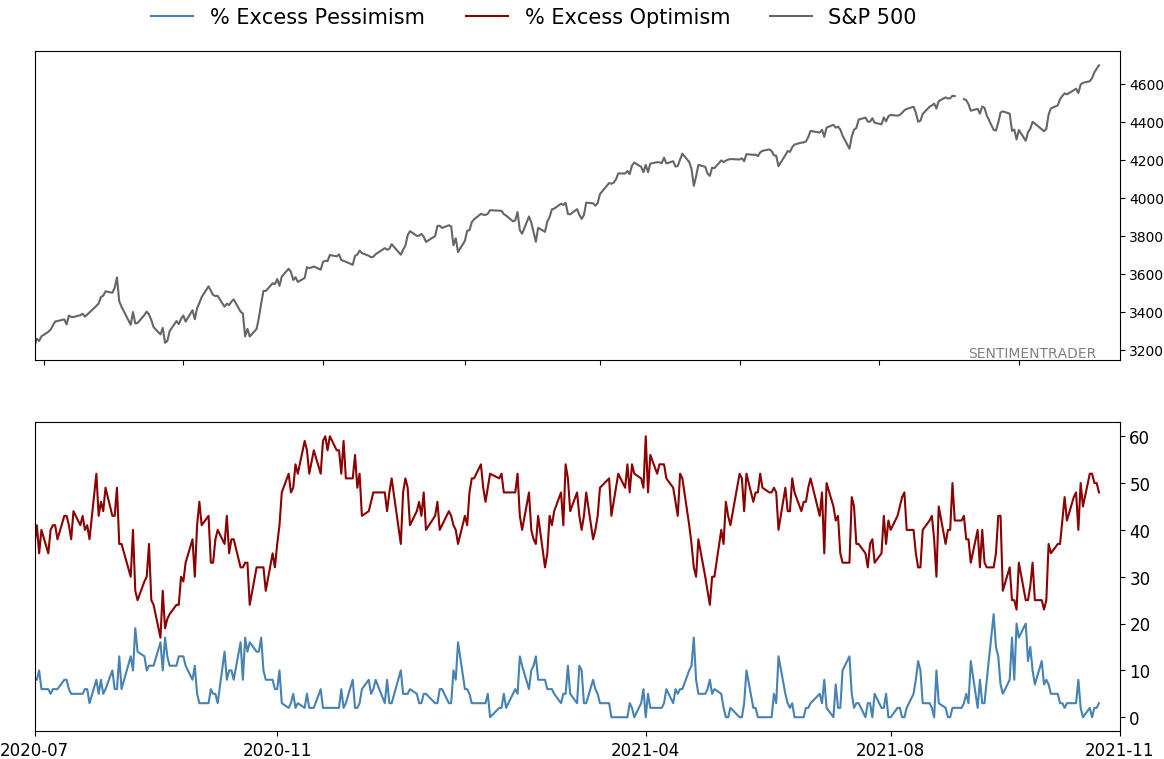
Smart / Dumb Money Confidence
|
|
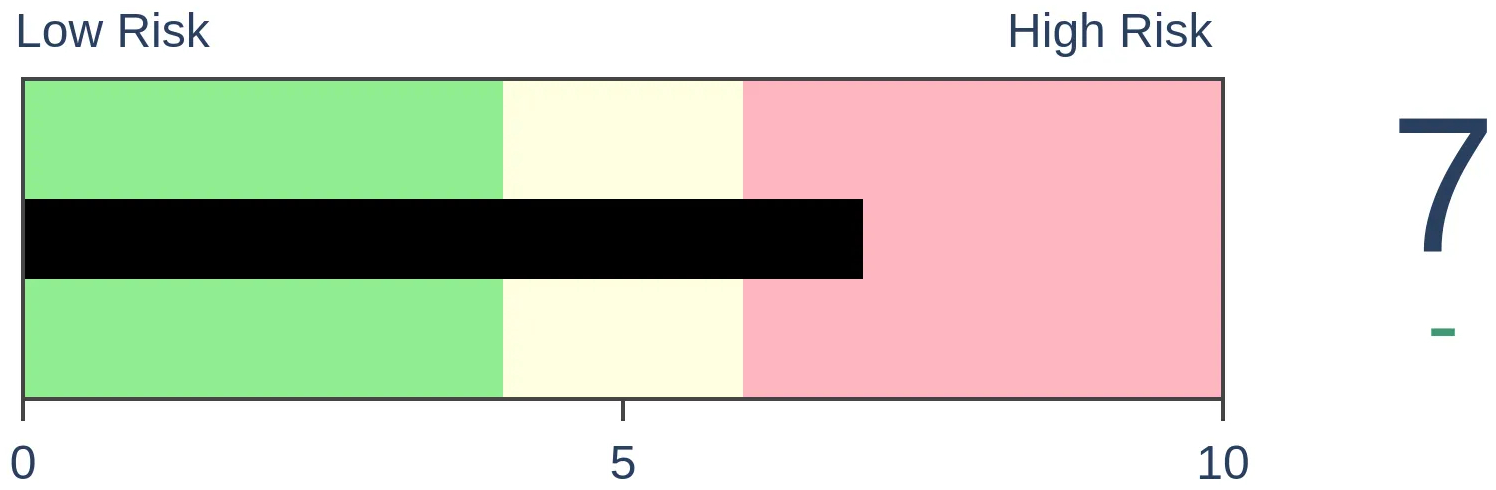
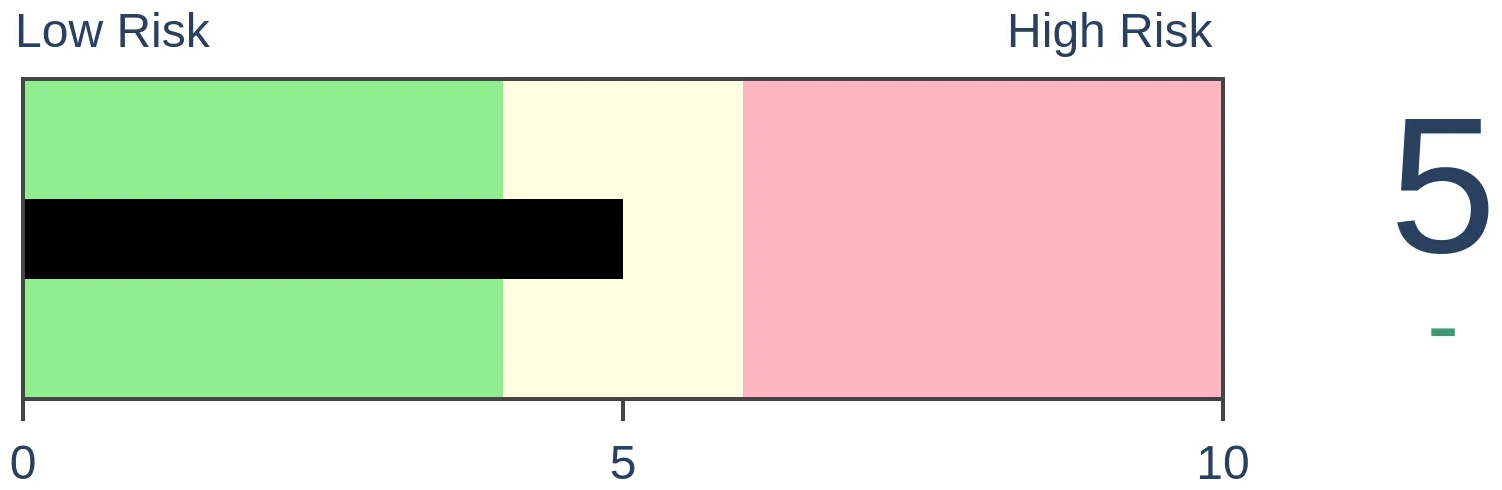
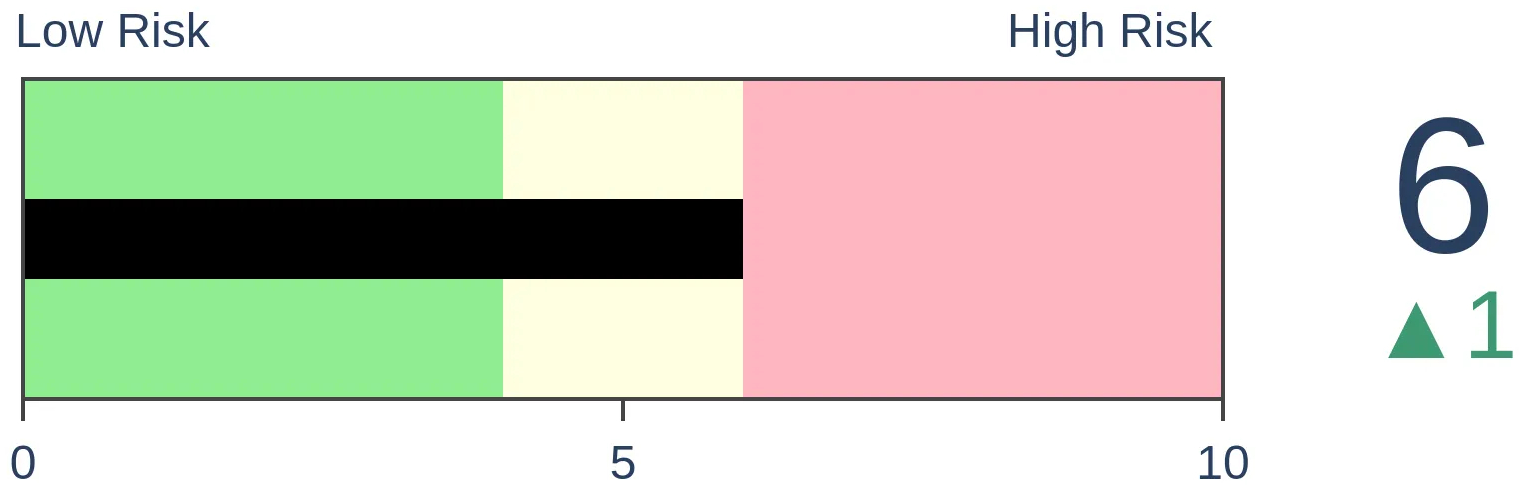
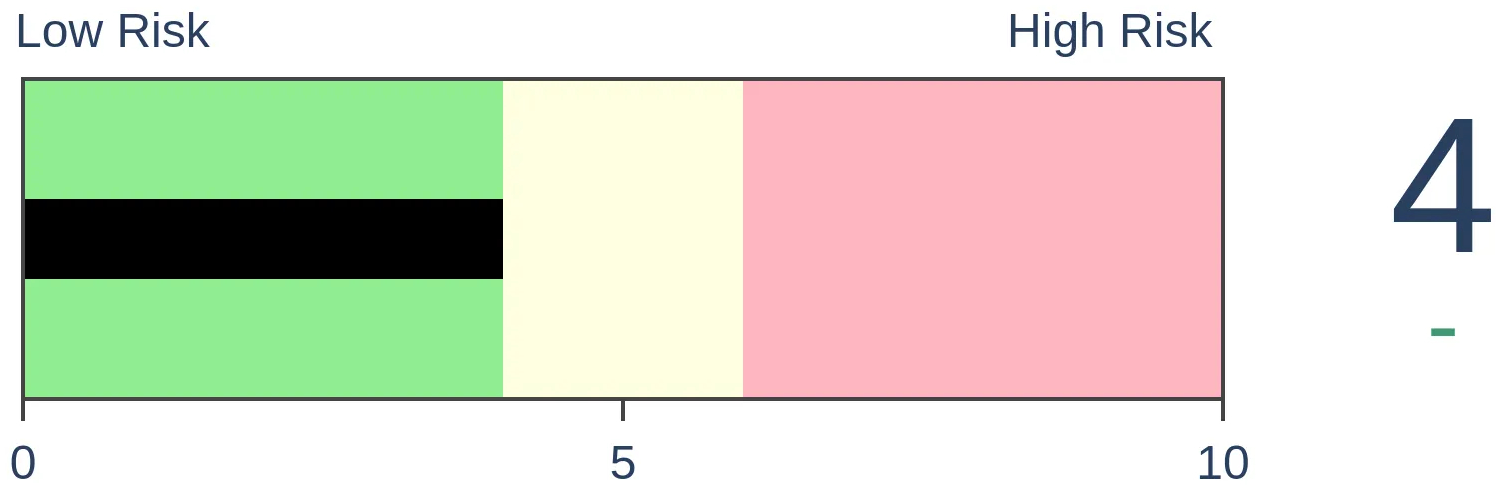
Risk Levels
|

|

|
Research
Weekly Wrap for Nov 5 - Small caps break out, volatility contracts, and consumers turn bearishBy Jason GoepfertBOTTOM LINEThis week, the small-cap Russell 2000 finally broke out to a new high, ending 161 days without one. Volatility expectations are plunging, and investors are fully back in risk-on mode. All of these tend to lead to higher prices for stocks. FORECAST / TIMEFRAME |
Key points:
- There has been a spike in options speculation rivaling other peaks
- Other indicators show that investors are in full risk-on mode
- That helped push the Russell 2000 to new highs
- Volatility is contracting quickly
- Inflation is still a long-term fundamental issue
- Overseas stocks are still struggling, while cyclicals are rebounding
- Most of these showed potential for short-term weakness, but mostly strong medium- to long-term returns
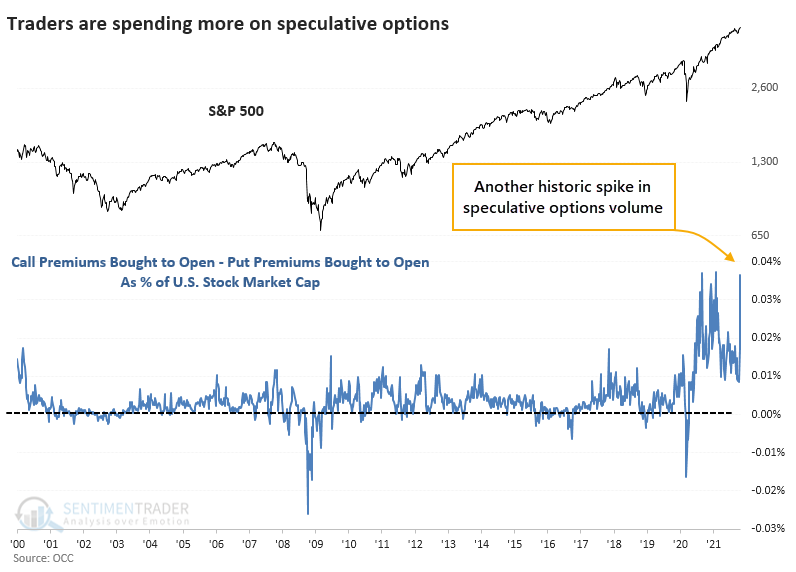
Option speculation nears record
In January, traders reached a peak in speculation in the options market. They're back for more.
Last week, the smallest traders spent 51% of their volume on buying call options to open. The largest traders tend to be more conservative, but even they focused 43% of their volume on call buying. Both are in the top 2% of all weeks since the year 2000.
When we look at the premiums spent on all options, it gets even more extreme. This is real money being spent. While it accounts for a tiny fraction of the value of U.S. stocks, the knock-on effects from dealer hedging can magnify its influence.
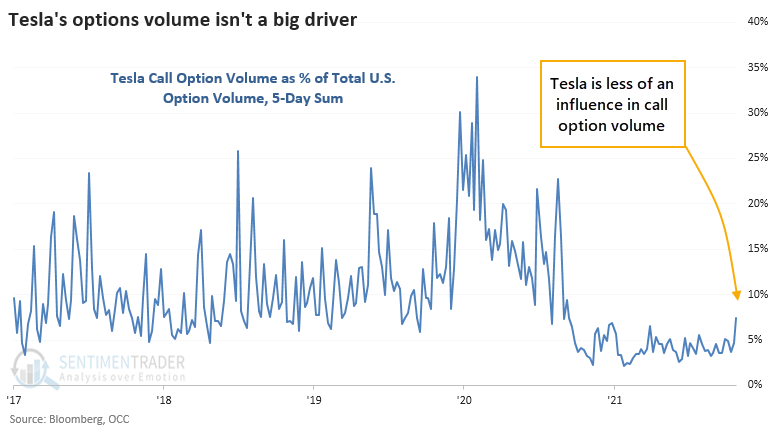
It wasn't just about Tesla. There were about 8,000,000 options traded on that stock. There were over 100,000,000 call options traded last week on all stocks across all U.S. exchanges. Tesla's share of overall volume was well below its peak influence over the past five years.
When speculative options volume spiked last fall, stocks pulled back for a few weeks. When it happened again in late January - early February of this year, the major indexes didn't suffer too much, but meme stocks tumbled, small-cap stocks went into a coma, and breadth flattened. If we've learned anything from the past 11 months, it's that there are factors that can easily overwhelm sentiment extremes to an extent we haven't seen in over 20 years, if ever. But risk just ticked higher for some higher-risk parts of the stock market.
Other indicators show nearly full risk-on mode
It's not a surprise given the above, but investors are fully back in risk-on mode.
Speculation in options has ramped up, there is little fear of a November pullback, and almost all core indicators show risk-seeking behavior. More than 95% of indicators showed a risk-on attitude by late last week though that's ticked down a tad since then.
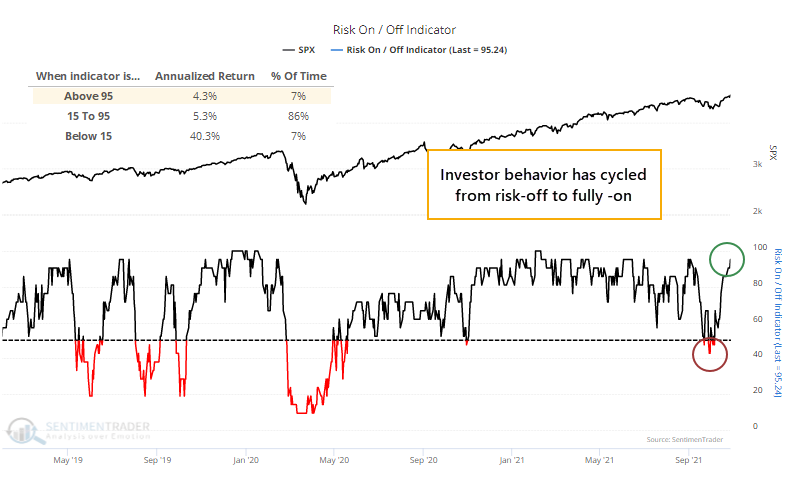
There was some short-term weakness after the other times when risk-seeking behavior cycled like this. But only one, during the bear market of 2002, led to substantially lower prices within the next few months.
If we add some context and only look at times when the model cycled like this while the S&P 500 was within 1% of a multi-year high, then we get signals that are more aligned with what we're seeing now.
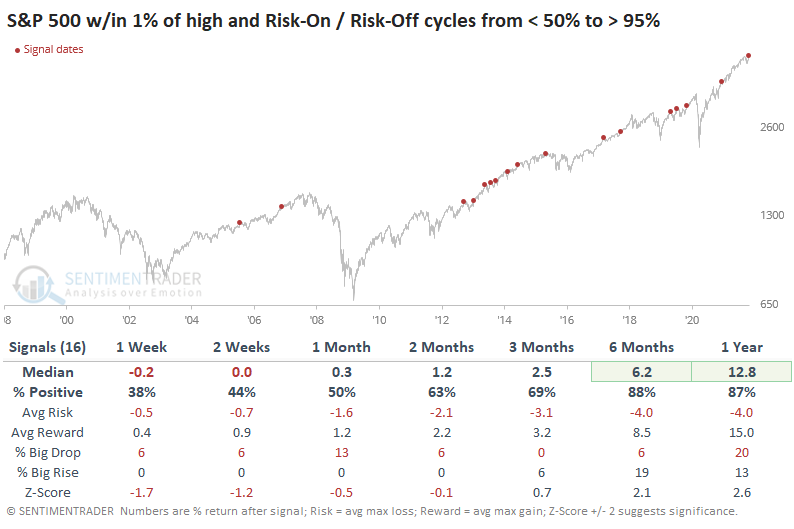
Out of the 16 signals, only 4 of them preceded a loss of more than -5% at any point within the next three months. But only 5 of them preceded a gain of more than +5% as well, so while risk might be limited, so was reward.
VIX futures show volatility expectations are receding
Dean showed that a trading model that uses VIX futures to identify when volatility cycles from high to low issued a buy signal at the close of trading on Wednesday.
The VIX Futures Range Rank signal triggers when the 4-month range rank for the 6-month VIX Futures Continuous Contract reverses from a period of high volatility to low volatility.
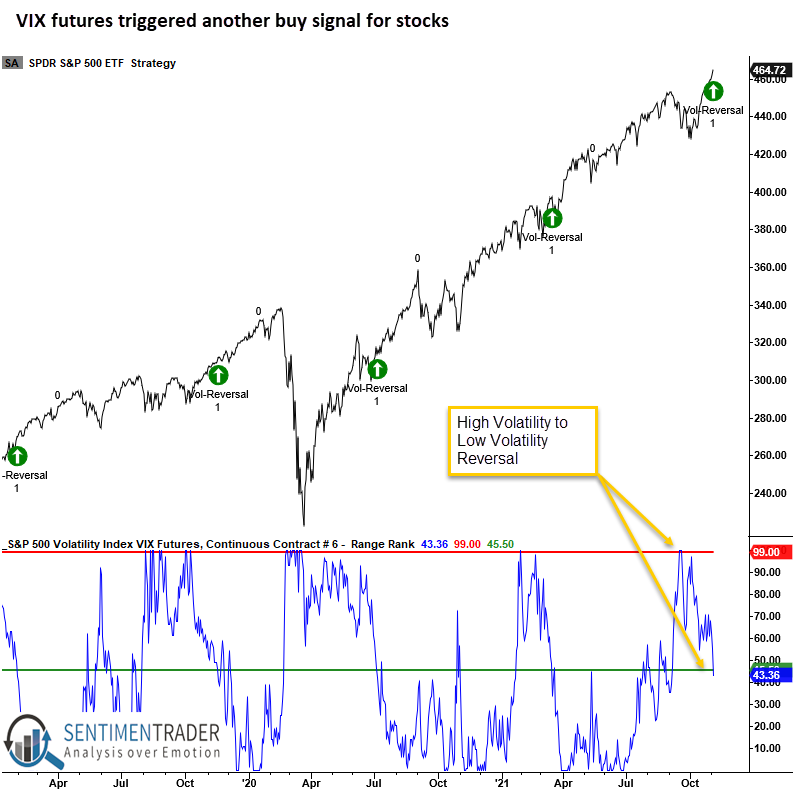
This signal has triggered 19 other times over the past 16 years. After the others, future returns in SPY were solid in 6 out of 7 time frames. The most recent signal from March stumbled out of the gate then quickly recovered. Like the current one, that signal occurred when the S&P 500 was trading at a new high.
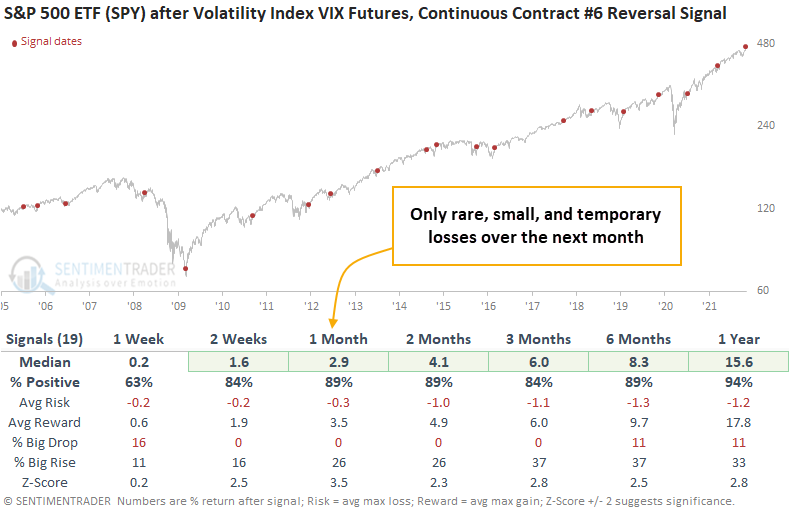
When stocks go from a period of high to low volatility, it signals that investors have started to calm down after a panic or at least heightened concern. Using VIX futures to measure that change in sentiment, similar setups to what we're seeing now have preceded rising prices for SPY almost every time over the medium term.
More consumers expect stocks to fall
Even if they're not investors, most U.S. consumers usually expect stocks to rise over time. And they've had that expectation for more than a year.
That changed in October. For the first time since July 2020, more consumers expect stocks to fall in the coming months than rise.
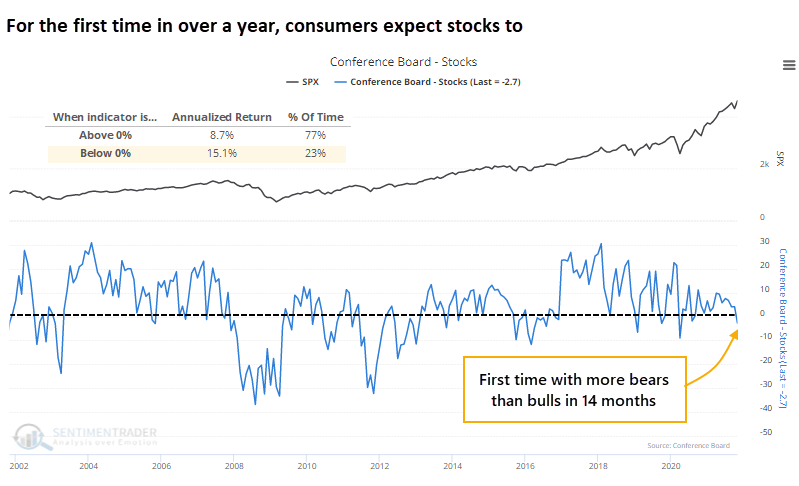
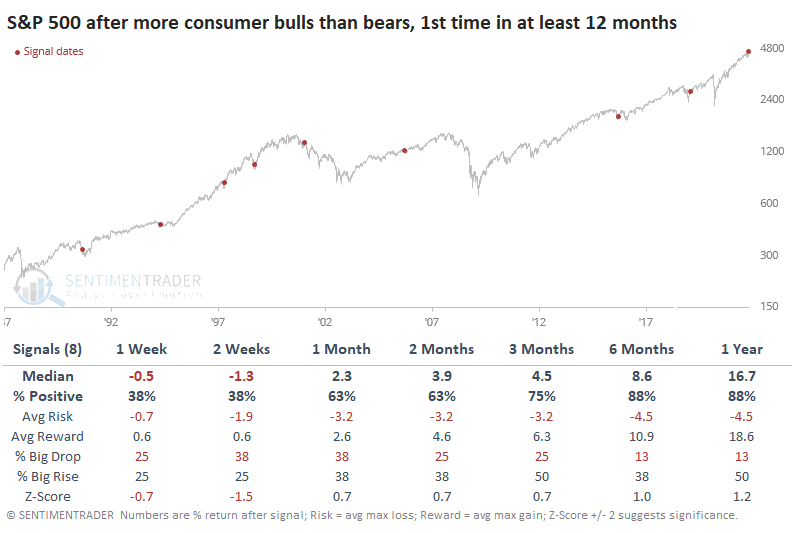
When consumers turn negative on stocks for the first time in over a year, it has preceded some weakness at the beginning of the next month, then stronger-than-average returns in the months ahead.
The only time when consumers ended up justified in their concern was in 2001. Six of the seven others preceded a double-digit gain in the S&P 500 during the following year. The only two signals in the past decade were immediate buy signals.
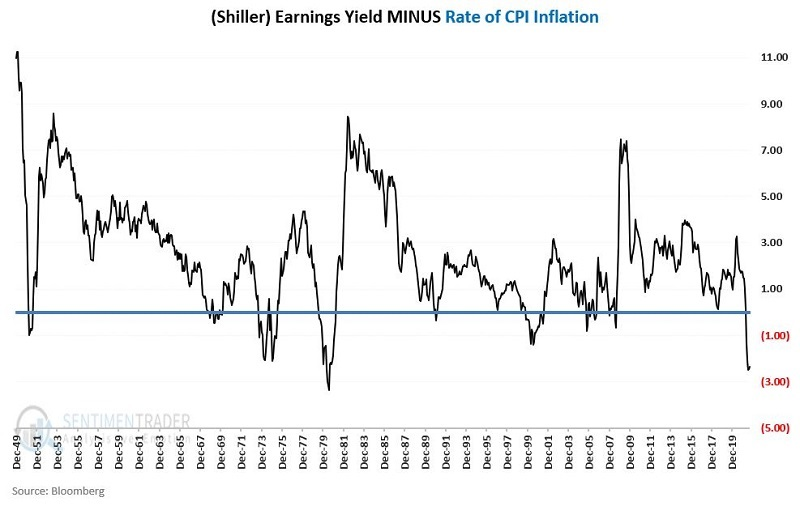
Inflation readings are still a concern
Jay looked at market performance during times when the S&P 500's earnings yield was above/below the inflation rate. To be more precise, he divided the Shiller P/E ratio by 100 to arrive at the "earnings yield" and then subtracted the current inflation rate.
The chart below displays the status of the indicator since 1950.
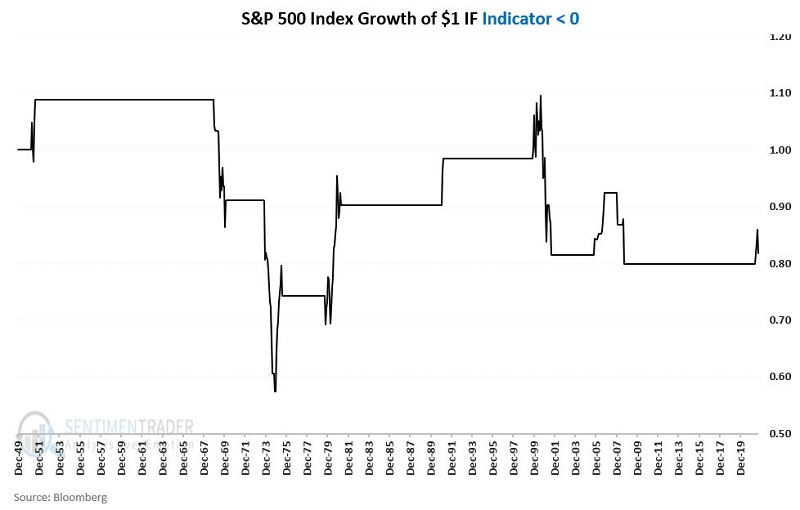
Stocks did exceptionally well when the indicator was above zero. The chart below displays the cumulative price return for the S&P 500 Index only when the indicator is below zero starting in 1950.
The table below displays a summary of performance during both bullish and bearish periods.
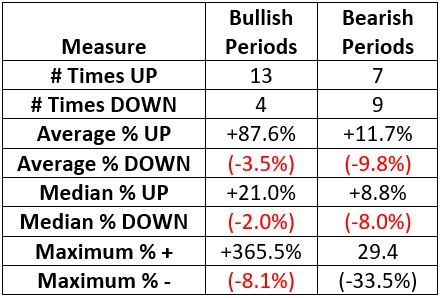
As with most indicators, there are no sure things with the Earnings Yield - Inflation indicator detailed here. But clearly, the odds tend to favor the bulls when this indicator is positive and the bears when it is negative. That's an issue because it's solidly in negative territory now.
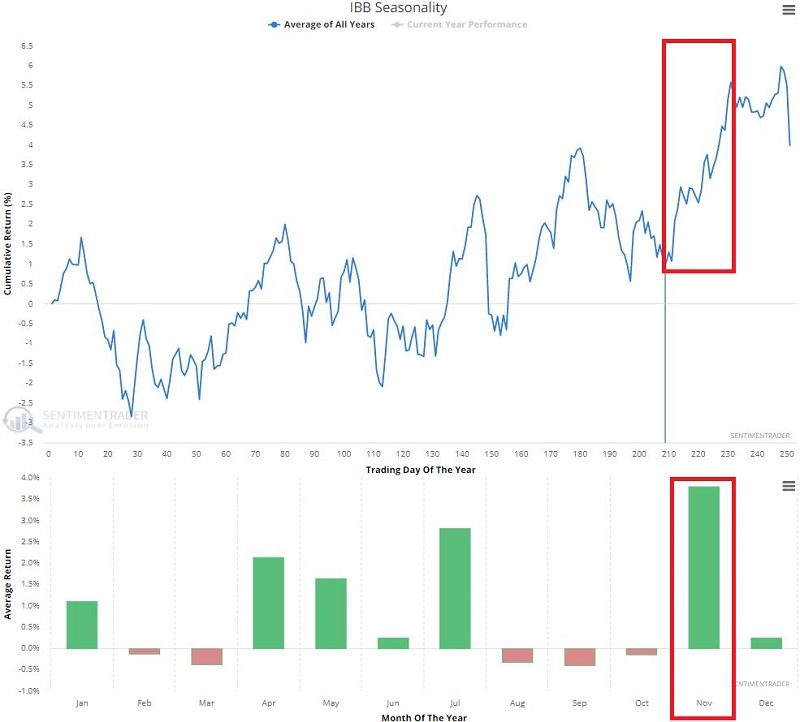
Biotech's time to shine
Jay noted that the seasonal trend for IBB (iShares Biotechnology ETF) is about to turn favorable. In addition, as you can see in the screenshot below, November is historically the best month for IBB.
XBI (SPDR S&P Biotech) has far greater options trading volume. So, let's focus our attention there. In this example, we are NOT looking for an exotic options trading strategy. We want to get as close to a long stock position as possible without spending as much as buying 100 shares.
So, we could buy a call option with several months left to expiration. The risk curves appear in the screenshots below.
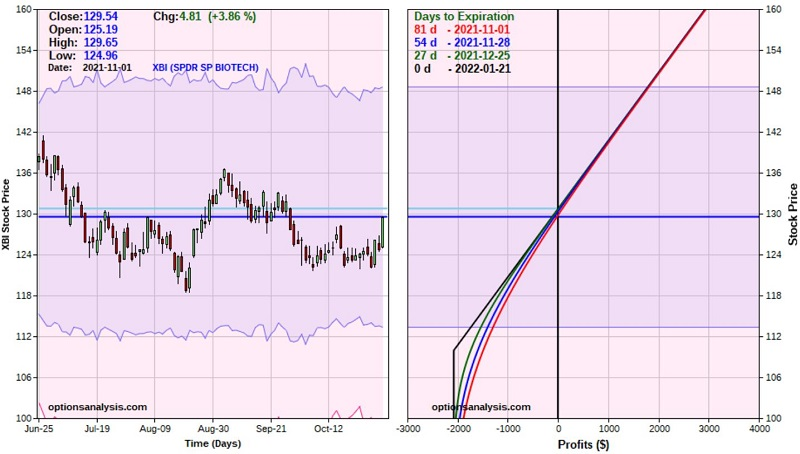
This trade has 81 days left until expiration, and buying a 1-lot gives this trade a delta of 90.62. This means that (for now) this position will behave like a position holding roughly 91 shares of XBI.
The cost to enter this trade is $2,075 versus $11,788 to buy 91 shares of XBI stock, and the maximum profit potential is unlimited versus a maximum risk of -$2,075 if XBI is below $110 a share at option expiration. Above $130.75, the option will move point-for-point with the shares.
While the maximum risk is $2,075, a trader is not obligated to sit around and accept the maximum loss if XBI decides to decline instead of rise. There is a recent low at $118.49. If our trader decides to exit if $118 a share is hit, the loss would be roughly -$977 to -$1,269.
Will this trade work out? Only time will tell. As always, the example trade above is not a recommendation. It merely serves to illustrate the potential to essentially rent a stock equivalent position using options at a fraction of the cost of buying the underlying shares.
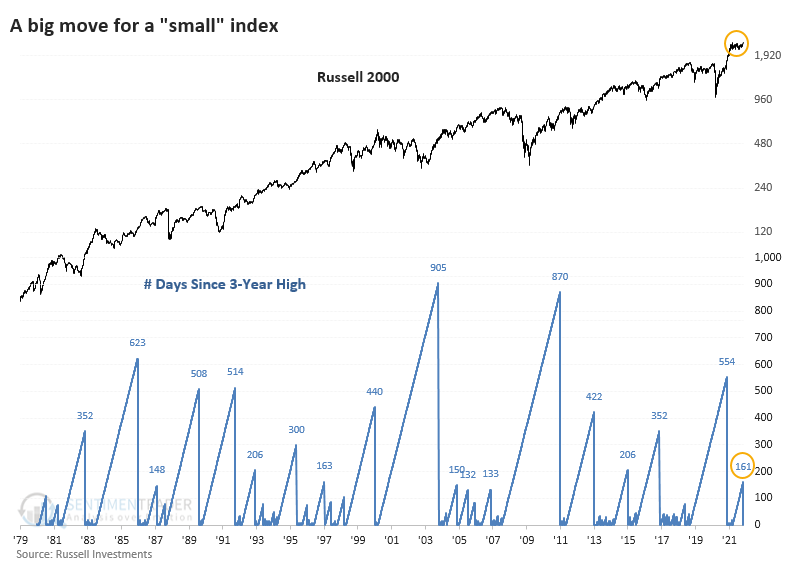
Small-cap stocks finally break out
In a year when headline indexes like the S&P 500 have set record after record, it seems like it has taken the small-cap Russell 2000 forever to break out. It finally did, by the tiniest of margins.
After more than six months of consolidating in a tight range, the Russell managed to push over the hurdle and close at a record high on Tuesday. That ended more than 160 days without one.
Once the Russell broke out to a new high for the first time in more than six months, it fell back only twice over the following two months, and both were minor losses that were quickly recouped. There was only a single loss of more than -5% at any point within the next three months.
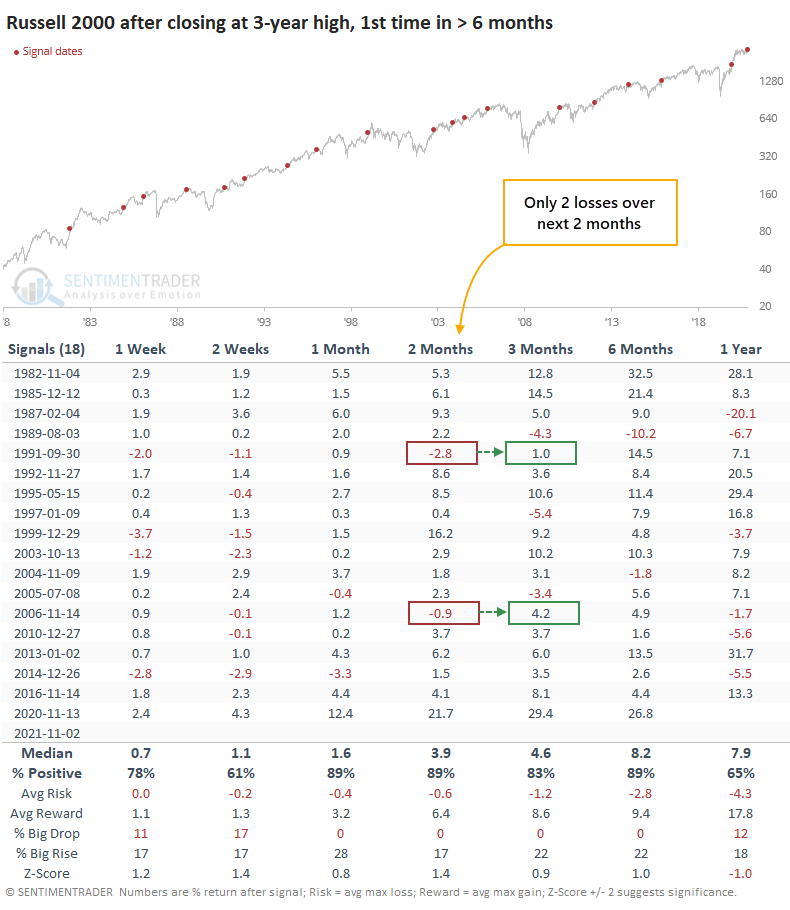
Breakouts in small-cap stocks tend to be a decent sign for the major indexes, and indeed, the S&P 500 showed good returns after these signals. Over the next two to three months, the S&P suffered only a few minor losses, none leading to imminent cascades. Jay went into detail about an options strategy, the Bull Call Spread, as a way to bet on this tendency with low risk.
Picking Midcap stocks for the next 7 months
If Jay could pick only one index for the next 7 months, it would be the S&P 400. That's based on returns during the 7 months extending from the end of October through May since 1981.
For this test, he used monthly total return data for:
- S&P 500 (Large-cap) Index
- S&P 400 (Mid-cap) Index
- Russell 2000 (Small-cap) Index
The chart below displays the cumulative % return for each of the 3 indexes held ONLY during November through May each year since 1981.
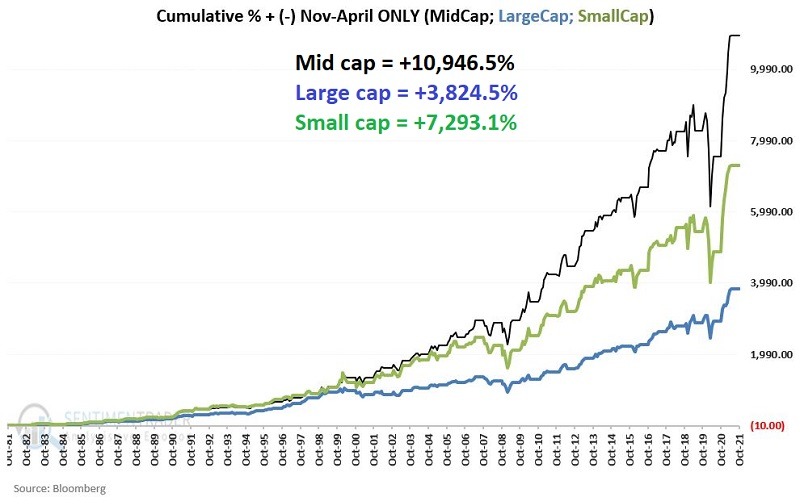
The cumulative returns for each index during Nov-May appear in the table below.
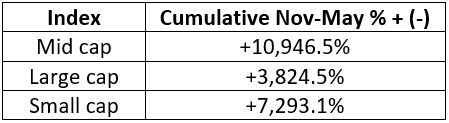
In terms of raw returns, Midcaps have been the winner of the past four decades. However, consistency is just as important. Even in that category, Midcaps took the crown, winning more often than the other two indexes.
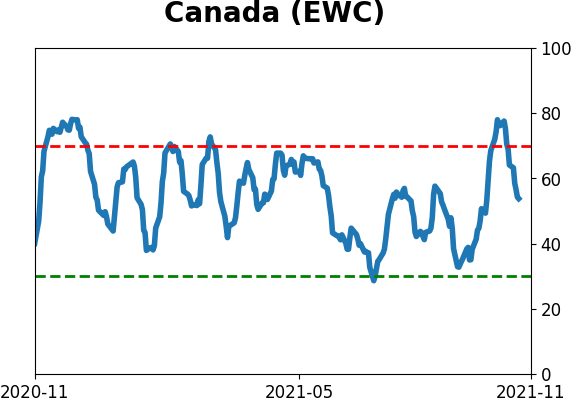
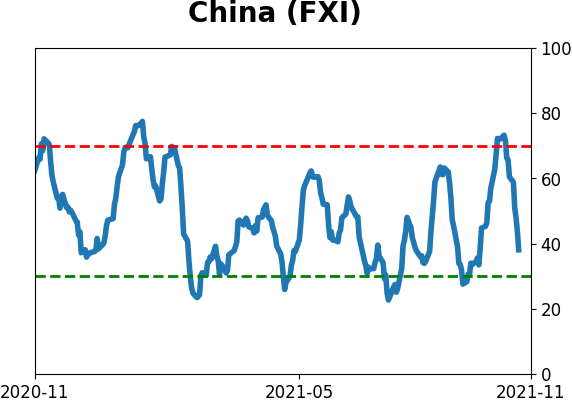
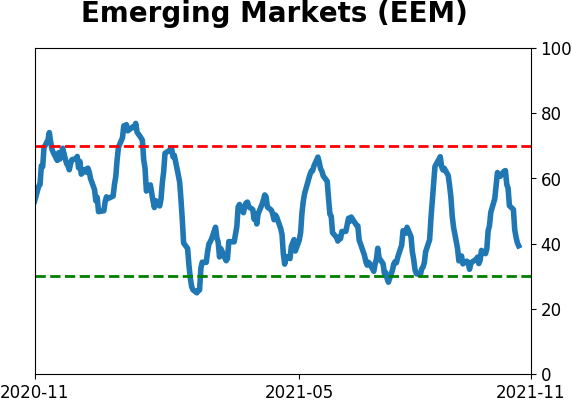
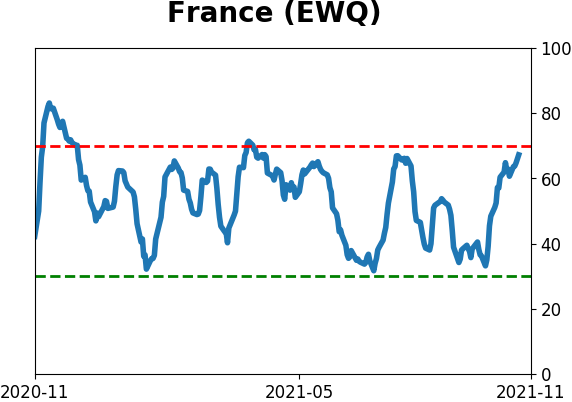
Overseas stocks just can't keep up
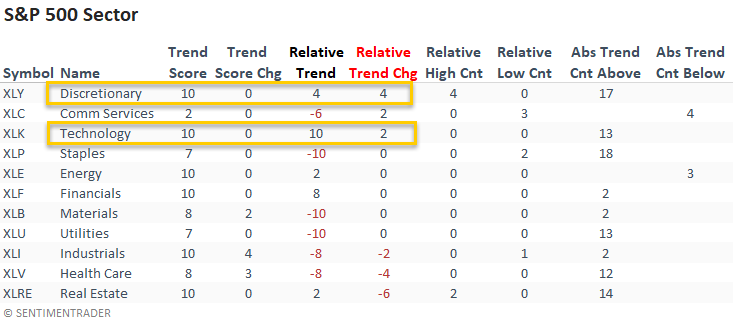
Dean updated his absolute and relative trend following indicators for domestic and international ETFs.
The consumer discretionary sector had the best week-over-week relative trend score improvement and registered a new relative high on 4/5 days. Technology continues to look good and returns to a perfect absolute and relative trend score profile.
Real estate registered two new relative highs last week before underperforming by a meaningful amount on Friday. The underperformance shifted the relative trend score down by six points.
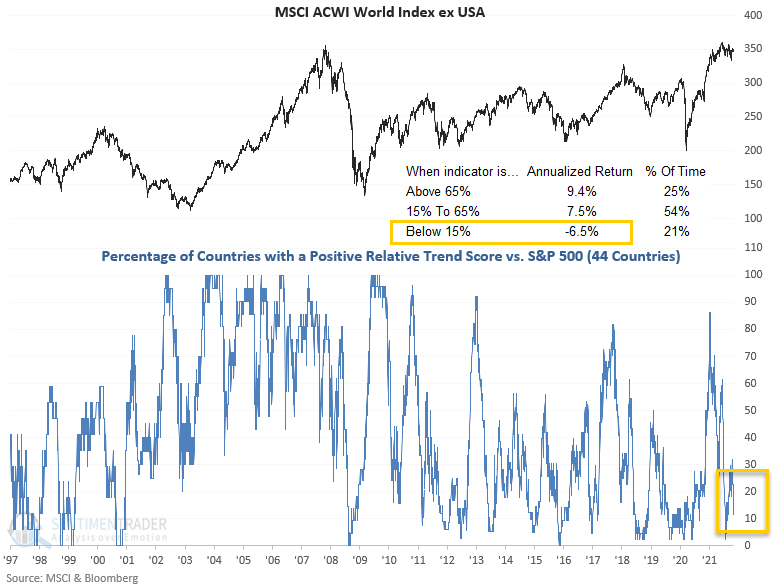
The percentage of countries with a positive relative trend score versus the S&P 500 declined from last week. If we look at the regional data, we see deterioration across the globe.
The current all-country data continues to suggest an unfavorable environment for the MSCI ACWI World Index ex USA.
The percentage of Eurozone countries with a positive relative trend score versus the S&P 500 dropped to zero for the first time since July.
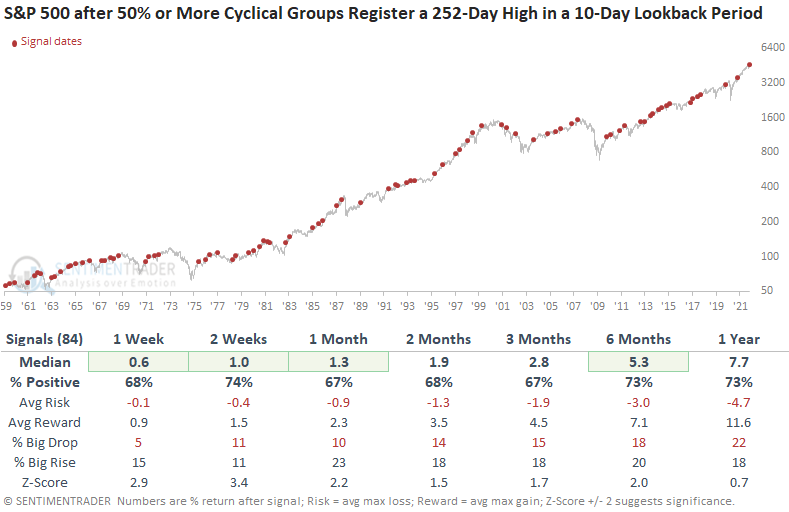
Cyclical groups storm higher
Dean pointed out that participation from a basket of cyclical industries looks solid. At the start of November, 57% of cyclical groups registered a new 252-day within the past 10 days.
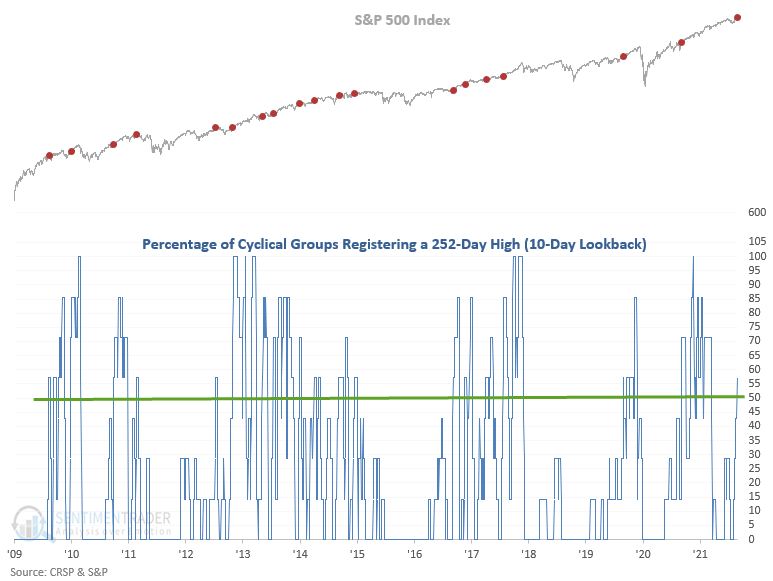
Let's assess the forward return outlook for the S&P 500 when this crosses above 50%. Dean screened out repeat signals by requiring the indicator to fall to 0% before a new instance could occur again.
Results look good across all time frames with several notable risk/reward profiles, especially in the 2-week window.
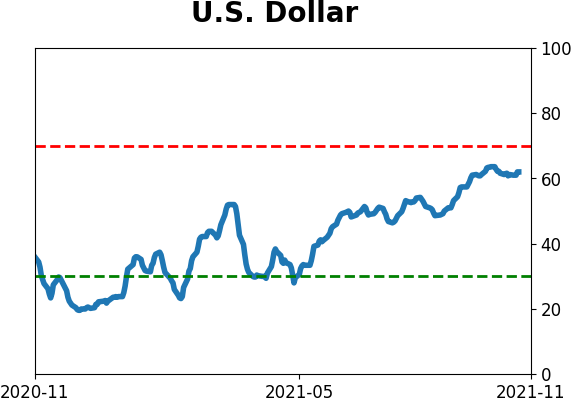
The dollar's decent trend and positive seasonality
Jay pointed out that a daily chart for UUP (Invesco DB U.S. Dollar Index Bullish Fund) - which tracks U.S. Dollar futures - has been in a steady uptrend.
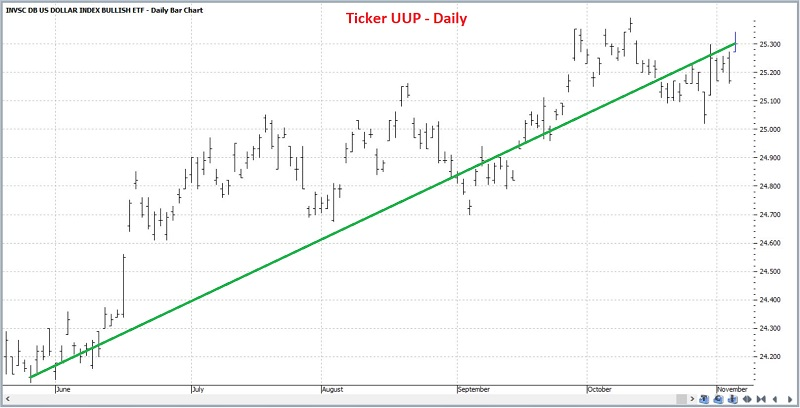
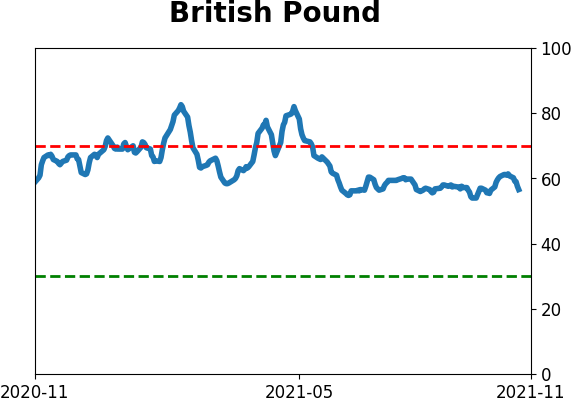
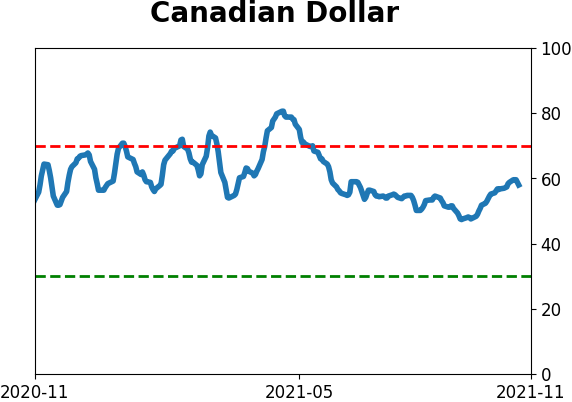
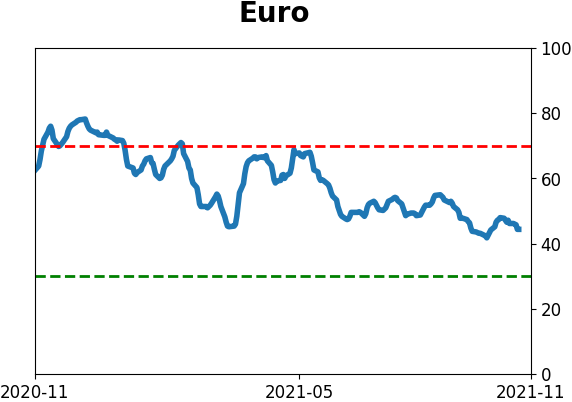
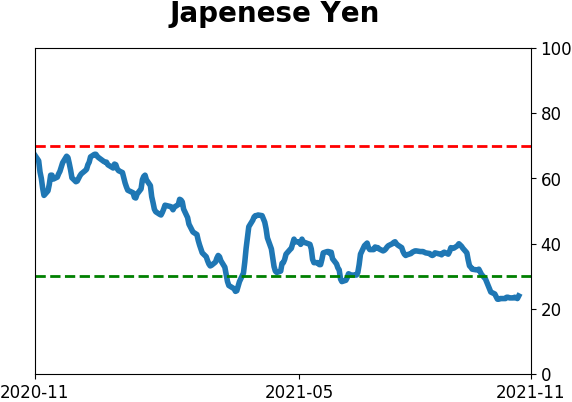
In direct contrast to other currencies like the pound, euro, and yen, the Annual Seasonal Trend for the U.S. dollar shows a mostly positive bias ahead.
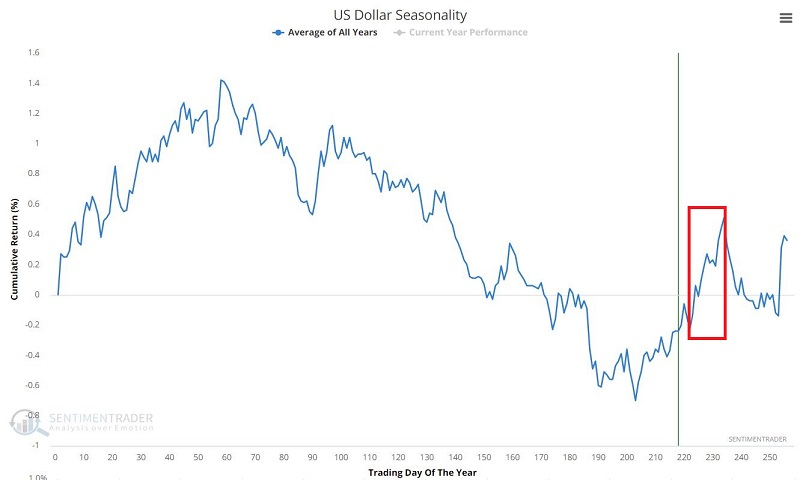
If we combine the current uptrend with the dollar's favorable seasonal trend, the suggestion is that the dollar will show strength in the near term.
One way to trade that is by buying calls on UUP. Buying a 3-lot of January 25 calls gives a delta of 196.56. This means that (for now) this position will behave like a position holding roughly 200 shares of UUP. The cost to enter is $123 versus $5,030 to buy 200 shares of UUP.
The maximum profit potential is unlimited, while the maximum risk is -$123 and would only occur if we held the position to January expiration with UUP below $25. At expiration, the breakeven price is $25.41, so above this price, the option will gain point-for-point with the shares.
Jay also noted that if a trader wished to bet that seasonal trends will peter out and the dollar will reverse from potential overhead resistance, then buying puts would offer roughly the inverse risk/reward as the calls.
About the Weekly Wrap...
The goal of the Weekly Wrap is to summarize our recent research. Some of it includes premium content (underlined links), but we're highlighting the key focus of the research for all. Sometimes there is a lot to digest, with this summary meant to highlight the highest conviction ideas we discussed. Tags will show any symbols and time frames related to the research.
Active Studies
|
|
|
|
|
|
Indicators at Extremes
|
|
|
Portfolio
|
|
|
|
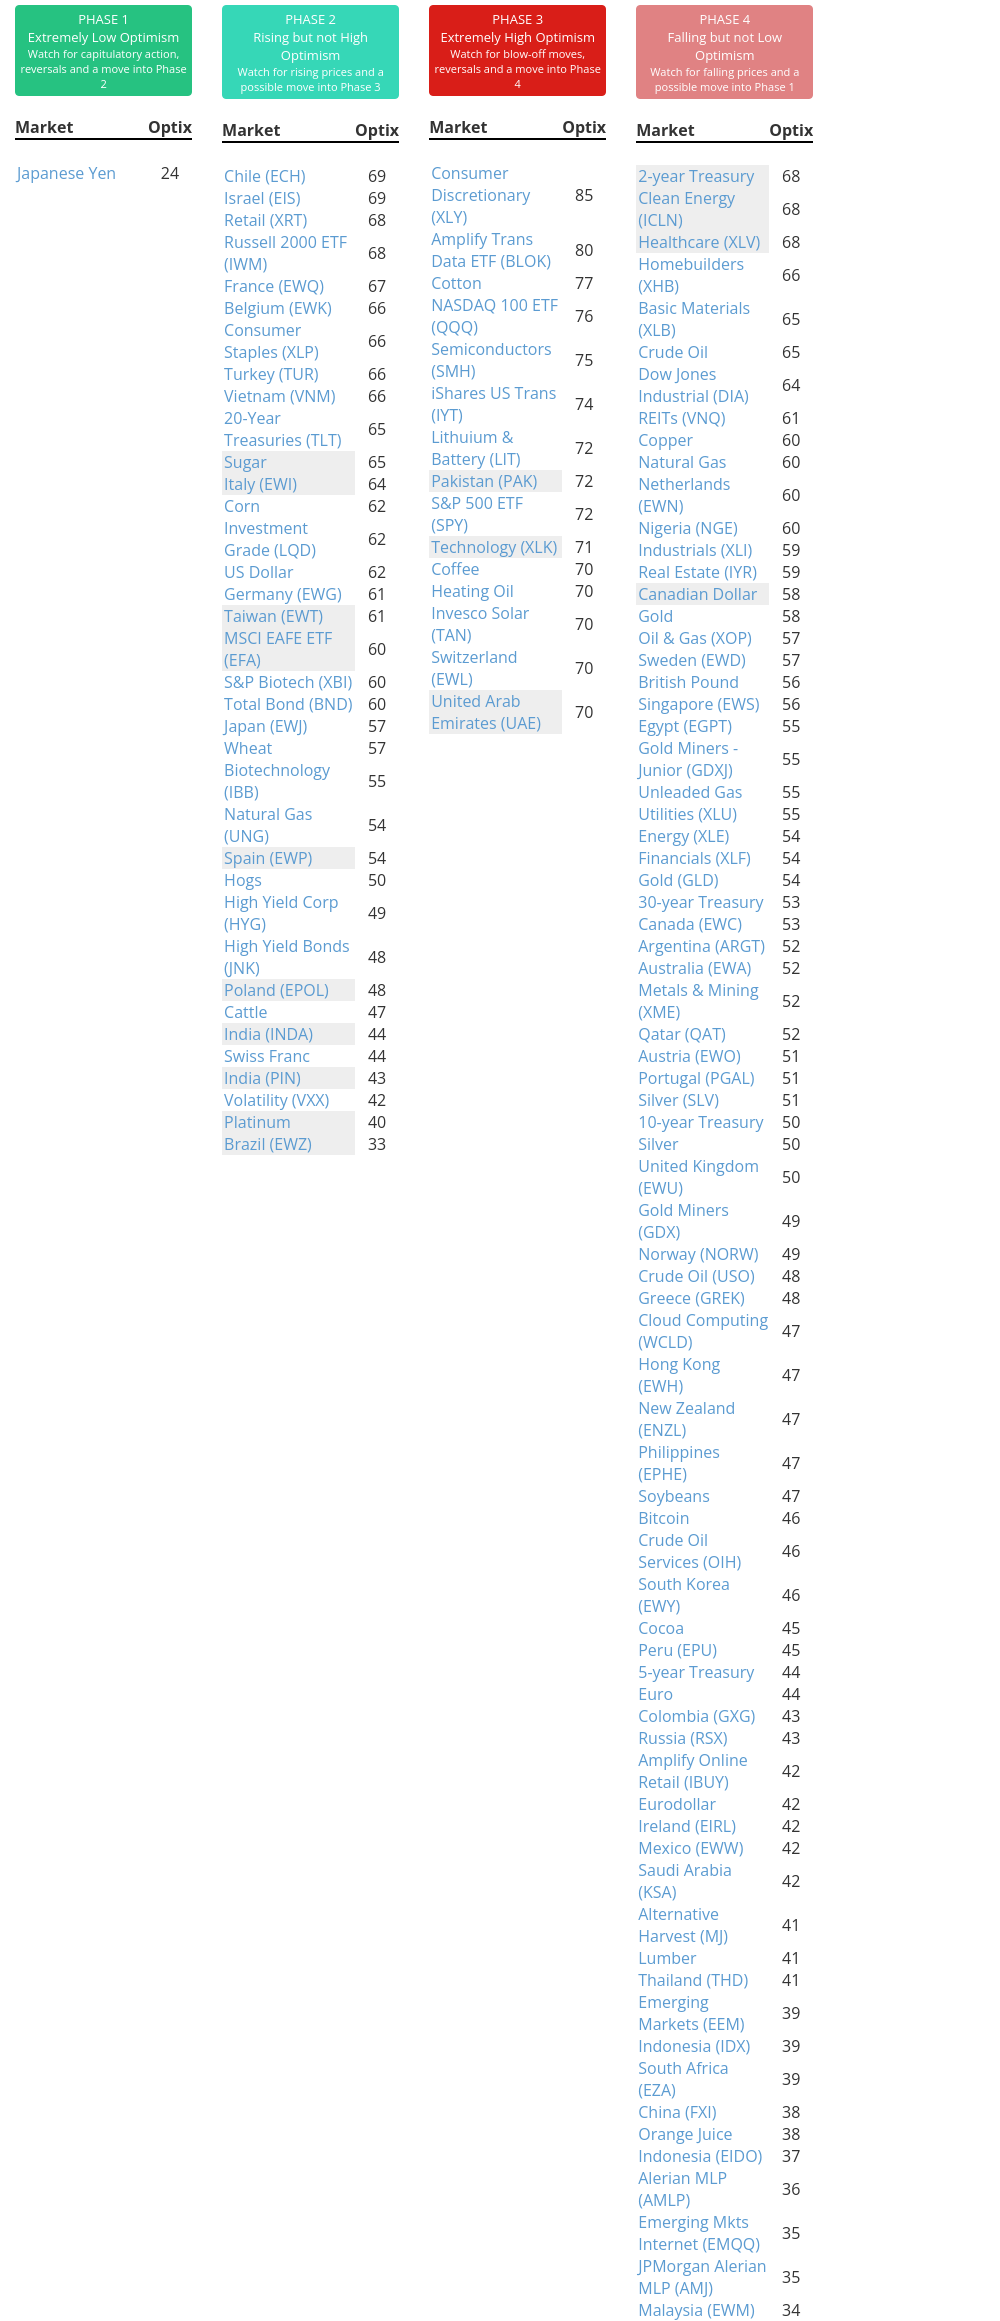
Phase Table
|
|
|
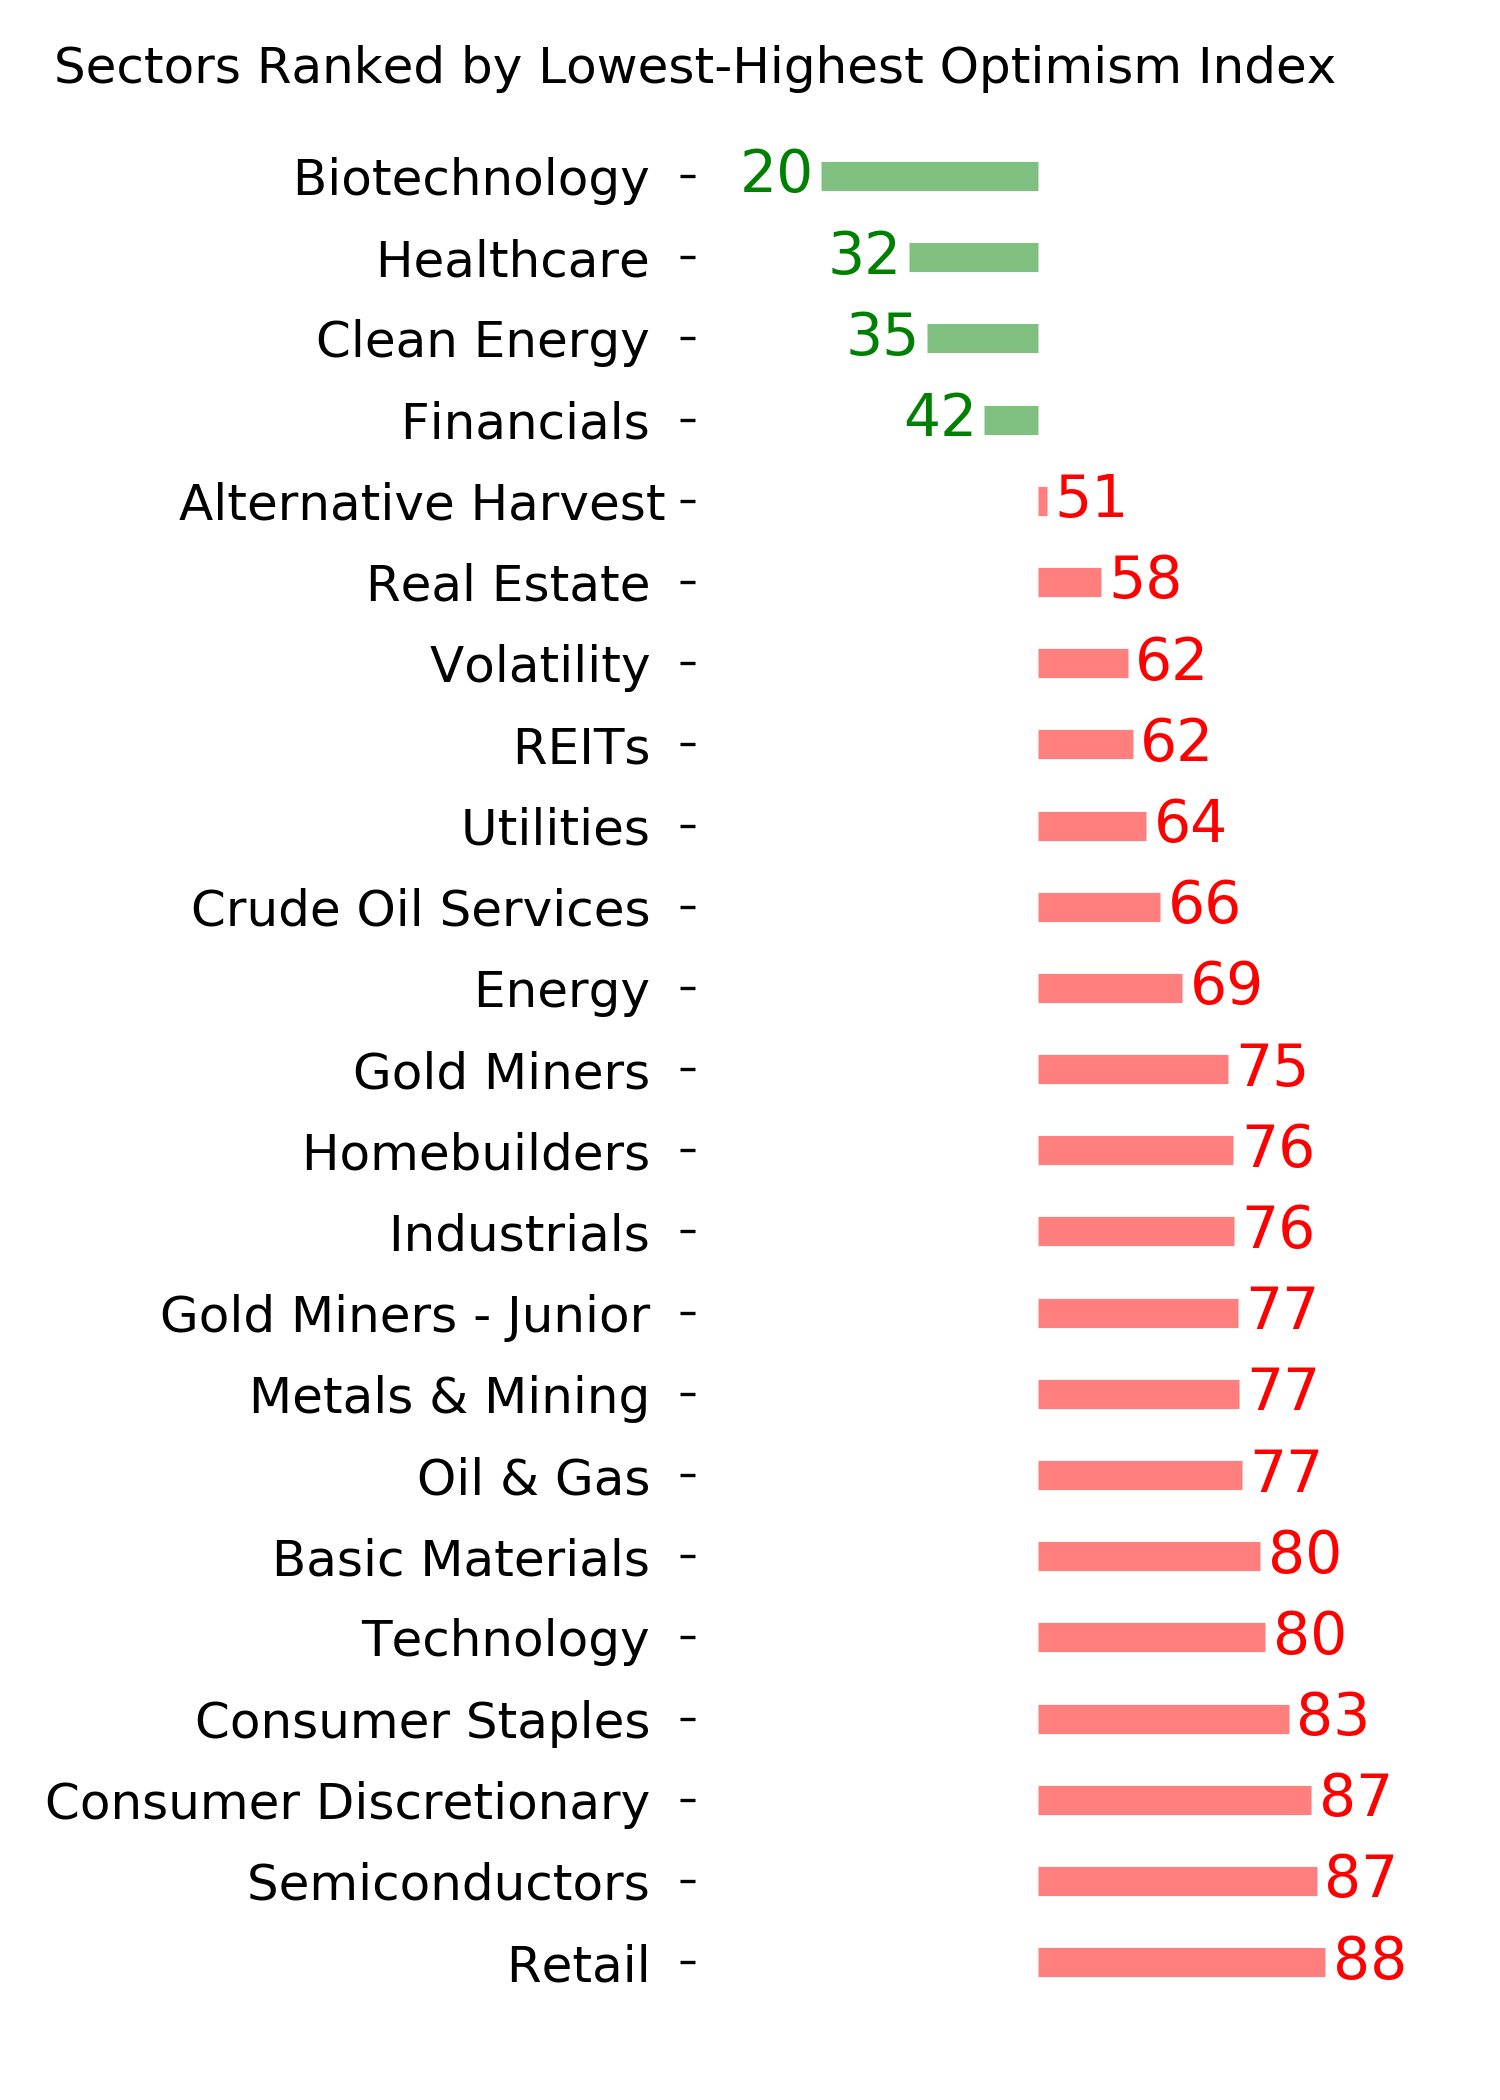
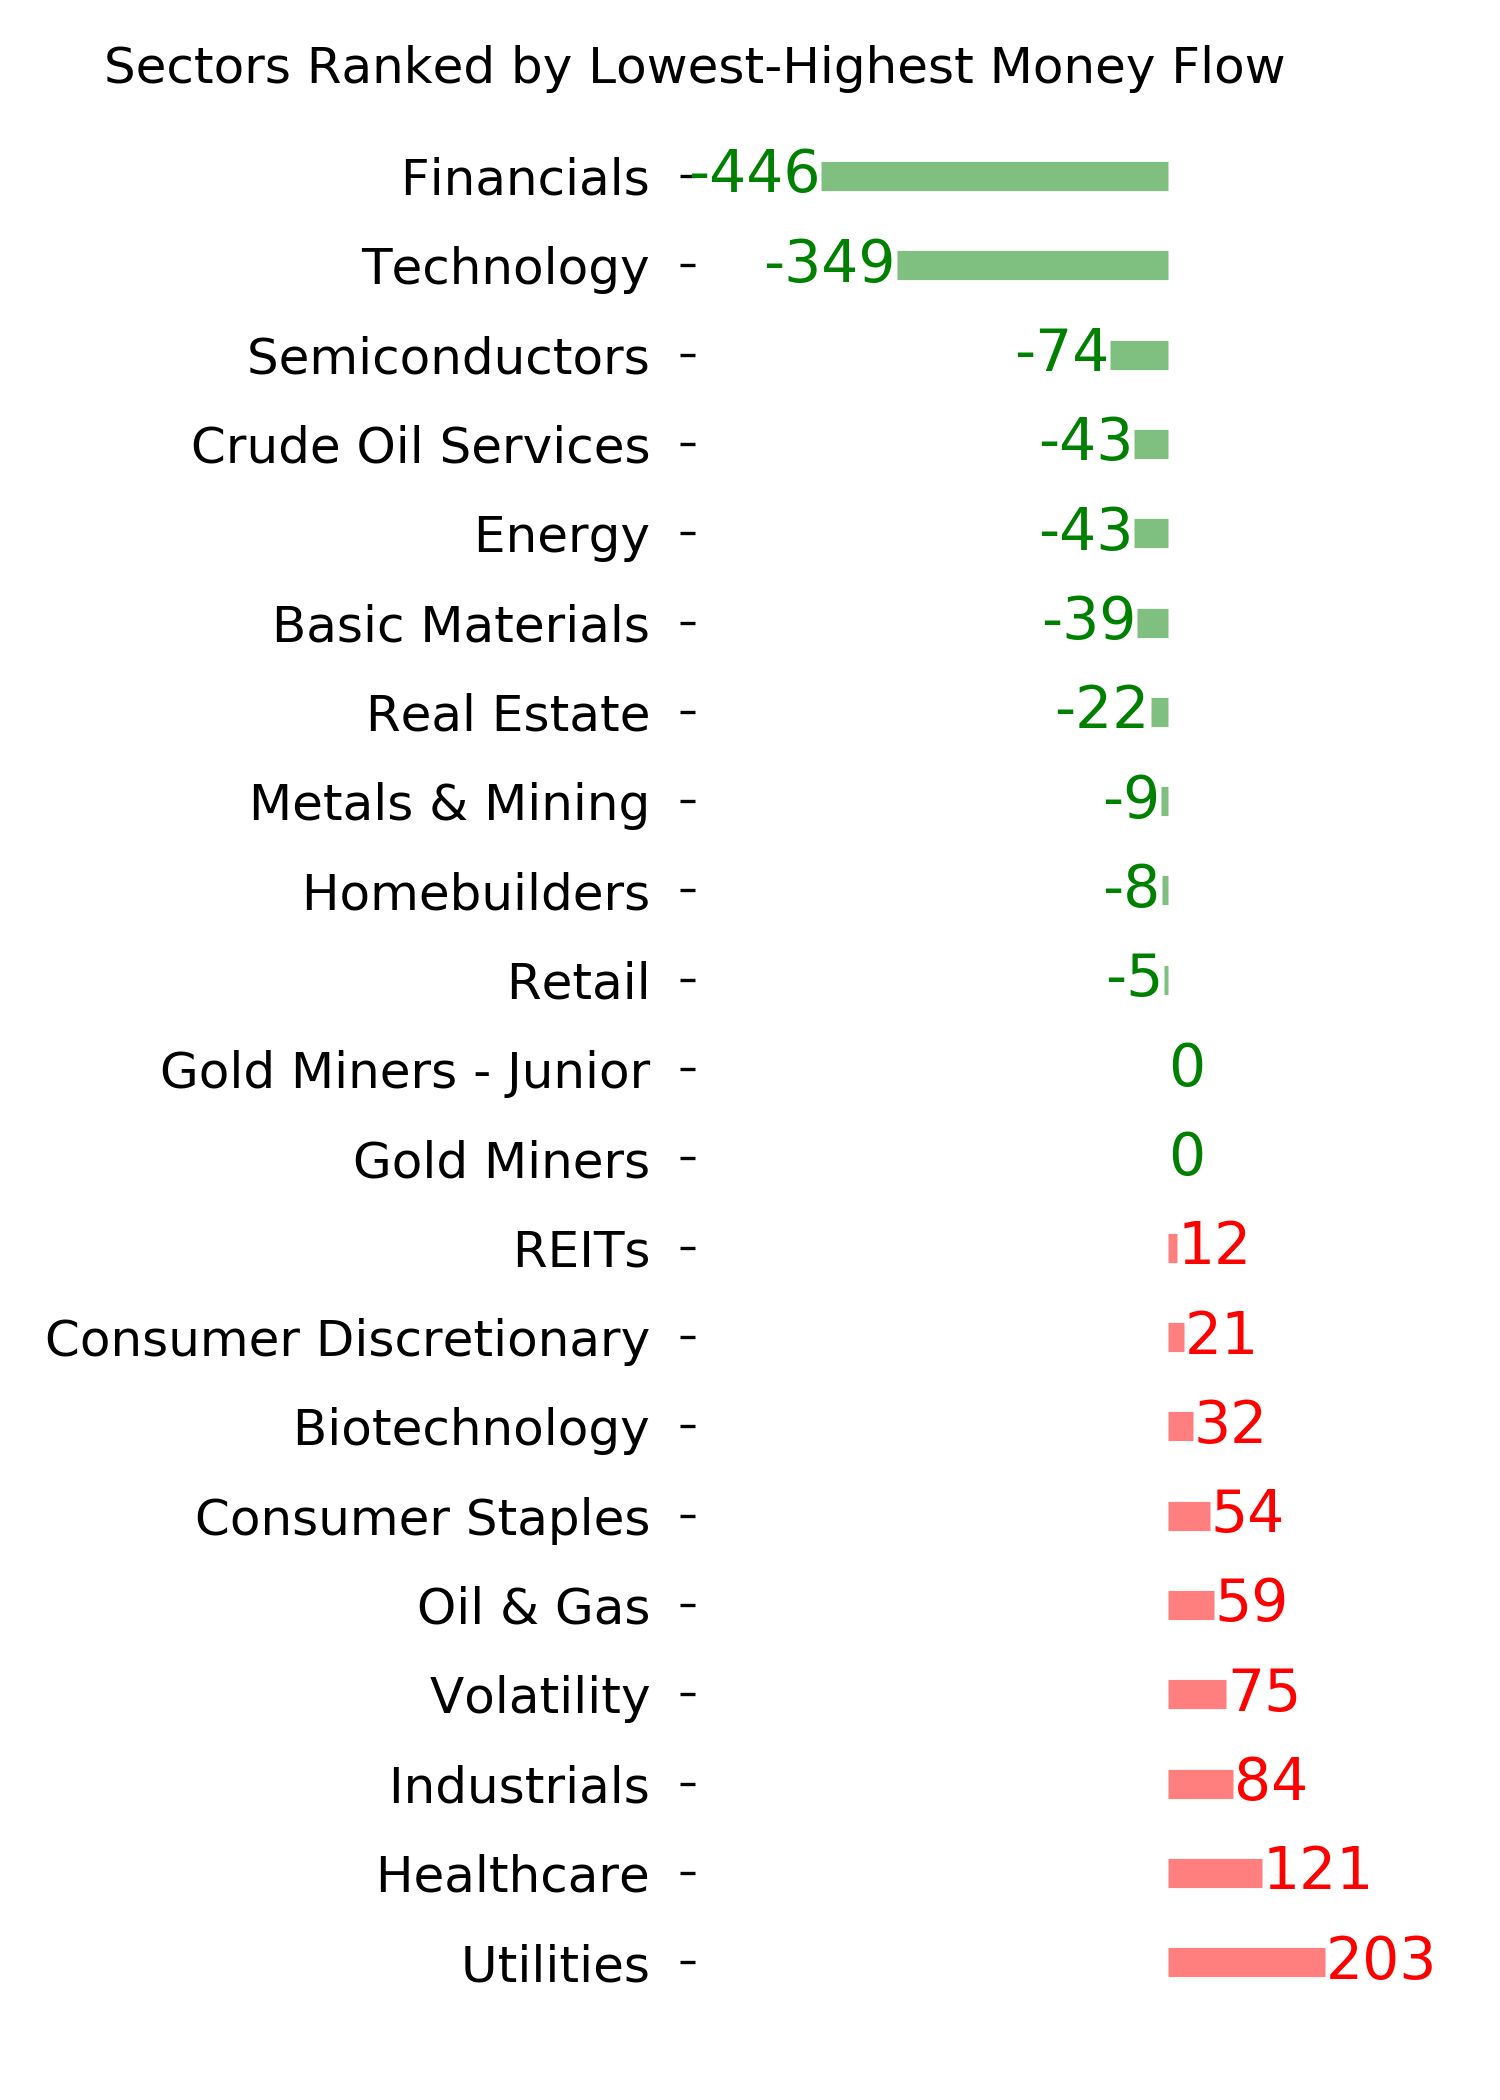
Ranks
|
|
|
|
|
|
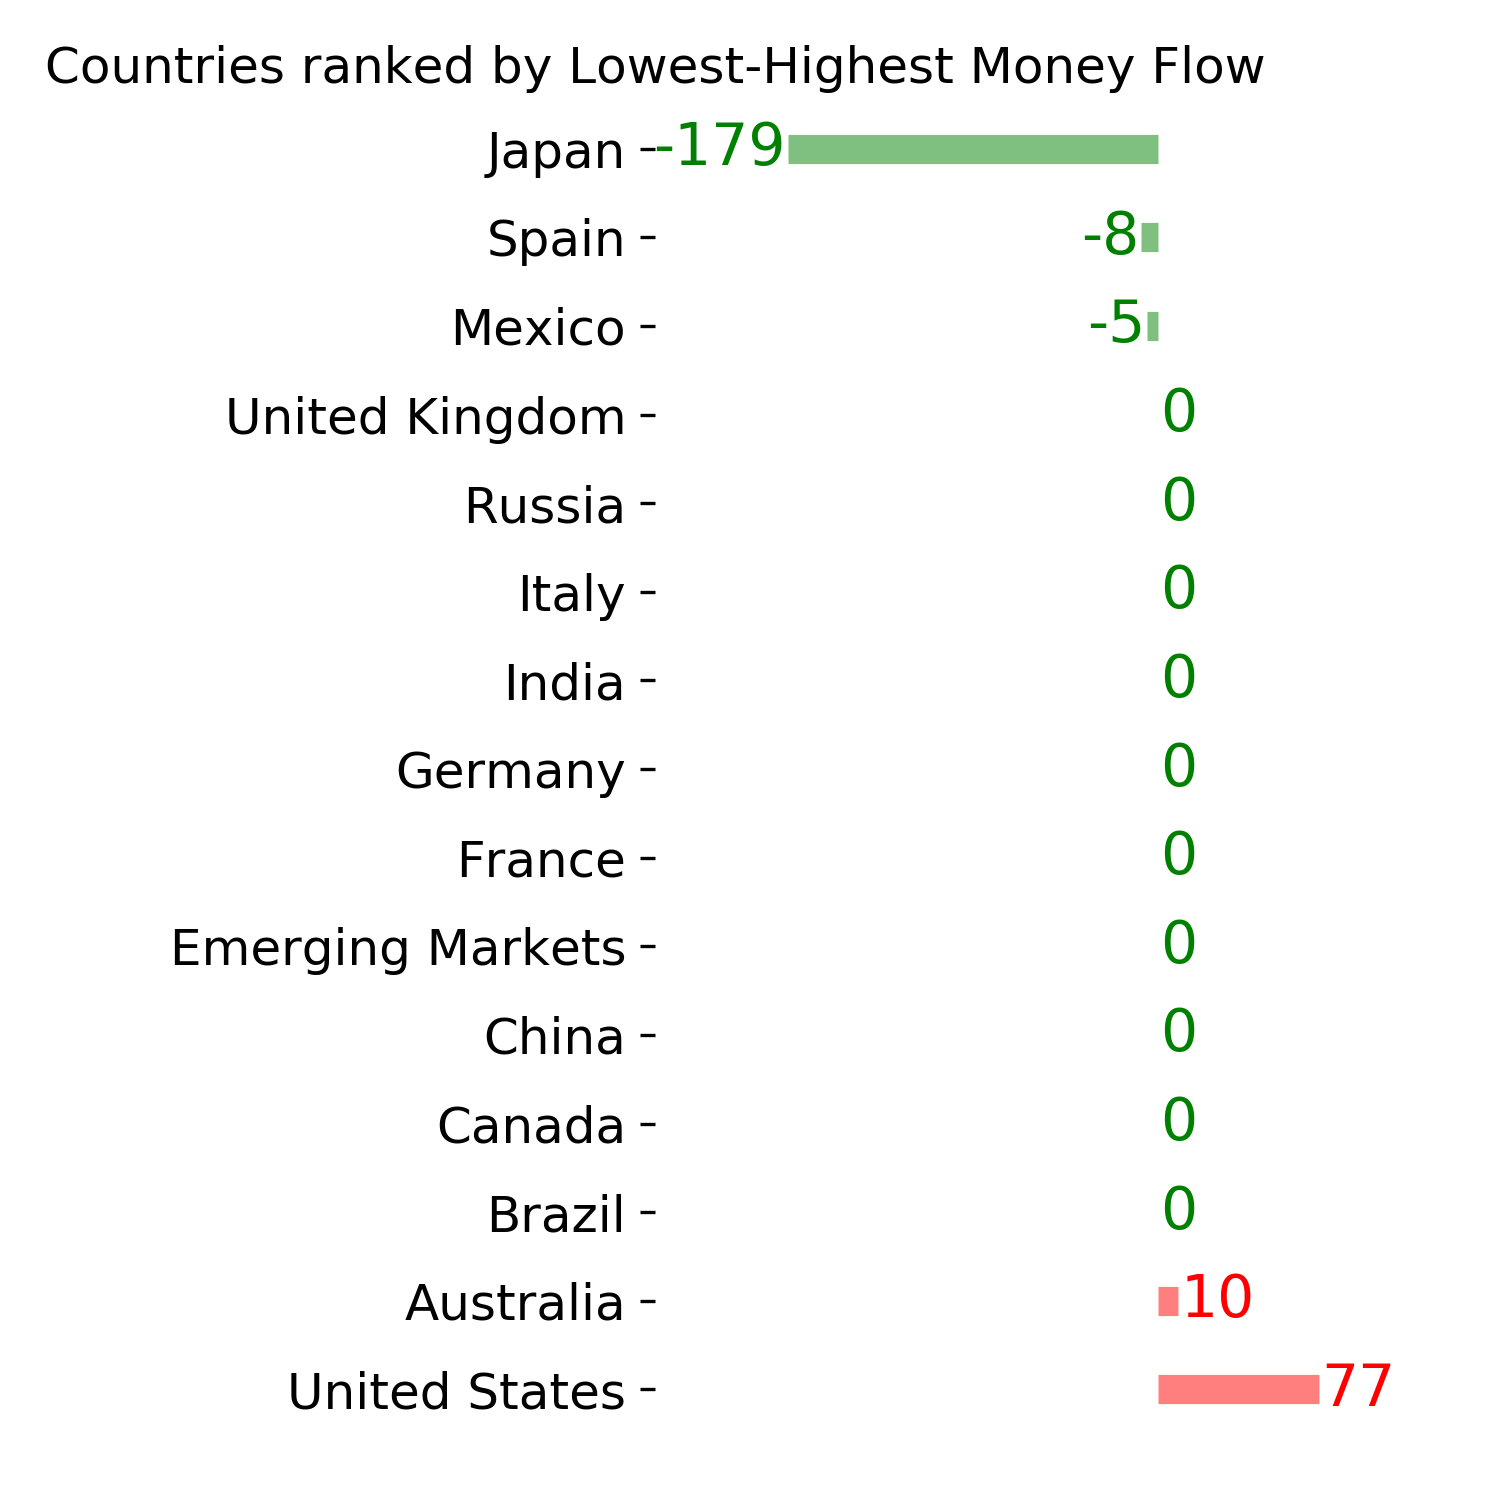
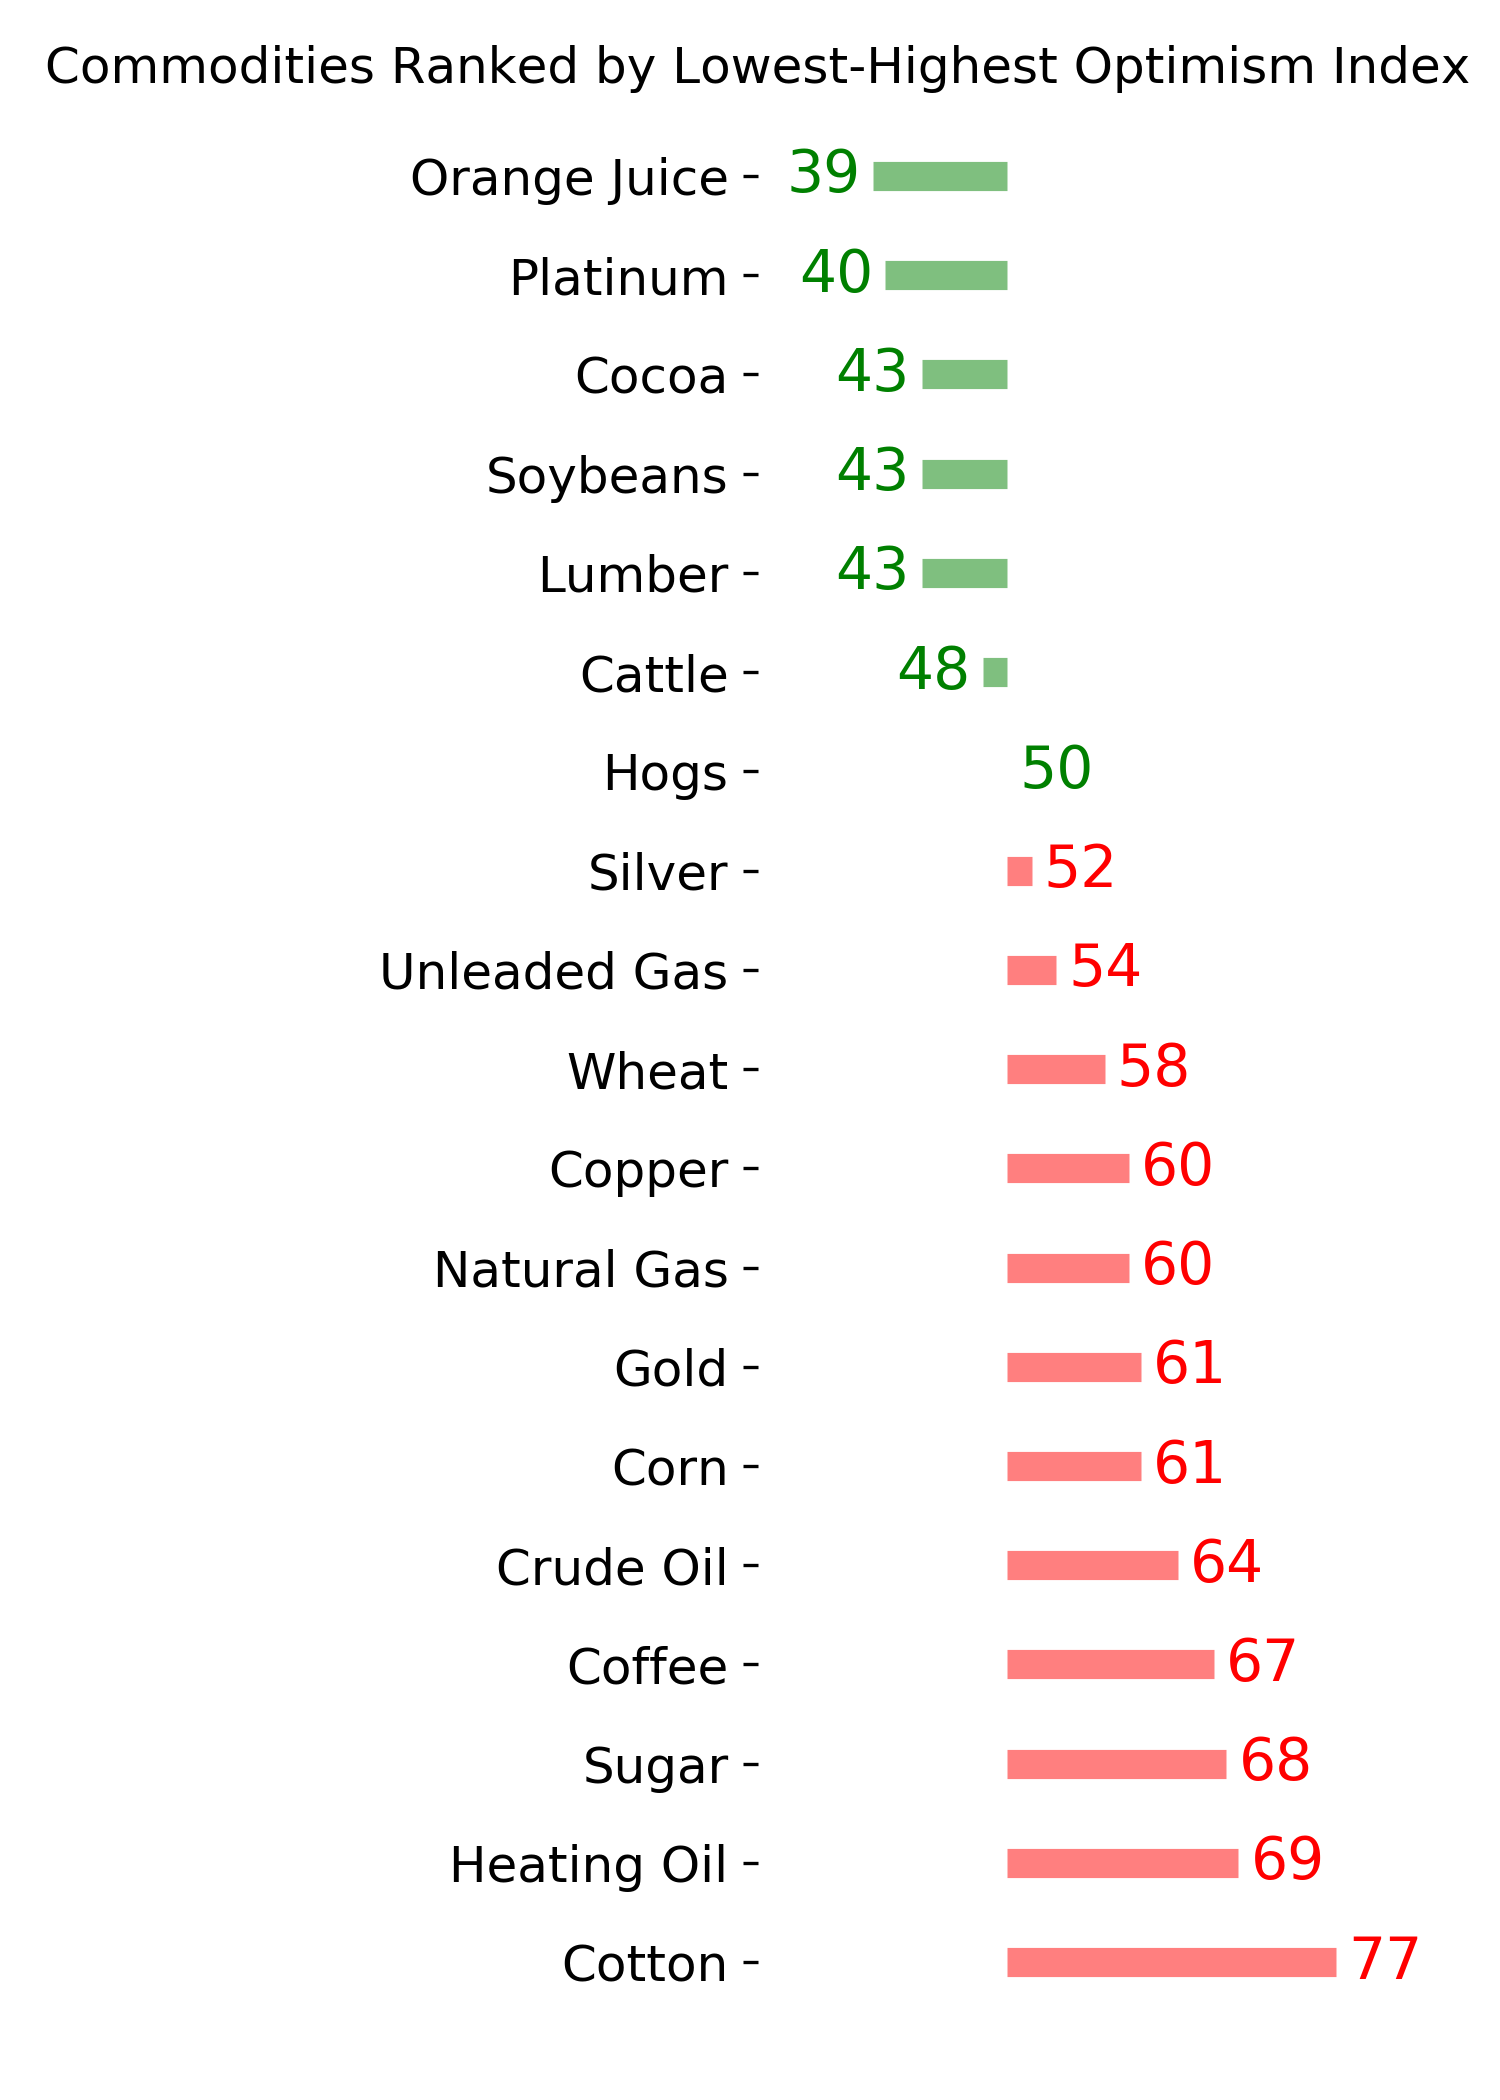
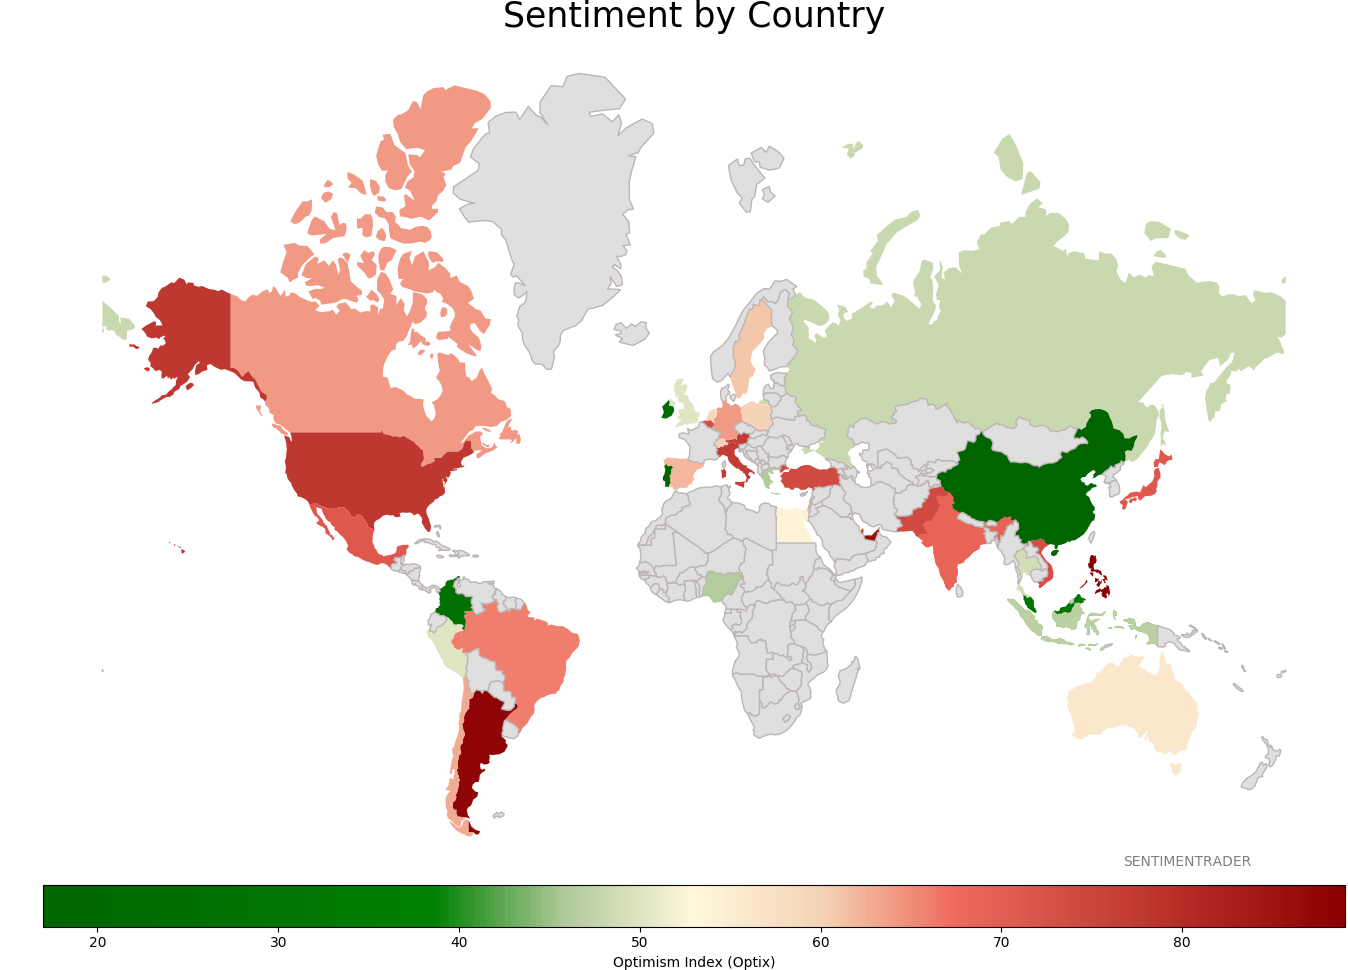
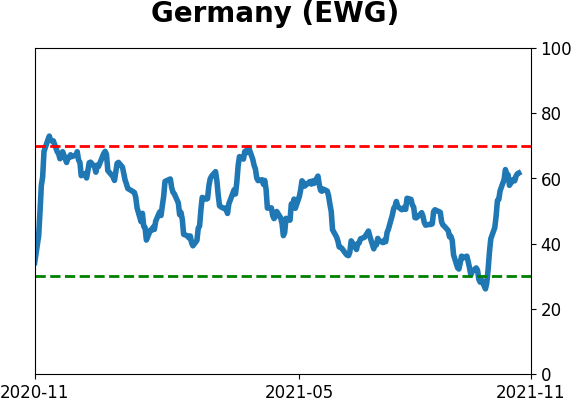
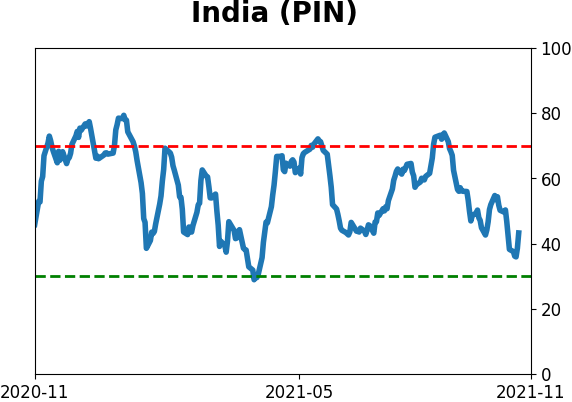
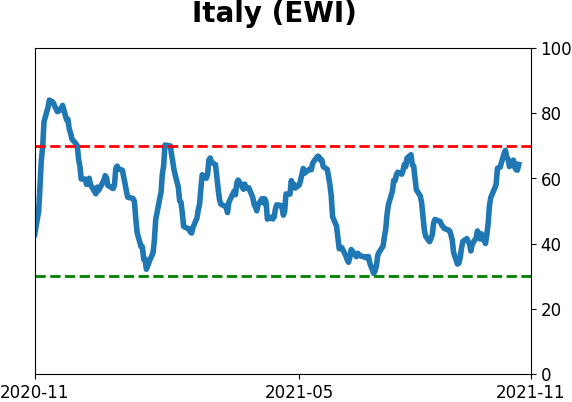
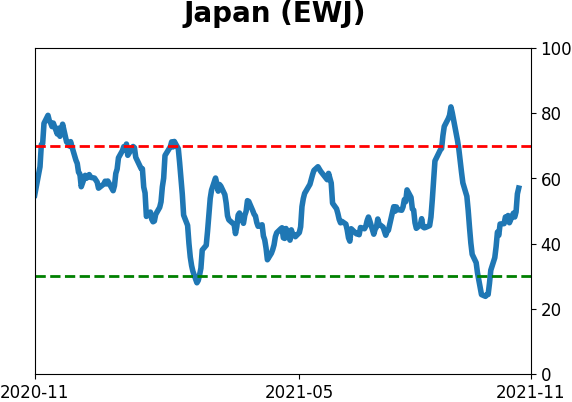
Sentiment Around The World
|
|
|
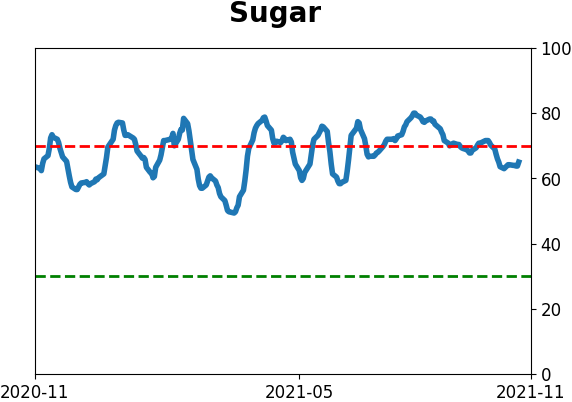
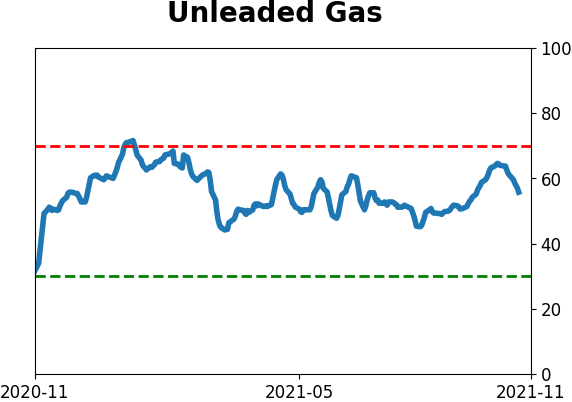
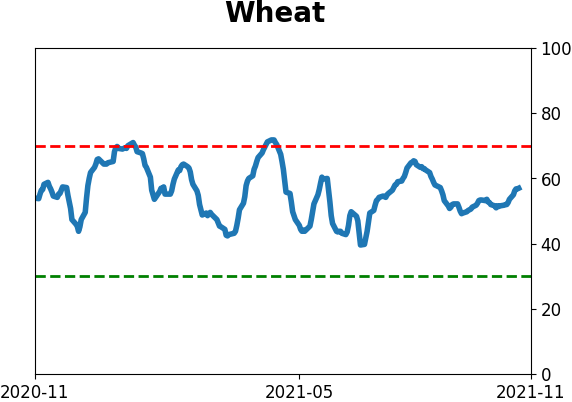
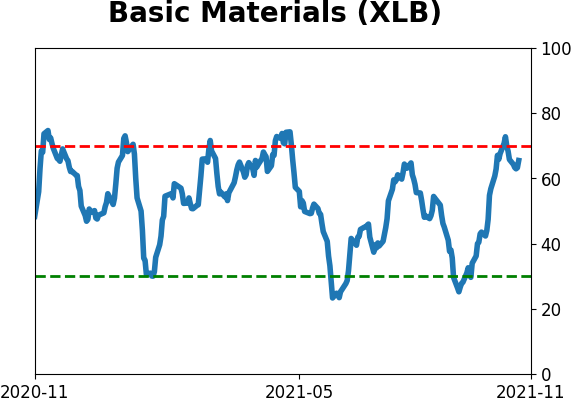
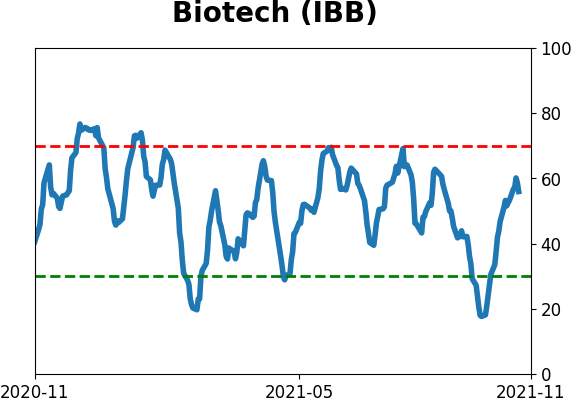
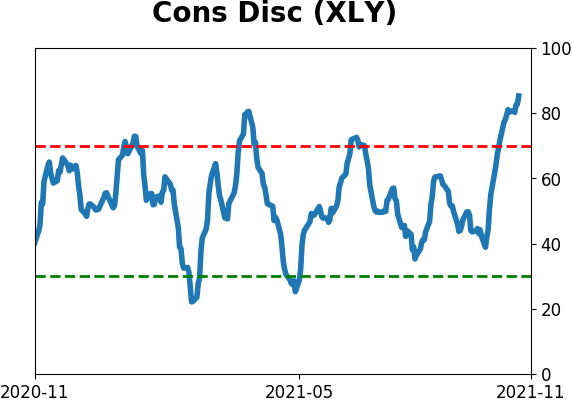
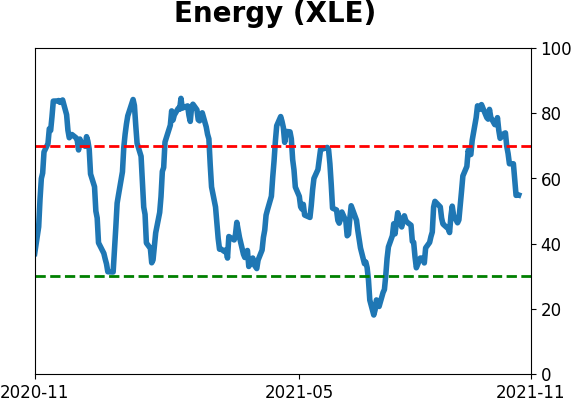
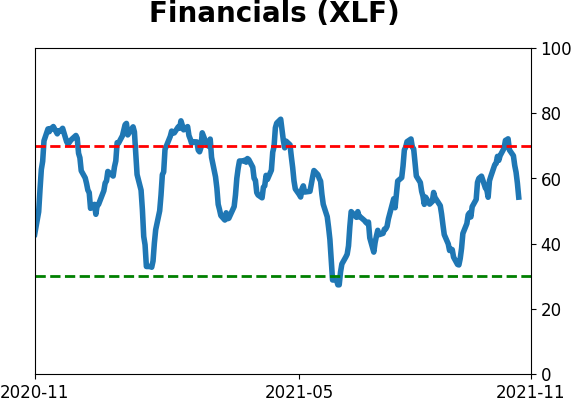
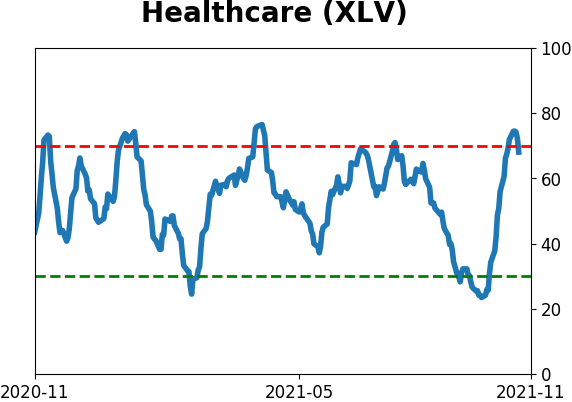
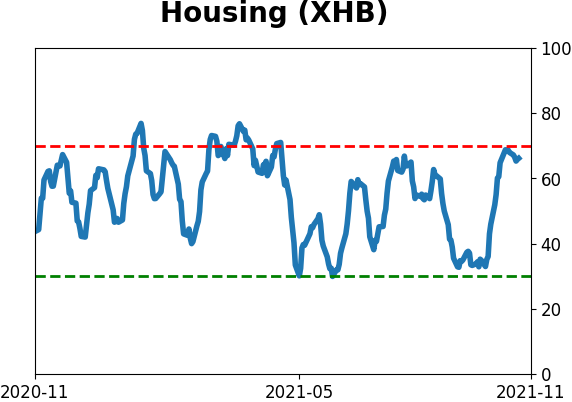
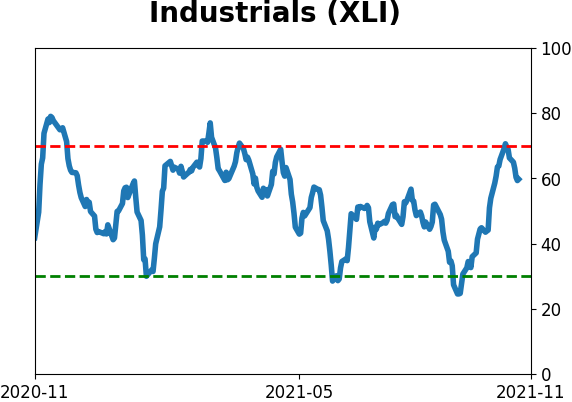
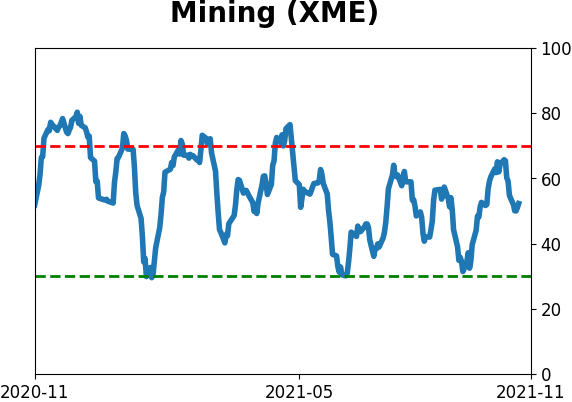
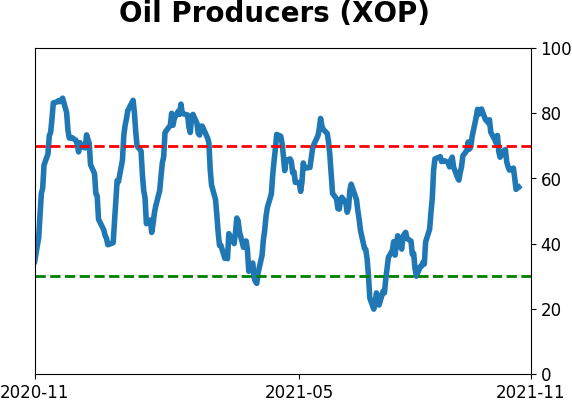
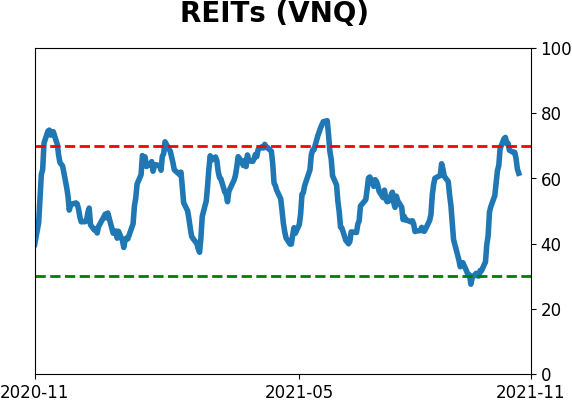
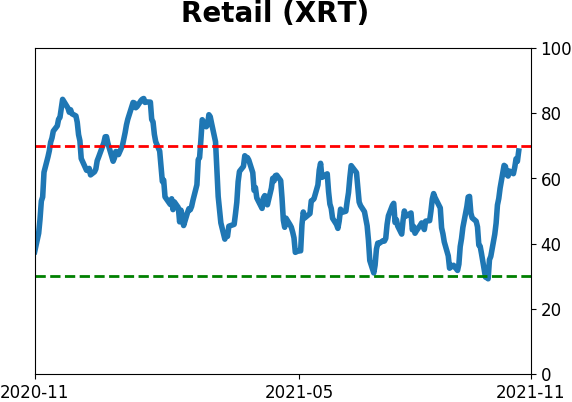
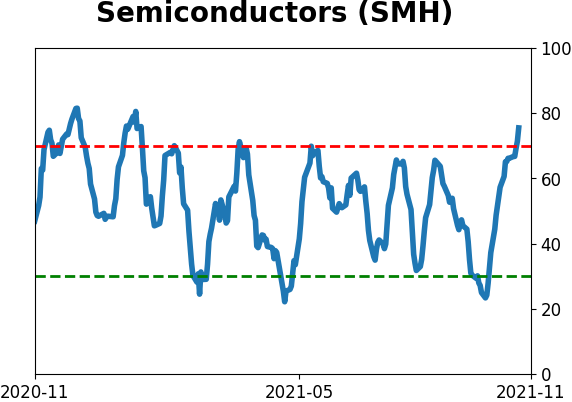
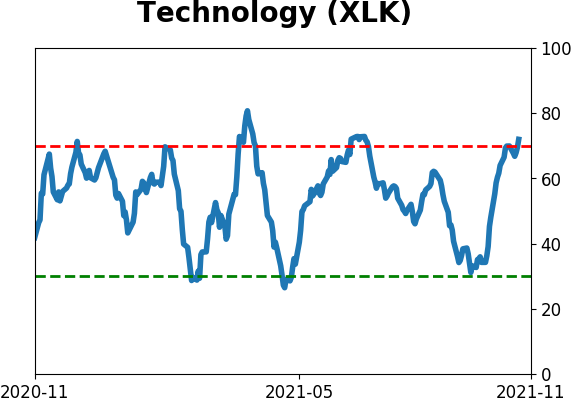
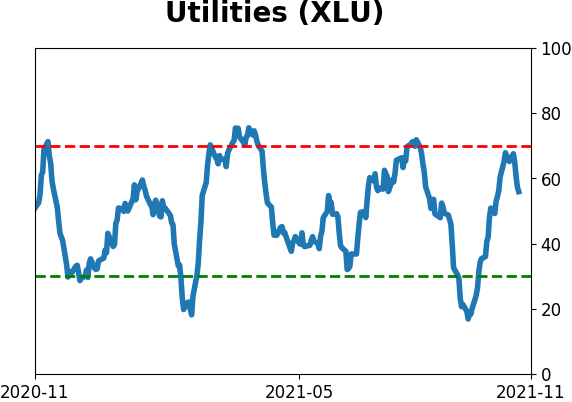
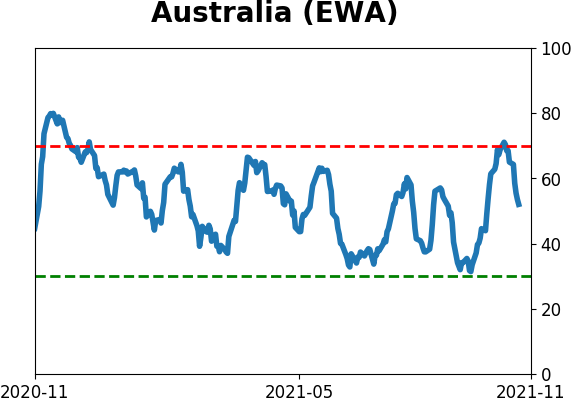
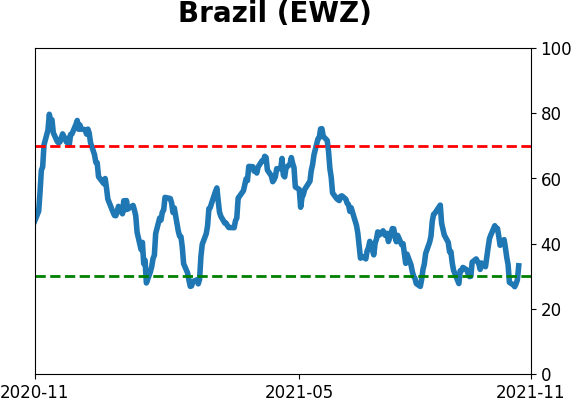
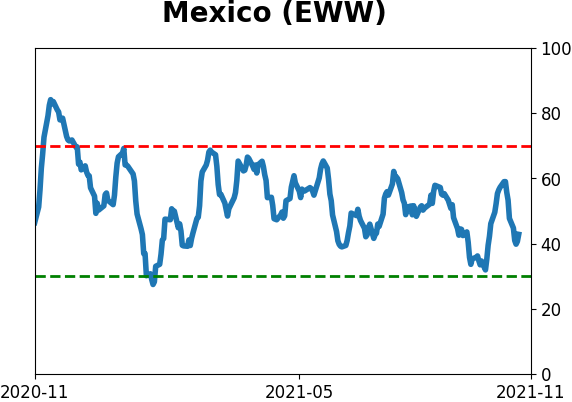
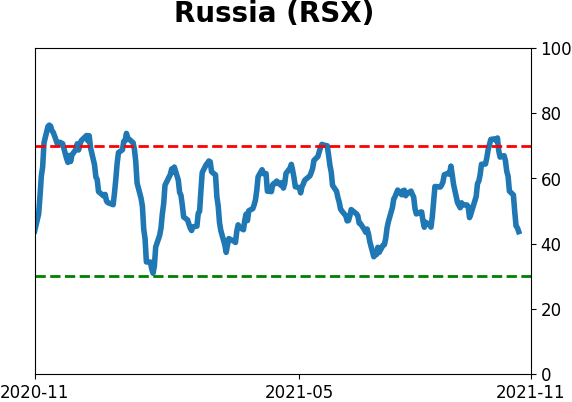
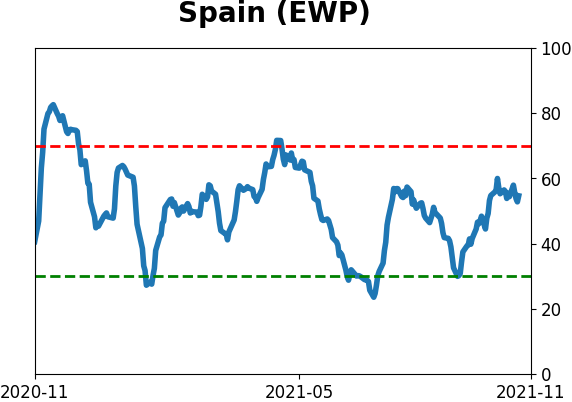
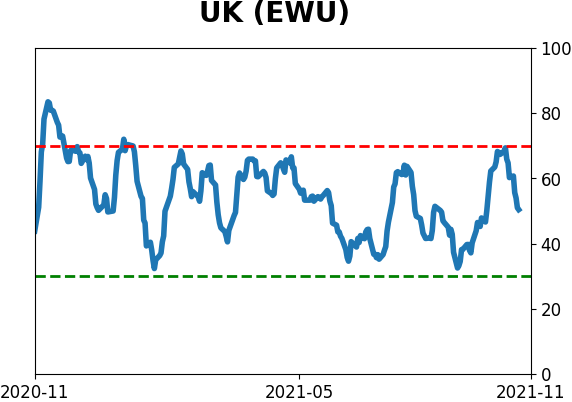
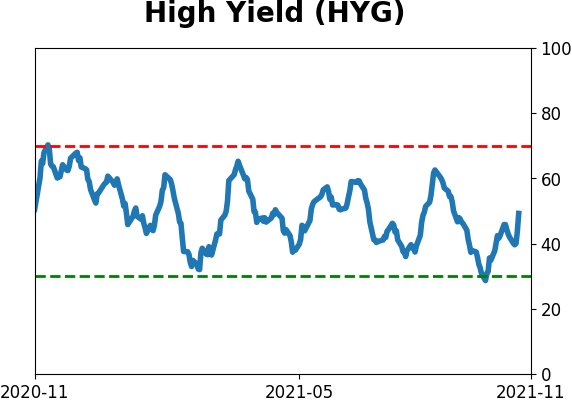
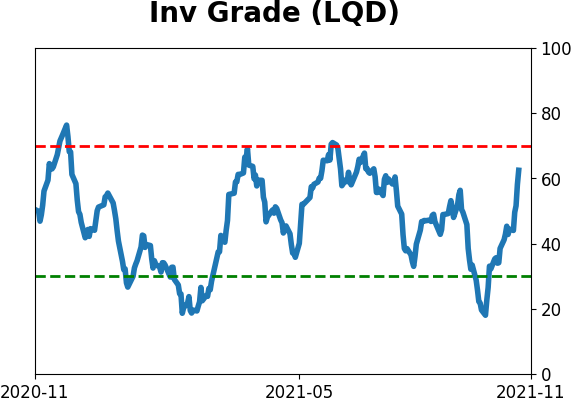
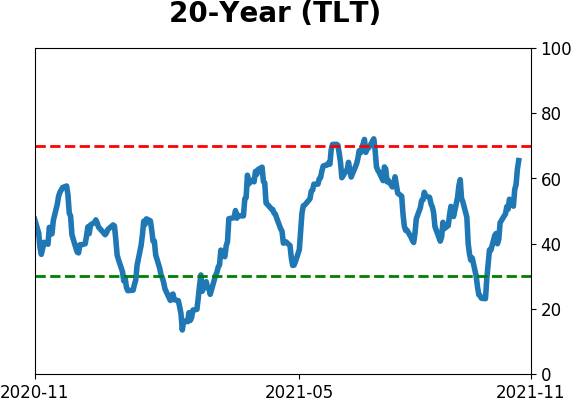
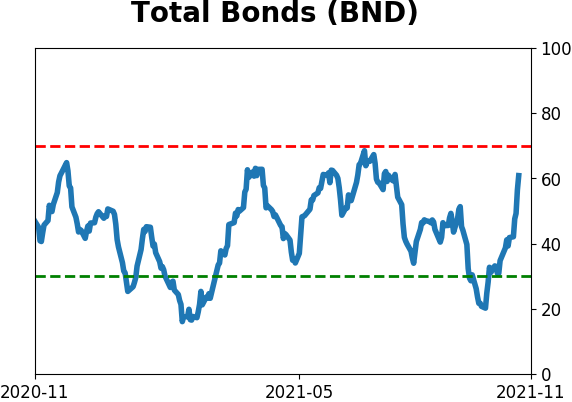
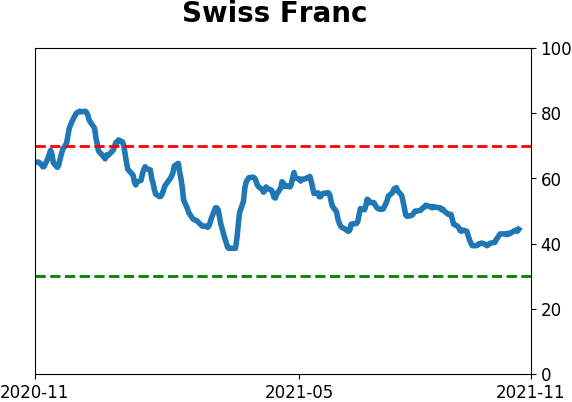
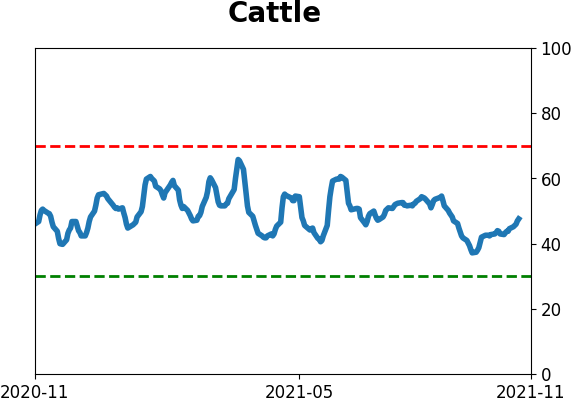
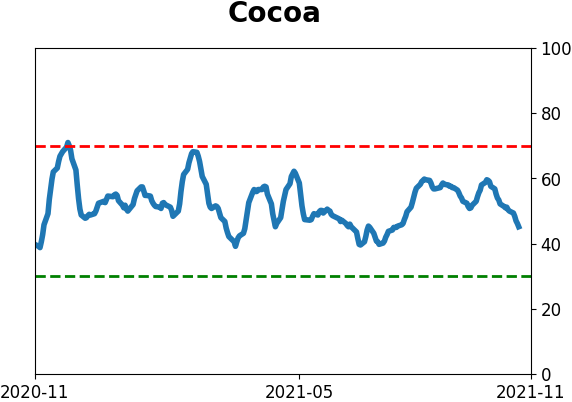
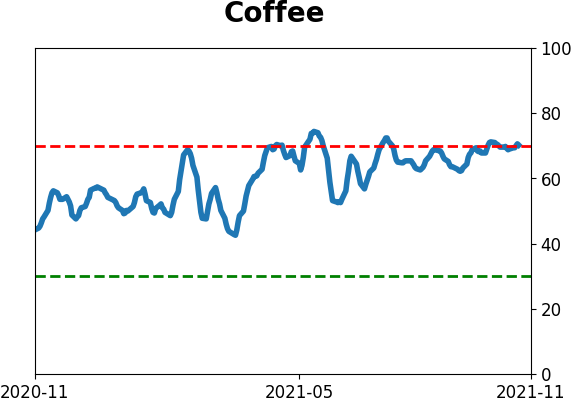
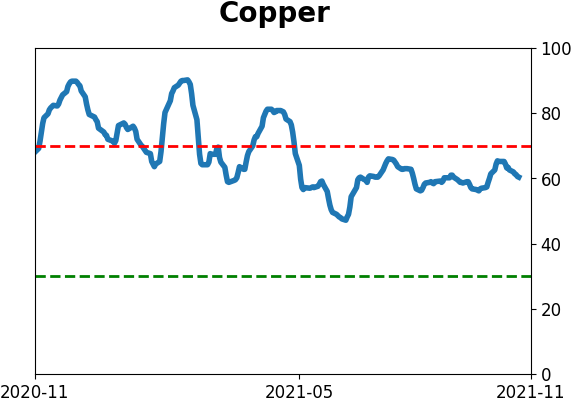
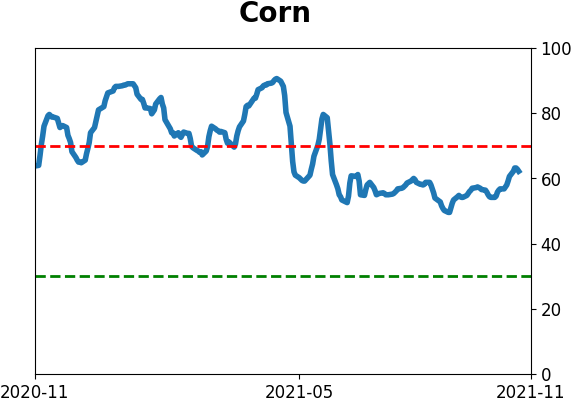
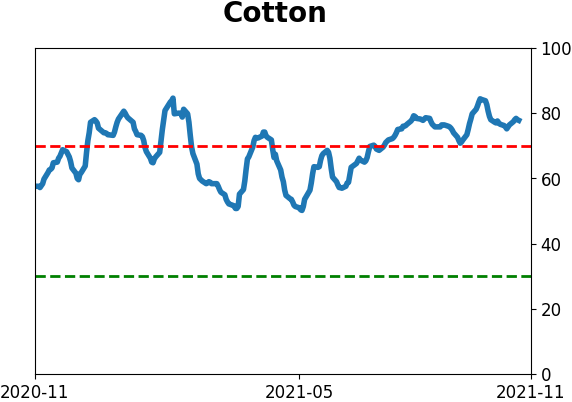
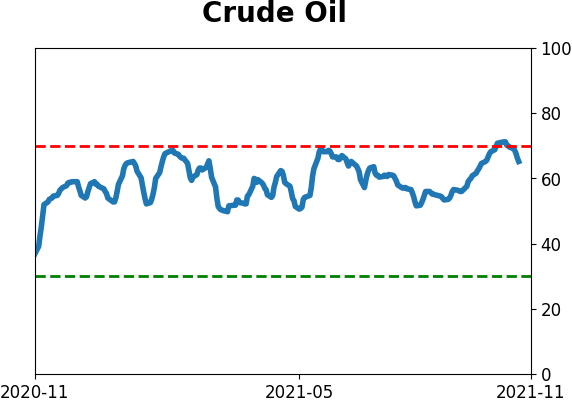
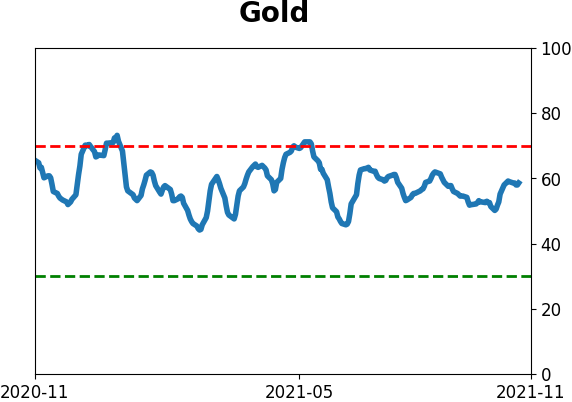
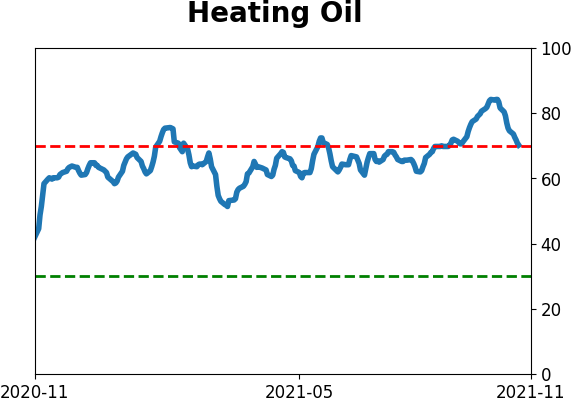
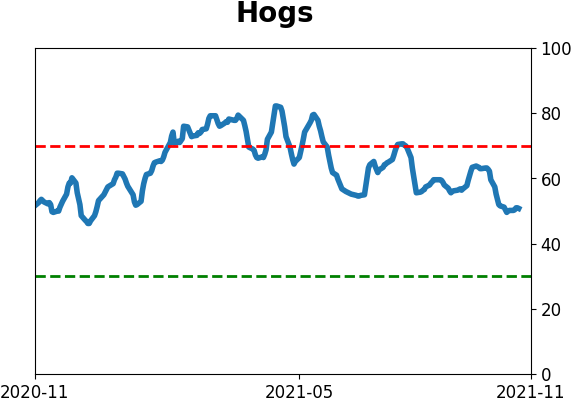
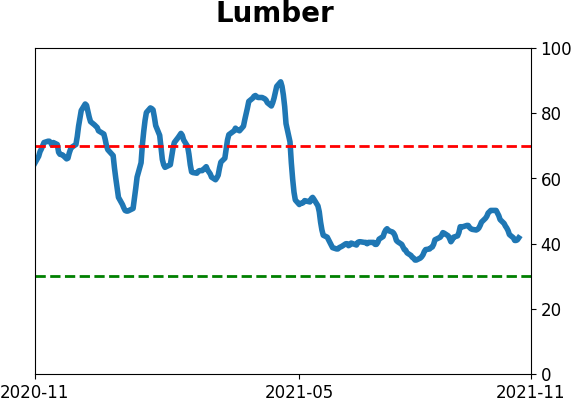
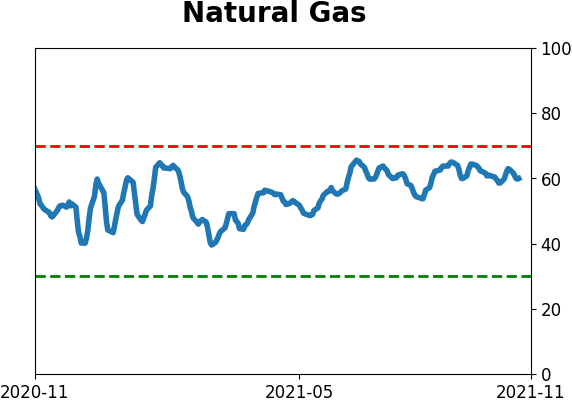
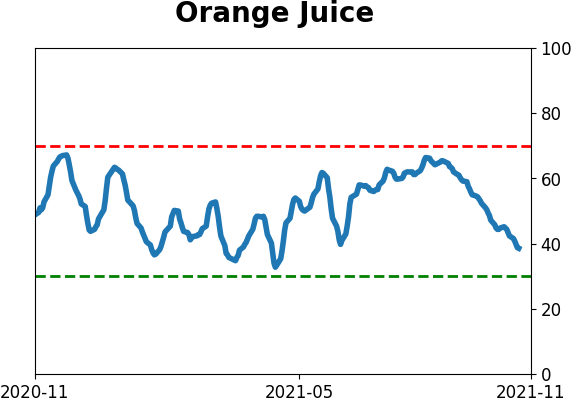
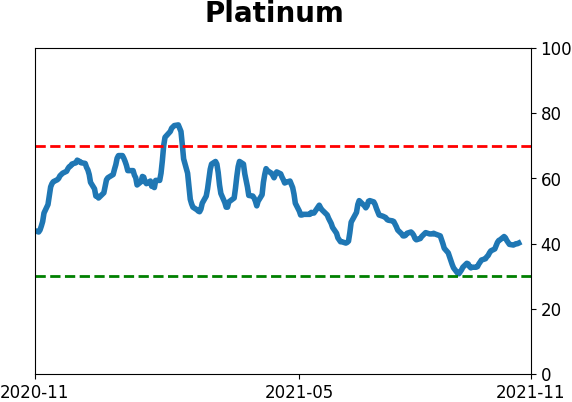
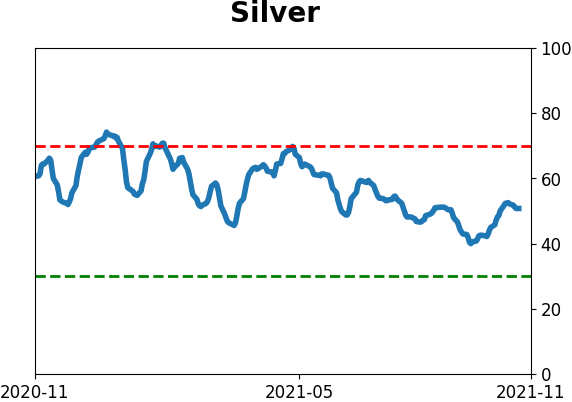
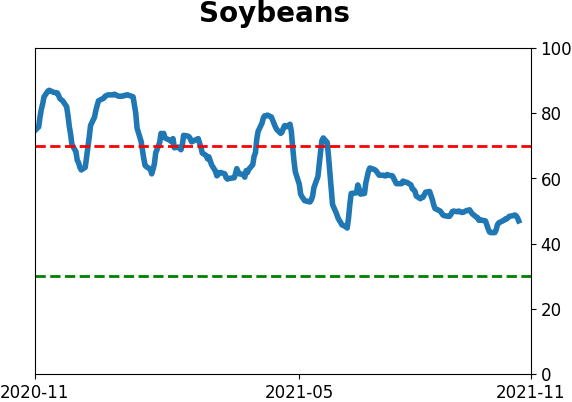
Optimism Index Thumbnails
|
|
|
|
|
|
|
|
|
|
|
|
|
|
|
|
|
|
|
|
|