Headlines
|
|
Health care stocks surge, with a caveat:
The post-election rally was especially good for health care stocks. More than 30% of them surged to a 52-week high, among the most in years. But relatively few have managed to climb above their 200-day averages, which has been a mild warning sign.
Can we make it a week straight?: With Thursday's follow-through, the Dow Industrials managed to log its 4th straight session with a 1% or greater gain. Going back to 1896, it's managed to string together 4 straight big up days only 19 other times. In recent decades, it led to some shorter-term weakness except for once, but the overall bias was positive over the medium-term.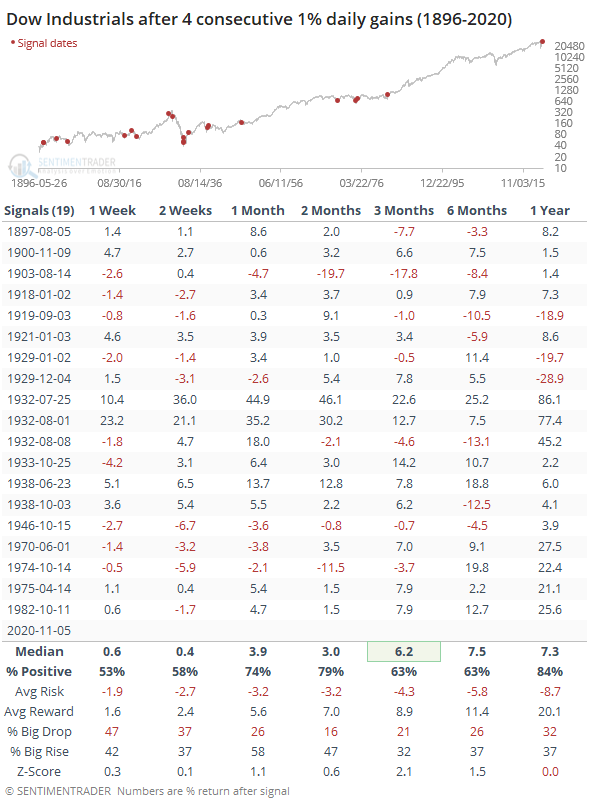 Many of these triggered in deep bear markets. When the Dow was within 5% of a 52-week high, there were only 5 precedents, all of which enjoyed higher prices over the next 1-2 months. Many of these triggered in deep bear markets. When the Dow was within 5% of a 52-week high, there were only 5 precedents, all of which enjoyed higher prices over the next 1-2 months.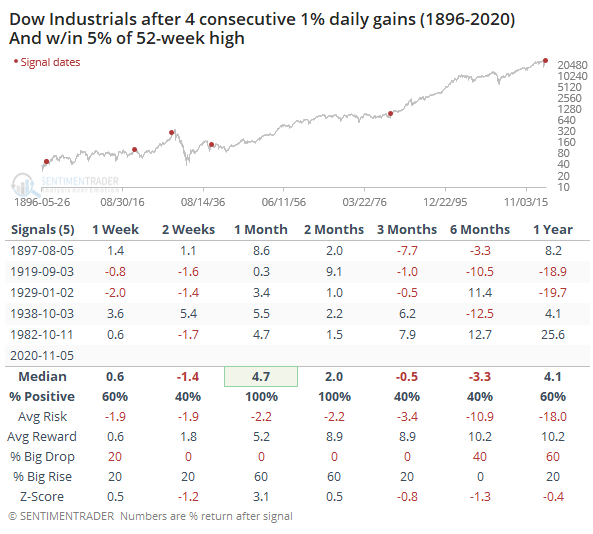
Bottom Line:
- A positive environment favors becoming aggressive on signs of excessive pessimism, of which there are few yet.
|
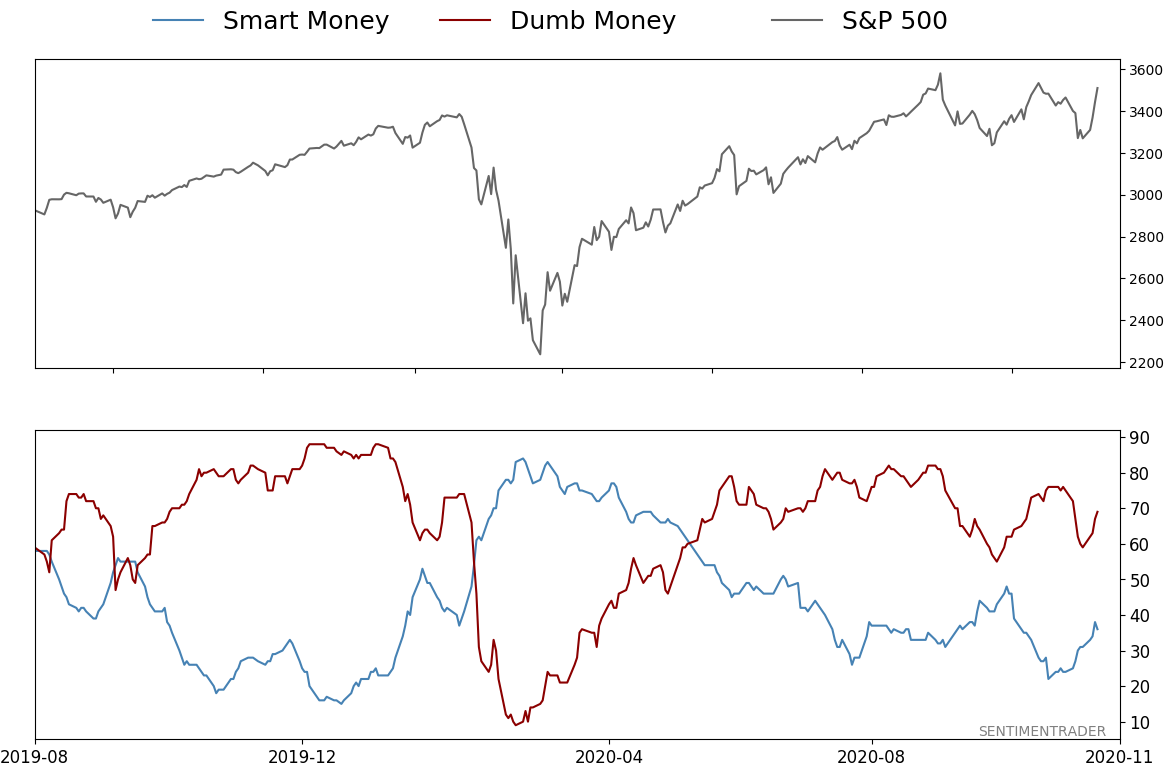
Smart / Dumb Money Confidence
|
Smart Money Confidence: 36%
Dumb Money Confidence: 69%
|
|
Risk Levels
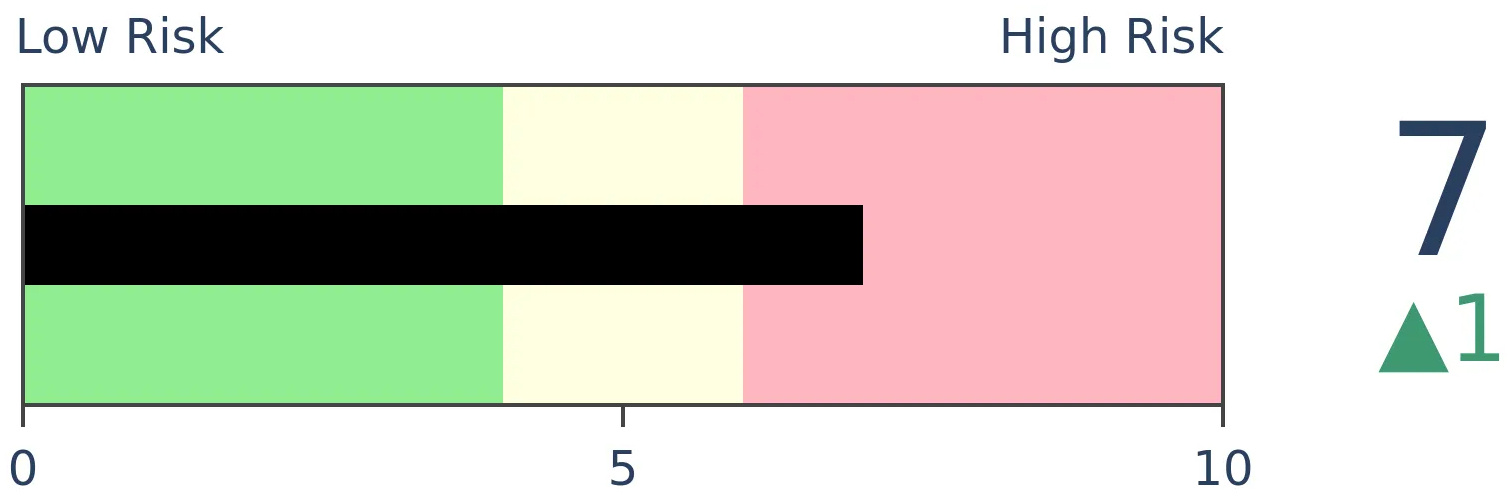
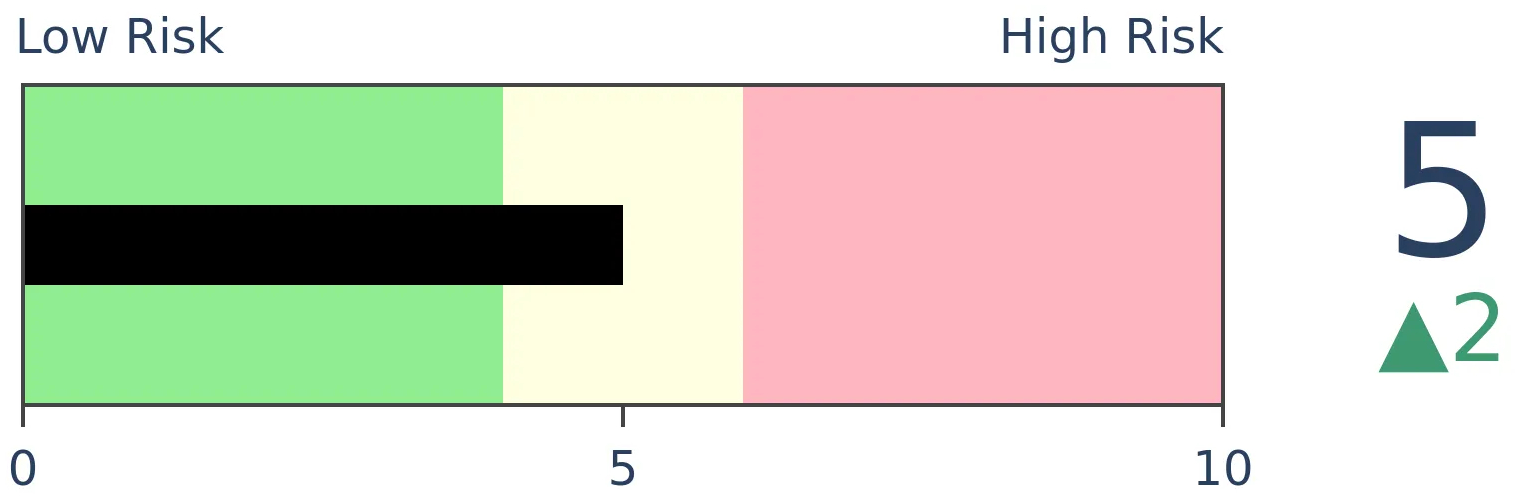
Stocks Short-Term
|
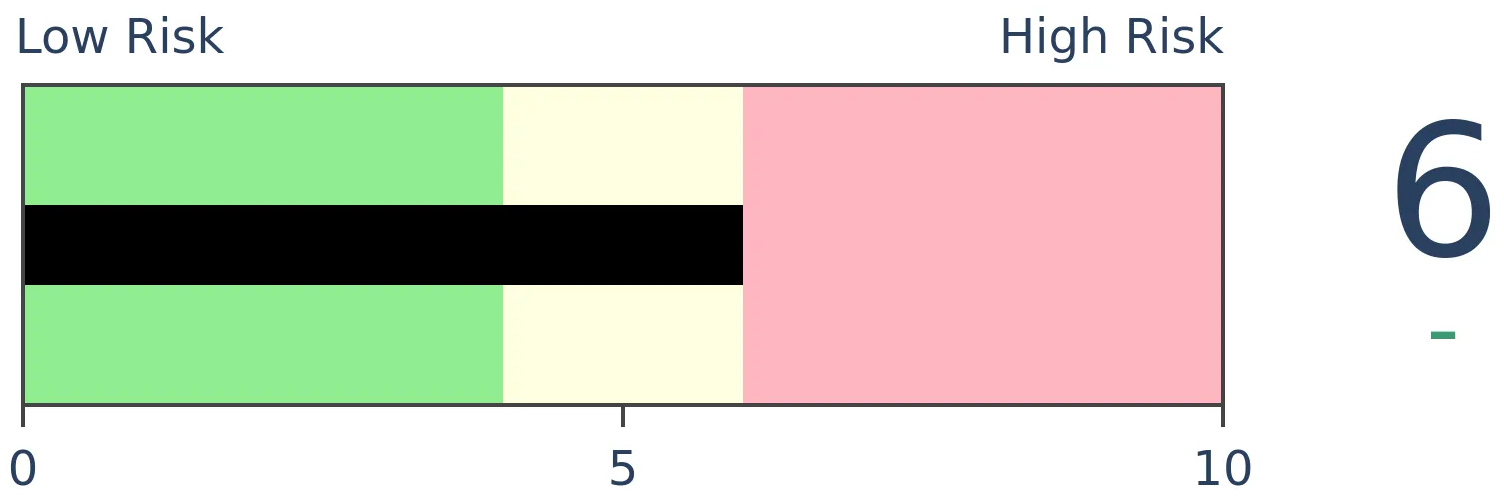
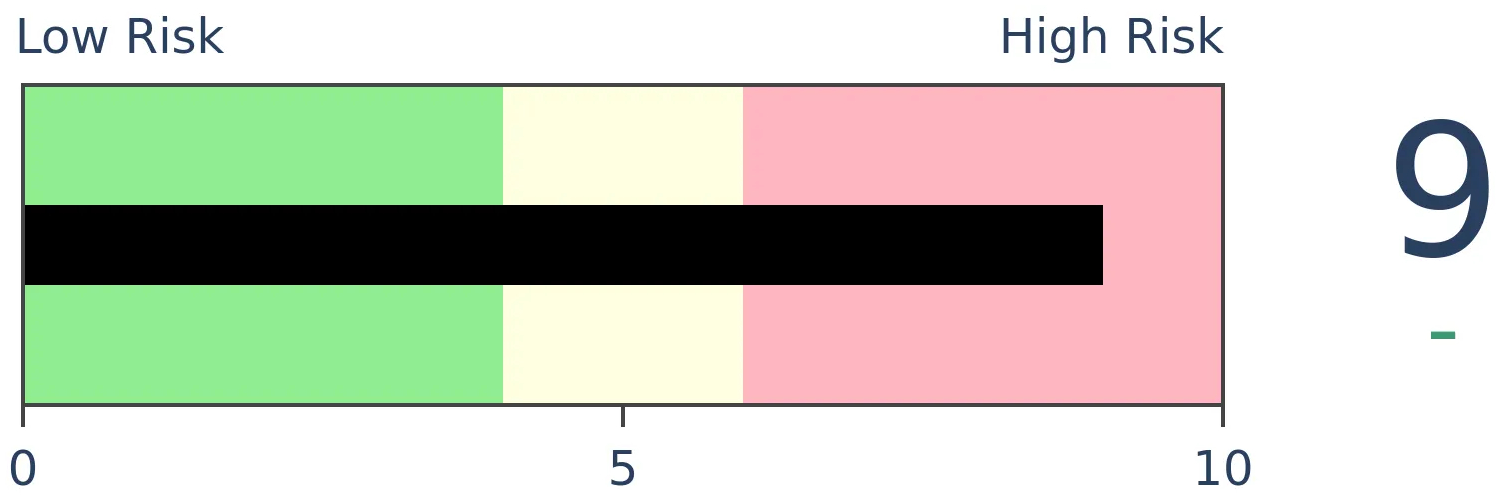
Stocks Medium-Term
|
|
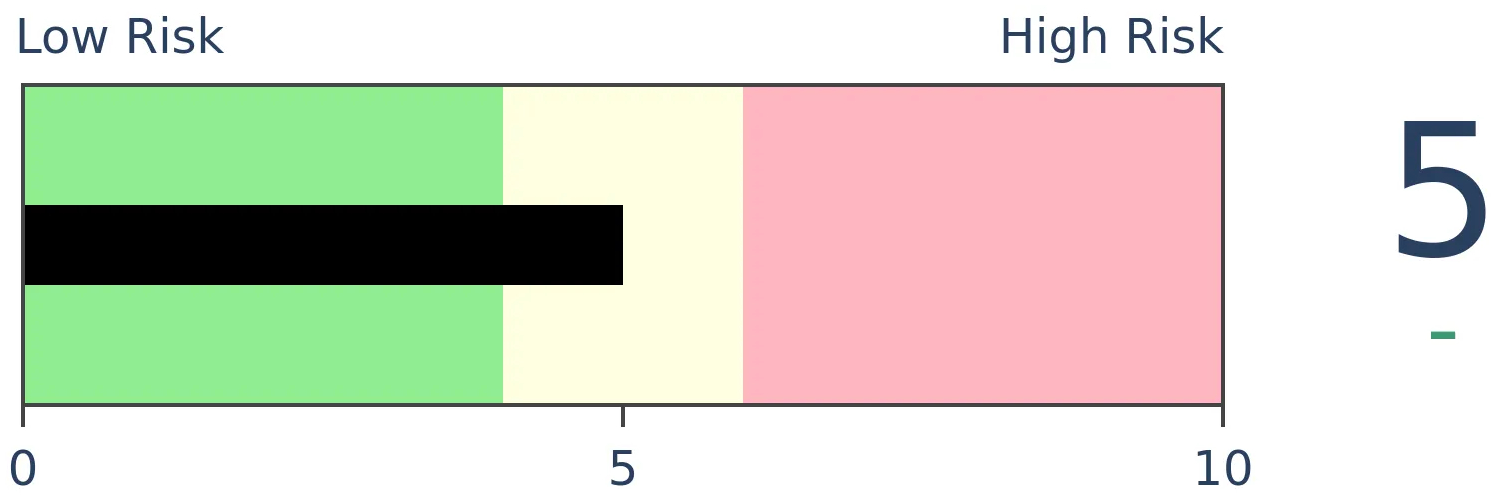
Bonds
|
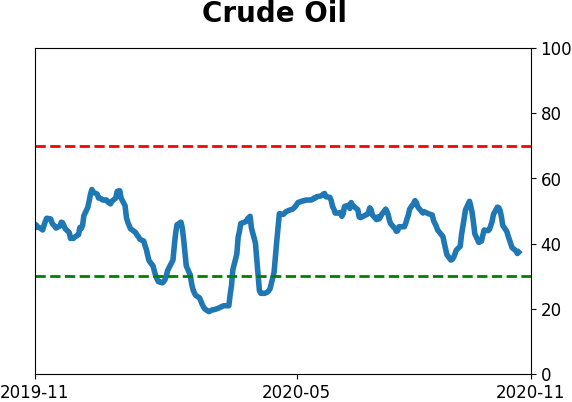
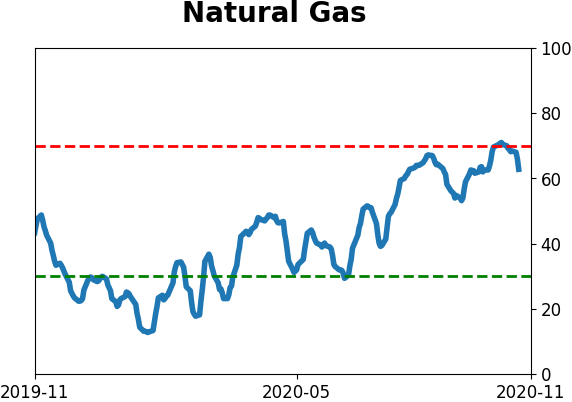
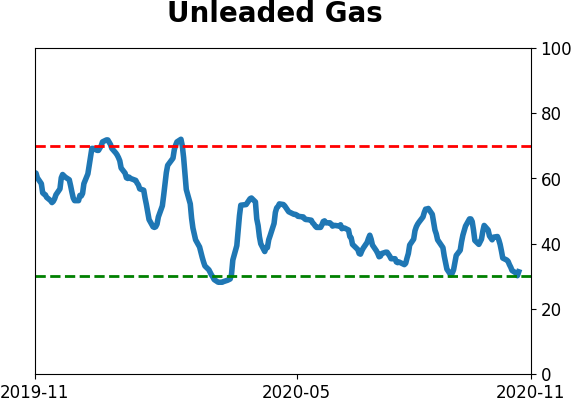
Crude Oil

|
|
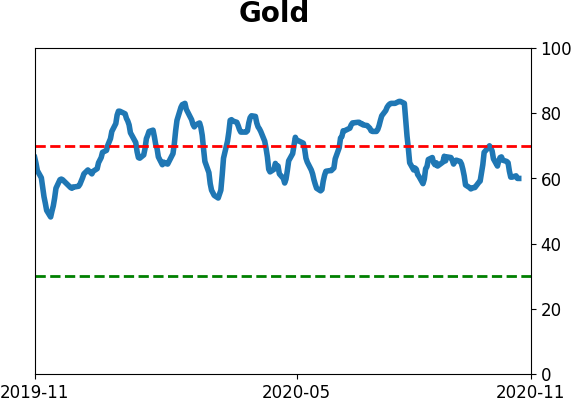
Gold
|
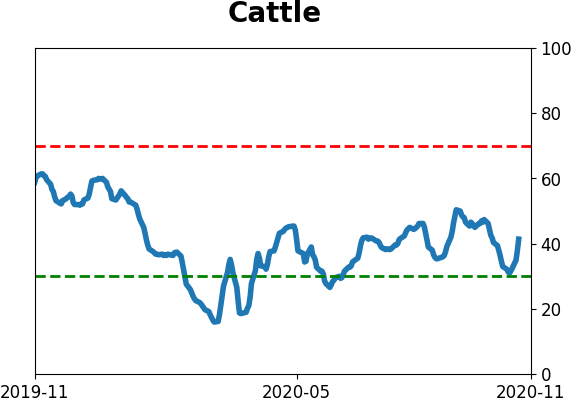
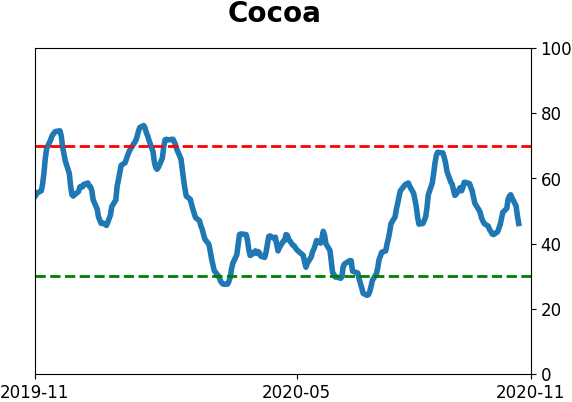
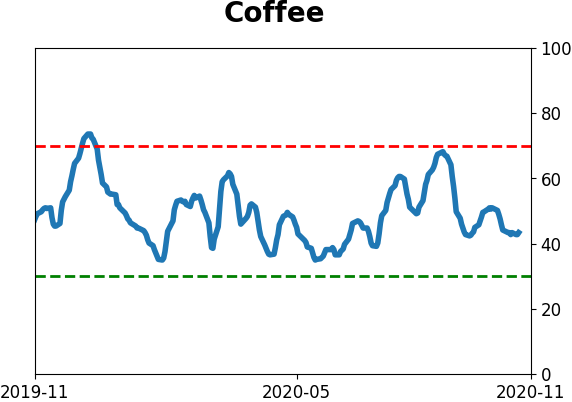
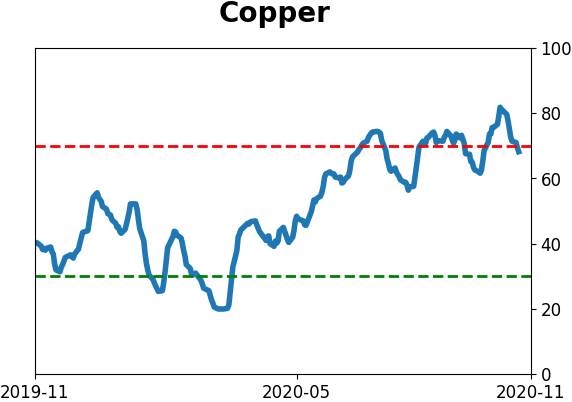
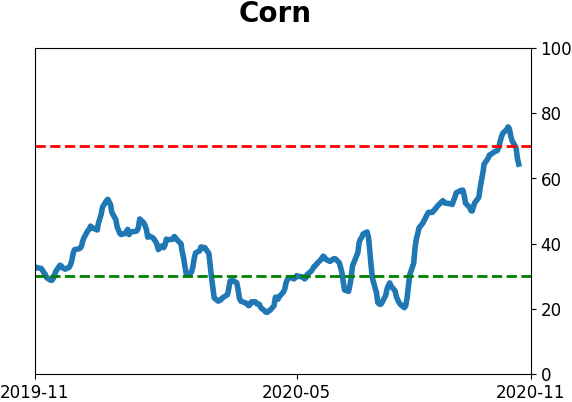
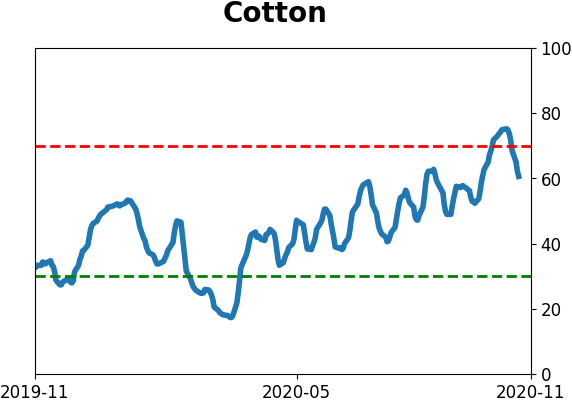
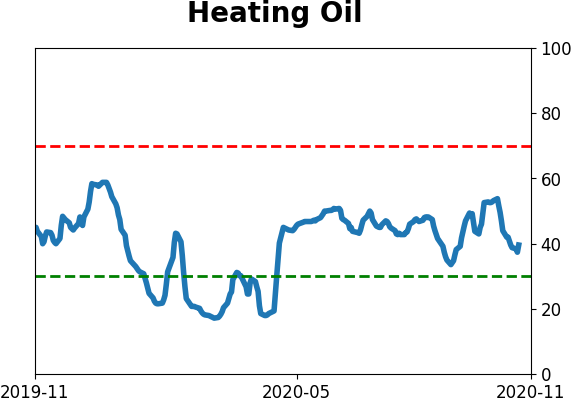
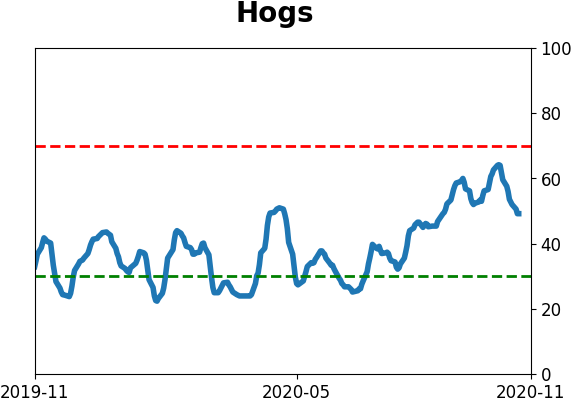
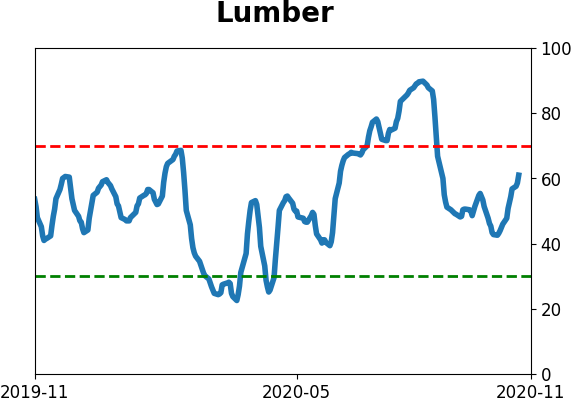
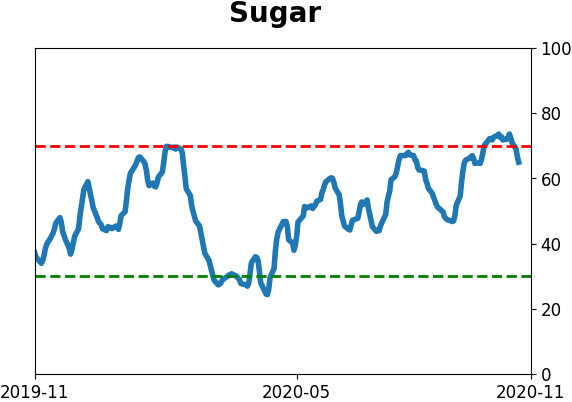
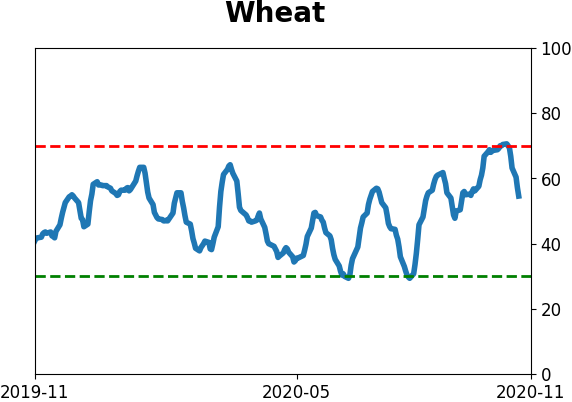
Agriculture
|
|
Research
BOTTOM LINE
The post-election rally was especially good for health care stocks. More than 30% of them surged to a 52-week high, among the most in years. But relatively few have managed to climb above their 200-day averages, which has been a mild warning sign.
FORECAST / TIMEFRAME
None
|
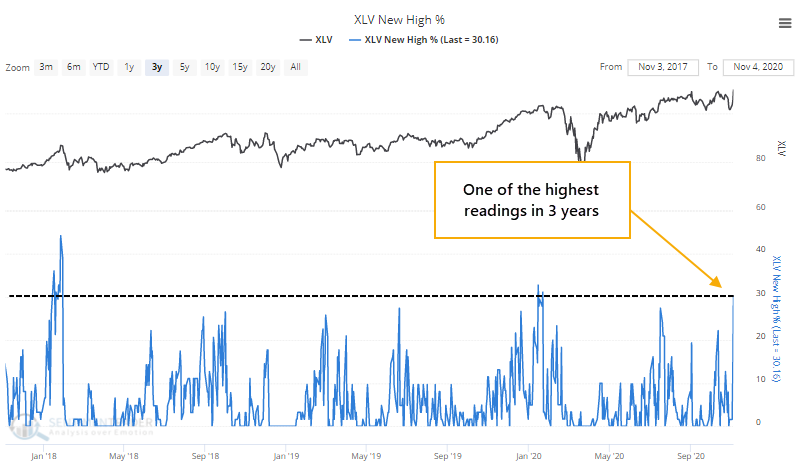
Health care stocks were some of the biggest beneficiaries of Wednesday's post-election relief rally. As a sector, they outperformed even highflying tech shares.
As a result, more than 30% of them broke out to fresh 52-week highs, among the biggest thrusts in years.
With some sectors, a surge in new highs tends to be a good sign of positive momentum, with consistently positive forward returns. Those tend to be higher-beta sectors. In more defensive sectors, we typically see weaker returns in the shorter-term after big thrusts.
That was modestly the case for health care.
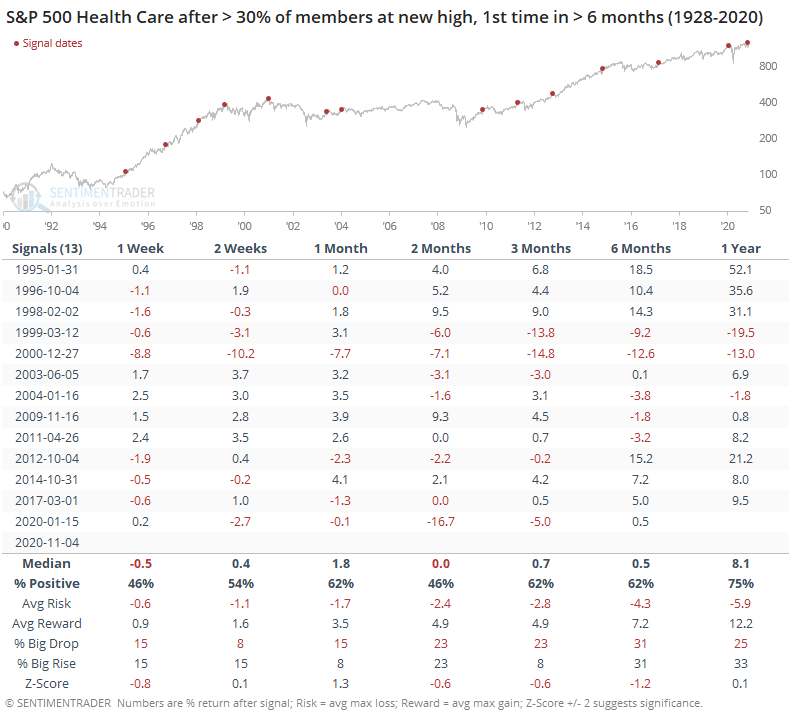
Over the next 2 months, the S&P 500 Health Care index showed a further gain less than half the time, with a flat average return and uninspiring risk/reward ratio. It wasn't that it was a good sell signal, but it wasn't the kind of action that usually sucked in more buyers at higher prices.
One of the relatively odd aspects of the surge in new highs is that there wasn't a concurrent surge in the percentage of them that also moved above their 200-day moving averages. Even after Wednesday's jump, fewer than 80% of them were in long-term uptrends.
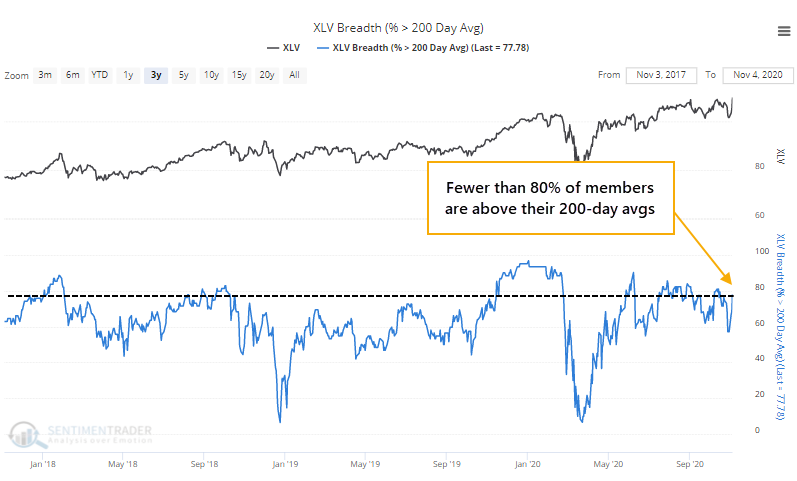
Below, we can see that the sector tended to struggle when there was a jump in new highs, but with relatively few member stocks trading above their averages. These are times when investors in the sector focused on the strongest stocks, instead of showing more widespread buying interest.
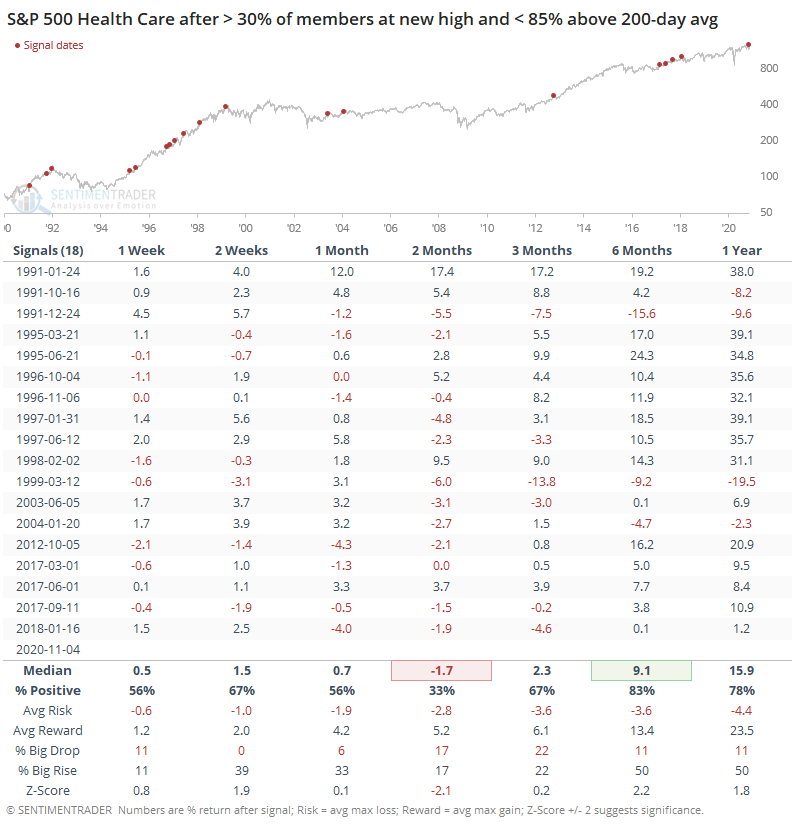
After these signals, Health Care was higher only 33% of the time over the next 2 months, with a poor average return. The weakness was mostly focused on that time frame, however, and by 6 months later there were only 3 losses.
If we contrast this with times when there was wider participation, then there was a stark difference in forward returns.
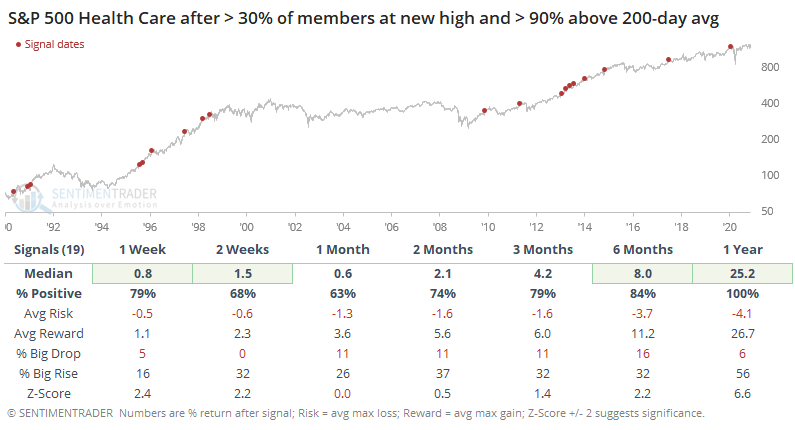
When more than 90% of stocks were above their 200-day averages, then returns across all time frames were above average, the sector was consistently positive, the risk/reward was better, and there was a better chance for a big rise versus big fall over the medium-term.
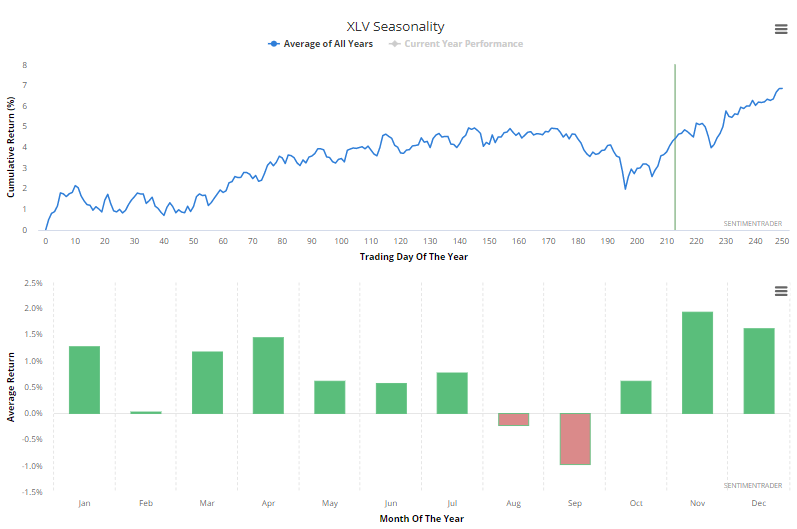
On the positive side, the sector - like most others - is entering what has traditionally been a positive seasonal window. The XLV fund's best average return has come during November.
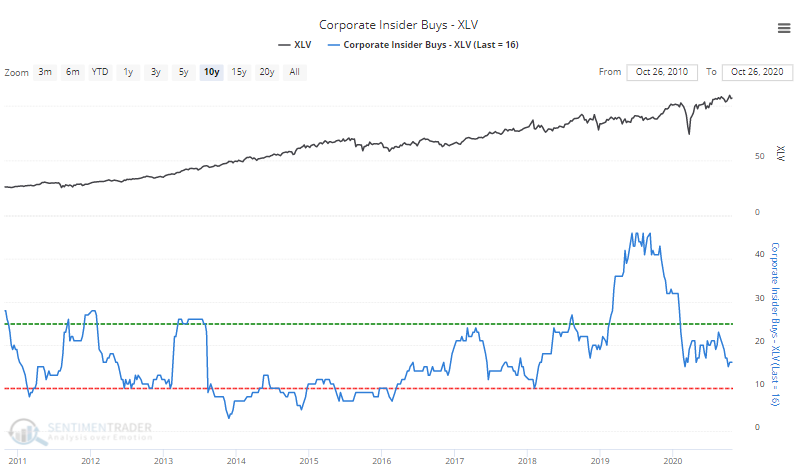
Corporate insiders in these firms have pulled back on their buying interest, following a record surge during 2019. It's now about the lowest in more than 2 years, but not to a level that might suggest undue concern.
Overall, it's kind of a muddled picture. There isn't anything strong enough here to suggest a major adjustment. The biggest takeaway (and concern) is that quick surges in defensive sectors have a poor record at preceding strong gains over the ensuing weeks-to-months. And the fact that relatively few of the stocks have climbed above their 200-day averages is showing that investors are embracing the sector as a whole less than they usually do when there is a spike in new highs. It's a mild suggestion that chasing the rally is more fraught with risk than usual.
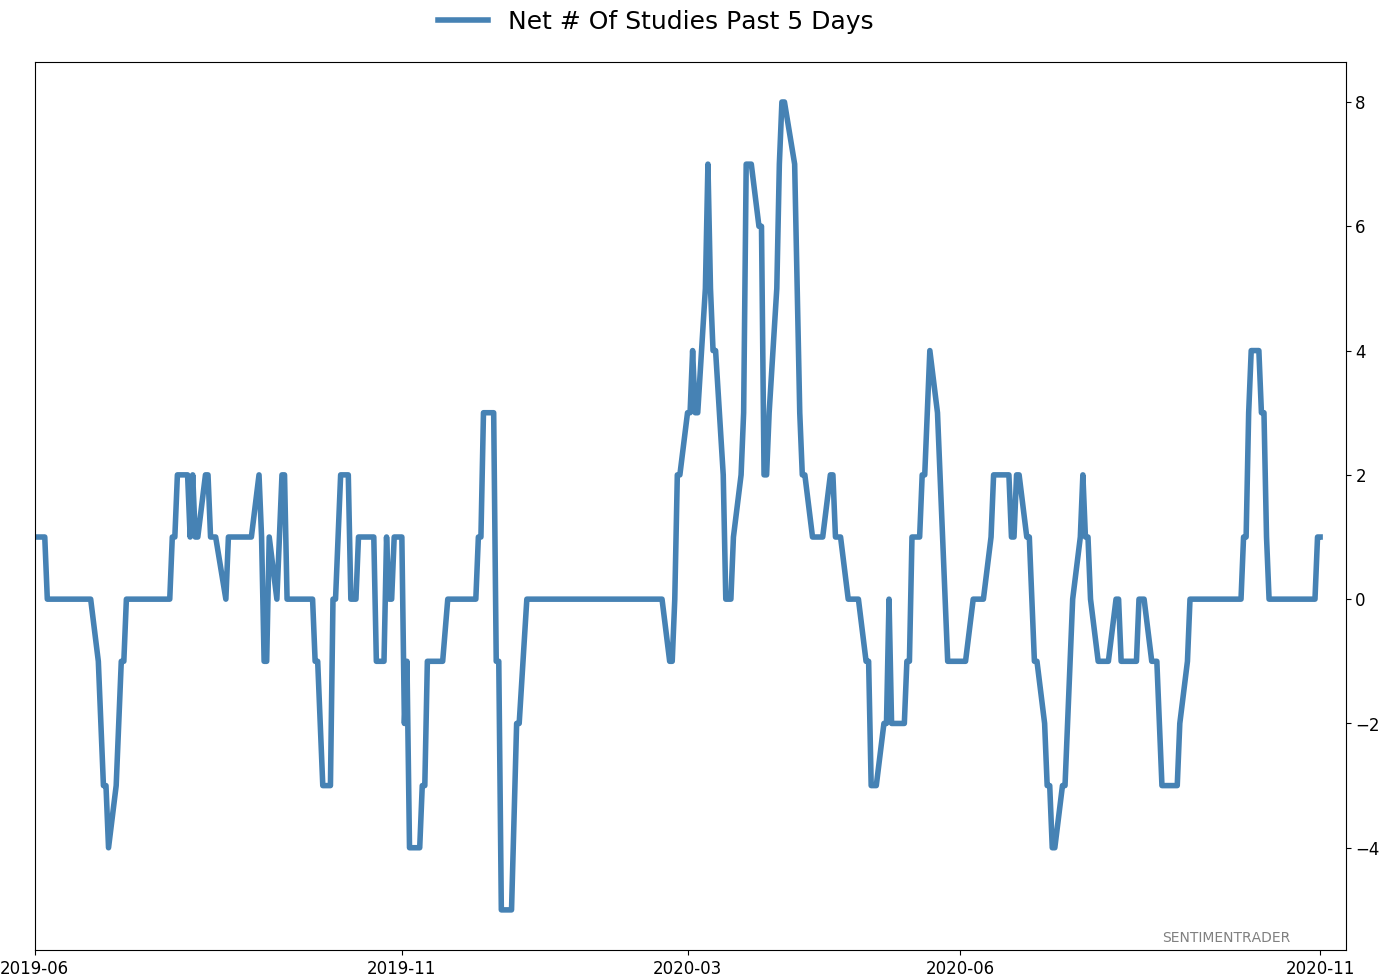
Active Studies
| Time Frame | Bullish | Bearish | | Short-Term | 0 | 0 | | Medium-Term | 5 | 8 | | Long-Term | 48 | 2 |
|
Indicators at Extremes
Portfolio
| Position | Description | Weight % | Added / Reduced | Date | | Stocks | 15.6% RSP, 10.1% VWO, 7.5% XLE, 5.1% PSCE | 38.2 | Added 5% | 2020-10-15 | | Bonds | 10% BND, 10% SCHP, 10% ANGL | 29.7 | Reduced 0.1% | 2020-10-02 | | Commodities | GCC | 2.4 | Reduced 2.1%
| 2020-09-04 | | Precious Metals | GDX | 4.7 | Added 5% | 2020-09-09 | | Special Situations | | 0.0 | Reduced 5% | 2020-10-02 | | Cash | | 25.0 | | |
|
Updates (Changes made today are underlined)
After the September swoon wrung some of the worst of the speculation out of stocks, there are some signs that it's returning, especially in the options market. It's helped to push Dumb Money Confidence above 70%. A big difference between now and August is that in August, there was a multitude of days with exceptionally odd breadth readings. Some of the biggest stocks were masking underlying weakness. Combined with heavy speculative activity, it was a dangerous setup. Now, we've seen very strong internal strength, in the broad market, as well as tech and small-cap stocks. Prior signals almost invariably led to higher prices. That's hard to square with the idea that forward returns tend to be subdued when Confidence is high, but that's less reliable during healthy market conditions, which we're seeing now (for the most part). I added some risk with small-cap energy stocks, due to an increasing number of positive signs in both small-caps and energy. This is intended as a long-term position.
RETURN YTD: 0.1% 2019: 12.6%, 2018: 0.6%, 2017: 3.8%, 2016: 17.1%, 2015: 9.2%, 2014: 14.5%, 2013: 2.2%, 2012: 10.8%, 2011: 16.5%, 2010: 15.3%, 2009: 23.9%, 2008: 16.2%, 2007: 7.8%
|
|
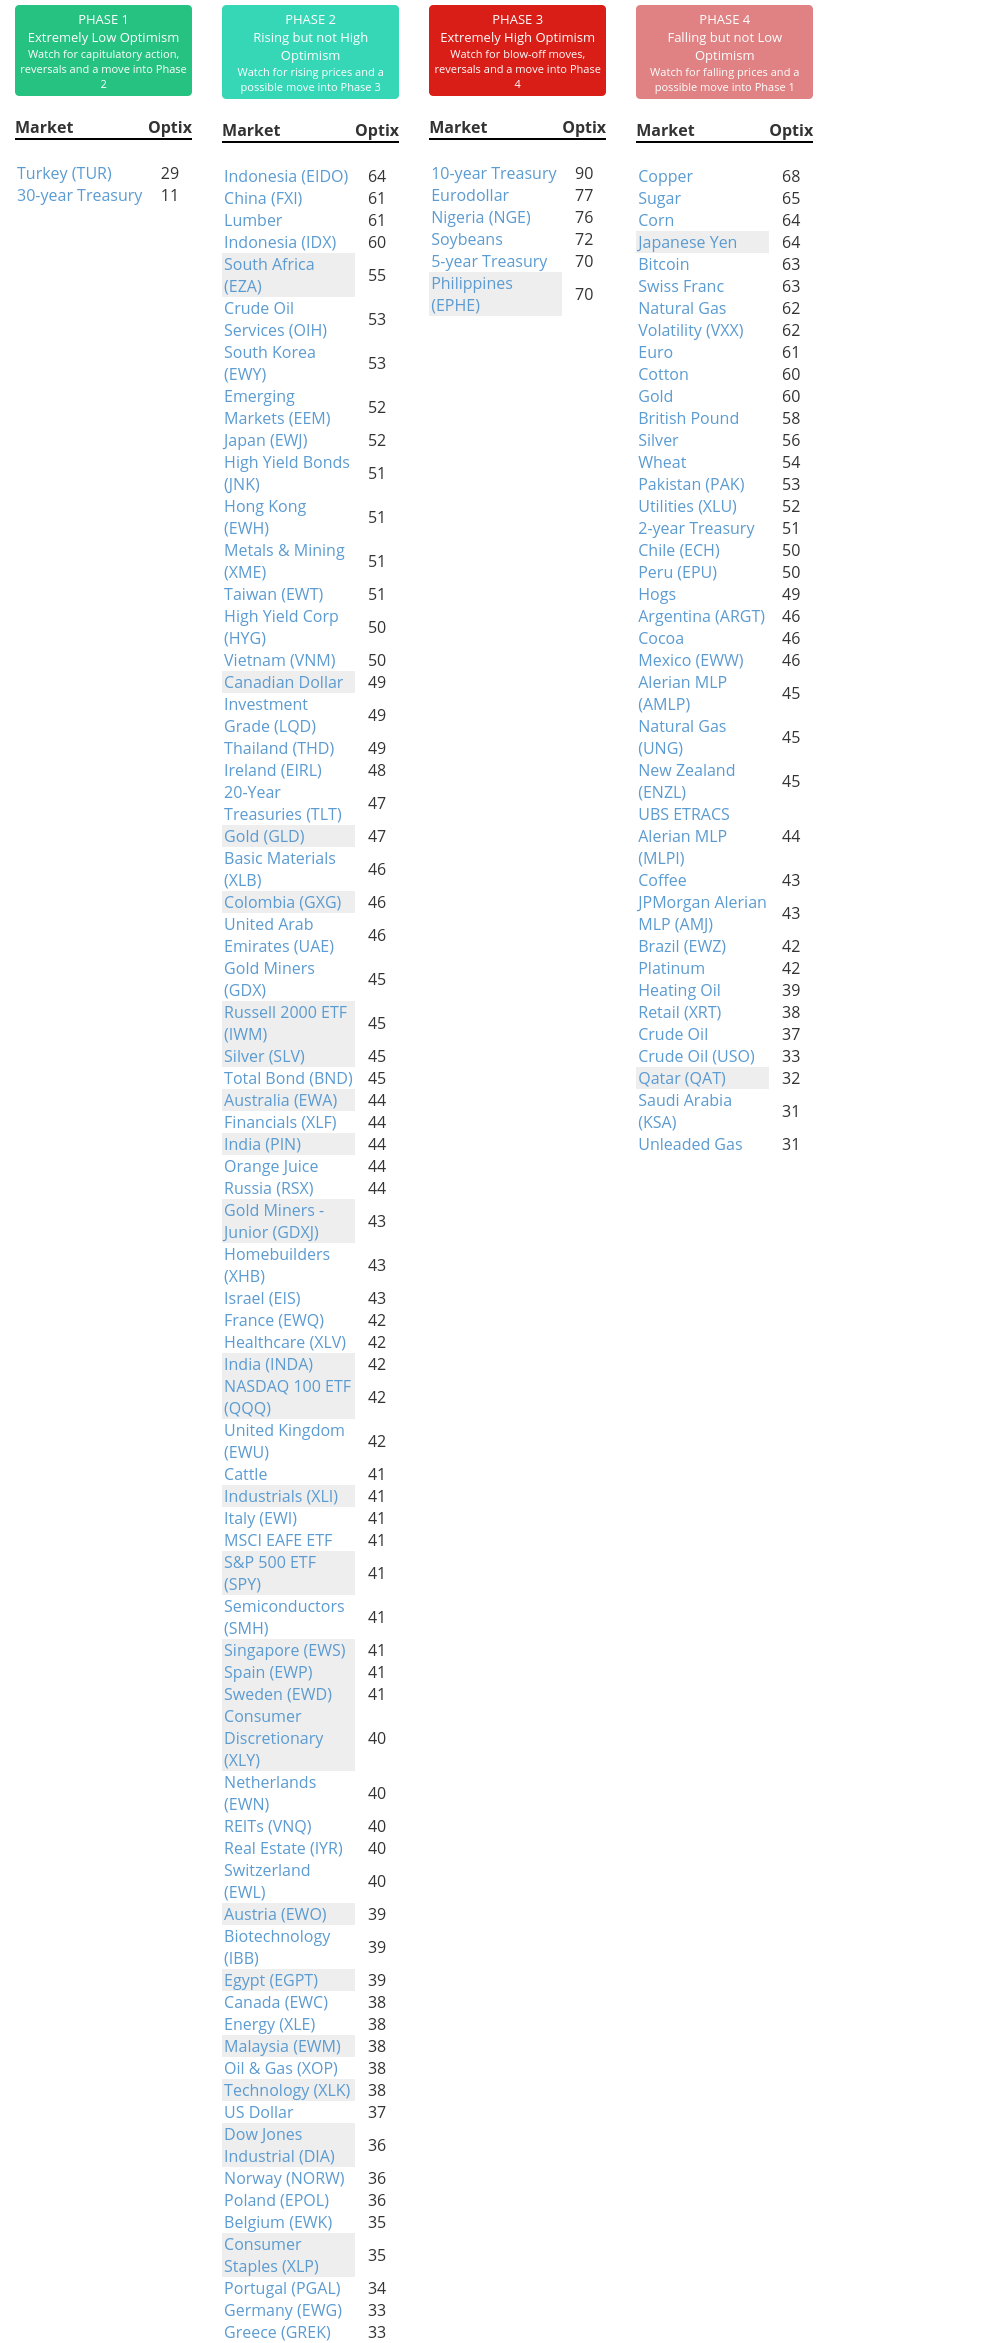
Phase Table
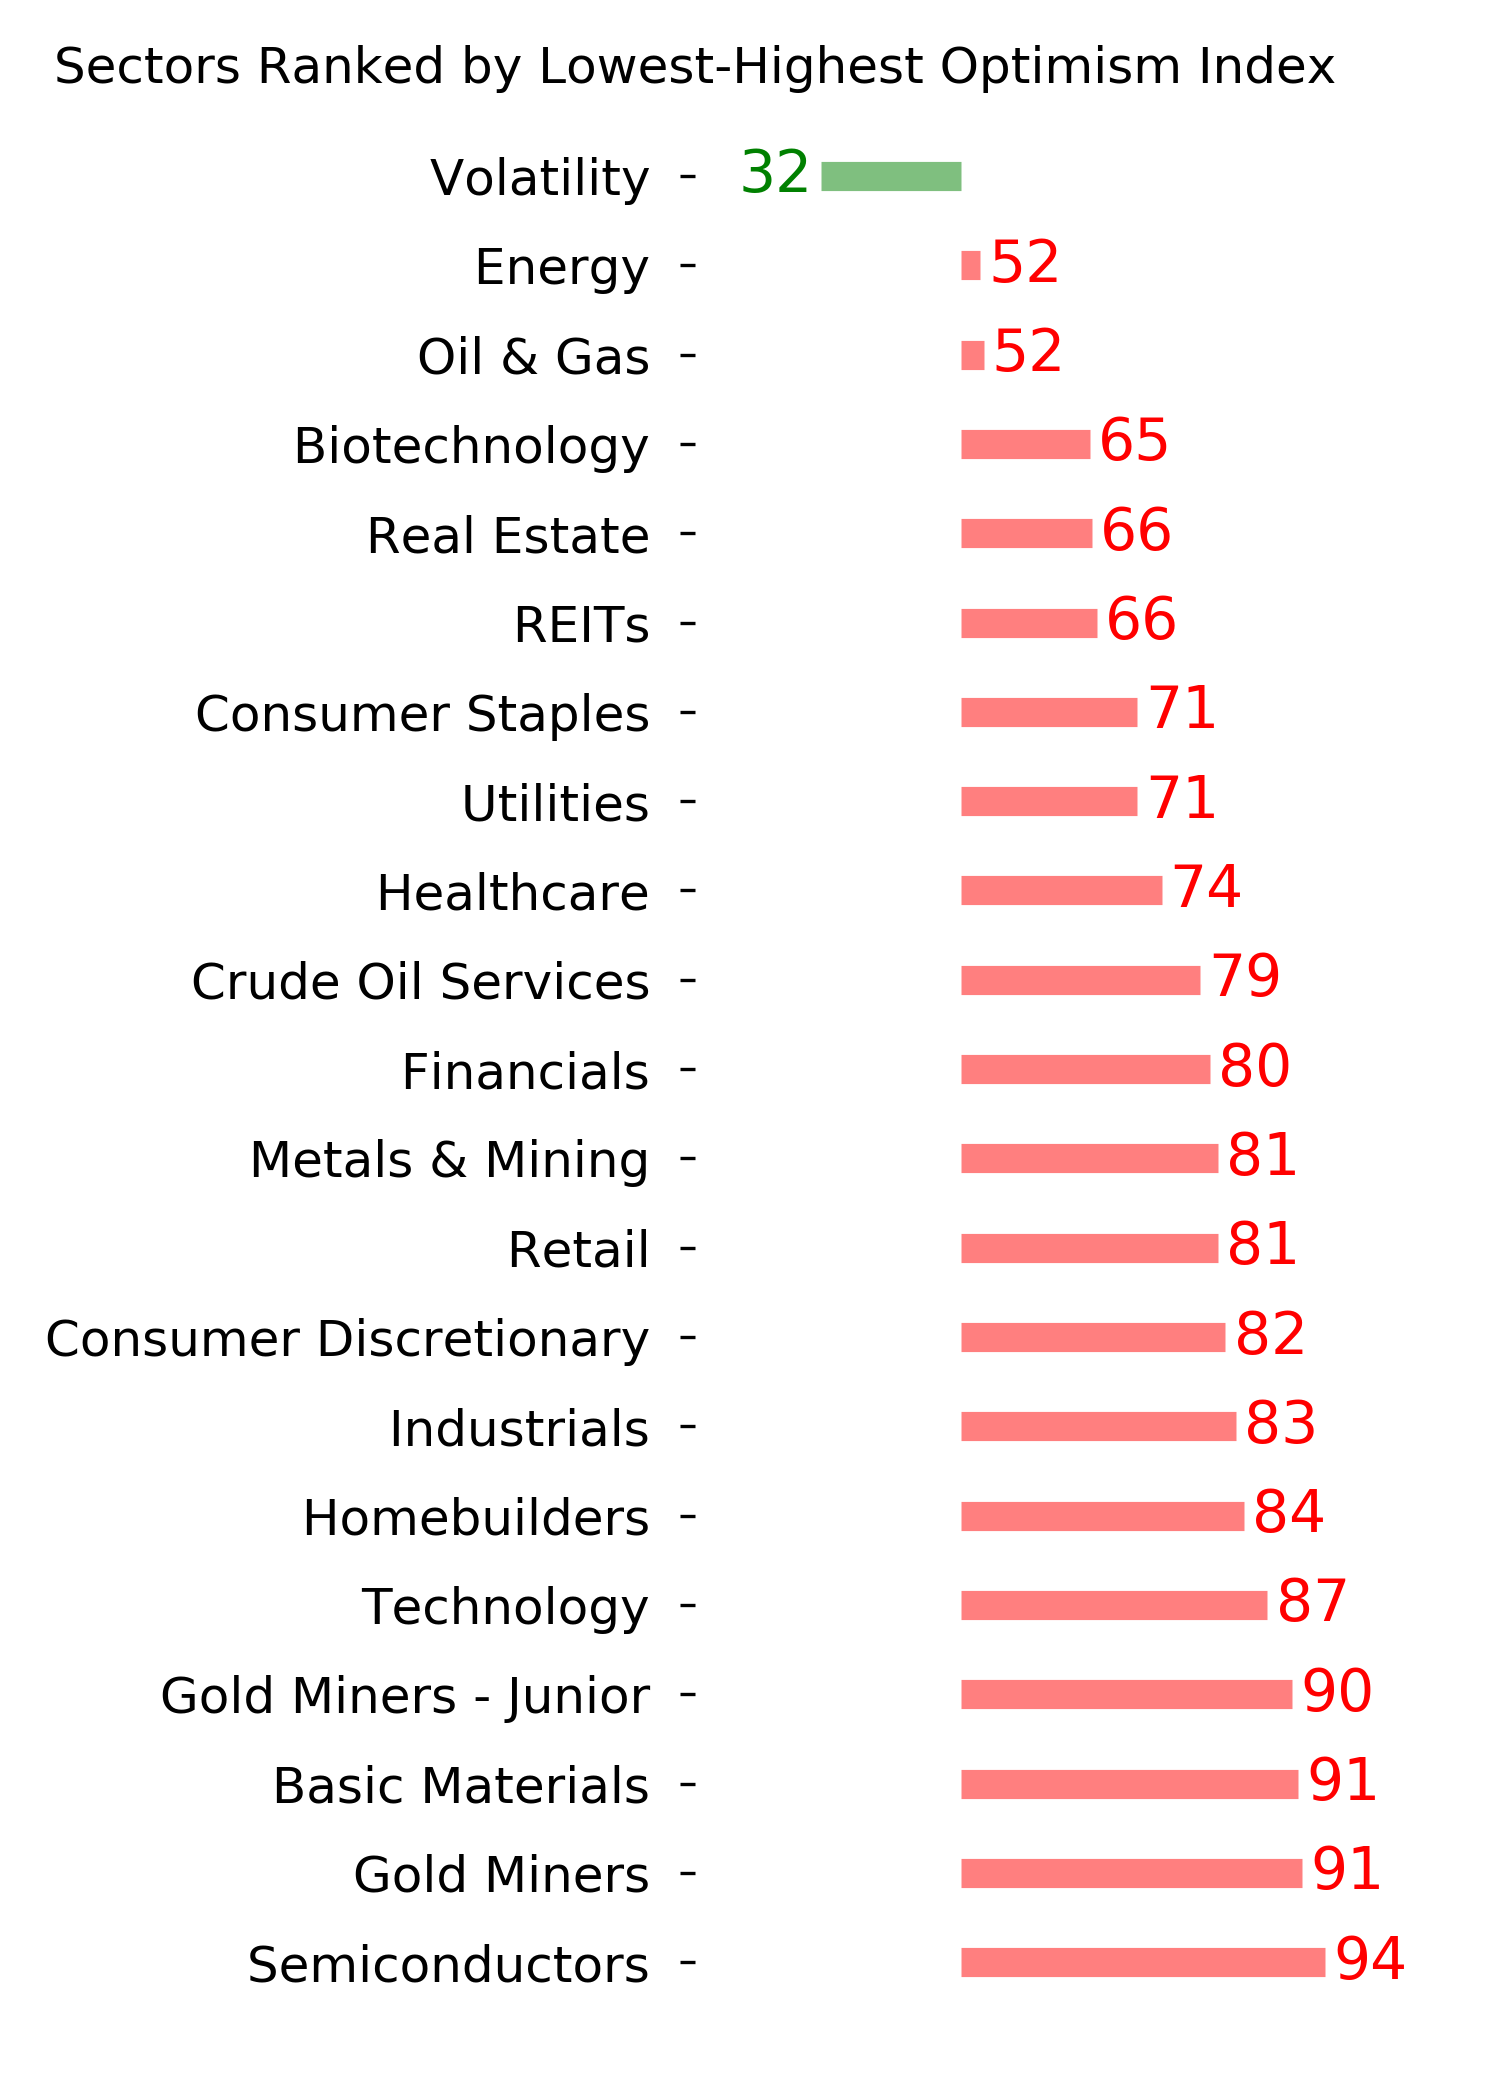
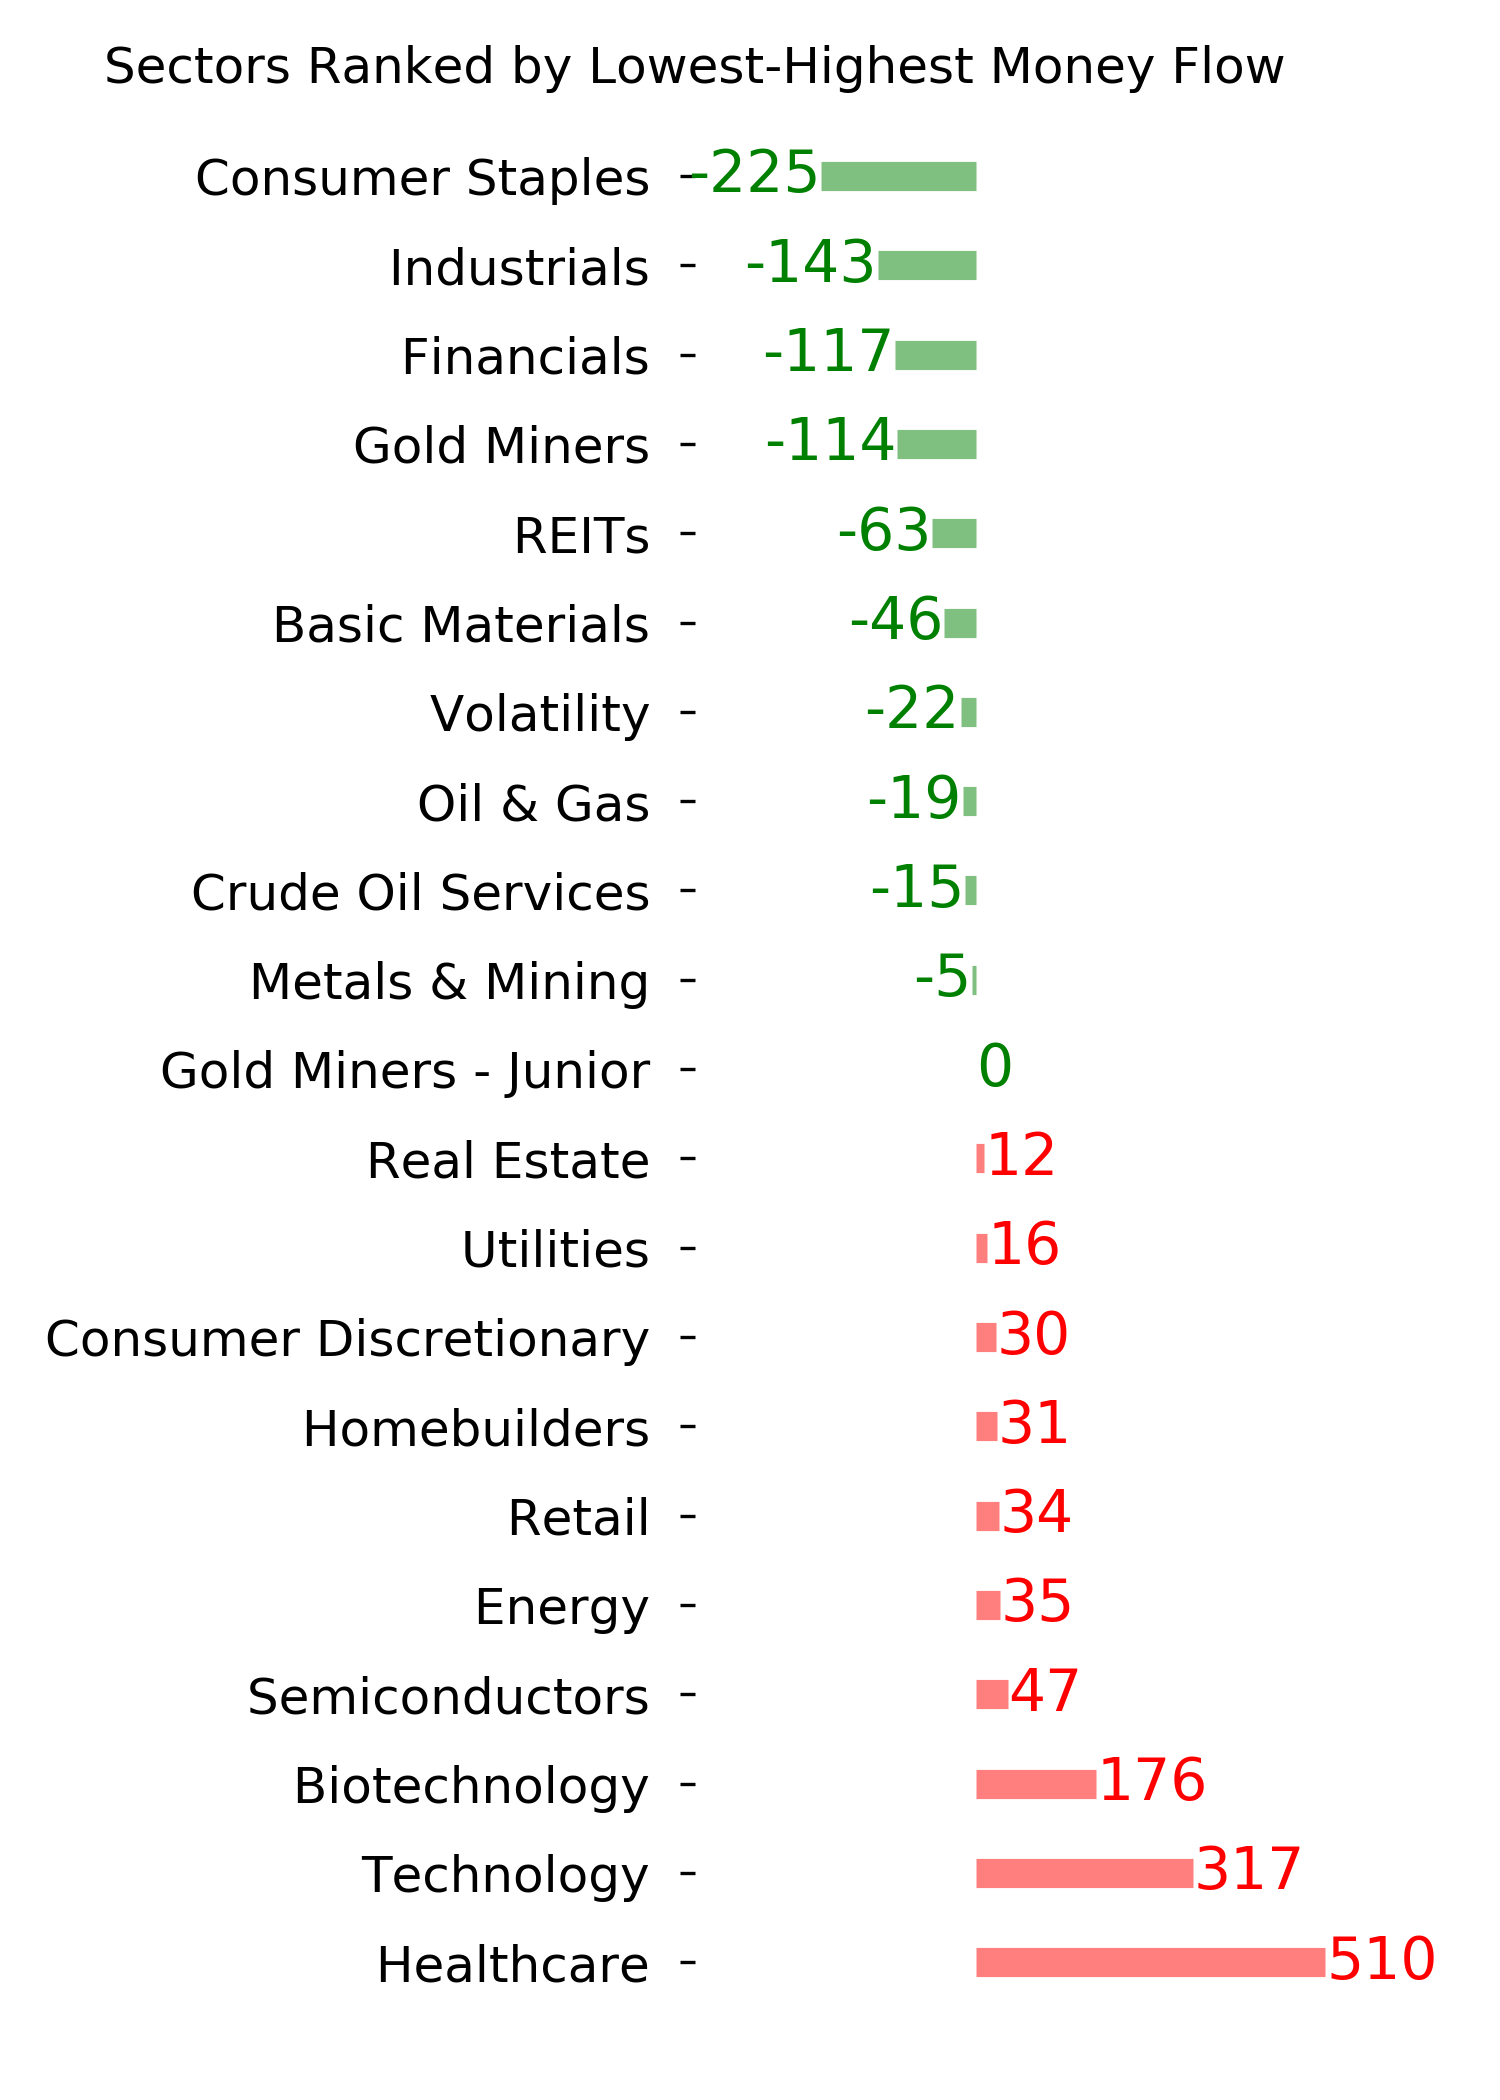
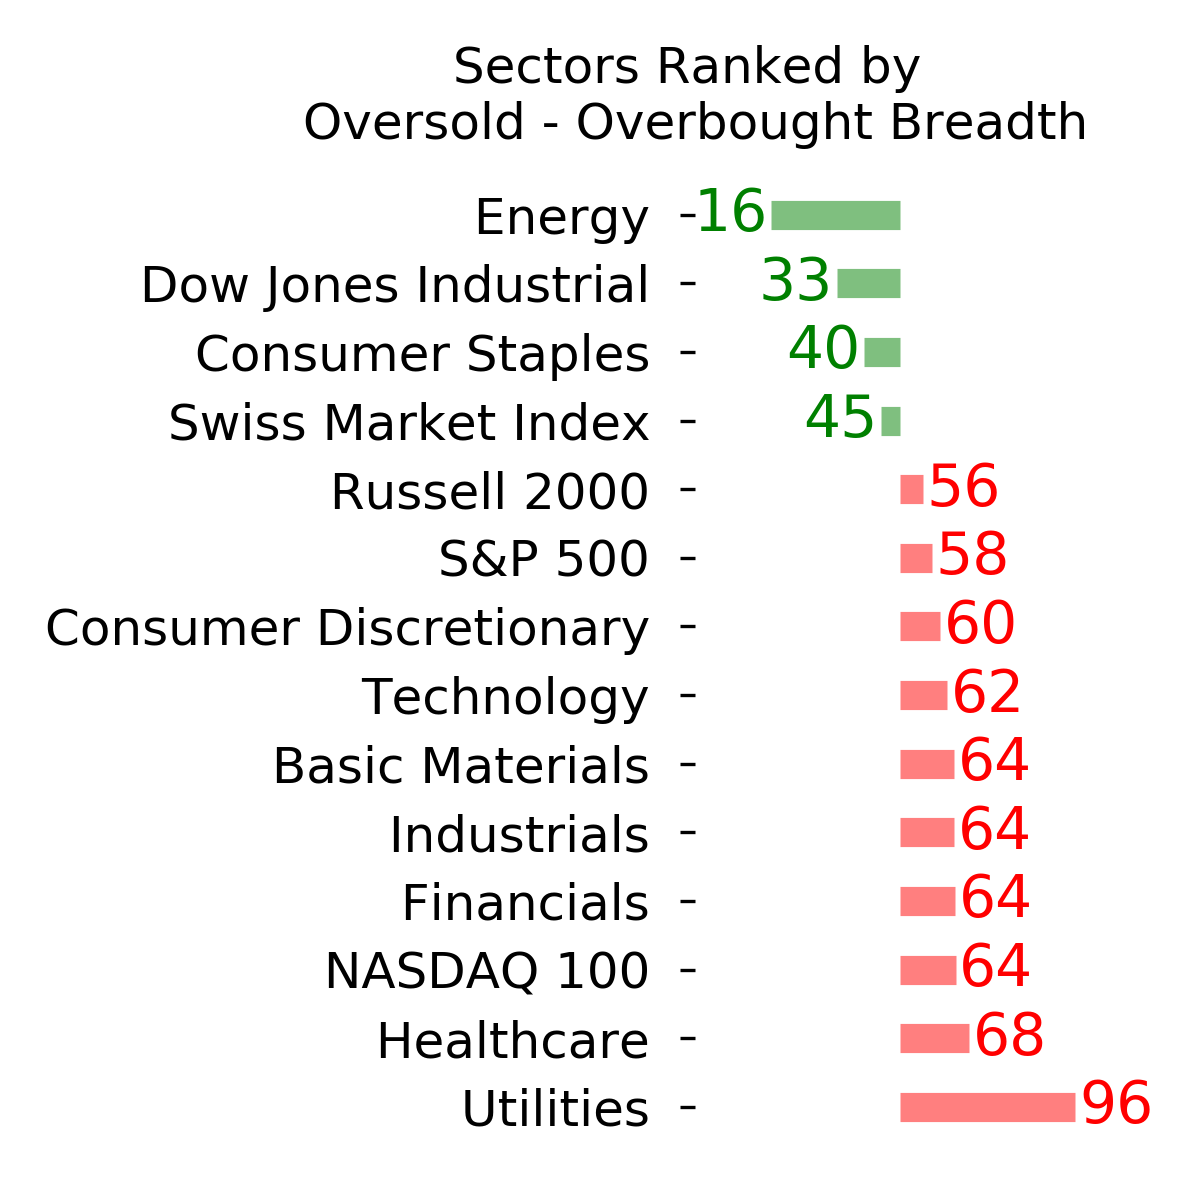
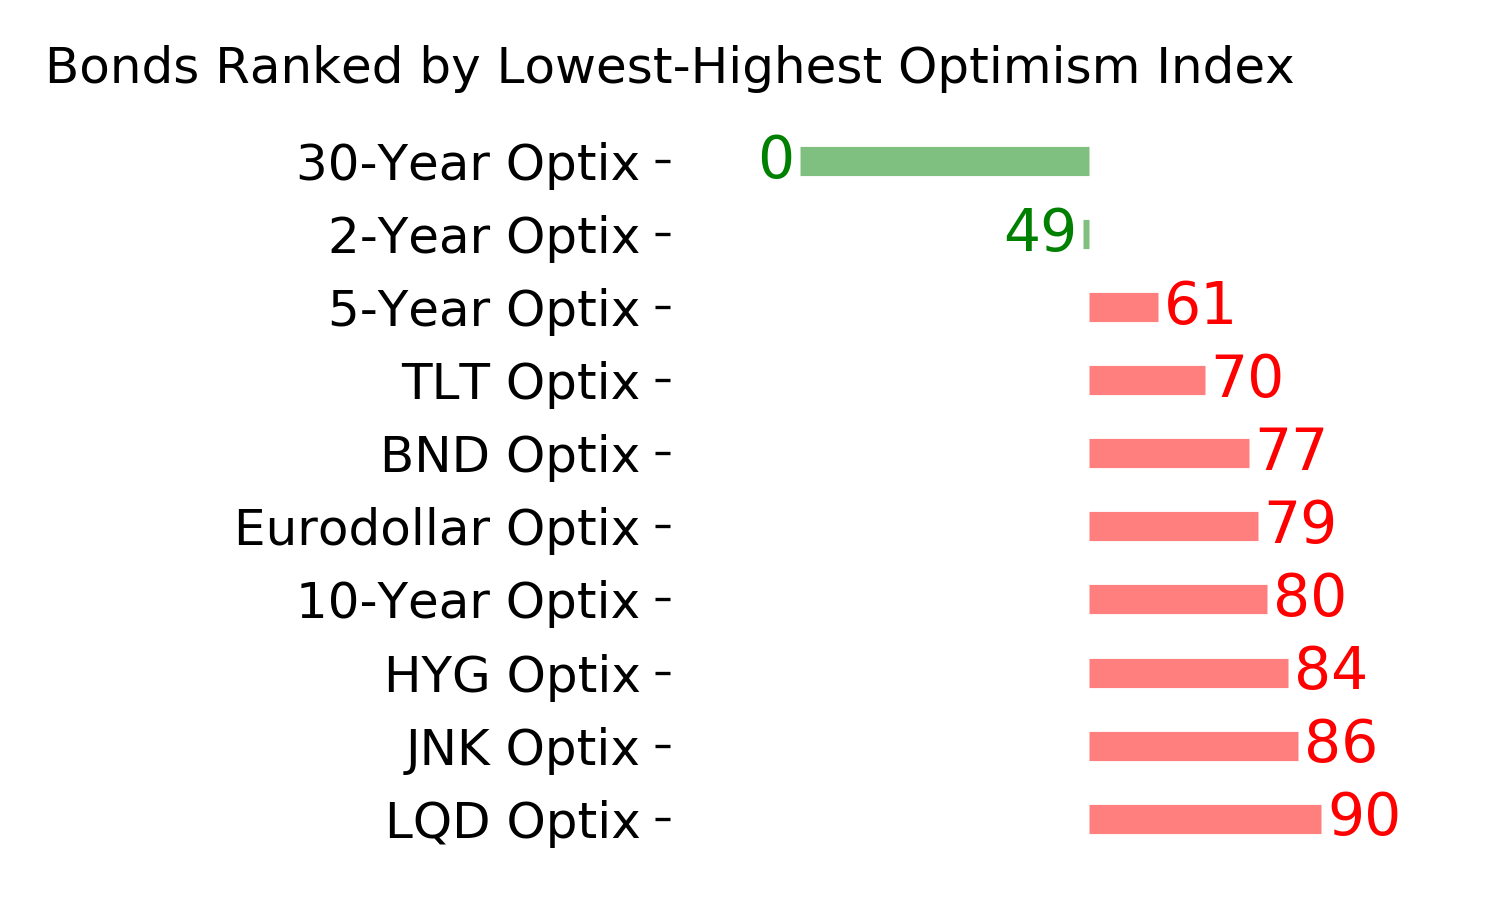
Ranks
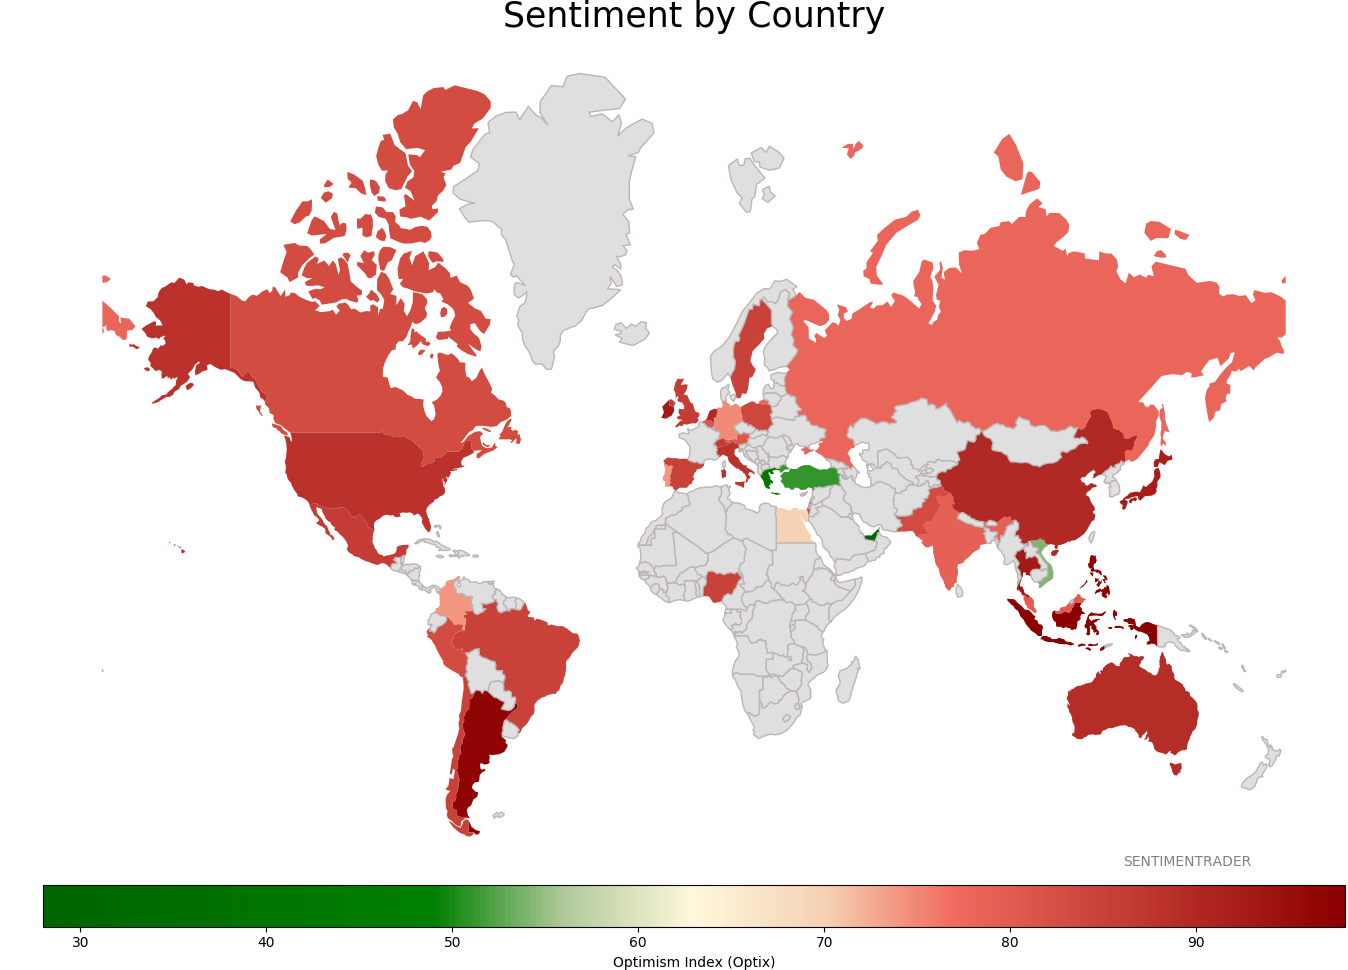
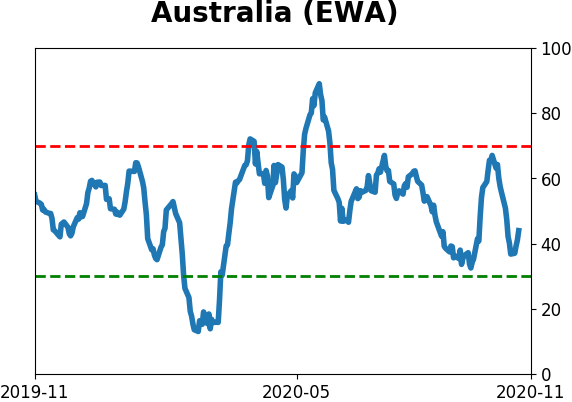
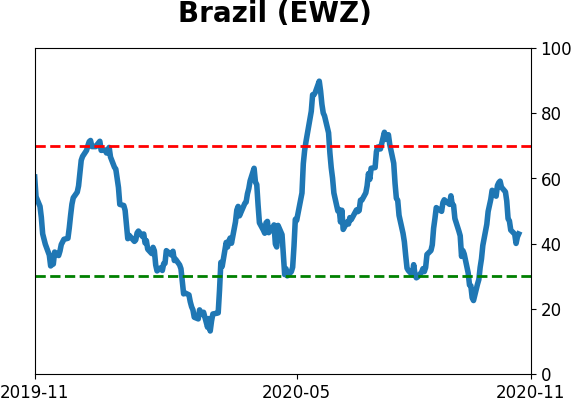
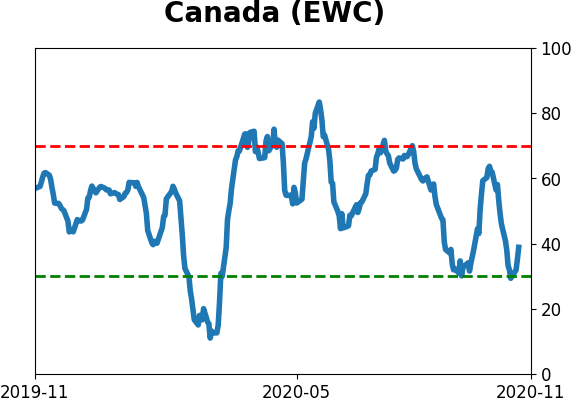
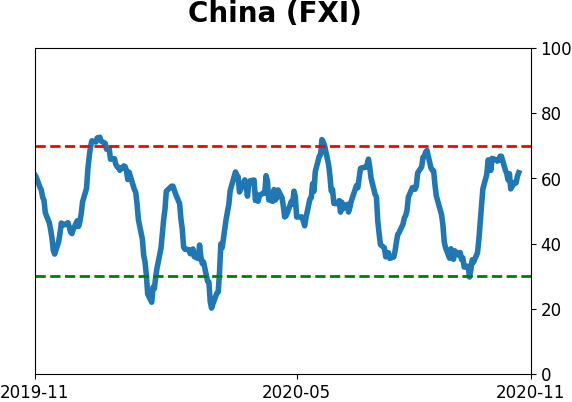
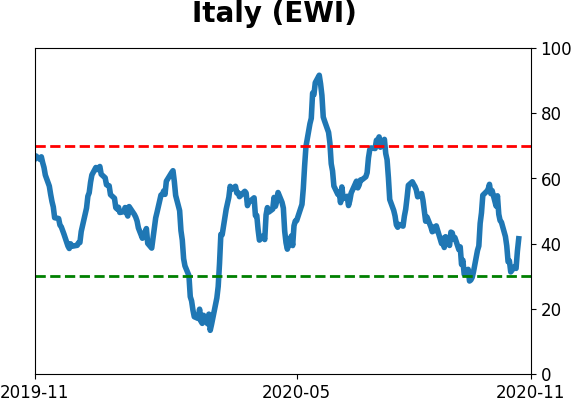
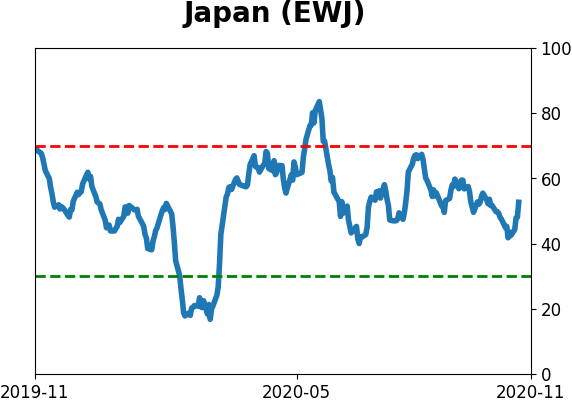
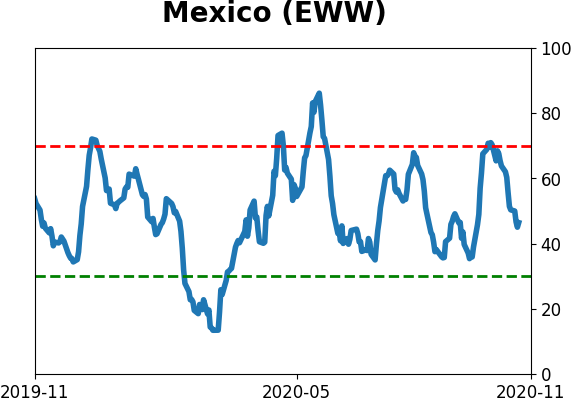
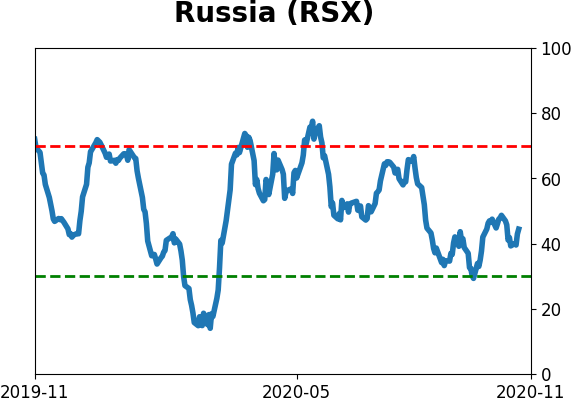
Sentiment Around The World
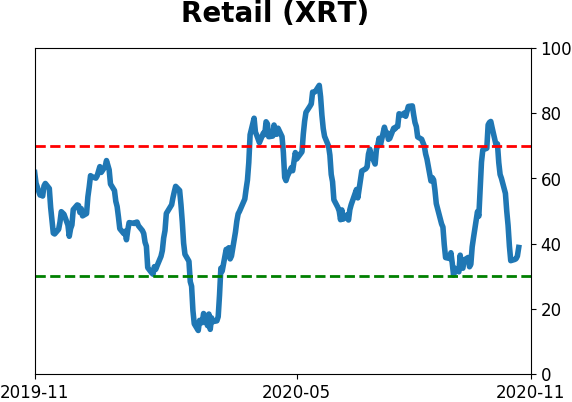
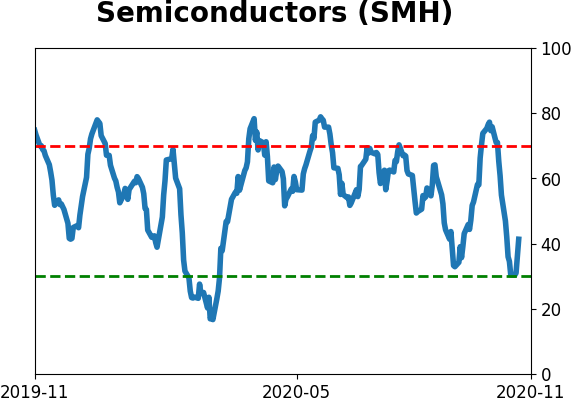
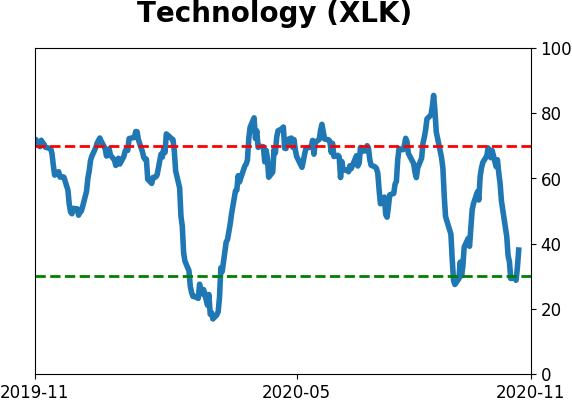
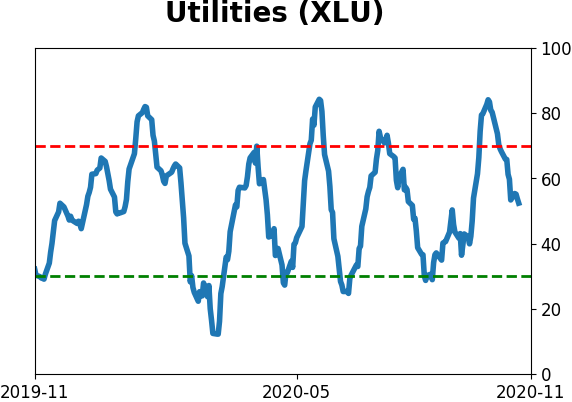
Optimism Index Thumbnails
|
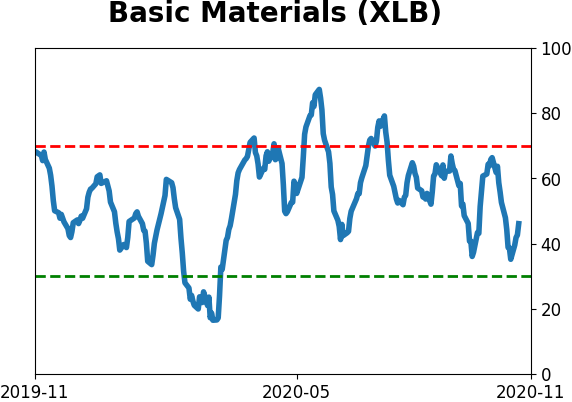
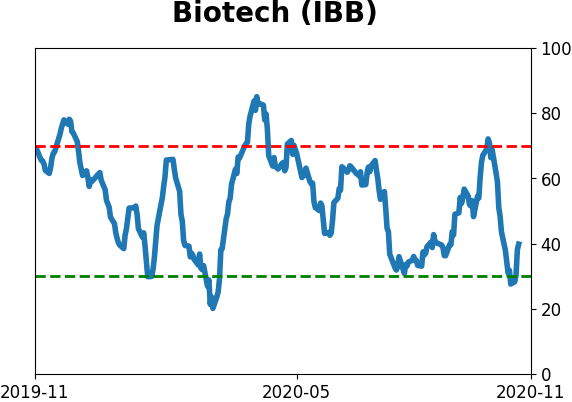
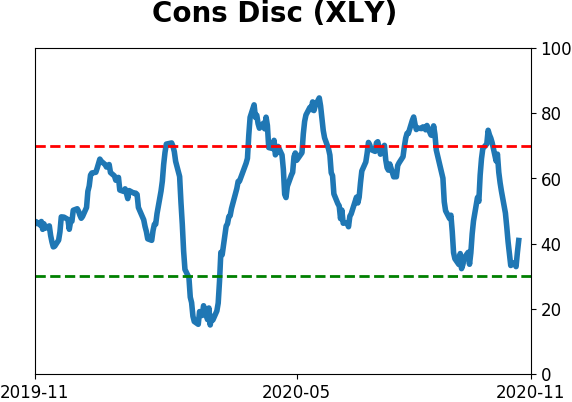
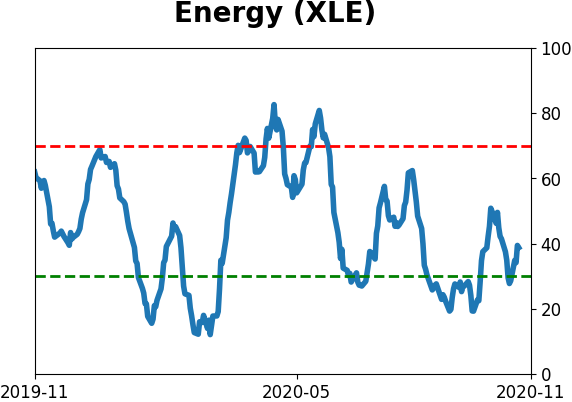
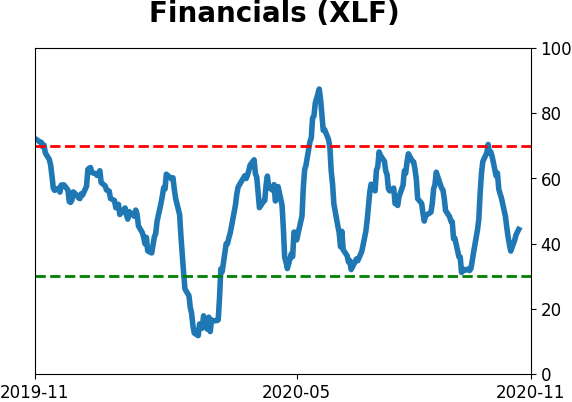
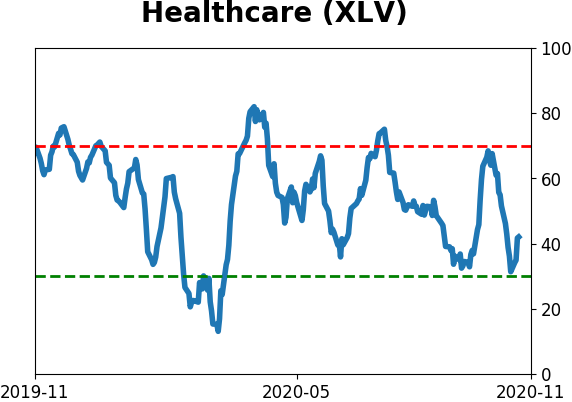
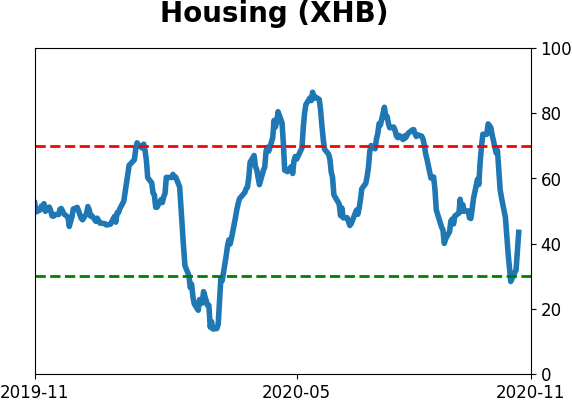
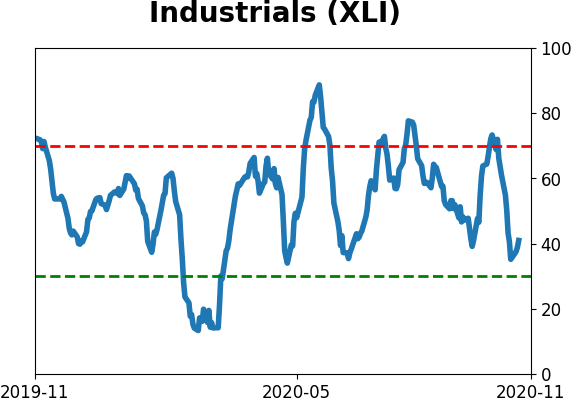
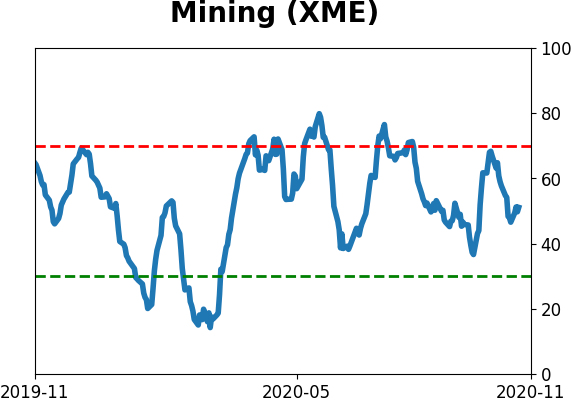
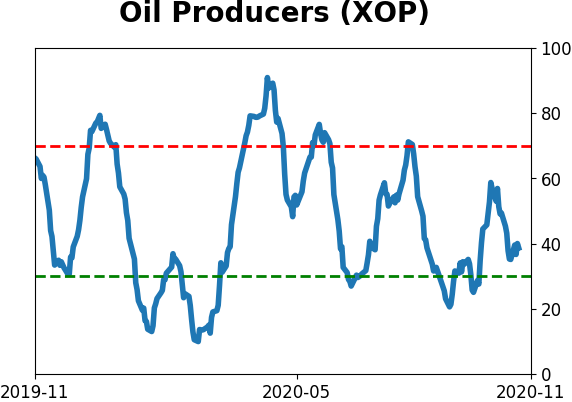
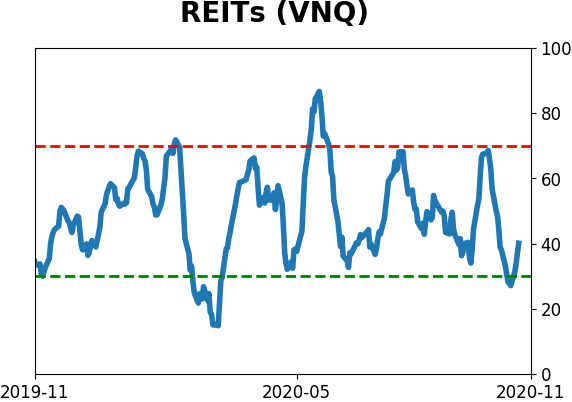
Sector ETF's - 10-Day Moving Average
|
|
|
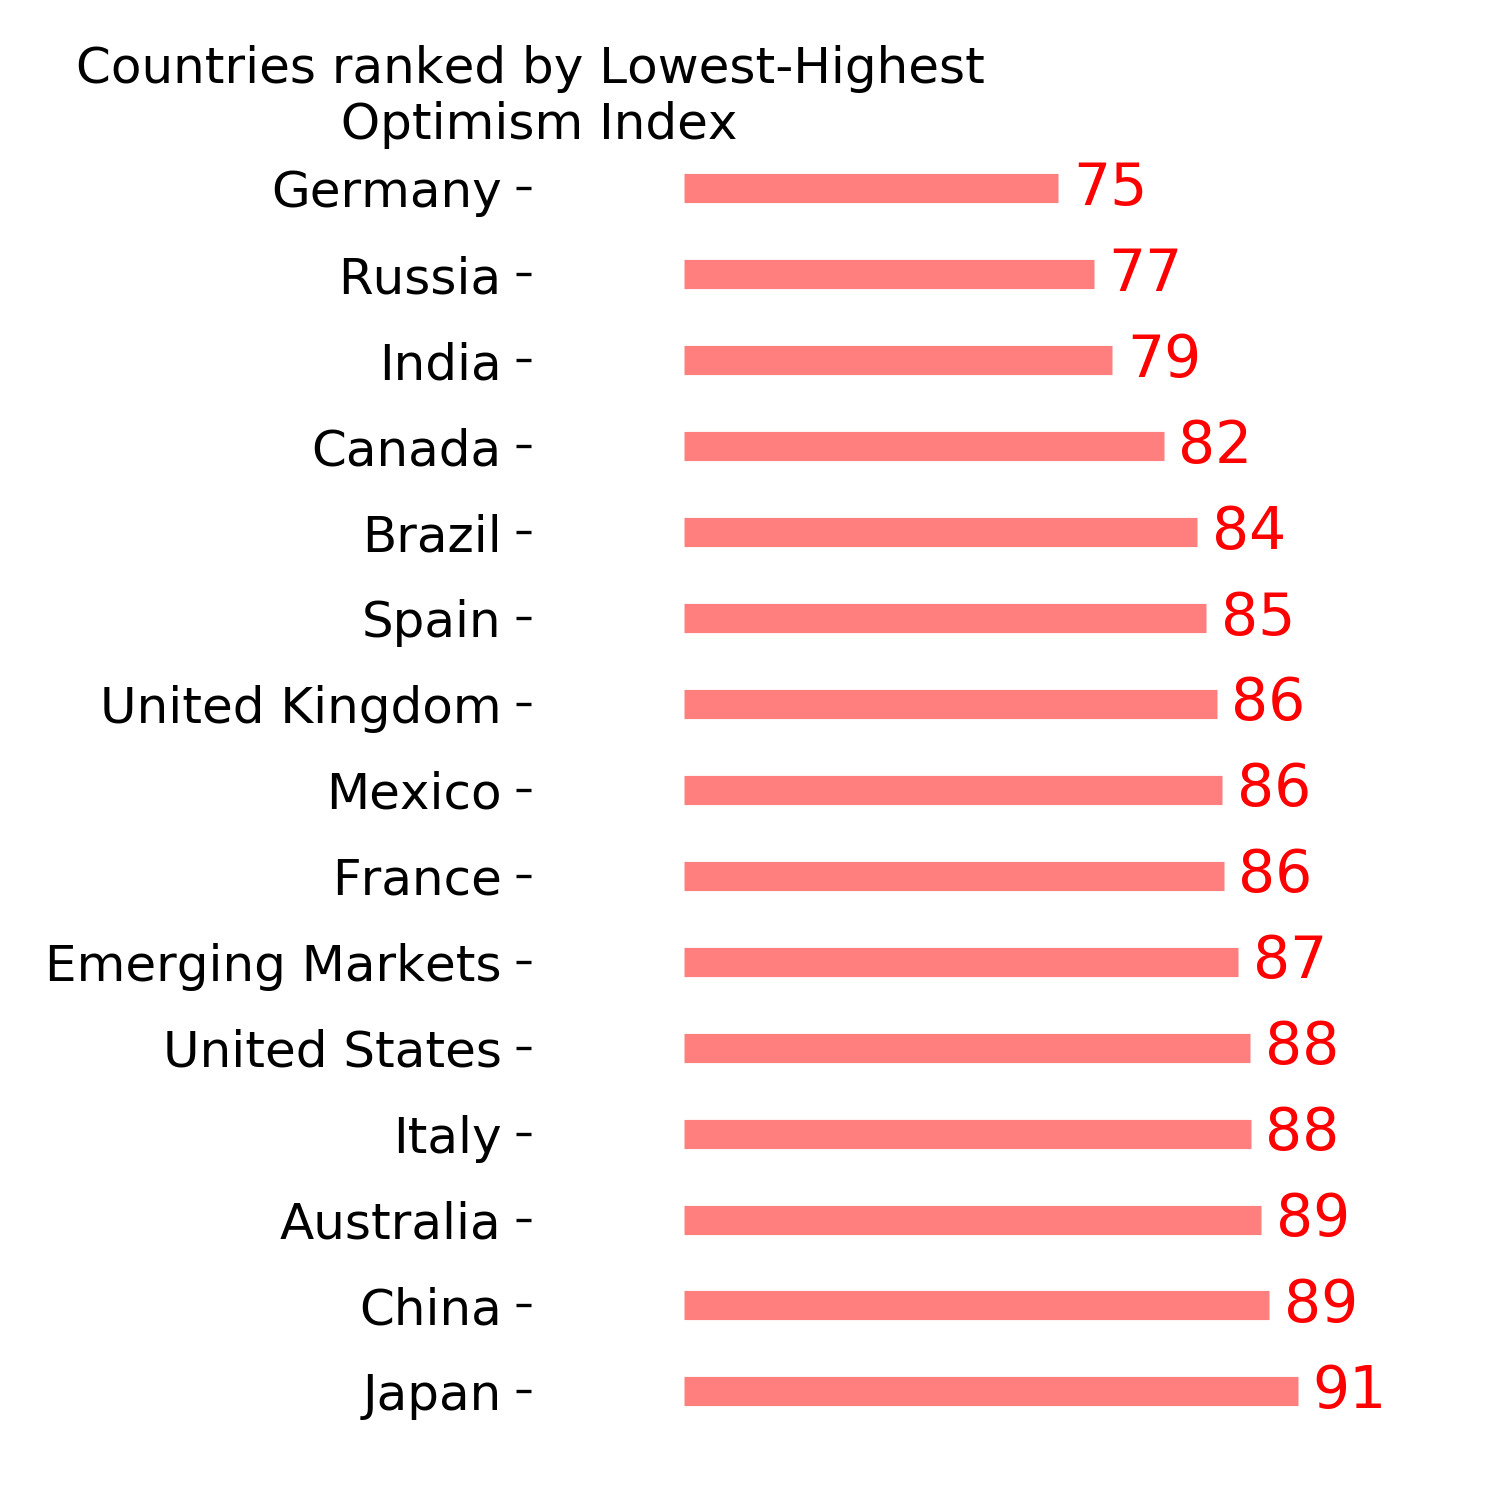
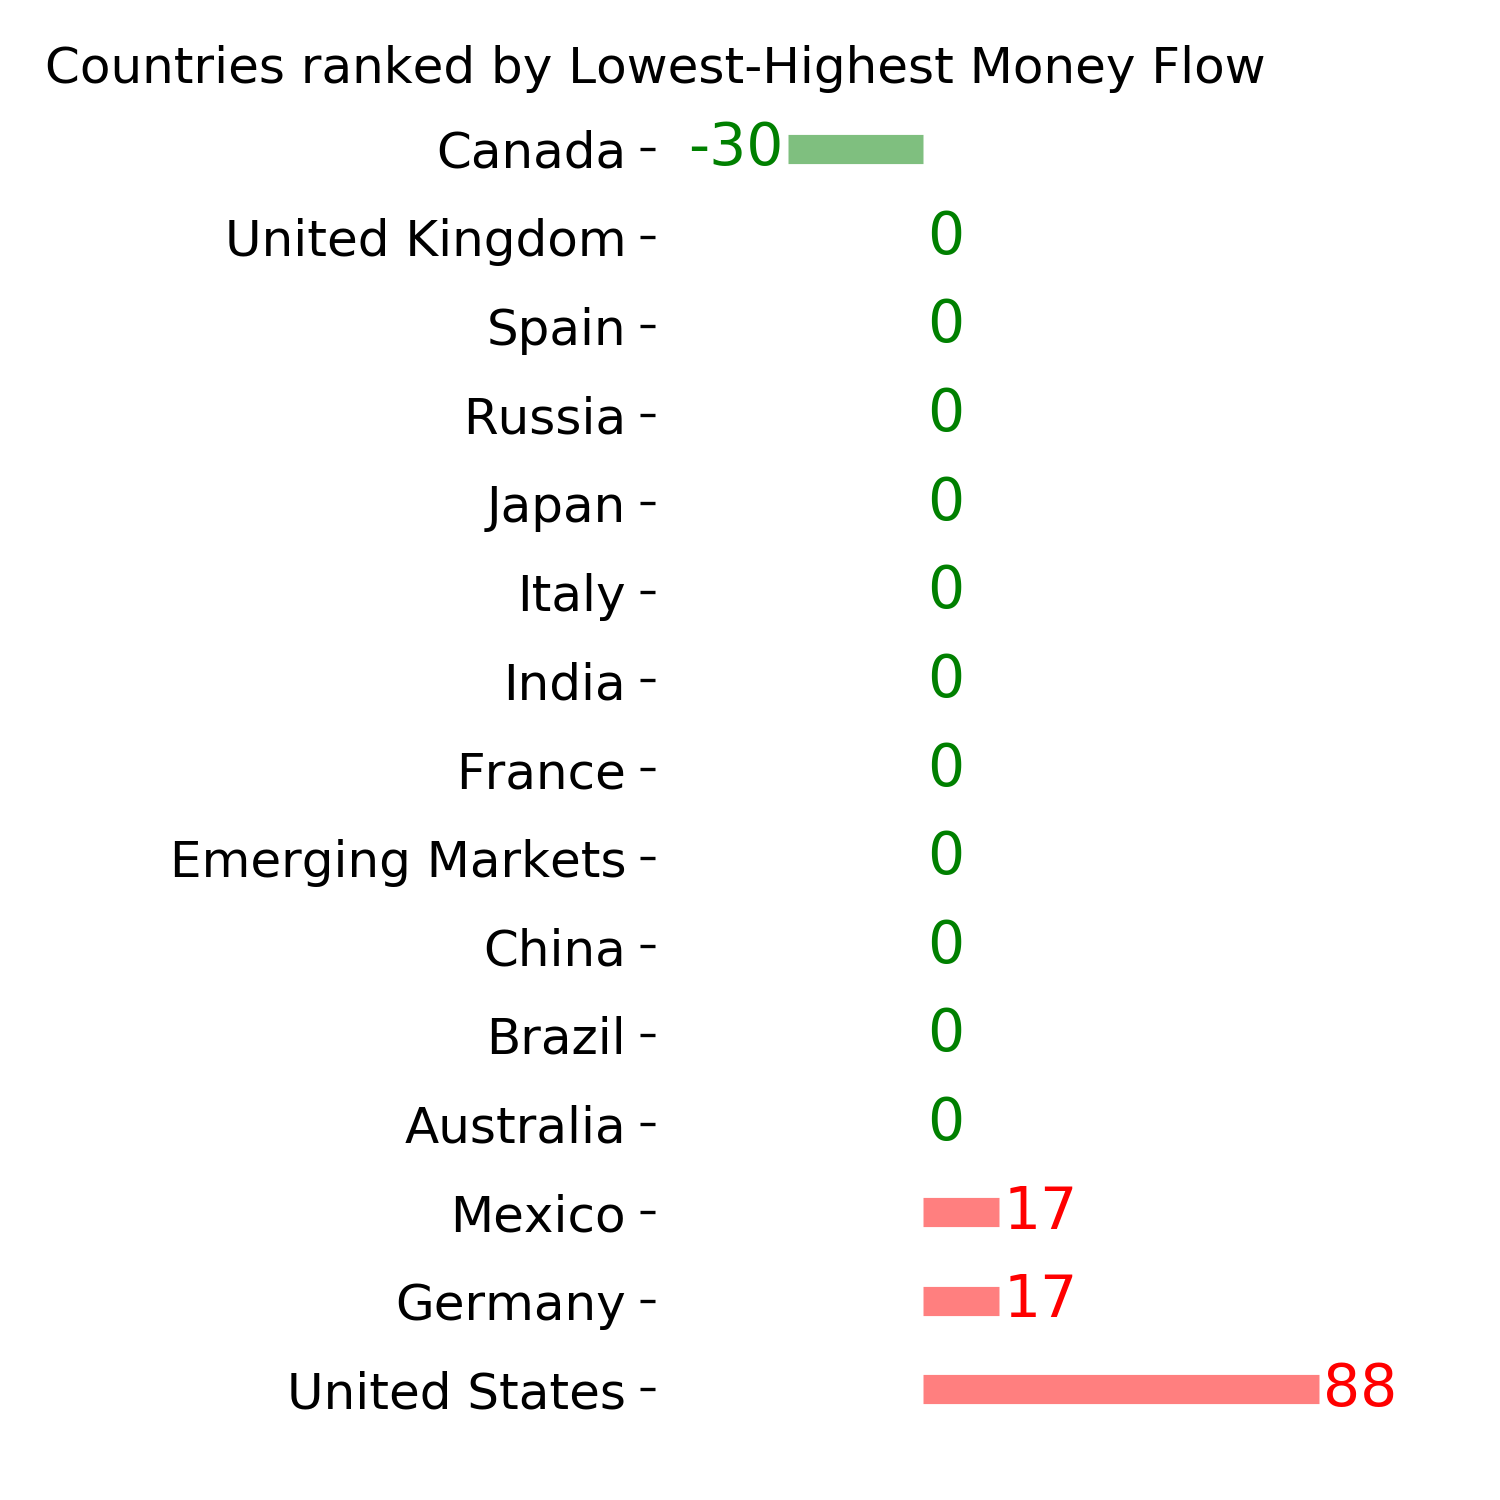
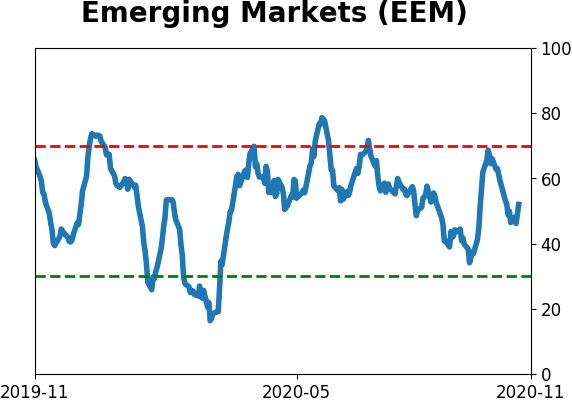
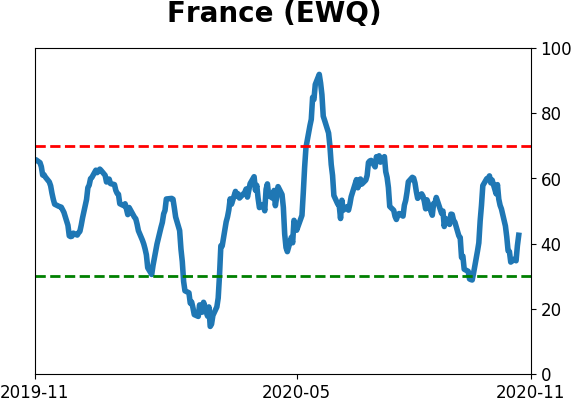
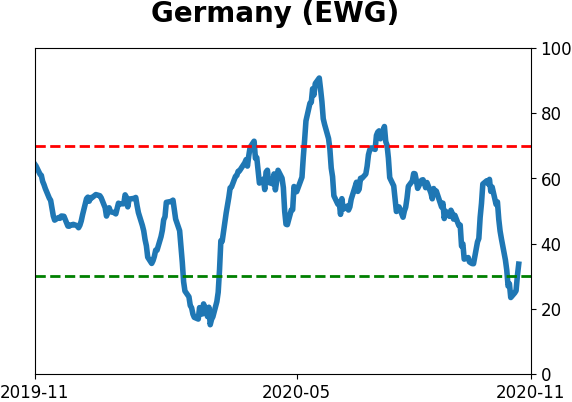
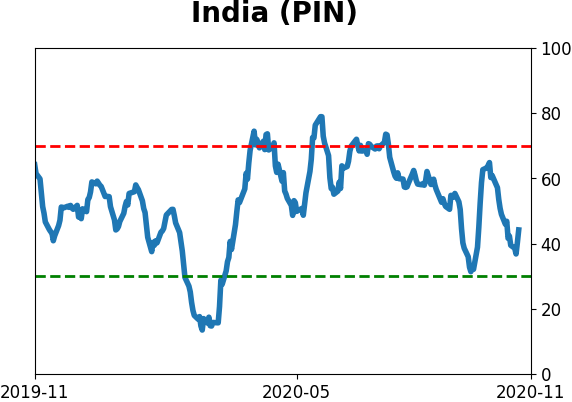
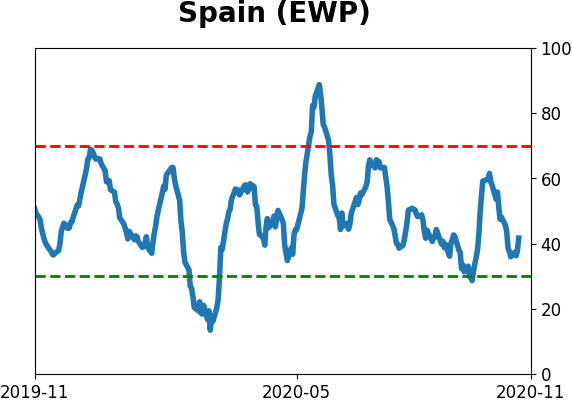
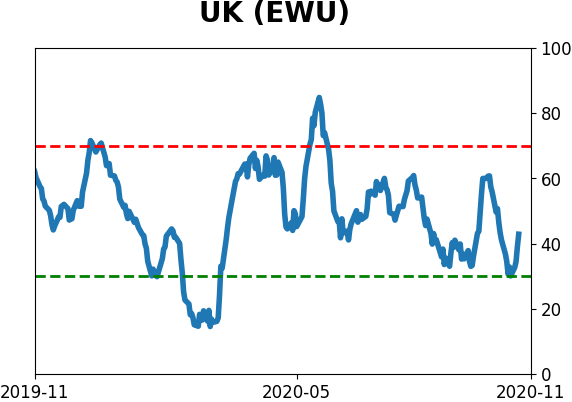
Country ETF's - 10-Day Moving Average
|
|
|
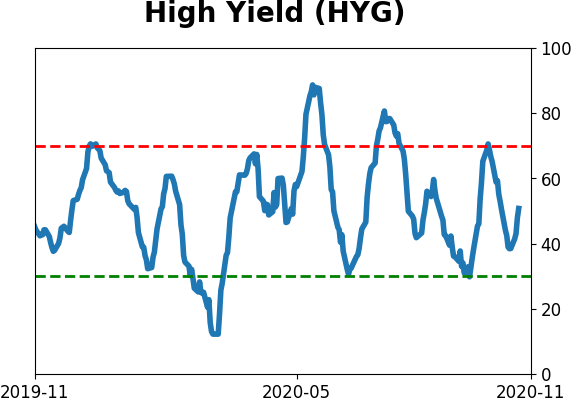
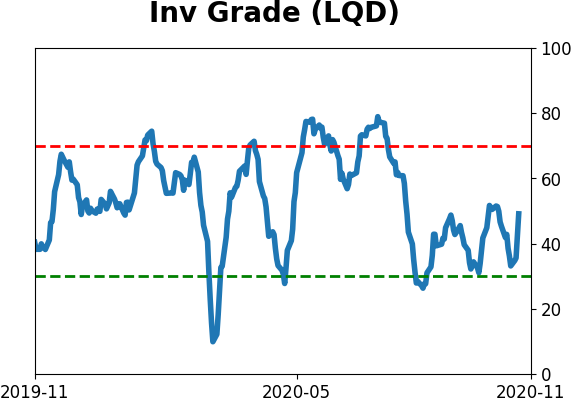
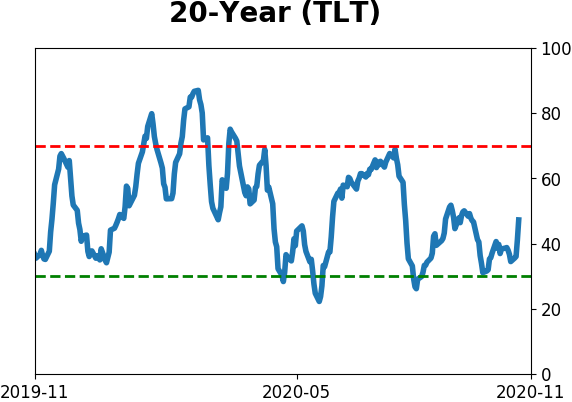
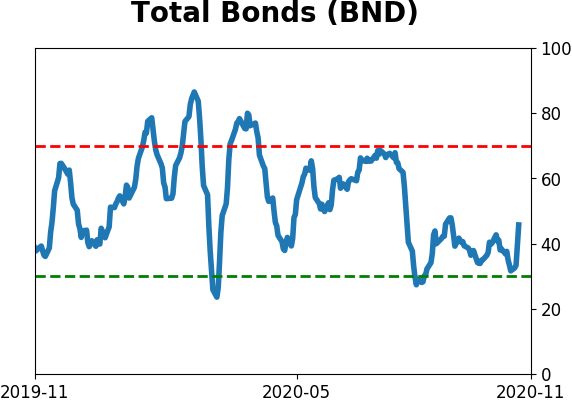
Bond ETF's - 10-Day Moving Average
|
|
|
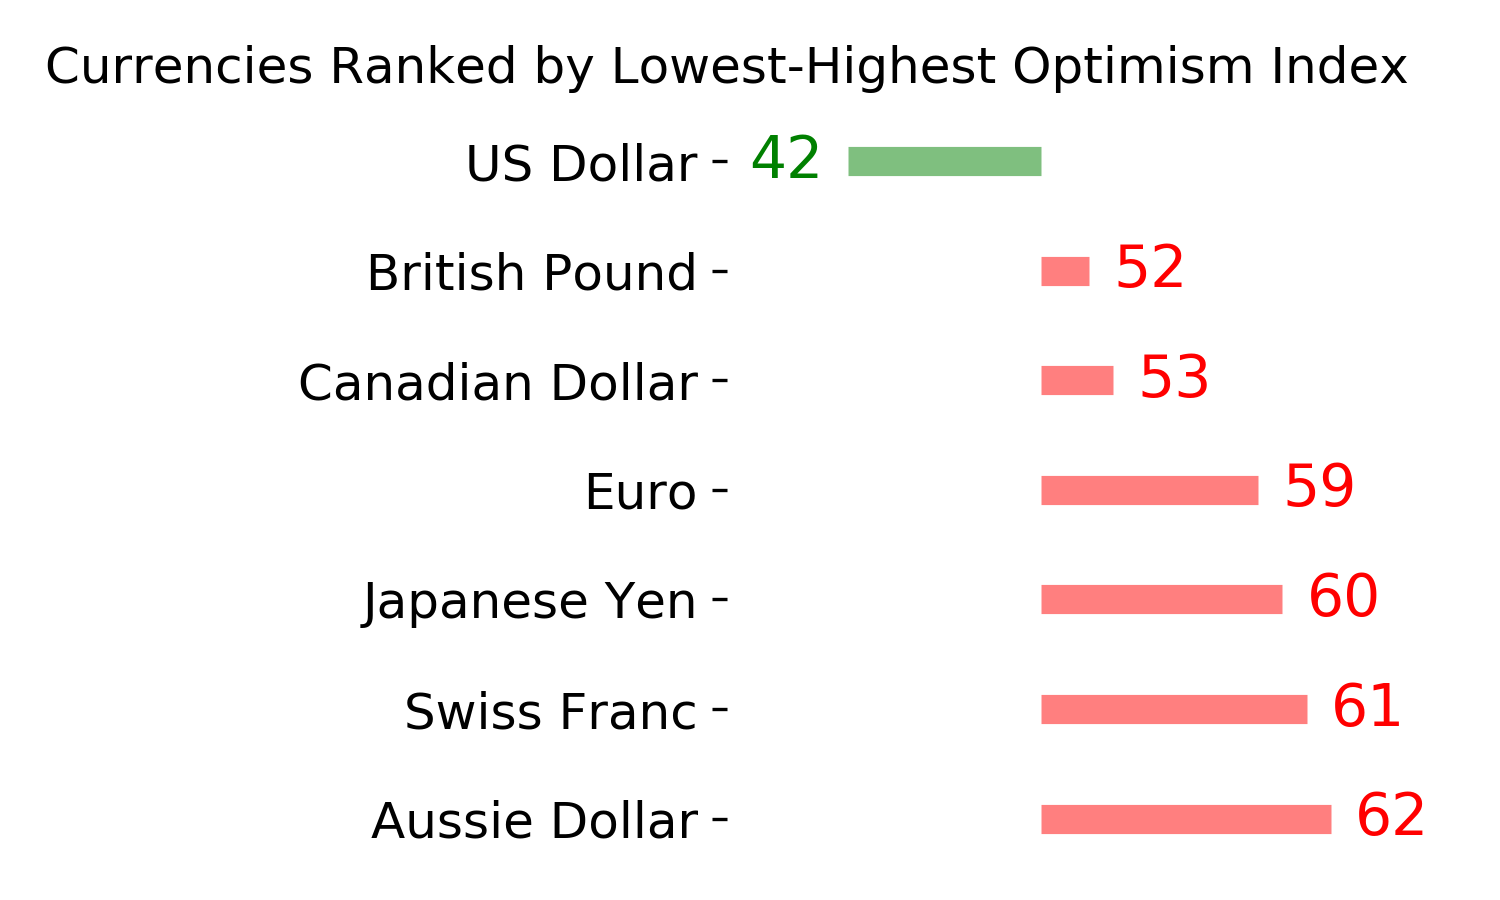
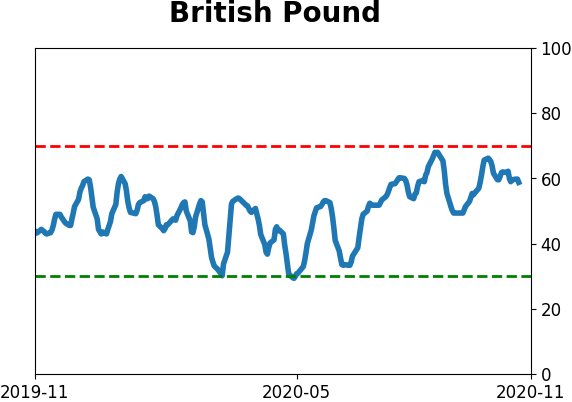
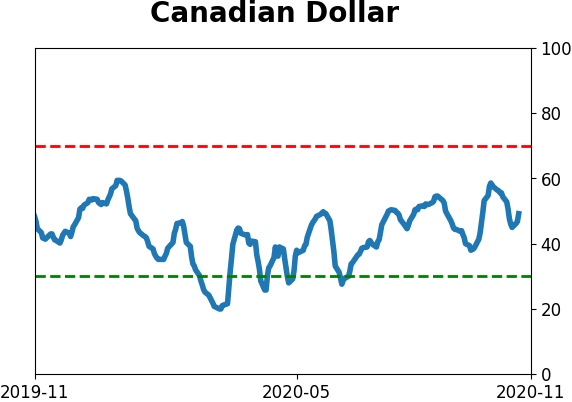
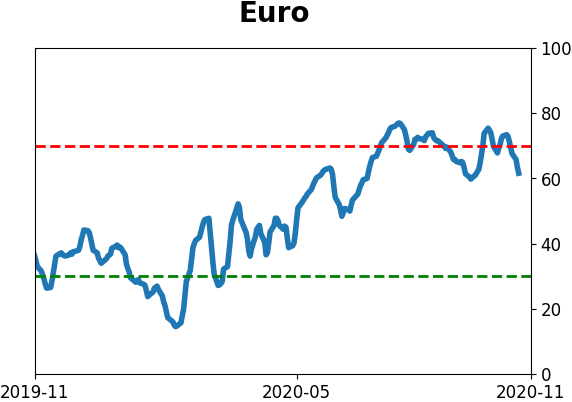
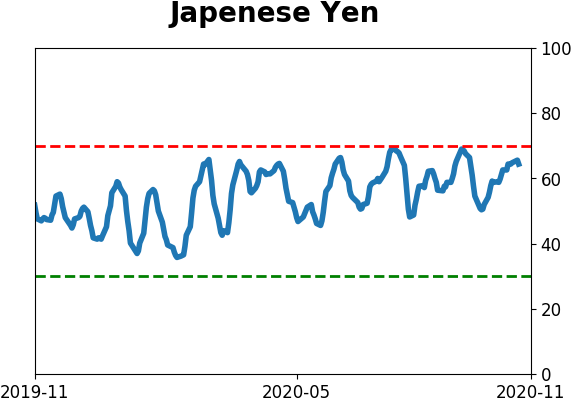
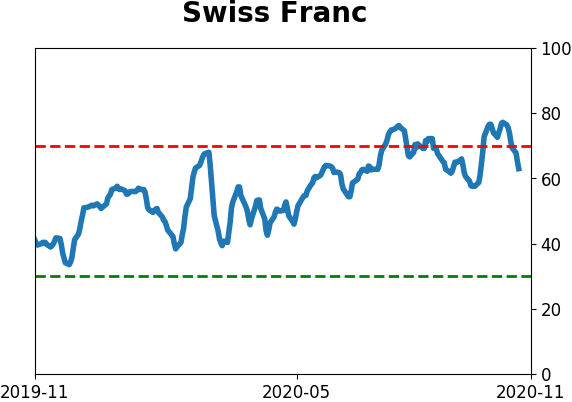
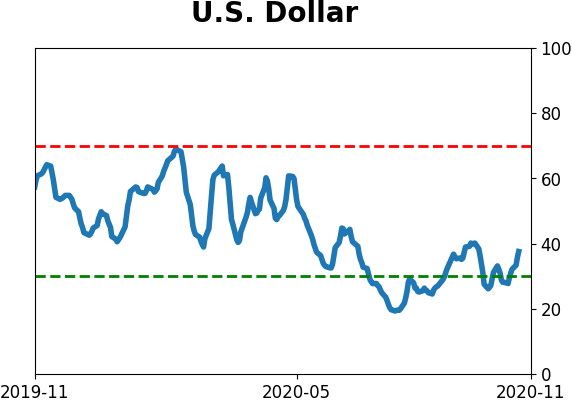
Currency ETF's - 5-Day Moving Average
|
|
|
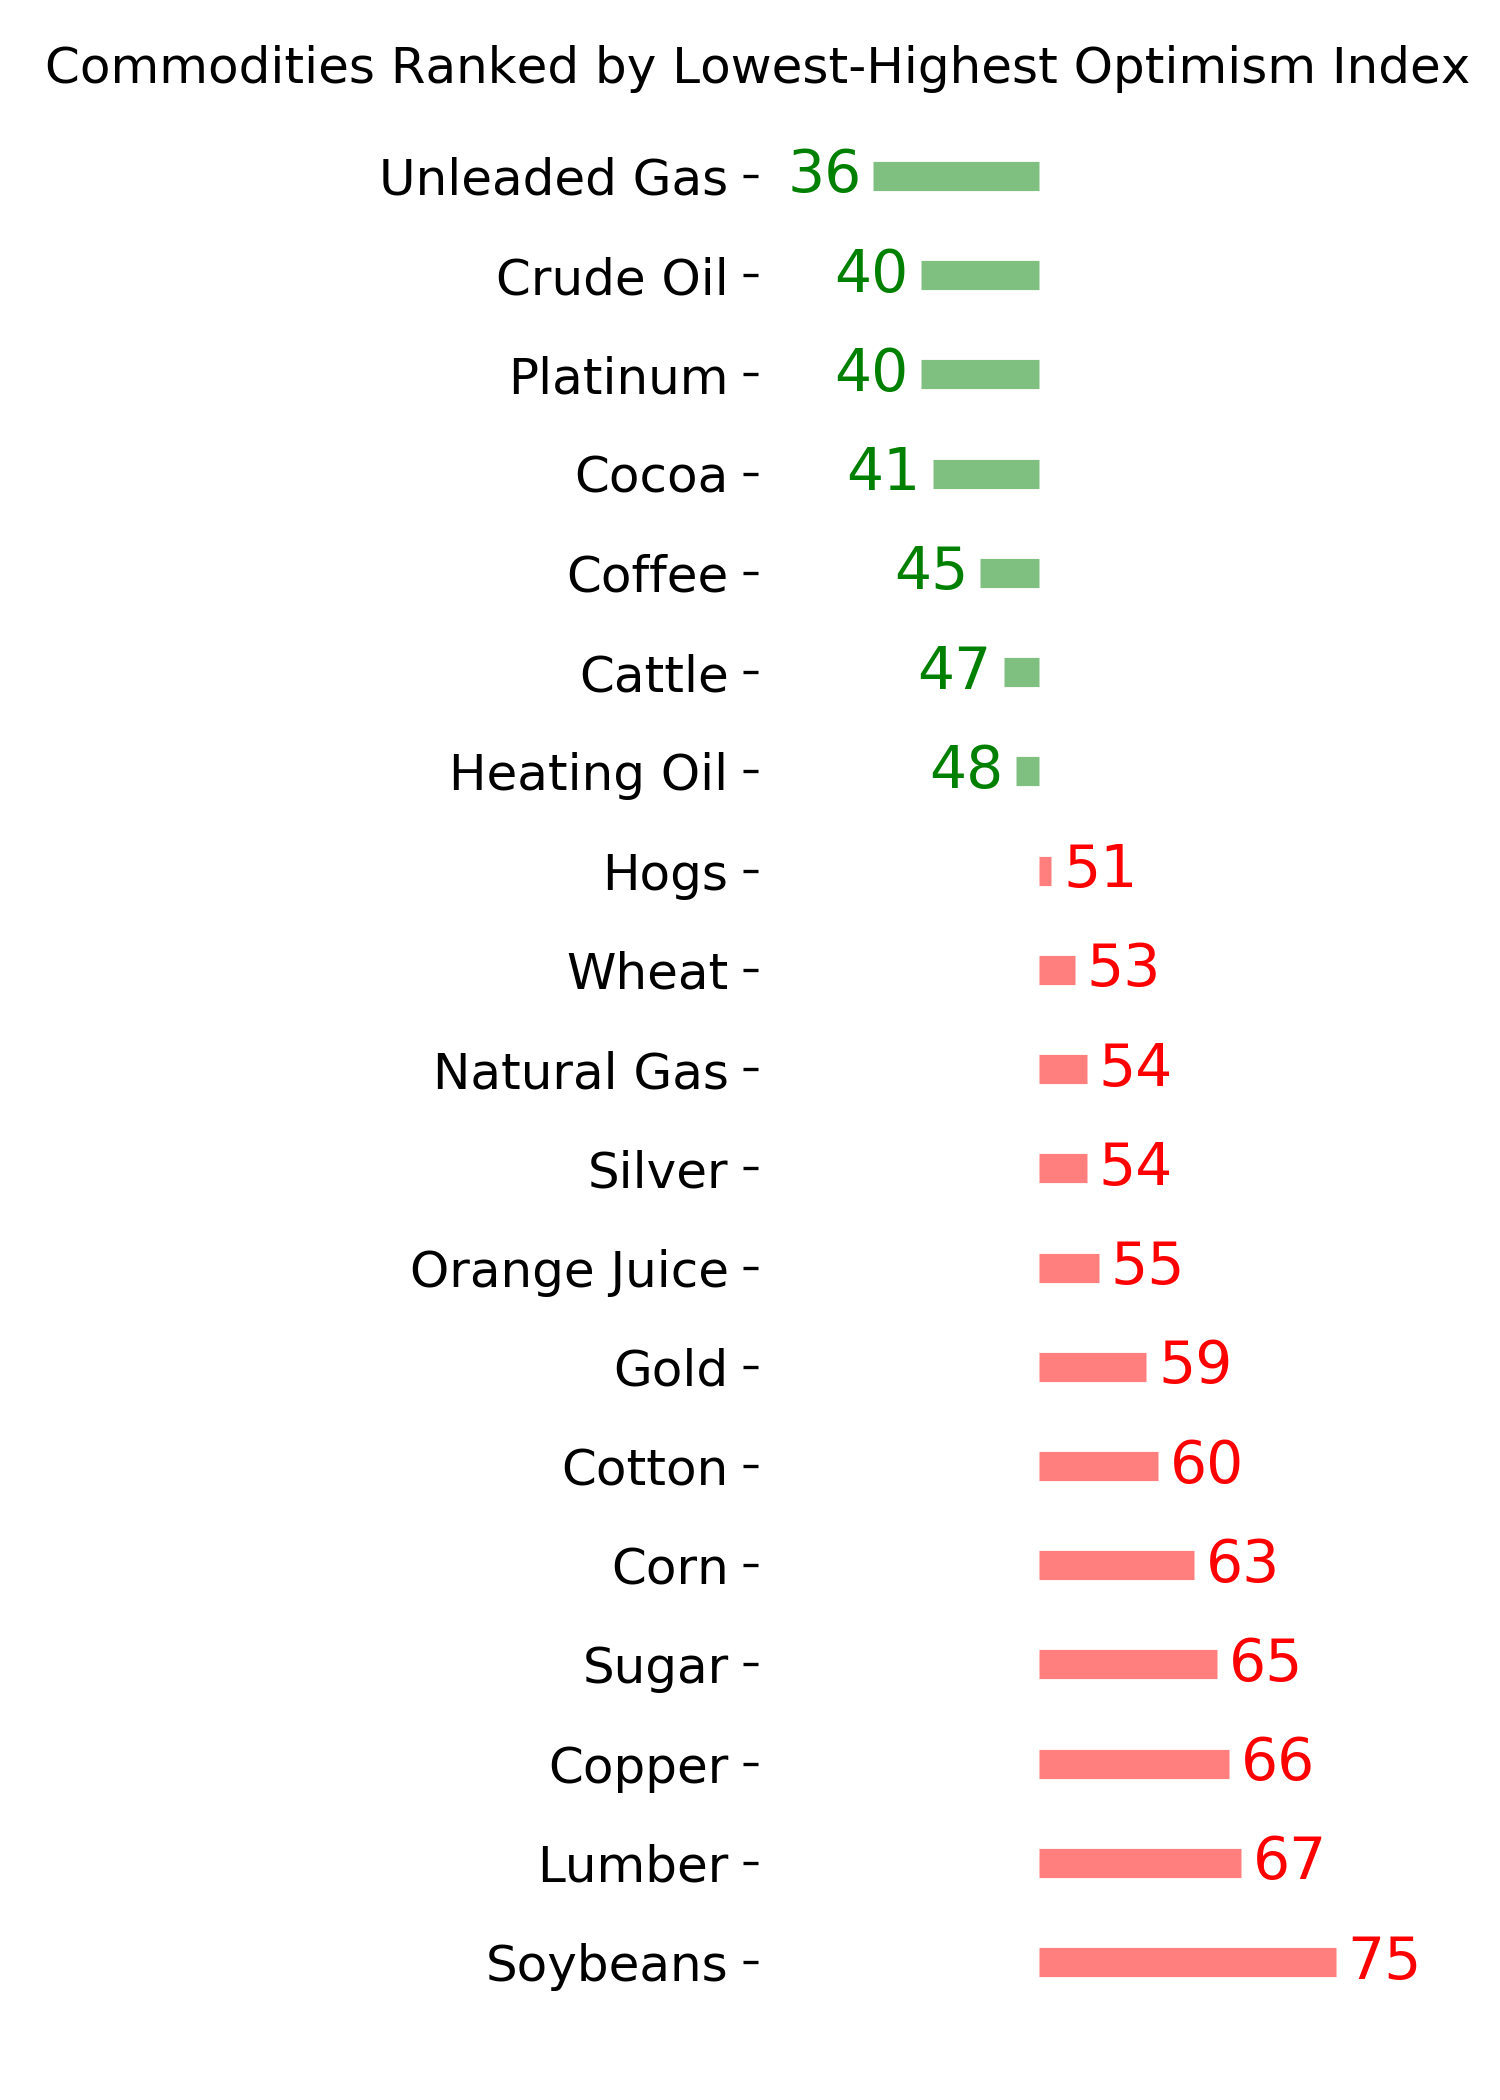
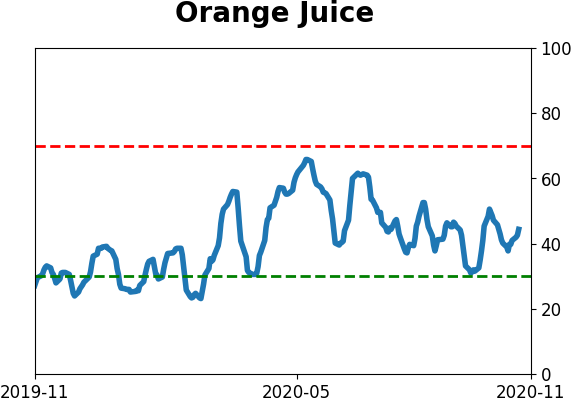
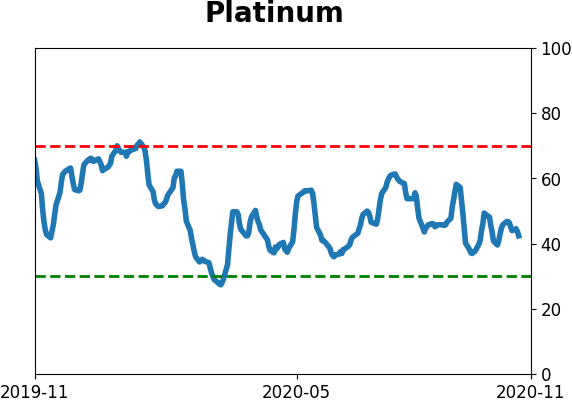
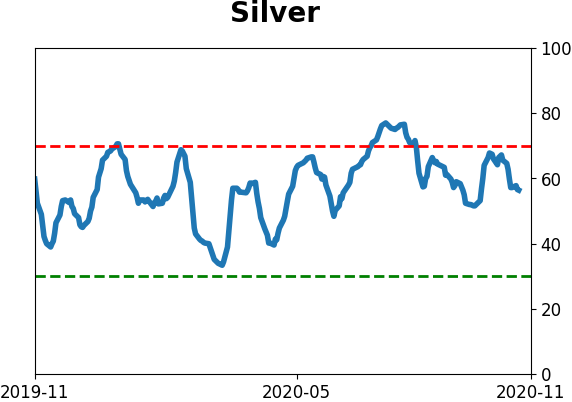
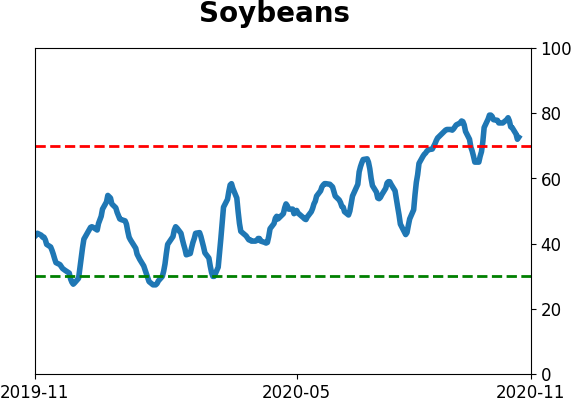
Commodity ETF's - 5-Day Moving Average
|
|