Headlines
|
|
Consumers turn bearish for the first time in a year:
The latest Conference Board survey shows that more consumers expect stocks to fall than rise in the coming months. They've usually been wrong.
Bottom Line:
STOCKS: Weak buy
The speculative frenzy in February is wrung out. There are some signs of pessimism, but the most compelling data show that buyers consistently tend to return once the first signs of extreme momentum end, especially as we head into a seasonally positive time of year. See the Outlook & Allocations page for more. BONDS: Hold
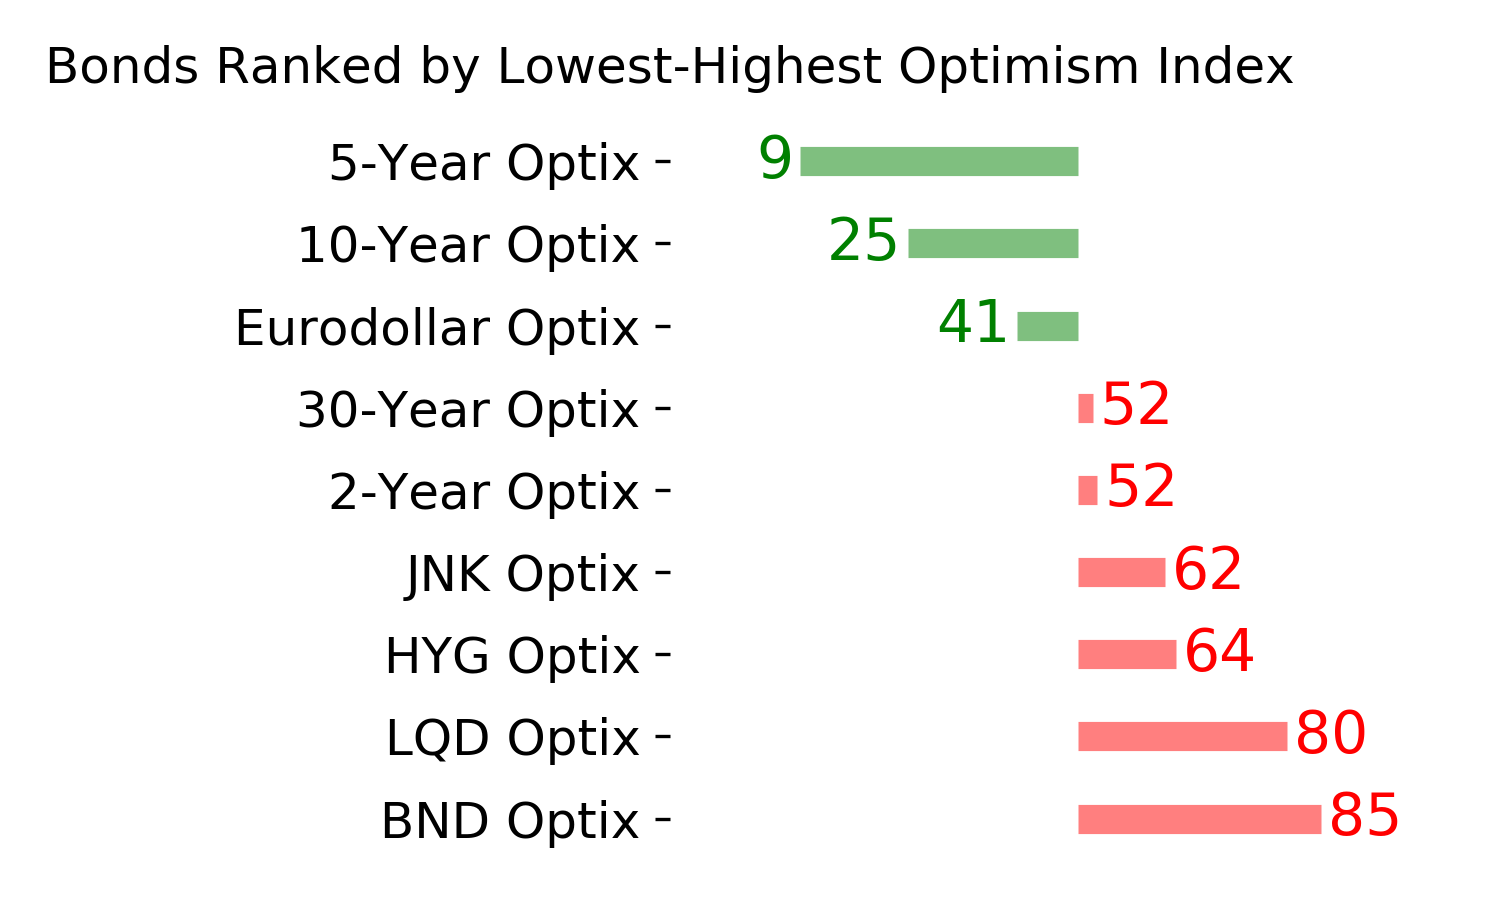
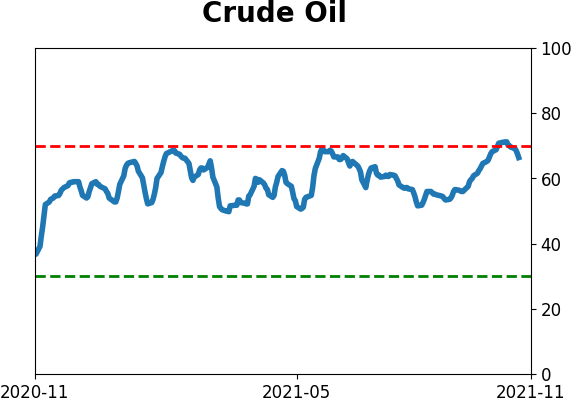
Various parts of the market got hit in March, with the lowest Bond Optimism Index we usually see during healthy environments. Bond prices have modest recovered and there is no edge among the data we follow. GOLD: Hold
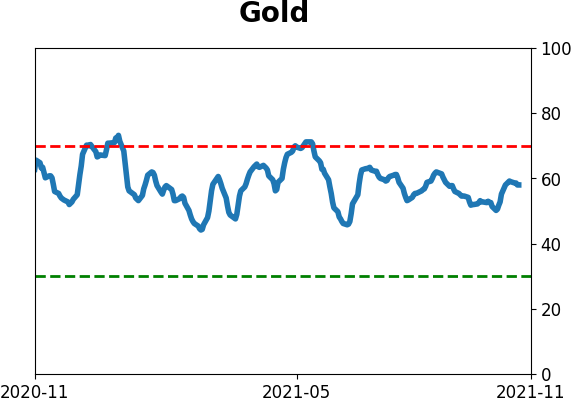
Gold and miners were rejected after trying to recover above their 200-day averages in May. Lately, some medium-term (not long-term) oversold extremes in breadth measures among miners have triggered.
|
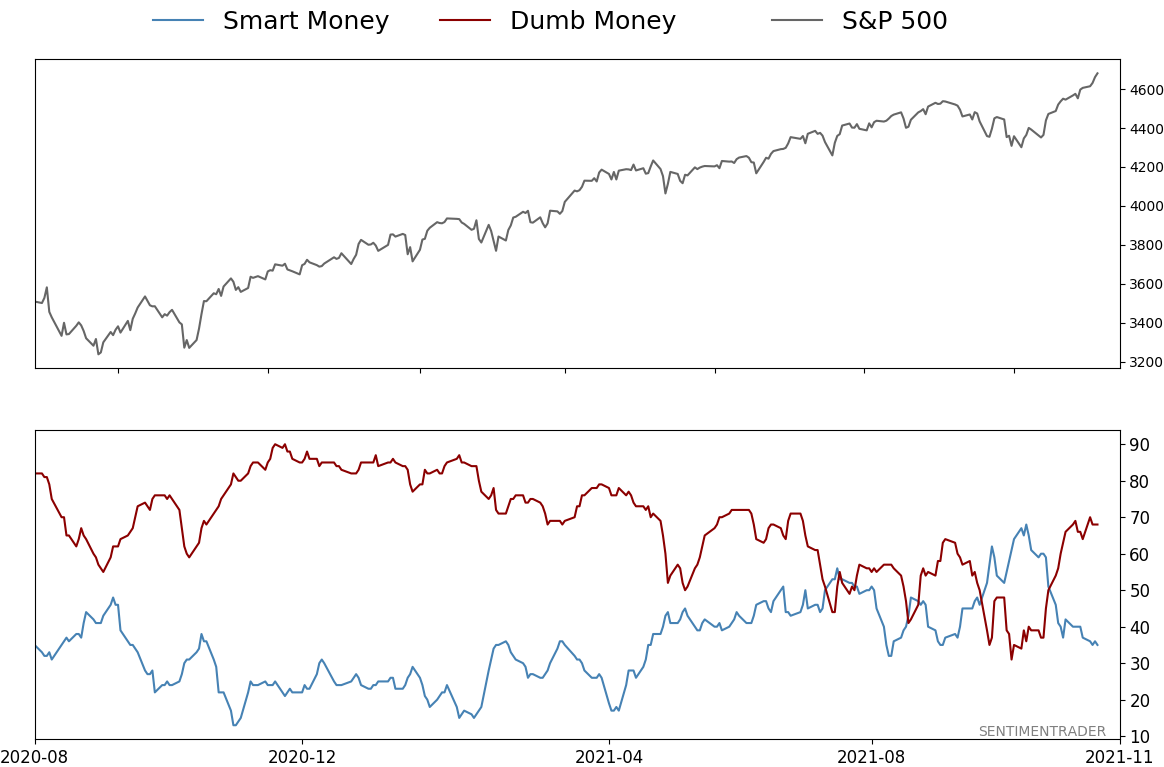
Smart / Dumb Money Confidence
|
Smart Money Confidence: 35%
Dumb Money Confidence: 68%
|
|
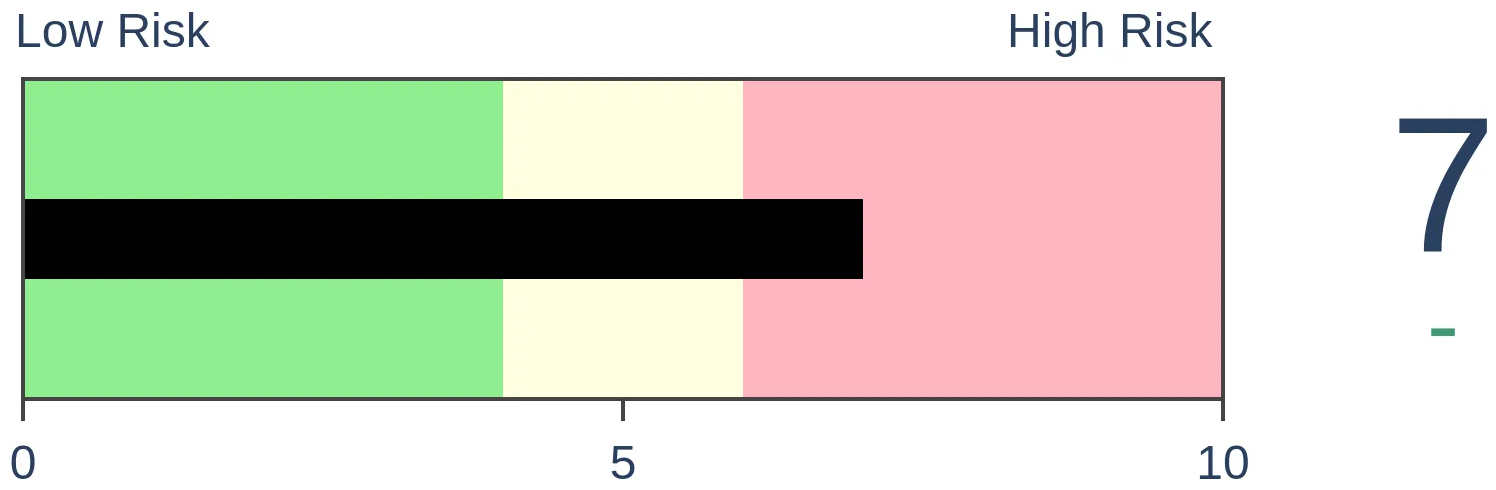
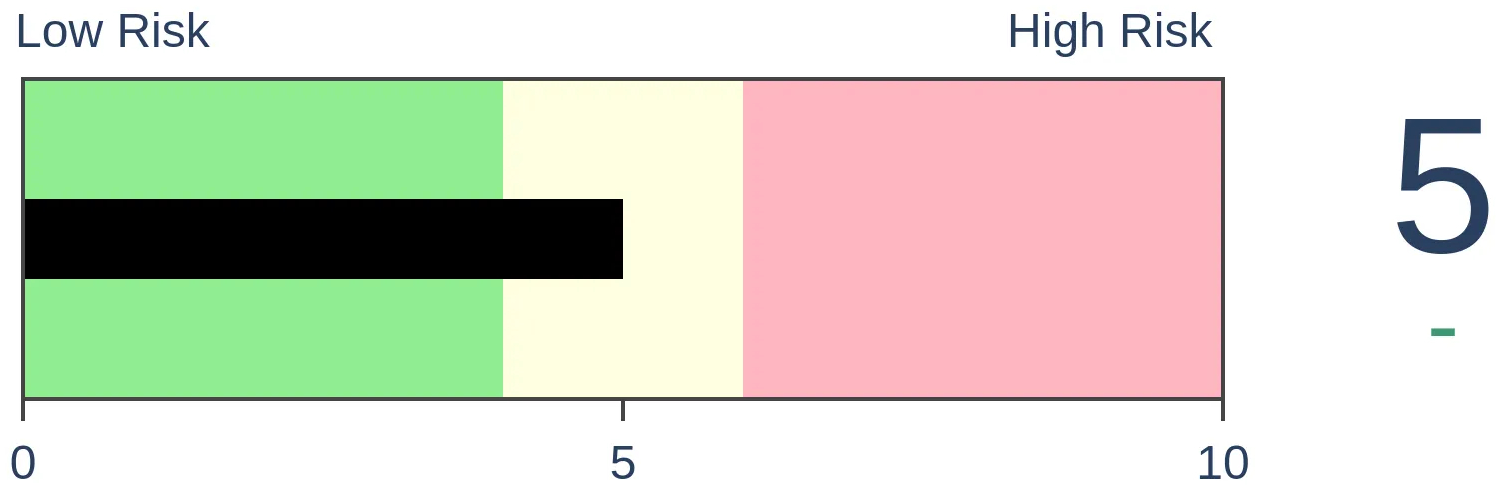
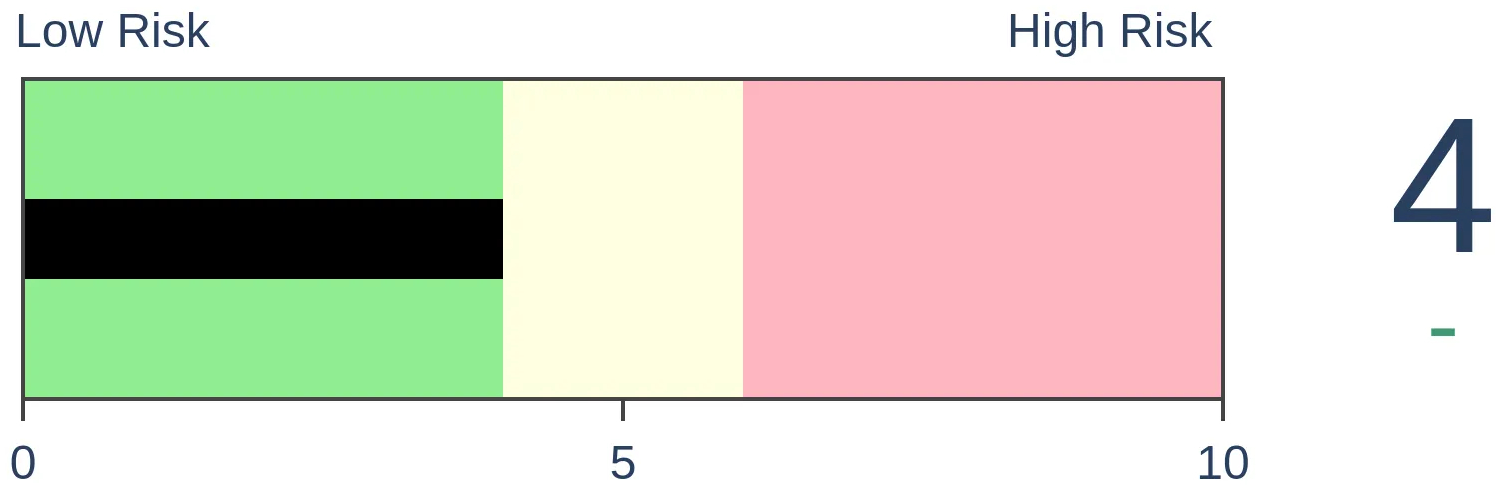
Risk Levels
Stocks Short-Term
|
Stocks Medium-Term

|
|
Bonds

|
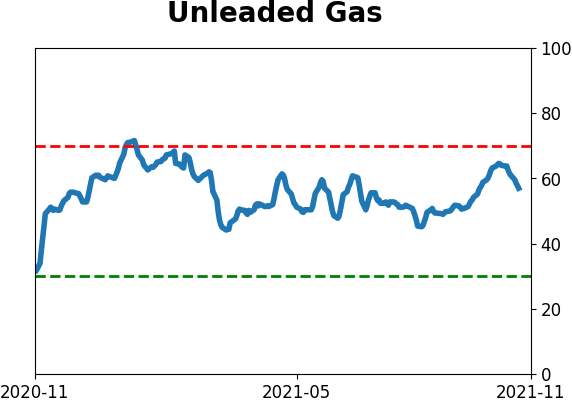
Crude Oil

|
|
Gold
|
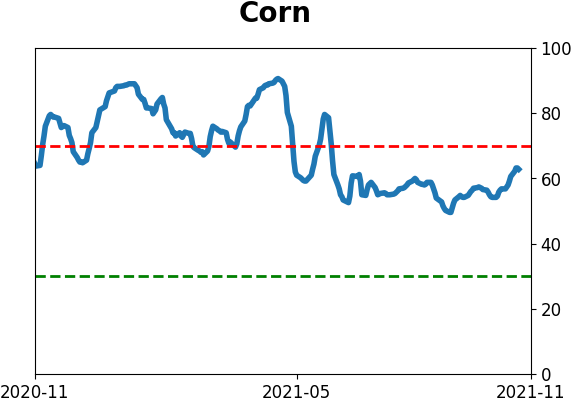
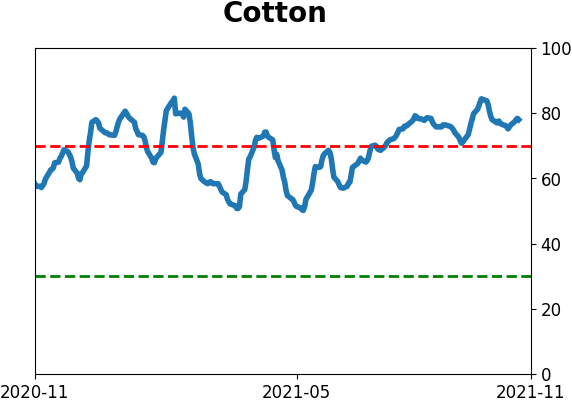
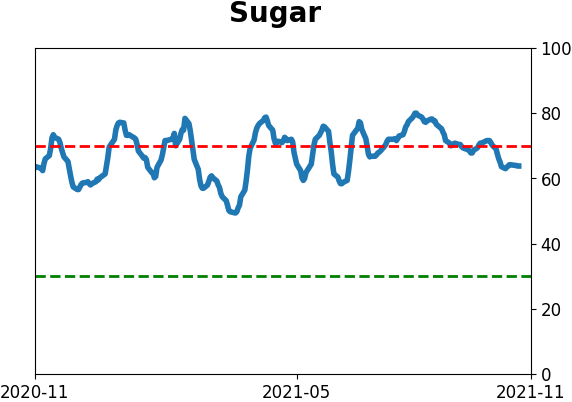
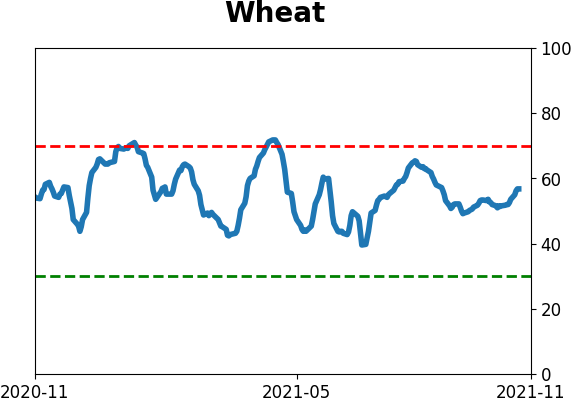
Agriculture
|
|
Research
By Jason Goepfert
BOTTOM LINE
The latest Conference Board survey shows that more consumers expect stocks to fall than rise in the coming months. They've usually been wrong.
FORECAST / TIMEFRAME
None
|
Key points:
- More U.S. consumers now expect stocks to fall than rise
- That ends a streak of more than a year of bullishness
- The ends of other streaks led to rising stocks 7 out of 8 times
The end of a long streak of optimism
As a general rule, consumers in the U.S. would rather, well, consume than invest. Saving rates are low, and consumption accounts for about 70% of GDP.
It's hard to escape the fact that stocks usually go up, even among those who don't regularly invest. So most consumers usually expect stocks to rise over time. And they've had that expectation for more than a year.
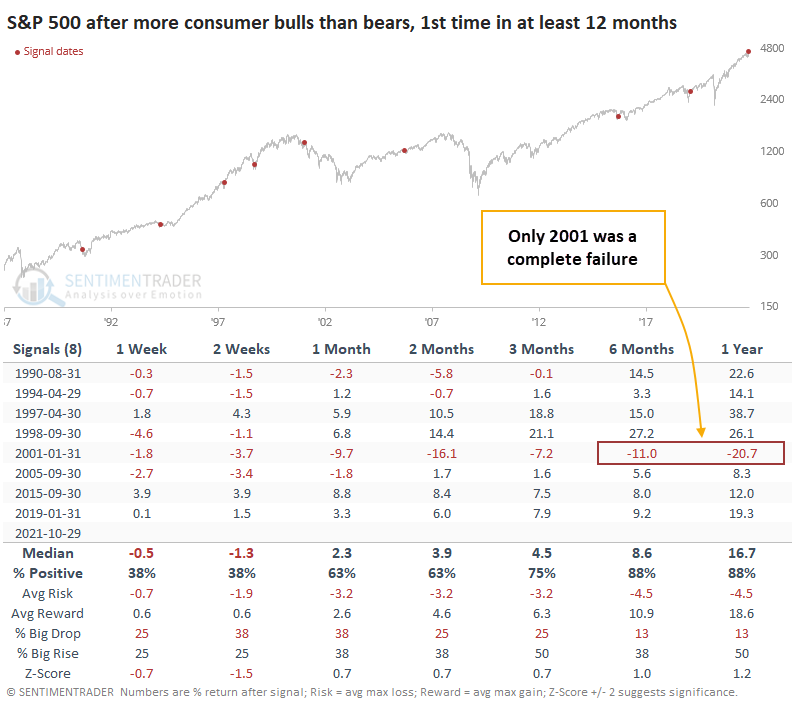
That changed in October. For the first time since July 2020, more consumers expect stocks to fall in the coming months than rise. The latest survey from the Conference Board showed that 2.7% more consumers are bearish than bullish. That's the 4th most negative spread since the start of 2017.
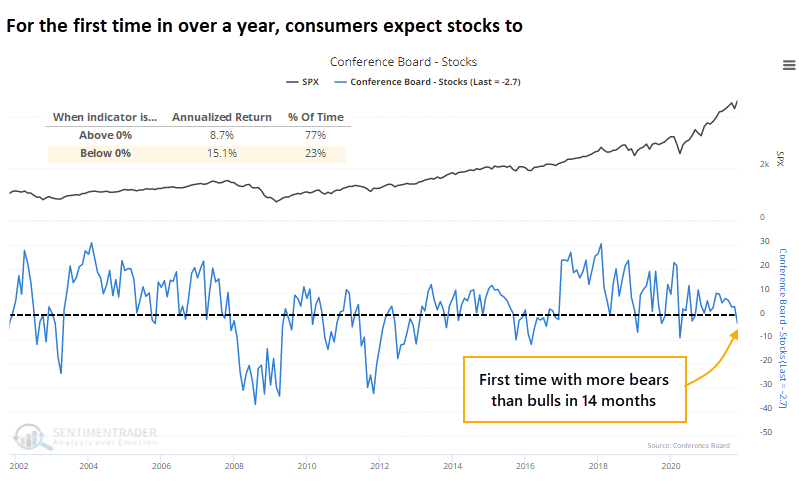
Some of the most significant monthly rebounds have occurred when consumers had been negative on stocks, so the S&P 500's annualized return when there are more bears than bulls is almost double what it is when bulls are in the majority.
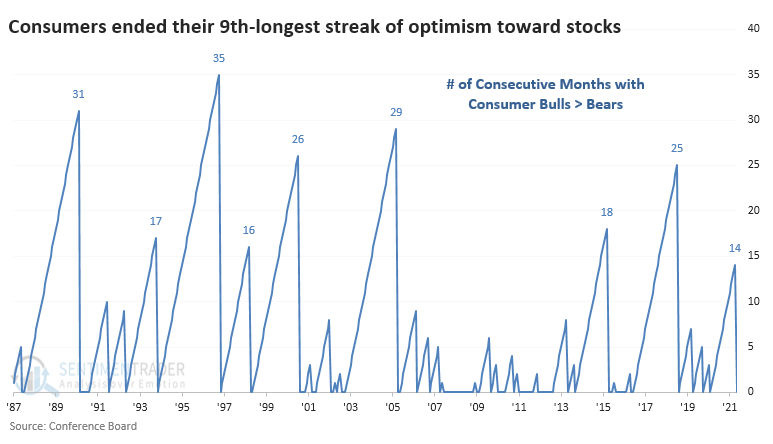
October's dip into bearishness ended the 9th-longest streak with more consumer bulls than bears since 1987.
Bearish consumers were good for future stock returns
When consumers turn negative on stocks for the first time in over a year, it has preceded some weakness at the beginning of the next month, then stronger-than-average returns in the months ahead.
The only time when consumers ended up justified in their concern was in 2001. Six of the seven others preceded a double-digit gain in the S&P 500 during the following year. The only two signals in the past decade were immediate buy signals.
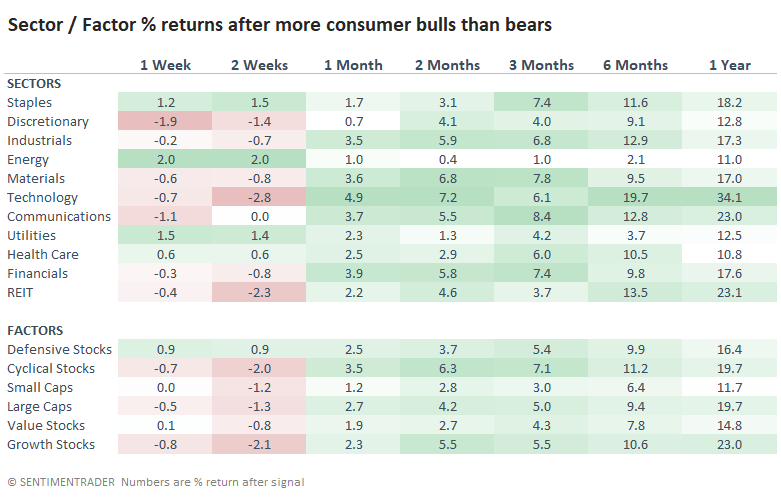
There was a modest tilt toward higher-beta sectors and factors after other signals.
What the research tells us...
This year hasn't been very accommodating to historical norms. There are some signs that sentiment is a bit overheated in the short-term, while some longer-term measures are still lukewarm or even on the pessimistic side of things, including among consumers. That has been mostly a positive sign over a 6-12 month time frame.
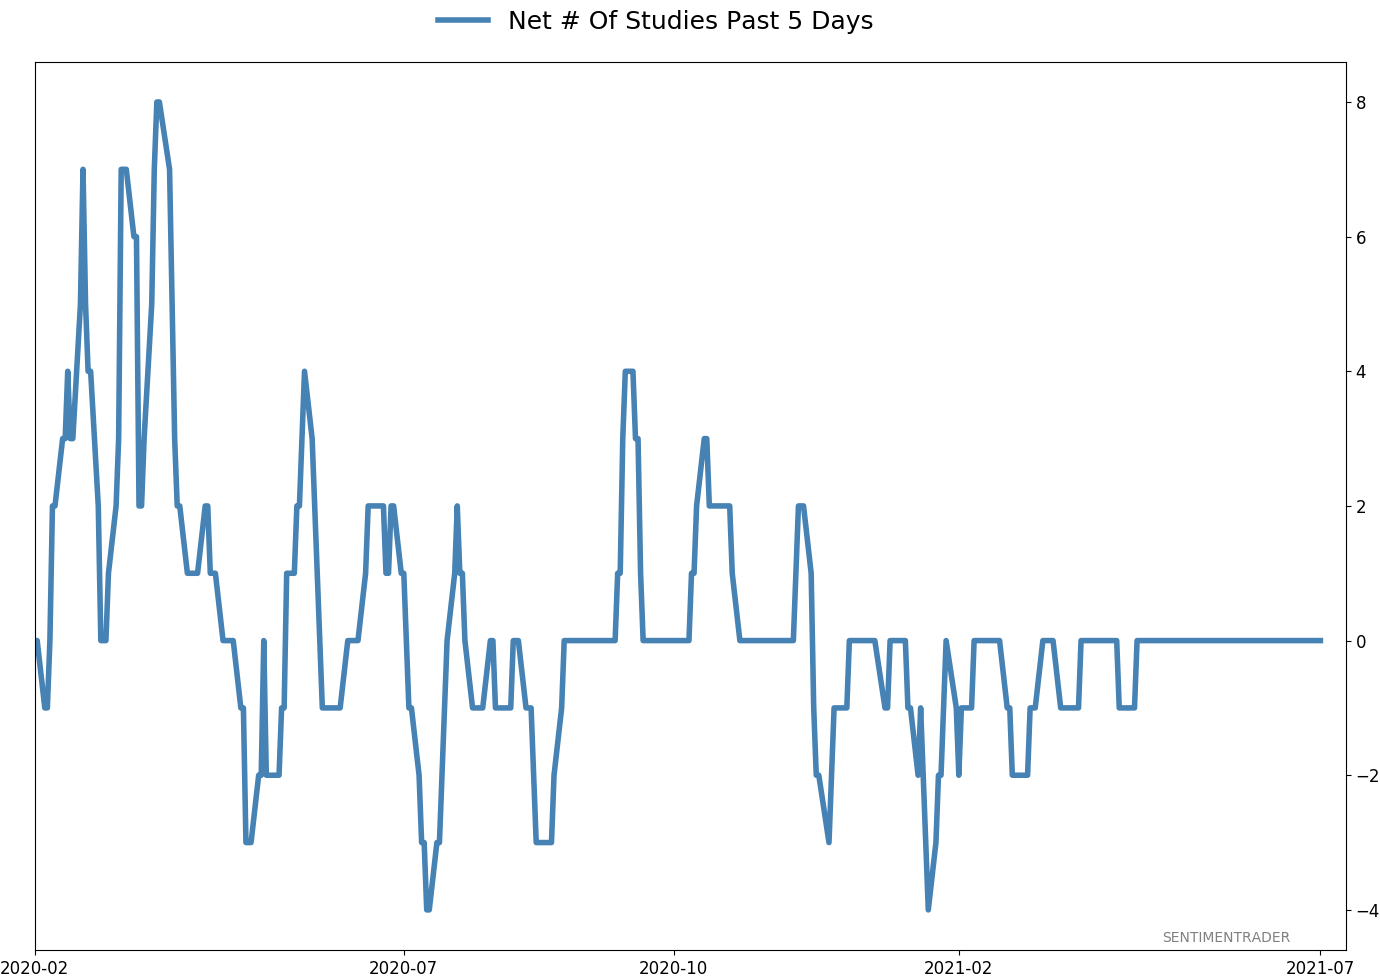
Active Studies
| Time Frame | Bullish | Bearish | | Short-Term | 2 | 0 | | Medium-Term | 10 | 0 | | Long-Term | 11 | 5 |
|
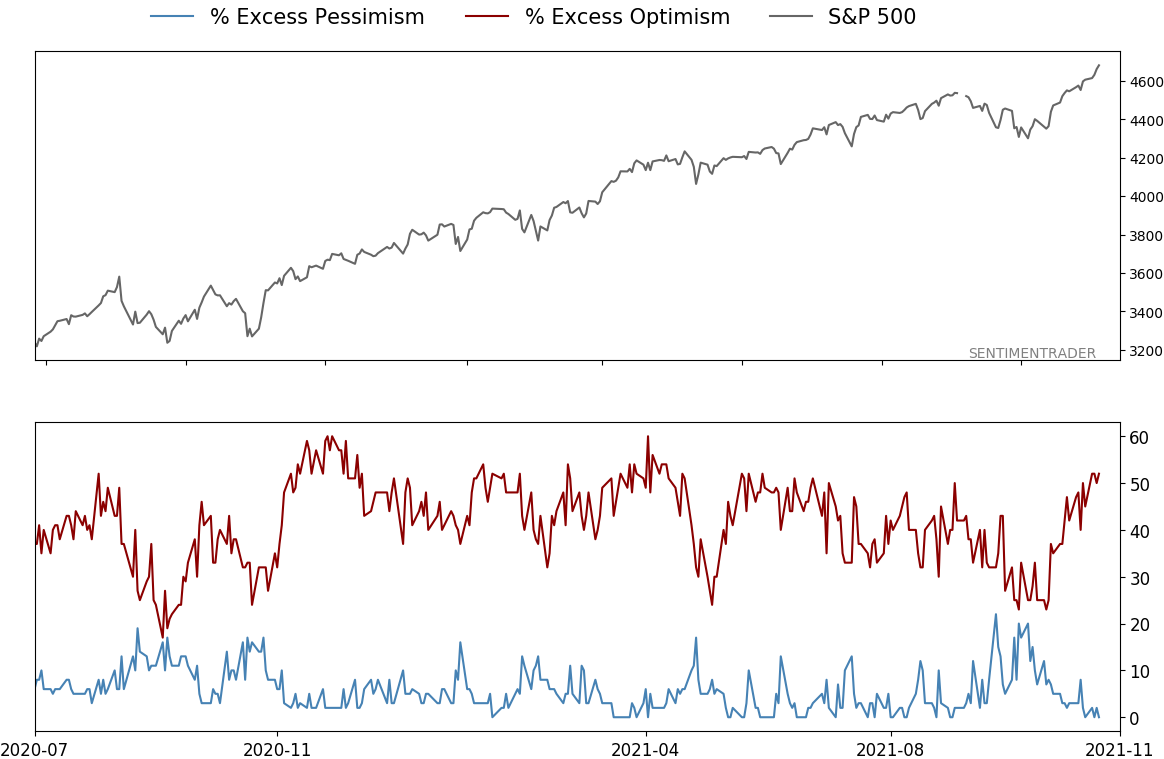
Indicators at Extremes
|
% Showing Pessimism: 0%
Bullish for Stocks
|
|
Portfolio
| Position | Description | Weight % | Added / Reduced | Date | | Stocks | RSP | 10.7 | Added 6.4% | 2021-10-01 | | Bonds | 32.7% BND, 7.1% SCHP | 39.8 | Added 8.3% | 2021-10-26 | | Commodities | GCC | 2.4 | Reduced 2.1%
| 2020-09-04 | | Precious Metals | GDX | 4.6 | Reduced 4.2% | 2021-05-19 | | Special Situations | 9.8% KWEB, 4.7% XLE, 2.9% PSCE | 17.3 | Added 9.78% | 2021-10-01 | | Cash | | 24.1 | | |
|
Updates (Changes made today are underlined)
Much of our momentum and trend work has remained positive for several months, with some scattered exceptions. Almost all sentiment-related work has shown a poor risk/reward ratio for stocks, especially as speculation drove to record highs in exuberance in February. Much of that has worn off, and most of our models are back toward neutral levels. There isn't much to be excited about here. The same goes for bonds and even gold. Gold has been performing well lately and is back above long-term trend lines. The issue is that it has a poor record of holding onto gains when attempting a long-term trend change like this, so we'll take a wait-and-see approach. Momentum has ebbed quickly in recent weeks, and nearing oversold levels in some indicators. This can be a dangerous area, with a lot of short-term volatility, but we'd be more inclined to add medium- to long-term exposure rather than sell on much more of a decline, thanks to already rock-bottom exposure. Other areas look more attractive, including some overseas markets. RETURN YTD: 10.6% 2020: 8.1%, 2019: 12.6%, 2018: 0.6%, 2017: 3.8%, 2016: 17.1%, 2015: 9.2%, 2014: 14.5%, 2013: 2.2%, 2012: 10.8%, 2011: 16.5%, 2010: 15.3%, 2009: 23.9%, 2008: 16.2%, 2007: 7.8%
|
|
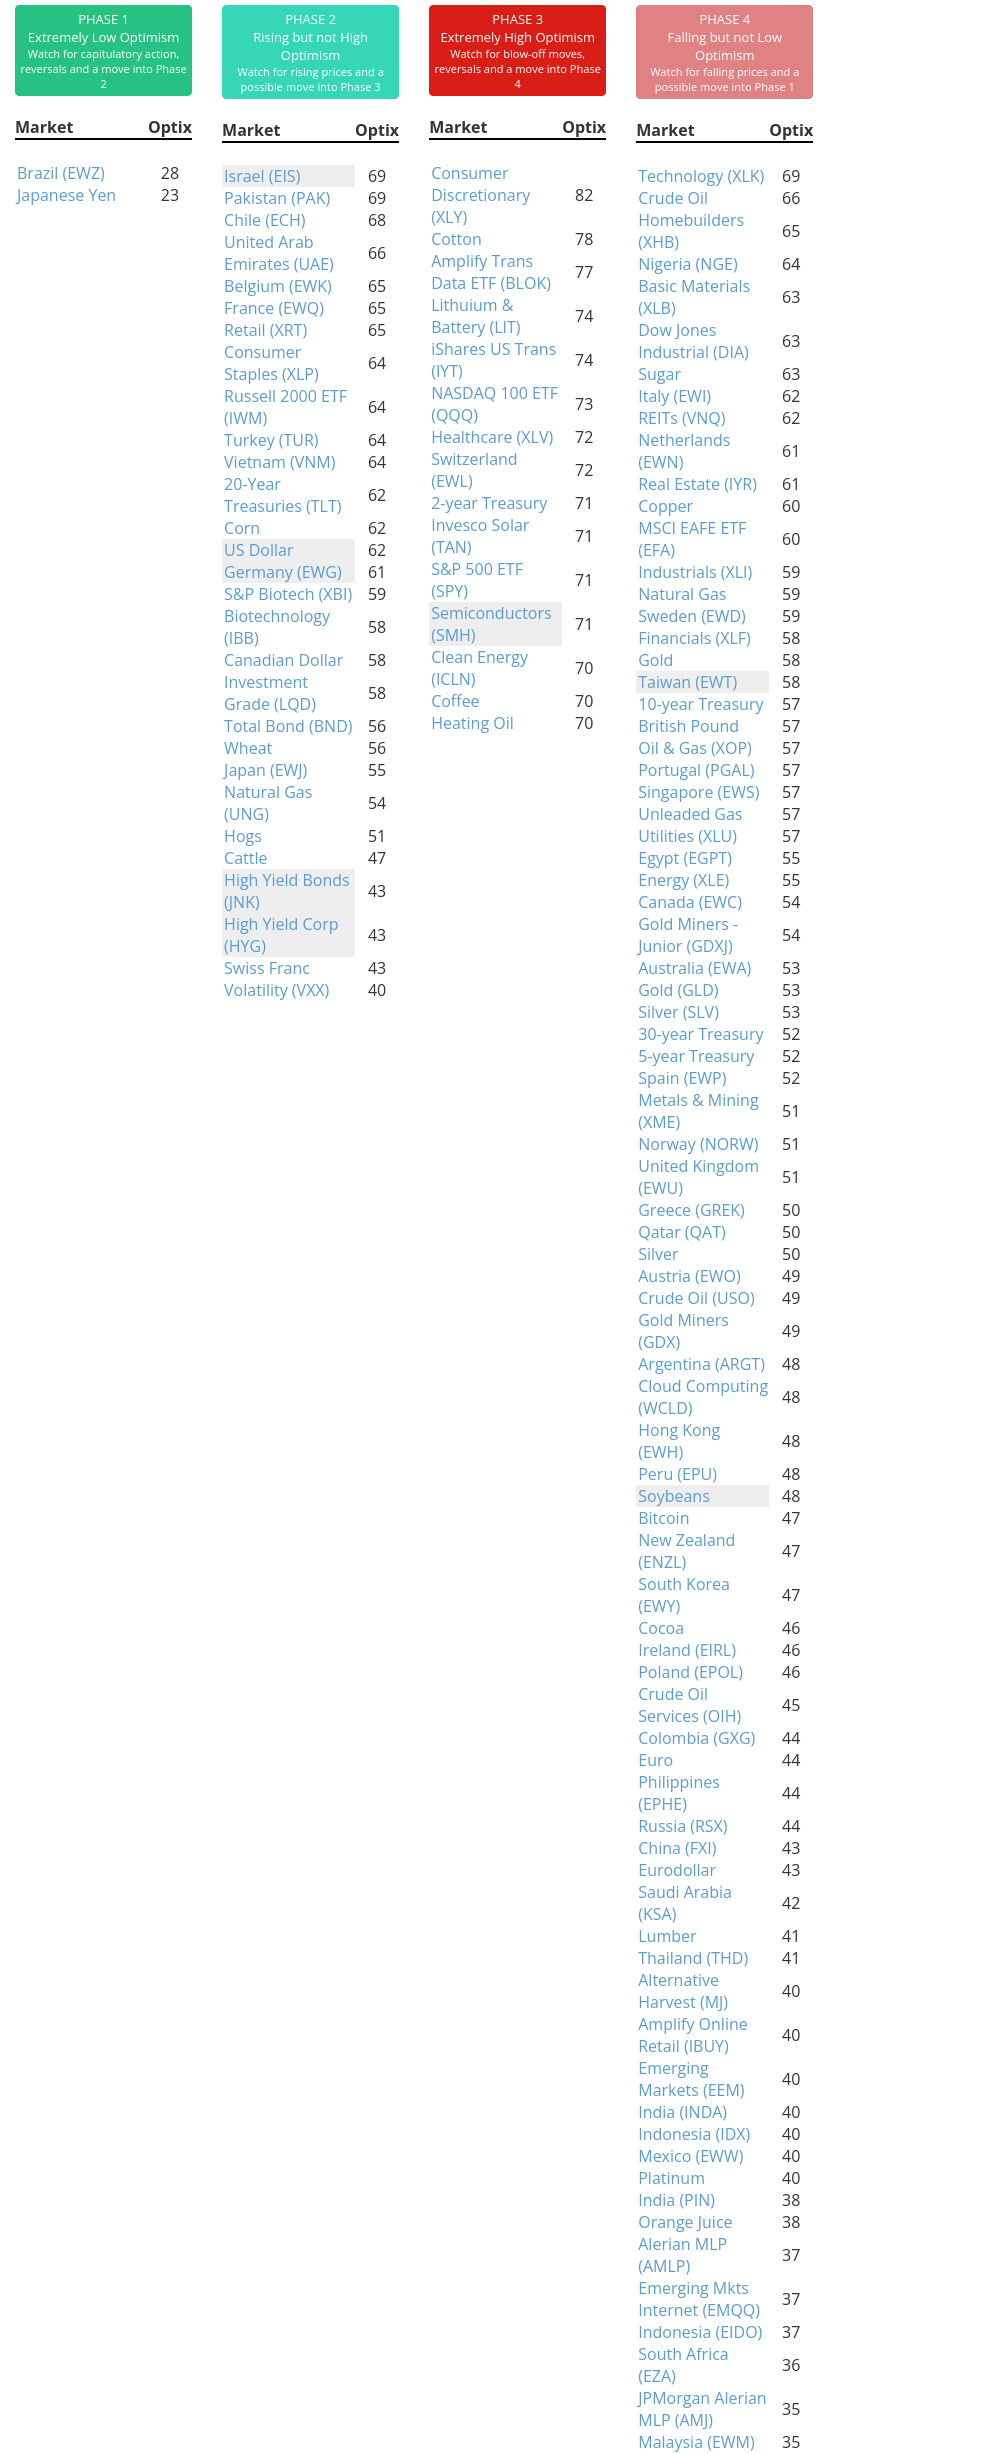
Phase Table
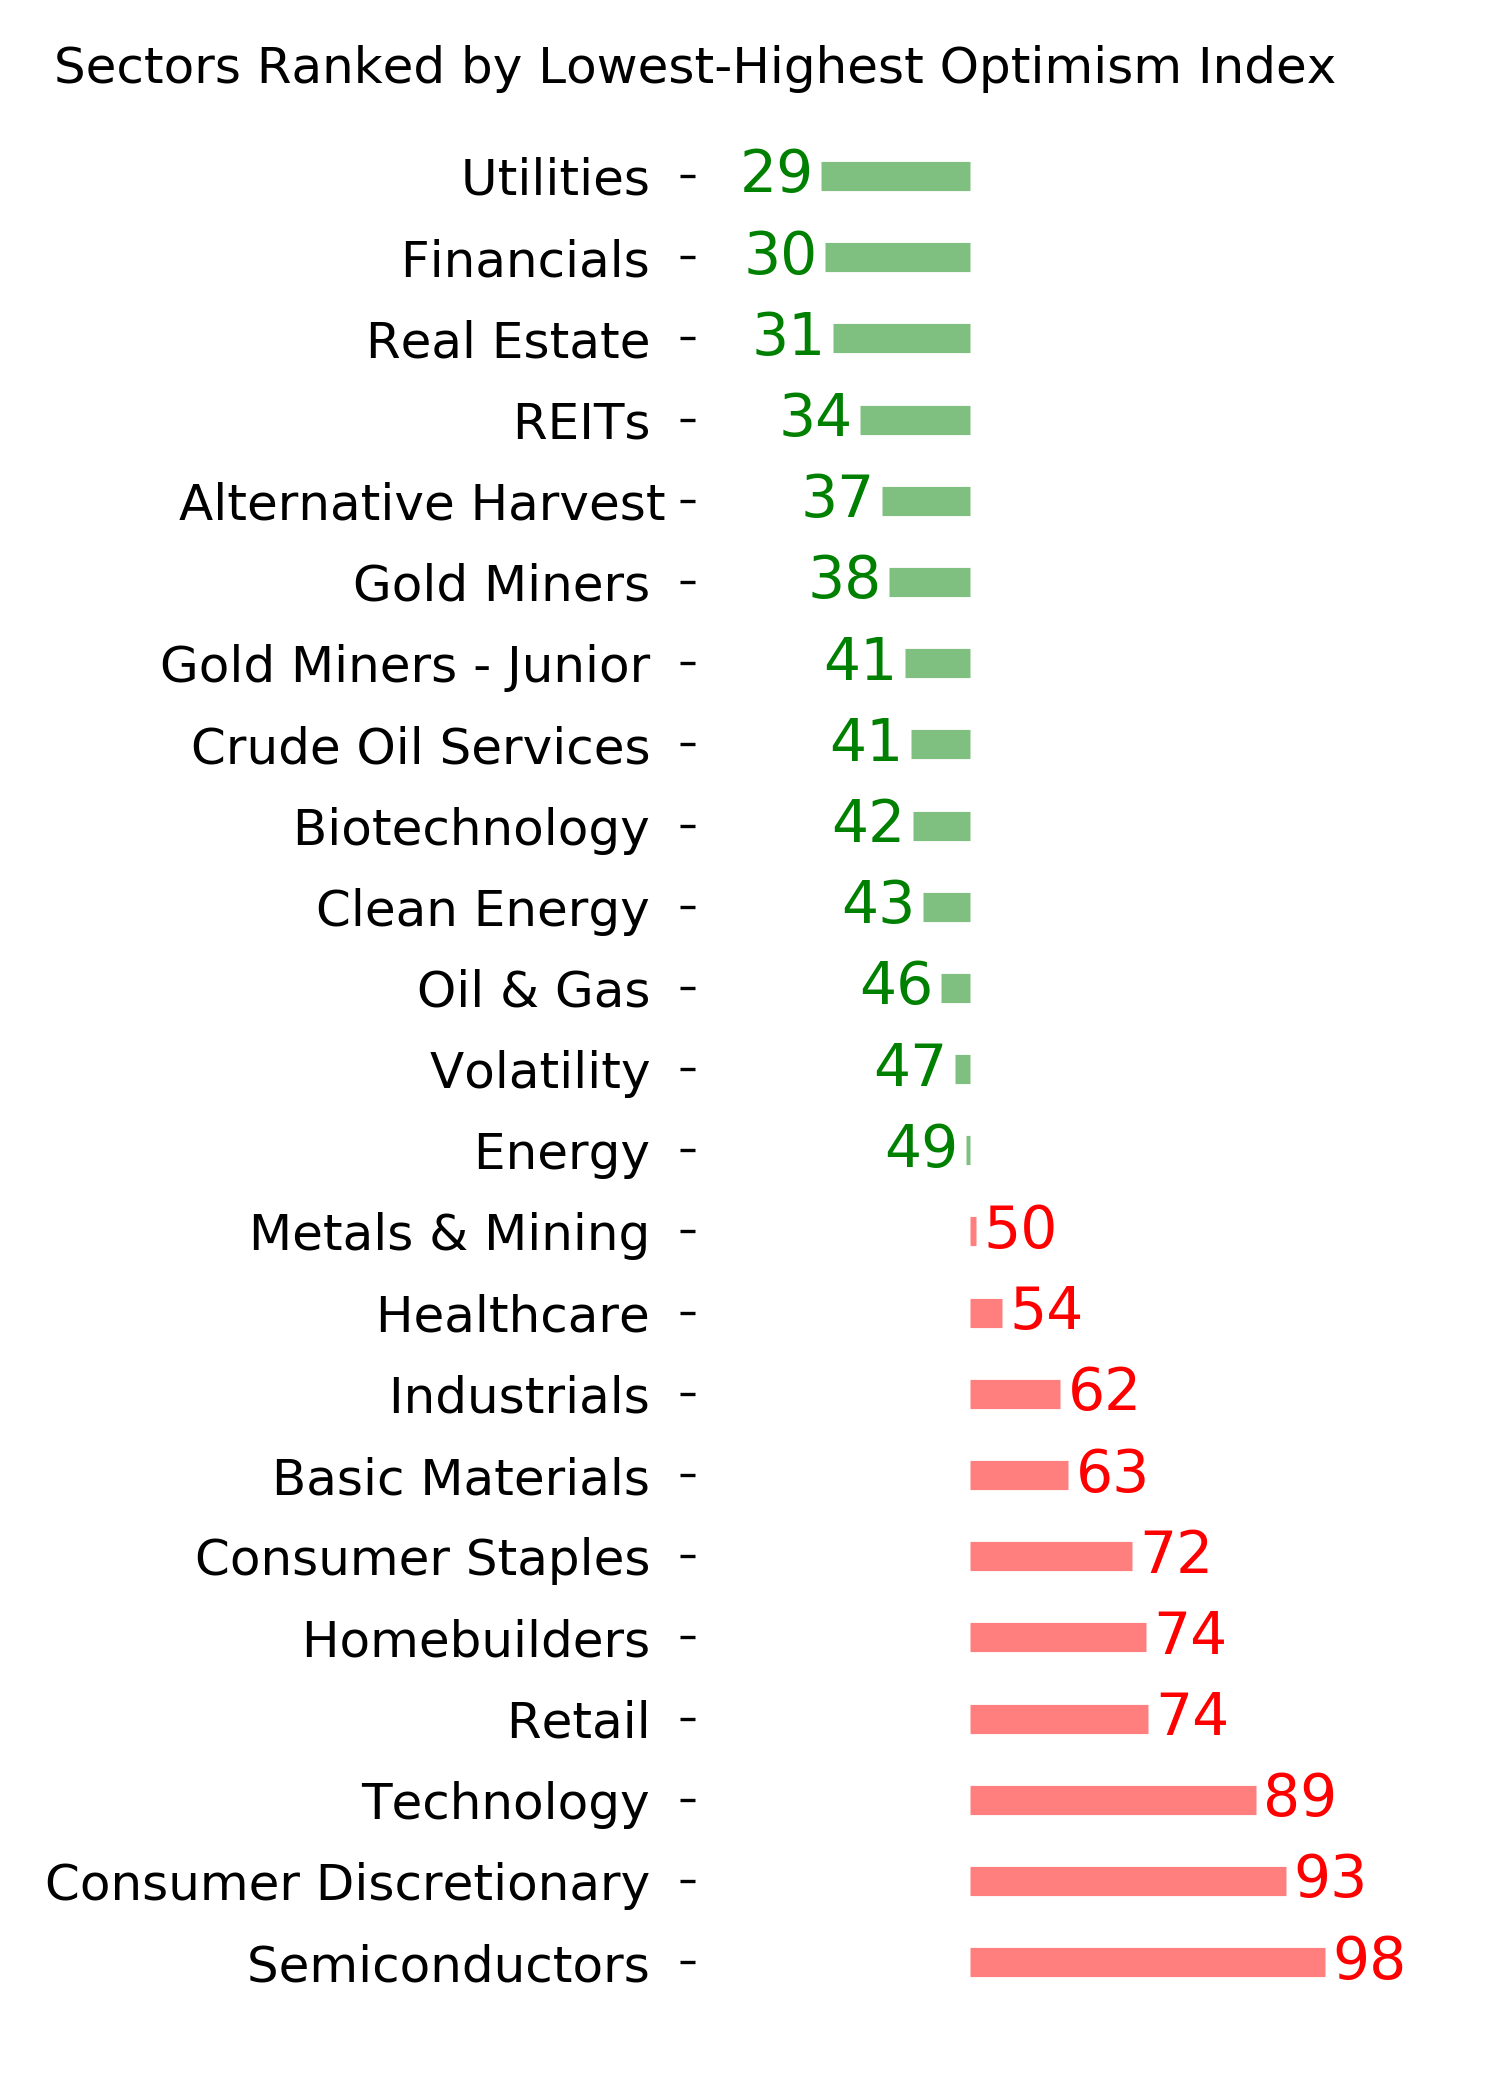
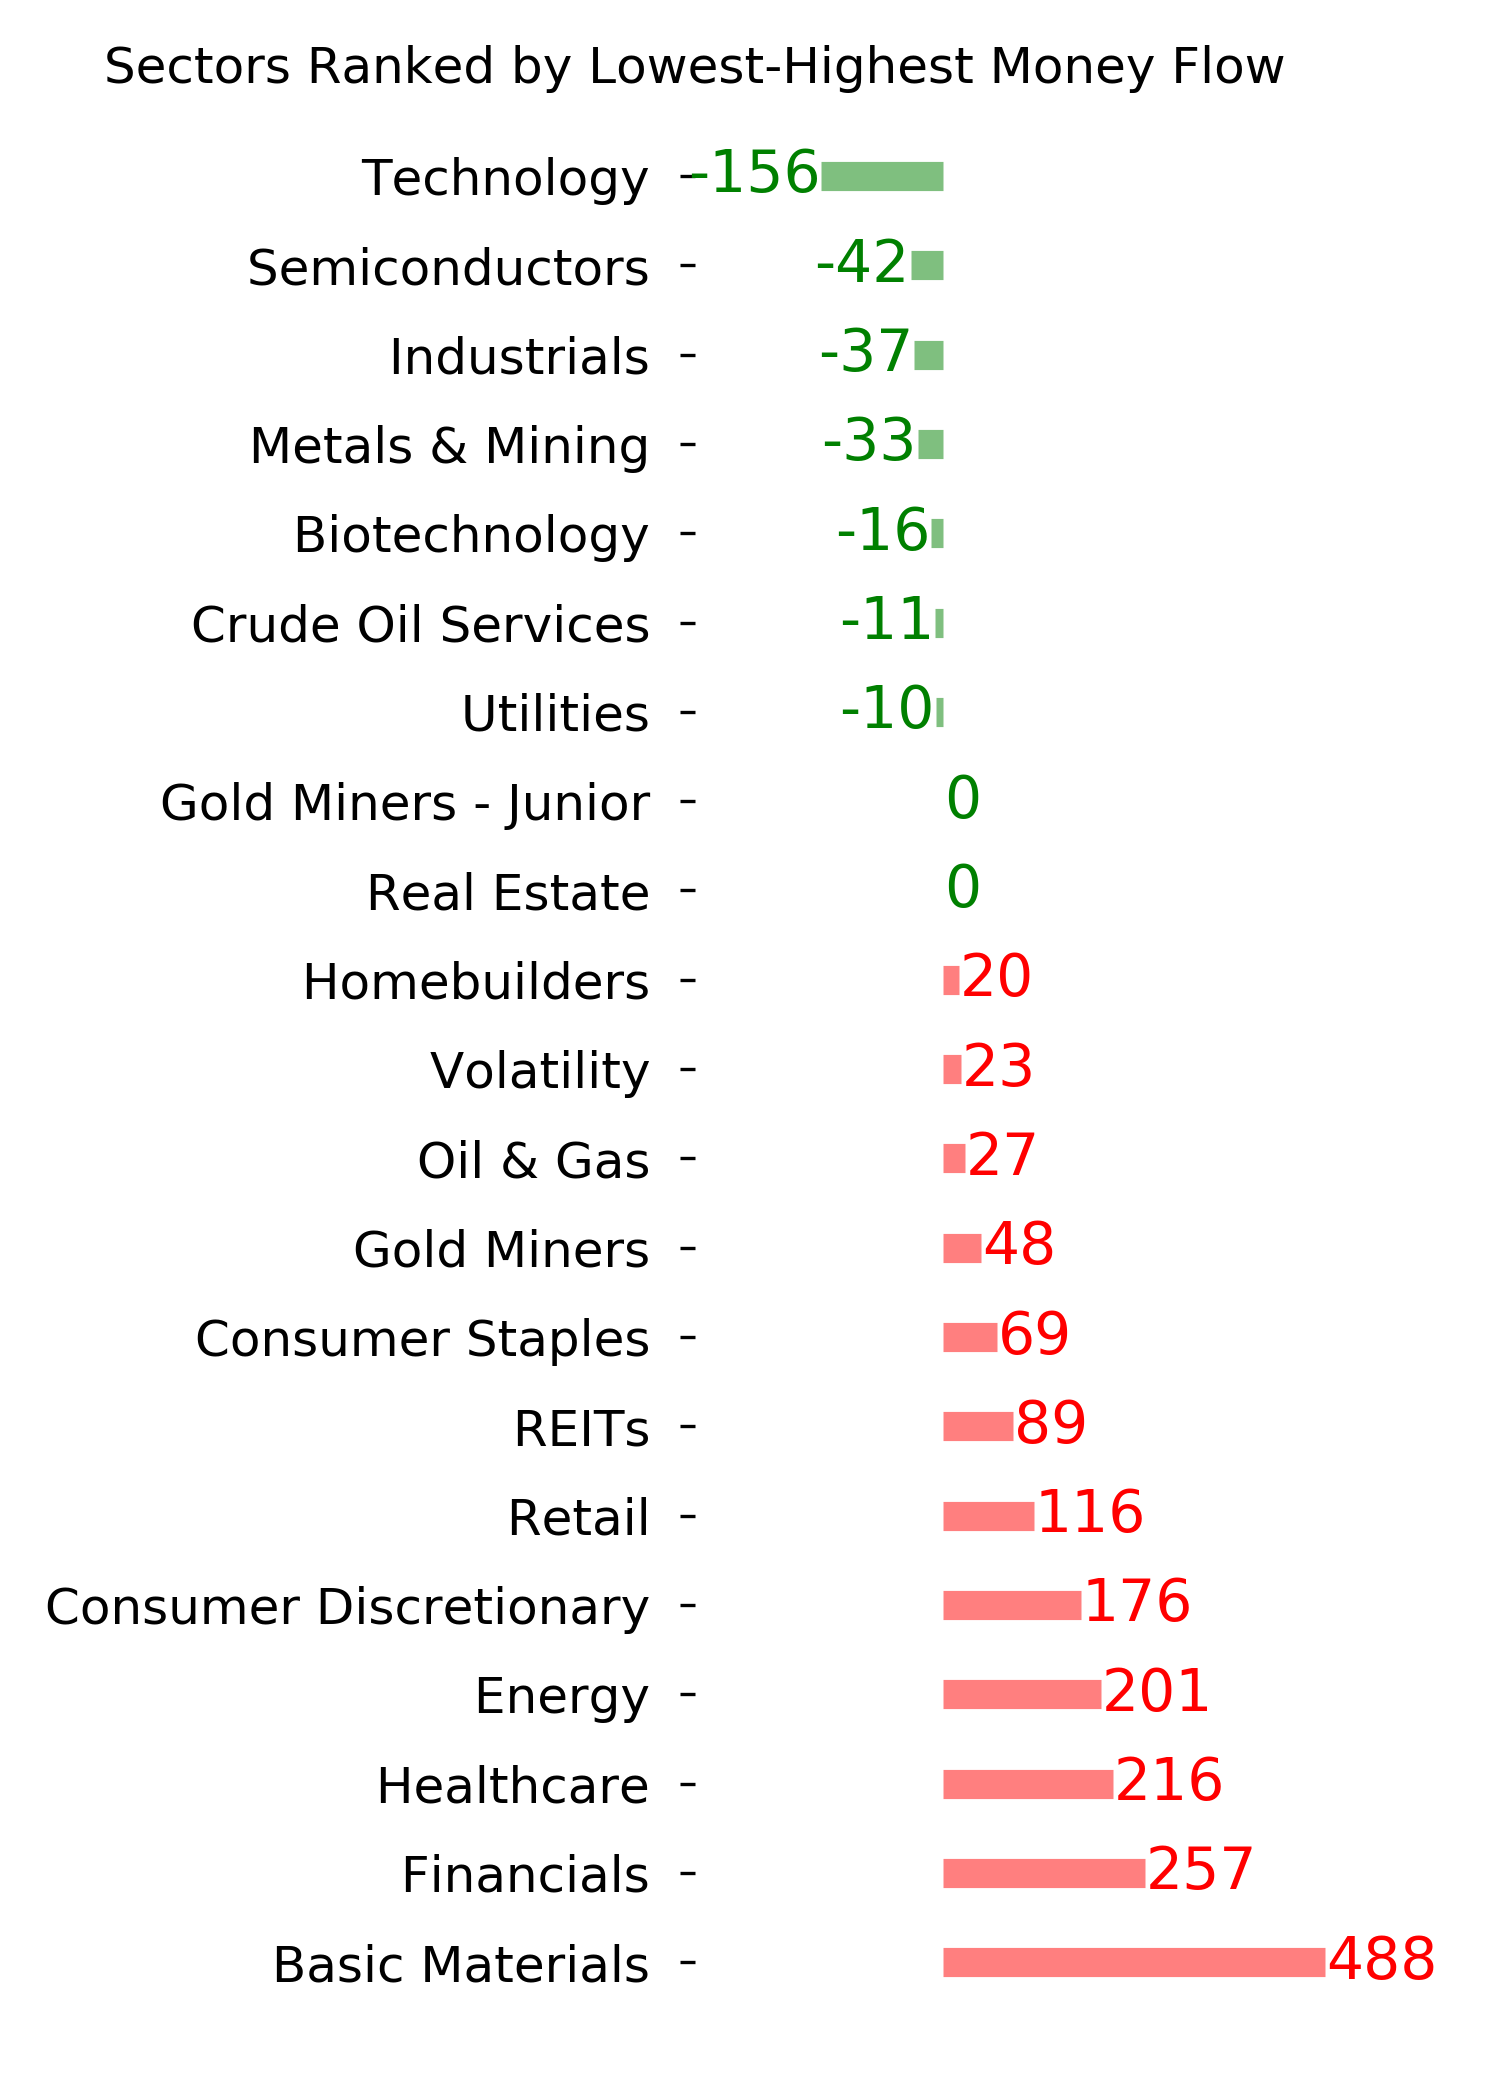
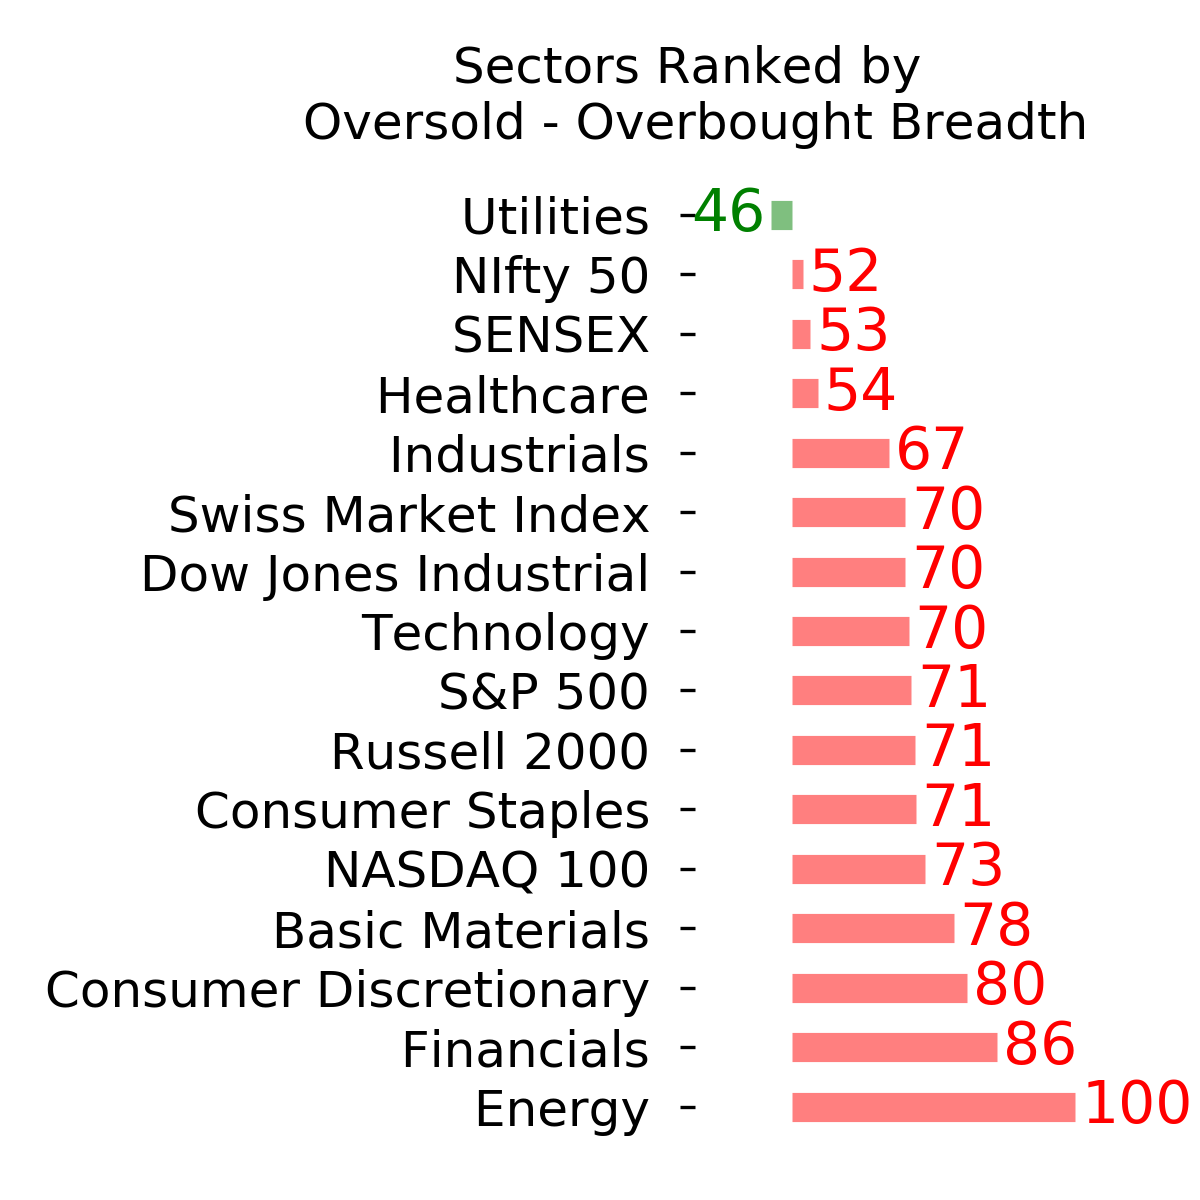
Ranks
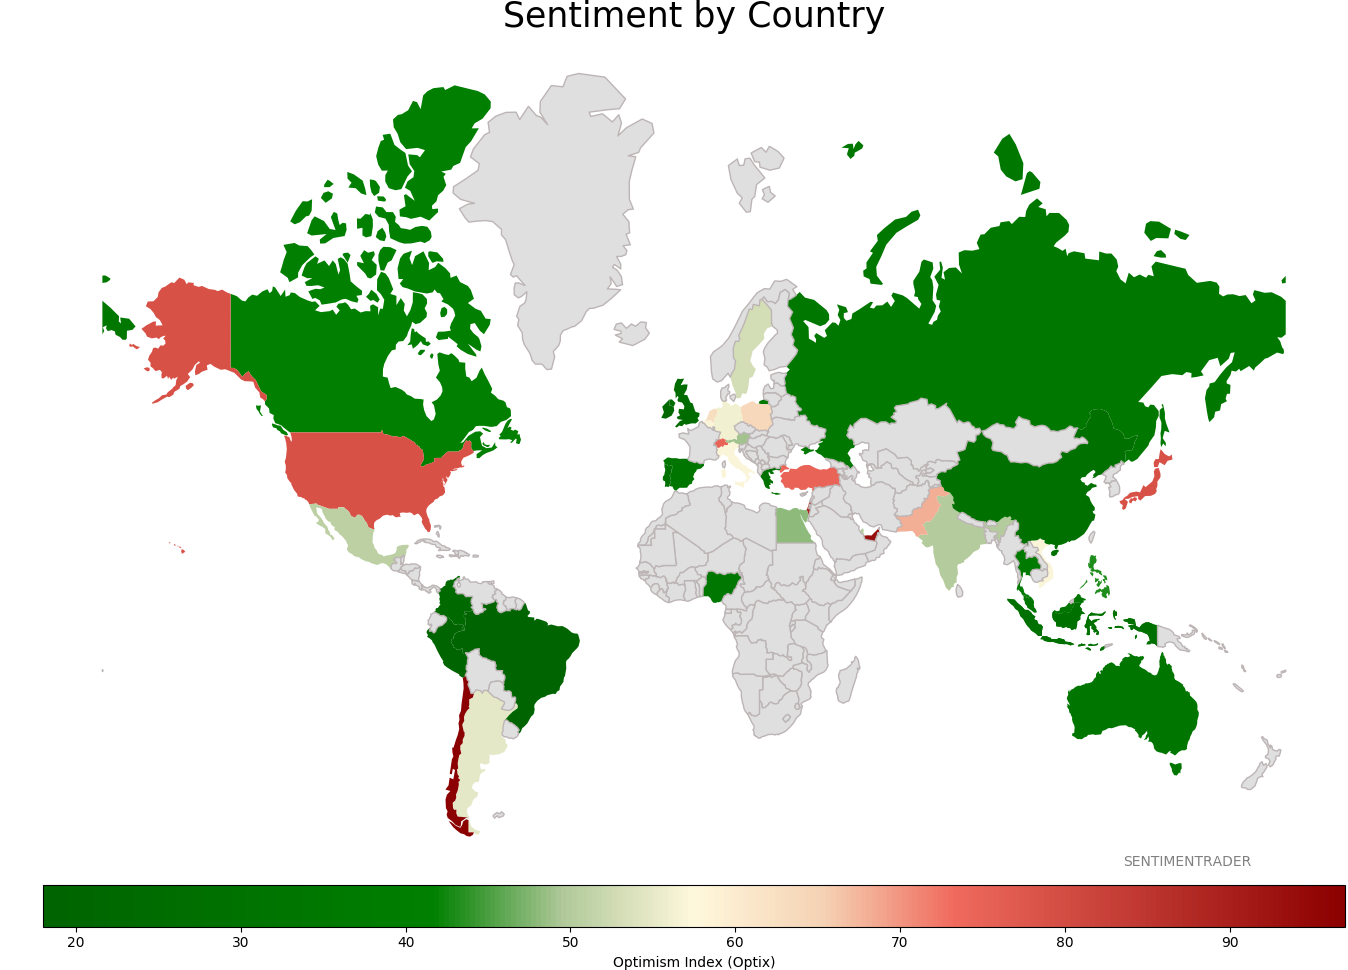
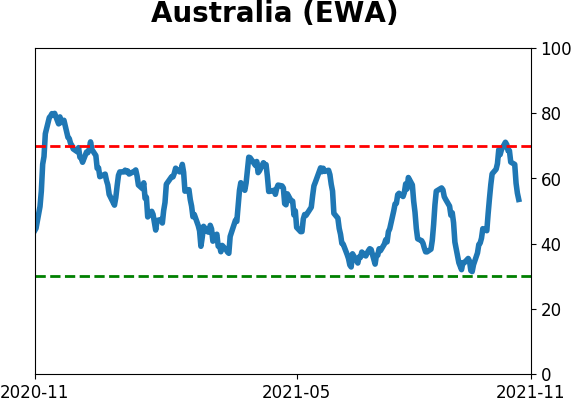
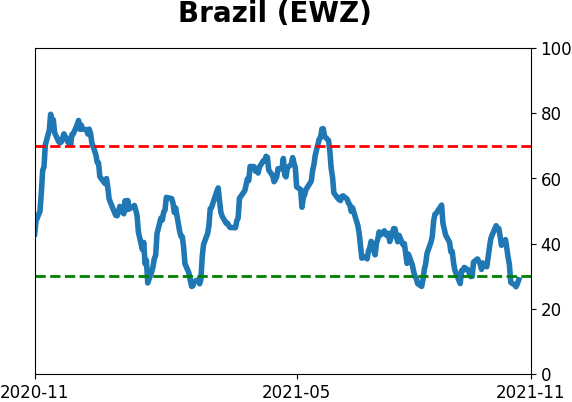
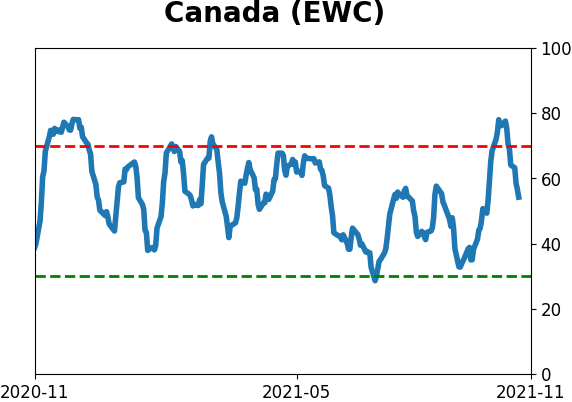
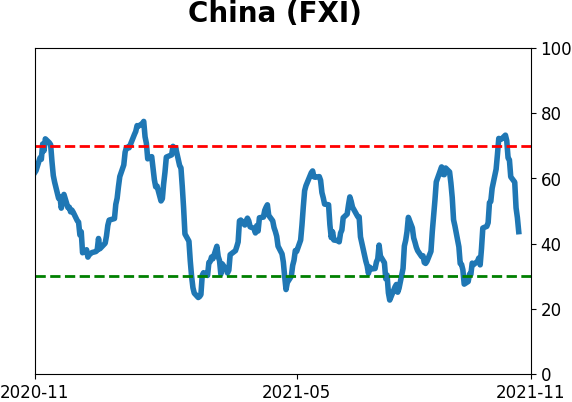
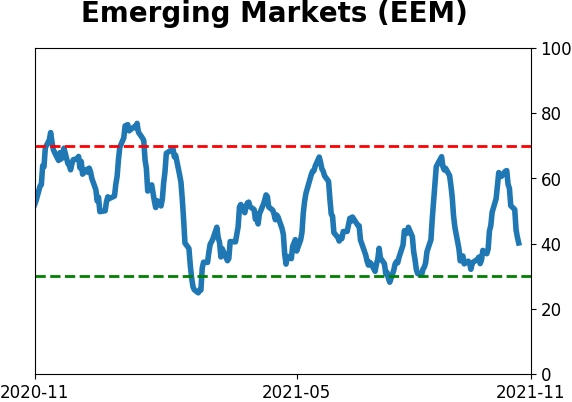
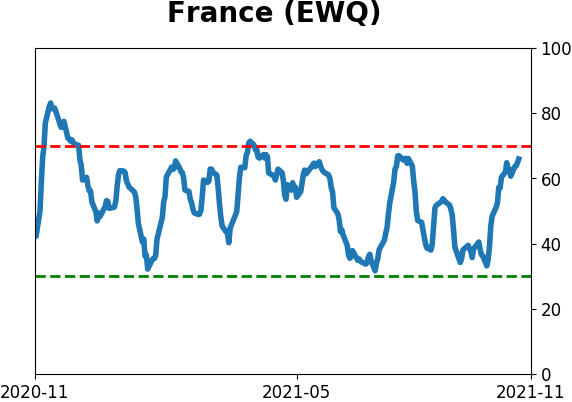
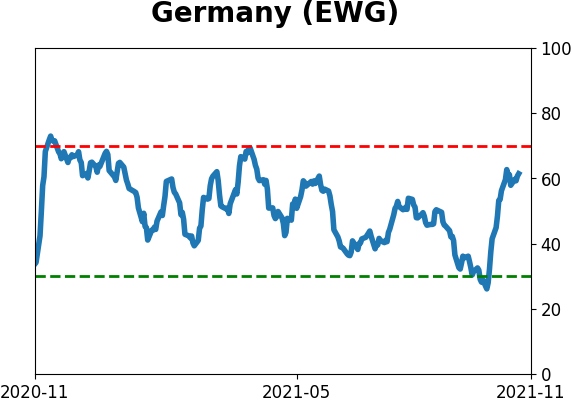
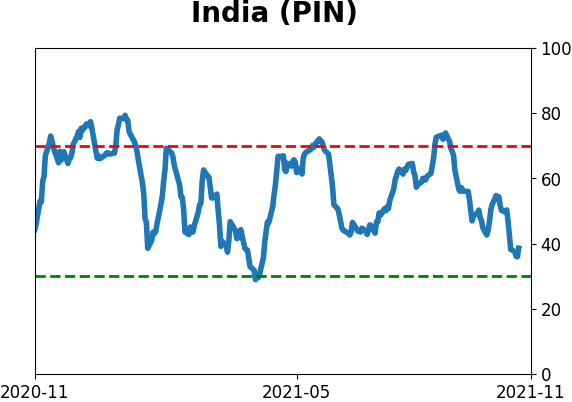
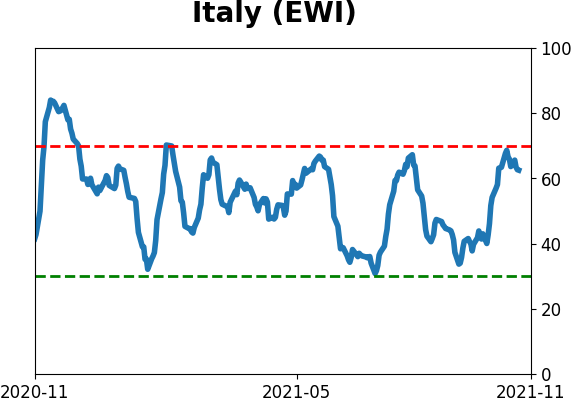
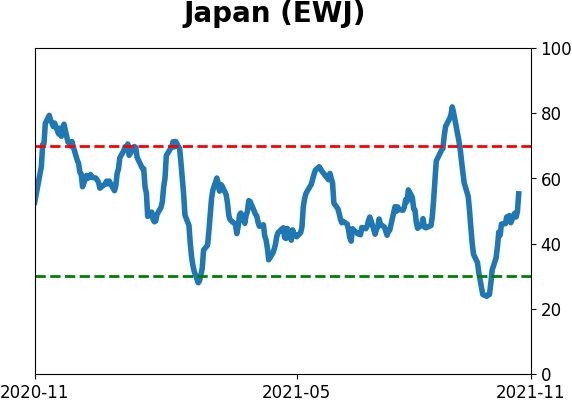
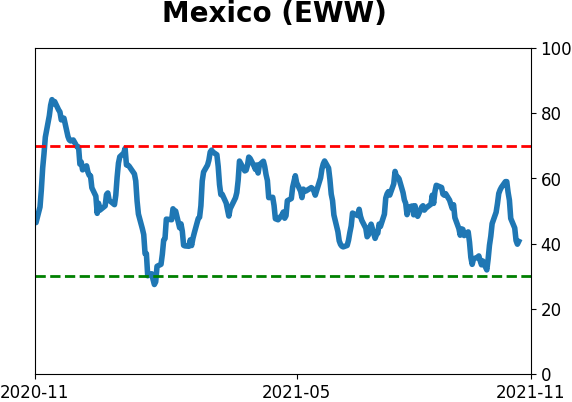
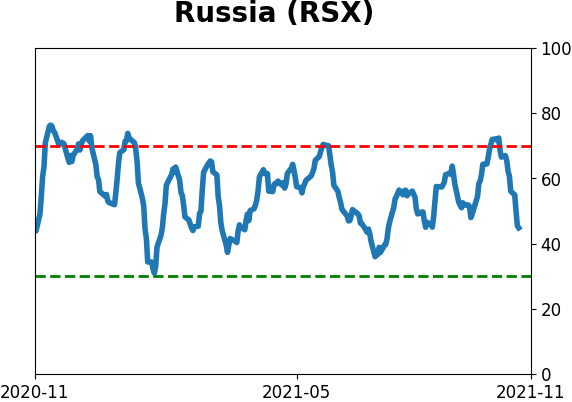
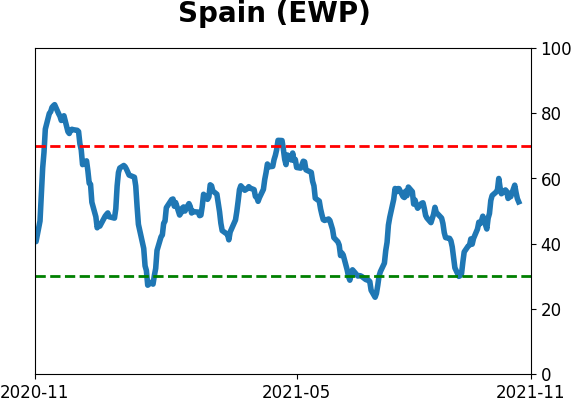
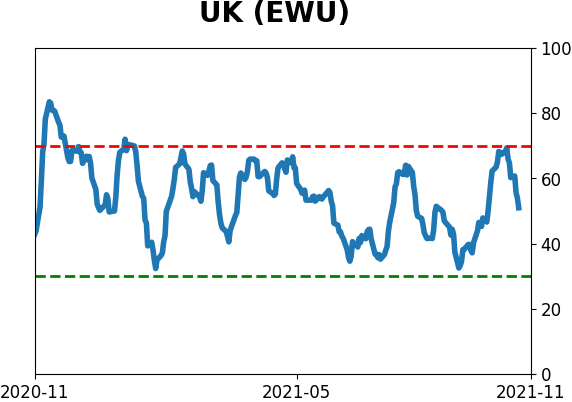
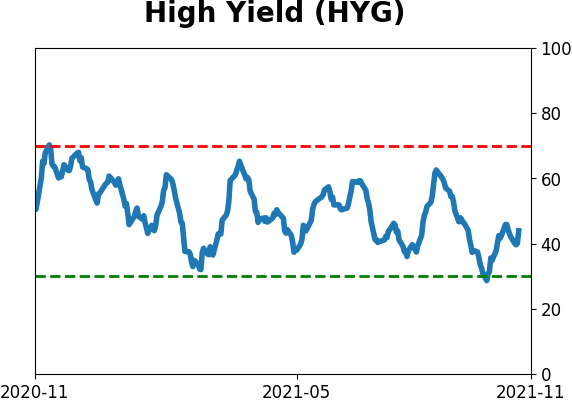
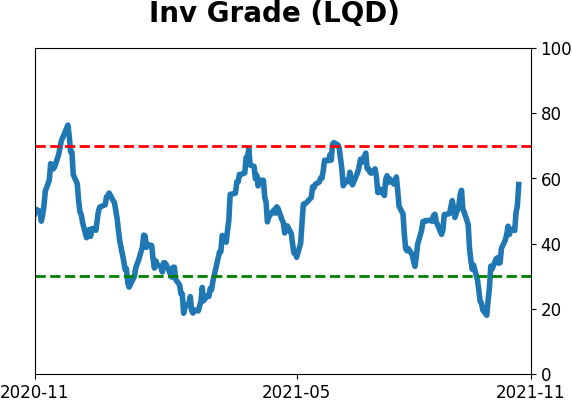
Sentiment Around The World
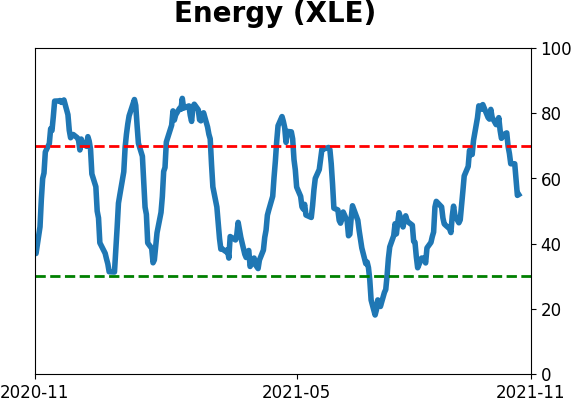
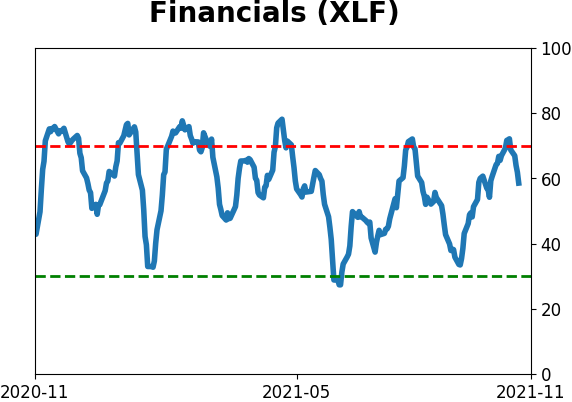
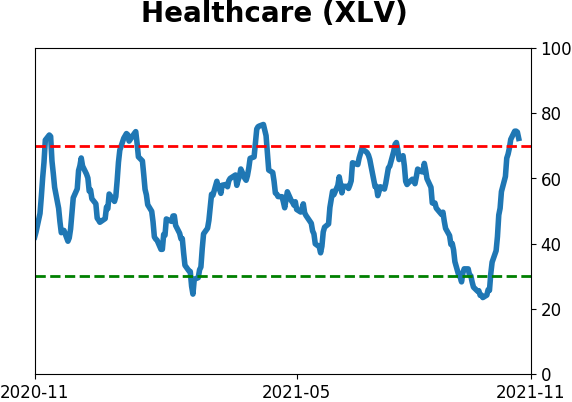
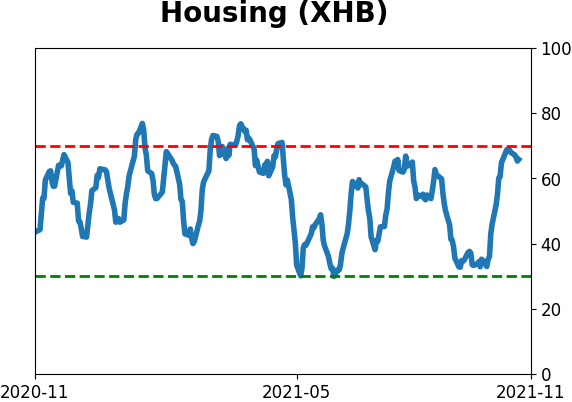
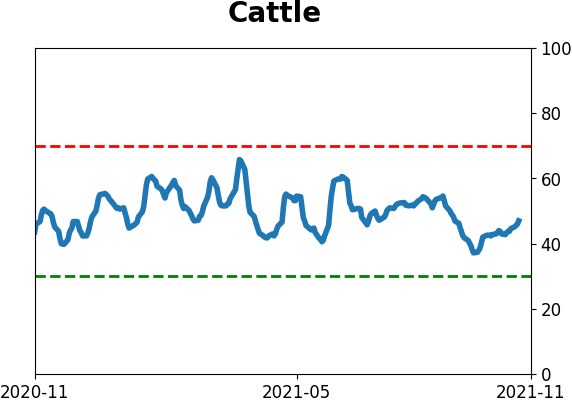
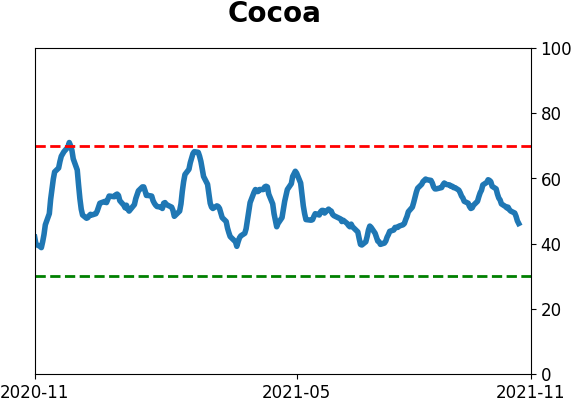
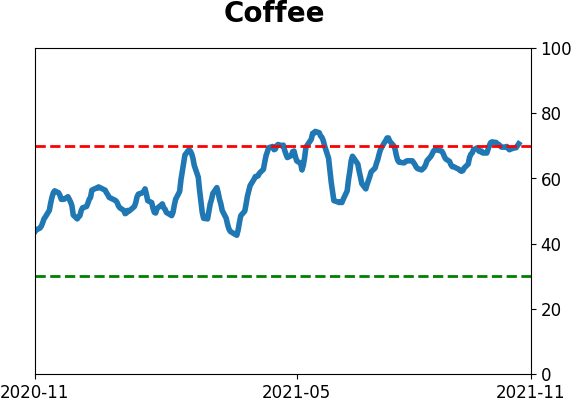
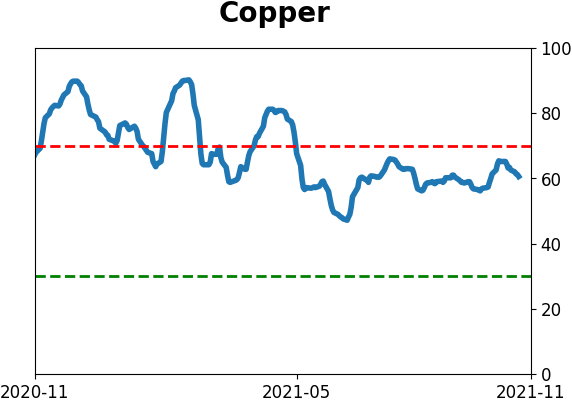
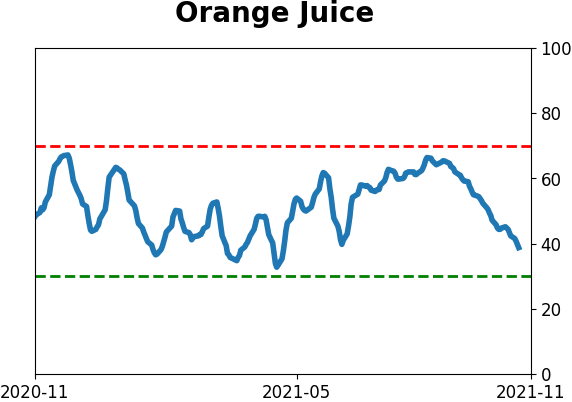
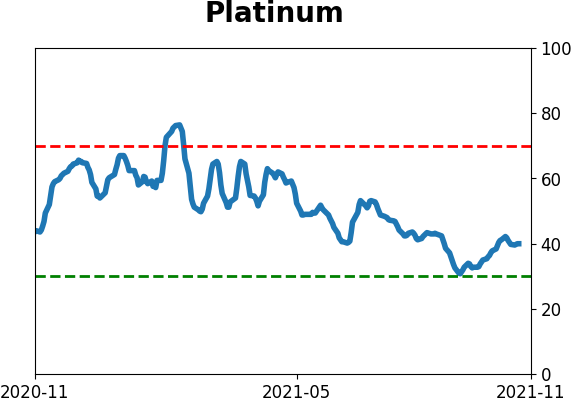
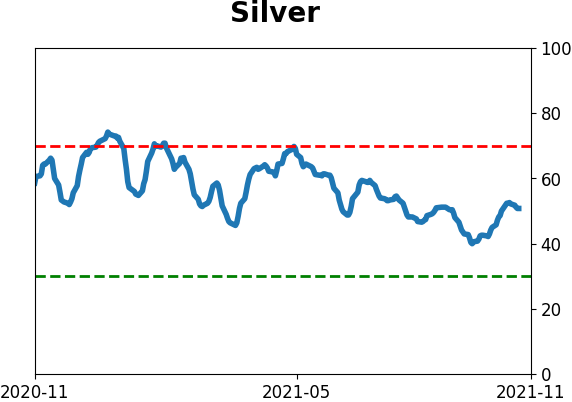
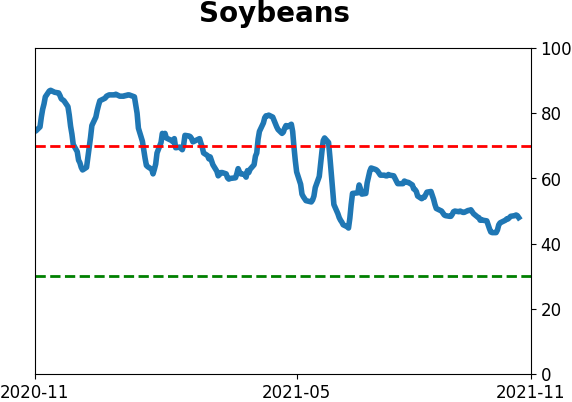
Optimism Index Thumbnails
|
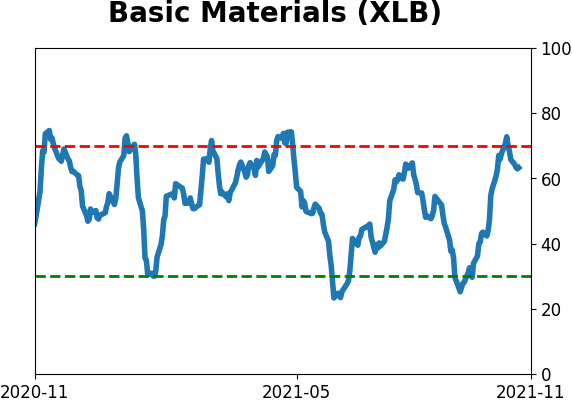
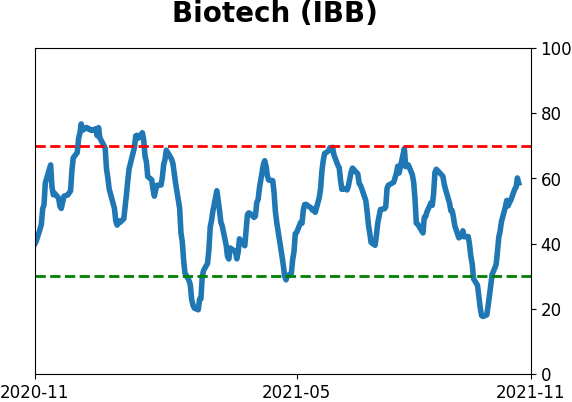
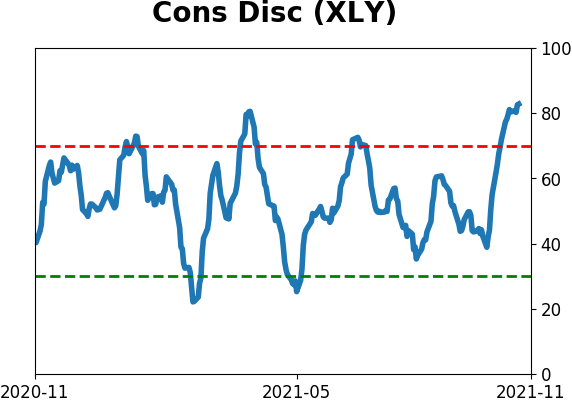
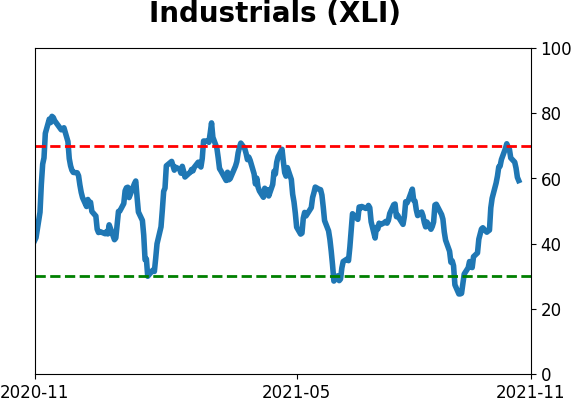
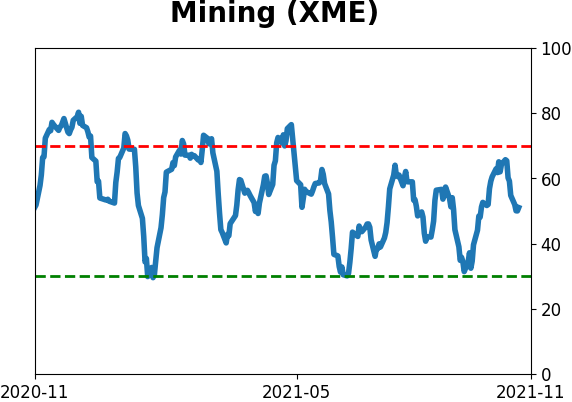
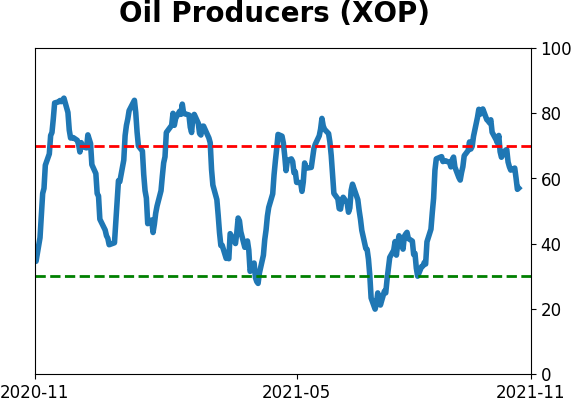
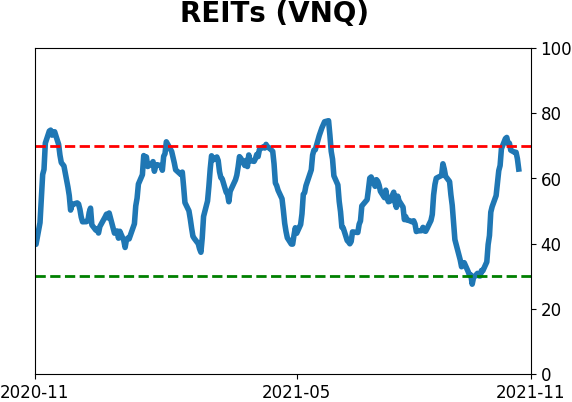
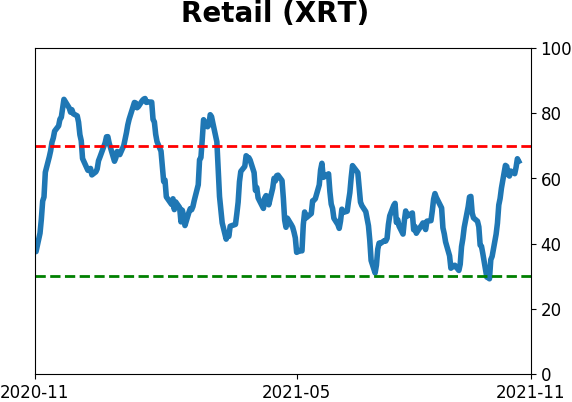
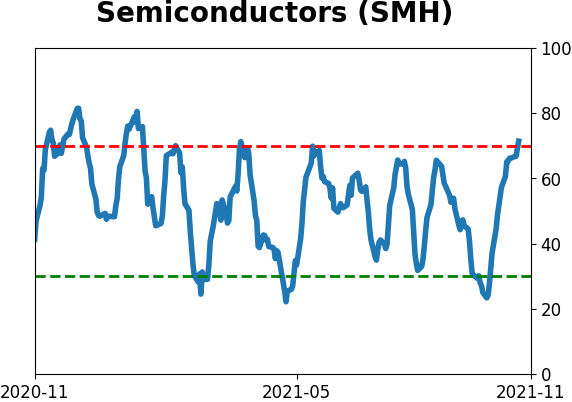
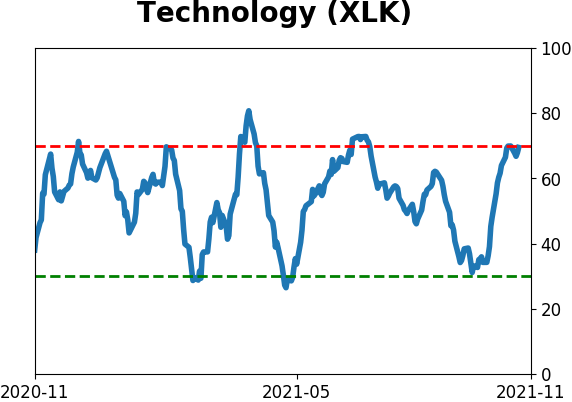
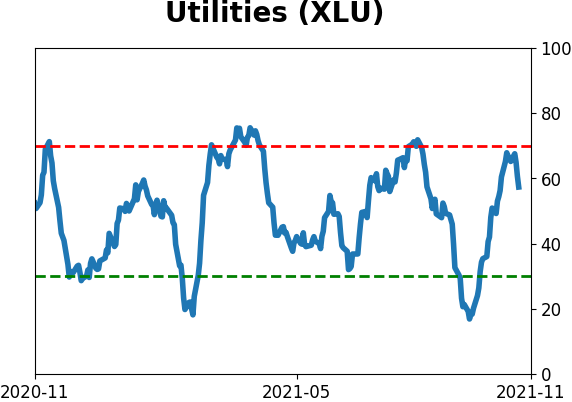
Sector ETF's - 10-Day Moving Average
|
|
|
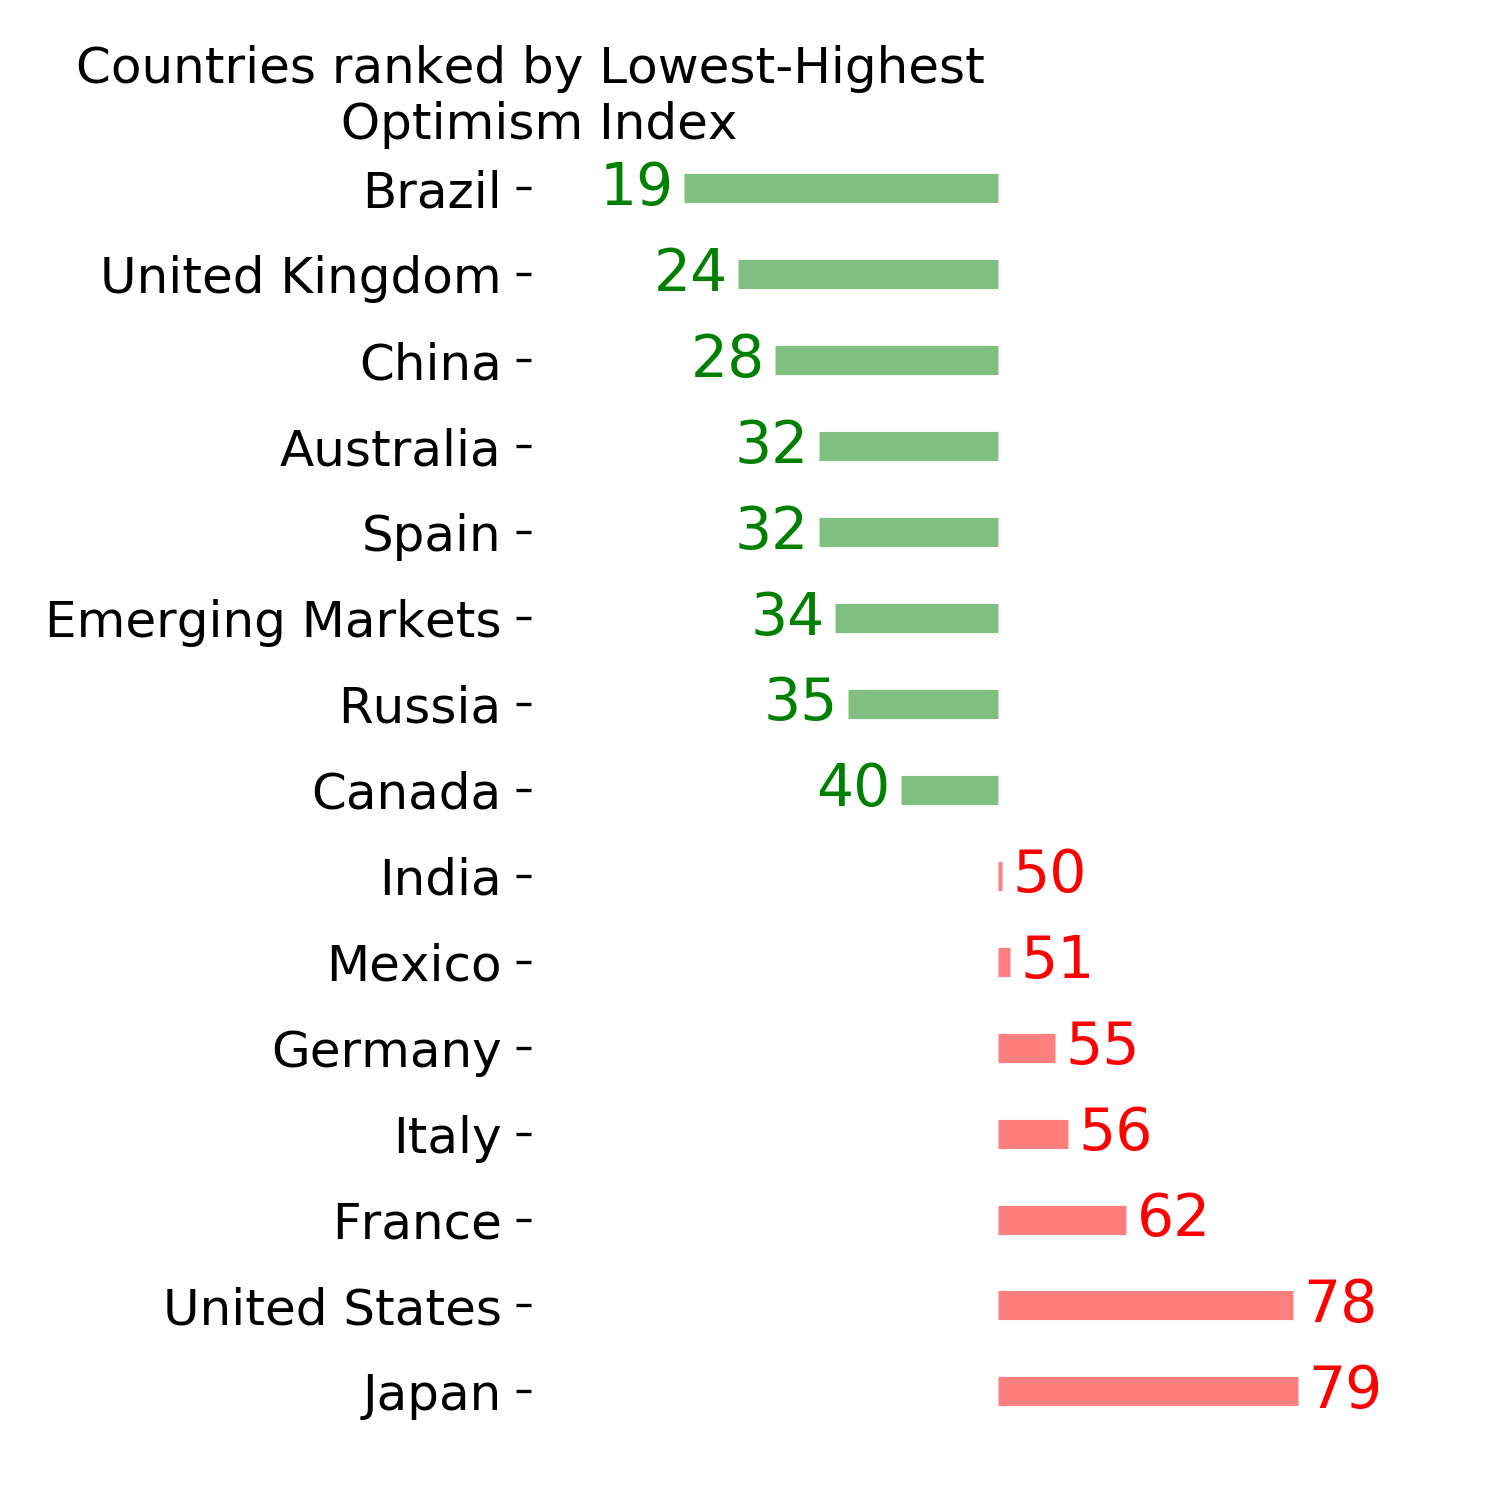
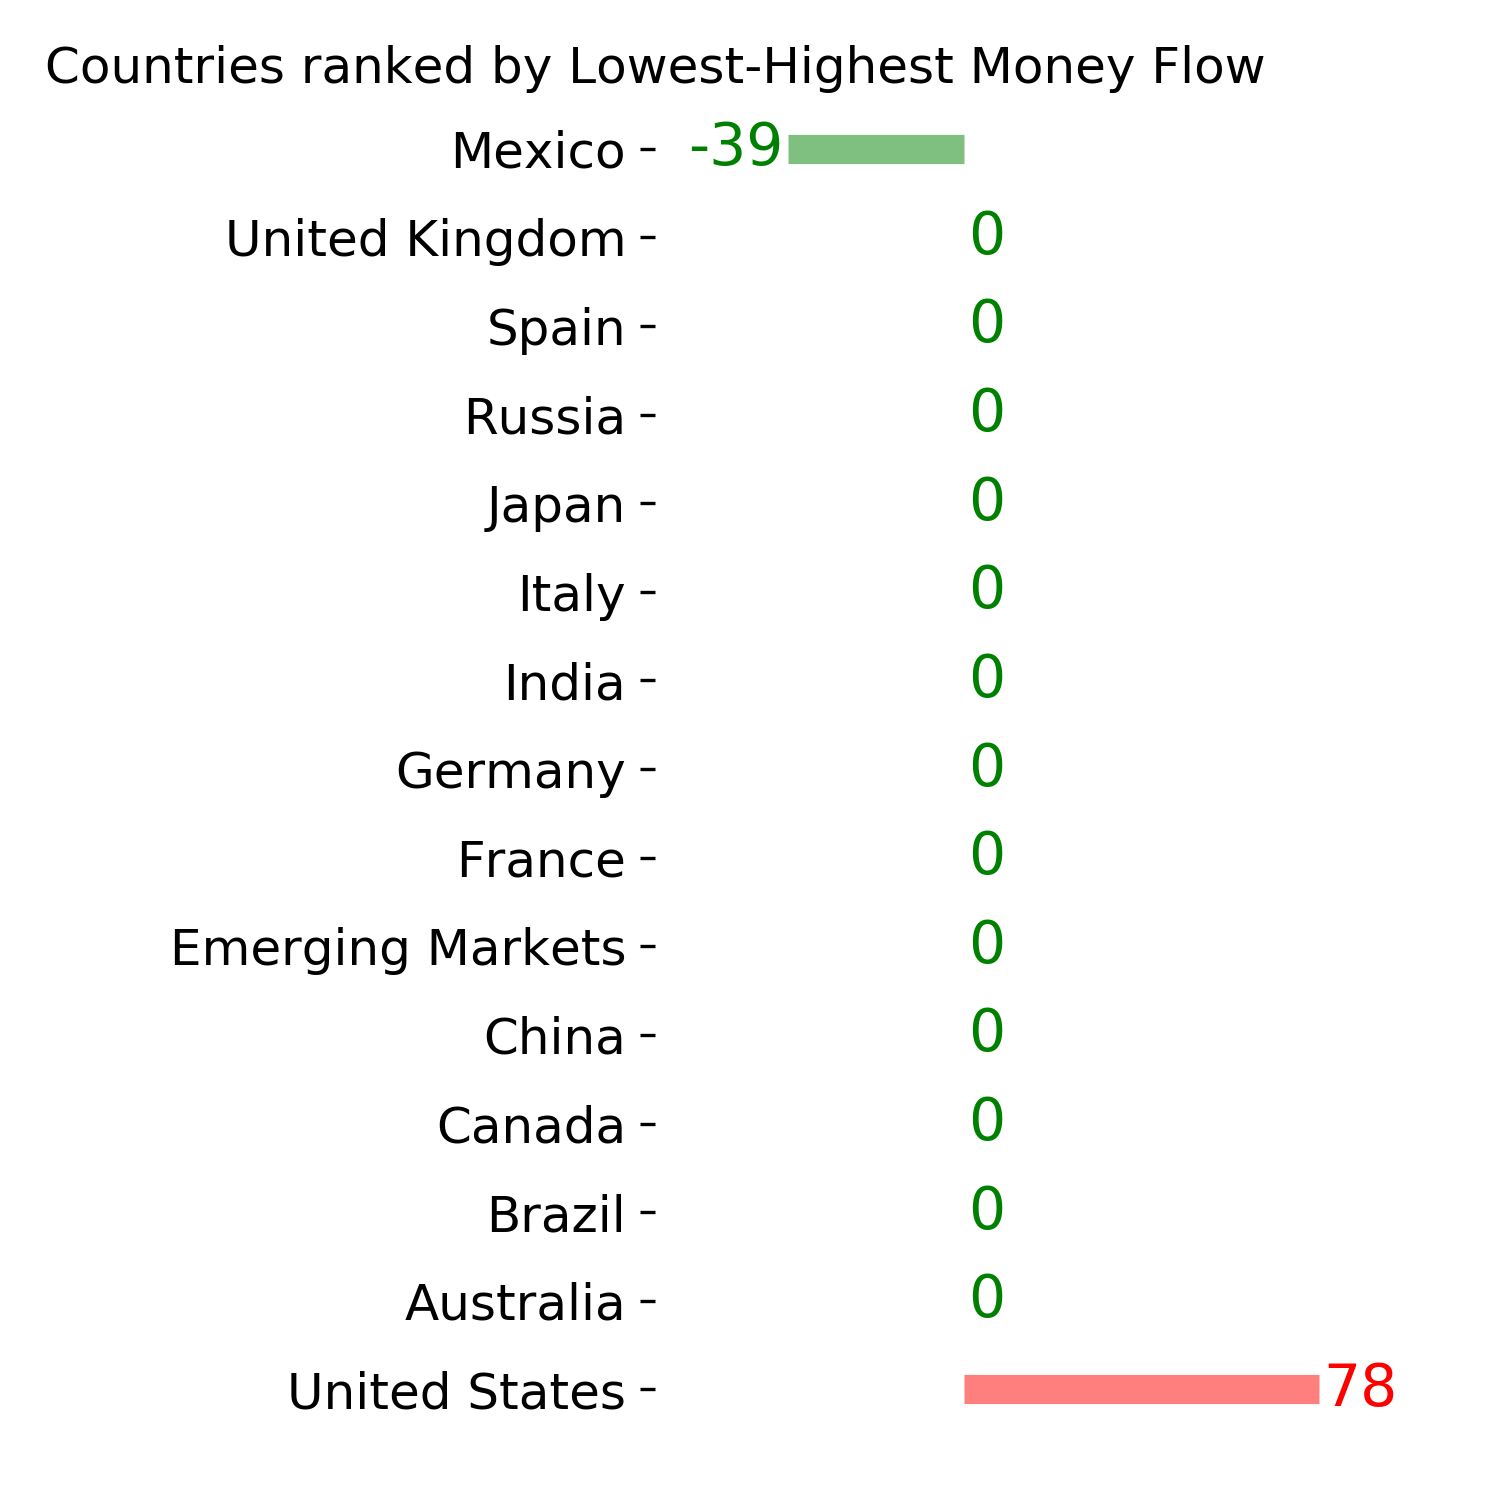
Country ETF's - 10-Day Moving Average
|
|
|
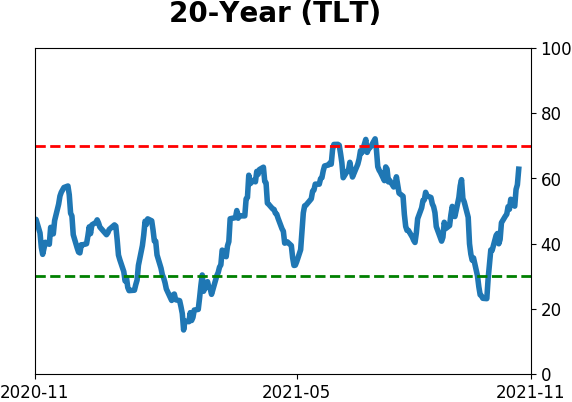
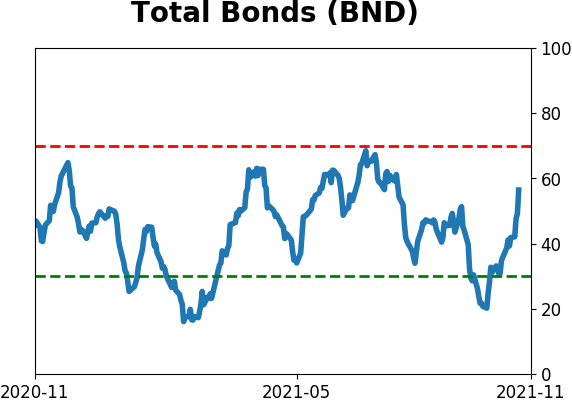
Bond ETF's - 10-Day Moving Average
|
|
|
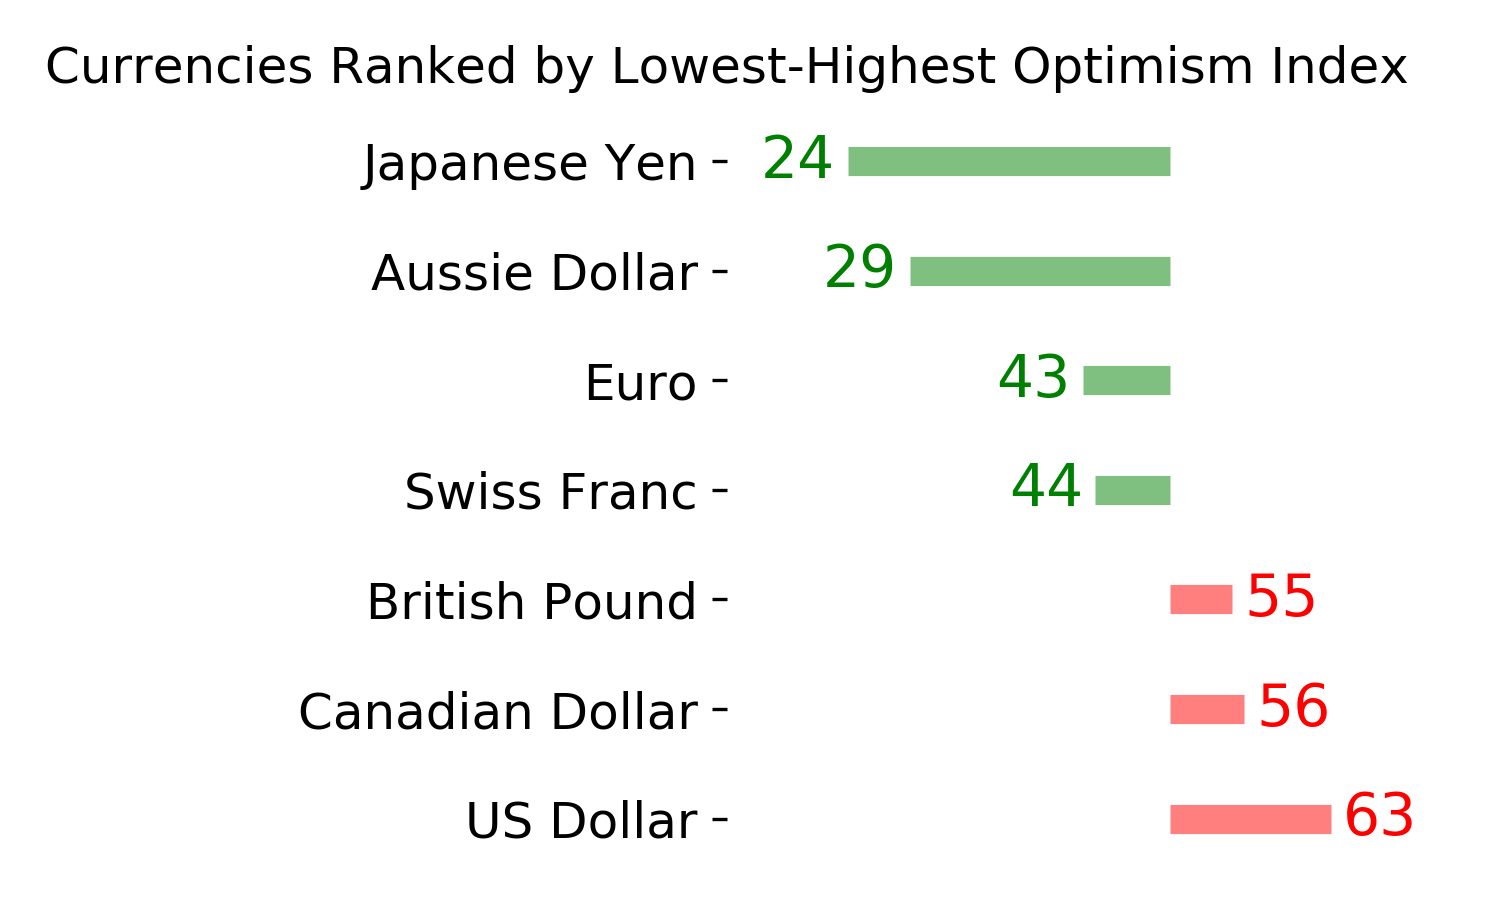
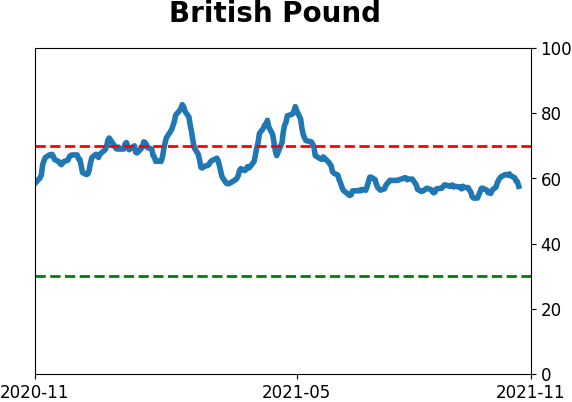
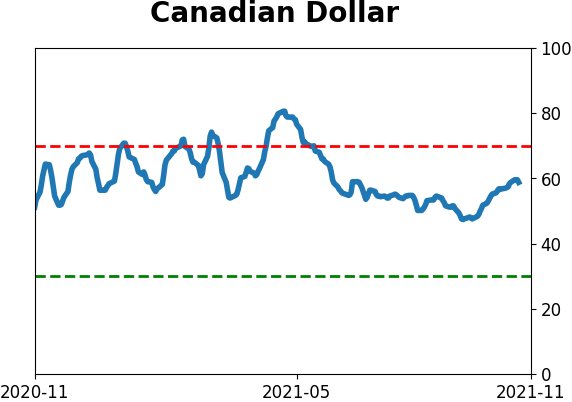
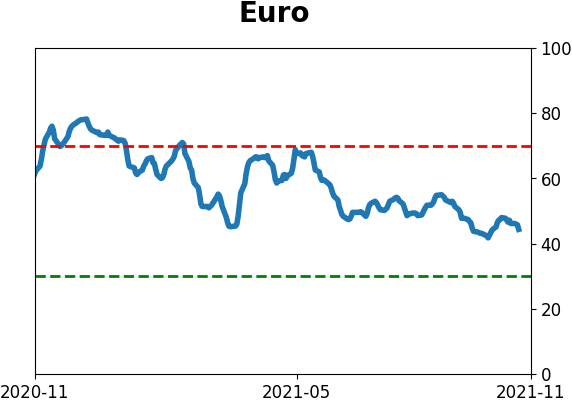
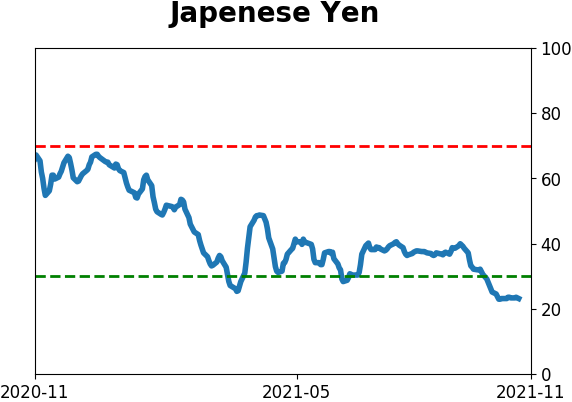
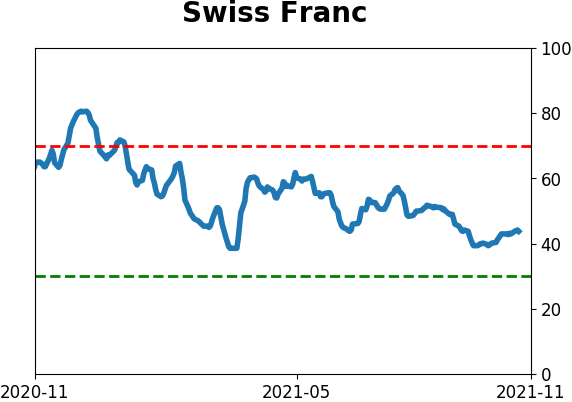
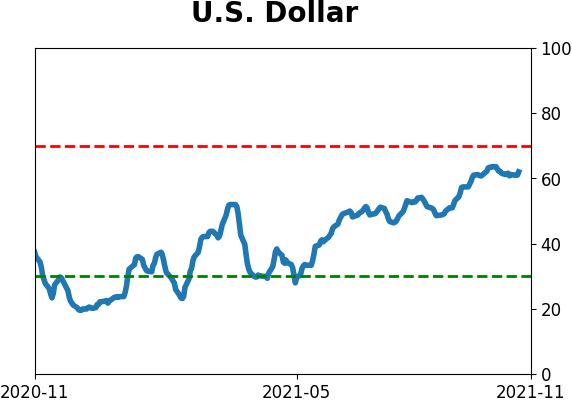
Currency ETF's - 5-Day Moving Average
|
|
|
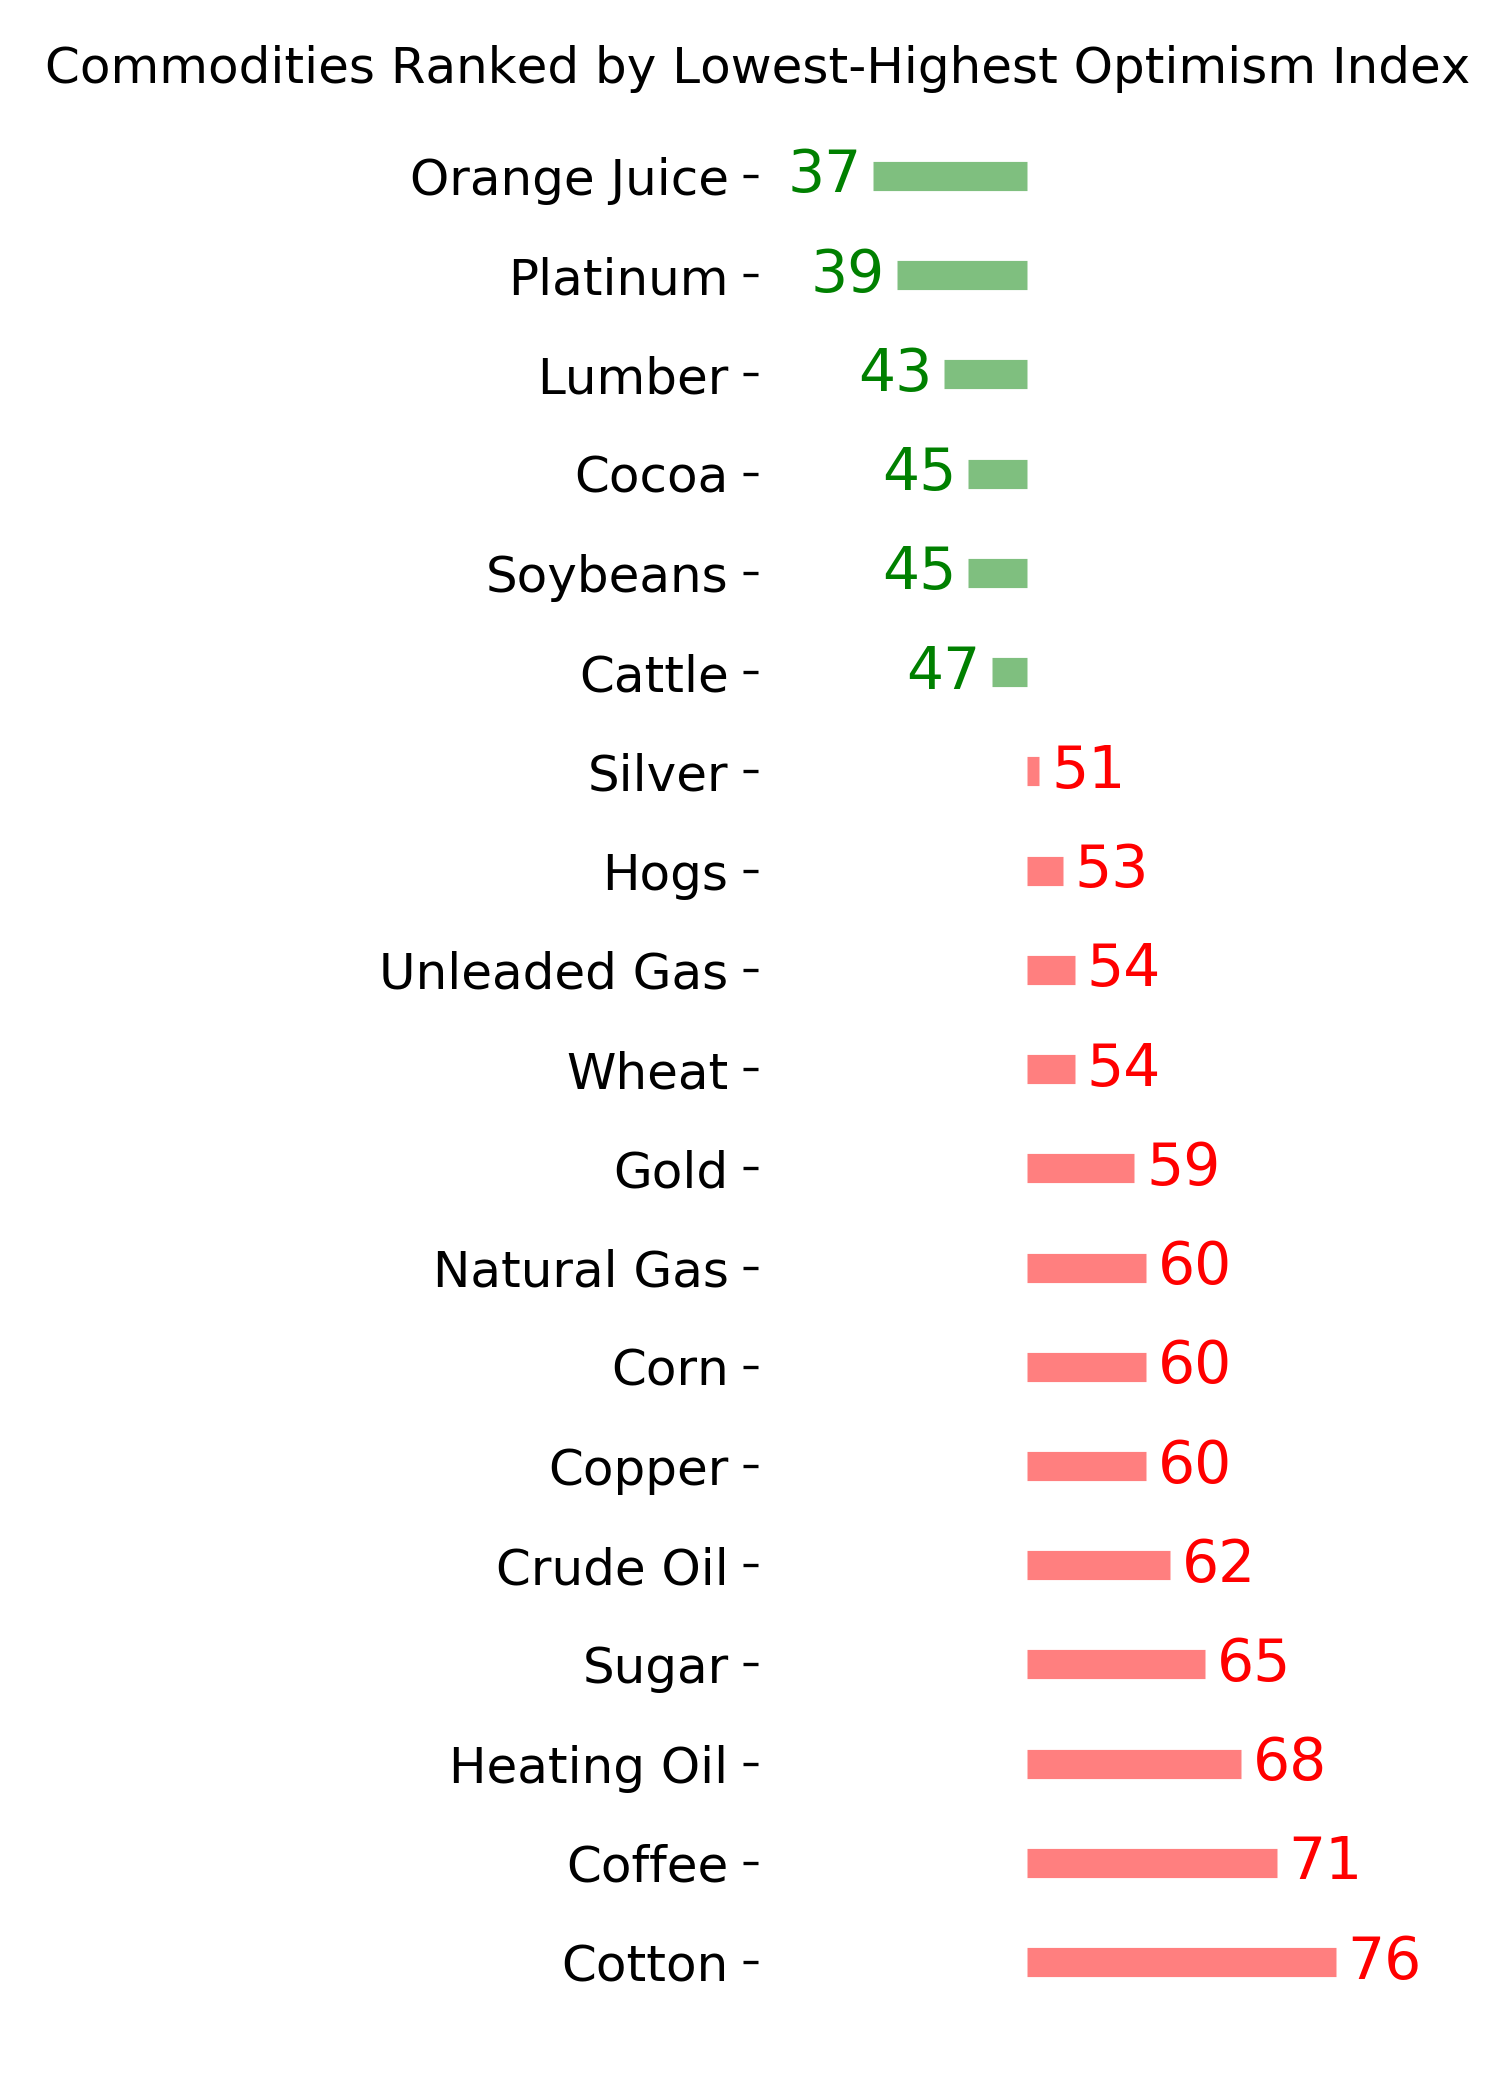
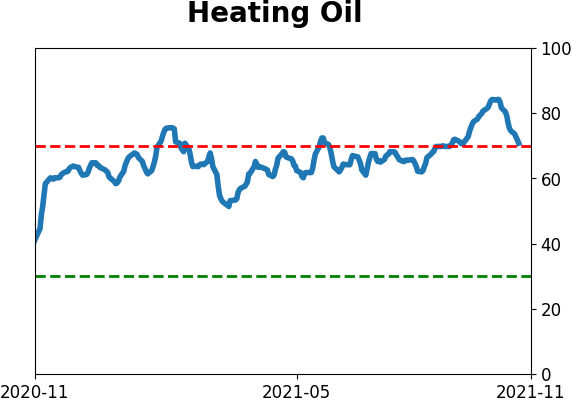
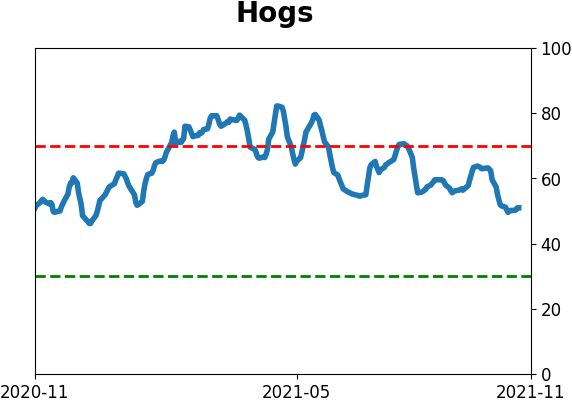
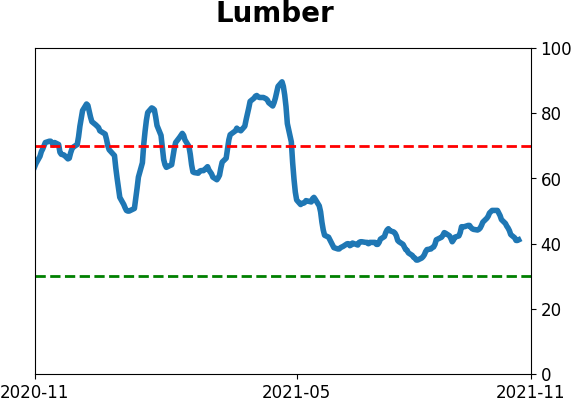
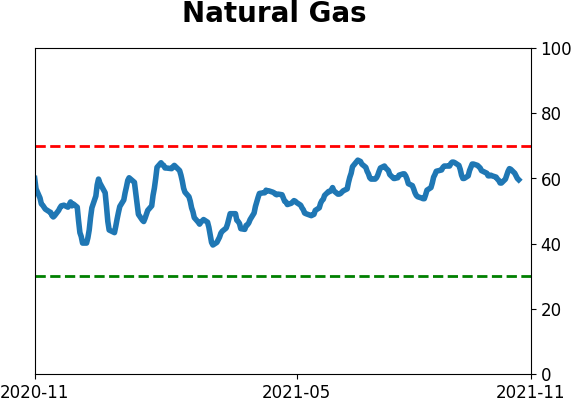
Commodity ETF's - 5-Day Moving Average
|
|