Headlines
|
|
Small Caps Make a Big Move:
For the first time in more than 6 months, the small-cap Russell 2000 has broken out to a multi-year high. The index has a strong tendency to keep rising, with low risk, and bring the S&P 500 along for the ride.
Bottom Line:
STOCKS: Weak buy
The speculative frenzy in February is wrung out. There are some signs of pessimism, but the most compelling data show that buyers consistently tend to return once the first signs of extreme momentum end, especially as we head into a seasonally positive time of year. See the Outlook & Allocations page for more. BONDS: Hold
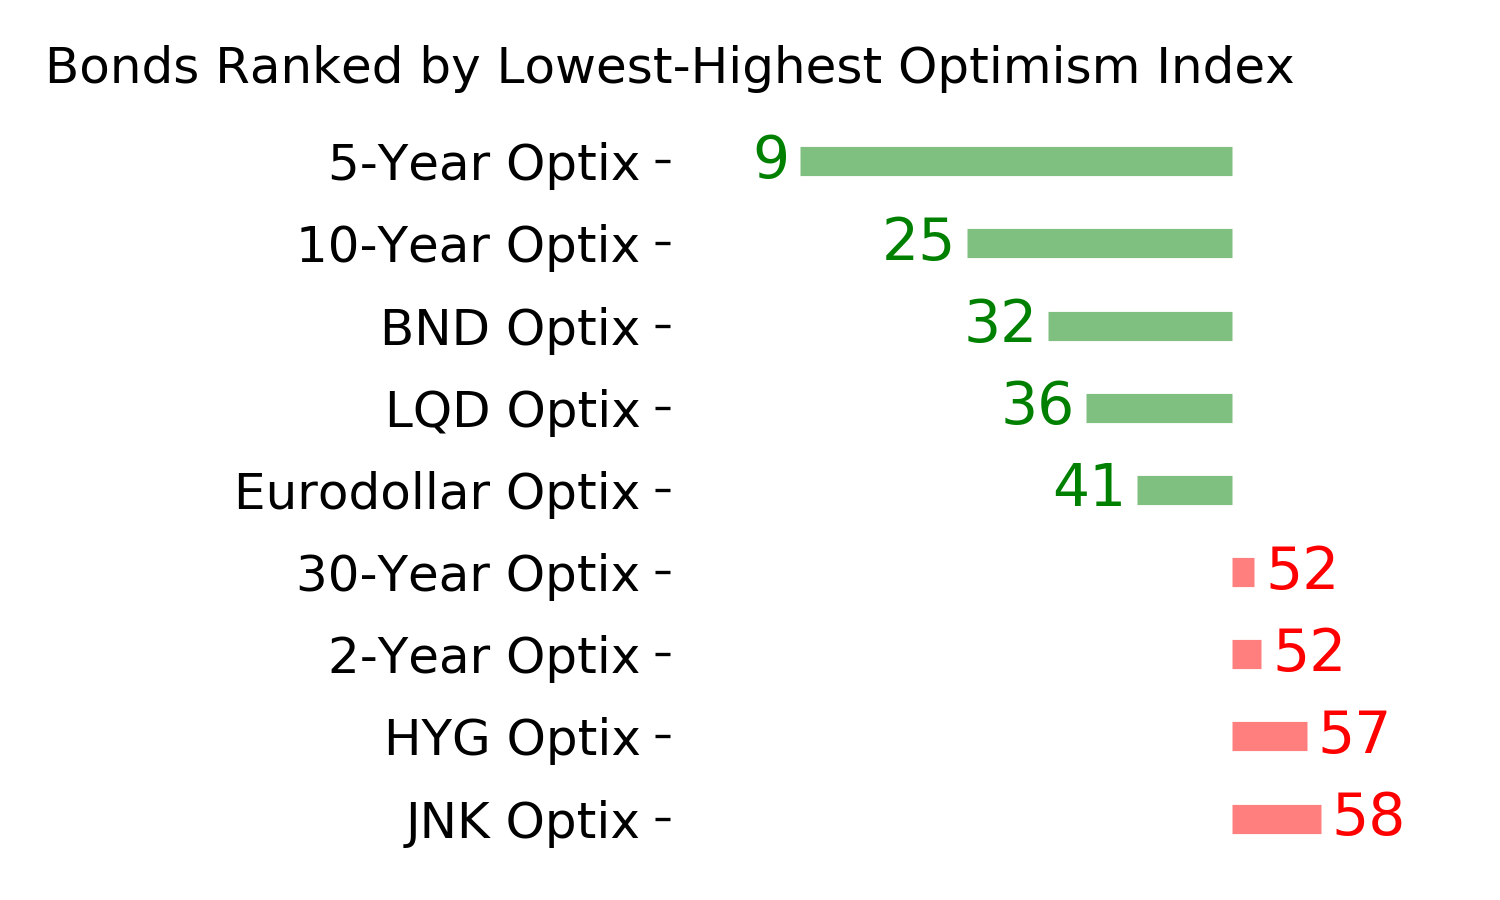
Various parts of the market got hit in March, with the lowest Bond Optimism Index we usually see during healthy environments. Bond prices have modest recovered and there is no edge among the data we follow. GOLD: Hold
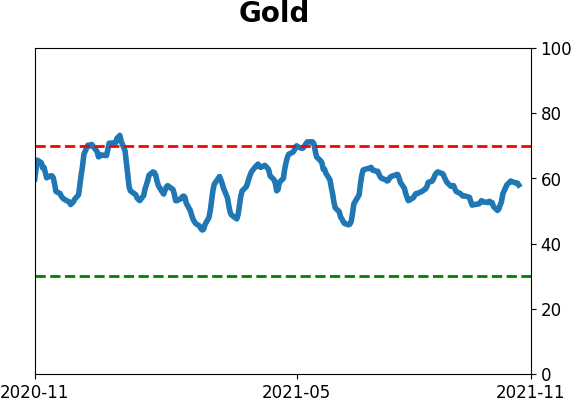
Gold and miners were rejected after trying to recover above their 200-day averages in May. Lately, some medium-term (not long-term) oversold extremes in breadth measures among miners have triggered.
|
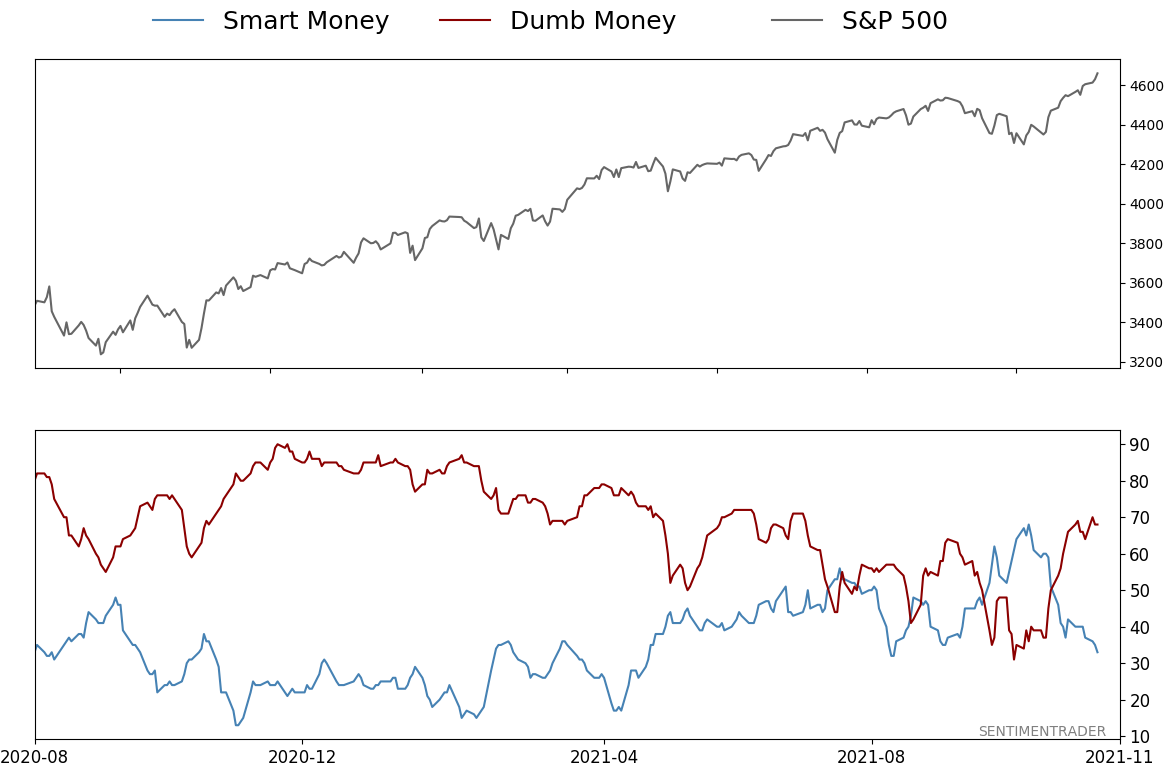
Smart / Dumb Money Confidence
|
Smart Money Confidence: 33%
Dumb Money Confidence: 68%
|
|
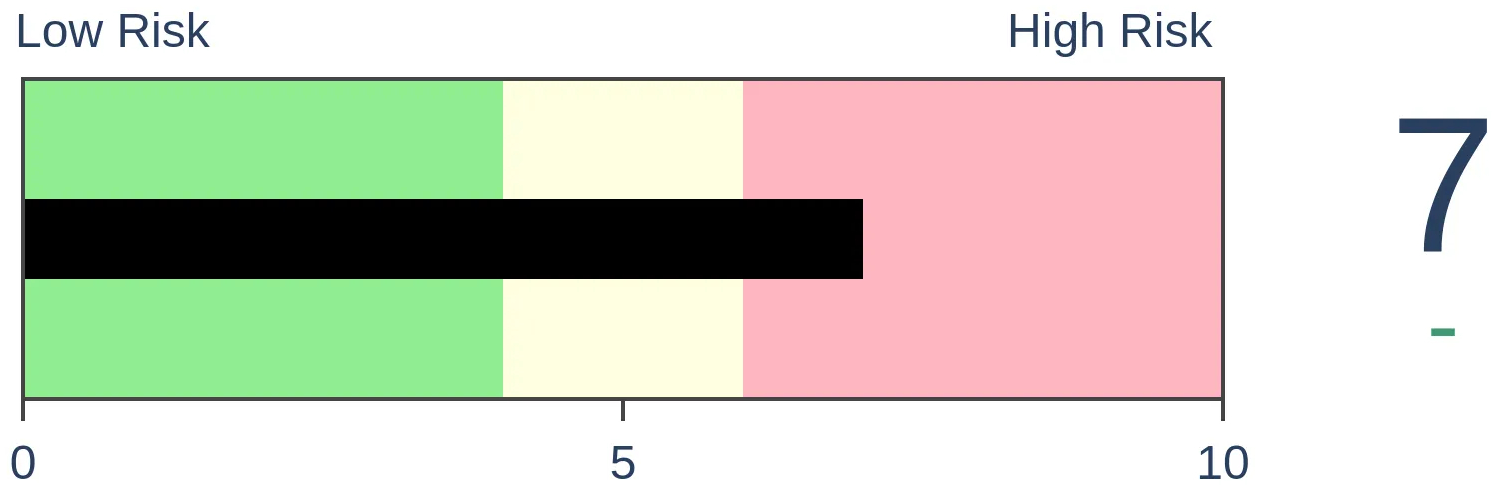
Risk Levels
Stocks Short-Term

|
Stocks Medium-Term
|
|
Bonds

|
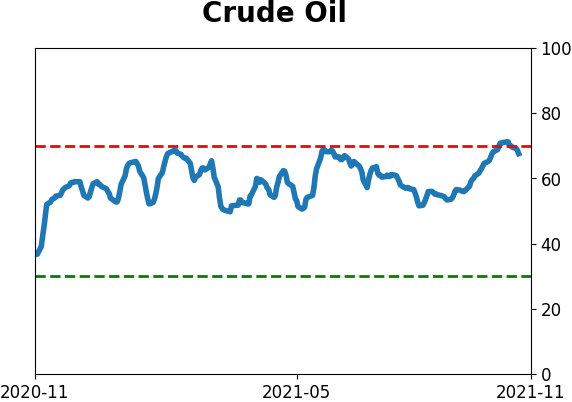
Crude Oil
|
|
Gold
|
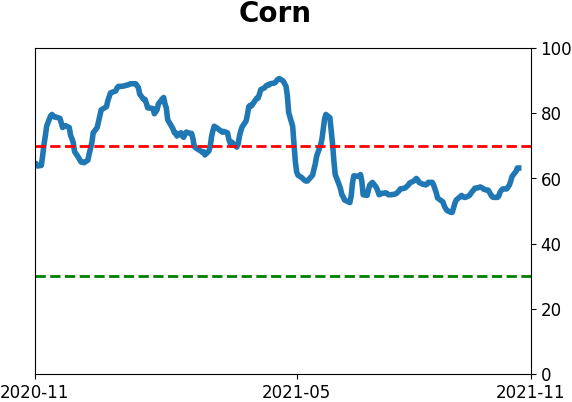
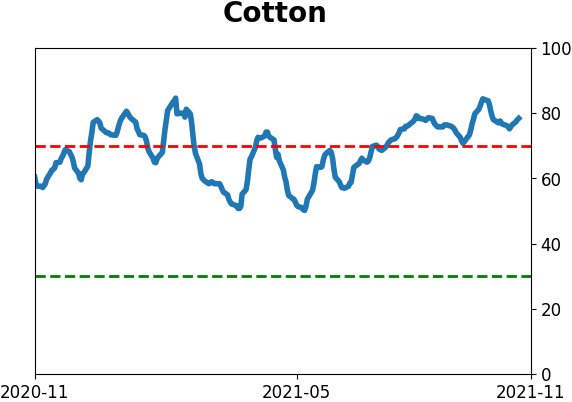
Agriculture
|
|
Research
By Jason Goepfert
BOTTOM LINE
For the first time in more than 6 months, the small-cap Russell 2000 has broken out to a multi-year high. The index has a strong tendency to keep rising, with low risk, and bring the S&P 500 along for the ride.
FORECAST / TIMEFRAME
IWM -- Up, Medium-Term
|
In a year when headline indexes like the S&P 500 have set record after record, it seems like it has taken the small-cap Russell 2000 forever to break out. It finally did, by the tiniest of margins.
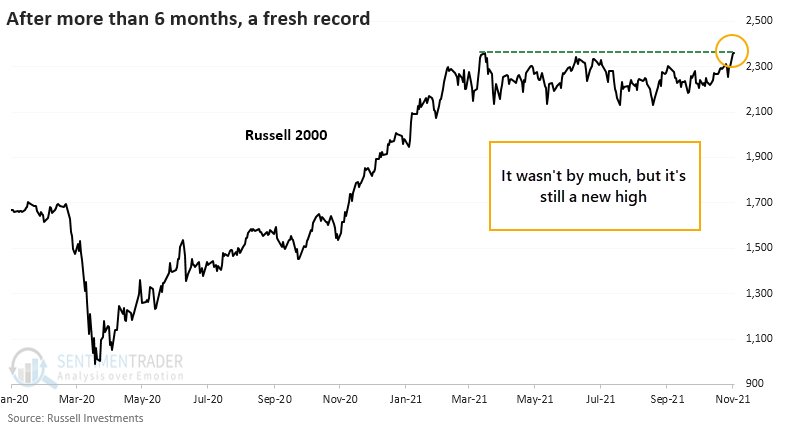
After more than six months of consolidating in a tight range, the Russell managed to push over the hurdle and close at a record high on Tuesday. That ended more than 160 days without one.
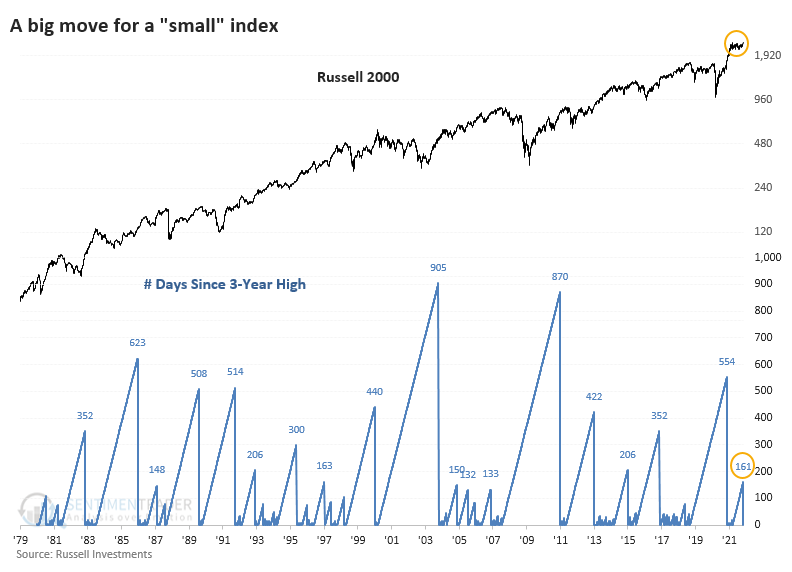
The index has gone far longer without setting a multi-year high, but this one seems overly long because other indexes have been rising without it. And with rare exceptions, it's been an excellent sign for those patient enough to stick with it.
GOOD SIGN FOR FUTURE RETURNS
Once the Russell broke out to a new high for the first time in more than six months, it fell back only twice over the following two months, and both were minor losses that were quickly recouped.
Looking at the Risk/Reward Table for the Russell, there was only a single loss of more than -5% at any point within the next three months.
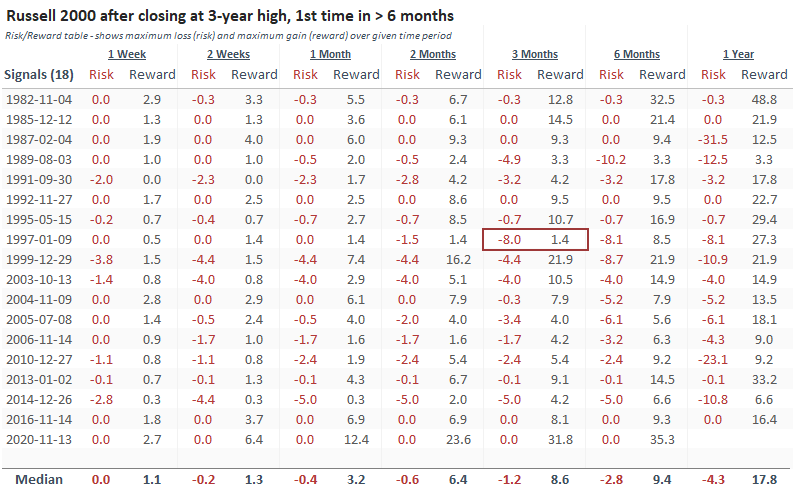
Just as remarkably, 15 out of 18 signals showed more reward than risk over the next three months, 16/18 did so over the next six months, and 17/18 over the next year.
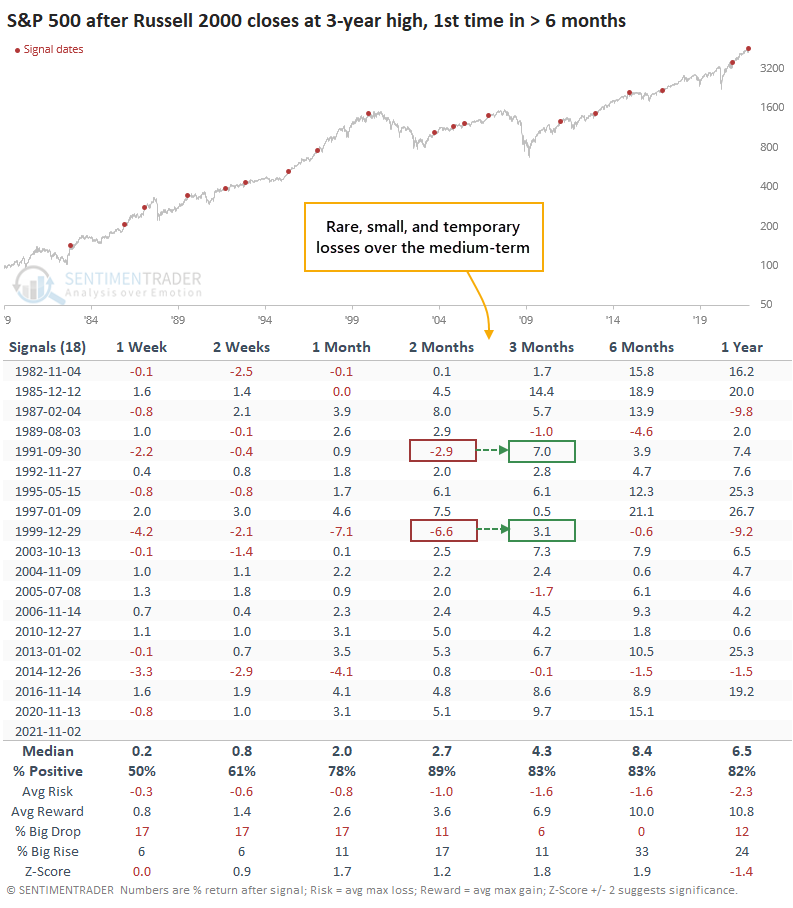
EVEN FOR THE S&P 500, A GOOD SIGN
Breakouts in small-cap stocks tend to be a decent sign for the major indexes, and indeed, the S&P 500 showed good returns after these signals. Over the next two to three months, the S&P suffered only a few minor losses, none leading to imminent cascades.
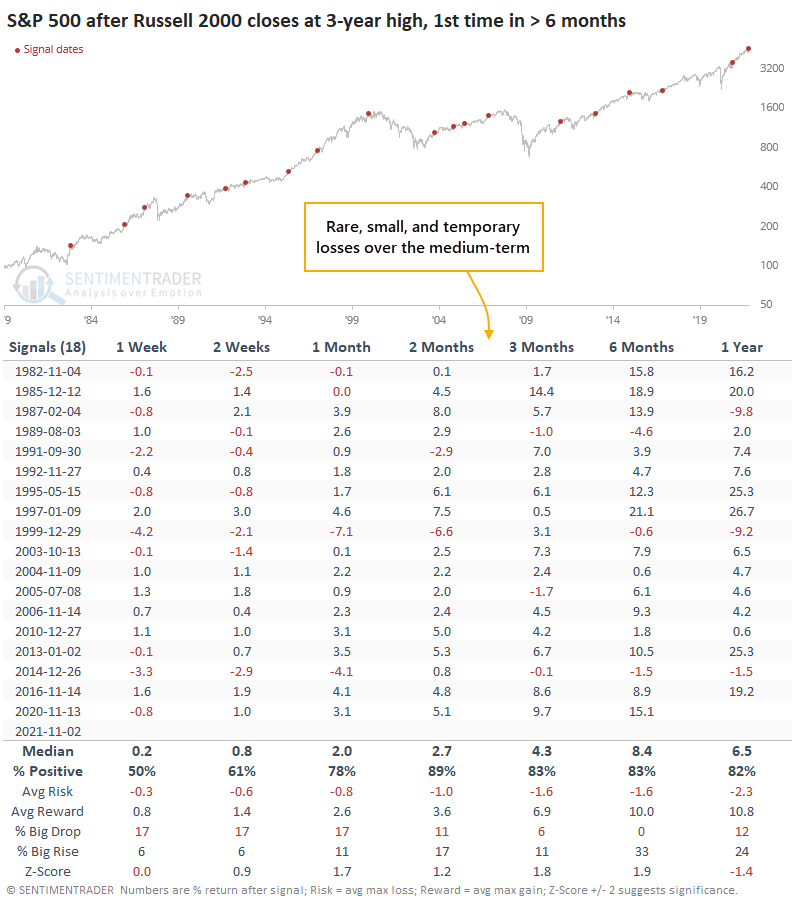
The recent spike in speculative activity is a bit of a worry over the short-term, but a return of risk-on behavior after a reset tends to lead to higher prices. The fact that small-cap stocks have now broken out to new highs, on the heels of broader advance/decline lines, is more evidence that an imminent correction seems like a low probability.
Active Studies
| Time Frame | Bullish | Bearish | | Short-Term | 2 | 0 | | Medium-Term | 9 | 0 | | Long-Term | 11 | 5 |
|
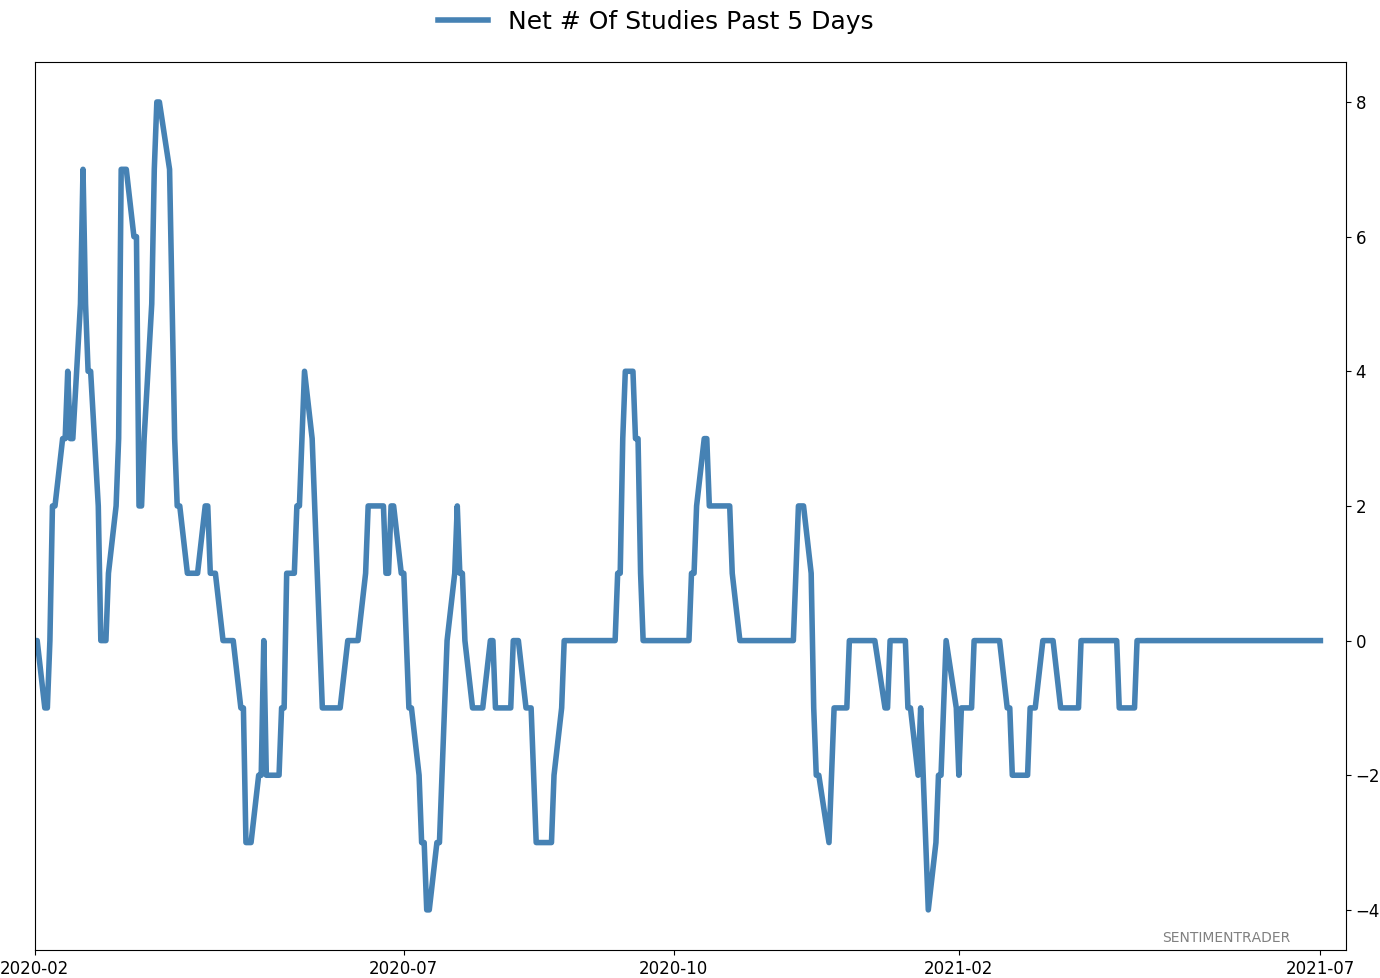
Indicators at Extremes
Portfolio
| Position | Description | Weight % | Added / Reduced | Date | | Stocks | RSP | 10.7 | Added 6.4% | 2021-10-01 | | Bonds | 32.7% BND, 7.1% SCHP | 39.8 | Added 8.3% | 2021-10-26 | | Commodities | GCC | 2.4 | Reduced 2.1%
| 2020-09-04 | | Precious Metals | GDX | 4.6 | Reduced 4.2% | 2021-05-19 | | Special Situations | 9.8% KWEB, 4.7% XLE, 2.9% PSCE | 17.3 | Added 9.78% | 2021-10-01 | | Cash | | 24.1 | | |
|
Updates (Changes made today are underlined)
Much of our momentum and trend work has remained positive for several months, with some scattered exceptions. Almost all sentiment-related work has shown a poor risk/reward ratio for stocks, especially as speculation drove to record highs in exuberance in February. Much of that has worn off, and most of our models are back toward neutral levels. There isn't much to be excited about here. The same goes for bonds and even gold. Gold has been performing well lately and is back above long-term trend lines. The issue is that it has a poor record of holding onto gains when attempting a long-term trend change like this, so we'll take a wait-and-see approach. Momentum has ebbed quickly in recent weeks, and nearing oversold levels in some indicators. This can be a dangerous area, with a lot of short-term volatility, but we'd be more inclined to add medium- to long-term exposure rather than sell on much more of a decline, thanks to already rock-bottom exposure. Other areas look more attractive, including some overseas markets. RETURN YTD: 10.9% 2020: 8.1%, 2019: 12.6%, 2018: 0.6%, 2017: 3.8%, 2016: 17.1%, 2015: 9.2%, 2014: 14.5%, 2013: 2.2%, 2012: 10.8%, 2011: 16.5%, 2010: 15.3%, 2009: 23.9%, 2008: 16.2%, 2007: 7.8%
|
|
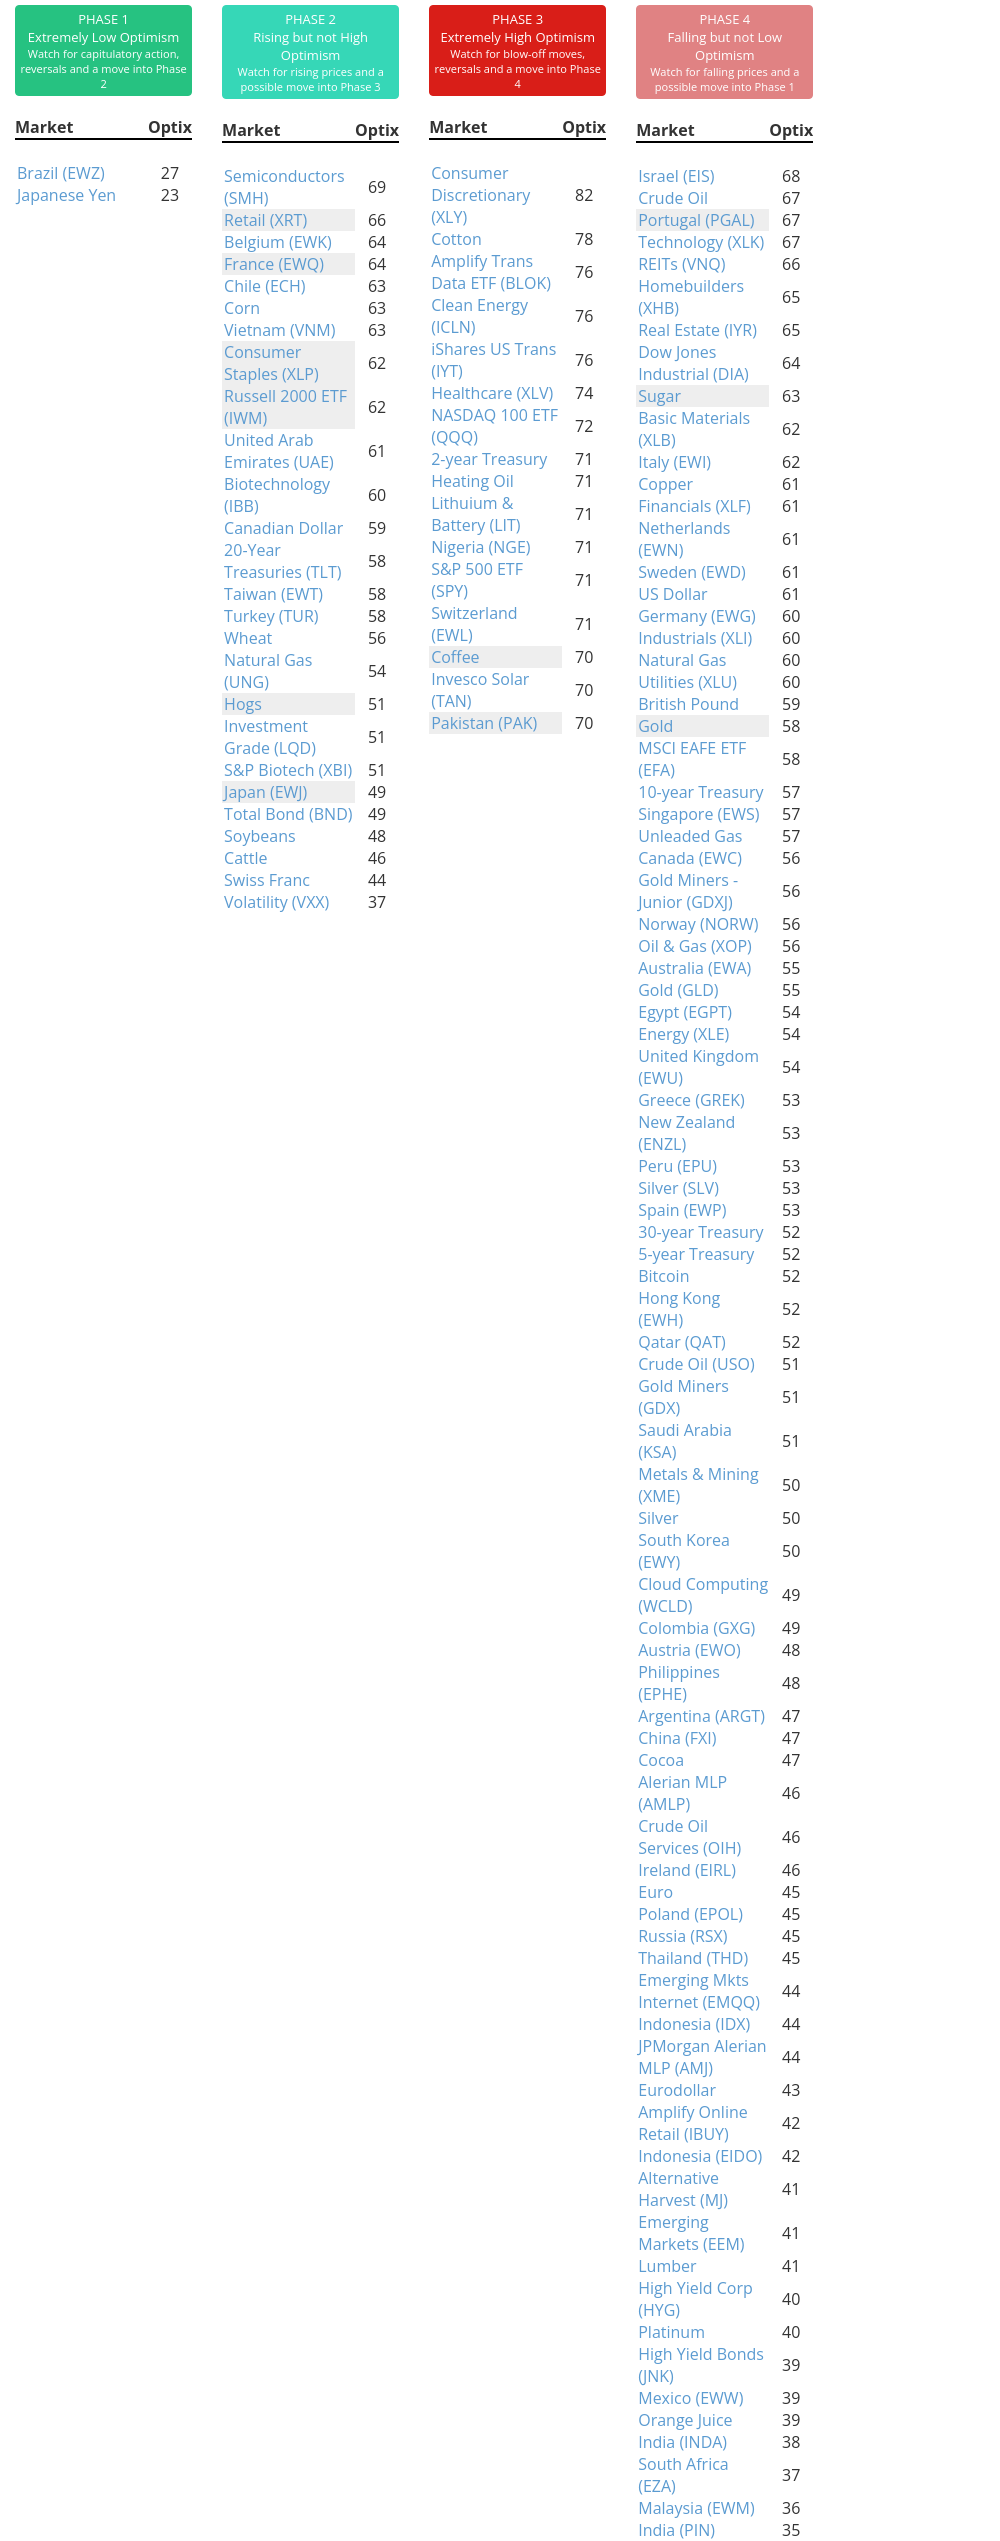
Phase Table
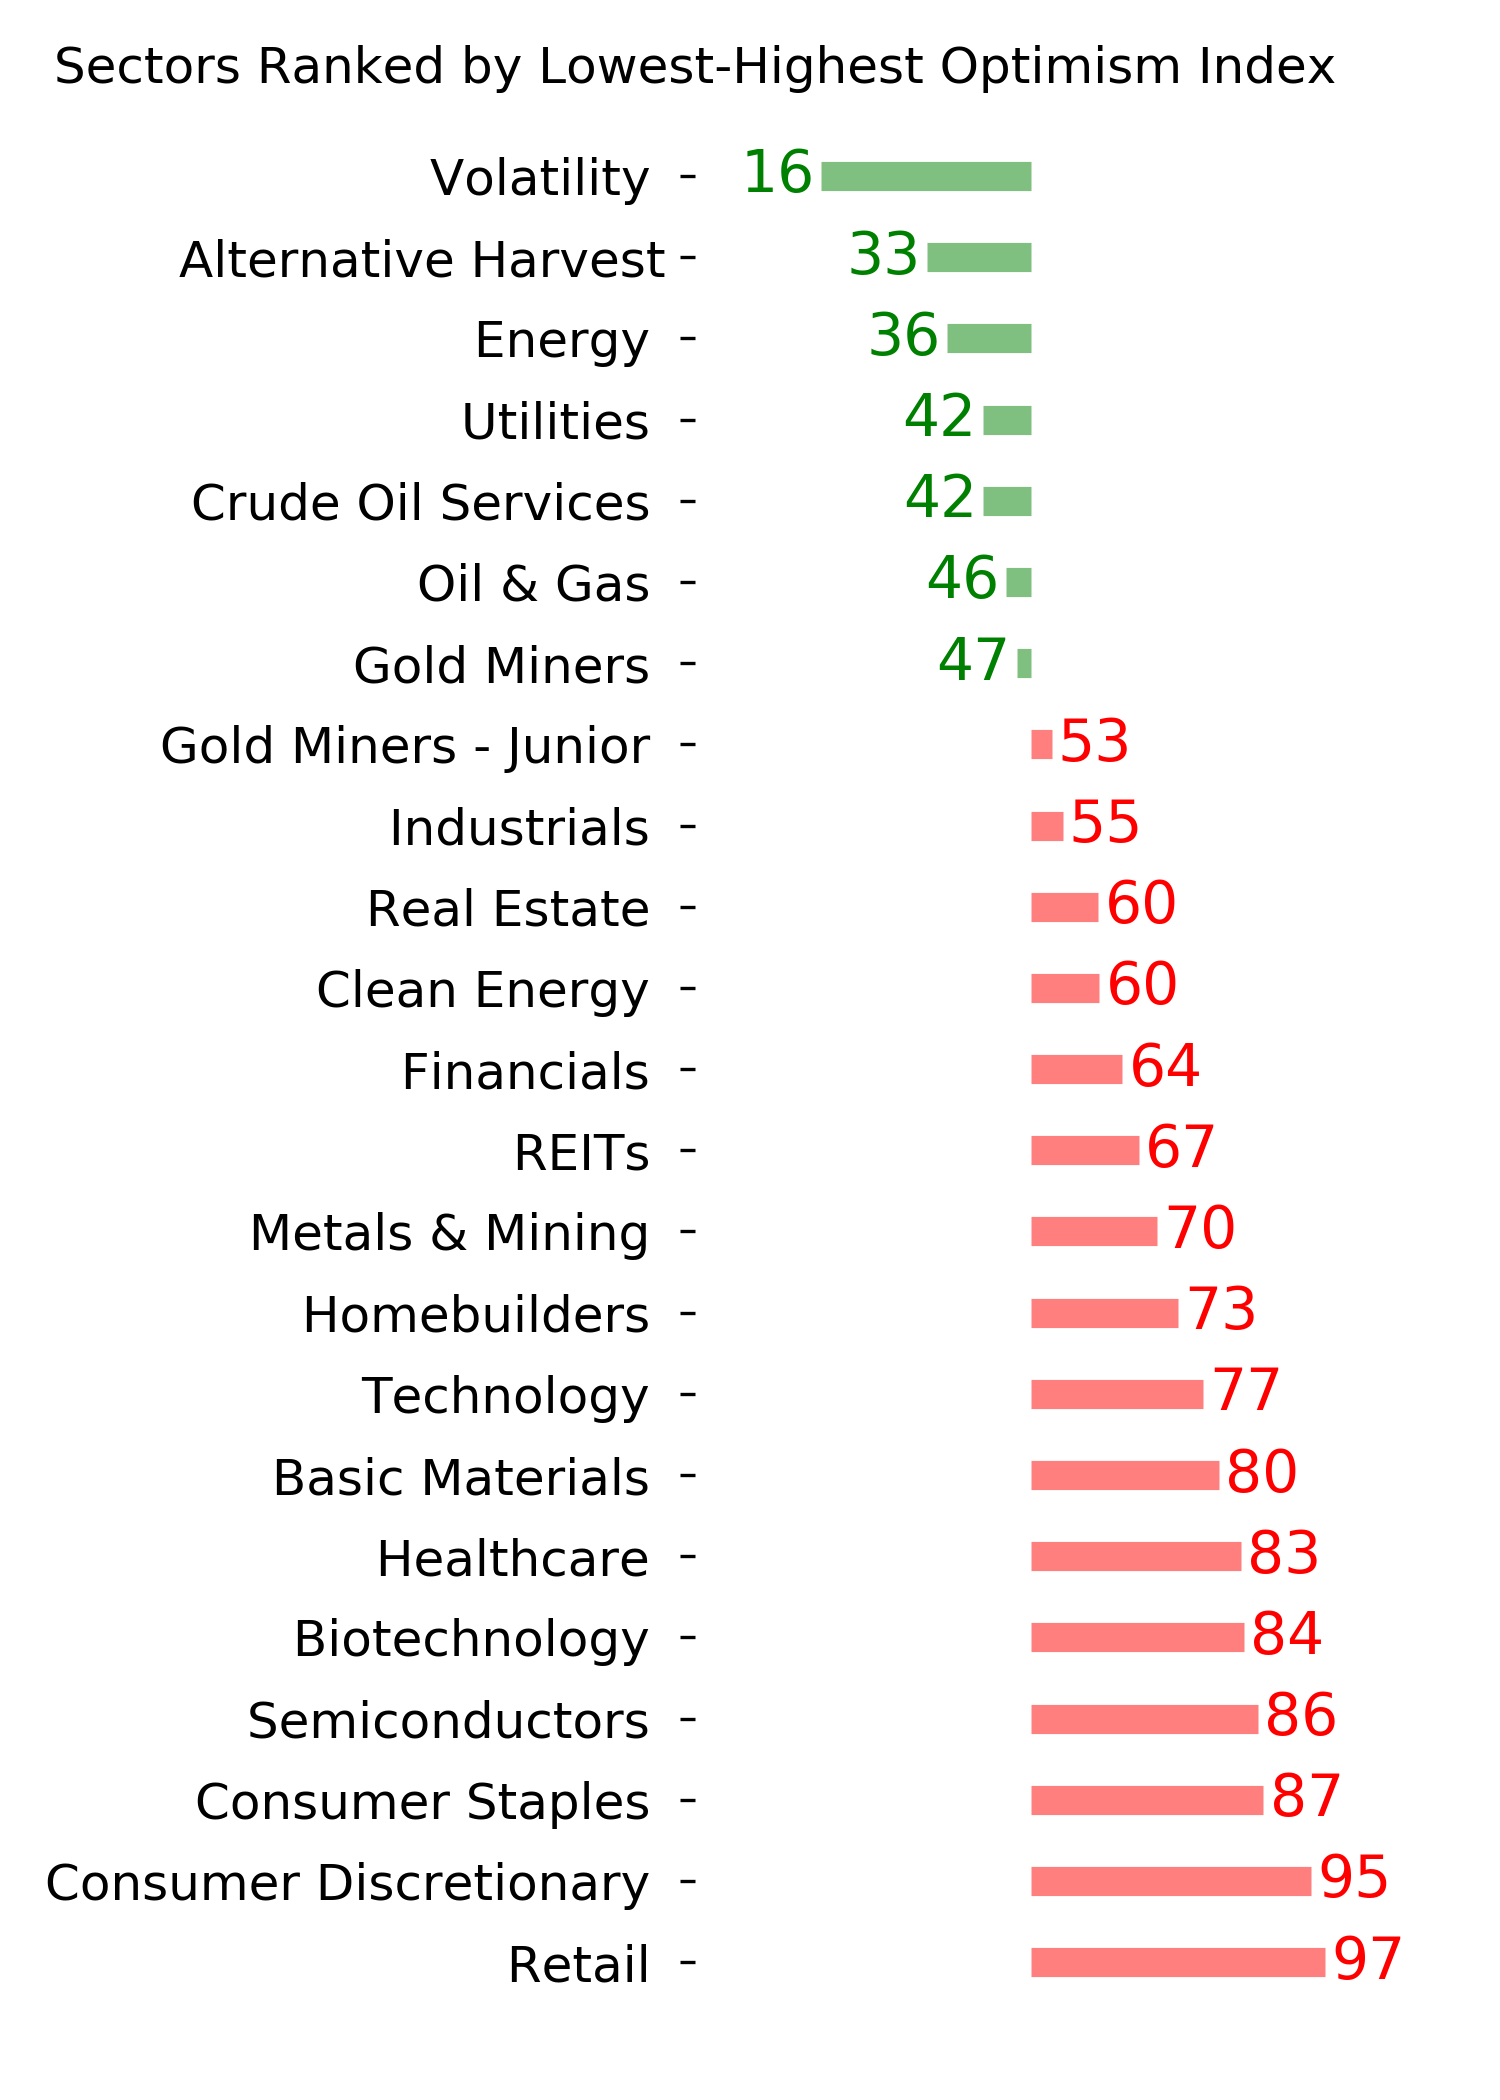
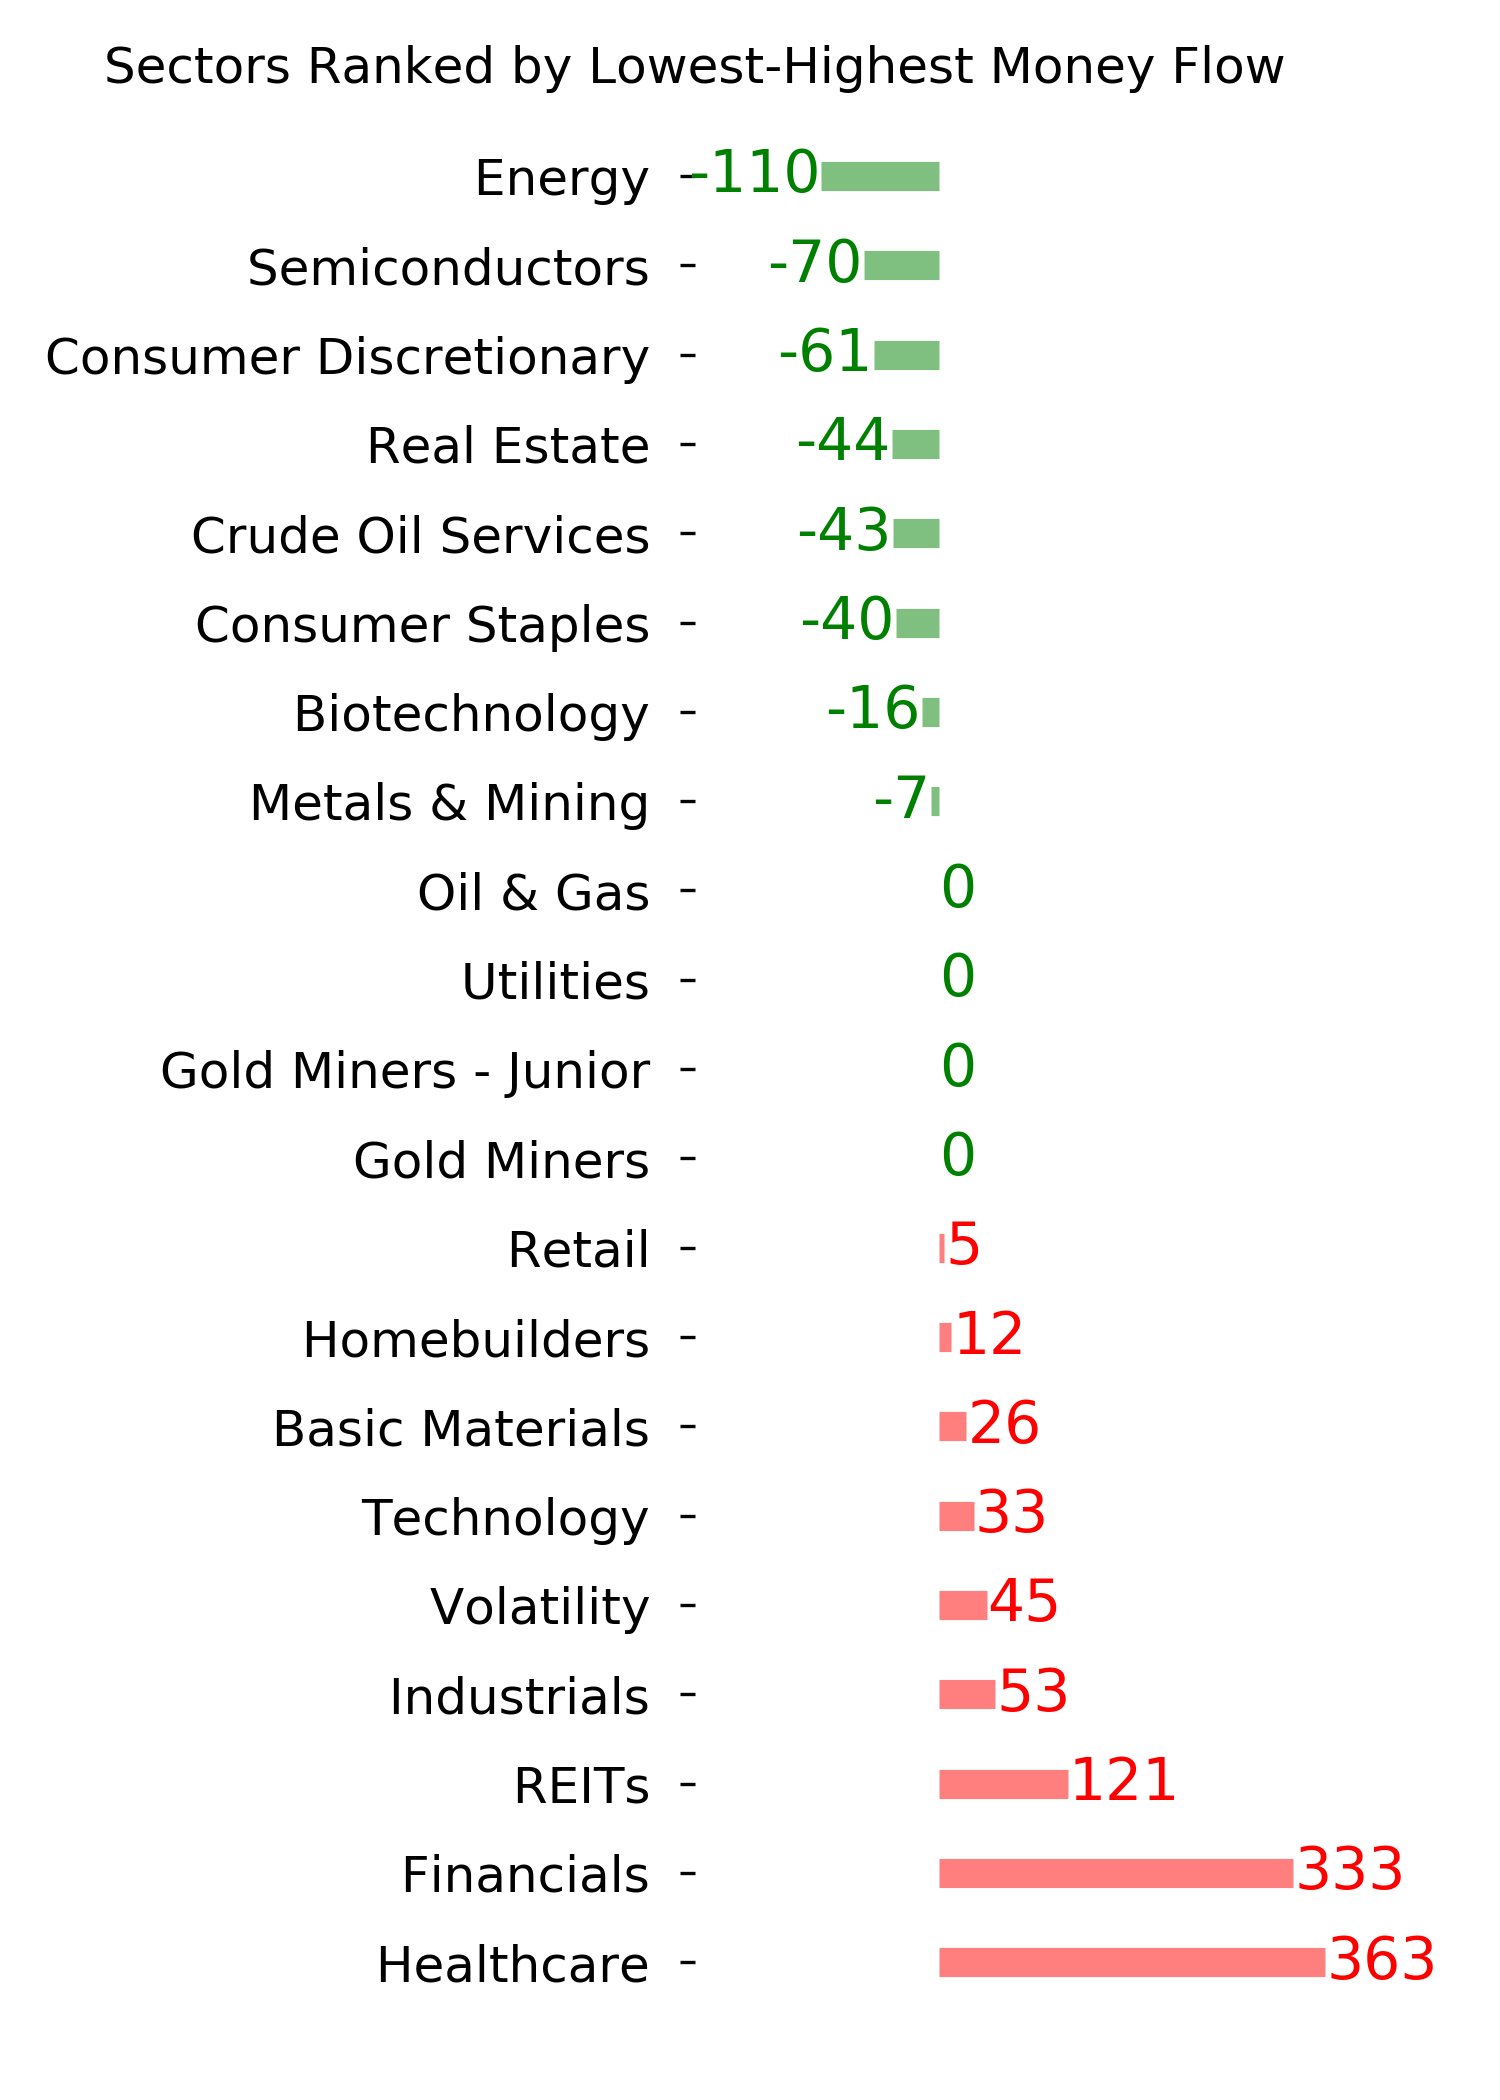
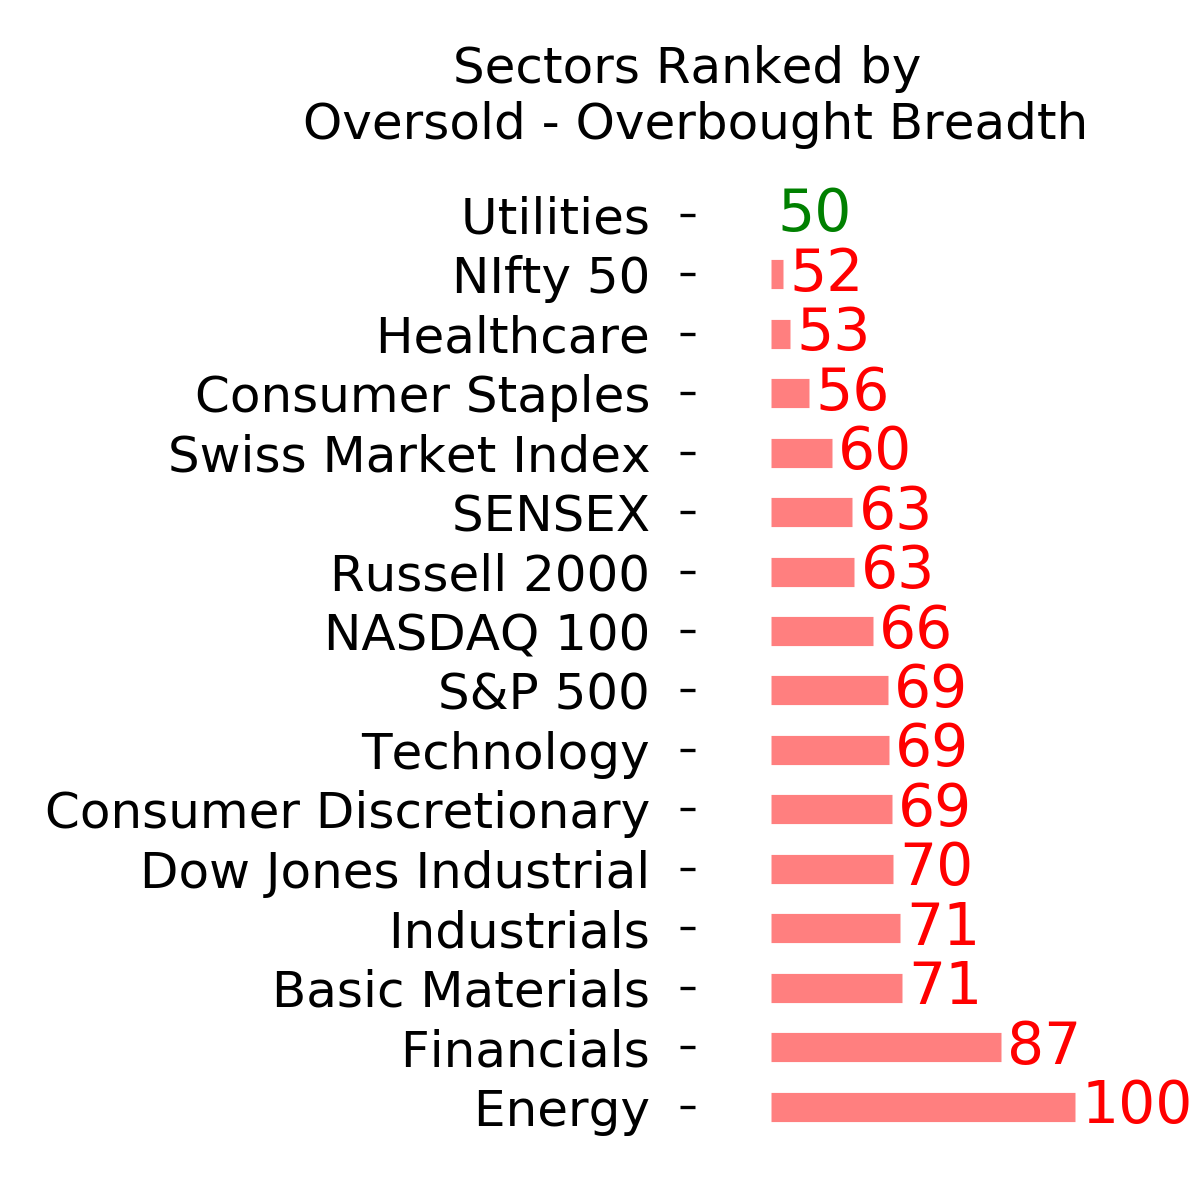
Ranks
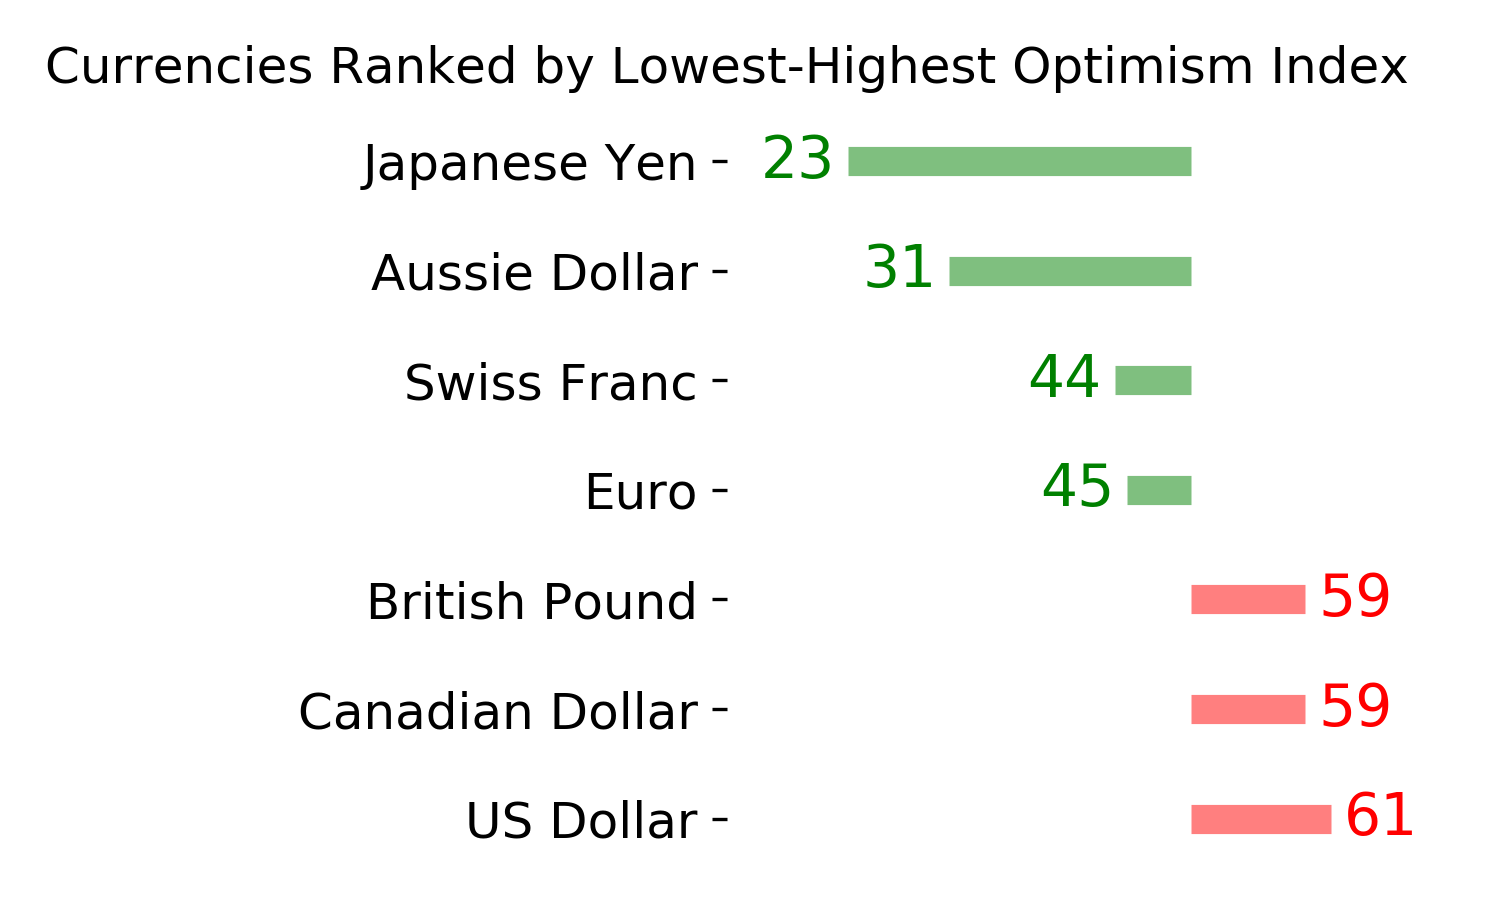
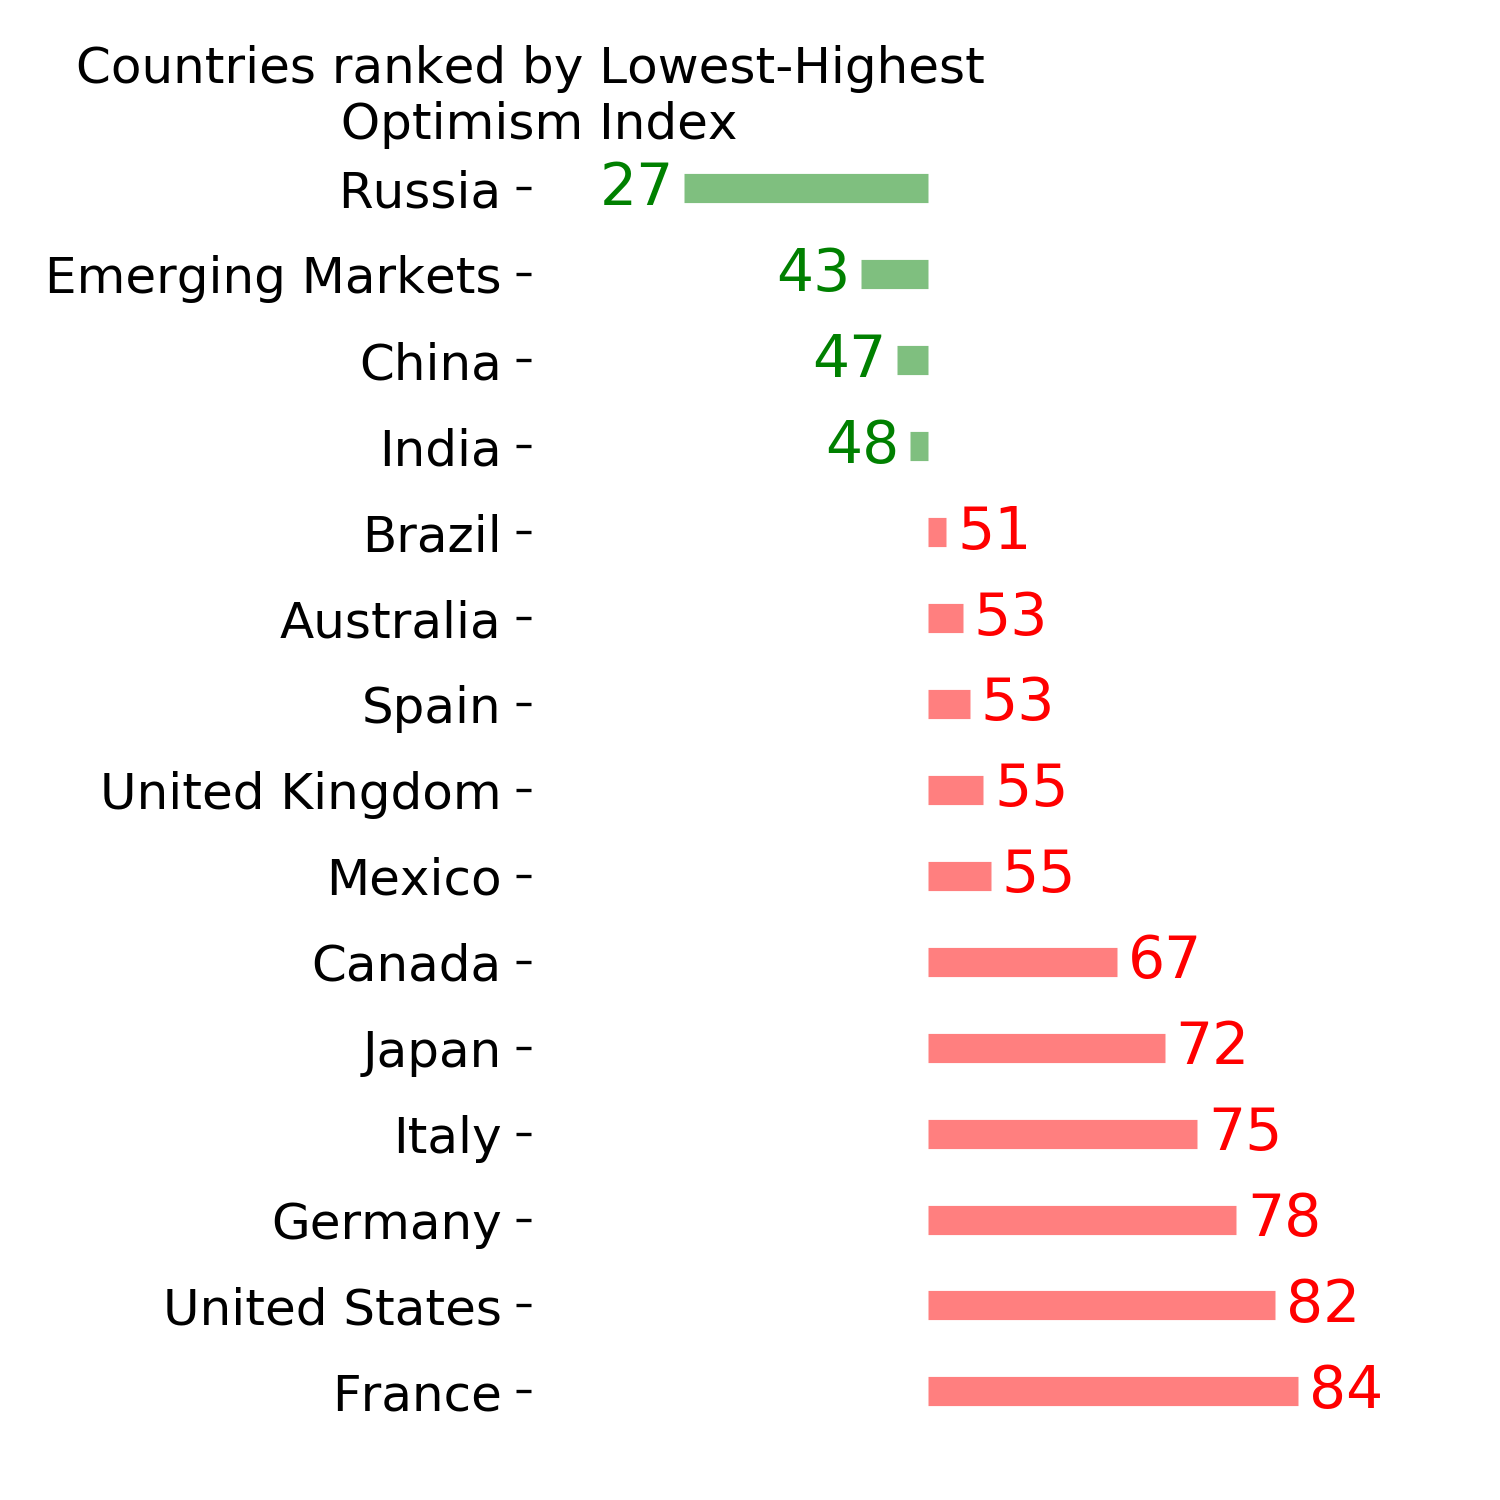
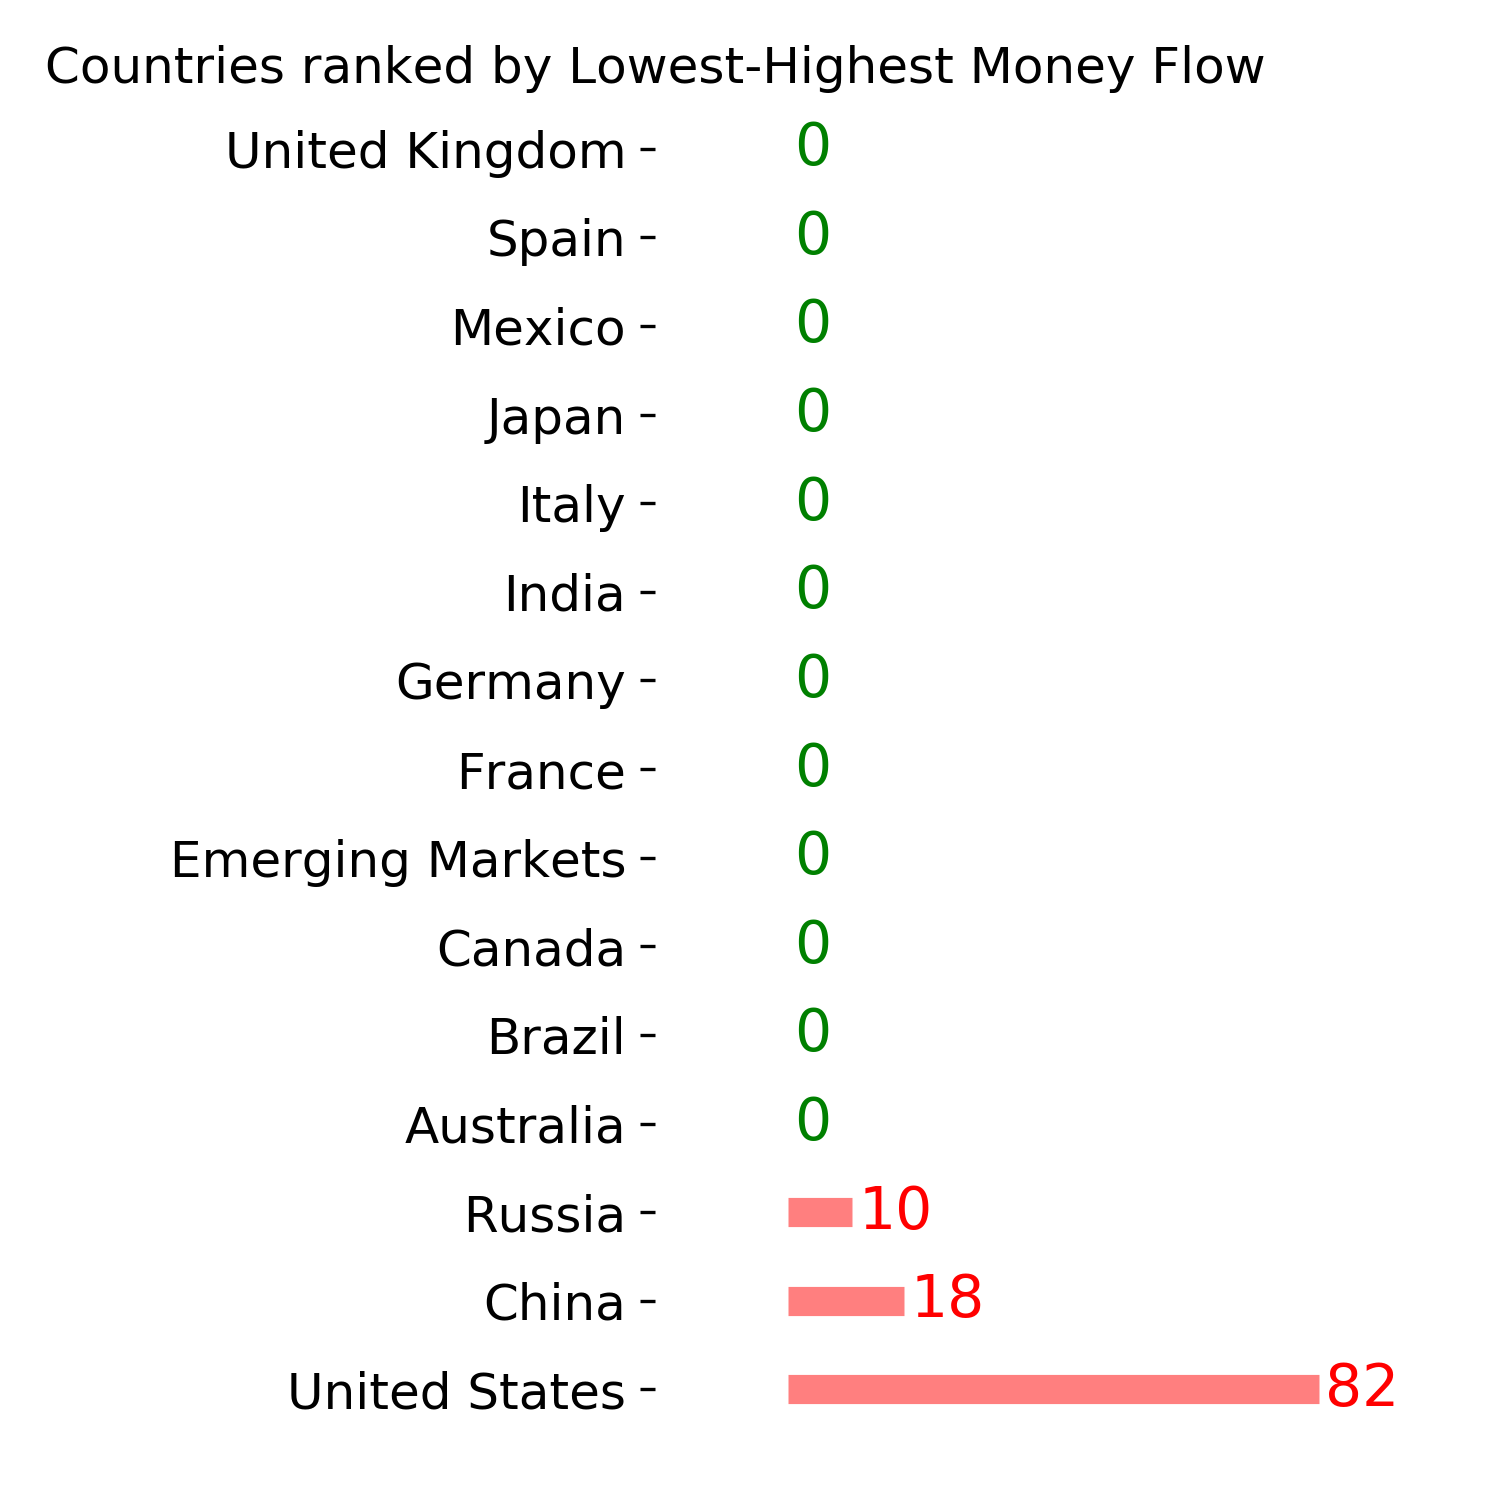
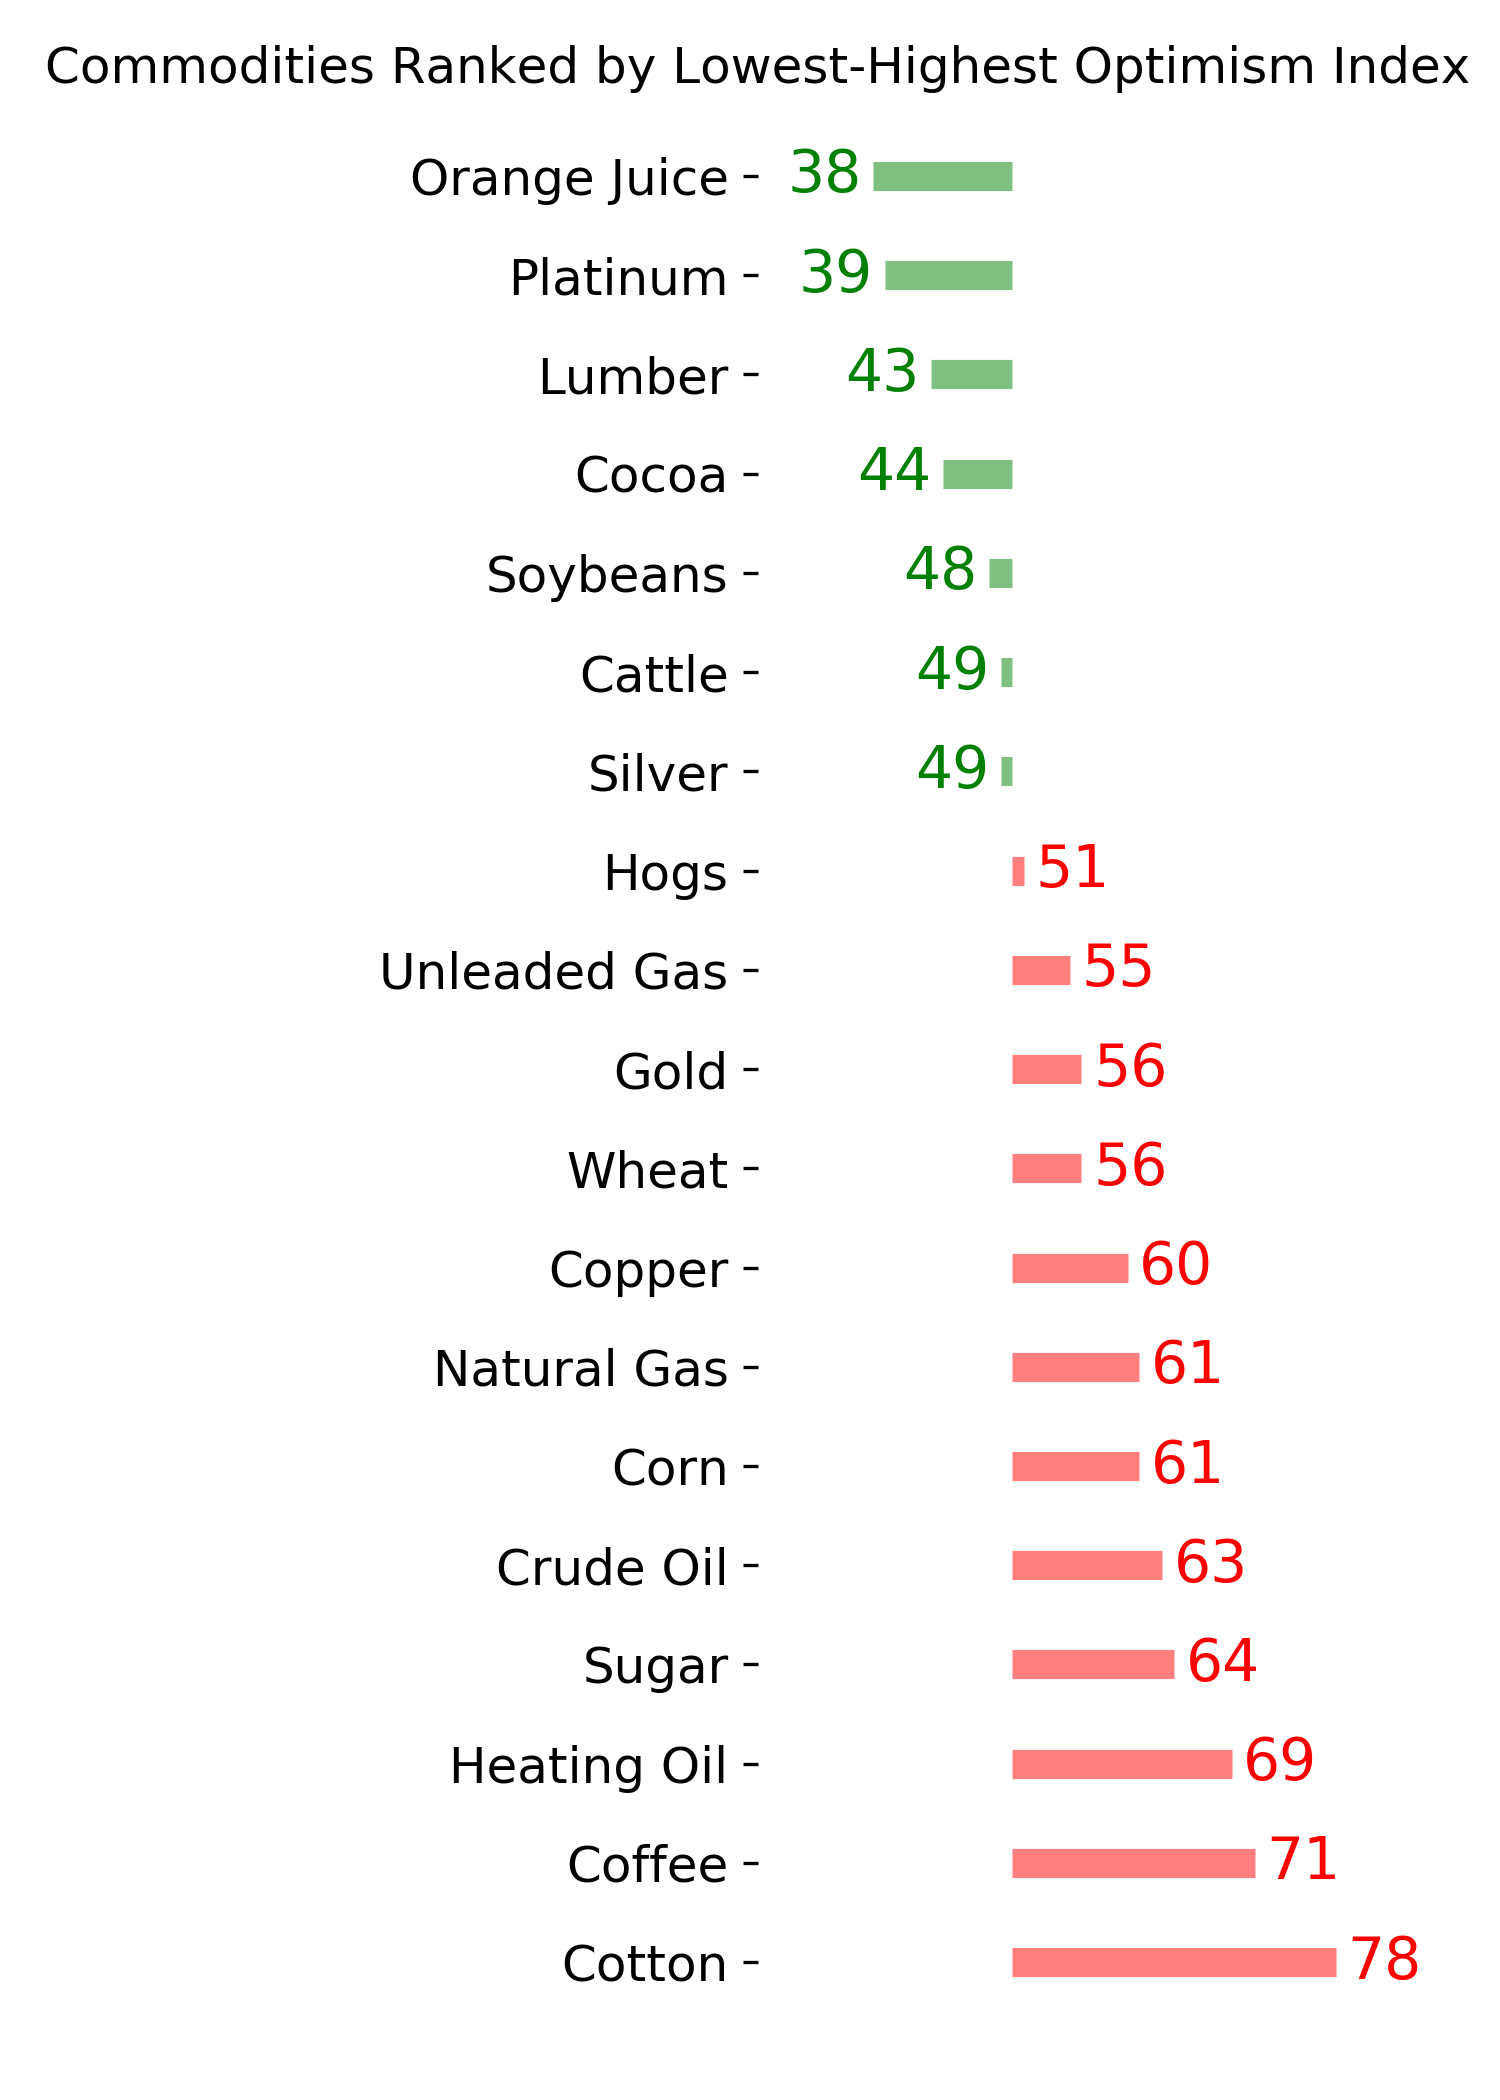
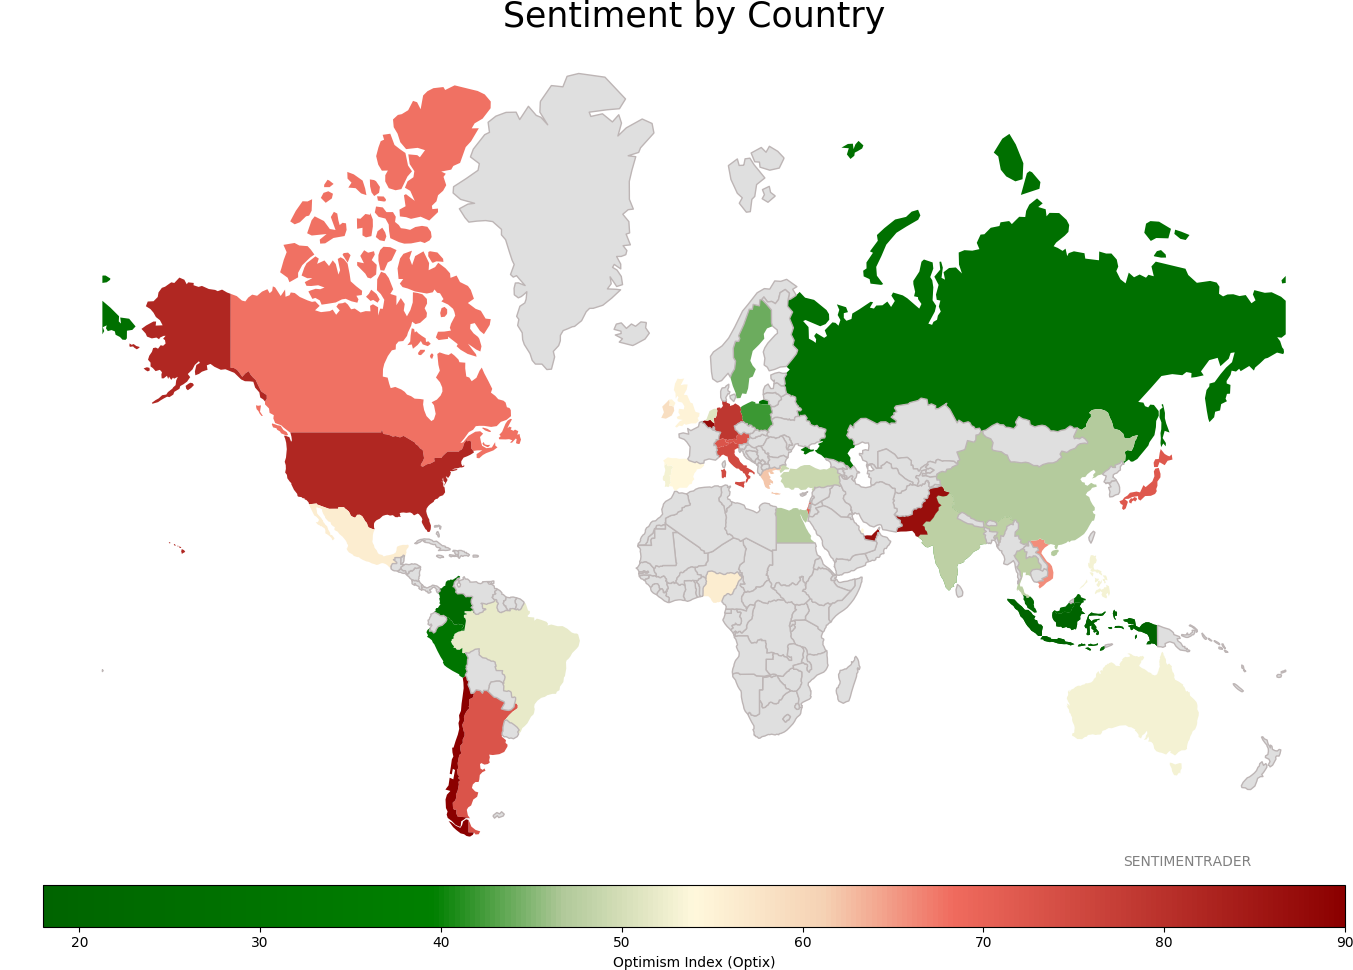
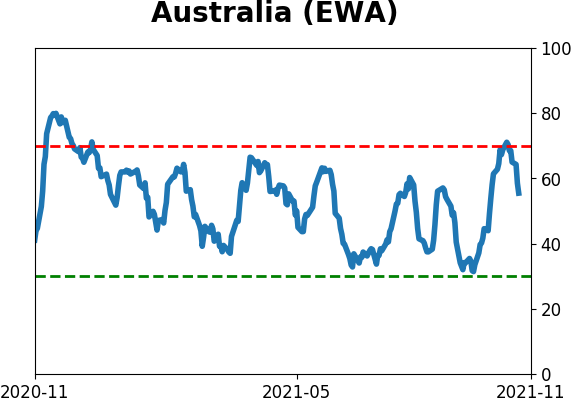
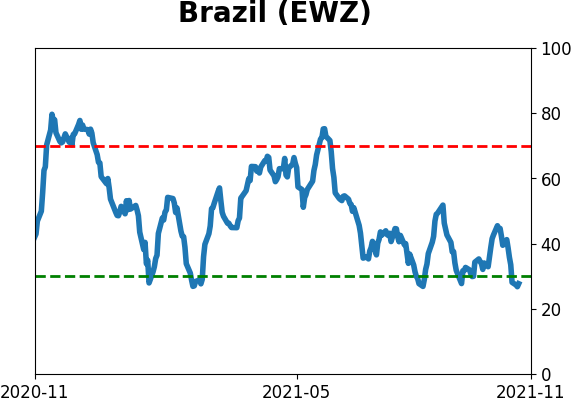
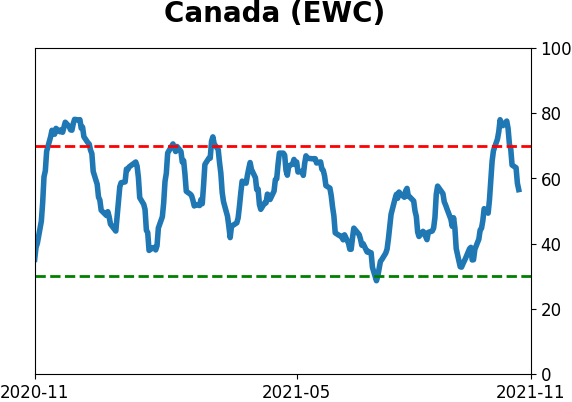
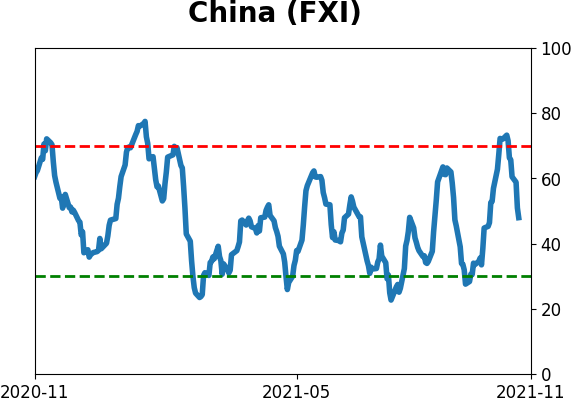
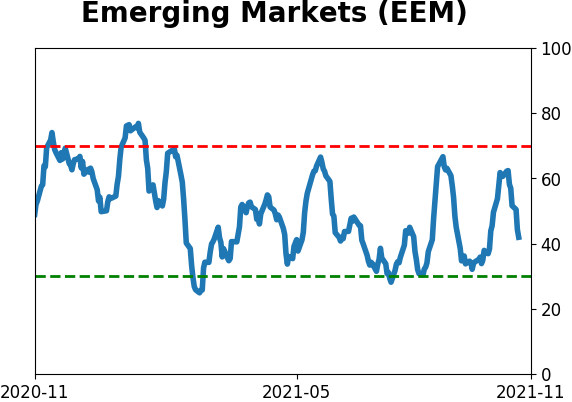
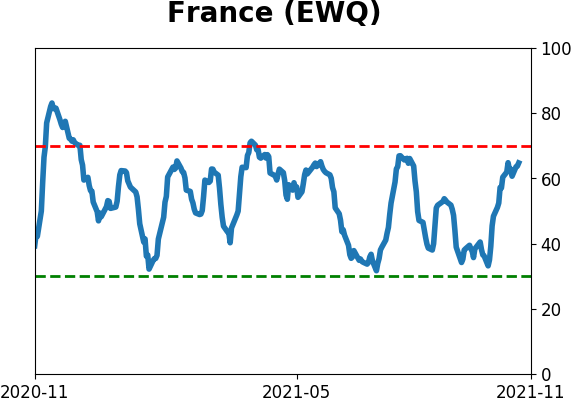
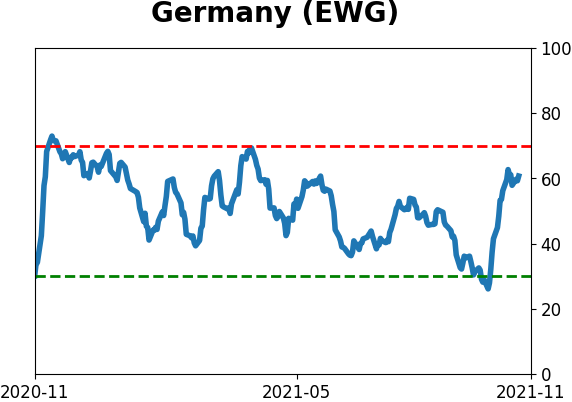
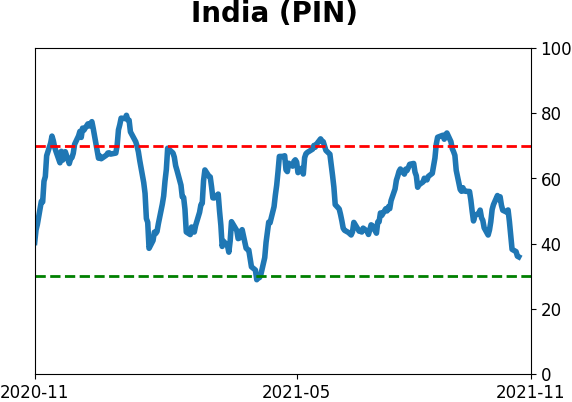
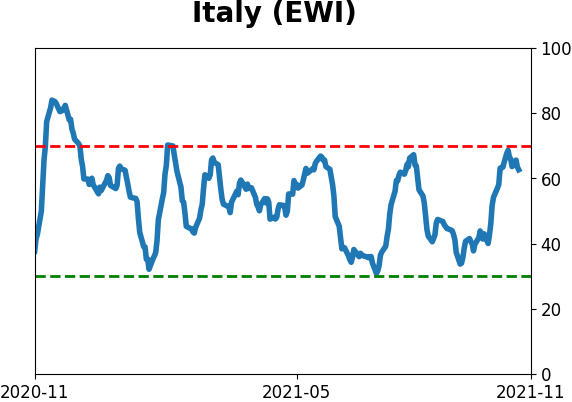
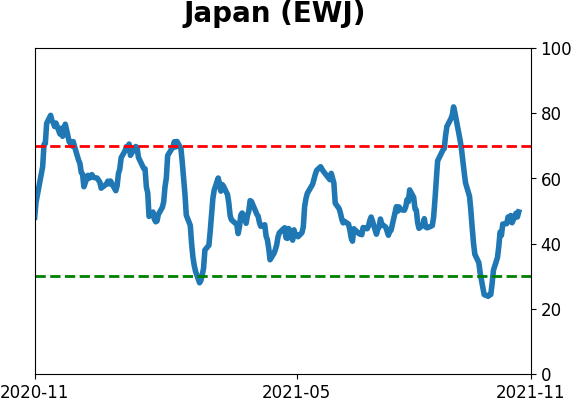
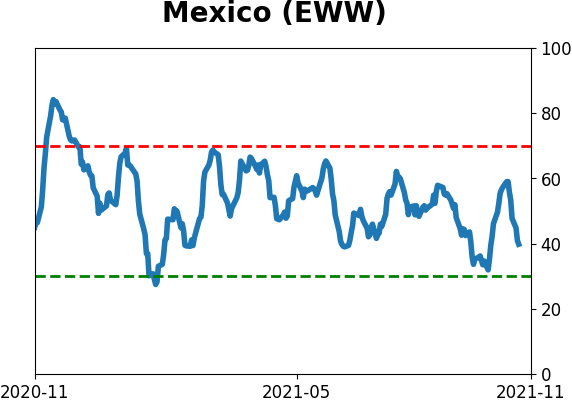
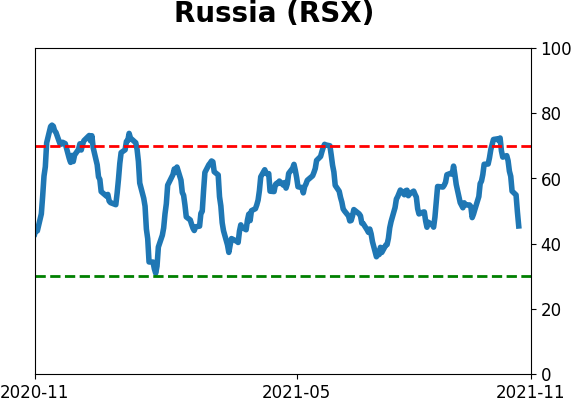
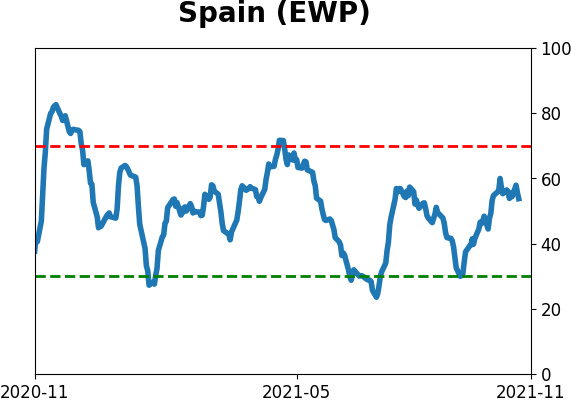
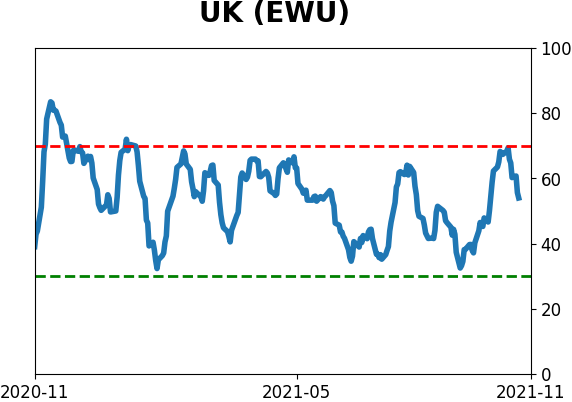
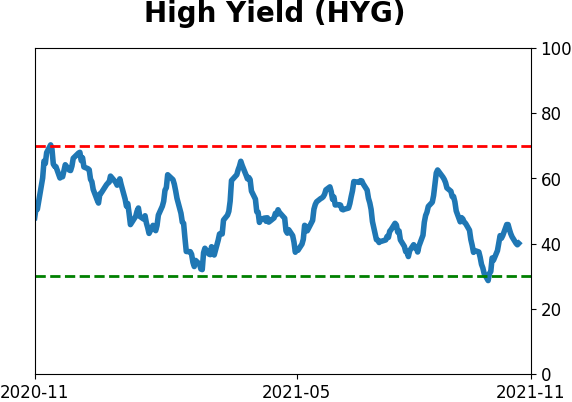
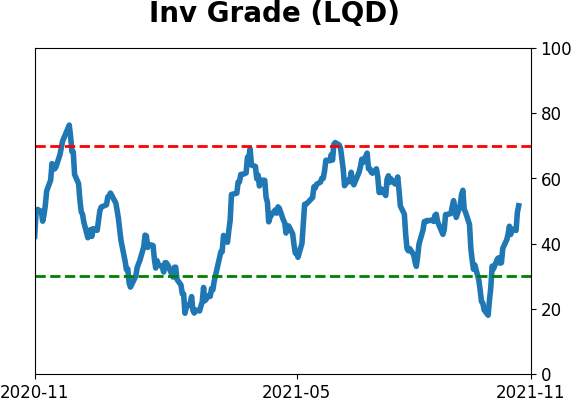
Sentiment Around The World
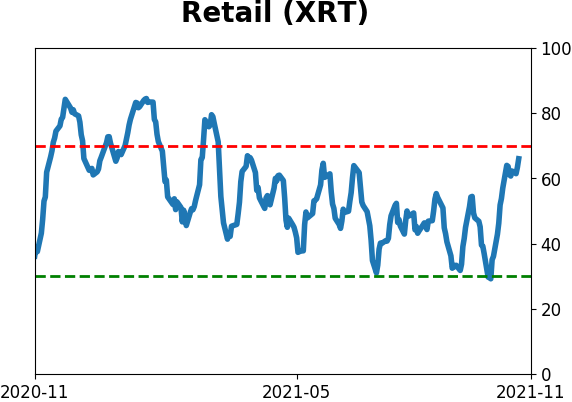
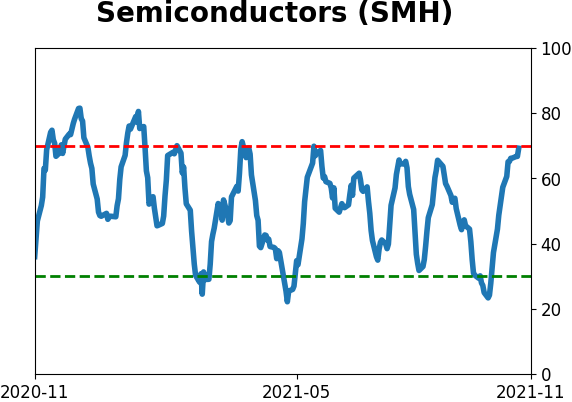
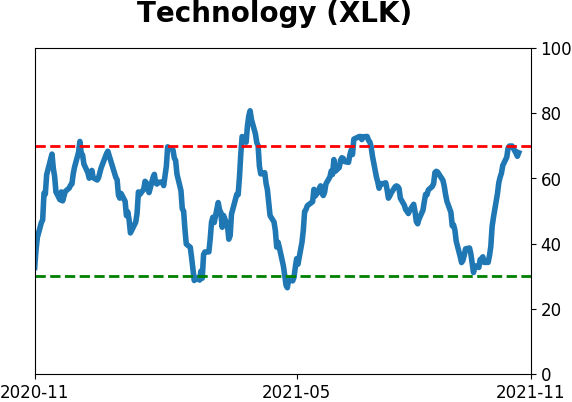
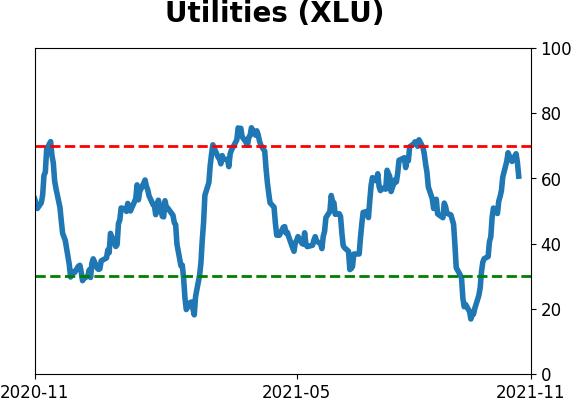
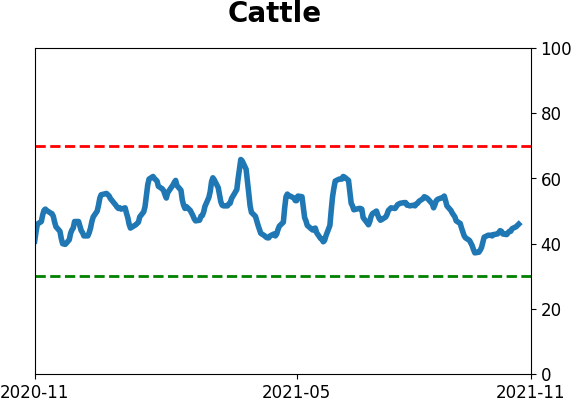
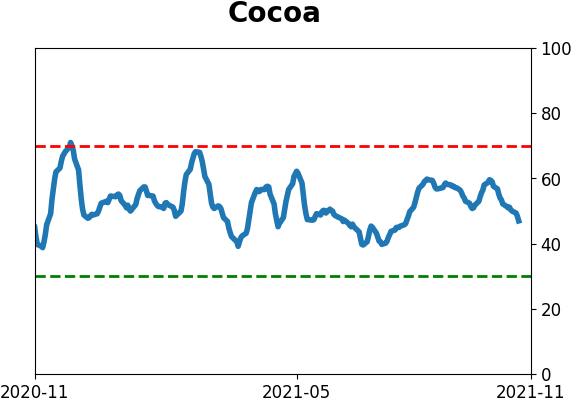
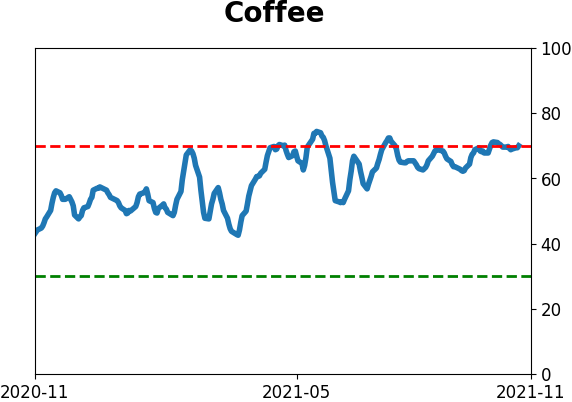
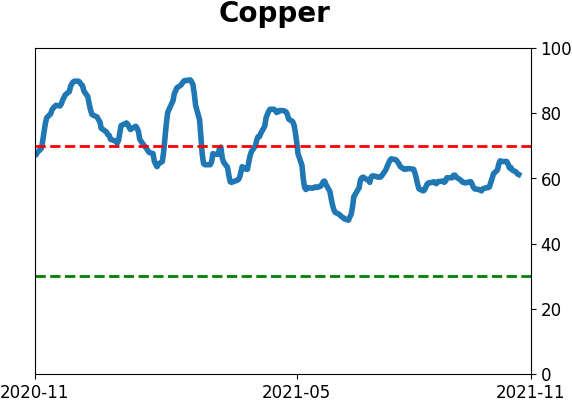
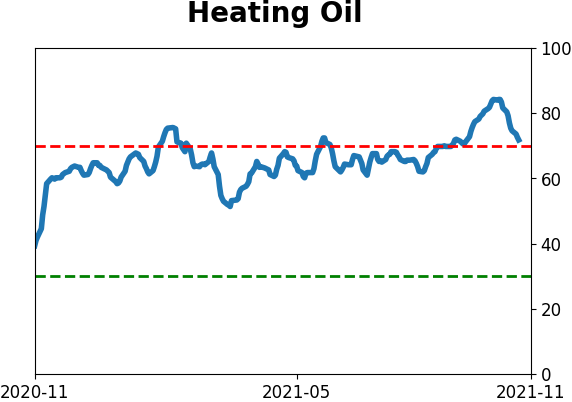
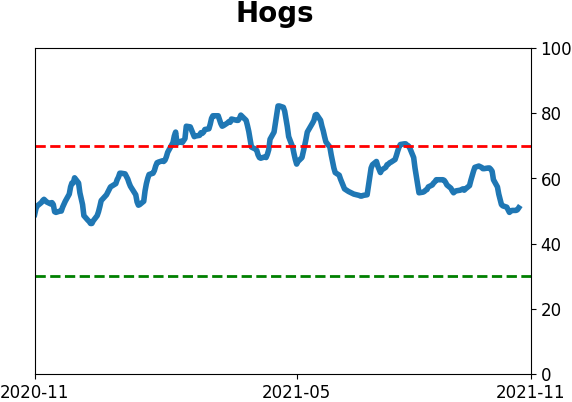
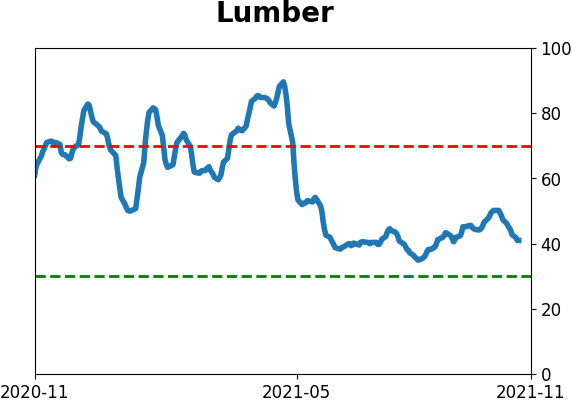
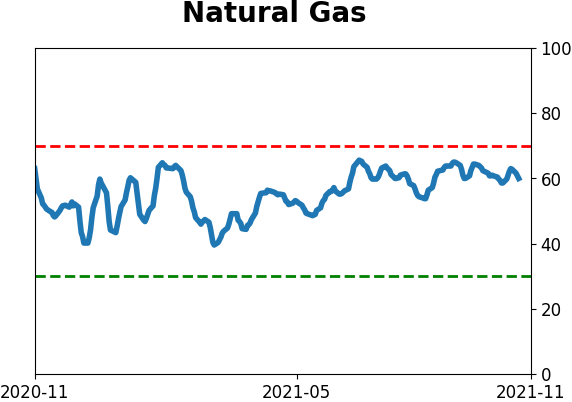
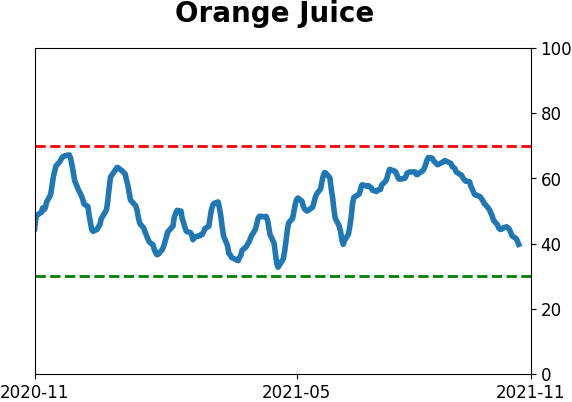
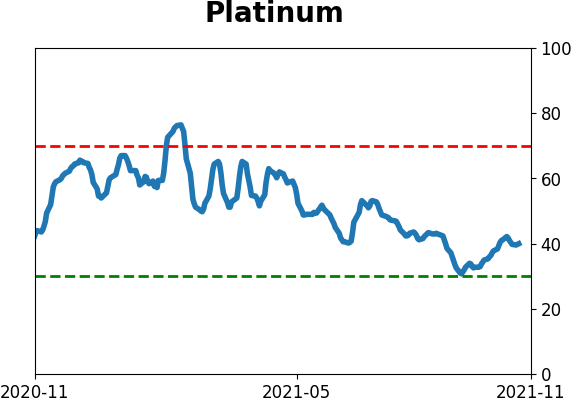
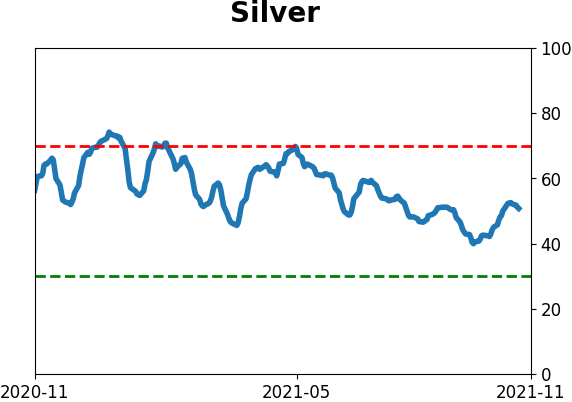
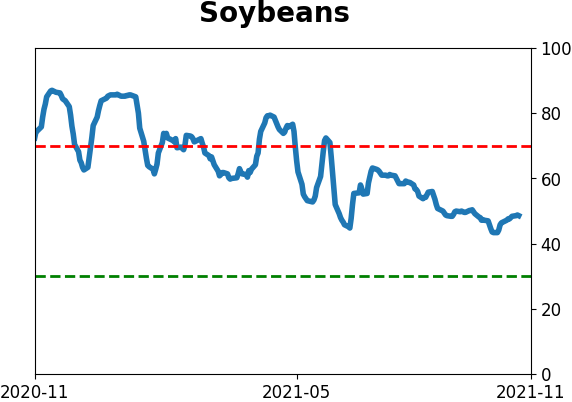
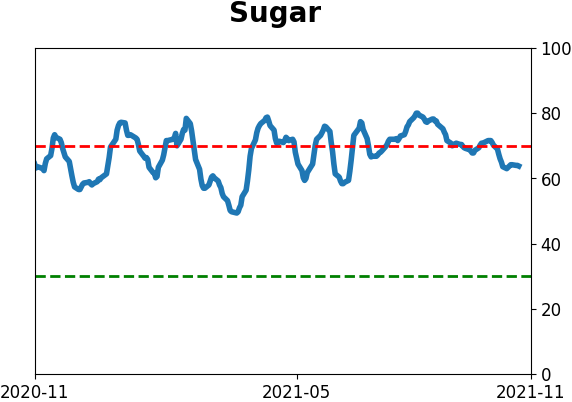
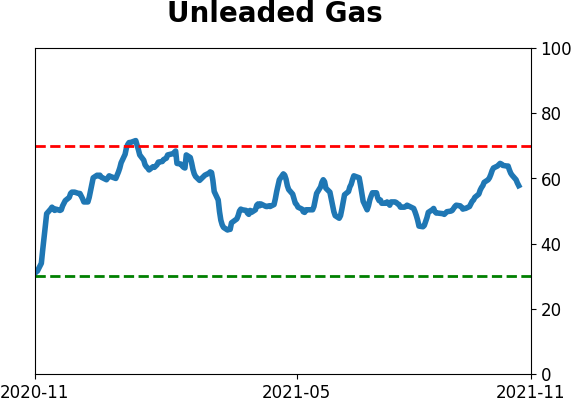
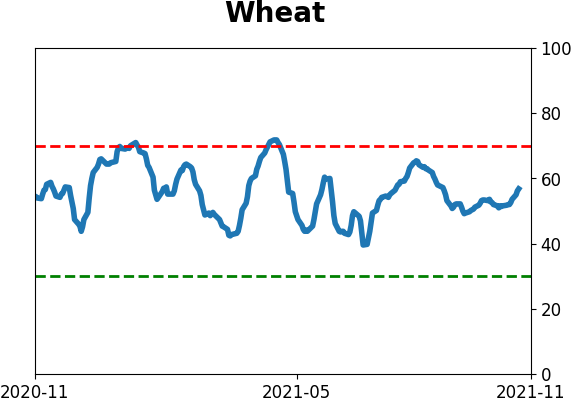
Optimism Index Thumbnails
|
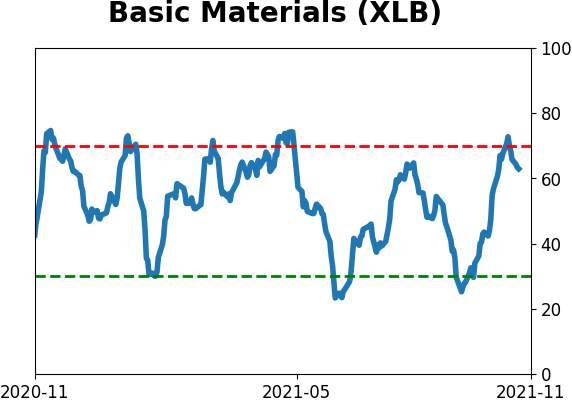
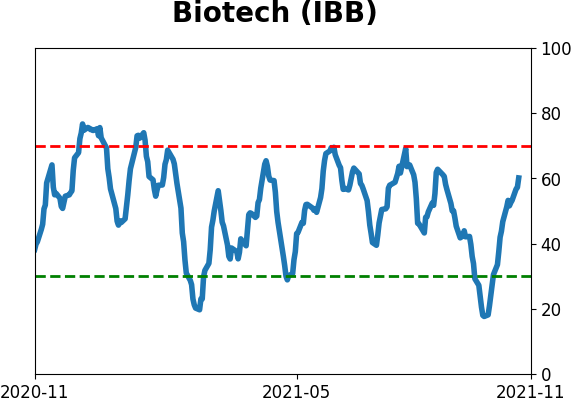
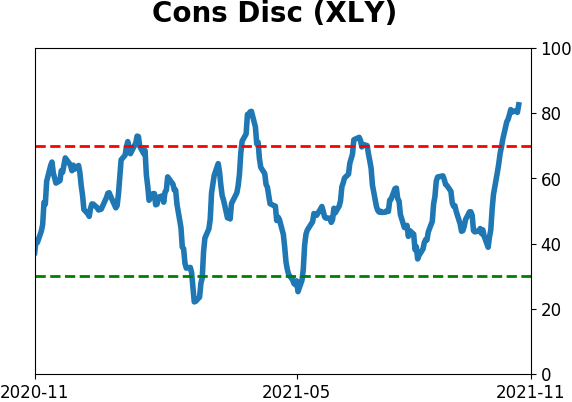
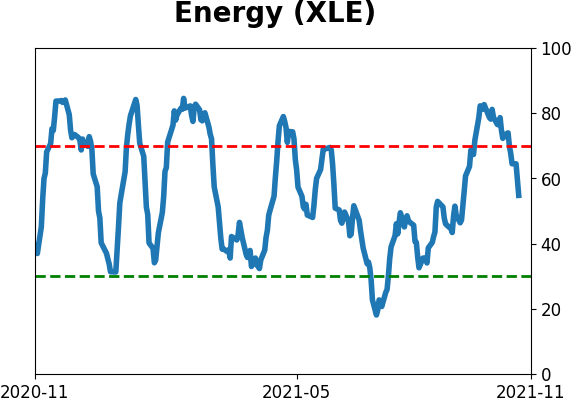
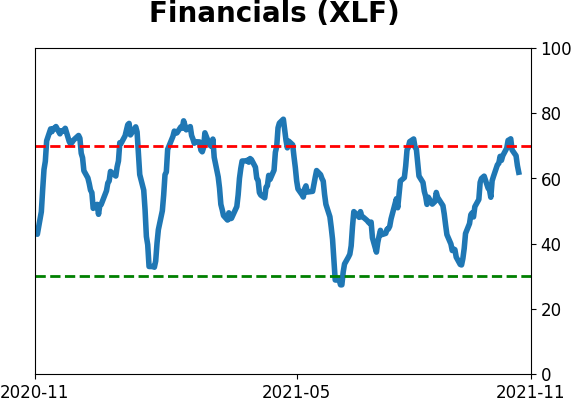
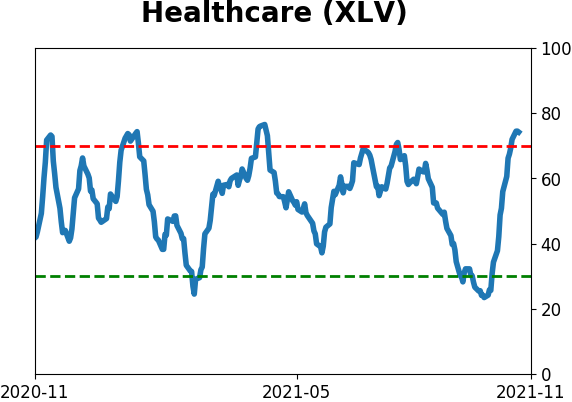
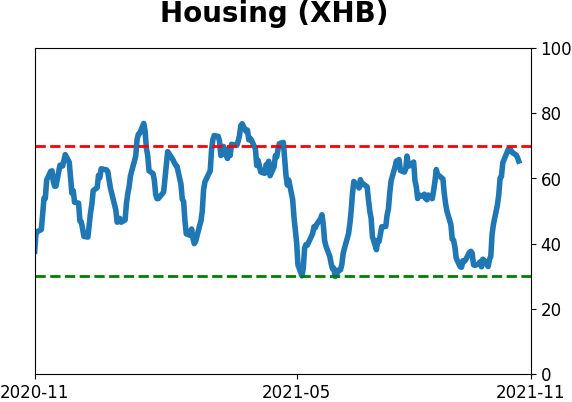
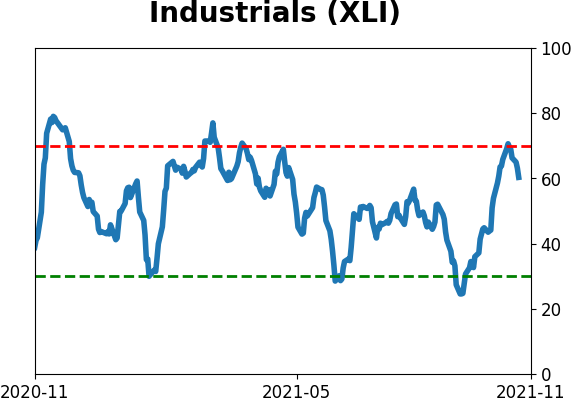
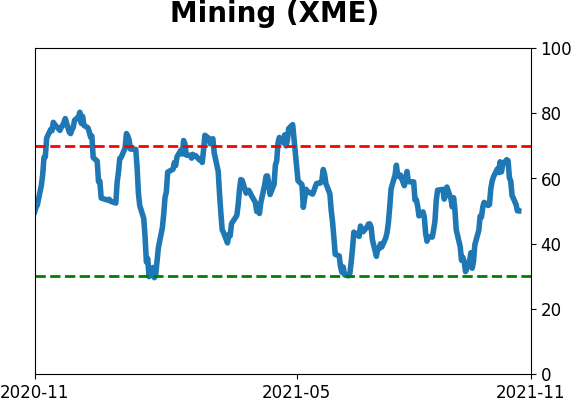
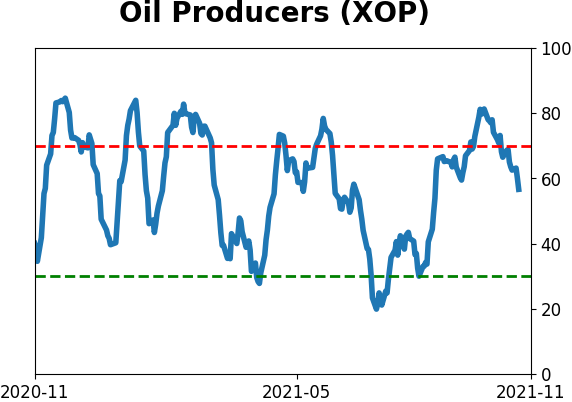
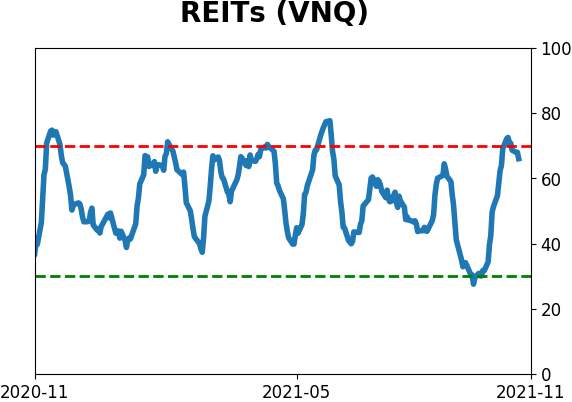
Sector ETF's - 10-Day Moving Average
|
|
|
Country ETF's - 10-Day Moving Average
|
|
|
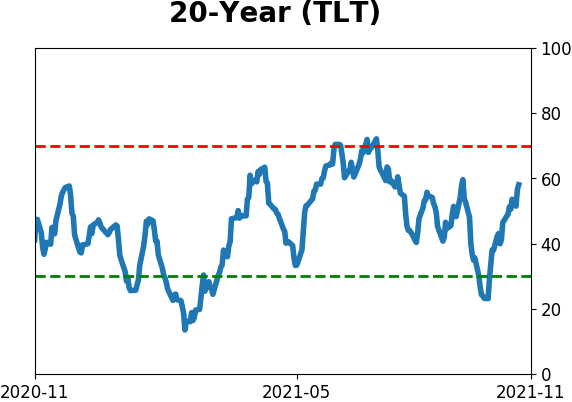
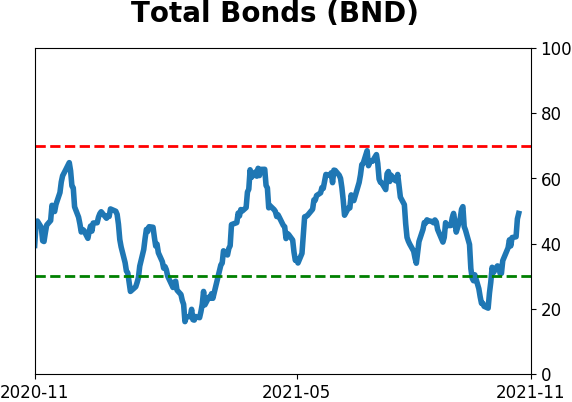
Bond ETF's - 10-Day Moving Average
|
|
|
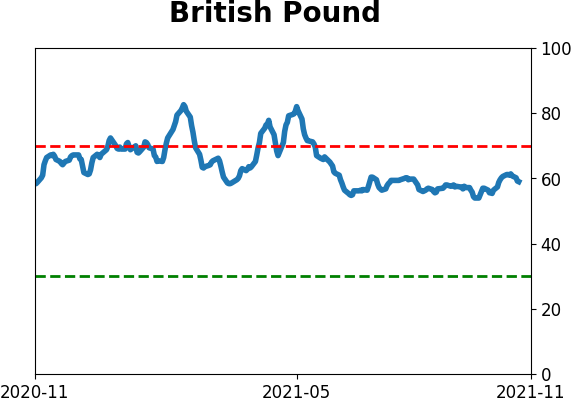
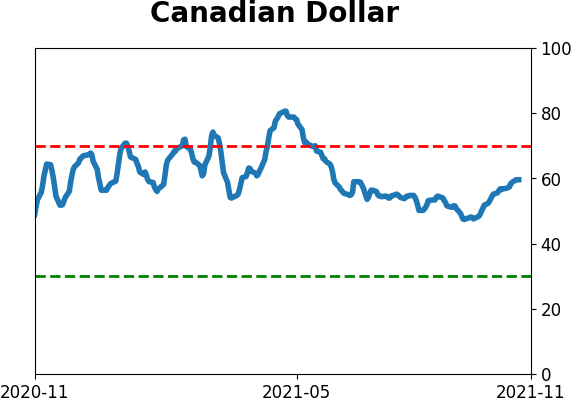
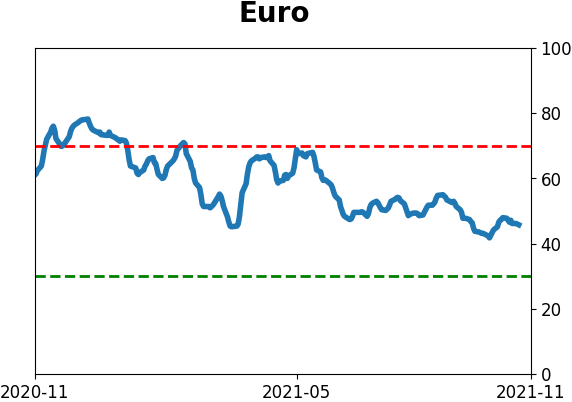
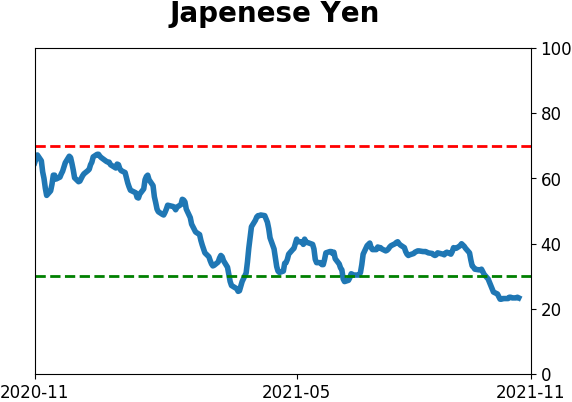
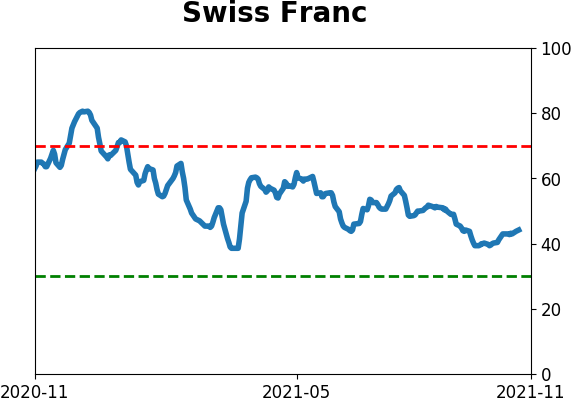
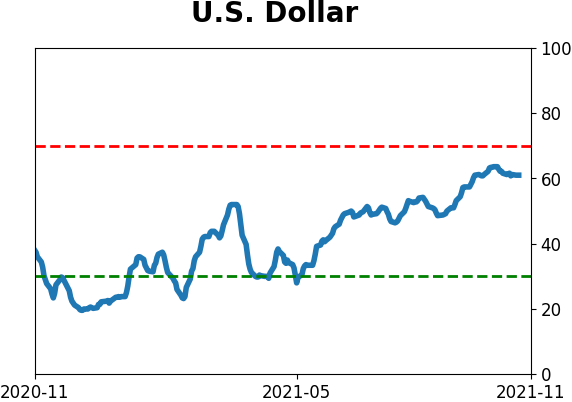
Currency ETF's - 5-Day Moving Average
|
|
|
Commodity ETF's - 5-Day Moving Average
|
|