Headlines
|
|
Investor Behavior Cycles Back to Full Risk-On Mode:
In a quick turnabout, investors have cycled from risk-off to risk-on behavior. An aggregate model shows that nearly all major indicators are showing investors in risk-on mode. This has preceded weak short-term returns, but strong long-term ones.
Bottom Line:
STOCKS: Weak buy
The speculative frenzy in February is wrung out. There are some signs of pessimism, but the most compelling data show that buyers consistently tend to return once the first signs of extreme momentum end, especially as we head into a seasonally positive time of year. See the Outlook & Allocations page for more. BONDS: Hold
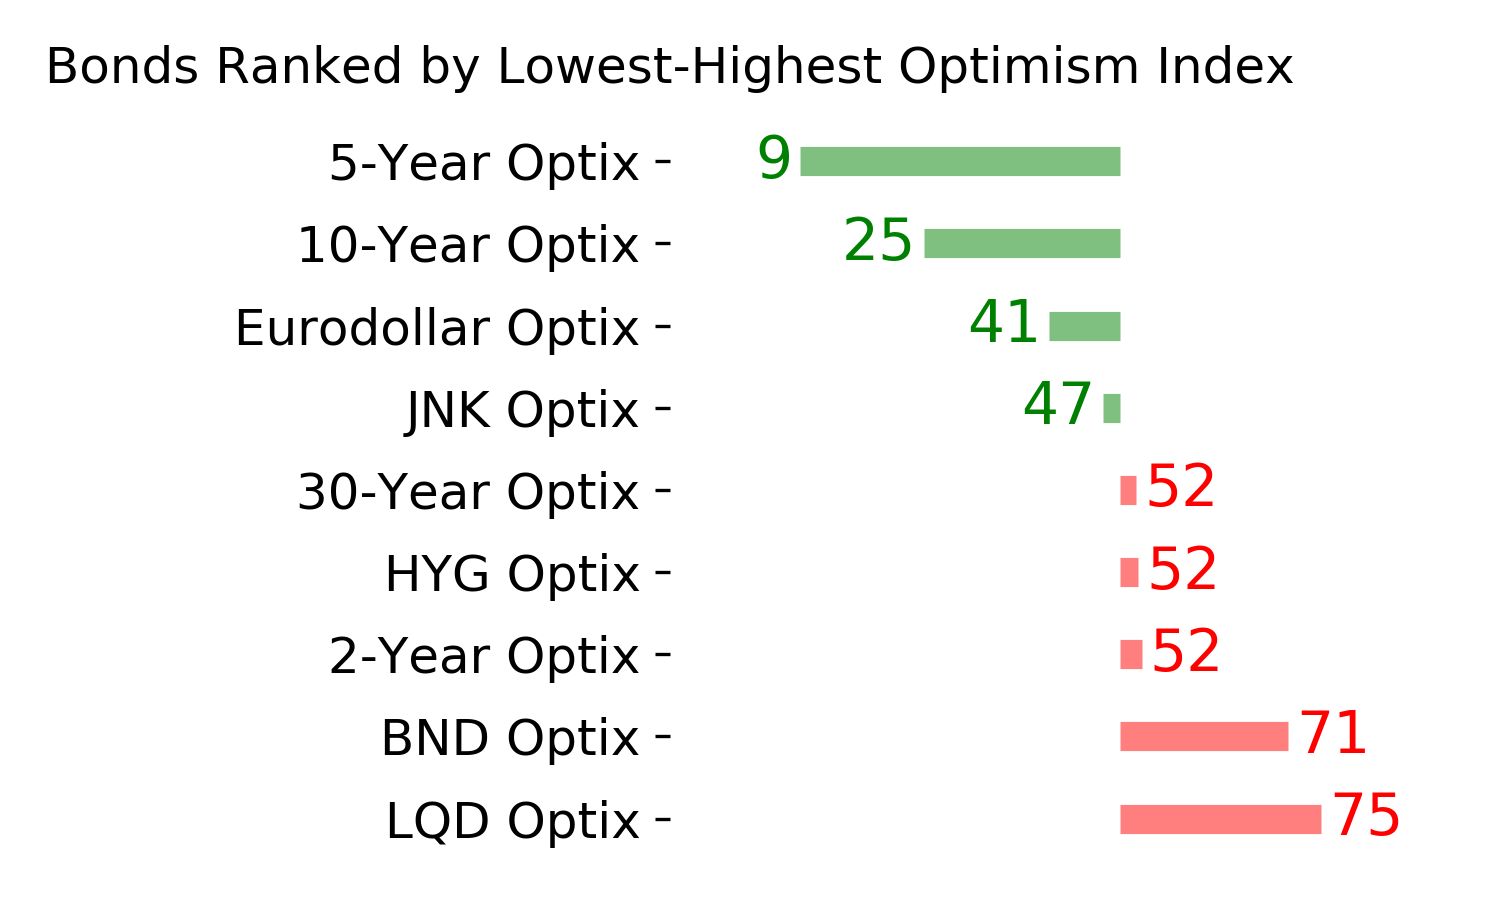
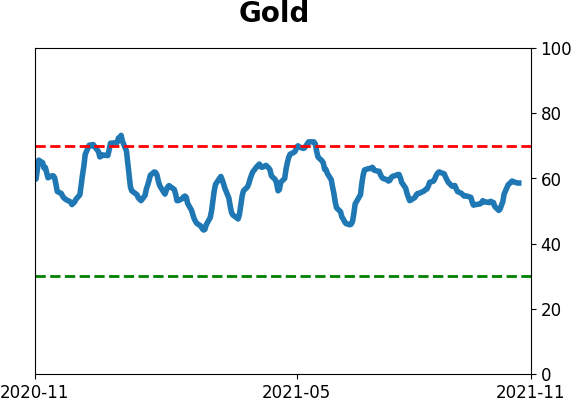
Various parts of the market got hit in March, with the lowest Bond Optimism Index we usually see during healthy environments. Bond prices have modest recovered and there is no edge among the data we follow. GOLD: Hold
Gold and miners were rejected after trying to recover above their 200-day averages in May. Lately, some medium-term (not long-term) oversold extremes in breadth measures among miners have triggered.
|
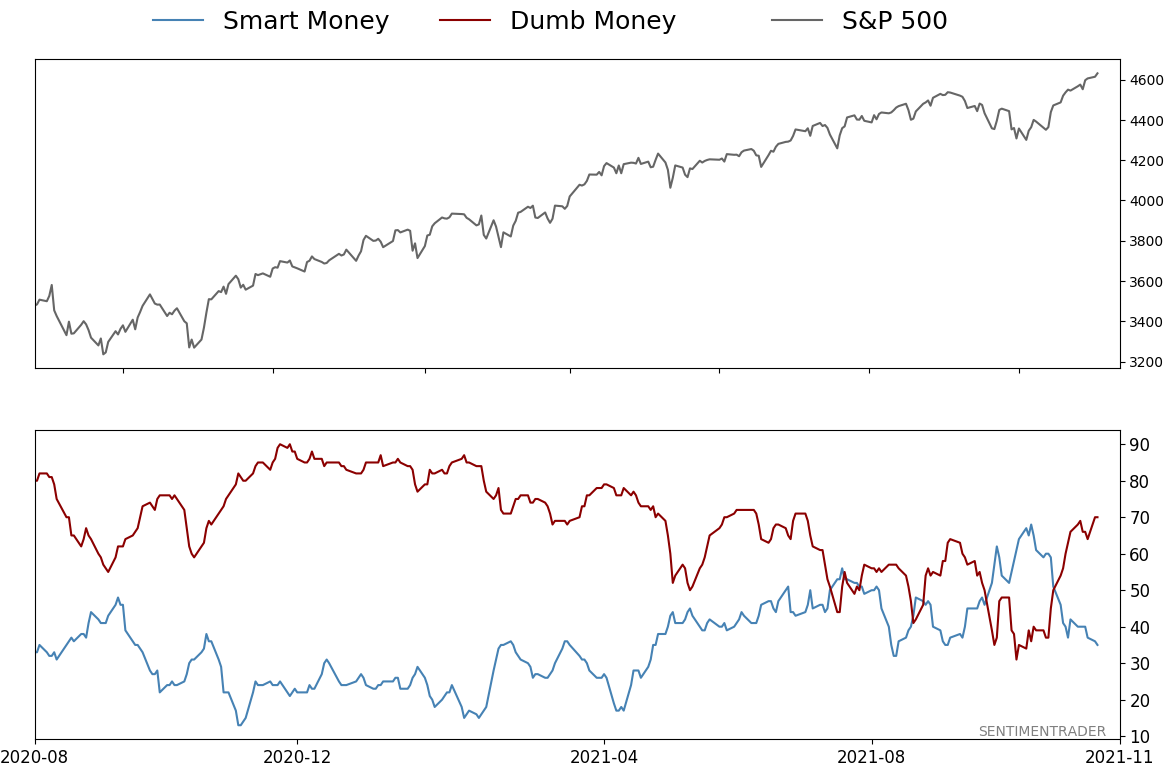
Smart / Dumb Money Confidence
|
Smart Money Confidence: 35%
Dumb Money Confidence: 70%
|
|
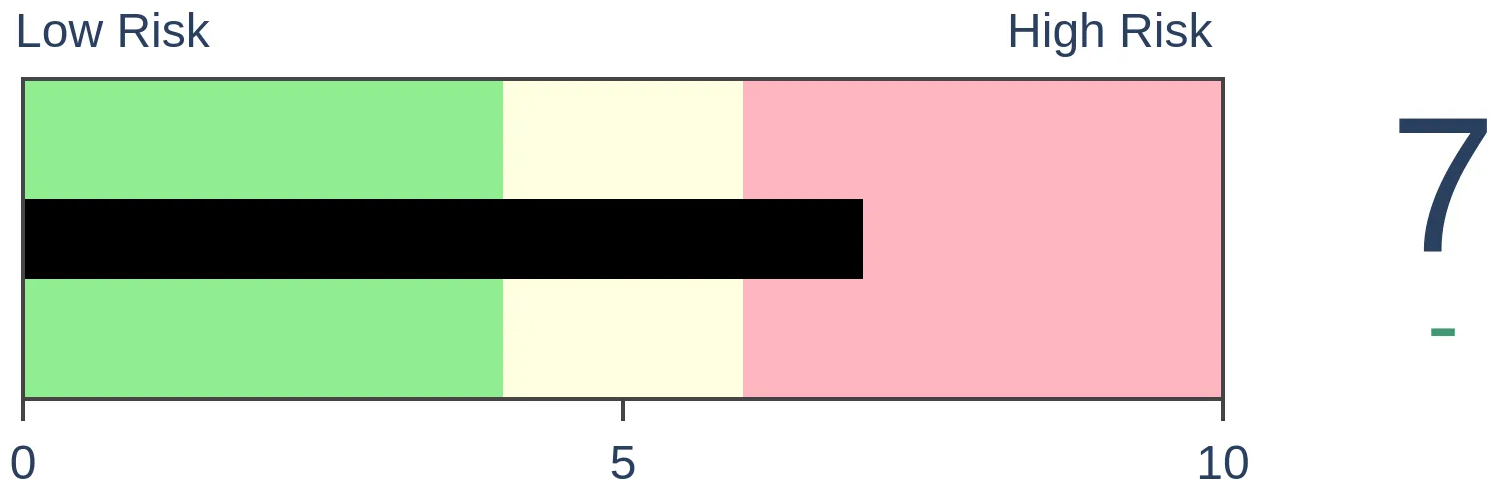
Risk Levels
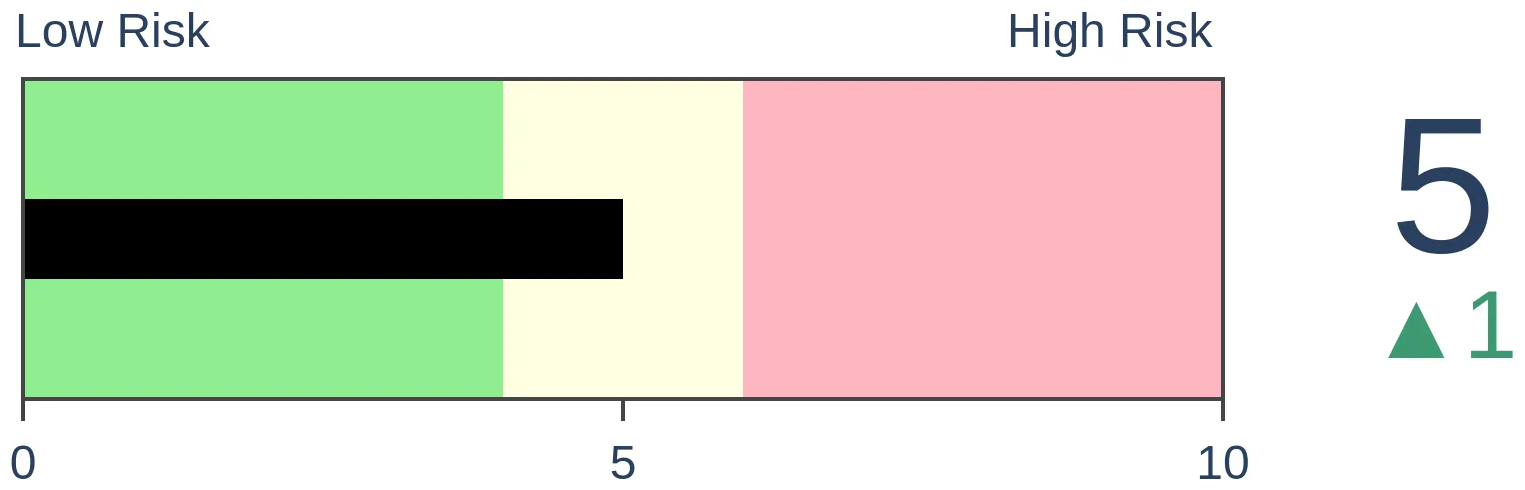
Stocks Short-Term

|
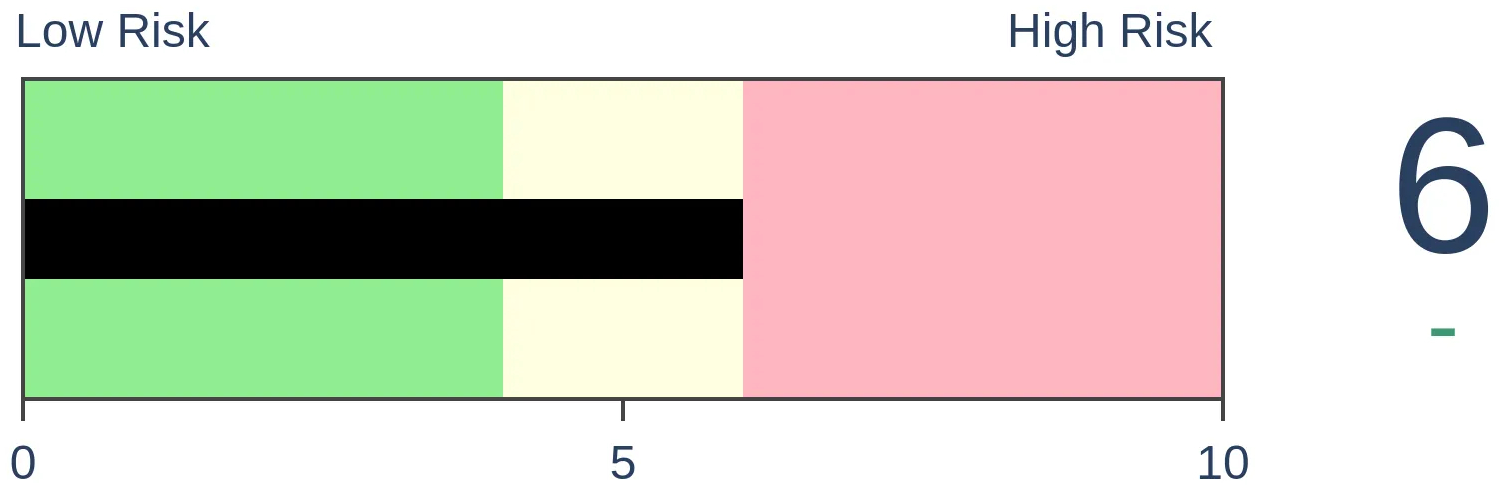
Stocks Medium-Term
|
|
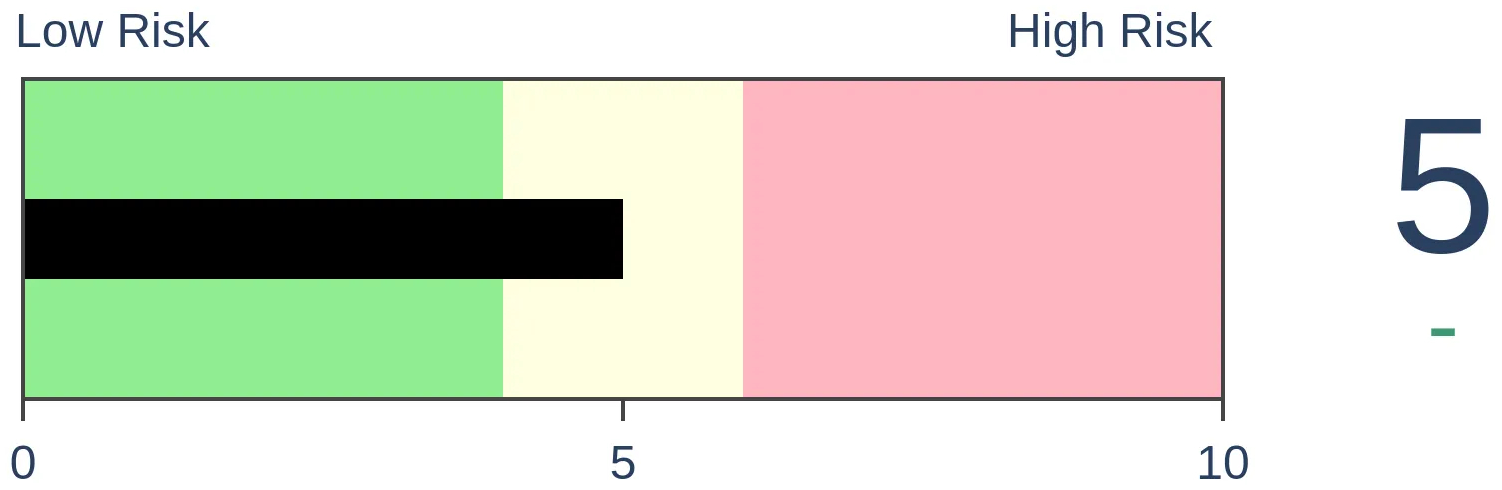
Bonds
|
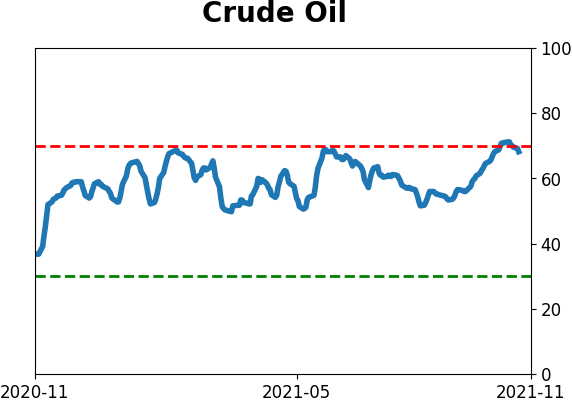
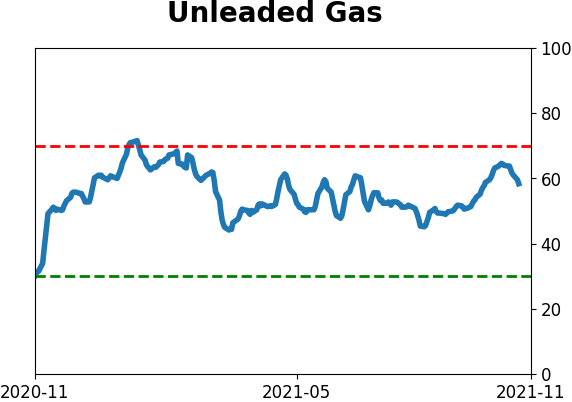
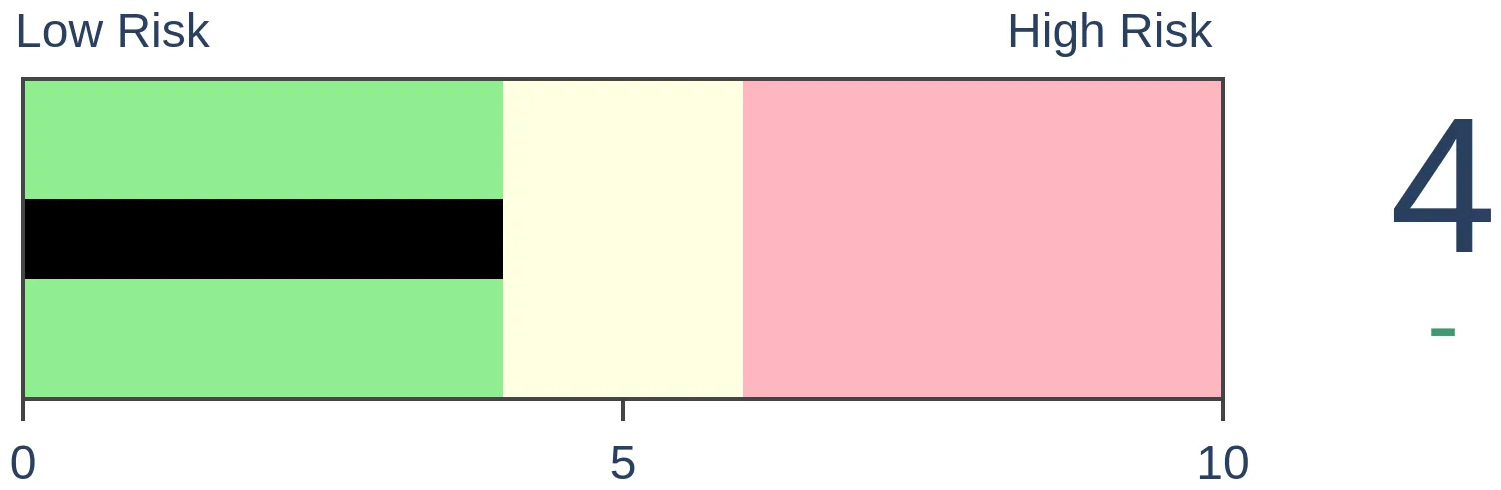
Crude Oil
|
|
Gold
|
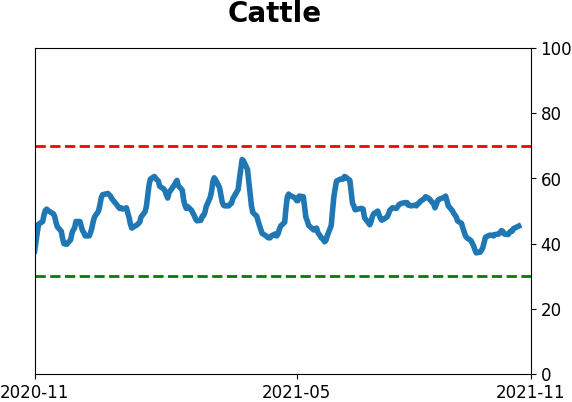
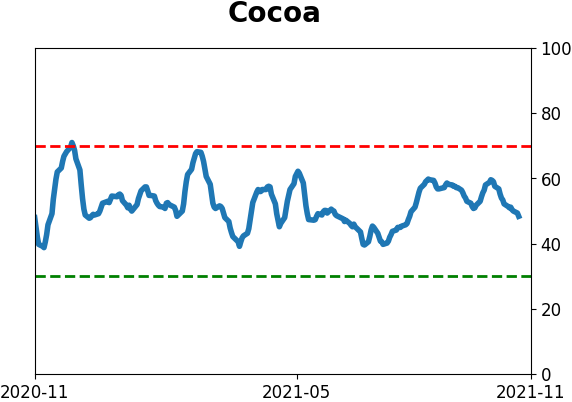
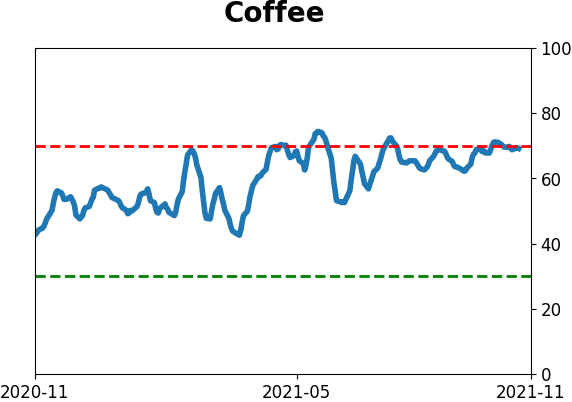
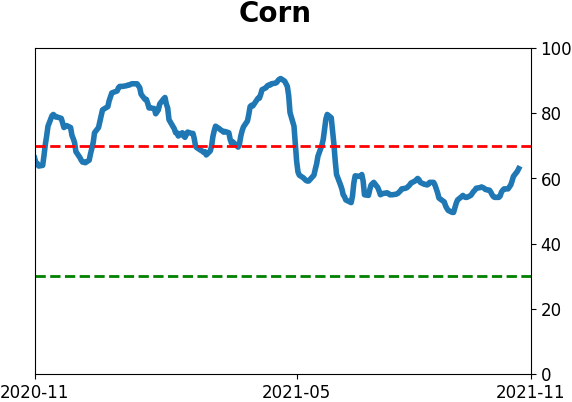
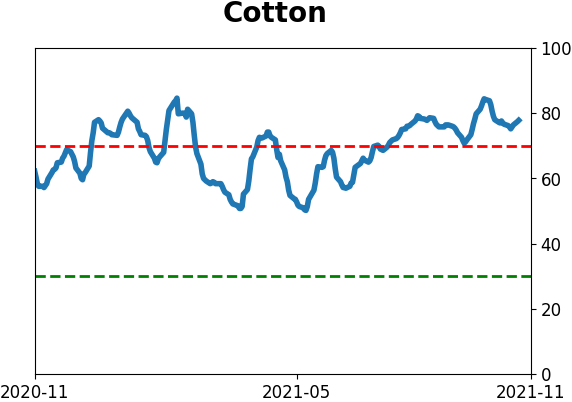
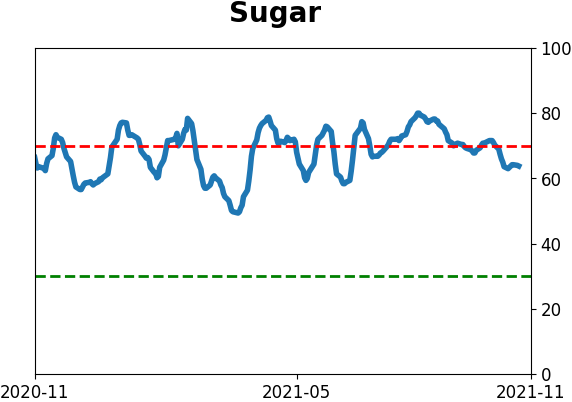
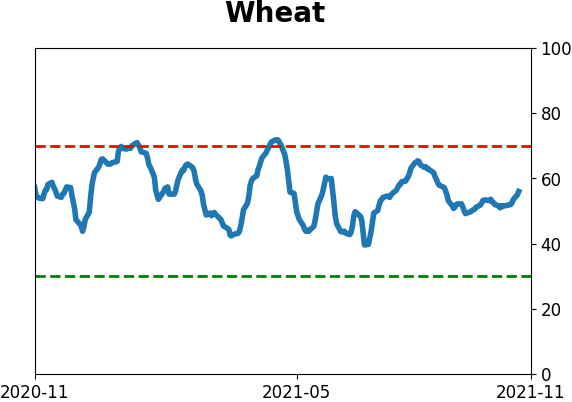
Agriculture
|
|
Research
By Jason Goepfert
BOTTOM LINE
In a quick turnabout, investors have cycled from risk-off to risk-on behavior. An aggregate model shows that nearly all major indicators are showing investors in risk-on mode. This has preceded weak short-term returns, but strong long-term ones.
FORECAST / TIMEFRAME
None
|
Investors are fully back in risk-on mode.
By early October, stocks had been mired in the longest pullback in over 200 days, finally ending some long momentum streaks, and risk appetite was declining fast. For the first time since the pandemic, the Risk-On/Risk-Off Indicator fell below 50% on consecutive days.
None of those were cause for concern. Historically, buyers have returned quickly after momentum and risk-taking behavior had been so strong, for so long.
RISK-ON MODEL RISES ABOVE 95%
Now that stocks have rallied again, investors are back in risk-on mode, in a big way. Speculation in options has ramped up, there is little fear of a November pullback, and almost all core indicators are showing risk-seeking behavior. More than 95% of indicators showed a risk-on attitude by late last week though that's ticked down a tad since then.
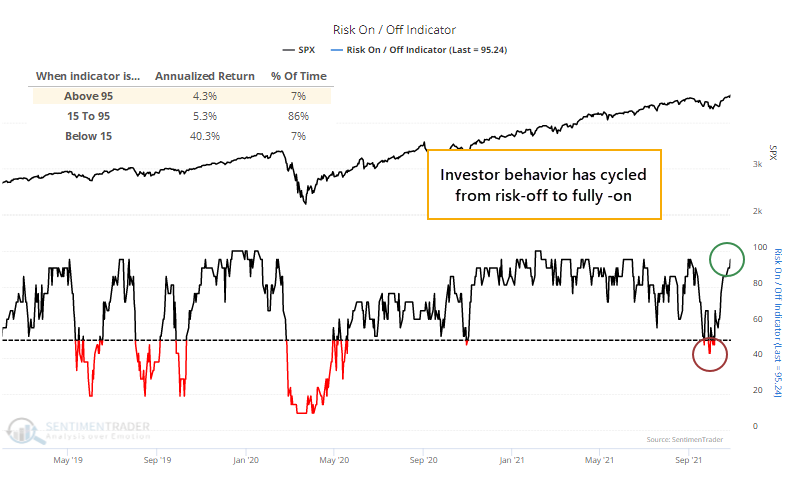
A reading of 95% is in the top 7% of all days since the year 2000, and the S&P 500's annualized return is relatively small after such high readings. It shows a bit of overheated sentiment that tends to work itself off with small gains at best in the short-term.
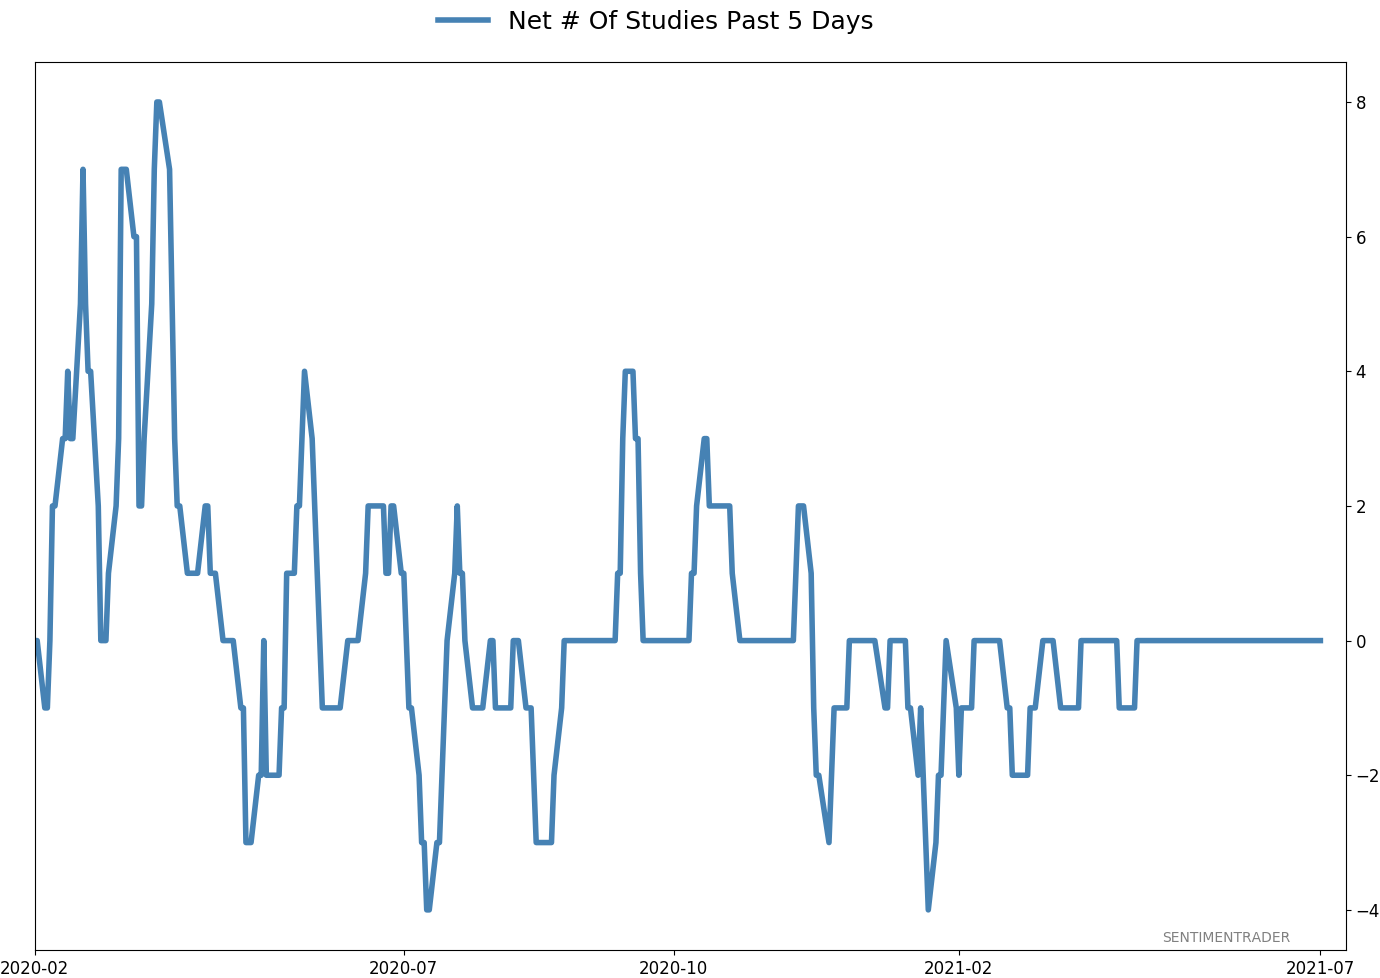
A couple of weeks ago in a premium note, Dean showed that the Risk-On/Risk-Off Indictor was quickly cycling higher. When sentiment turns like this, it tends to keep going, driving prices higher still. This is one of the quickest cycles from risk-off to fully risk-on behavior since 1998. The table shows the others.
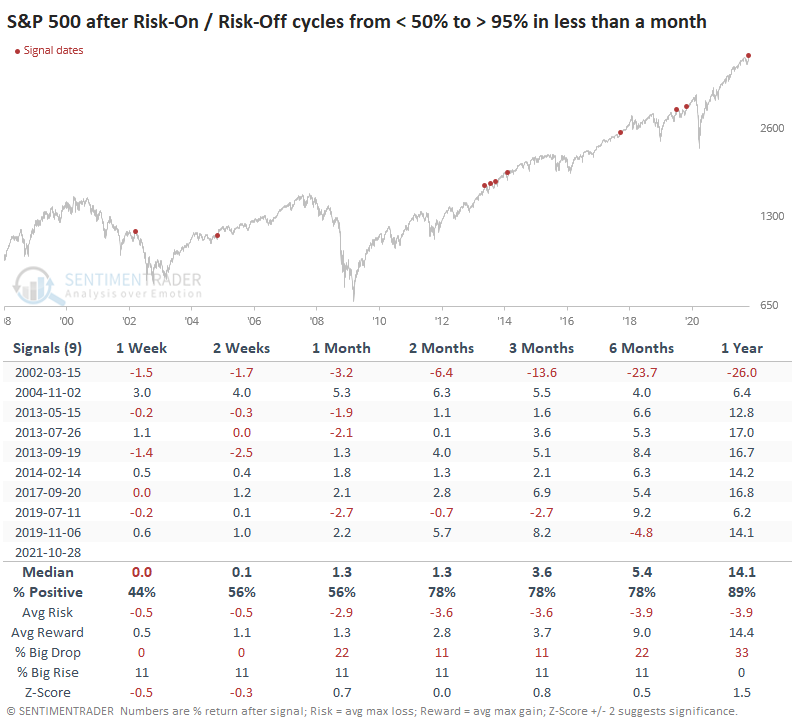
There was some short-term weakness after the others as investors took a breather. But only one, during the bear market of 2002, led to substantially lower prices within the next few months. The 2019 signal eventually preceded the pandemic crash, so there's that.
RISK-ON BEHAVIOR NEAR A HIGH LED TO EVEN HIGHER PRICES
If we add some context and only look at times when the model cycled like this while the S&P 500 was within 1% of a multi-year high, then we get signals that are more aligned with what we're seeing now.
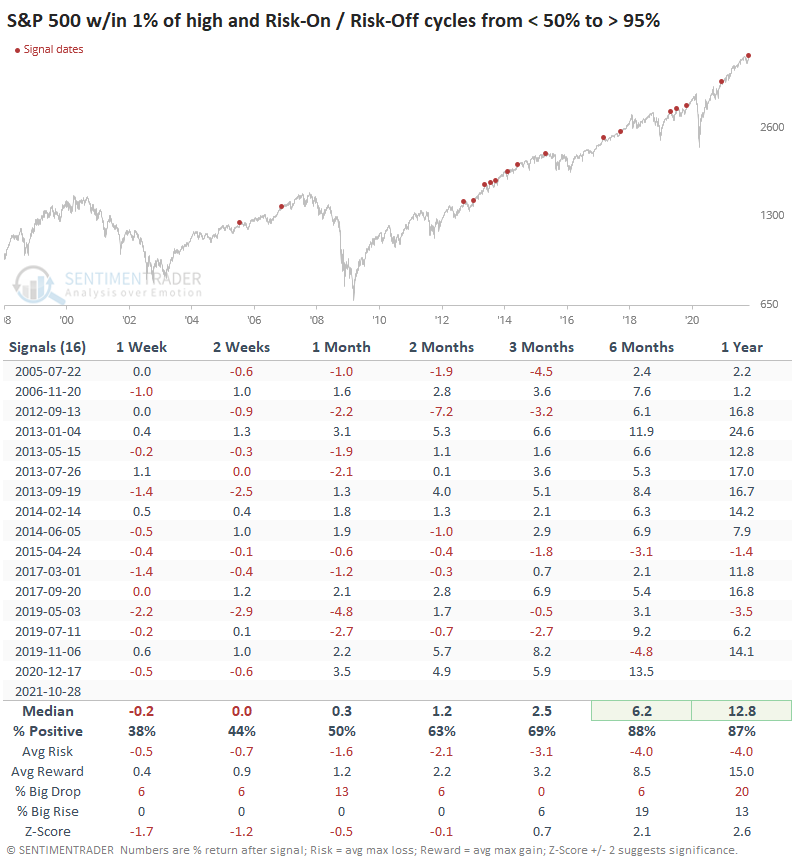
Again, shorter-term returns were weaker than average. Even clear risk-on environments need to take a rest now and then. But over the medium- to long-term, returns were well above average, with a good risk-to-reward ratio. Granted, it helps that almost all of them were triggered during one of the greatest bull markets in history, but even accounting for that, returns were above random.
Out of the 16 signals, only 4 of them preceded a loss of more than -5% at any point within the next three months. But only 5 of them preceded a gain of more than +5% as well, so while risk might be limited, so was reward. With an uptick in speculative activity, higher-beta areas of the market tend to be most at risk of a pullback. But a return to risk-on behavior is not a reason in itself to become overly defensive.
Active Studies
| Time Frame | Bullish | Bearish | | Short-Term | 2 | 0 | | Medium-Term | 8 | 0 | | Long-Term | 11 | 5 |
|
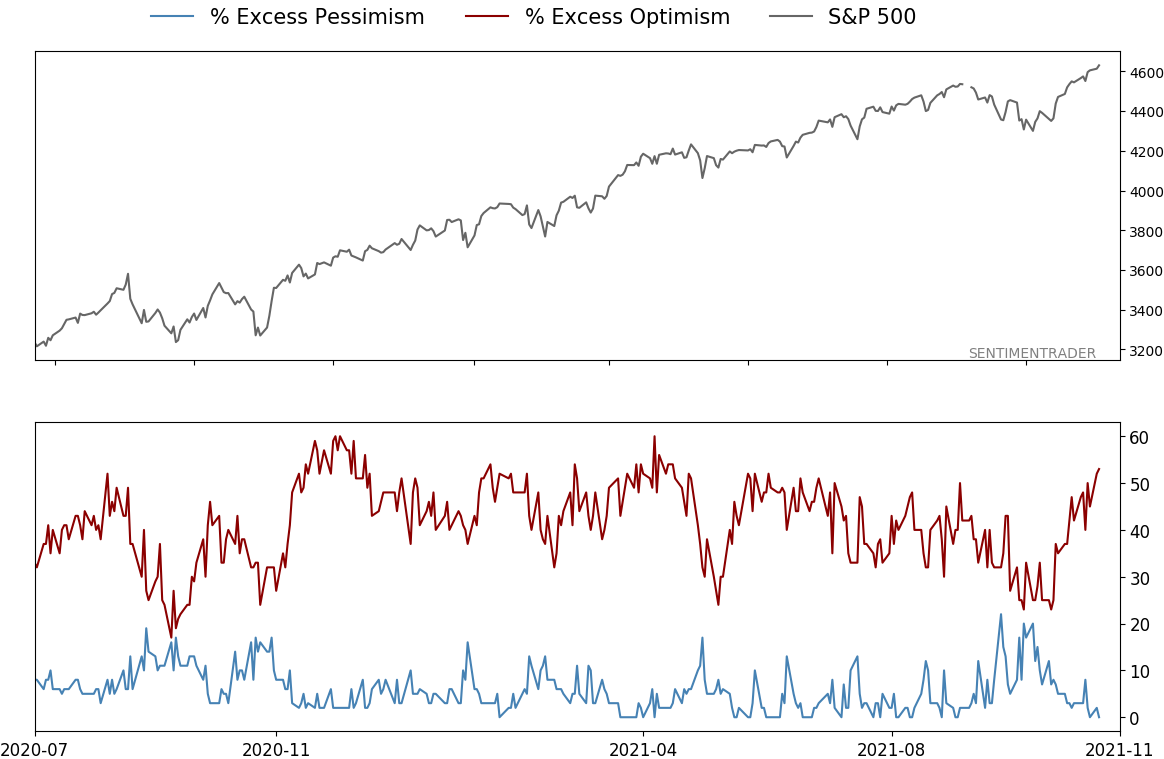
Indicators at Extremes
|
% Showing Pessimism: 0%
Bullish for Stocks
|
|
Portfolio
| Position | Description | Weight % | Added / Reduced | Date | | Stocks | RSP | 10.7 | Added 6.4% | 2021-10-01 | | Bonds | 32.7% BND, 7.1% SCHP | 39.8 | Added 8.3% | 2021-10-26 | | Commodities | GCC | 2.4 | Reduced 2.1%
| 2020-09-04 | | Precious Metals | GDX | 4.6 | Reduced 4.2% | 2021-05-19 | | Special Situations | 9.8% KWEB, 4.7% XLE, 2.9% PSCE | 17.3 | Added 9.78% | 2021-10-01 | | Cash | | 24.1 | | |
|
Updates (Changes made today are underlined)
Much of our momentum and trend work has remained positive for several months, with some scattered exceptions. Almost all sentiment-related work has shown a poor risk/reward ratio for stocks, especially as speculation drove to record highs in exuberance in February. Much of that has worn off, and most of our models are back toward neutral levels. There isn't much to be excited about here. The same goes for bonds and even gold. Gold has been performing well lately and is back above long-term trend lines. The issue is that it has a poor record of holding onto gains when attempting a long-term trend change like this, so we'll take a wait-and-see approach. Momentum has ebbed quickly in recent weeks, and nearing oversold levels in some indicators. This can be a dangerous area, with a lot of short-term volatility, but we'd be more inclined to add medium- to long-term exposure rather than sell on much more of a decline, thanks to already rock-bottom exposure. Other areas look more attractive, including some overseas markets. RETURN YTD: 10.8% 2020: 8.1%, 2019: 12.6%, 2018: 0.6%, 2017: 3.8%, 2016: 17.1%, 2015: 9.2%, 2014: 14.5%, 2013: 2.2%, 2012: 10.8%, 2011: 16.5%, 2010: 15.3%, 2009: 23.9%, 2008: 16.2%, 2007: 7.8%
|
|
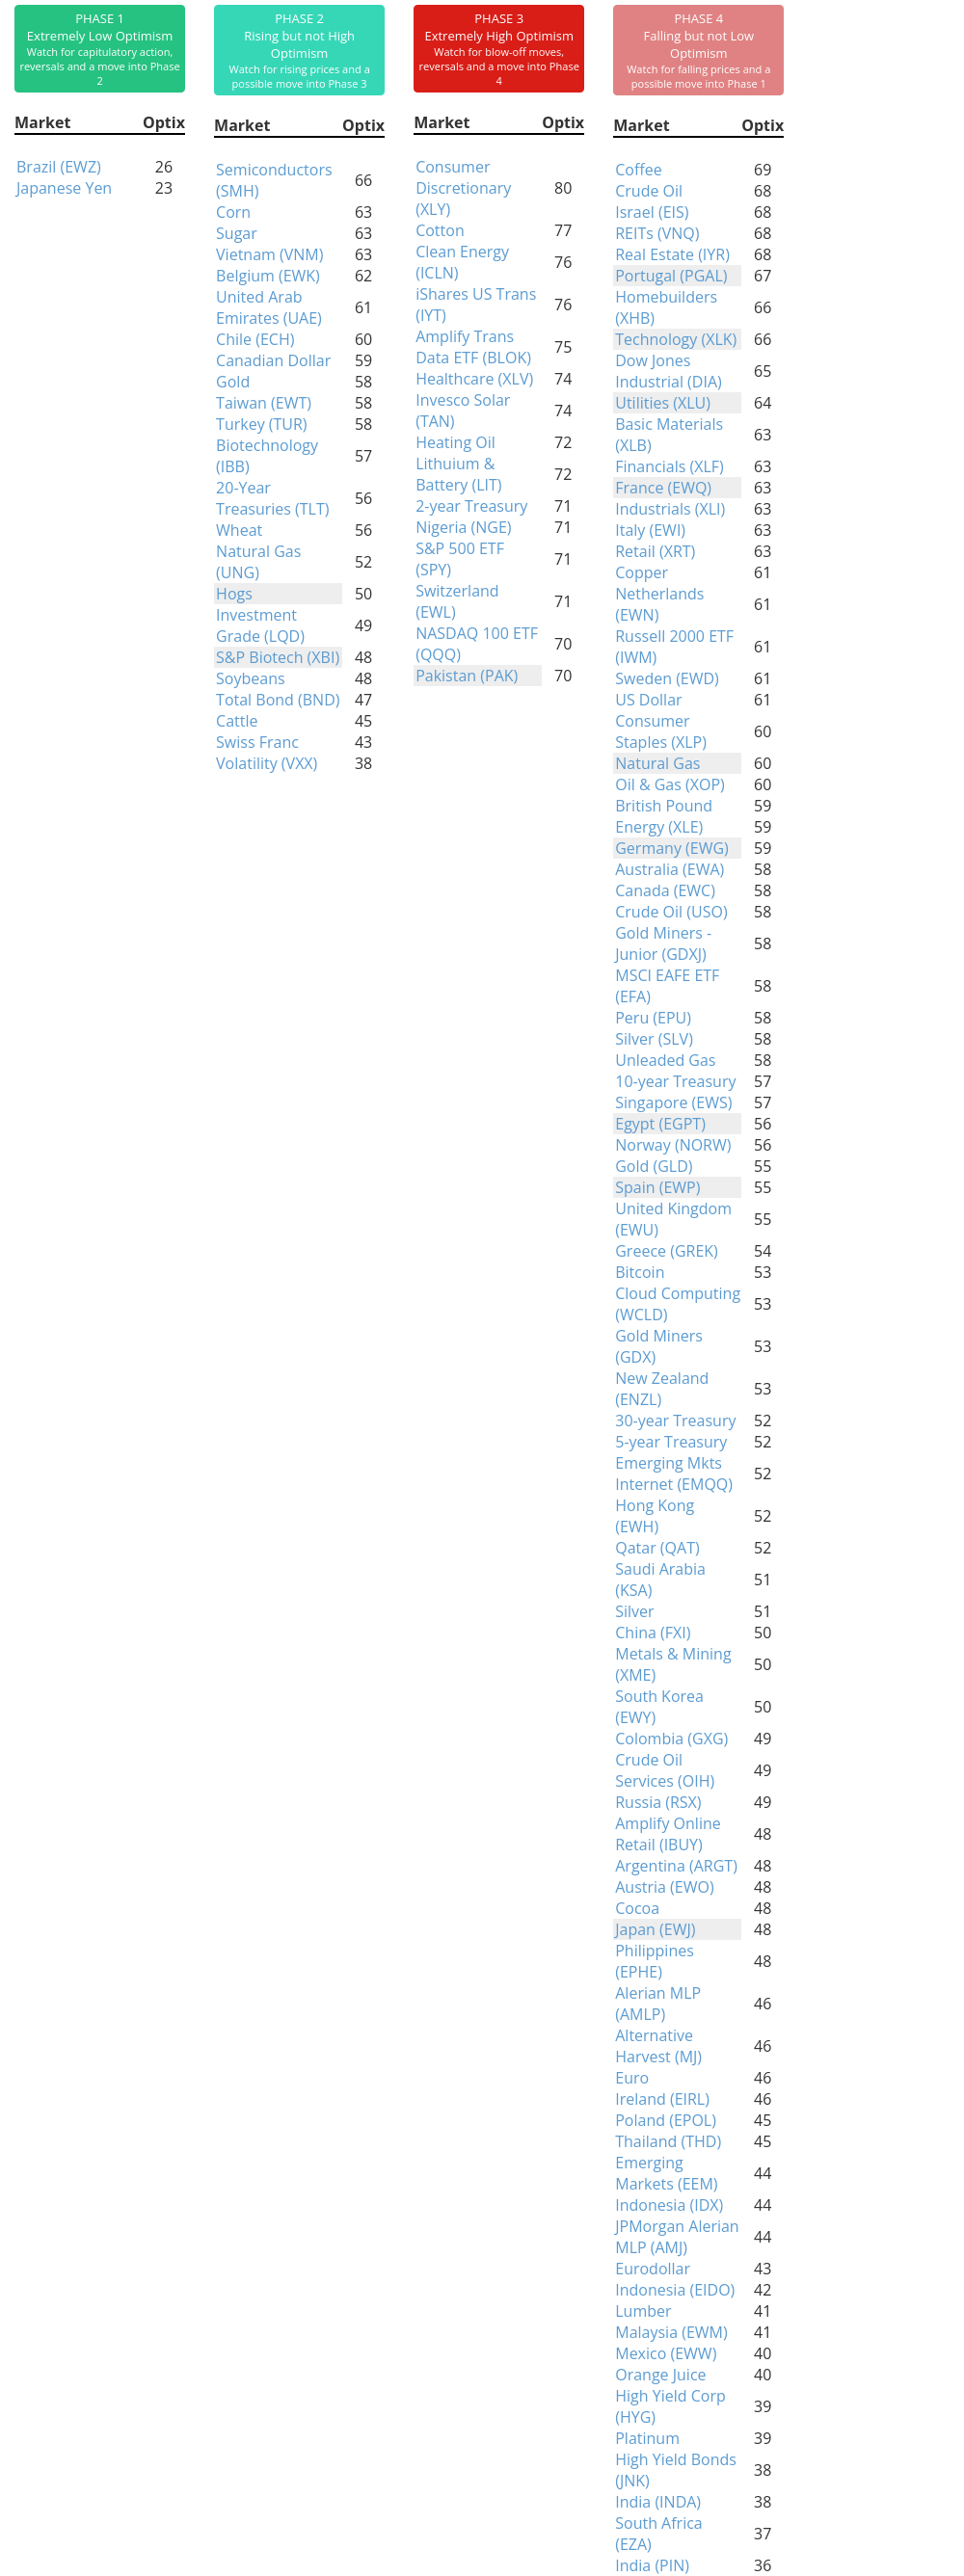
Phase Table
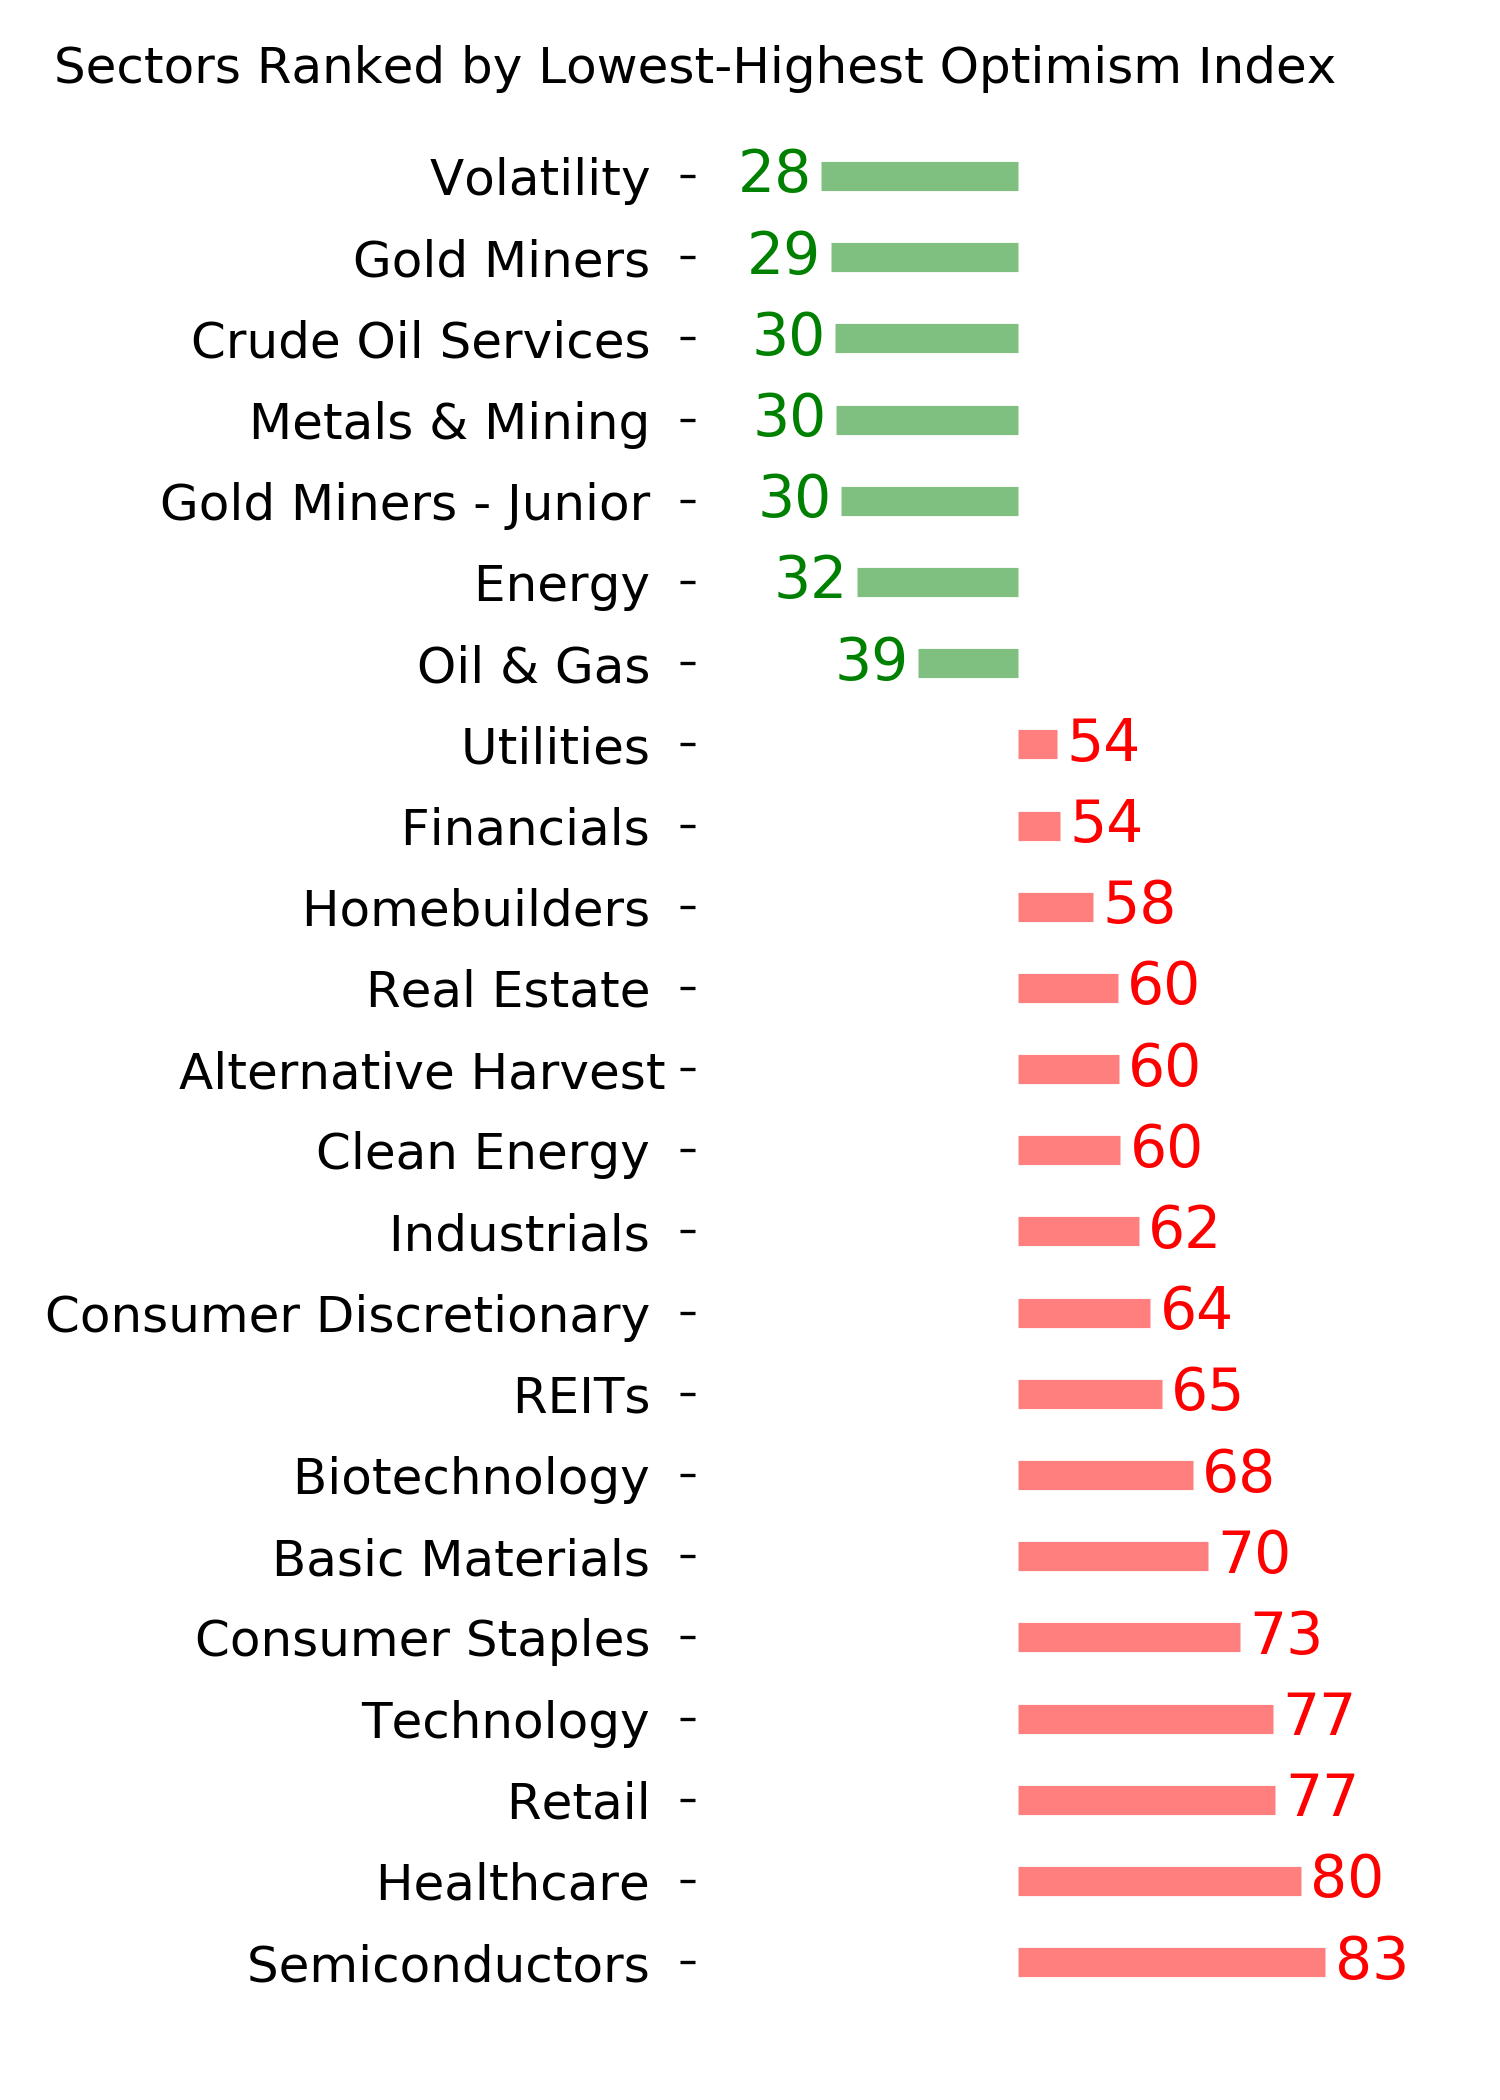
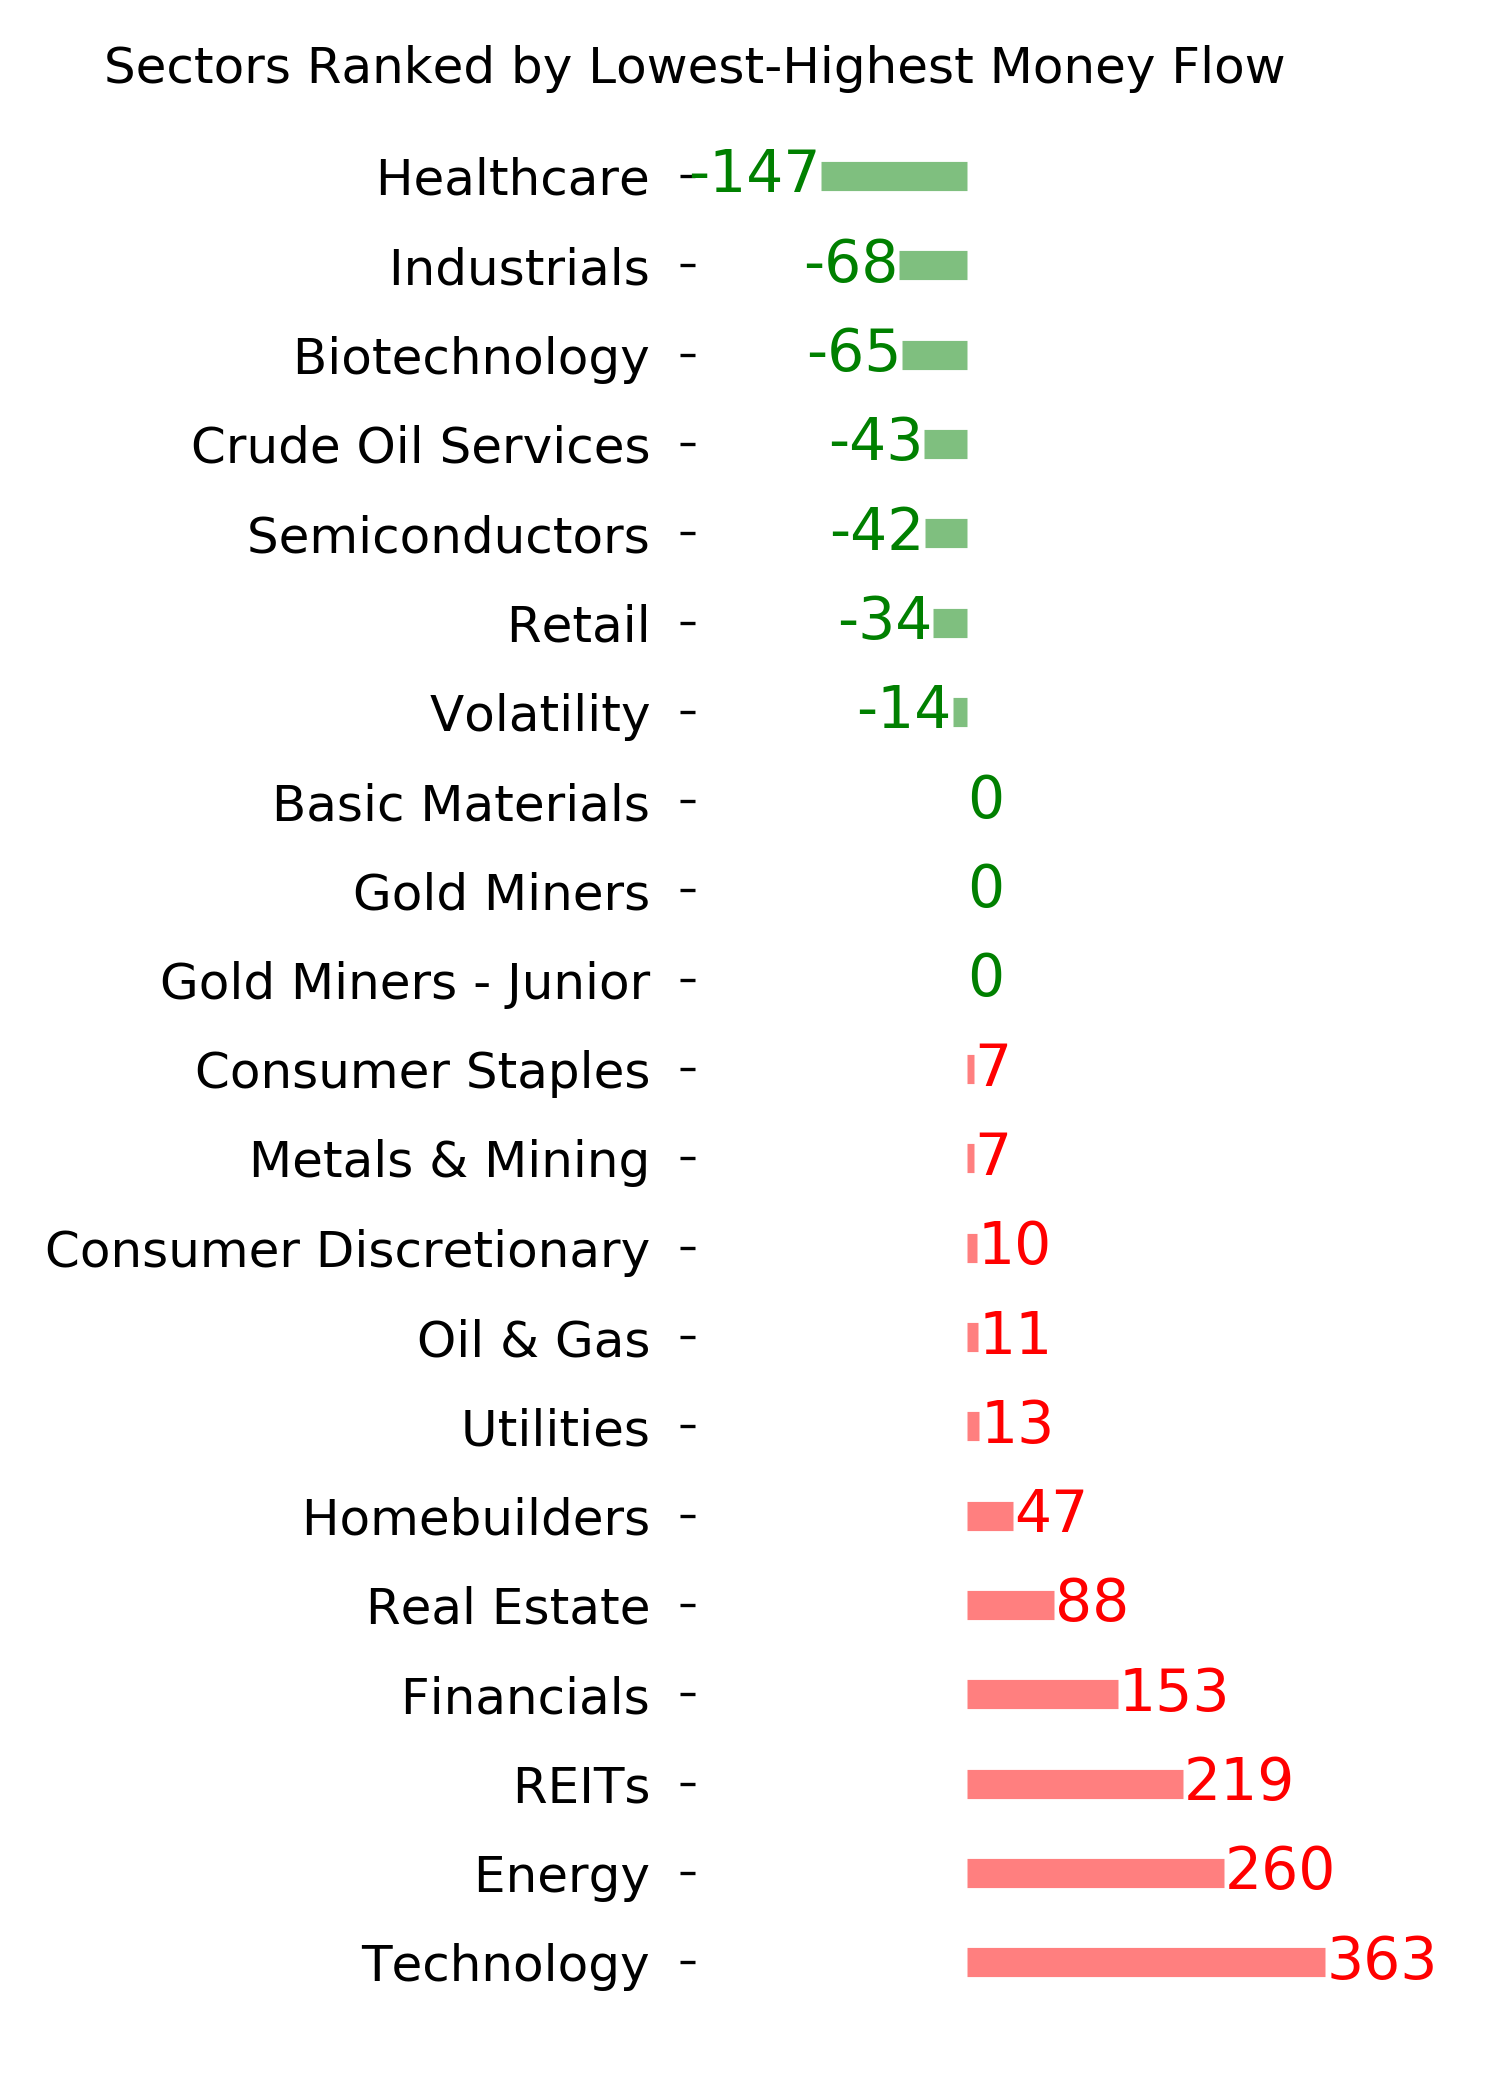
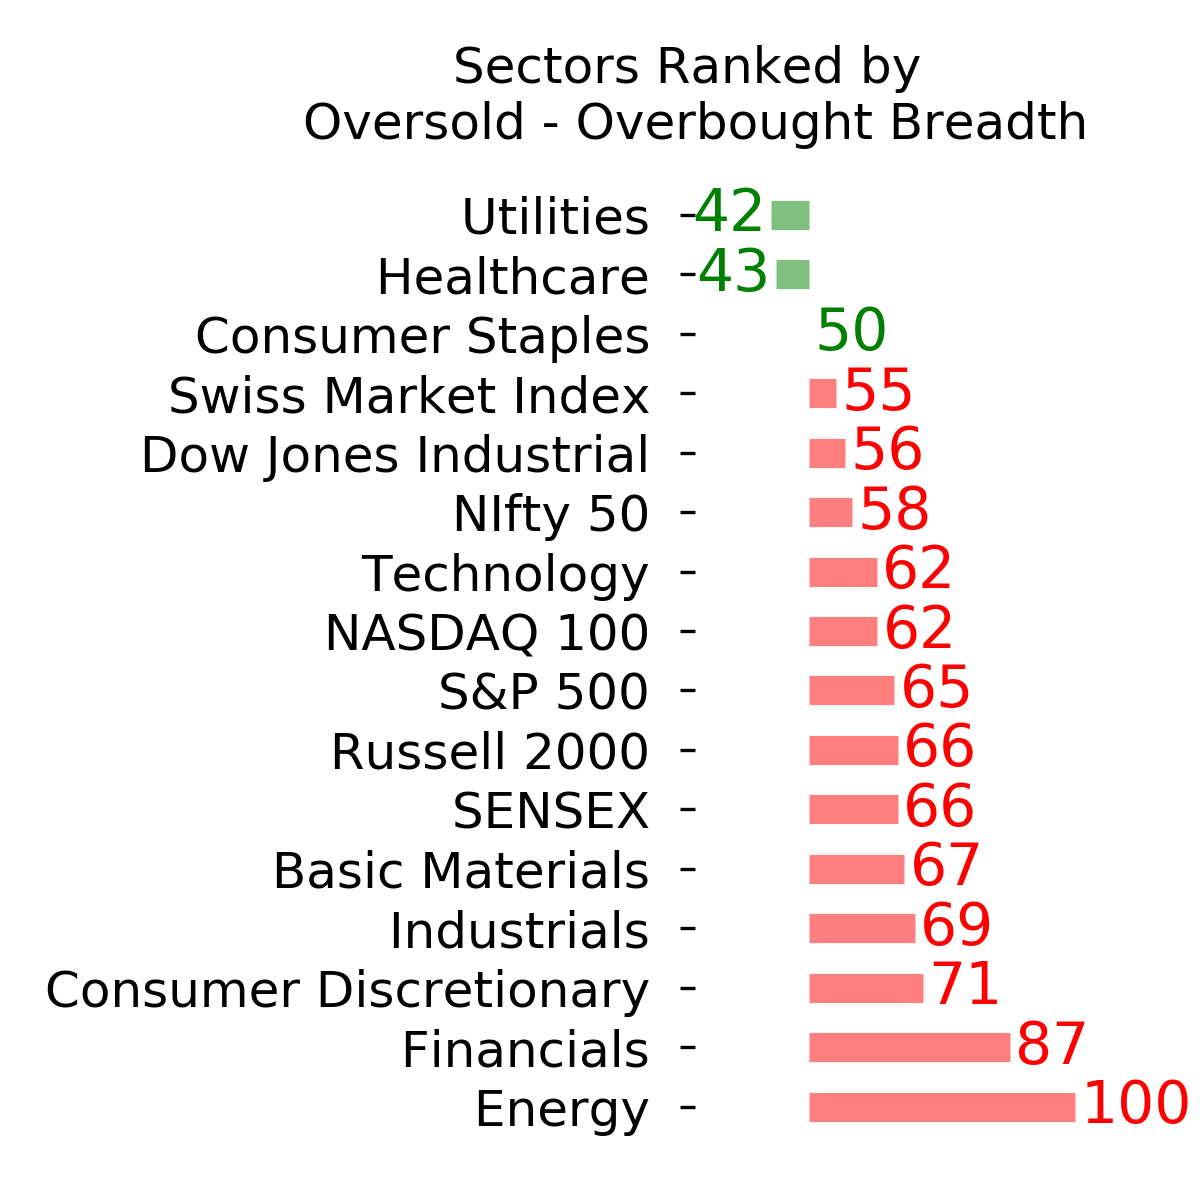
Ranks
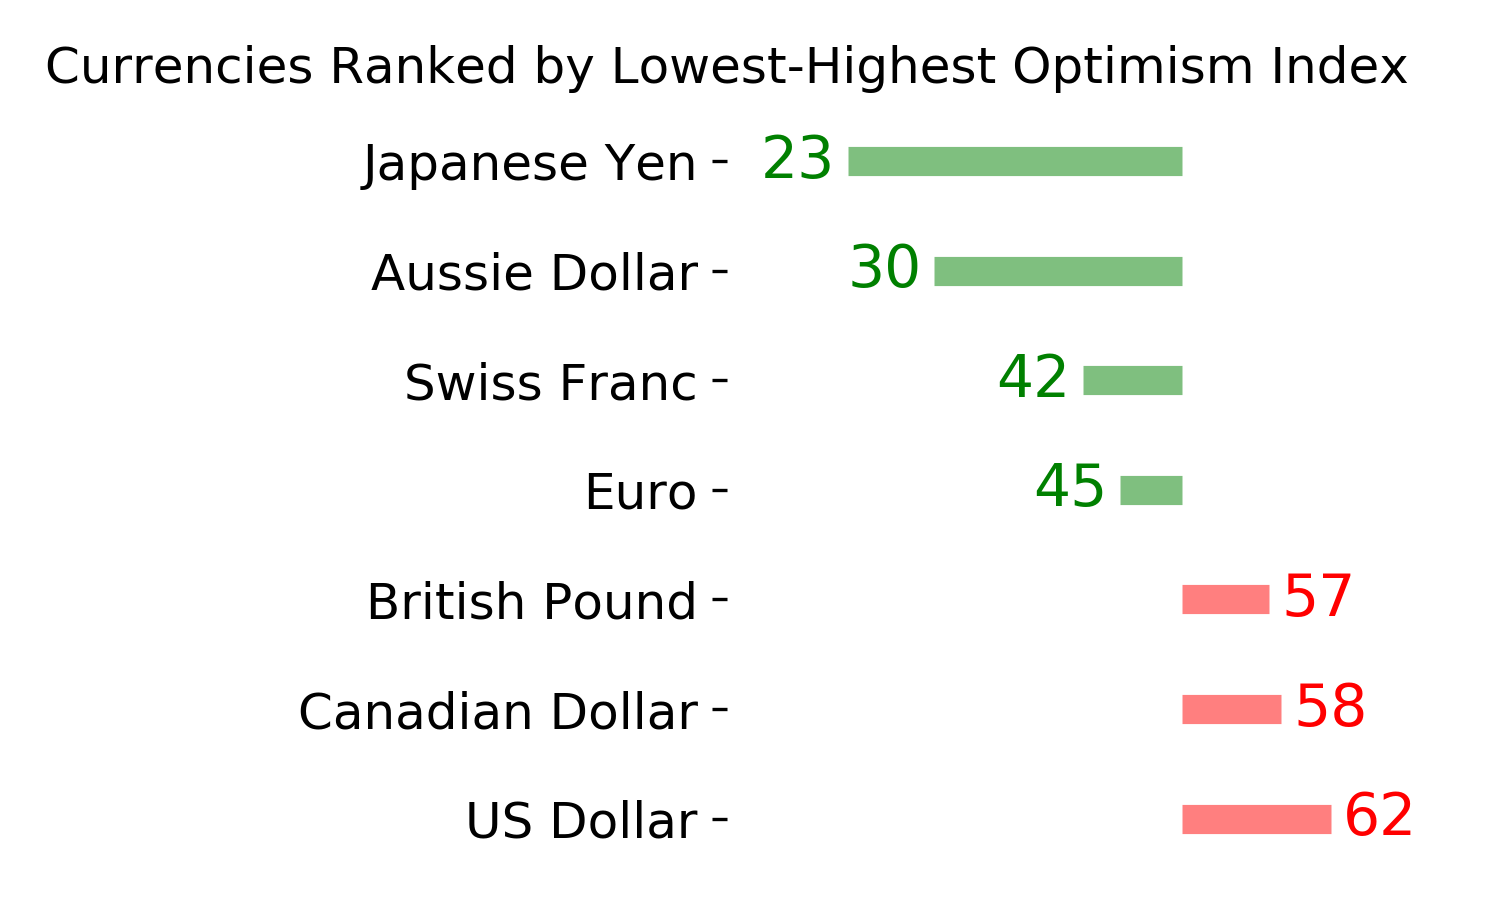
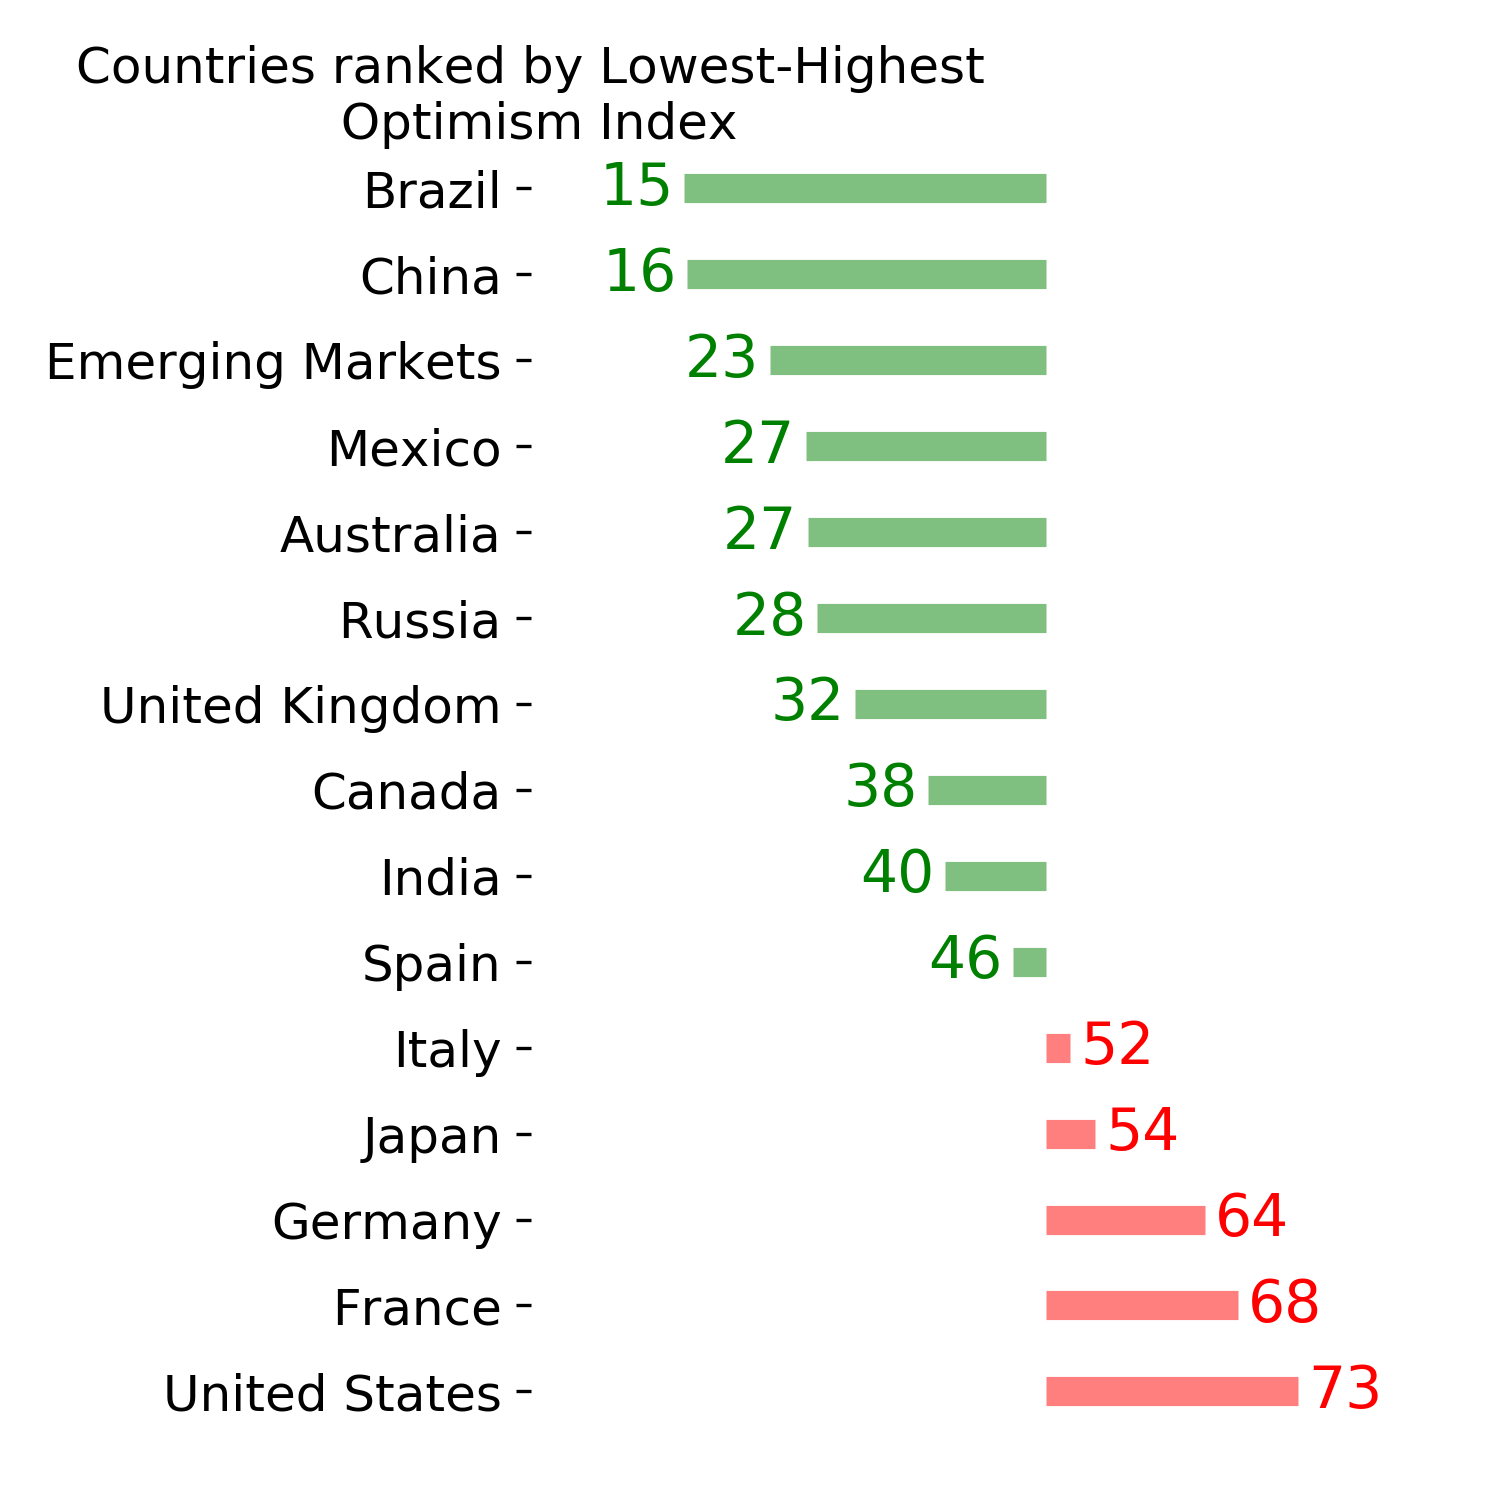
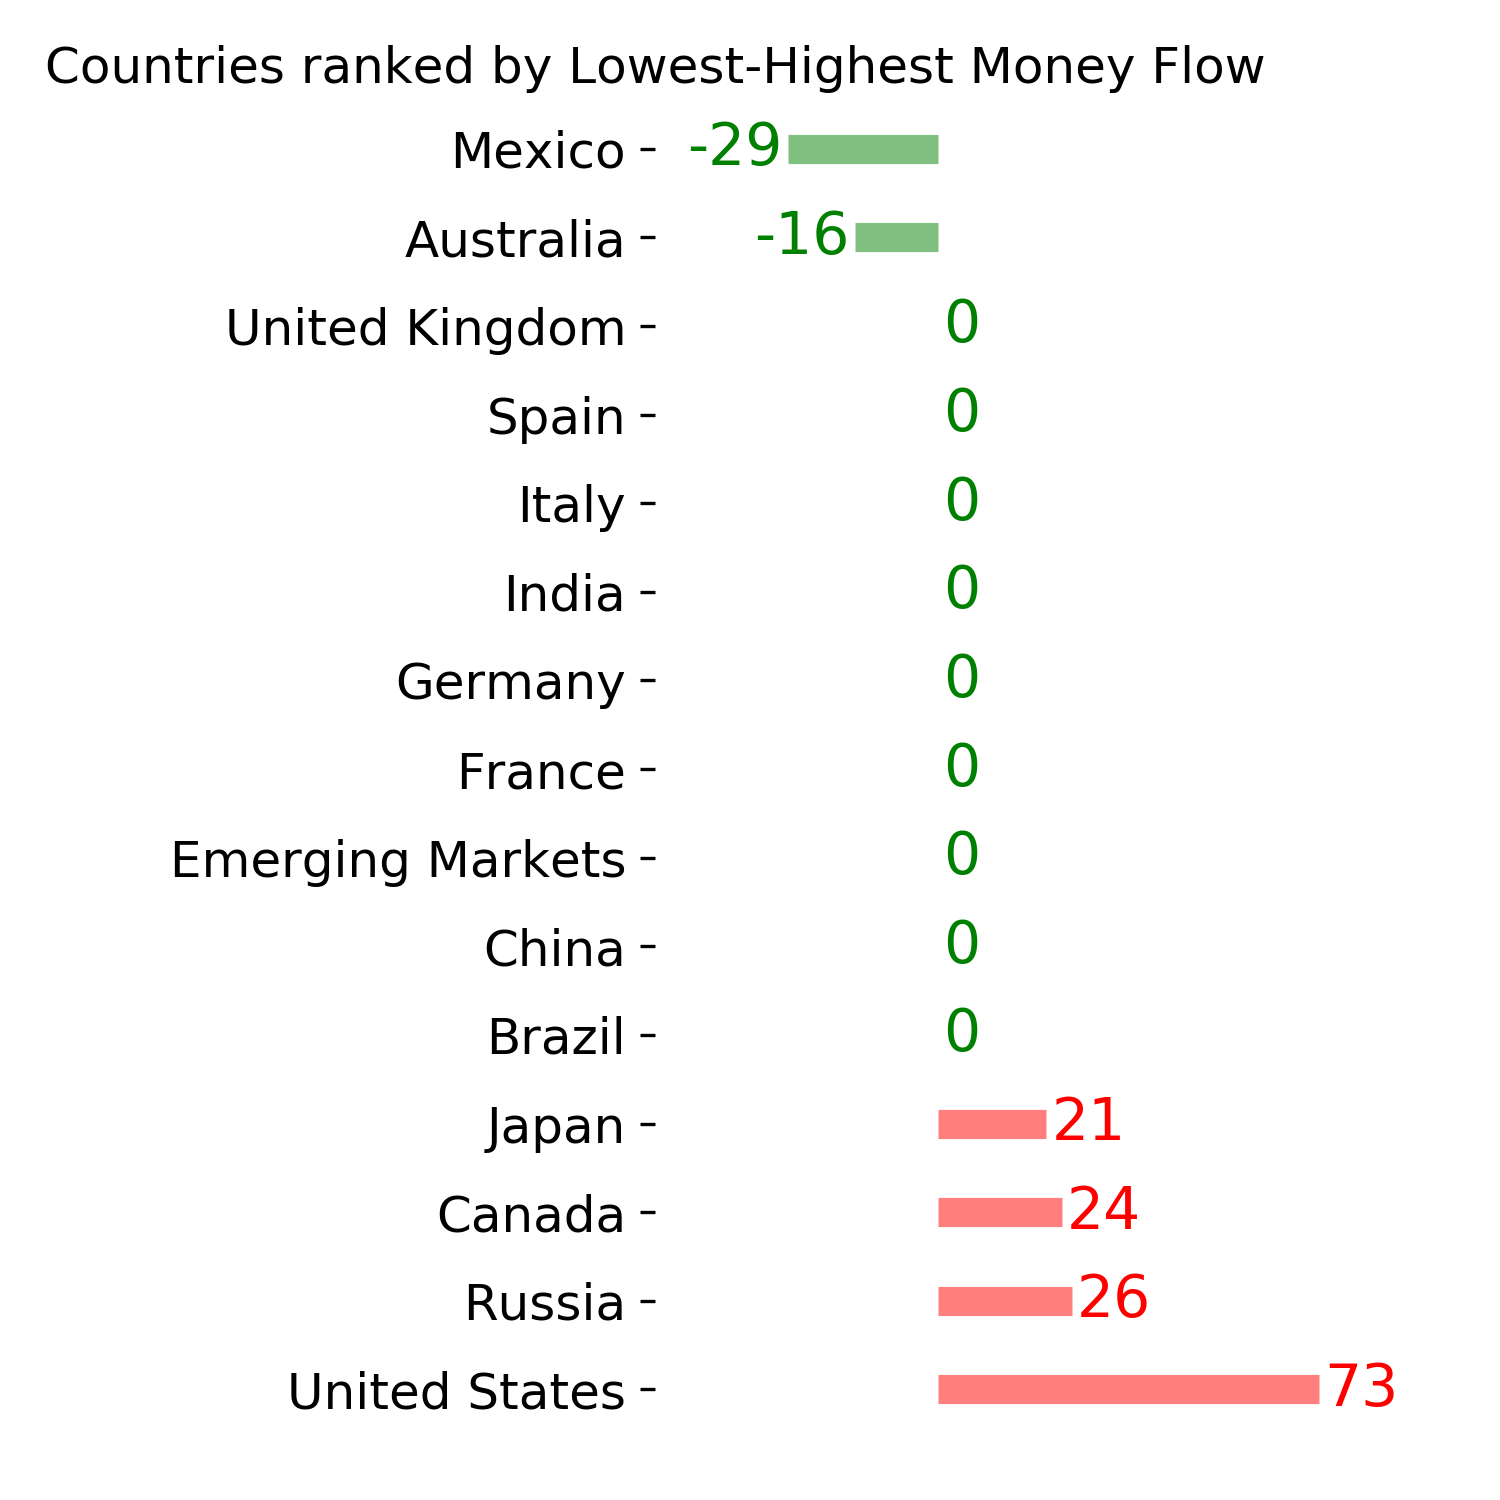
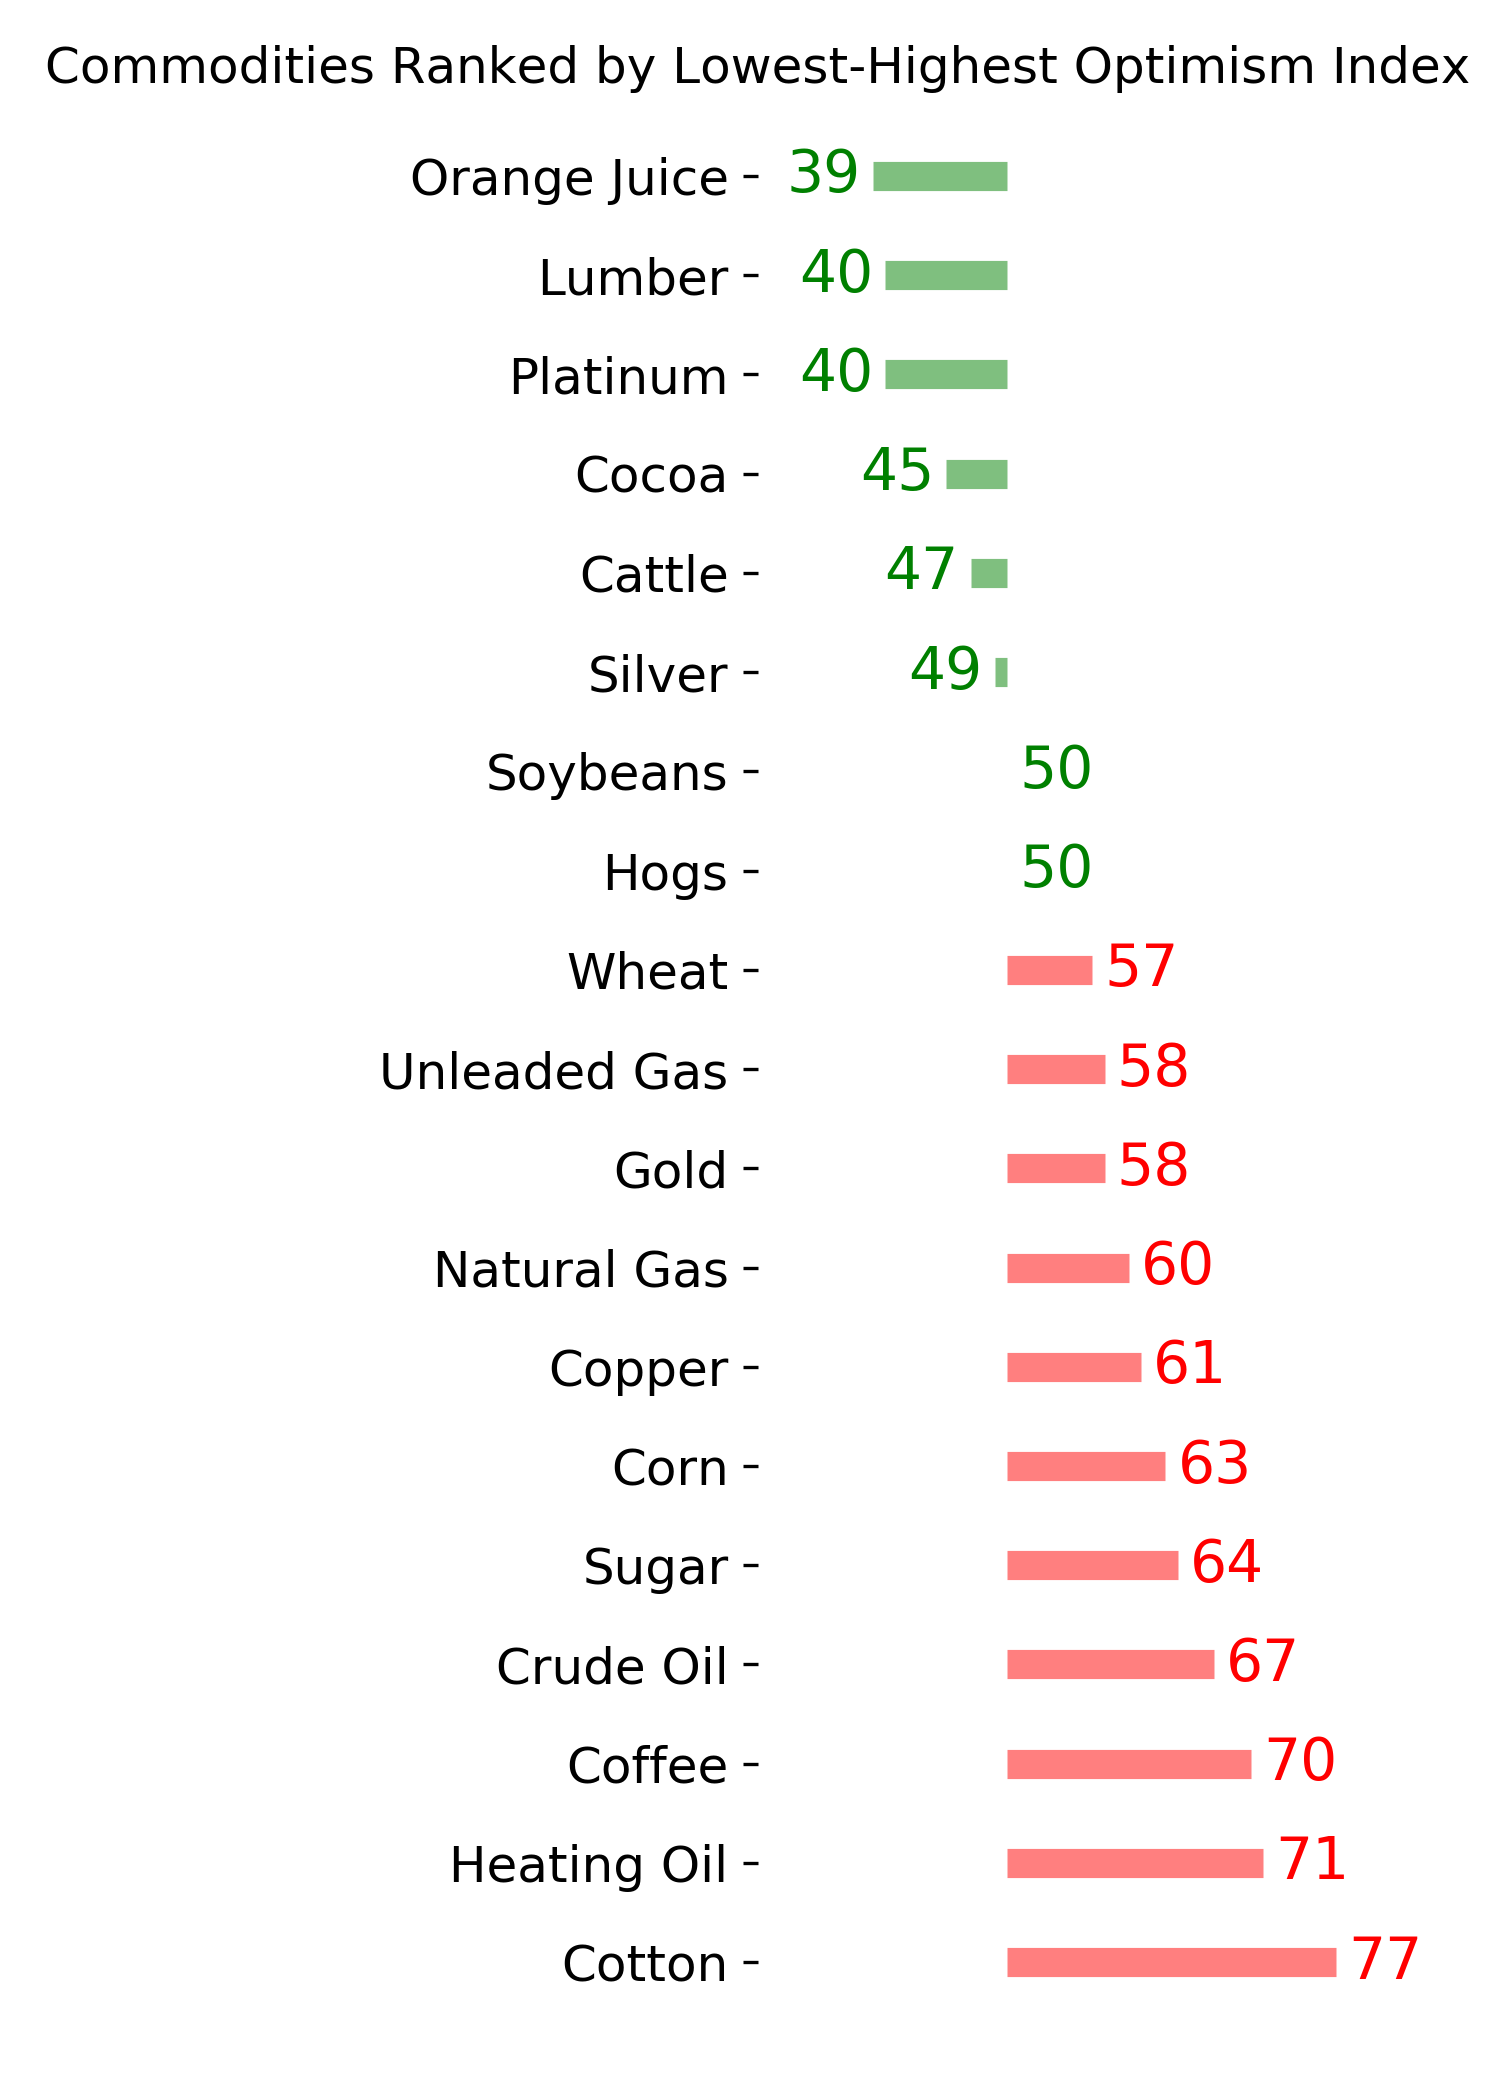
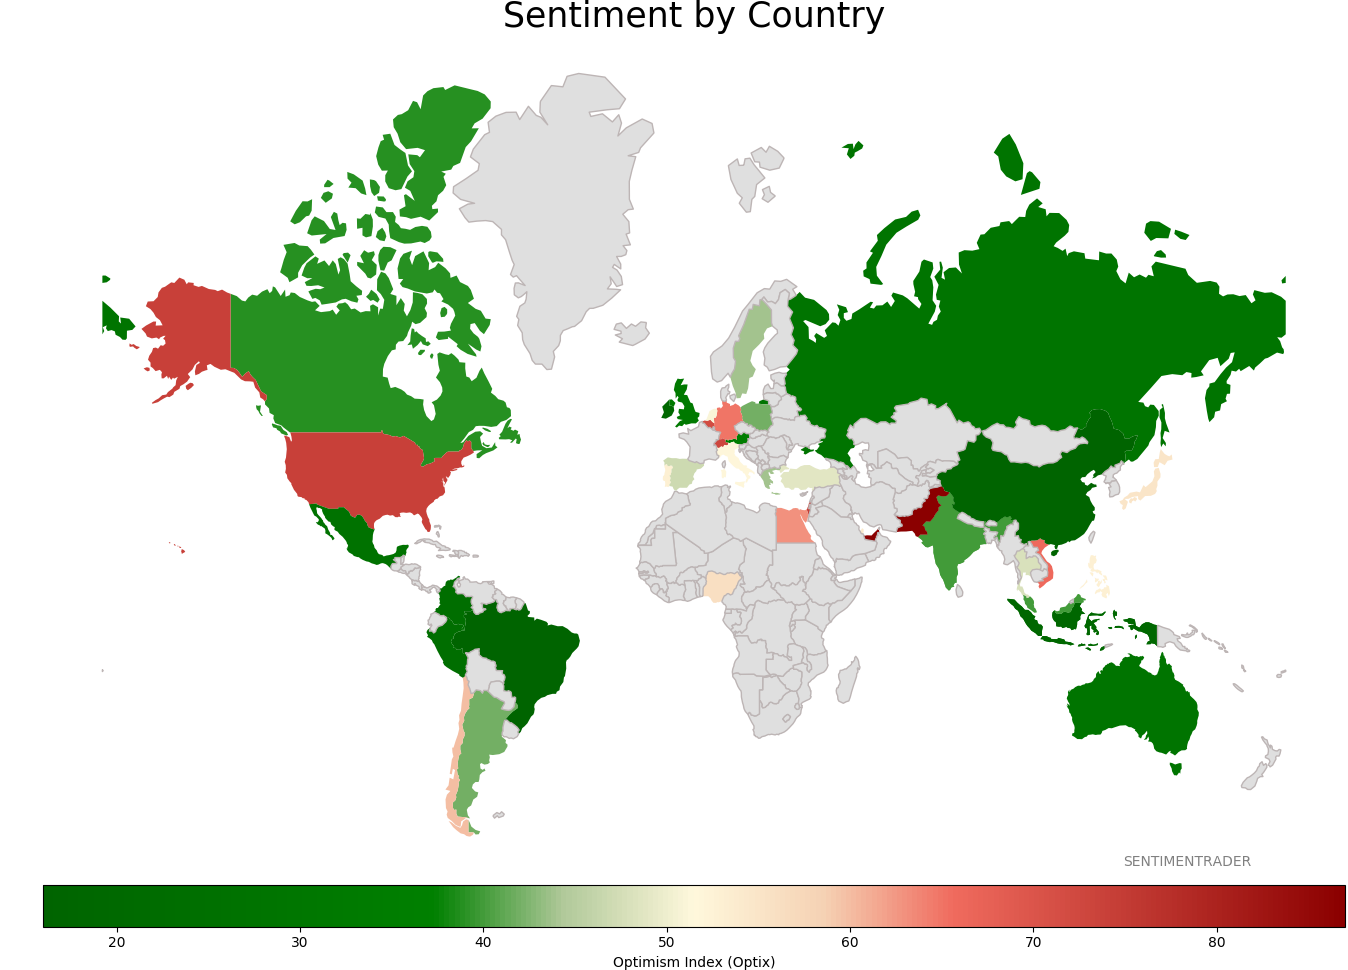
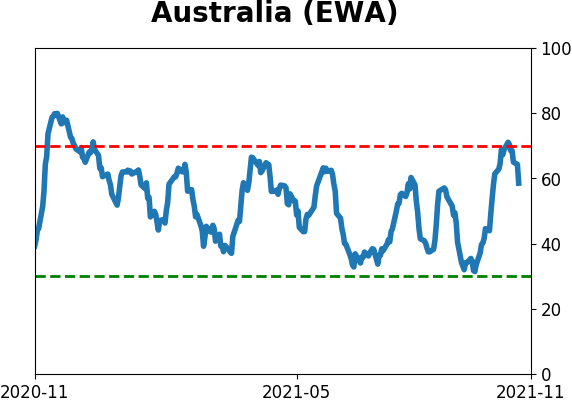
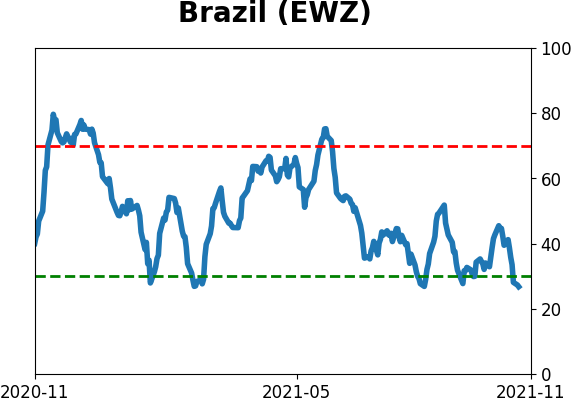
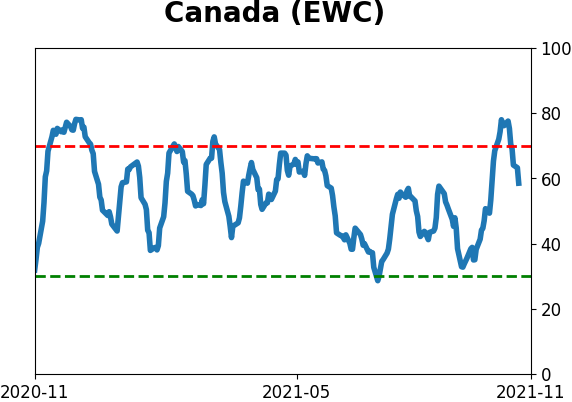
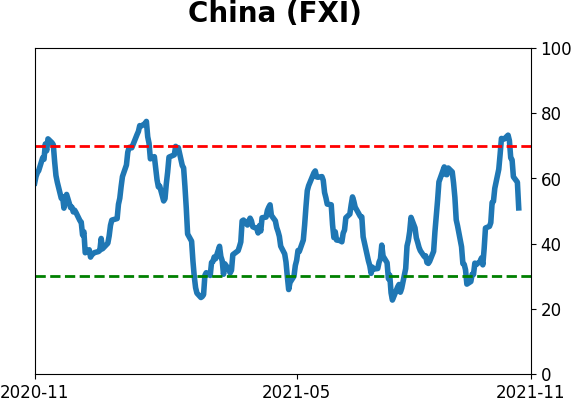
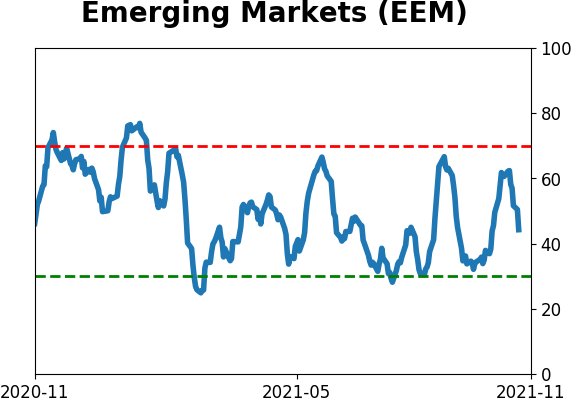
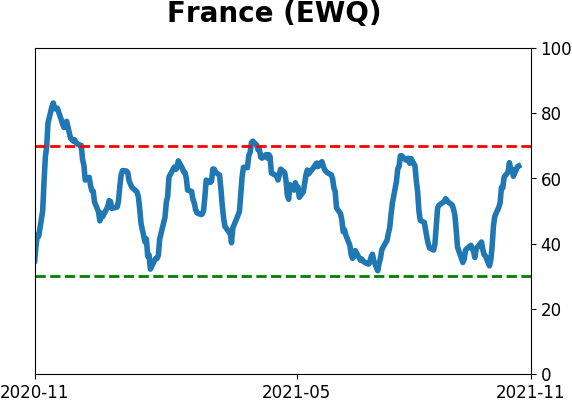
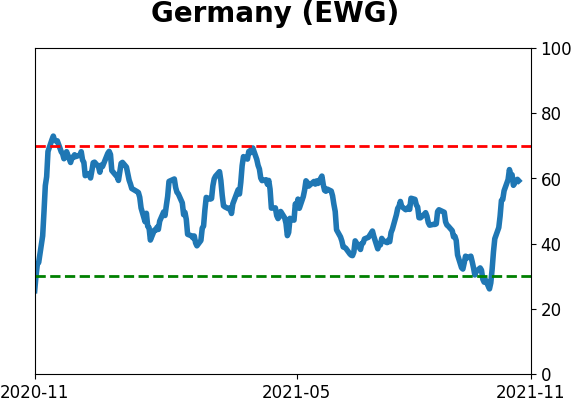
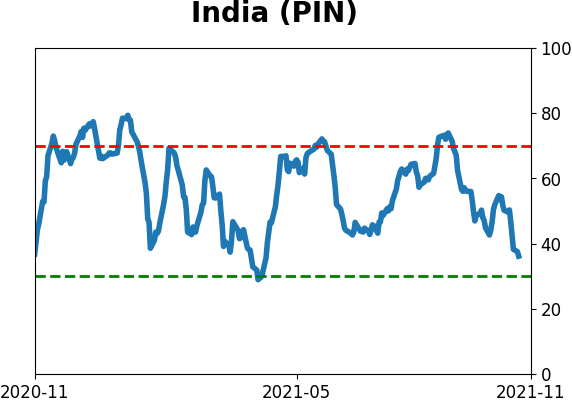
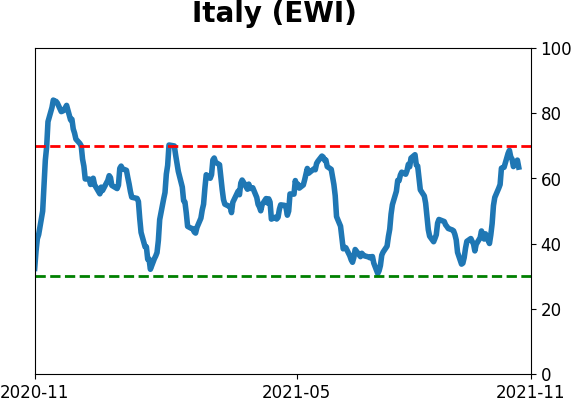
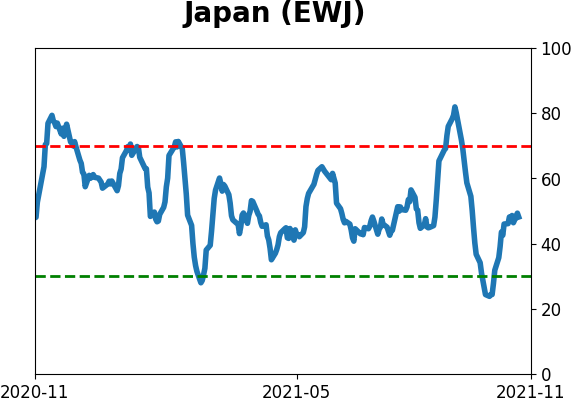
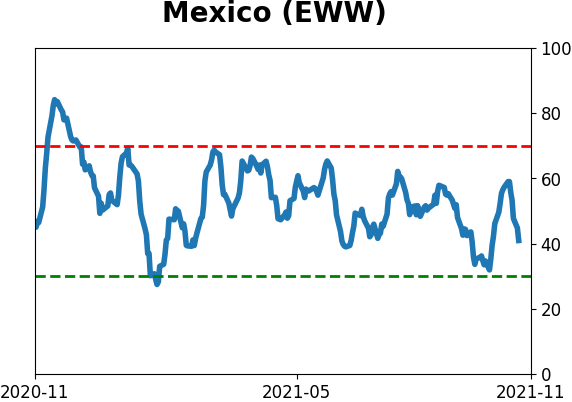
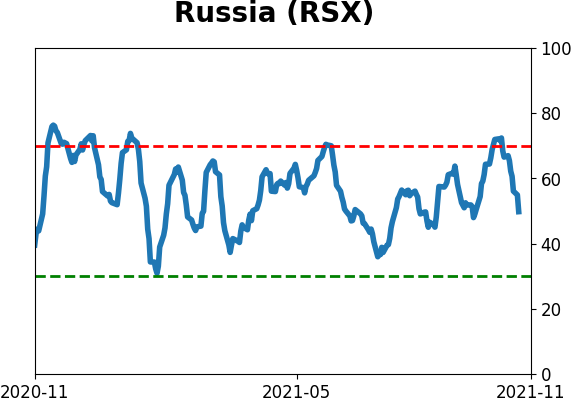
Sentiment Around The World
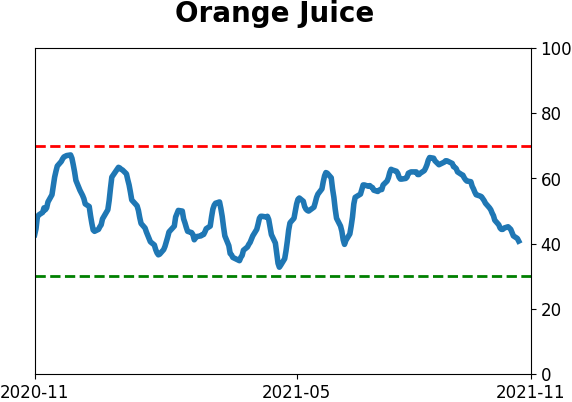
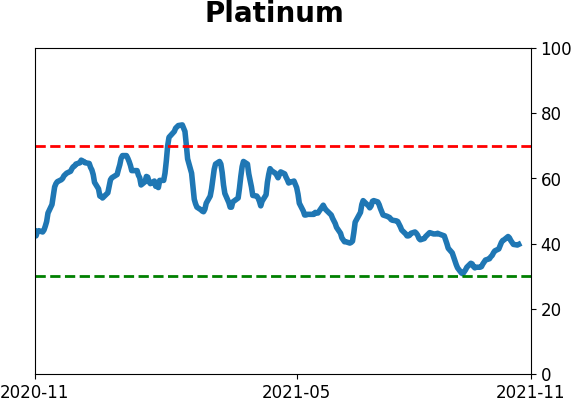
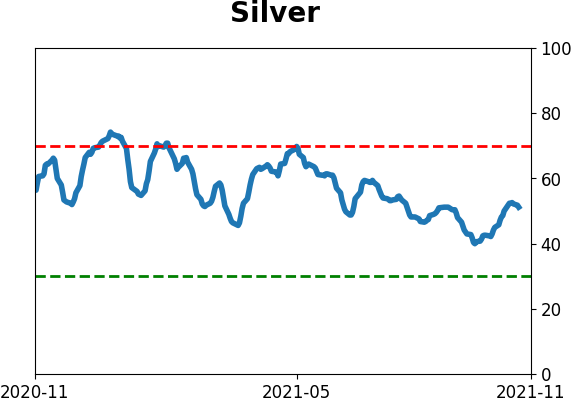
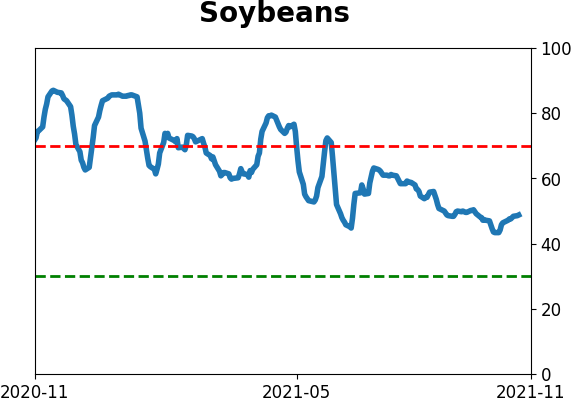
Optimism Index Thumbnails
|
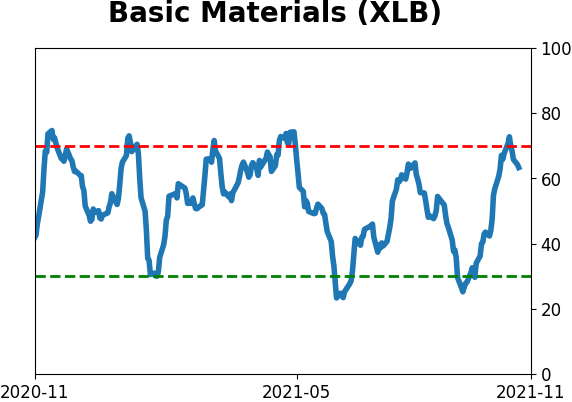
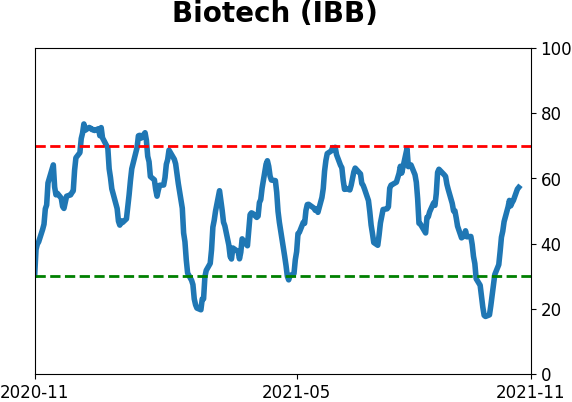
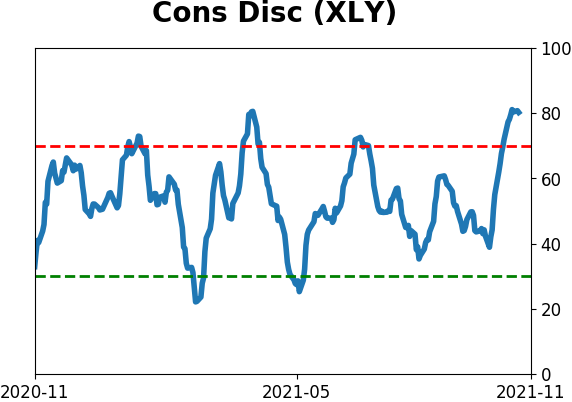
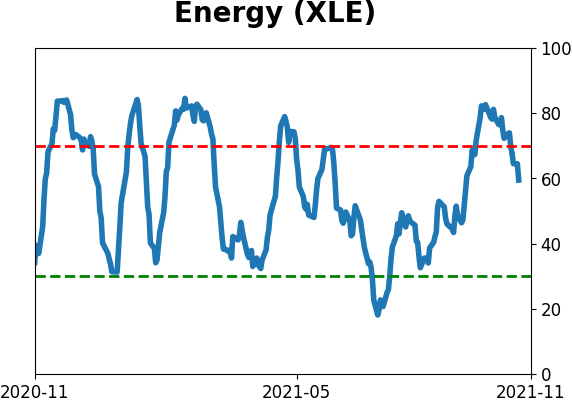
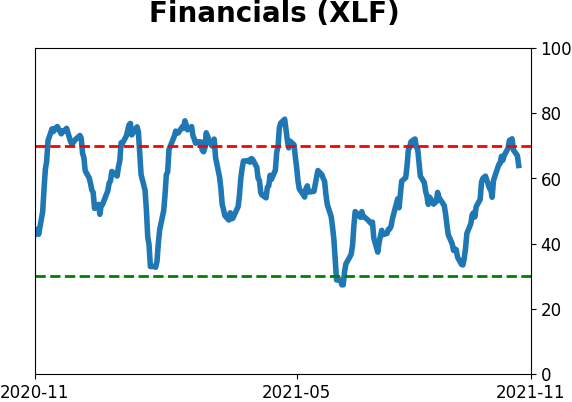
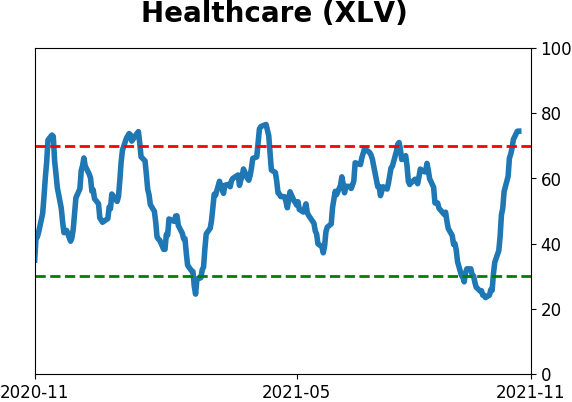
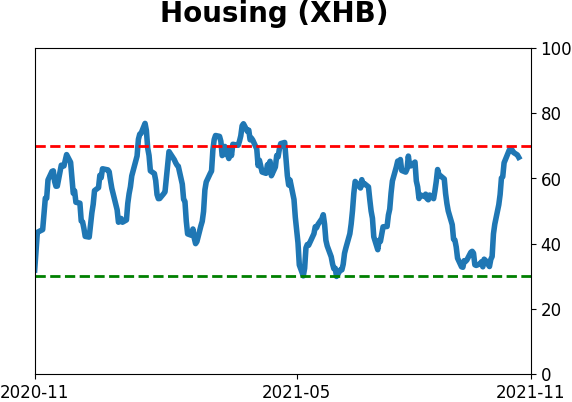
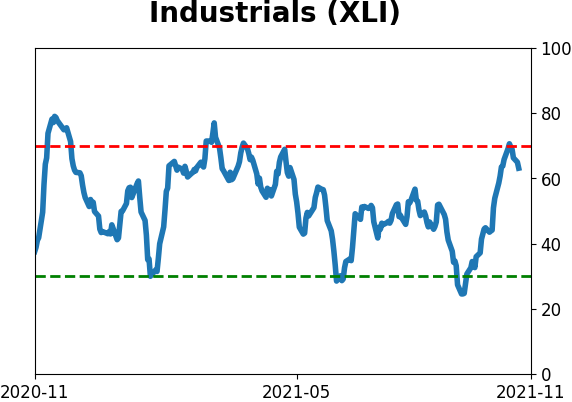
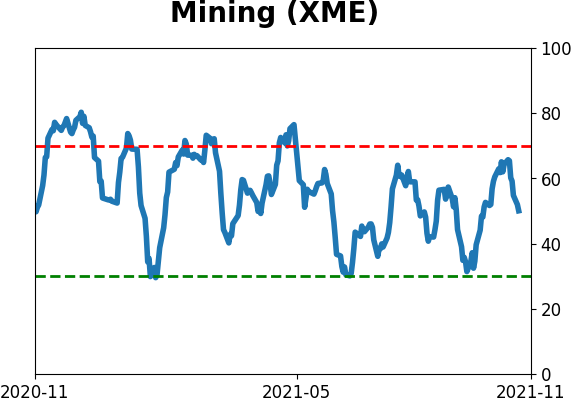
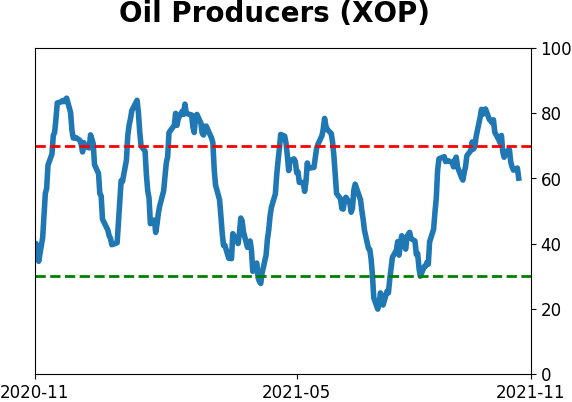
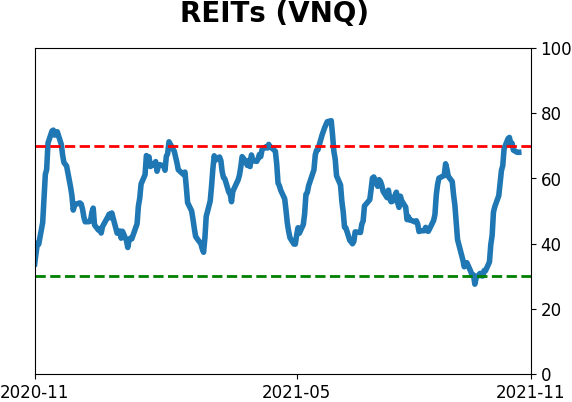
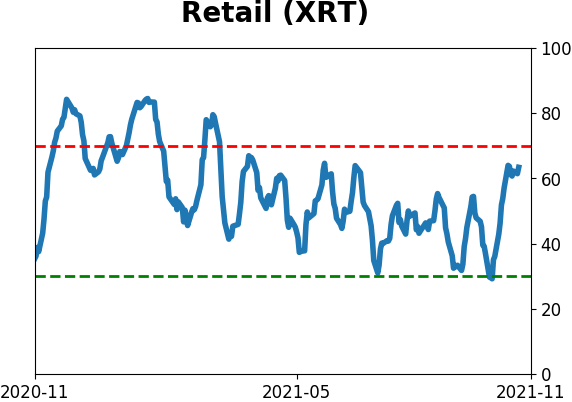
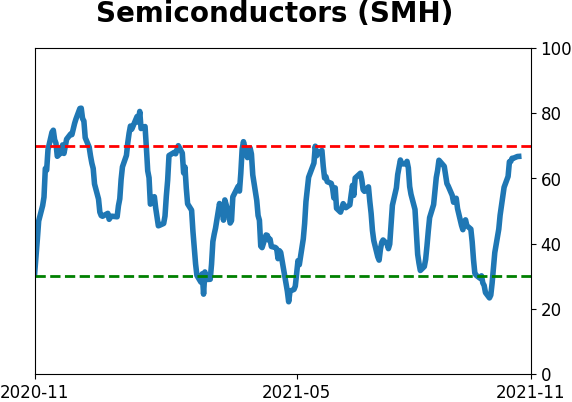
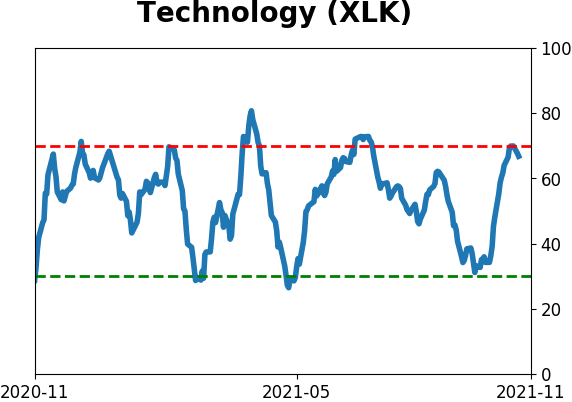
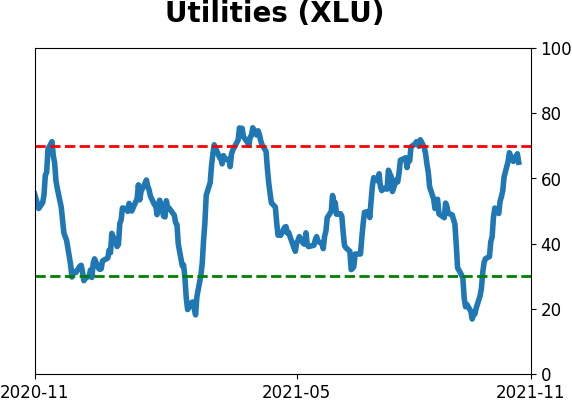
Sector ETF's - 10-Day Moving Average
|
|
|
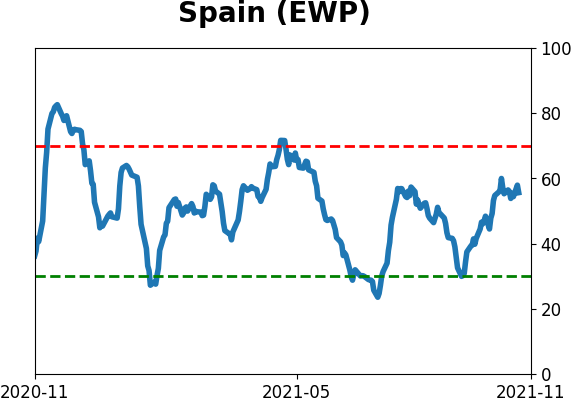
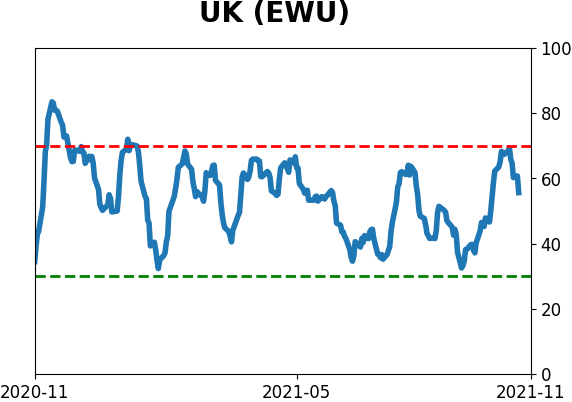
Country ETF's - 10-Day Moving Average
|
|
|
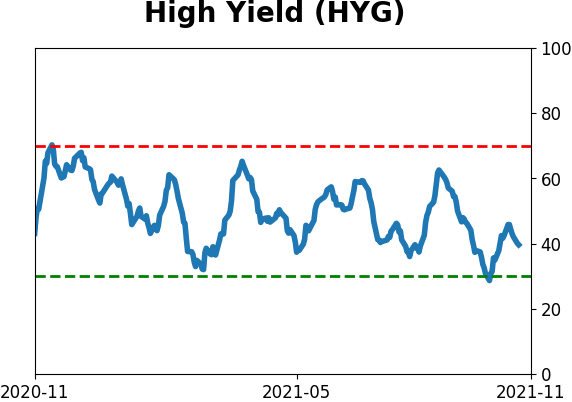
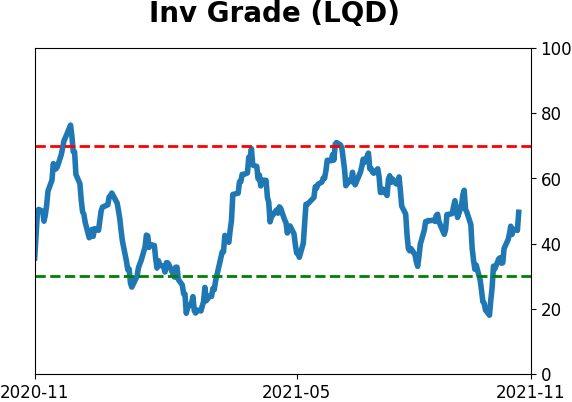
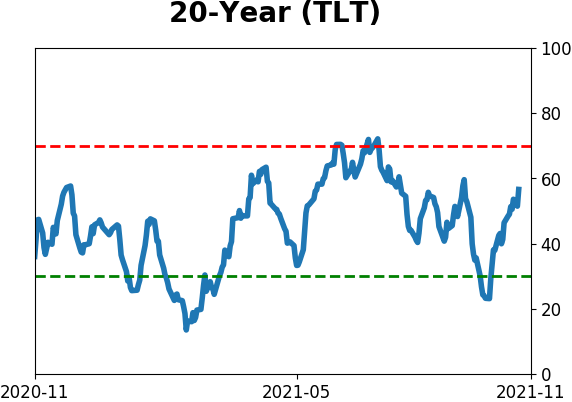
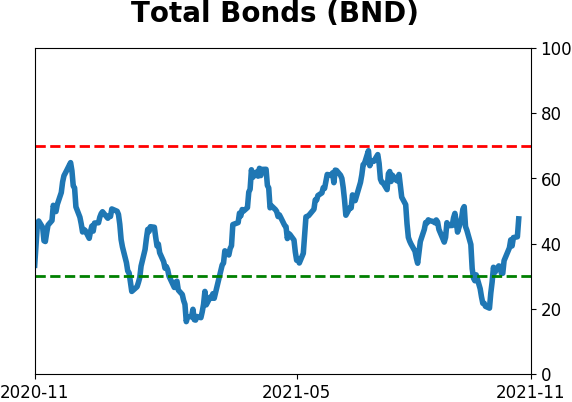
Bond ETF's - 10-Day Moving Average
|
|
|
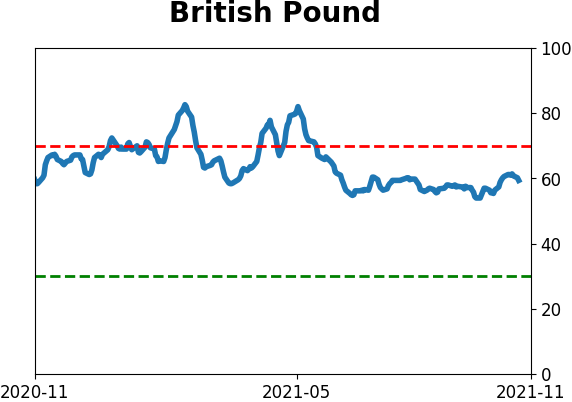
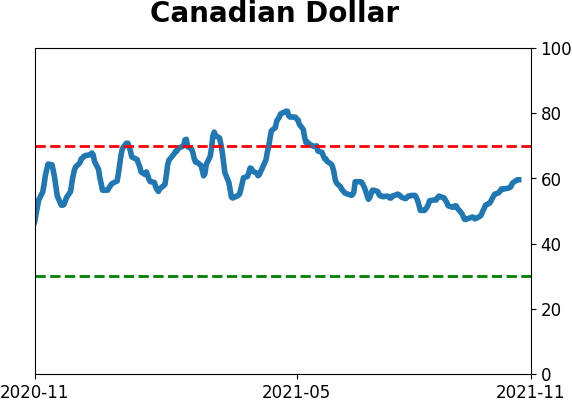
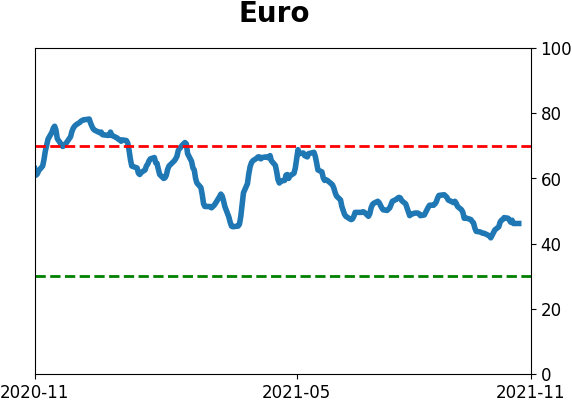
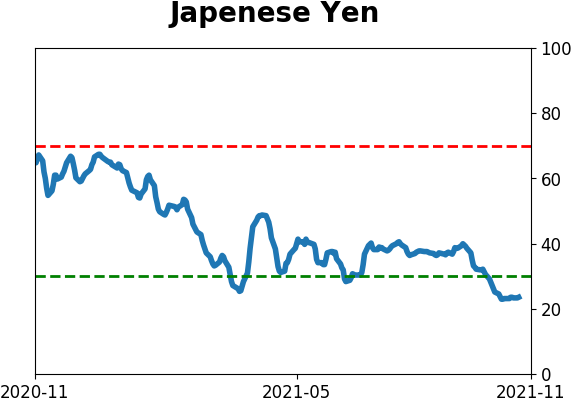
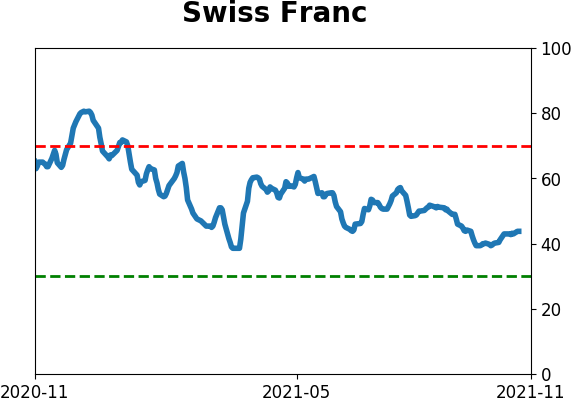
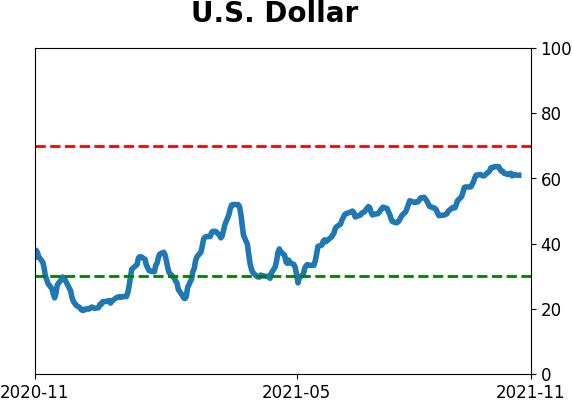
Currency ETF's - 5-Day Moving Average
|
|
|
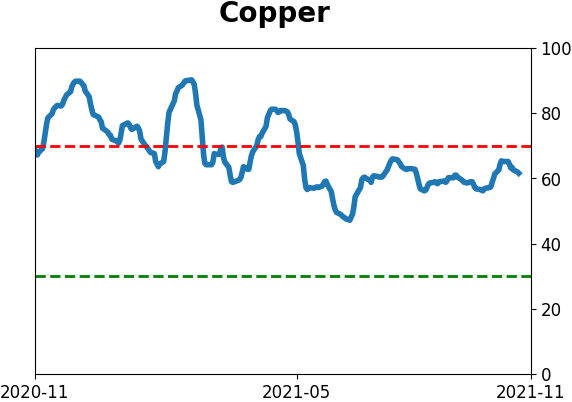
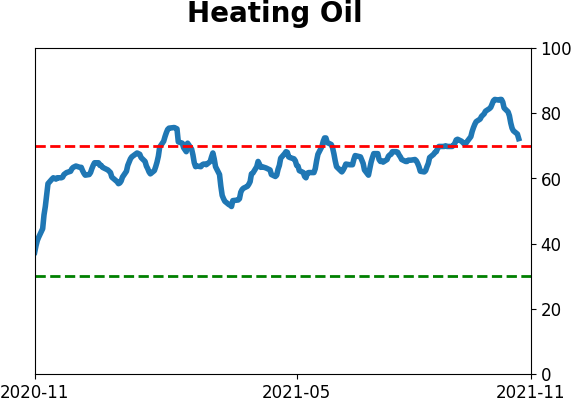
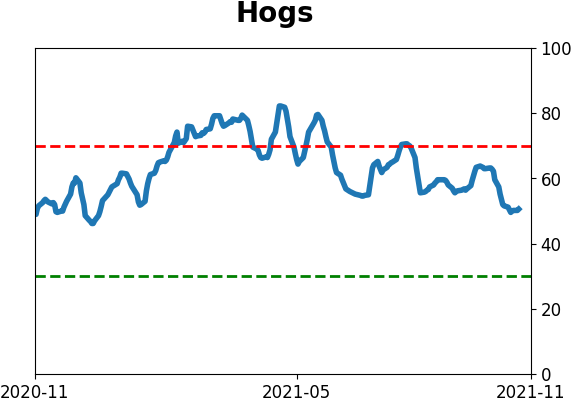
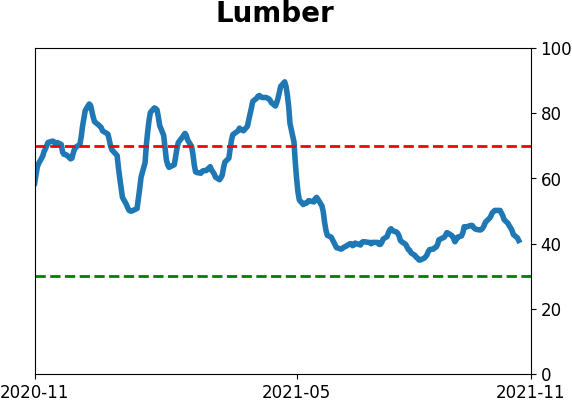
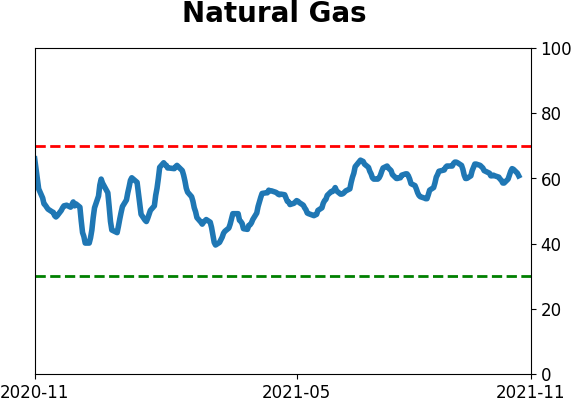
Commodity ETF's - 5-Day Moving Average
|
|