Headlines
|
|
Speculative Options Volume Ramps Up Yet Again:
Speculative options volume spiked last week, not due solely to trading in Tesla. As a percentage of volume, and market capitalization, speculative call buying rose to one of the highest levels on record.
Bottom Line:
STOCKS: Weak buy
The speculative frenzy in February is wrung out. There are some signs of pessimism, but the most compelling data show that buyers consistently tend to return once the first signs of extreme momentum end, especially as we head into a seasonally positive time of year. See the Outlook & Allocations page for more. BONDS: Hold
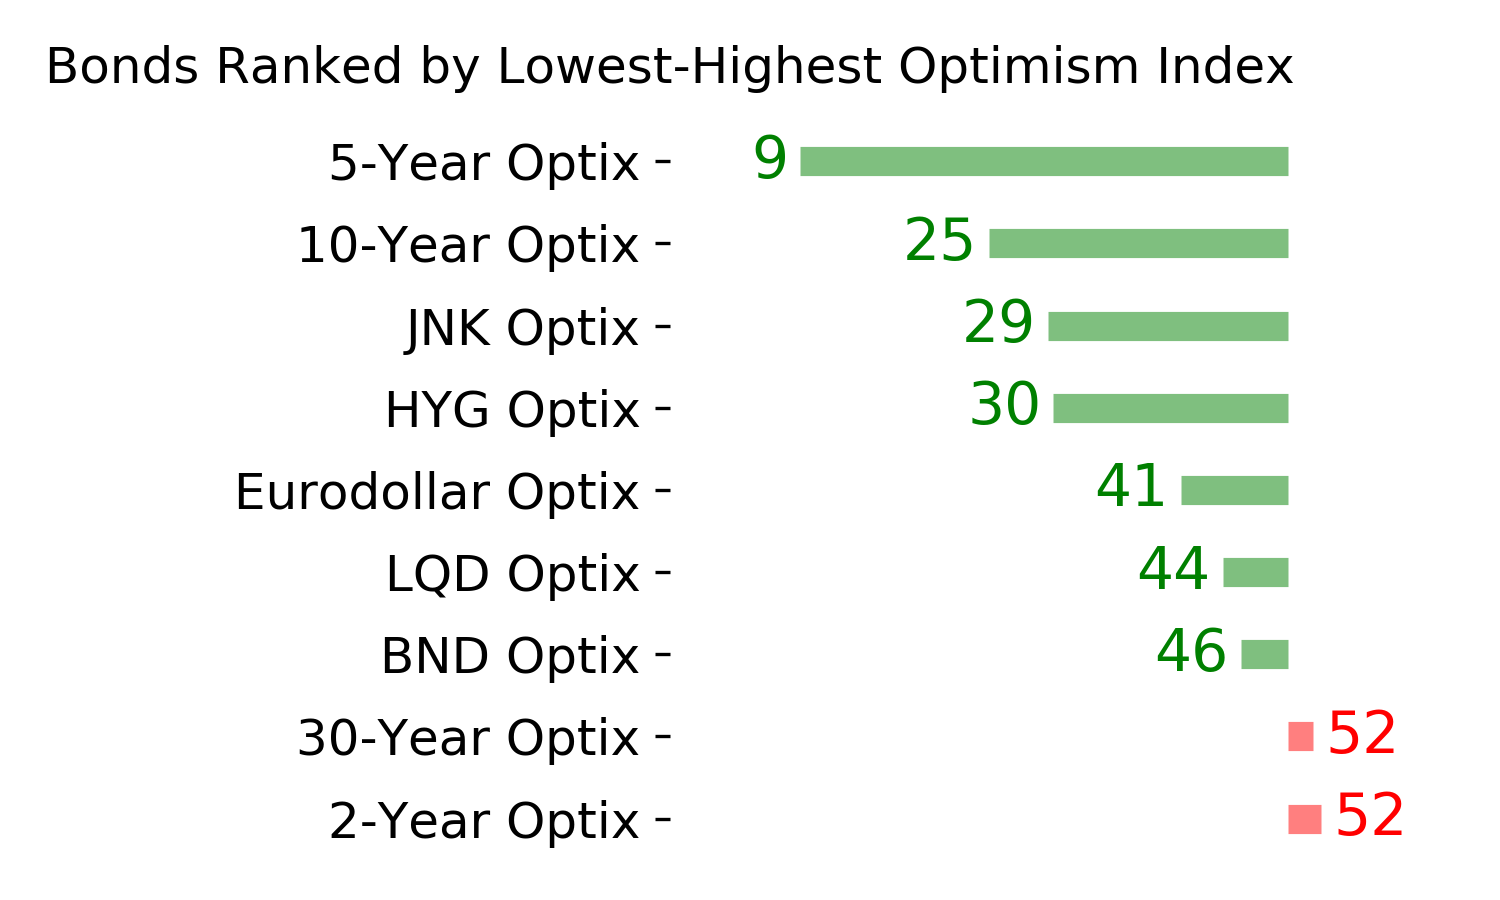
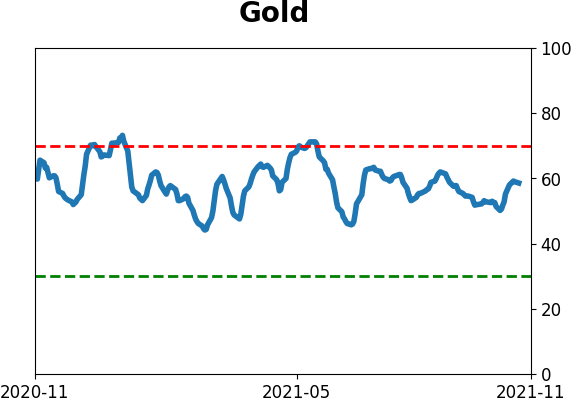
Various parts of the market got hit in March, with the lowest Bond Optimism Index we usually see during healthy environments. Bond prices have modest recovered and there is no edge among the data we follow. GOLD: Hold
Gold and miners were rejected after trying to recover above their 200-day averages in May. Lately, some medium-term (not long-term) oversold extremes in breadth measures among miners have triggered.
|
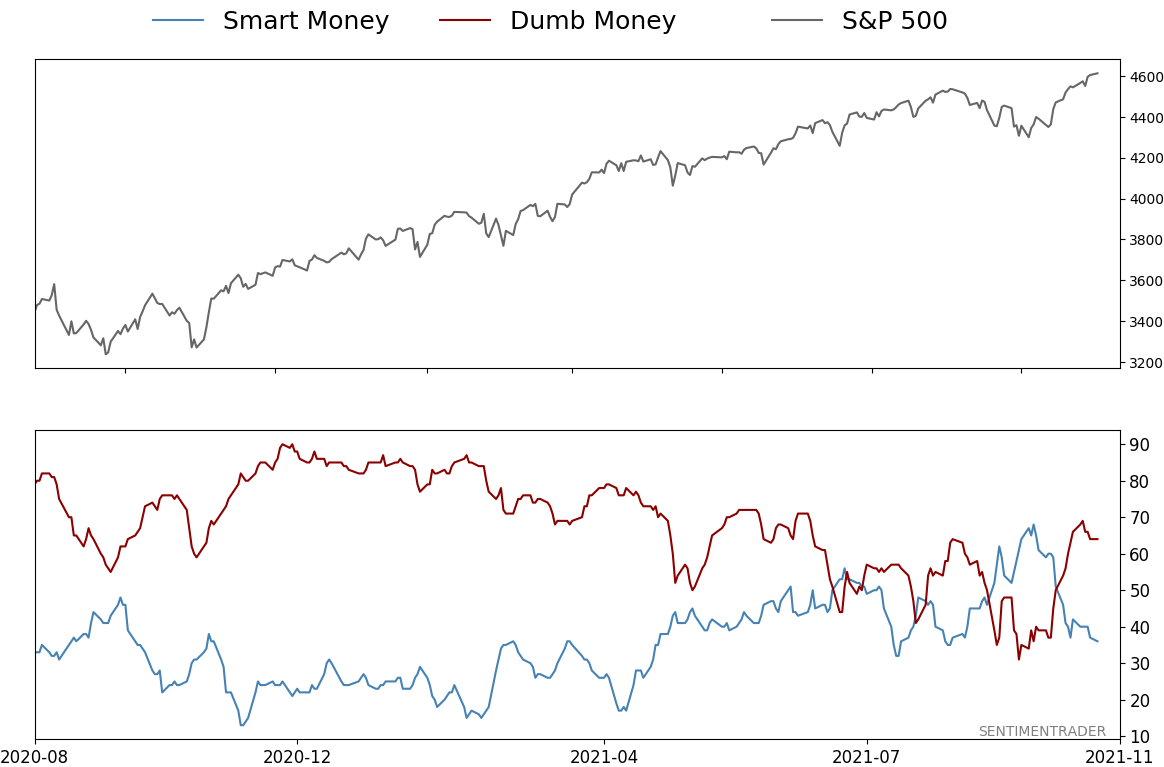
Smart / Dumb Money Confidence
|
Smart Money Confidence: 36%
Dumb Money Confidence: 64%
|
|
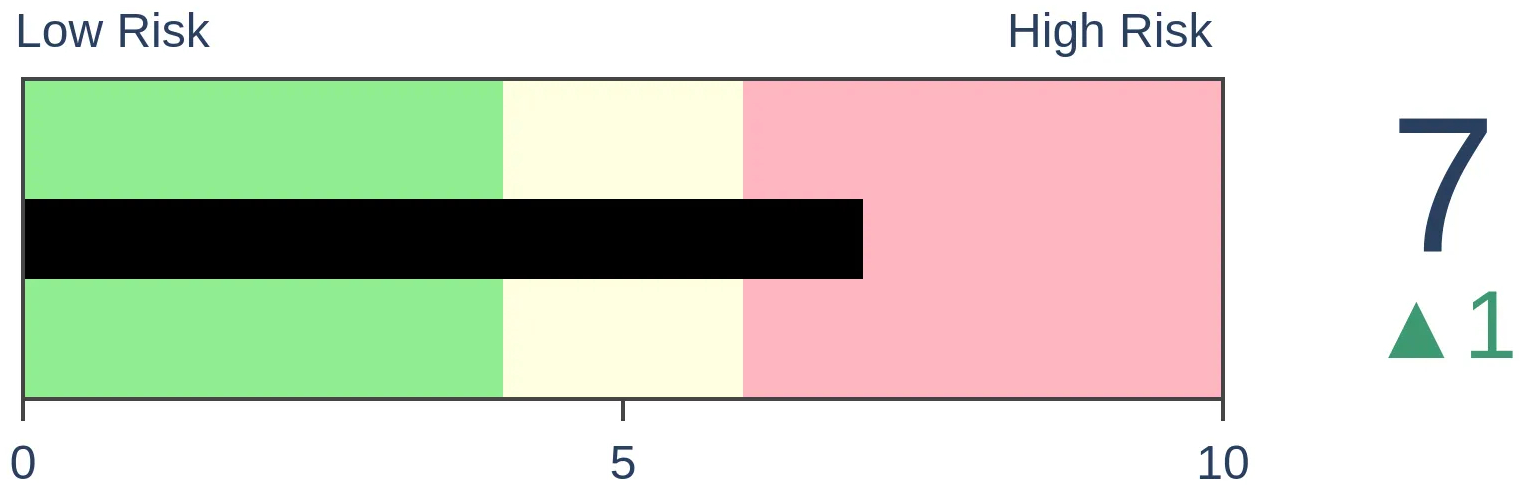
Risk Levels
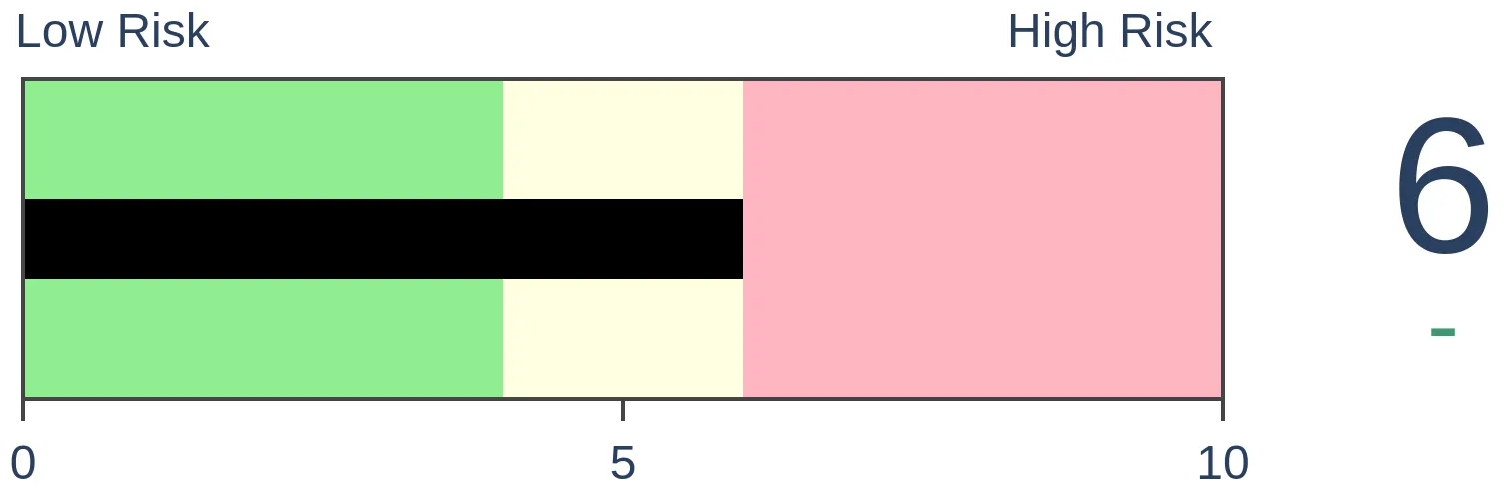
Stocks Short-Term
|
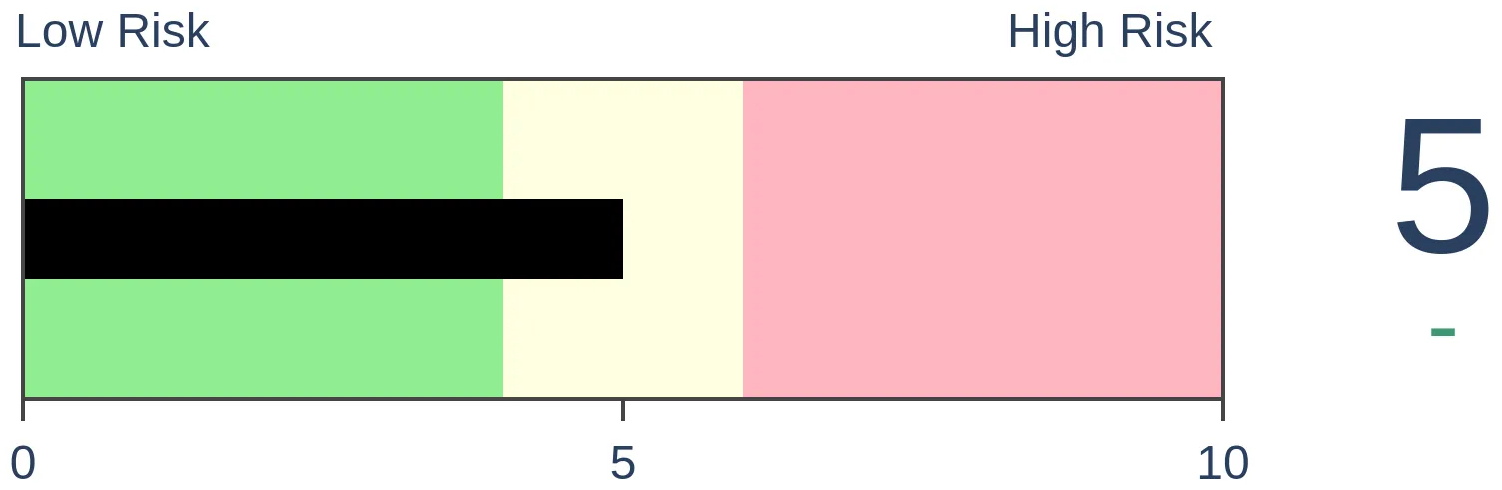
Stocks Medium-Term

|
|
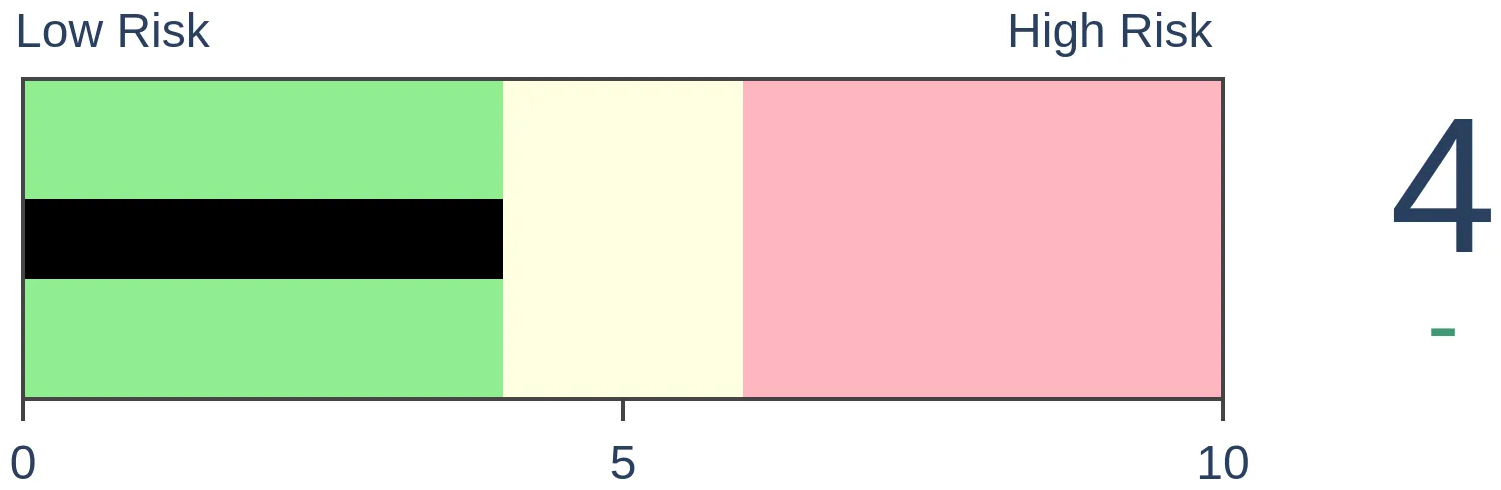
Bonds

|
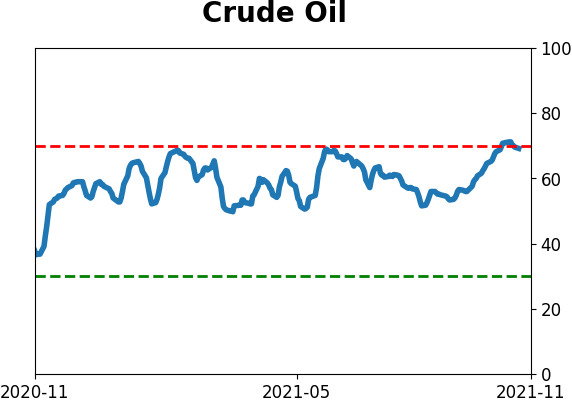
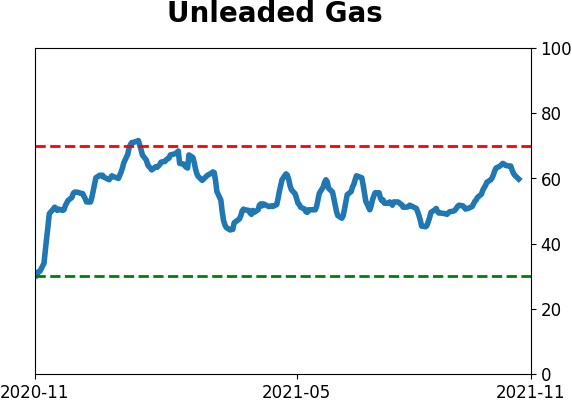
Crude Oil
|
|
Gold
|
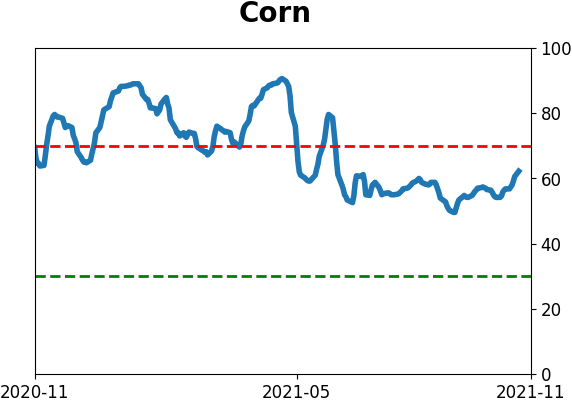
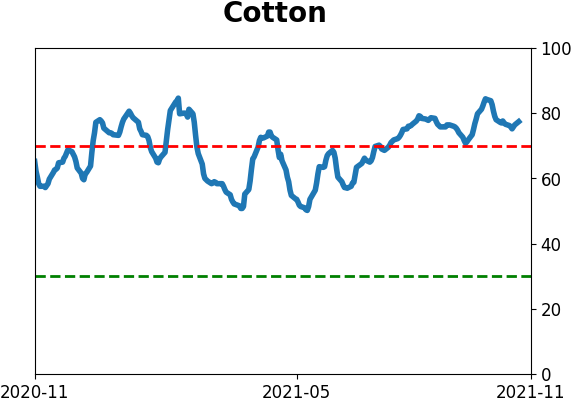
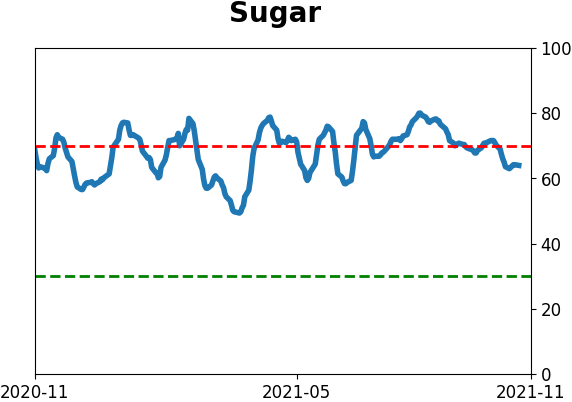
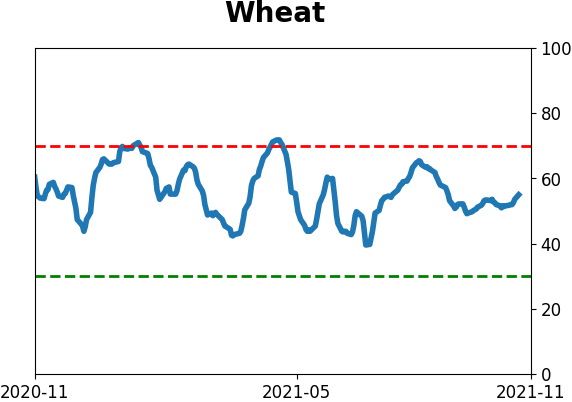
Agriculture
|
|
Research
By Jason Goepfert
BOTTOM LINE
Speculative options volume spiked last week, not due solely to trading in Tesla. As a percentage of volume, and market capitalization, speculative call buying rose to one of the highest levels on record.
FORECAST / TIMEFRAME
None
|
In January, traders reached a peak in speculation in the options market, unlike markets had ever witnessed before.
They're back for more.
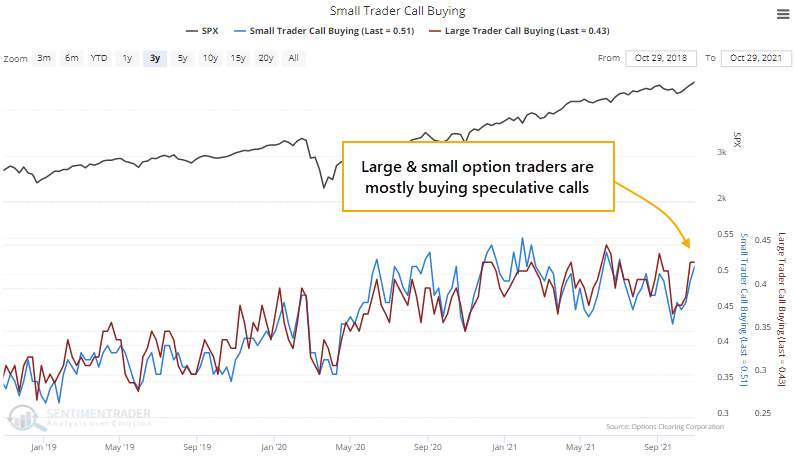
Last week, the smallest traders spent 51% of their volume on buying call options to open. The largest traders tend to be more conservative, but even they focused 43% of their volume on call buying. Both are in the top 2% of all weeks since the year 2000.
NET SPECULATIVE VOLUME NEARS RECORDS
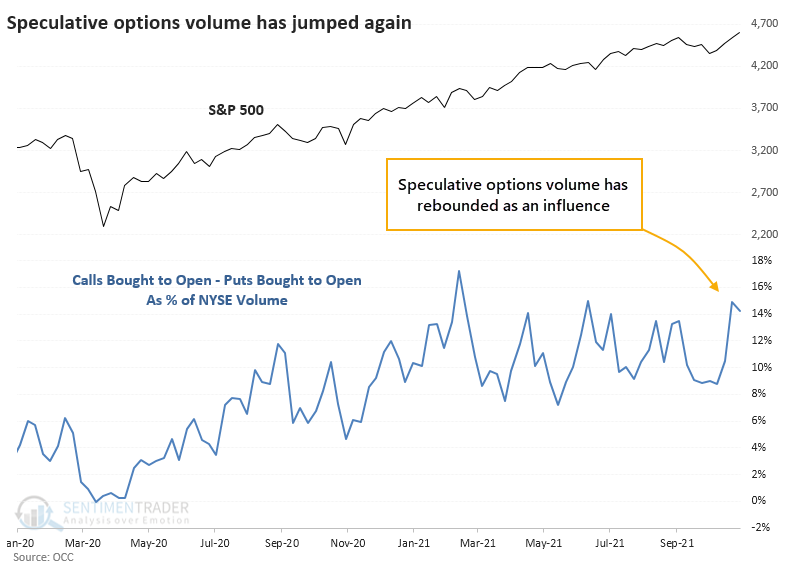
If we look at all trader sizes, in all options and ETFs traded in the U.S., net speculative volume (call buying to open minus put buying to open) accounted for more than 14% of NYSE volume. This is not accounting for the fact that options control the right to 100 shares; it's just raw volume.
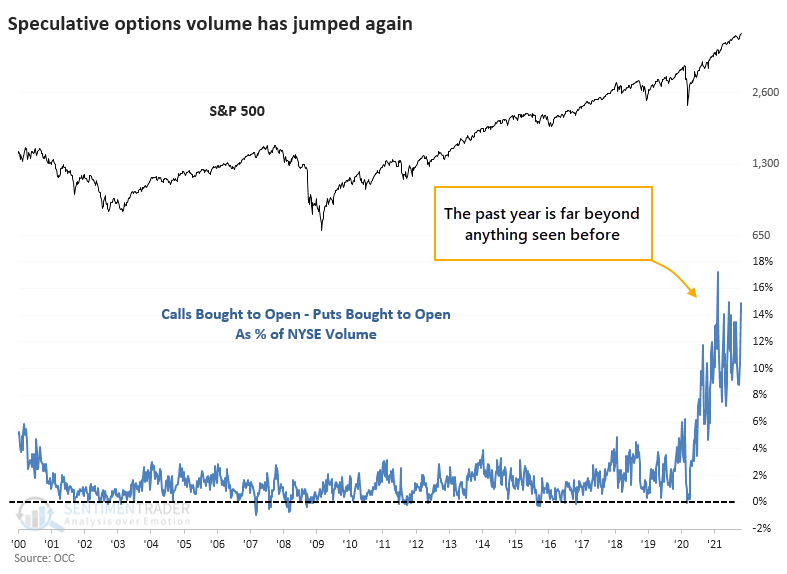
To see what a historical anomaly the past year has been, here's the entire history.
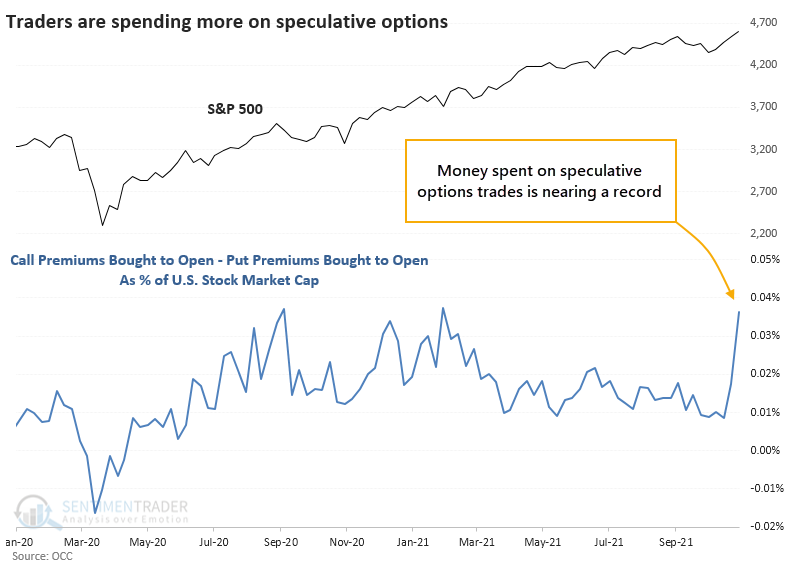
When we look at the premiums spent on these options, it gets even more extreme. This is real money being spent. While it accounts for a tiny fraction of the value of U.S. stocks, the knock-on effects from dealer hedging can magnify its influence.
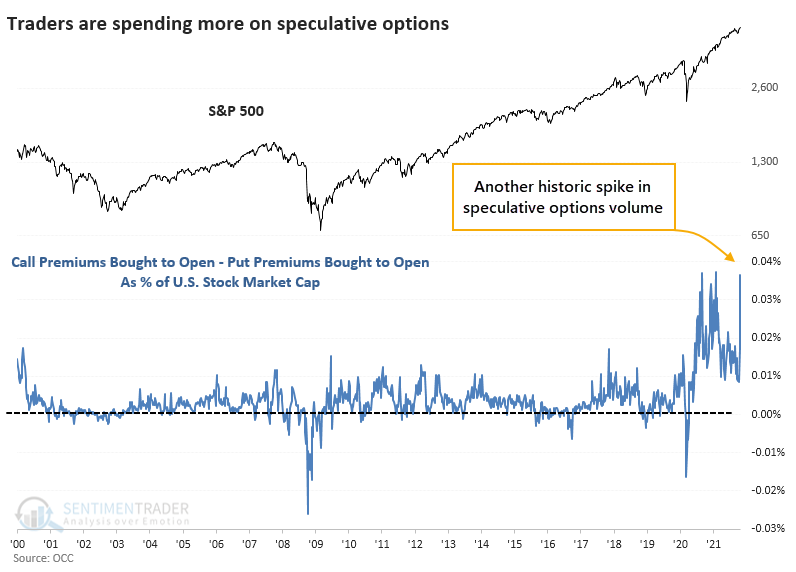
The historical chart shows just how much that last week stands out.
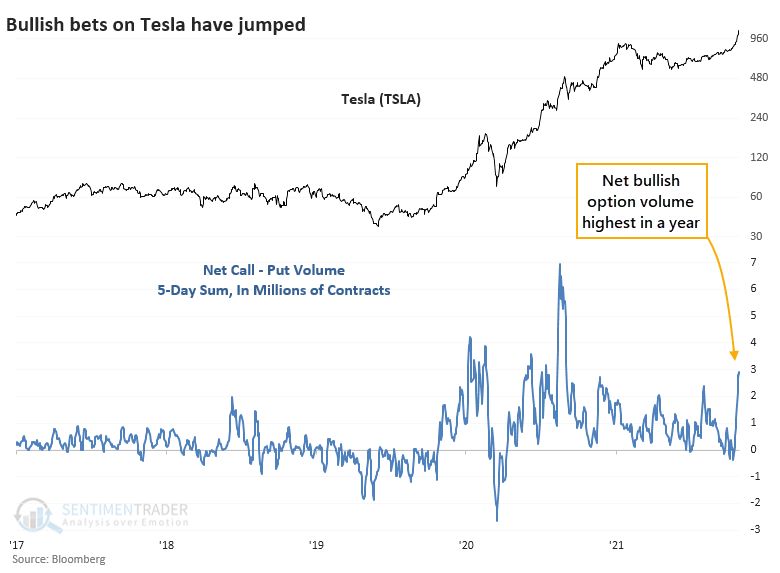
IT'S NOT JUST TESLA
I can already hear the excuses. "But, but, but it's just Tesla!" Well...
- No, it's not
- It doesn't matter
Last week, there were about 3 million more call options than put options traded on Tesla. That's the most in over a year, but it's well below other extremes in the stock.
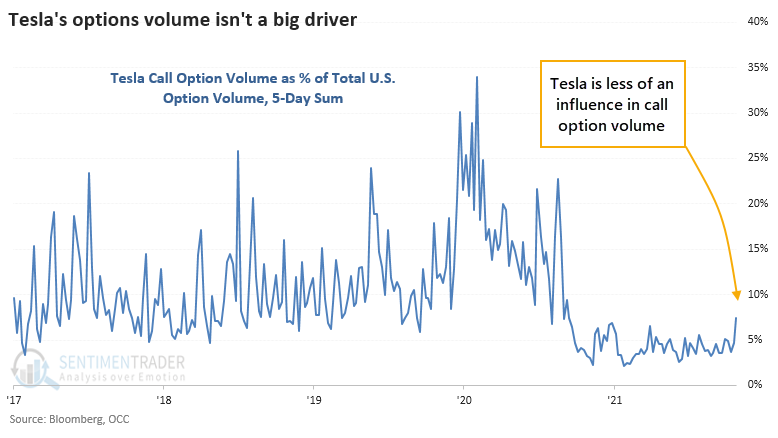
There were about 8,000,000 options traded on Tesla. There were over 100,000,000 call options traded last week across all U.S. exchanges. Tesla's share of overall volume was well below its peak influence over the past five years.
Even if trading in Tesla options was a primary driven of total options volume, that doesn't excuse the speculative nature of the bets.
Buying call options on a company priced at nearly 200x forward earnings estimates, based in part on the personality of the world's richest man who continually pumps crypto frauds, intentionally provokes regulators, and is overtly fascinated with scatological humor, doesn't seem to be the most prudent investment logic. But hey, it's working, and "retail" traders are banking billions.
When speculative options volume spiked last fall, stocks pulled back for a few weeks. When it happened again in late January - early February of this year, the major indexes didn't suffer too much, but meme stocks tumbled, small-cap stocks went into a coma, and breadth flattened. If we've learned anything from the past 11 months, it's that there are factors that can easily overwhelm sentiment extremes to an extent we haven't seen in over 20 years, if ever. But risk just ticked higher for some higher-risk parts of the stock market.
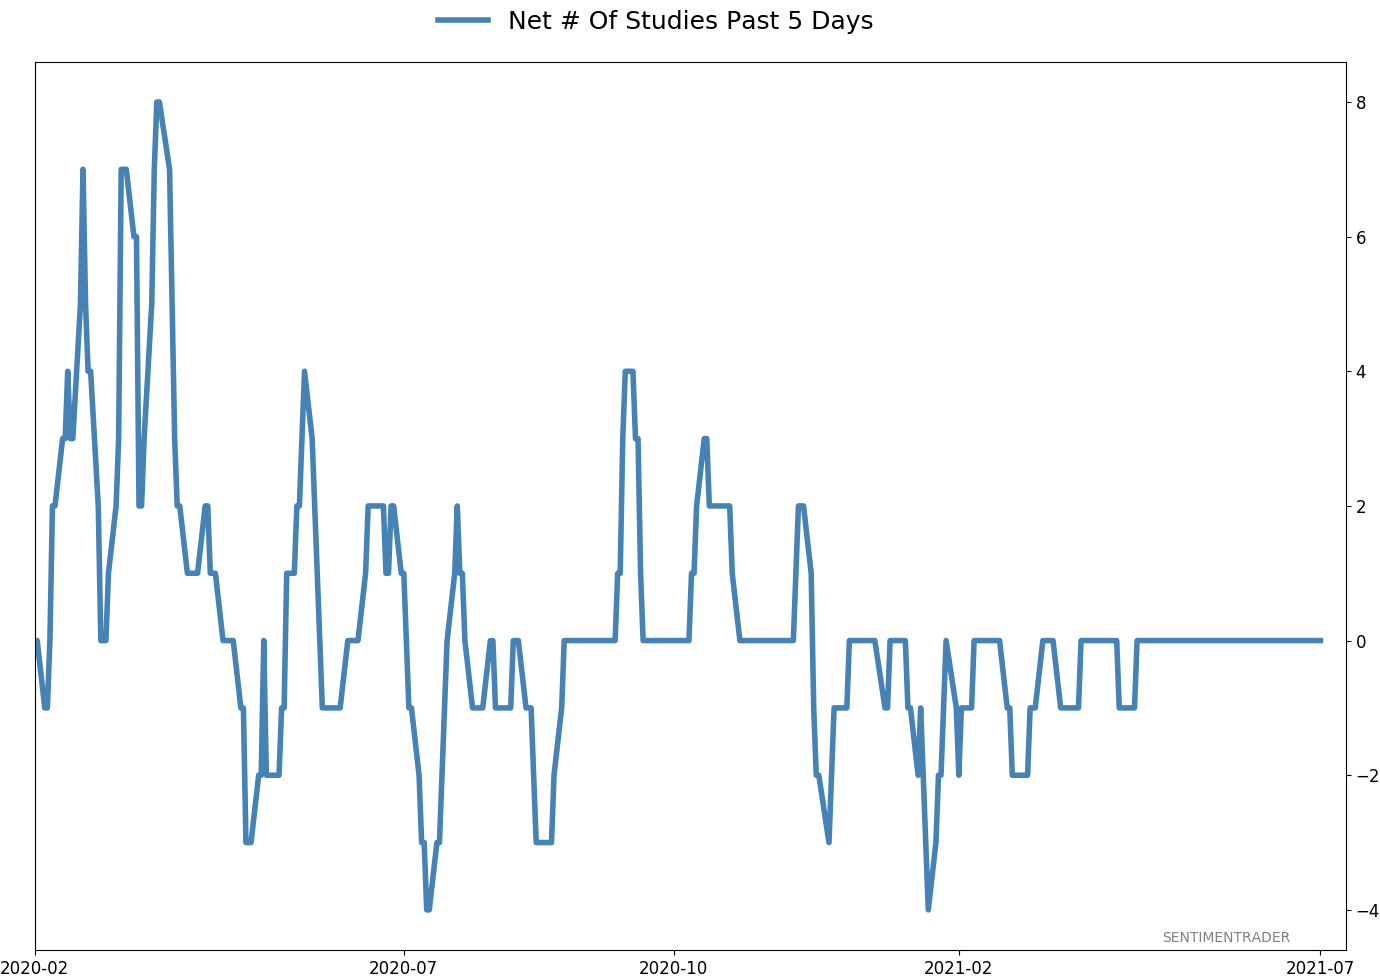
Active Studies
| Time Frame | Bullish | Bearish | | Short-Term | 2 | 0 | | Medium-Term | 8 | 0 | | Long-Term | 11 | 5 |
|
Indicators at Extremes
Portfolio
| Position | Description | Weight % | Added / Reduced | Date | | Stocks | RSP | 10.7 | Added 6.4% | 2021-10-01 | | Bonds | 32.7% BND, 7.1% SCHP | 39.8 | Added 8.3% | 2021-10-26 | | Commodities | GCC | 2.4 | Reduced 2.1%
| 2020-09-04 | | Precious Metals | GDX | 4.6 | Reduced 4.2% | 2021-05-19 | | Special Situations | 9.8% KWEB, 4.7% XLE, 2.9% PSCE | 17.3 | Added 9.78% | 2021-10-01 | | Cash | | 24.1 | | |
|
Updates (Changes made today are underlined)
Much of our momentum and trend work has remained positive for several months, with some scattered exceptions. Almost all sentiment-related work has shown a poor risk/reward ratio for stocks, especially as speculation drove to record highs in exuberance in February. Much of that has worn off, and most of our models are back toward neutral levels. There isn't much to be excited about here. The same goes for bonds and even gold. Gold has been performing well lately and is back above long-term trend lines. The issue is that it has a poor record of holding onto gains when attempting a long-term trend change like this, so we'll take a wait-and-see approach. Momentum has ebbed quickly in recent weeks, and nearing oversold levels in some indicators. This can be a dangerous area, with a lot of short-term volatility, but we'd be more inclined to add medium- to long-term exposure rather than sell on much more of a decline, thanks to already rock-bottom exposure. Other areas look more attractive, including some overseas markets. RETURN YTD: 11.1% 2020: 8.1%, 2019: 12.6%, 2018: 0.6%, 2017: 3.8%, 2016: 17.1%, 2015: 9.2%, 2014: 14.5%, 2013: 2.2%, 2012: 10.8%, 2011: 16.5%, 2010: 15.3%, 2009: 23.9%, 2008: 16.2%, 2007: 7.8%
|
|
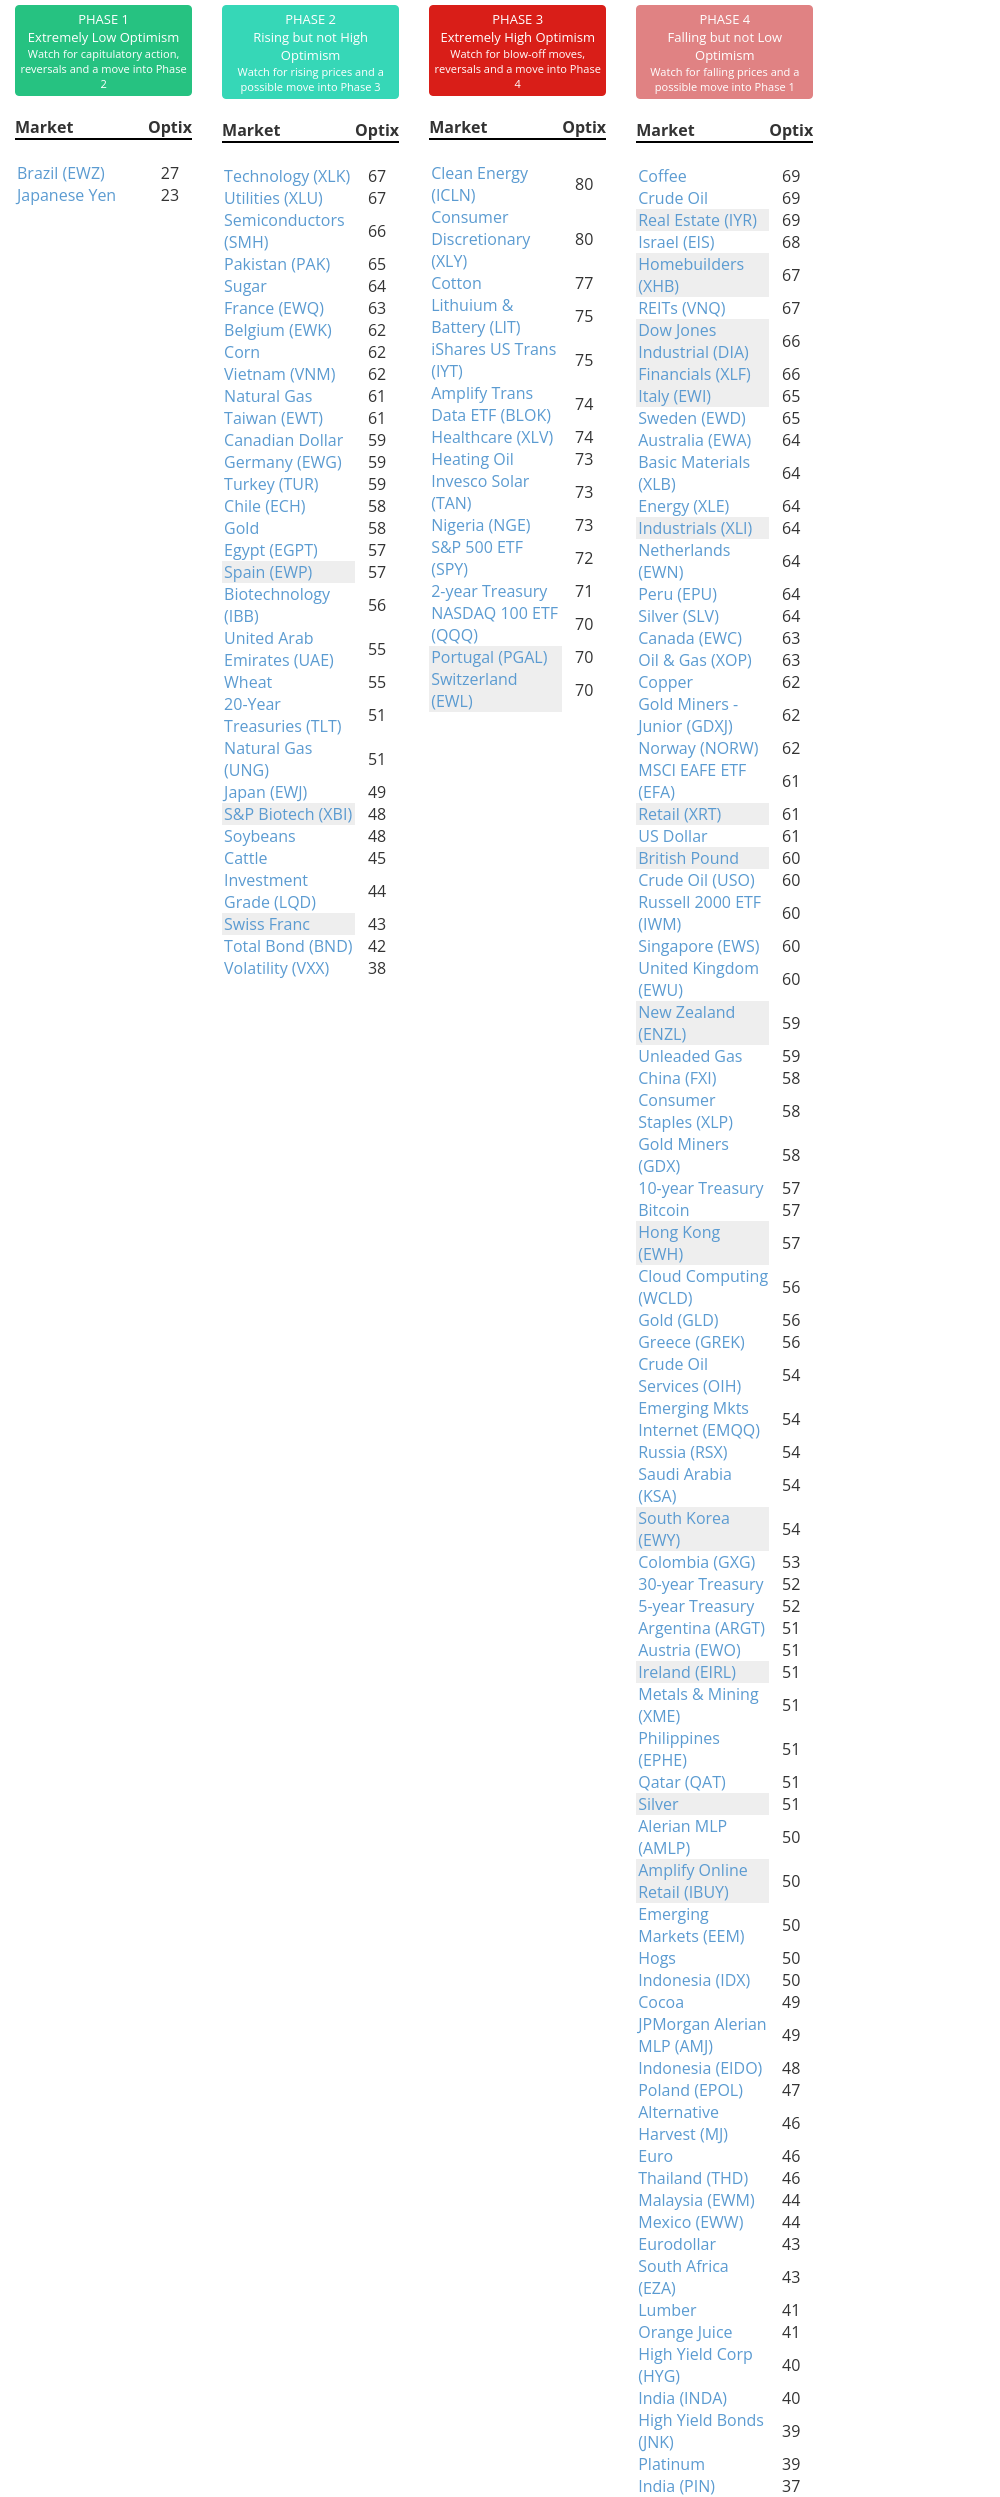
Phase Table
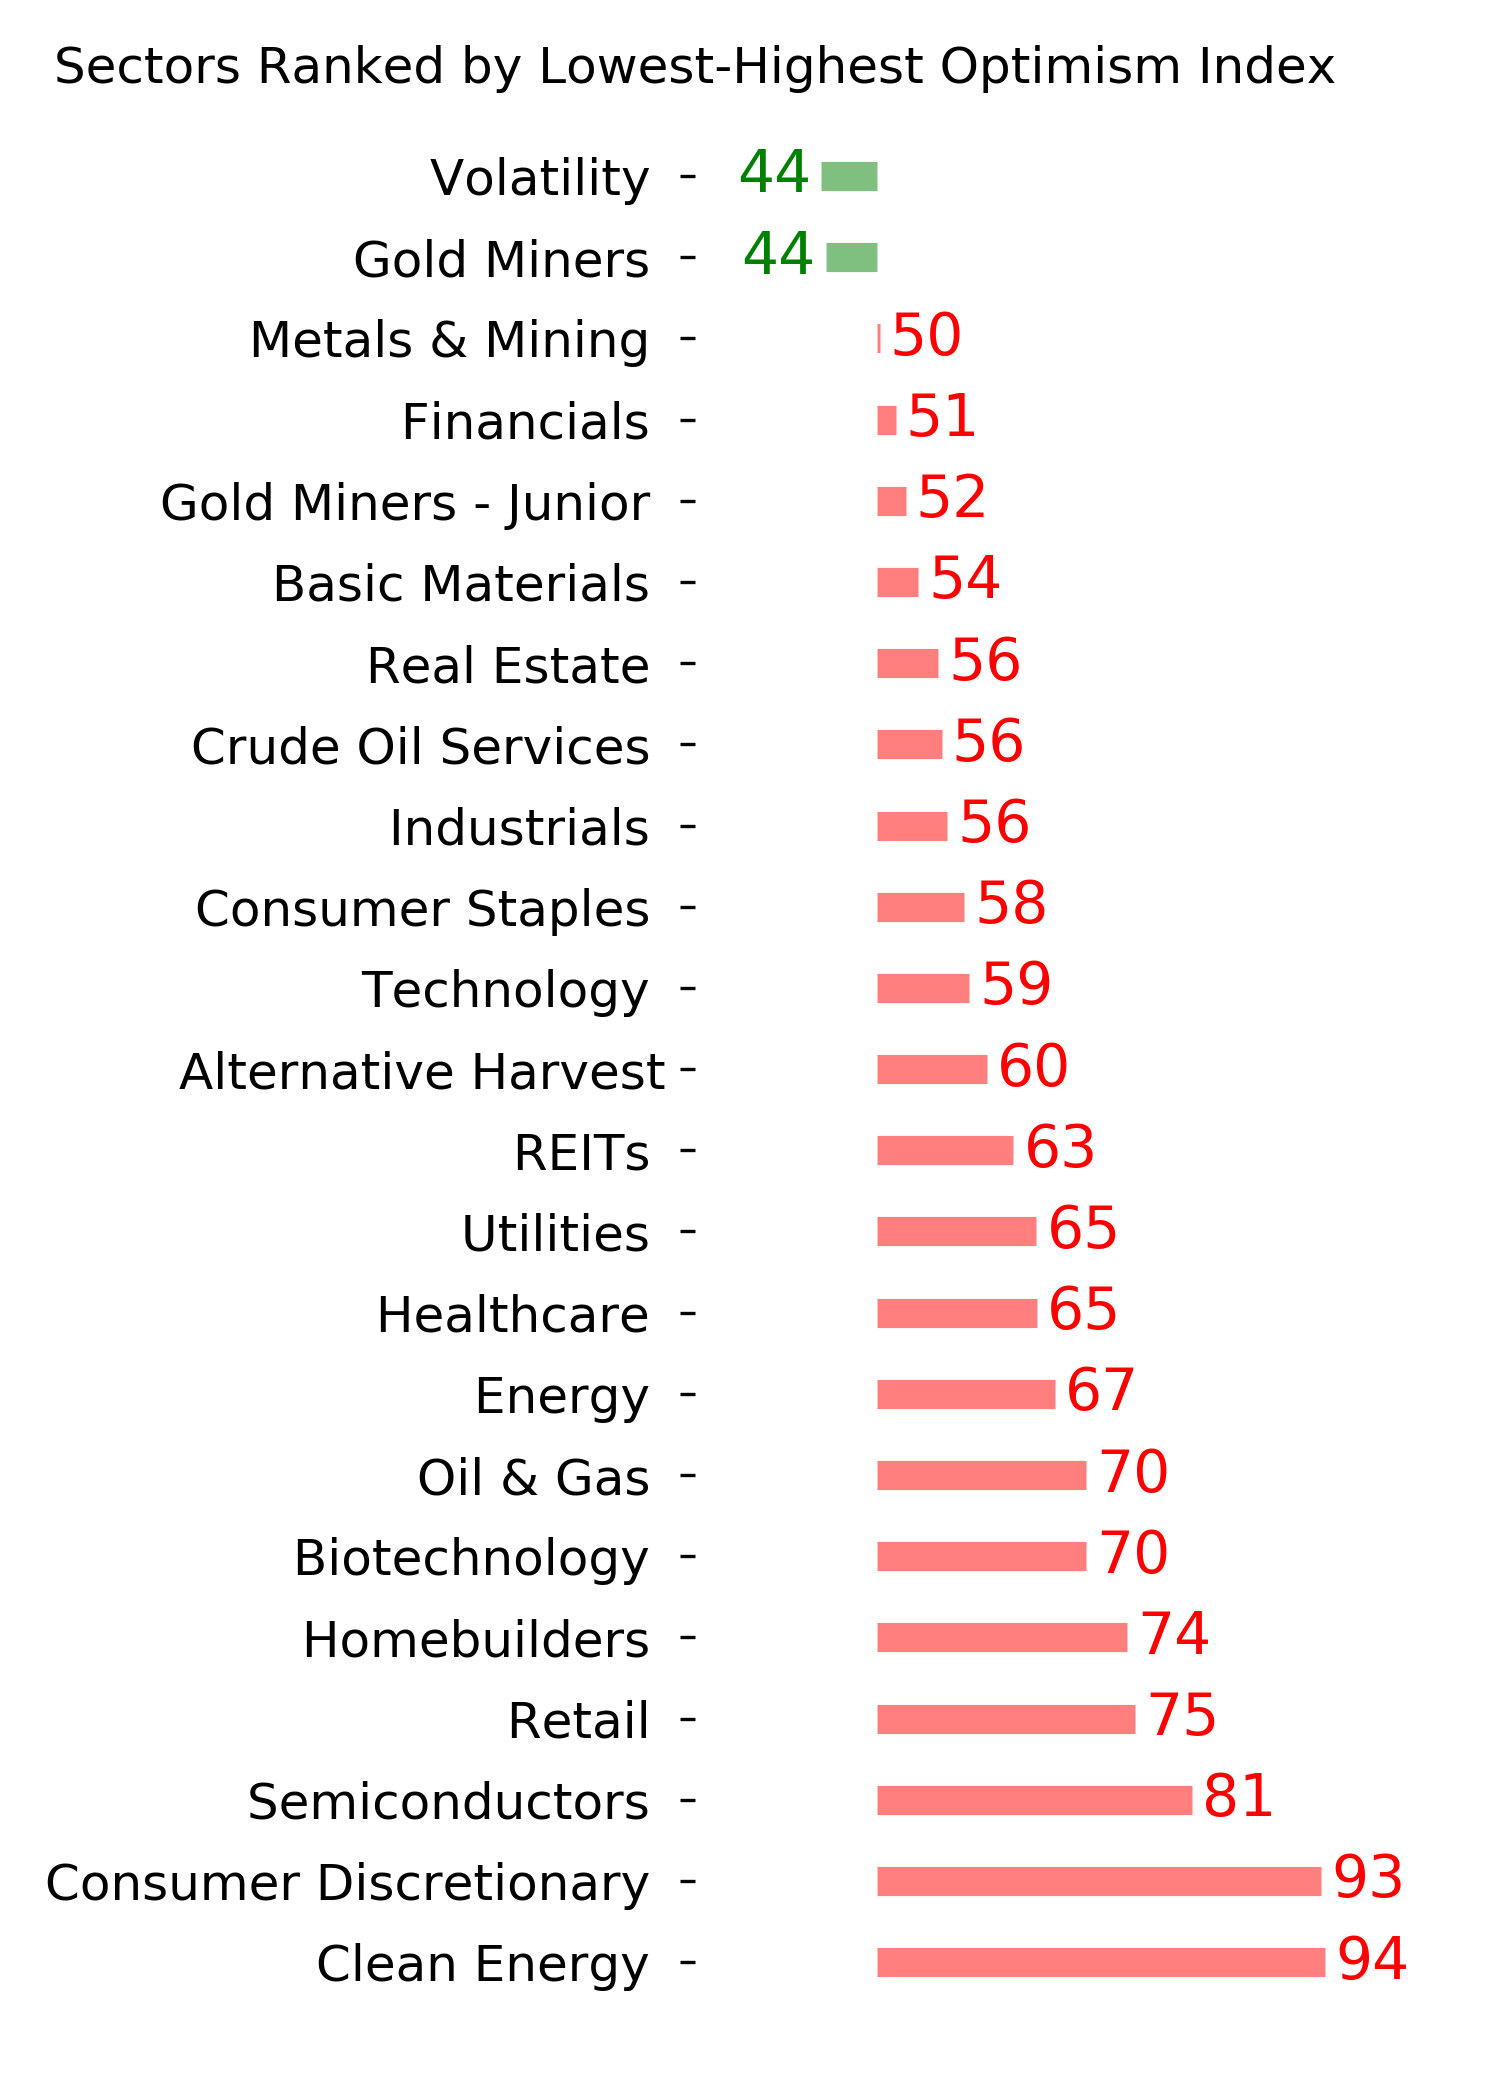
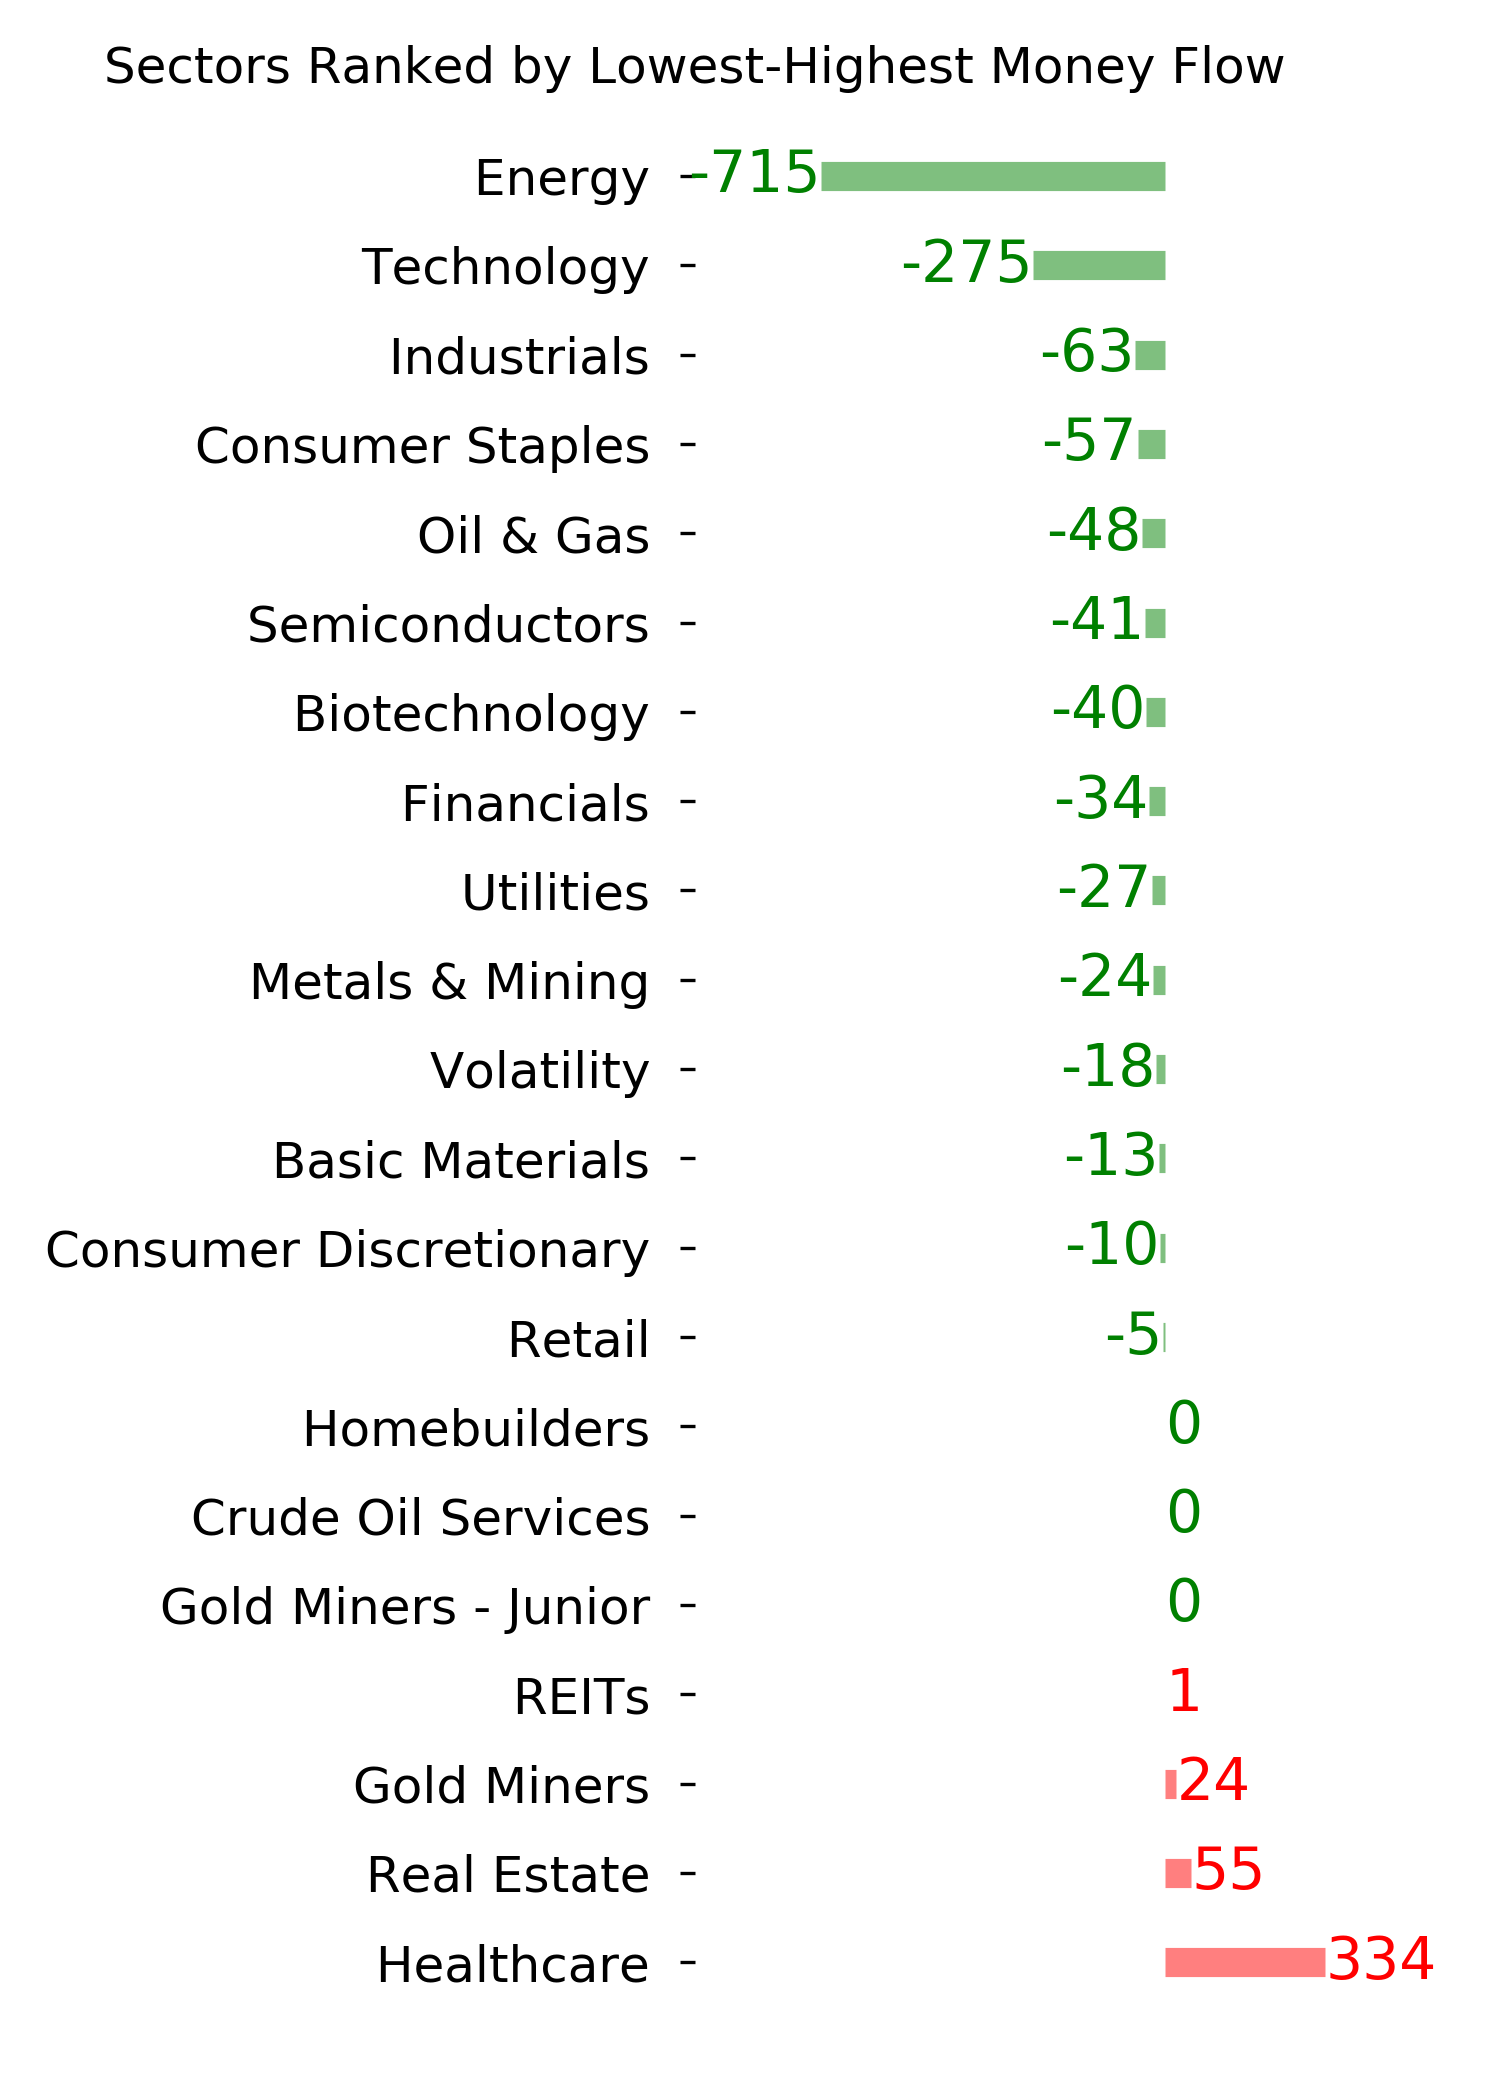
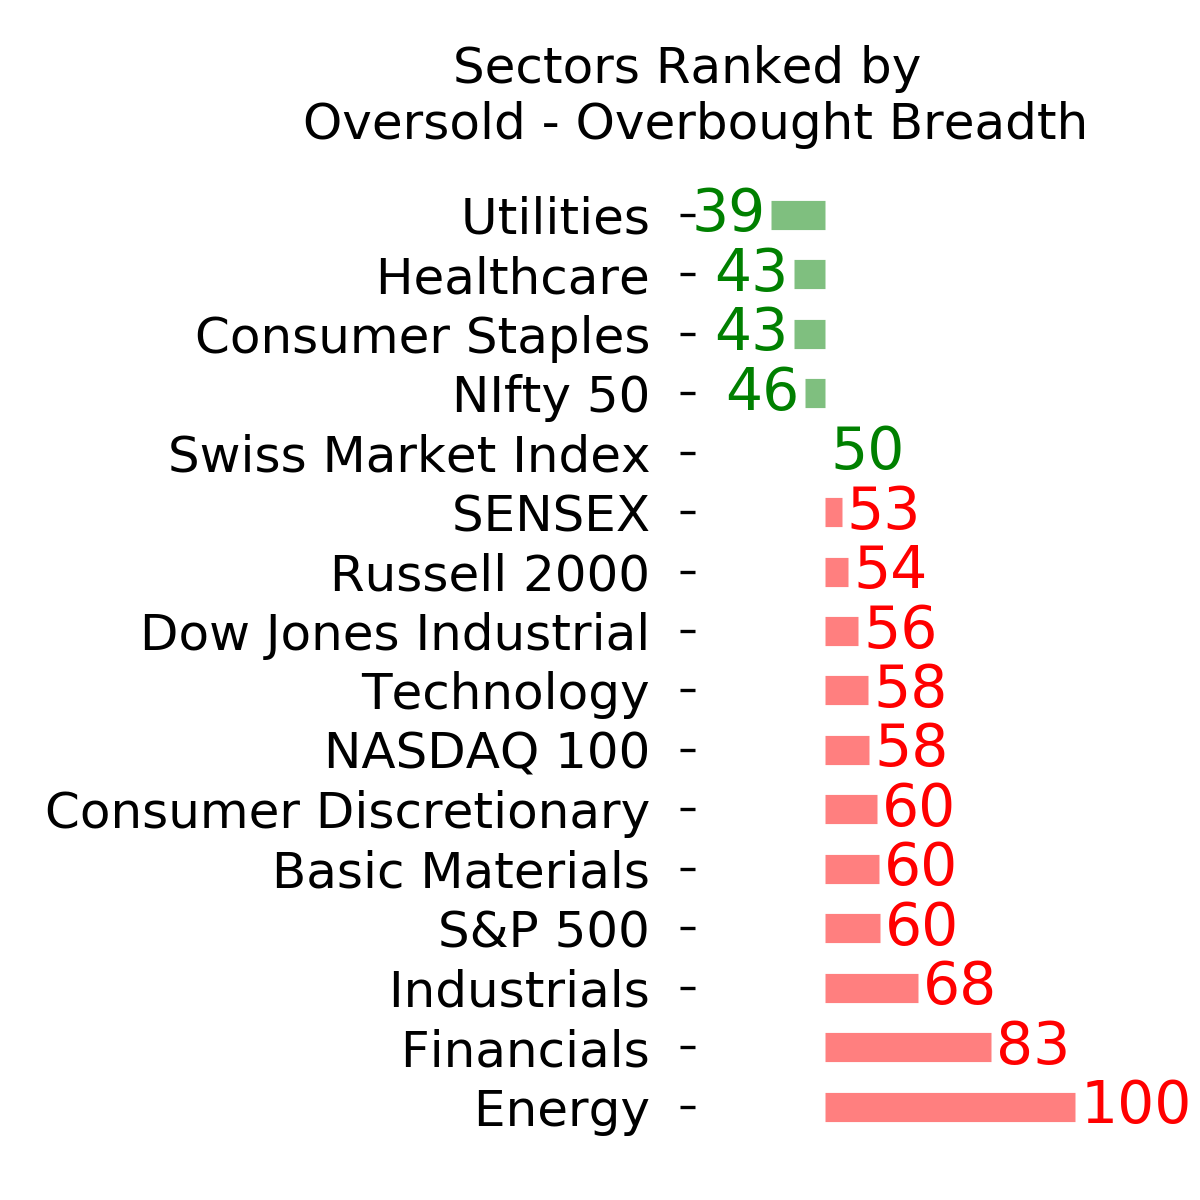
Ranks
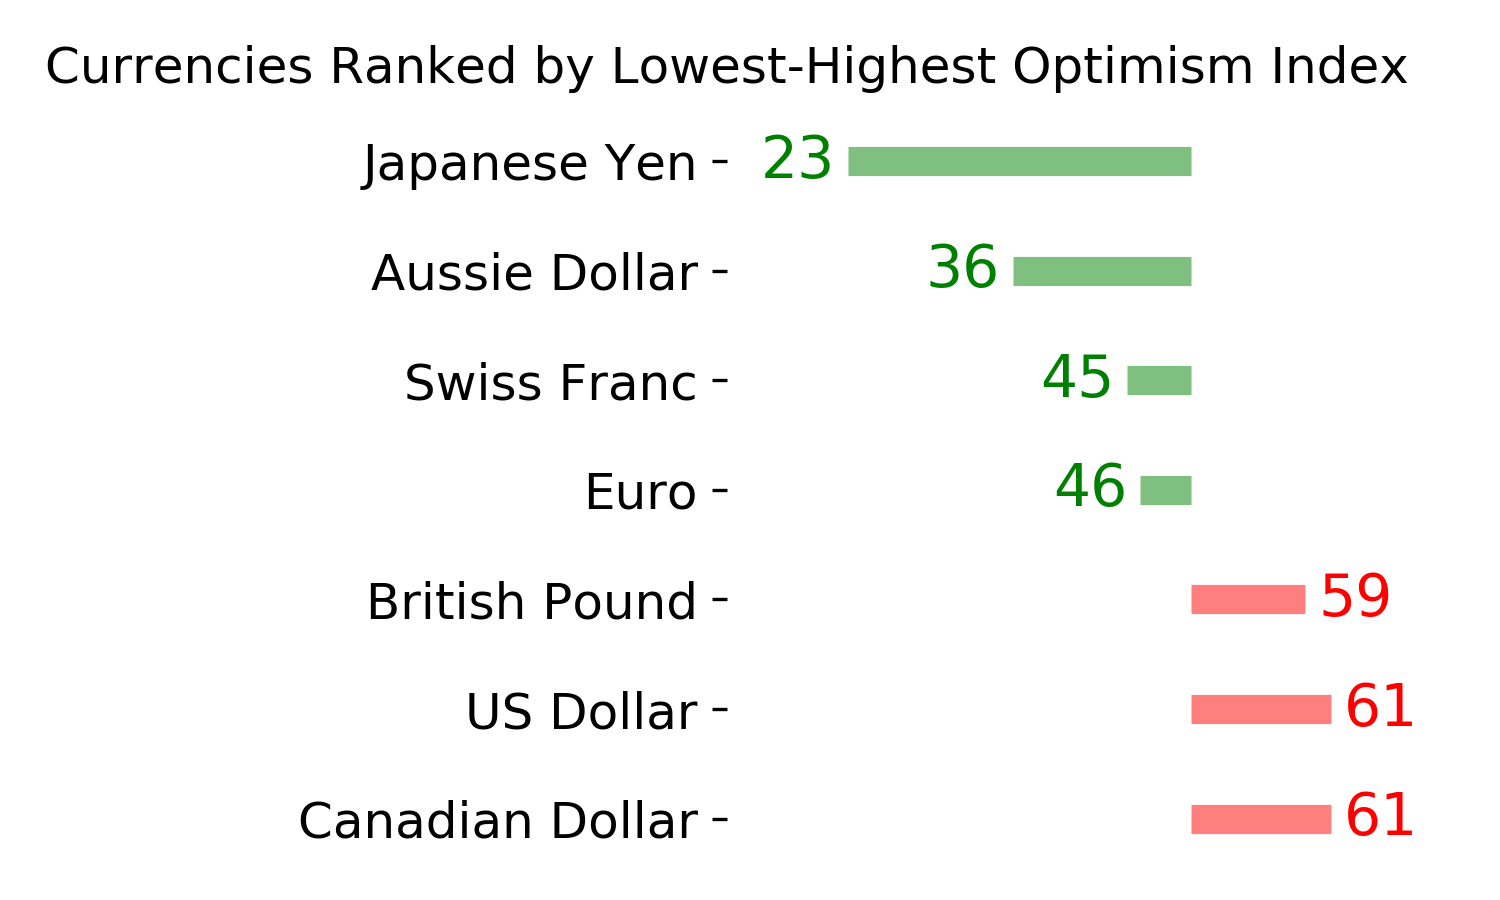
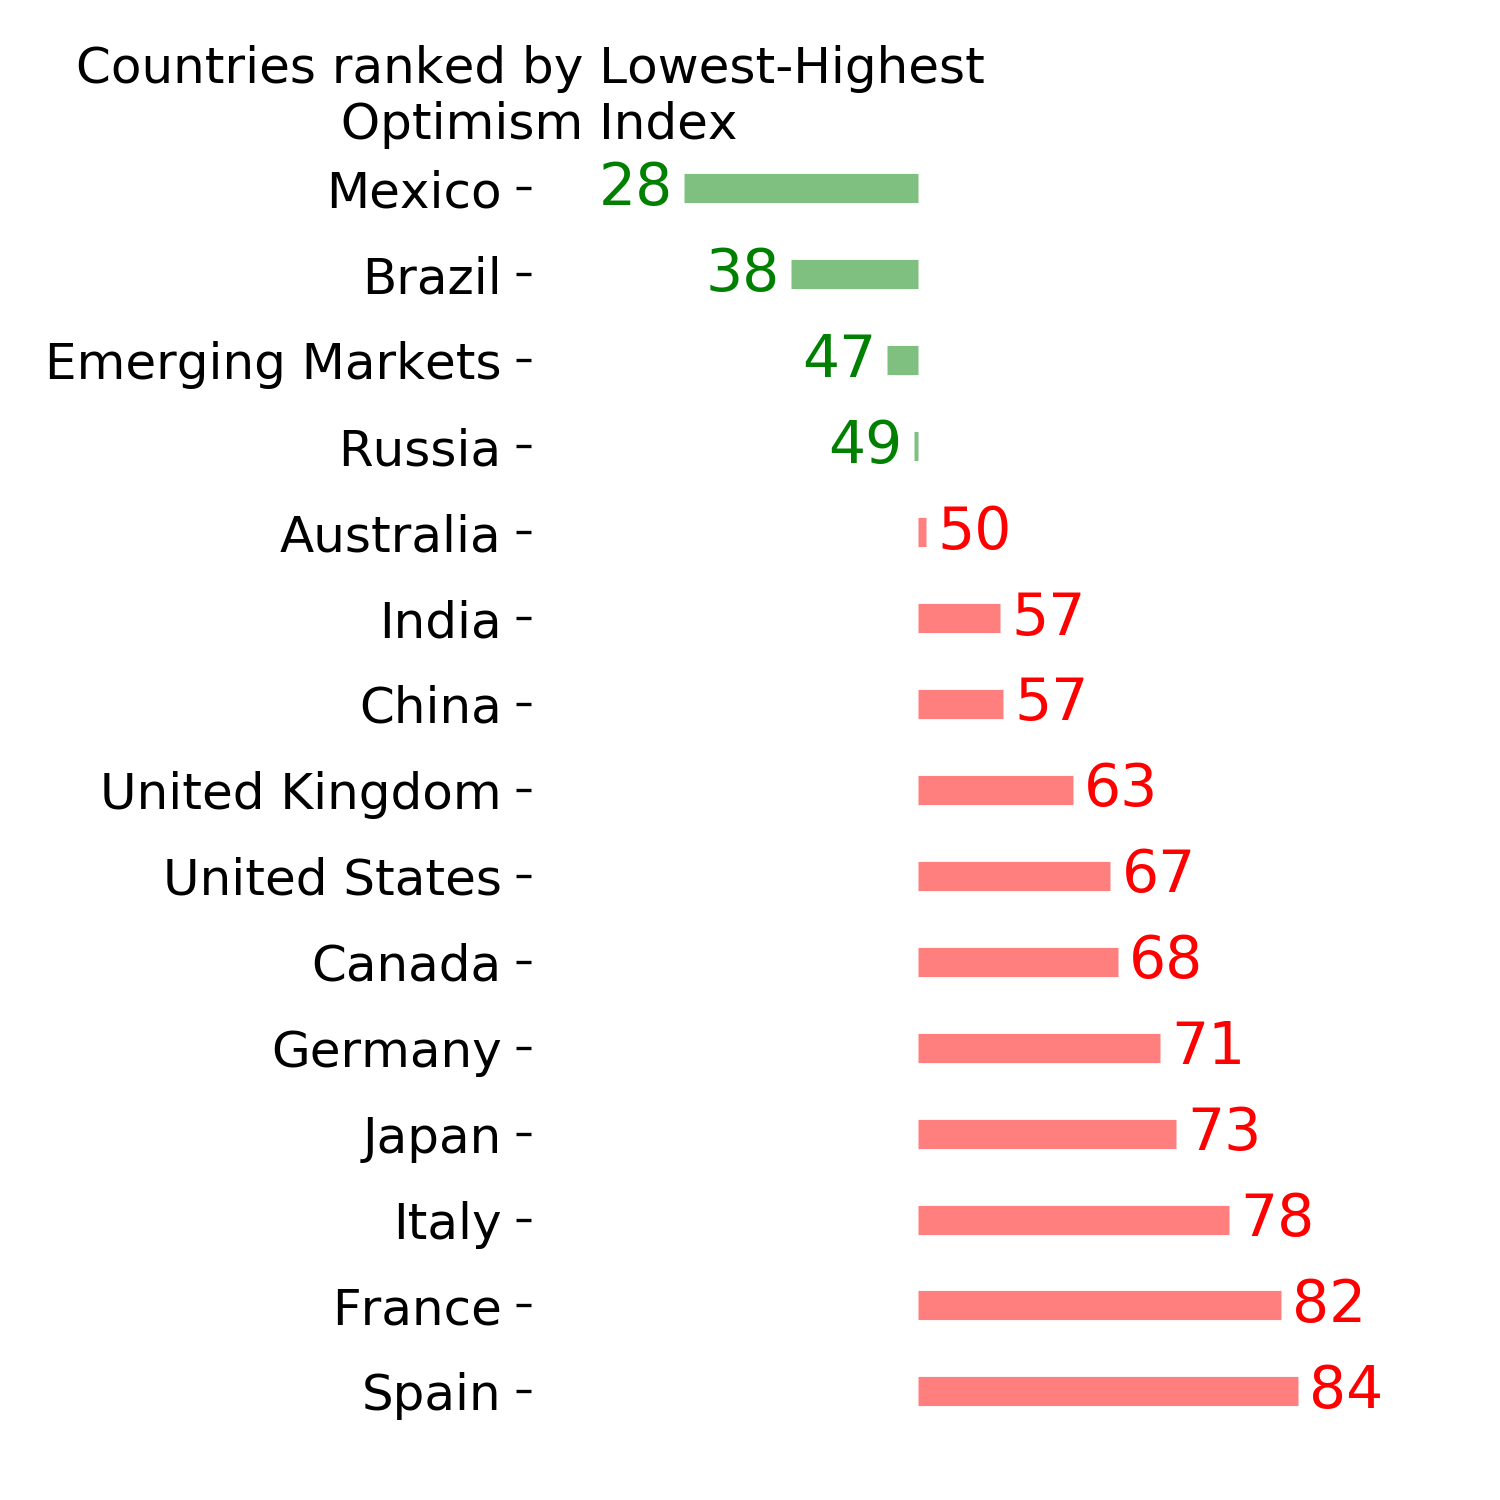
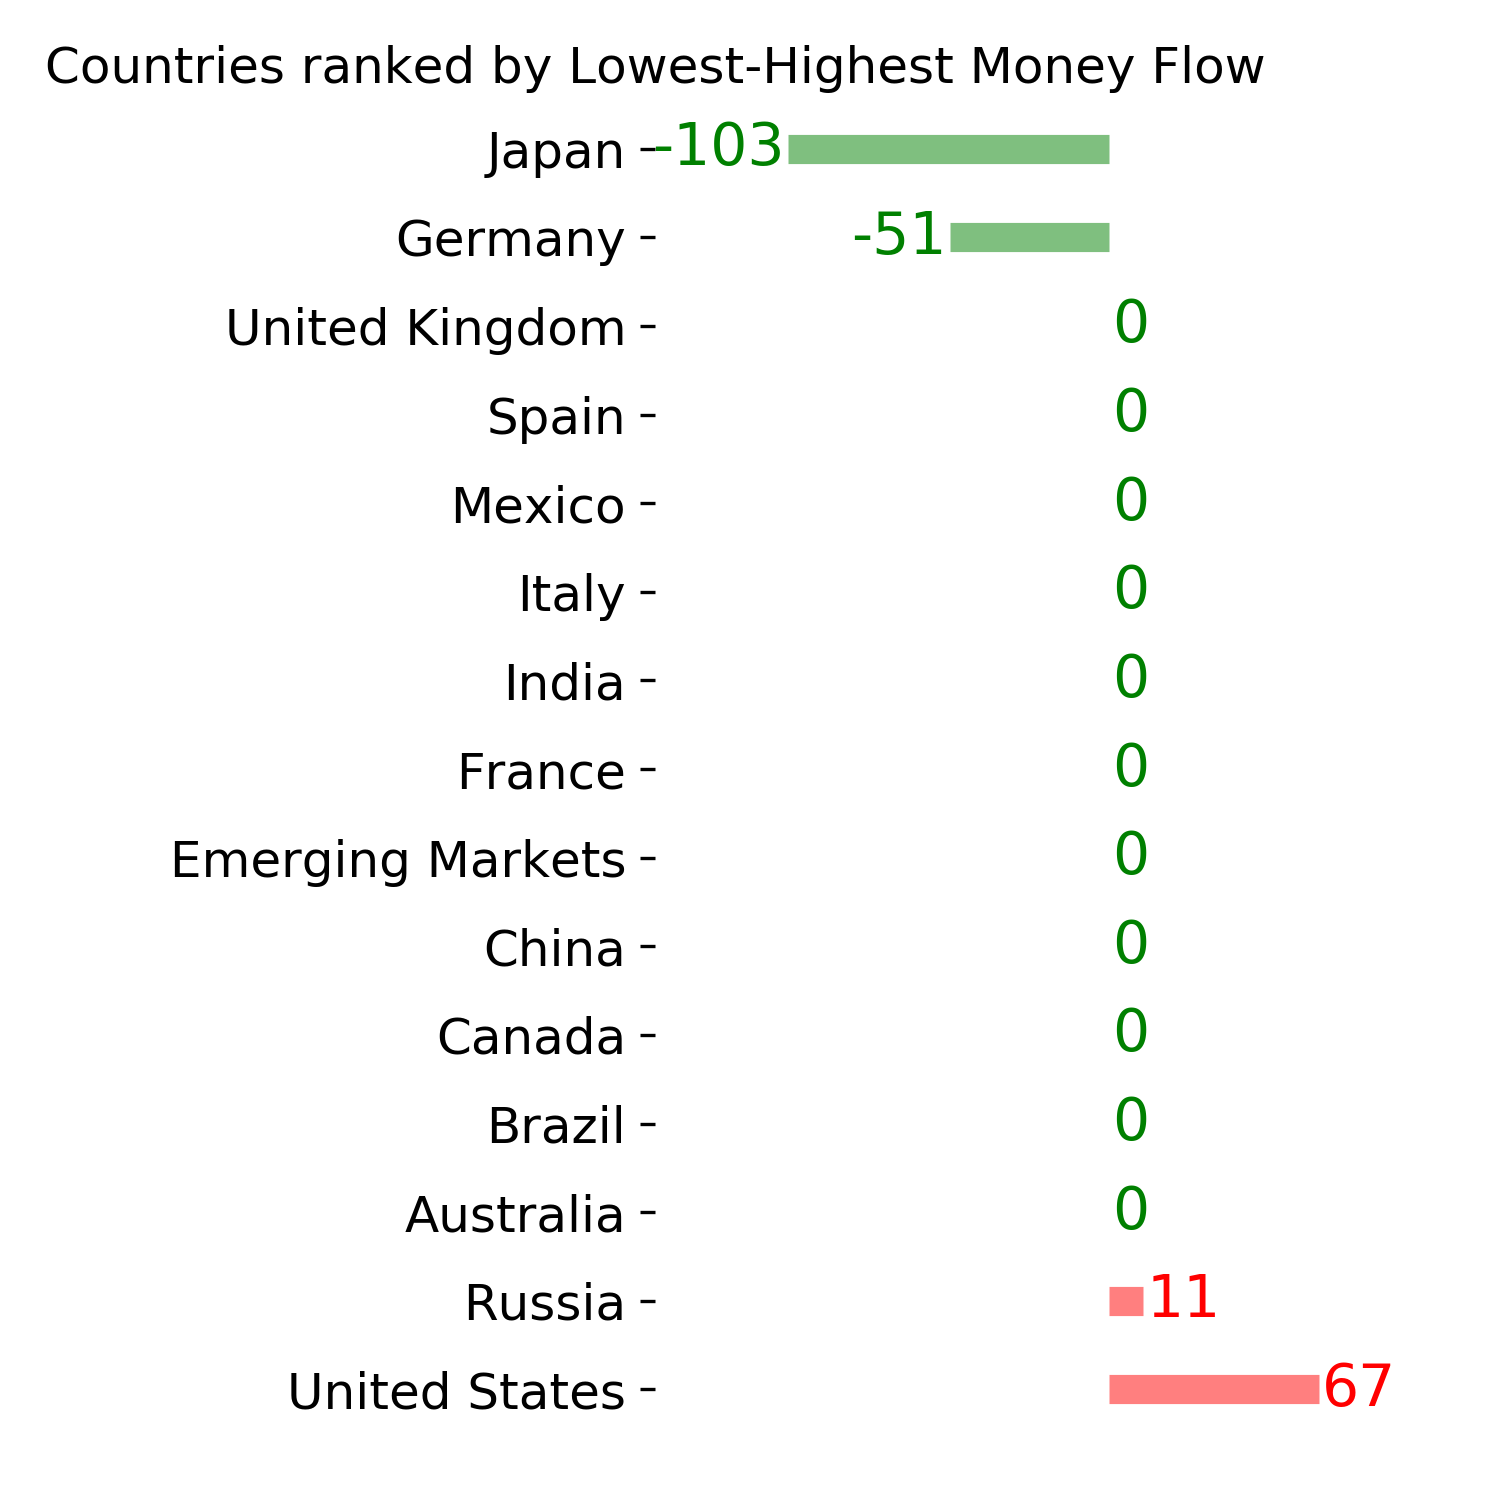
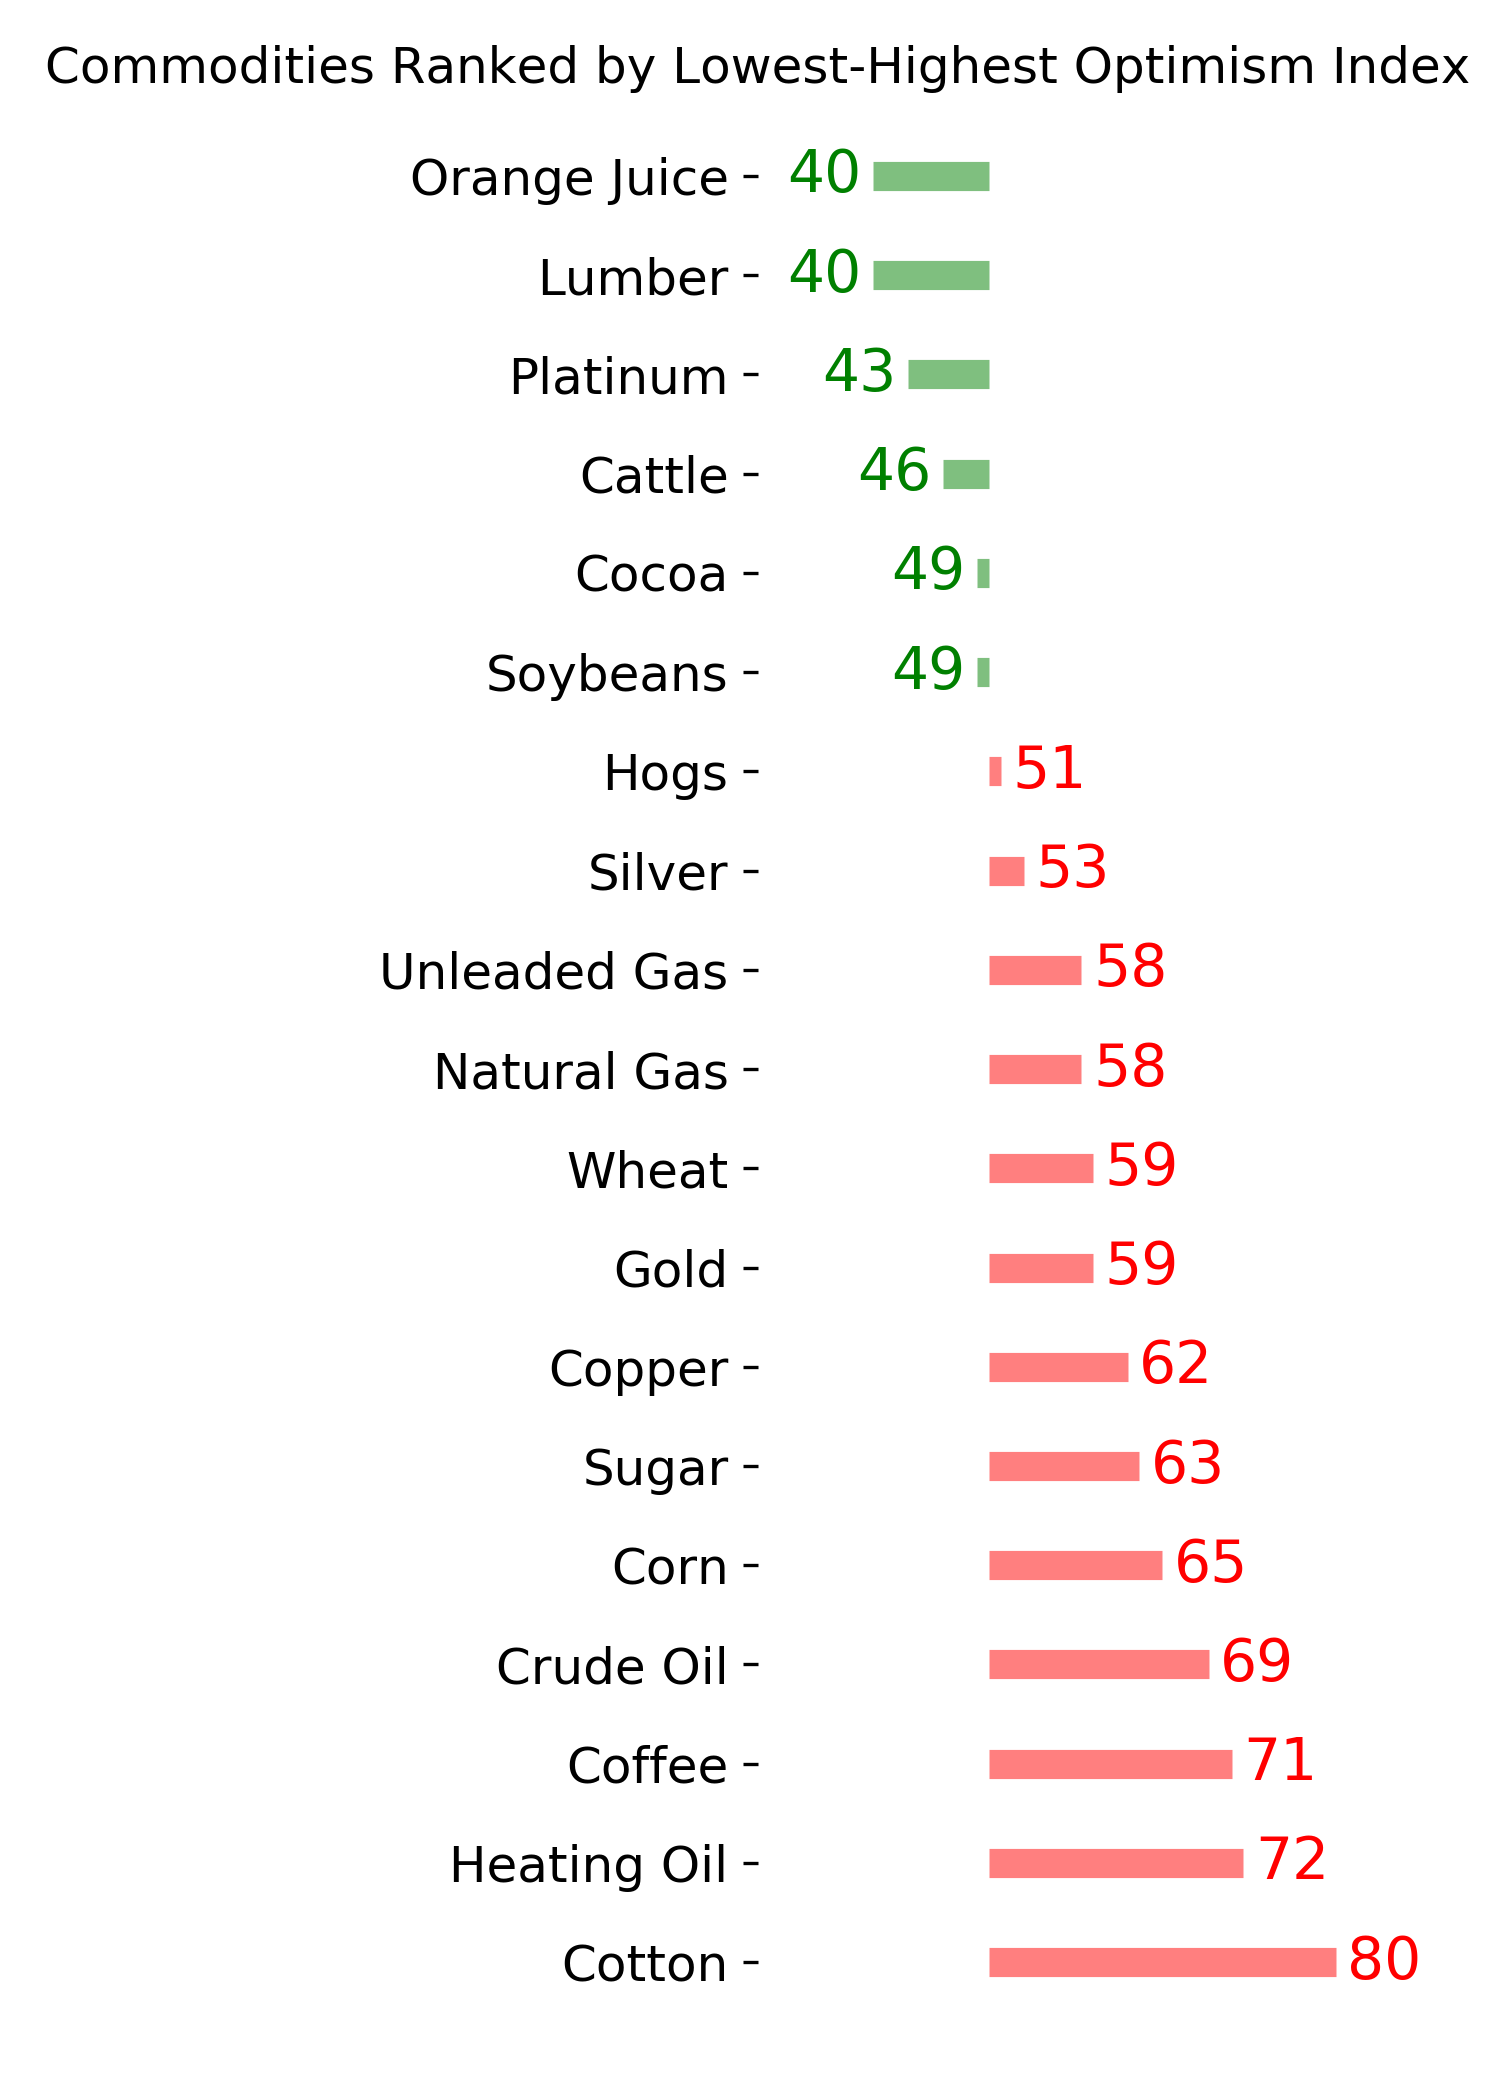
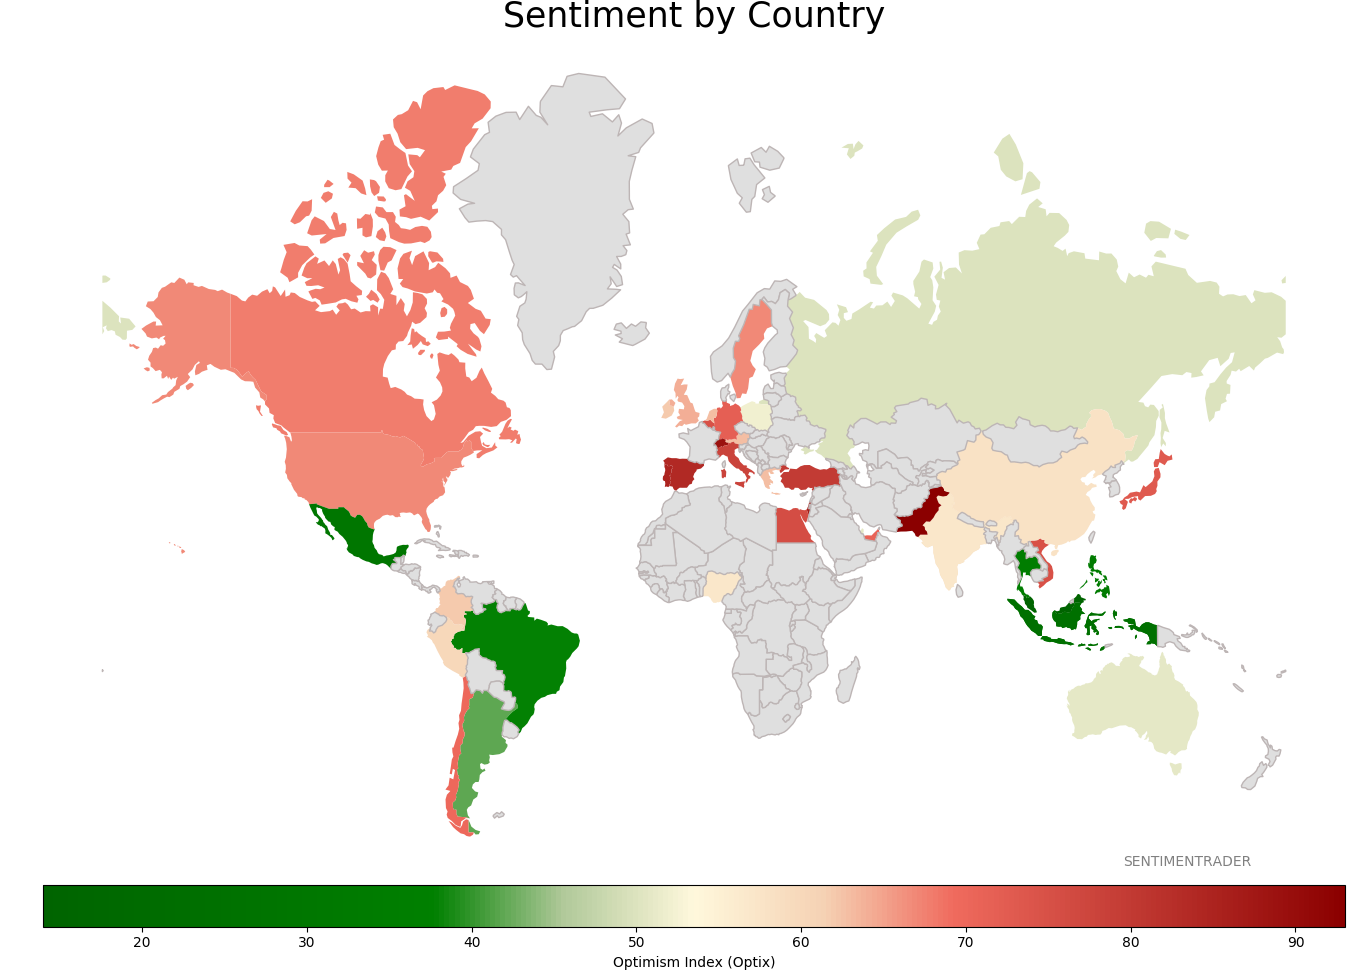
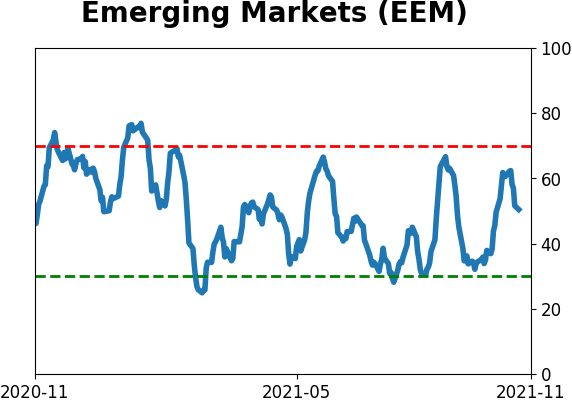
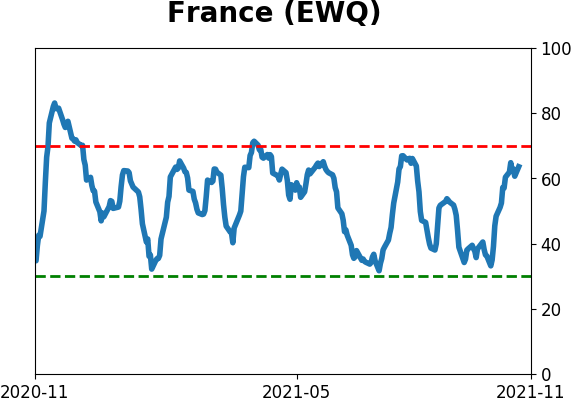
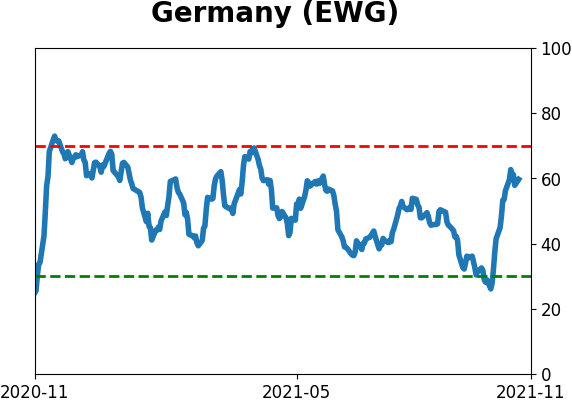
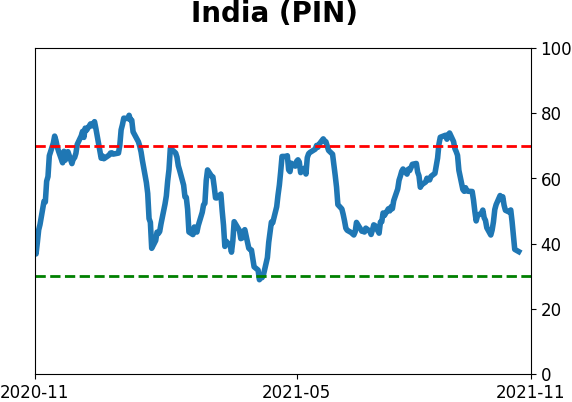
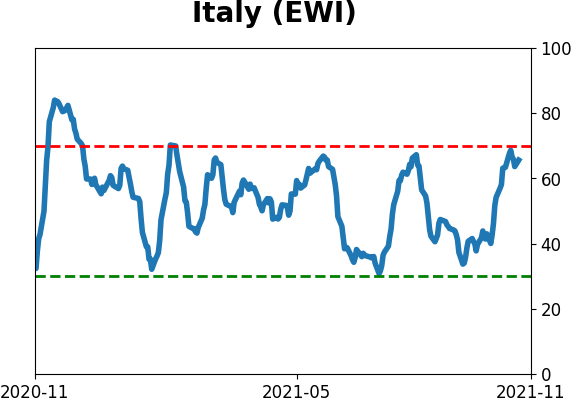
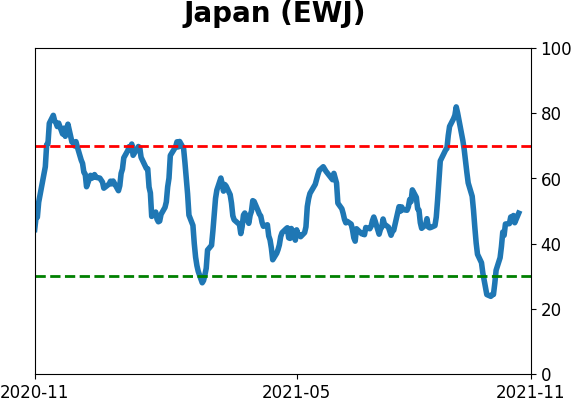
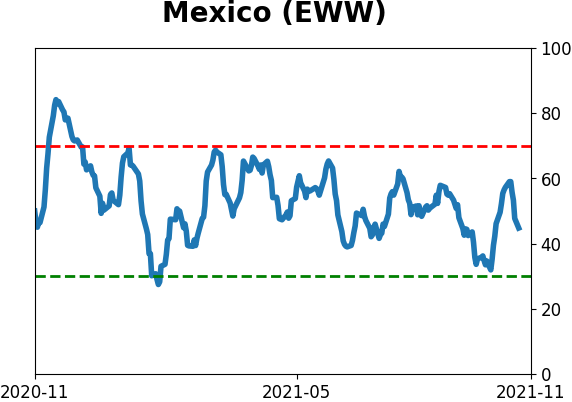
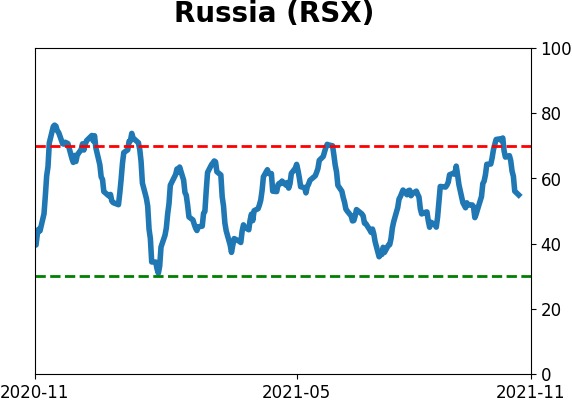
Sentiment Around The World
Optimism Index Thumbnails
|
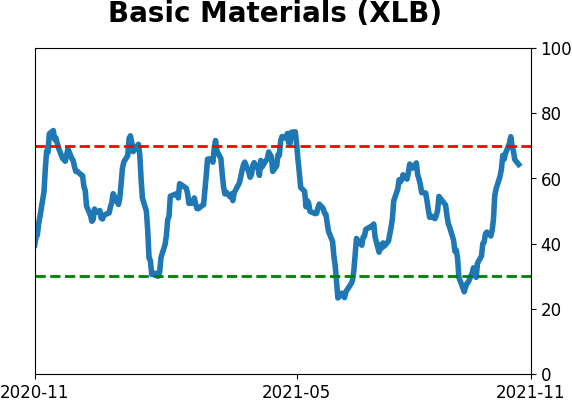
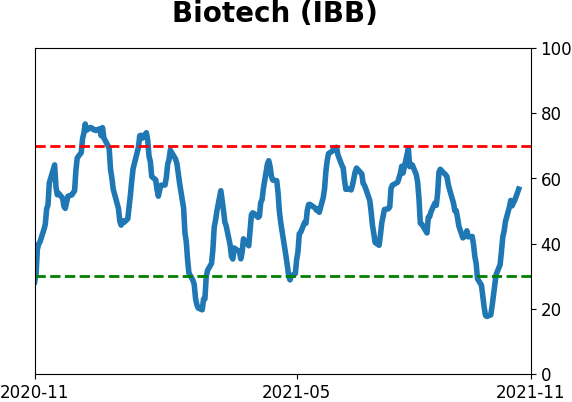
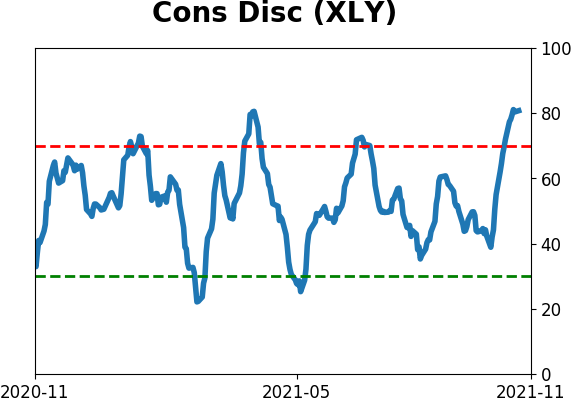
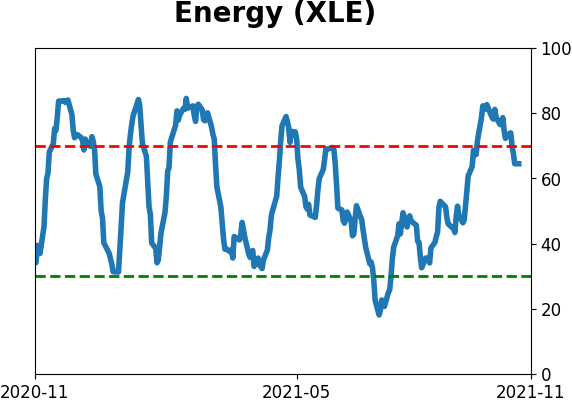
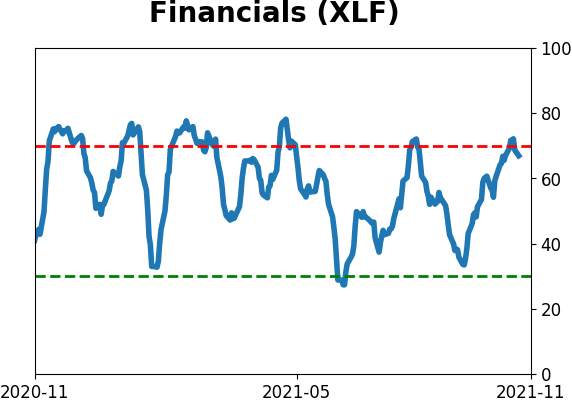
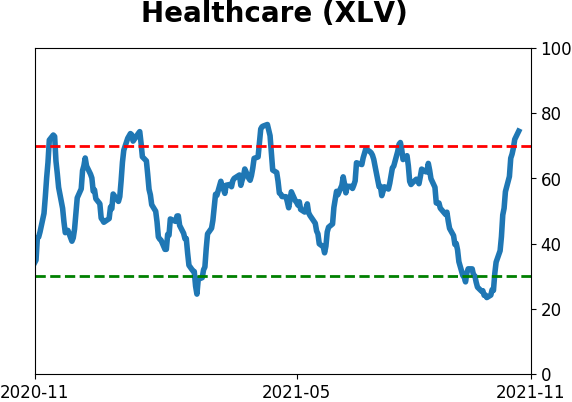
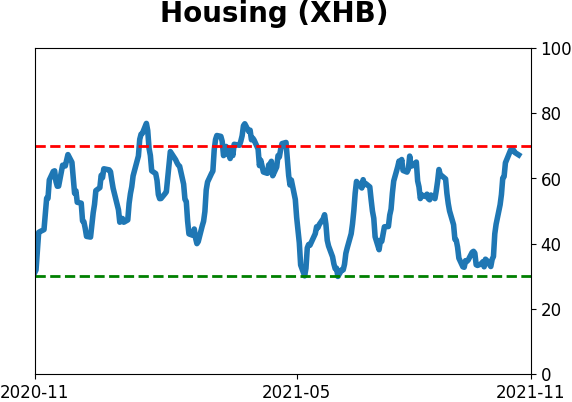
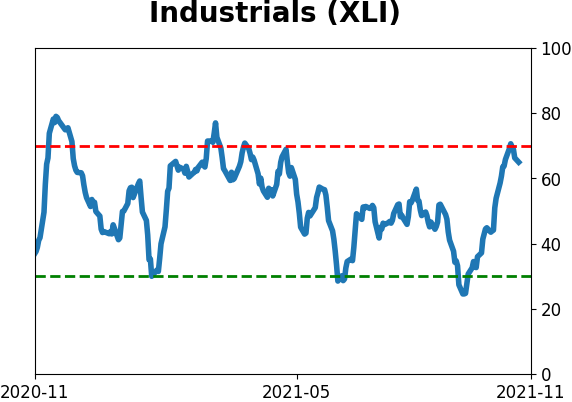
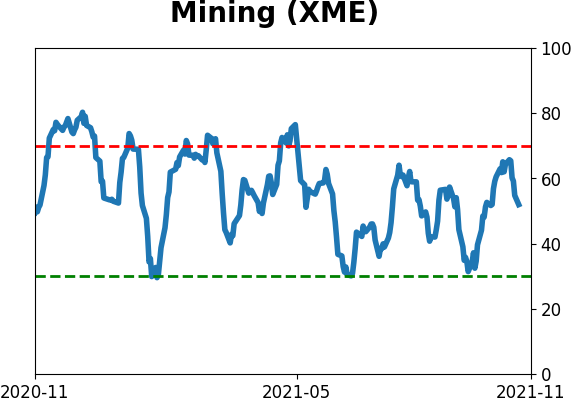
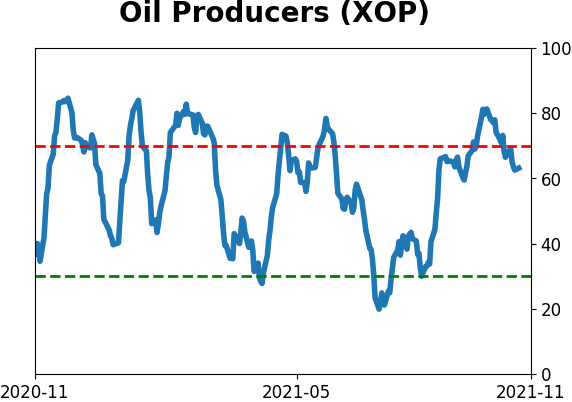
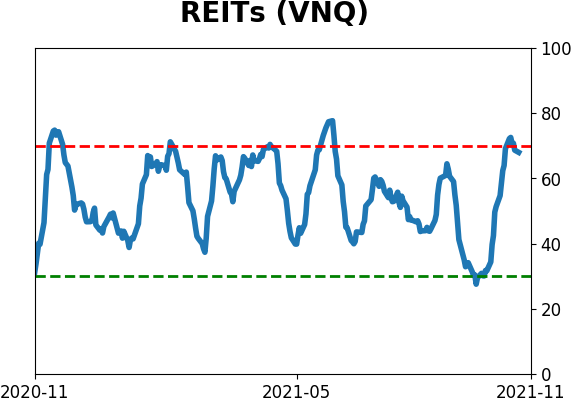
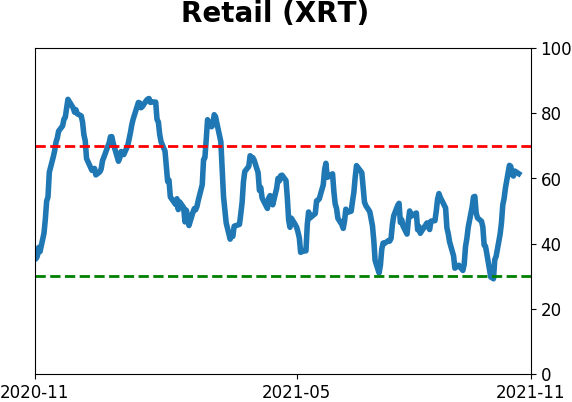
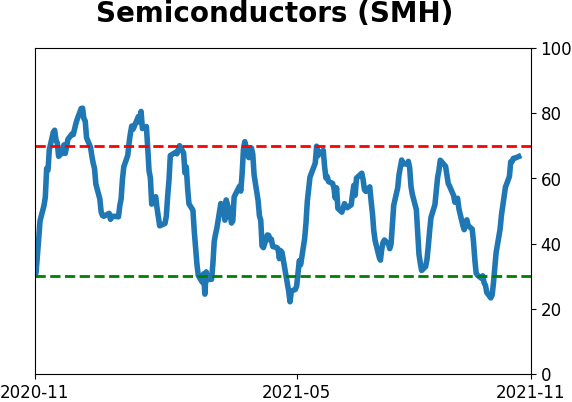
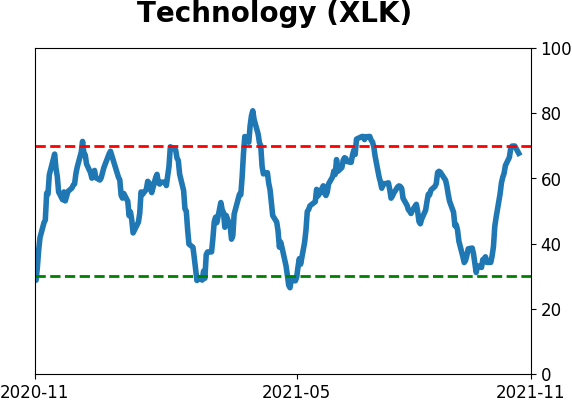
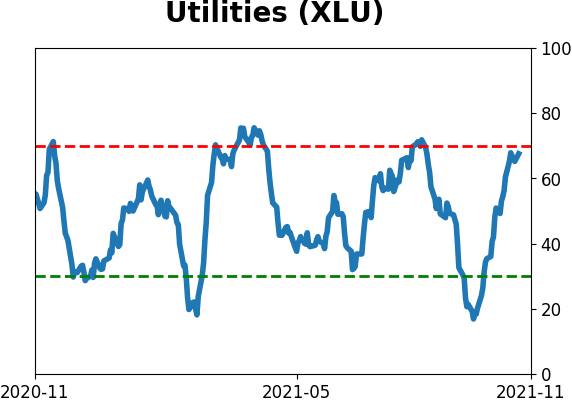
Sector ETF's - 10-Day Moving Average
|
|
|
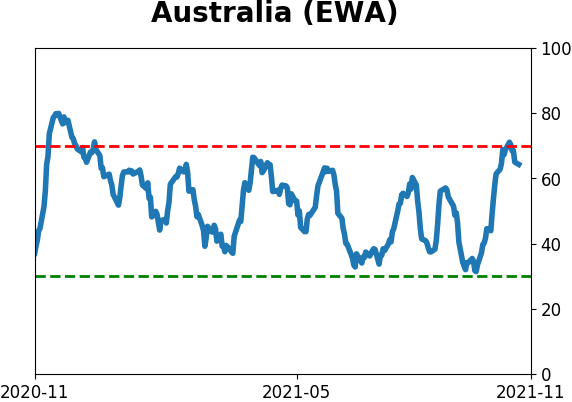
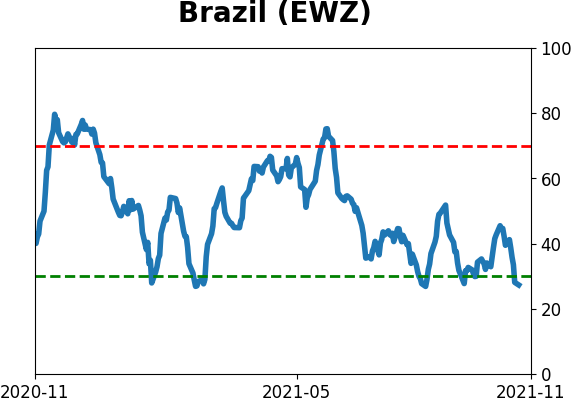
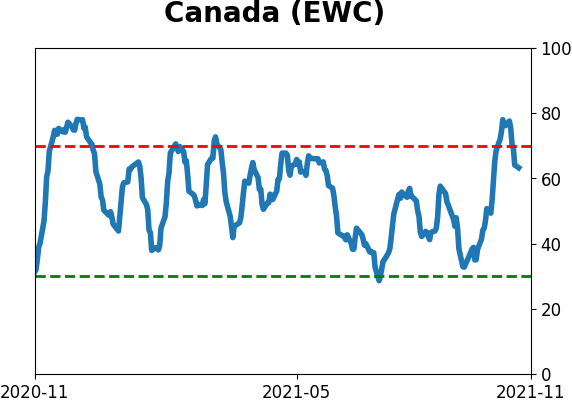
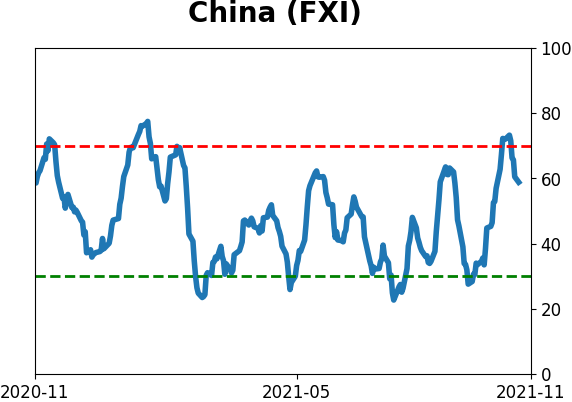
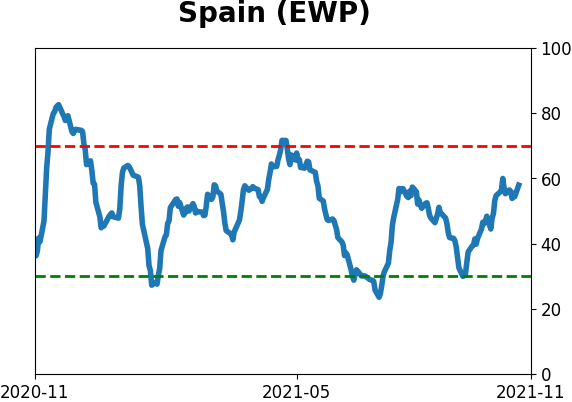
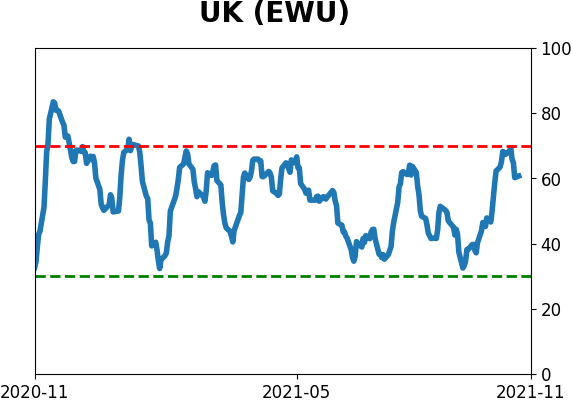
Country ETF's - 10-Day Moving Average
|
|
|
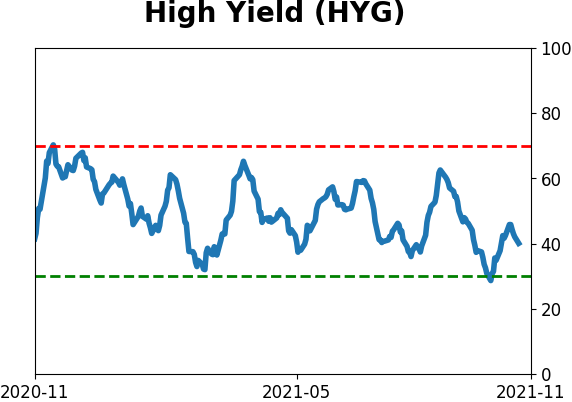
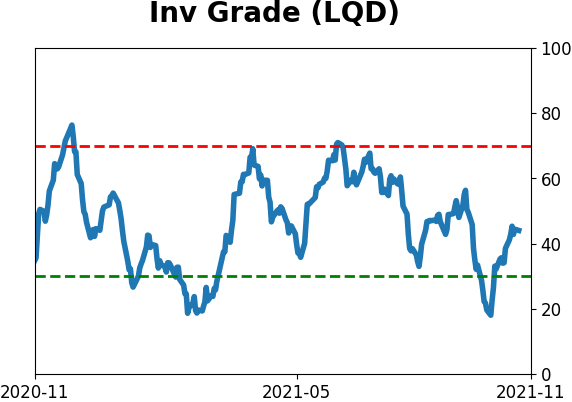
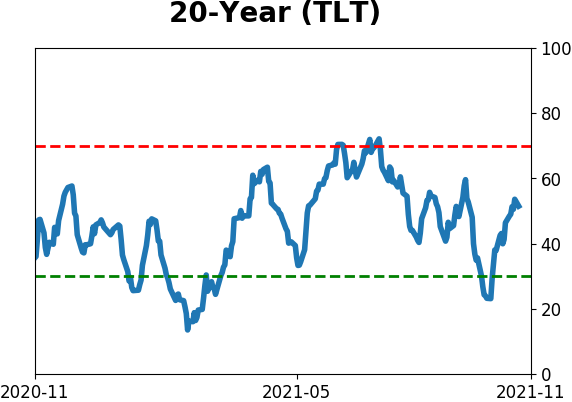
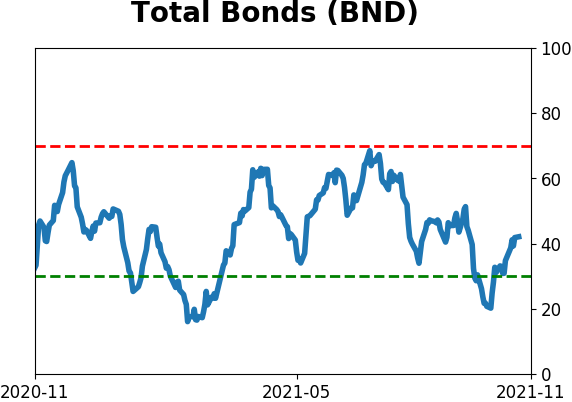
Bond ETF's - 10-Day Moving Average
|
|
|
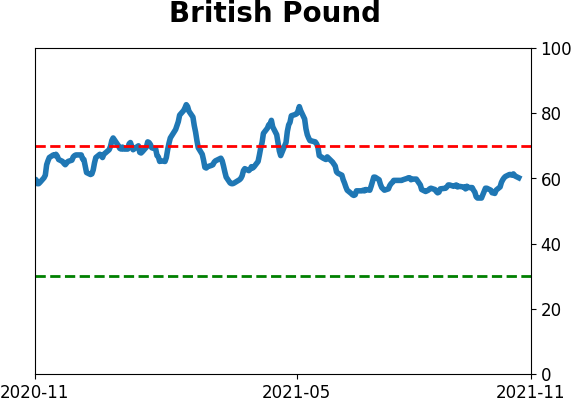
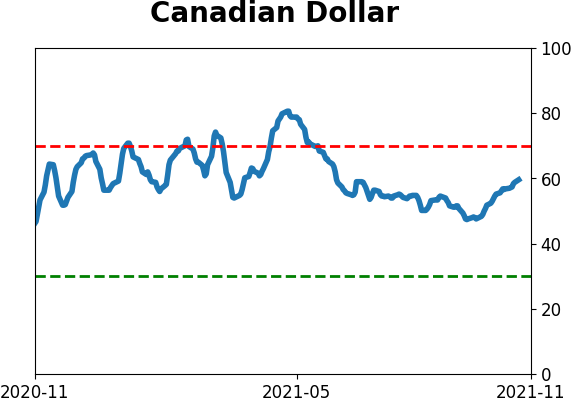
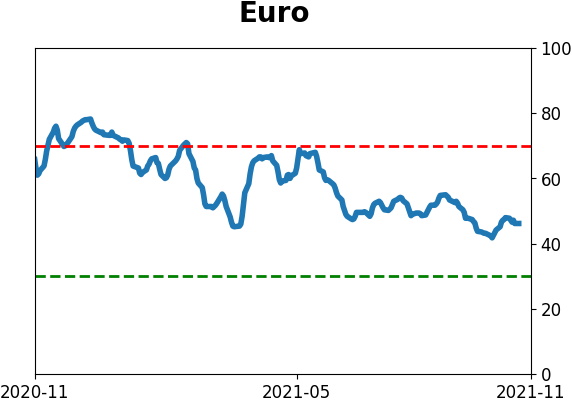
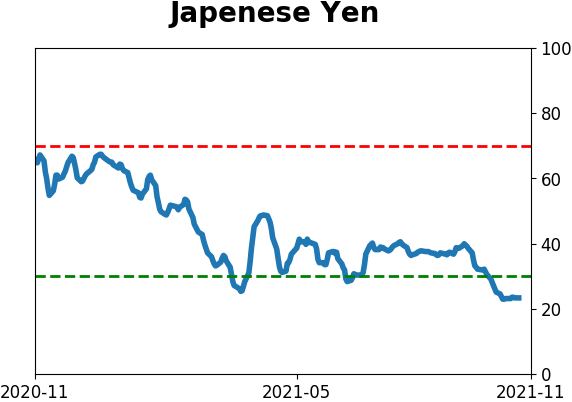
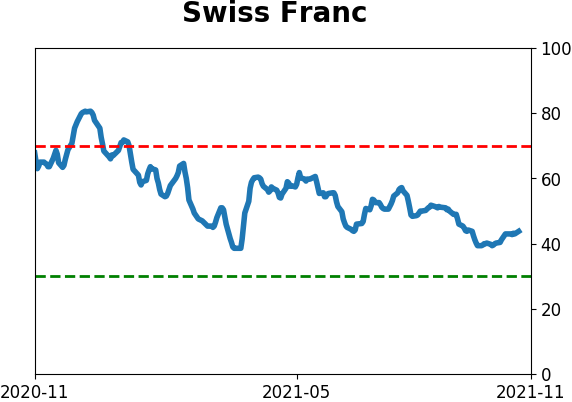
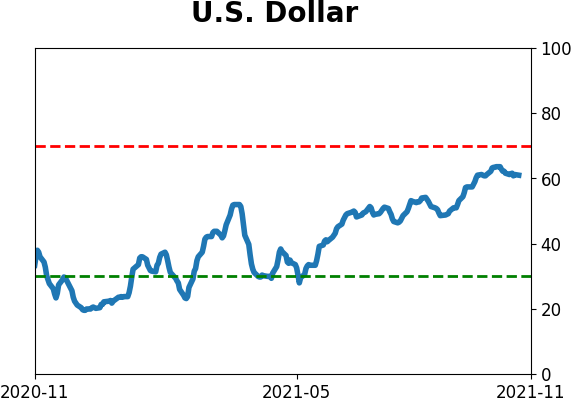
Currency ETF's - 5-Day Moving Average
|
|
|
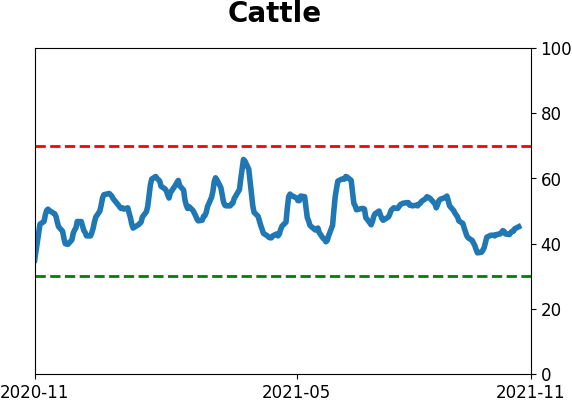
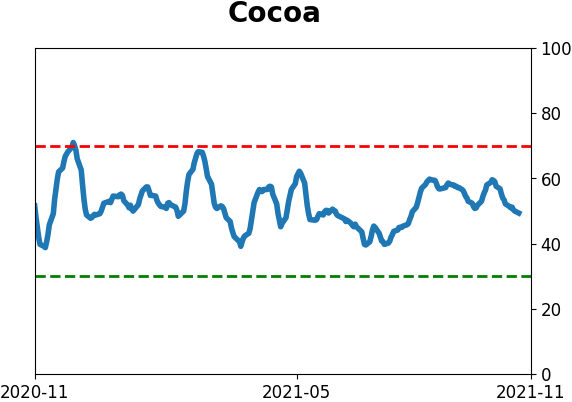
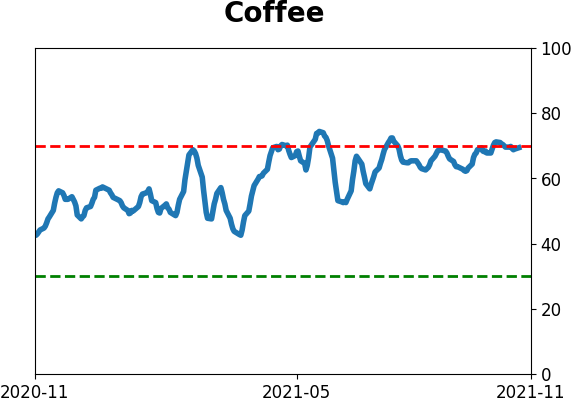
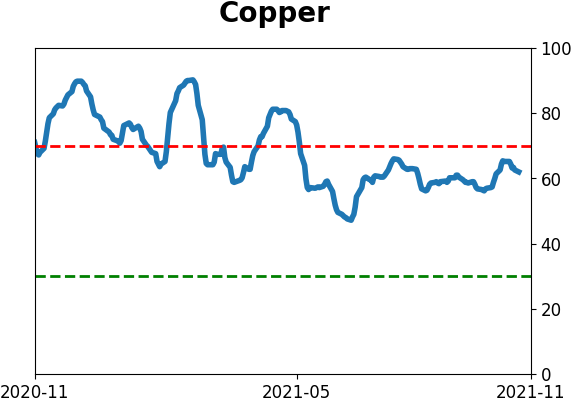
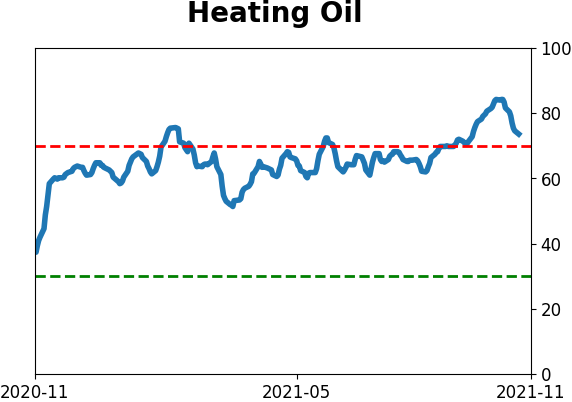
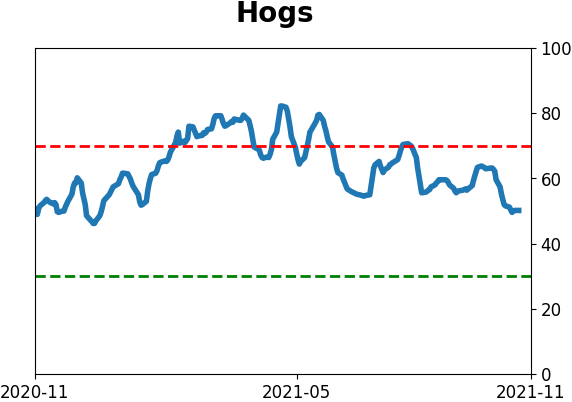
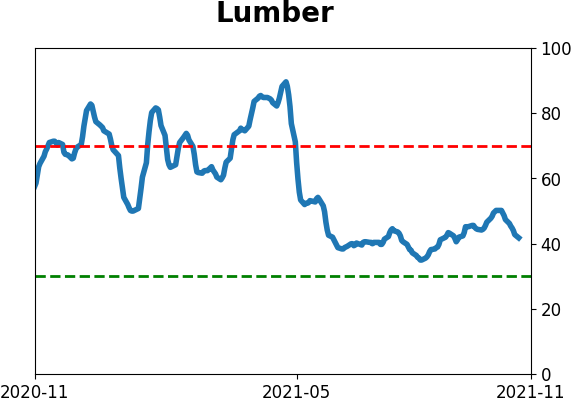
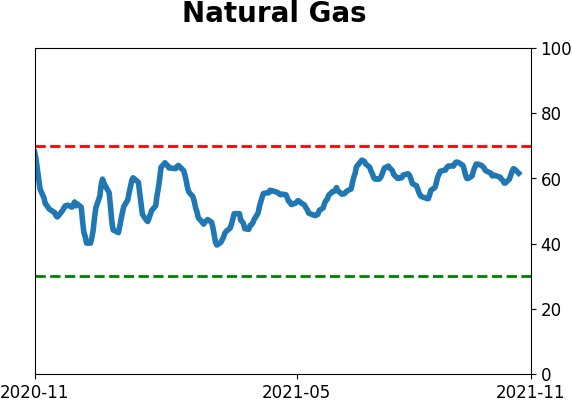
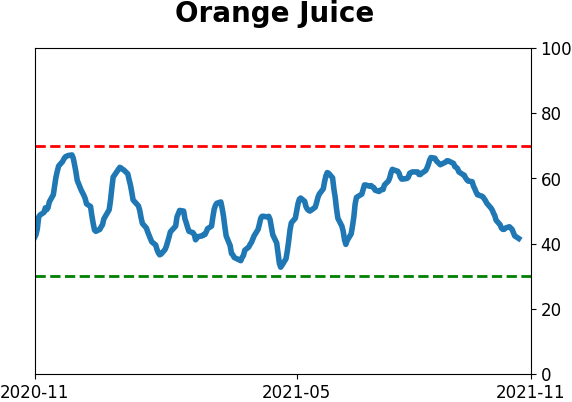
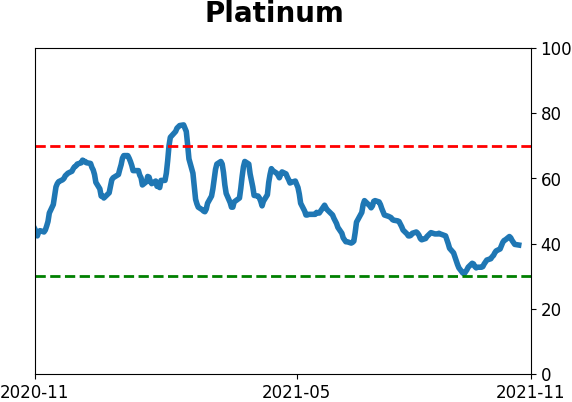
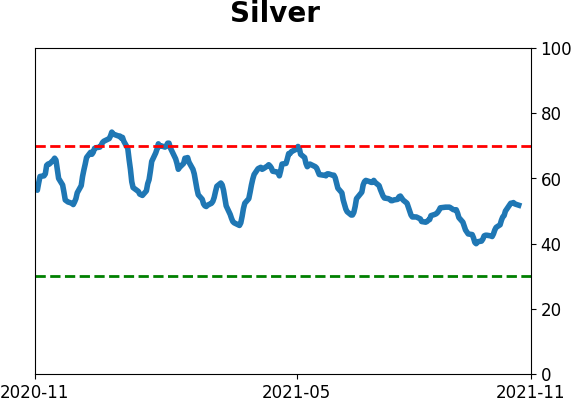
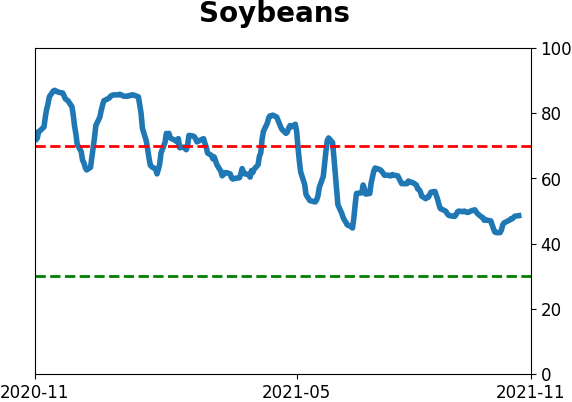
Commodity ETF's - 5-Day Moving Average
|
|