Headlines
|
|
ETF investors leave dividend stocks in favor of momentum:
In recent months (and quarters), ETF investors have pulled funds from those funds heavy on dividend-paying stocks, in favor of funds that focus on momentum. Other times we've seen this kind of flow, it was about time for dividend stocks to outperform.
A short-term breadth washout and initial recovery:
On Monday and Wednesday, selling pressure was heavy enough to push the 3-day average of both NYSE Up Issues and Up Volume below 20%, which recovered a bit by Thursday. During relatively healthy markets, this has typically led to shorter-term weakness, but medium-term strength.
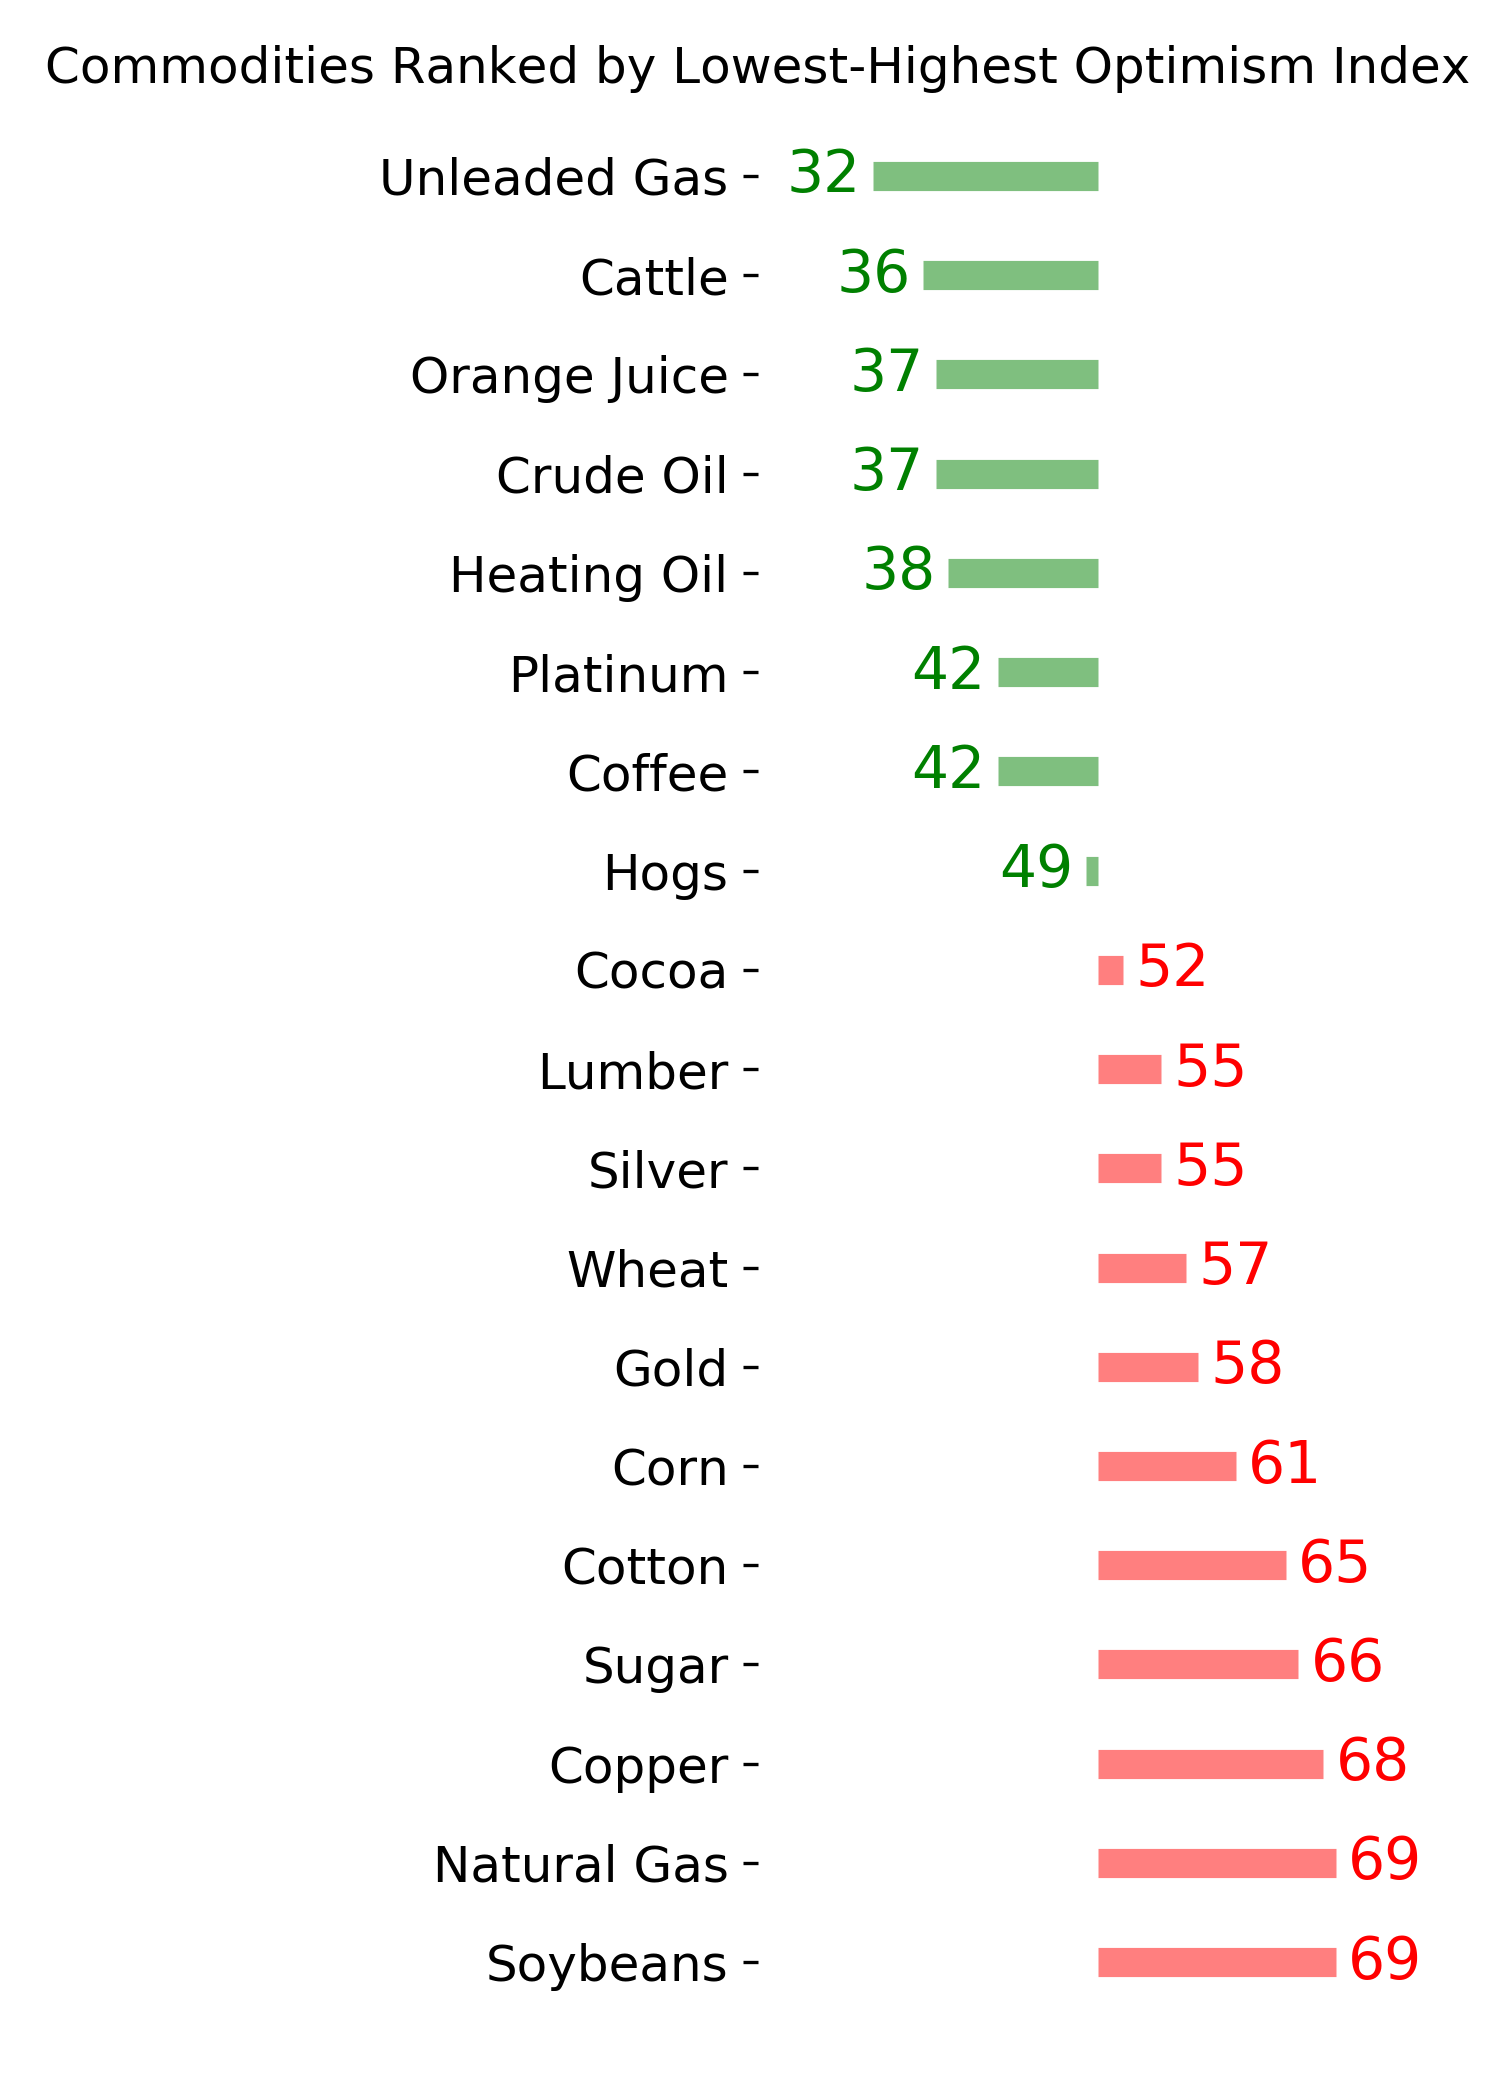
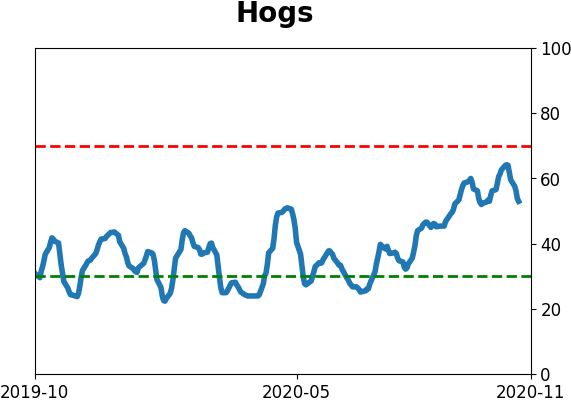
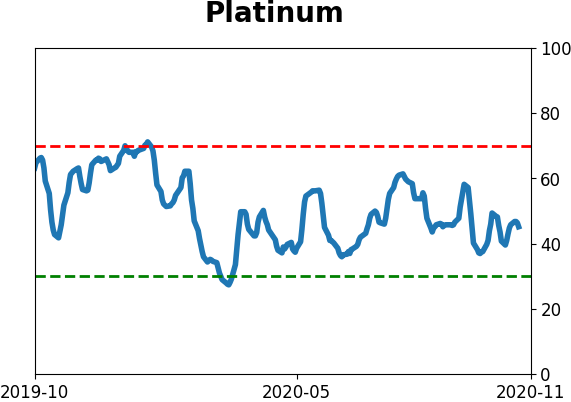
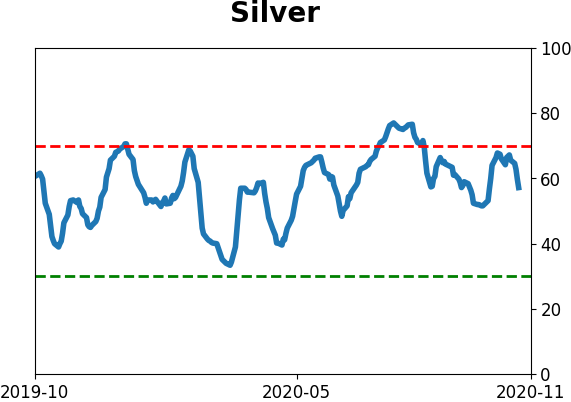
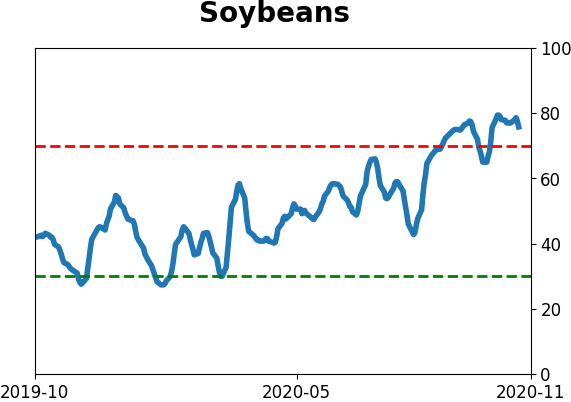
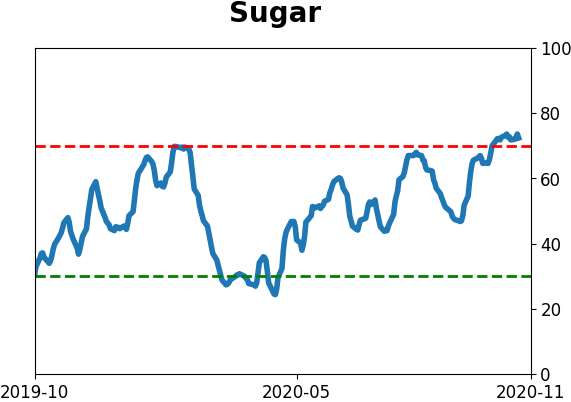
The latest Commitments of Traders report was released, covering positions through Tuesday: The 3-Year Min/Max Screen shows that "smart money" commercial hedgers mostly continued with their same positioning trends. They continue to push record short exposure in agriculture contracts, and commodities in general, with new extremes (again) in soybeans and sugar. So far, many of these contracts have been able to shrug off this positioning, which is a change from the past 8 years when they would roll over almost immediately. Hedgers have established a near-record long position in 30-year bonds, but are barely net long 10-year notes, which we've seen is an odd juxtaposition. In stocks, hedgers sold more and are now the most net short in nearly 2 years. This isn't a great sell signal, though. Per the Backtest Engine, the S&P showed flat returns up to 2 months later when they had short exposure of $45 billion or more.
October dip: October was a tale of two halves, with the first half of the month doing very well and triggering impressive momentum. The second half erased all those gains and then some. The S&P 500 ended up with a loss of nearly 3% for the month. But this comes on the heels of having set a multi-year closing high at some point in the past few months. When that happened and then it suffered a loss of 1% or more in October, future returns were almost universally positive. Seasonality + momentum + mean reversion tends to be a powerful force.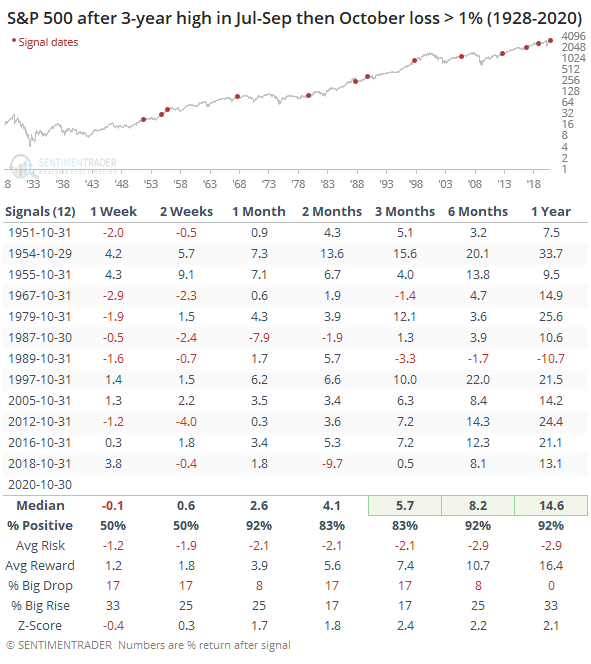
Bottom Line:
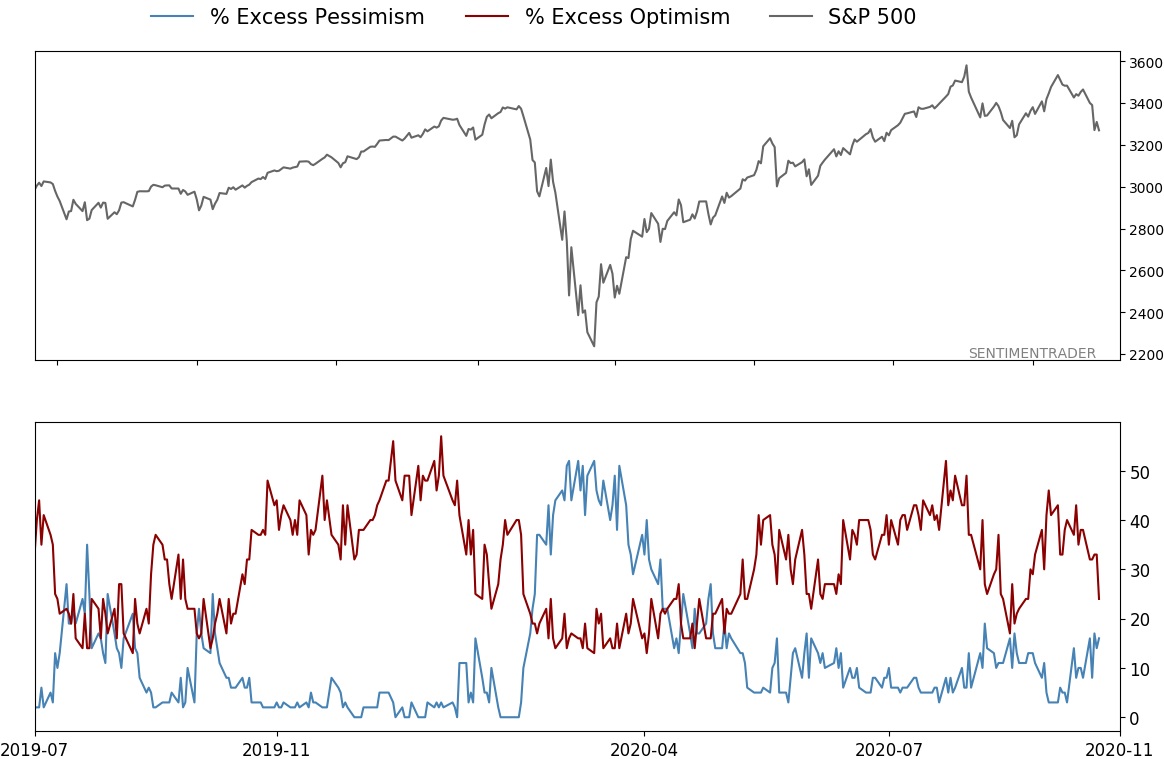
- A positive environment favors becoming aggressive on signs of excessive pessimism.
|
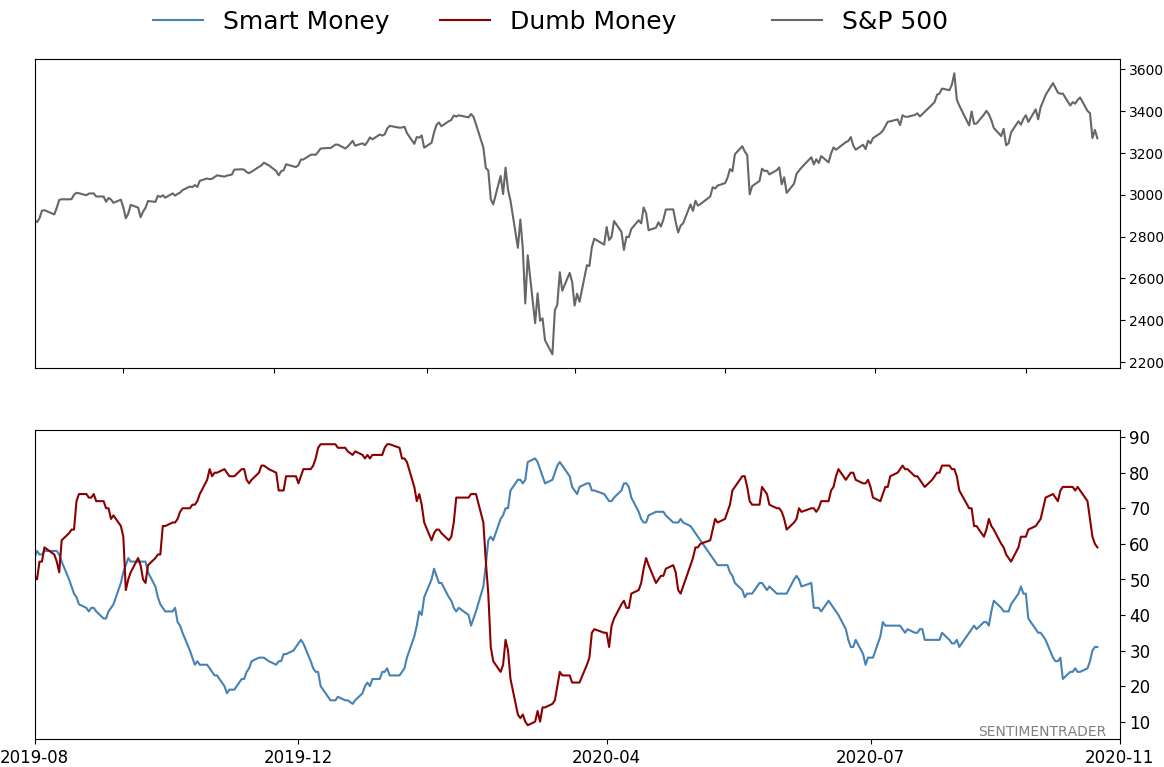
Smart / Dumb Money Confidence
|
Smart Money Confidence: 31%
Dumb Money Confidence: 59%
|
|
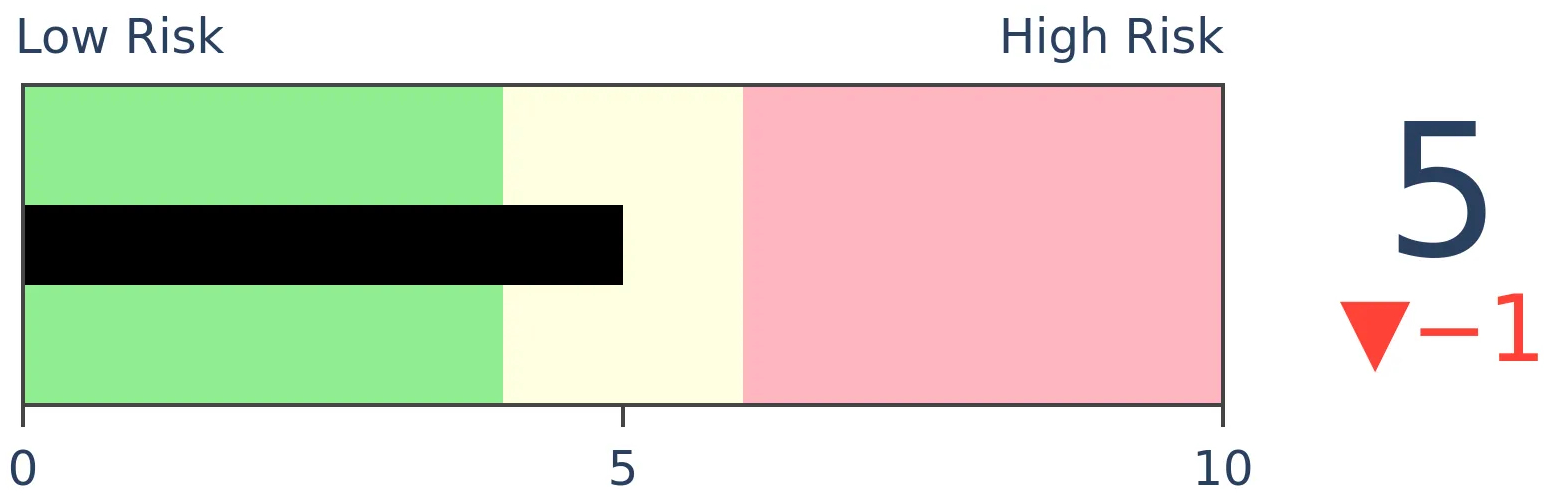
Risk Levels
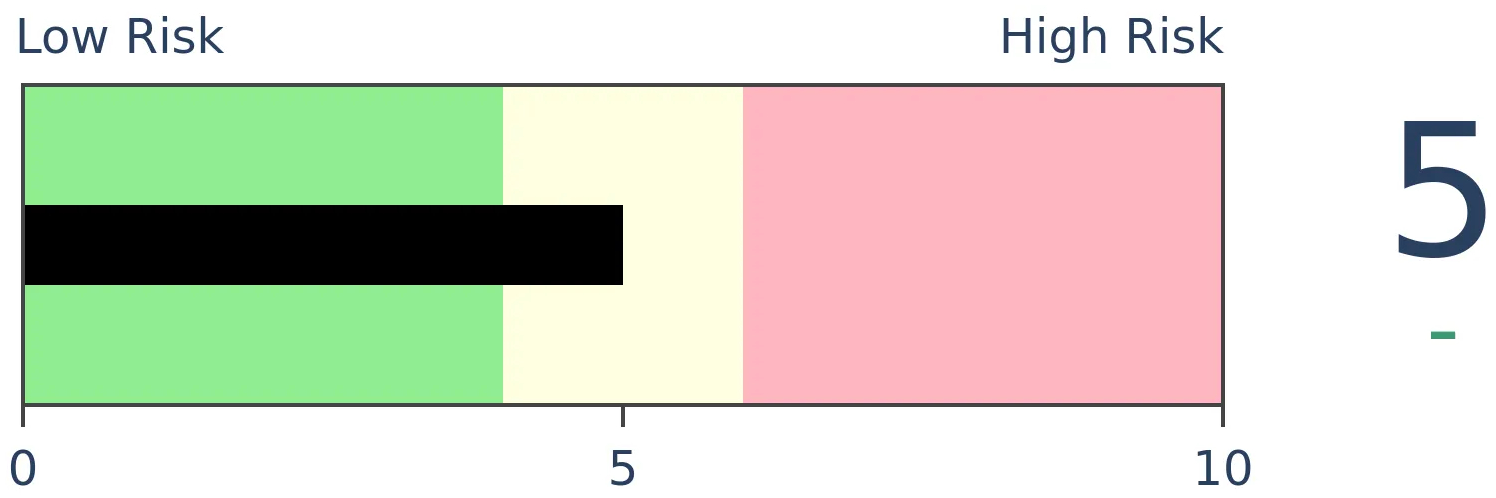
Stocks Short-Term
|
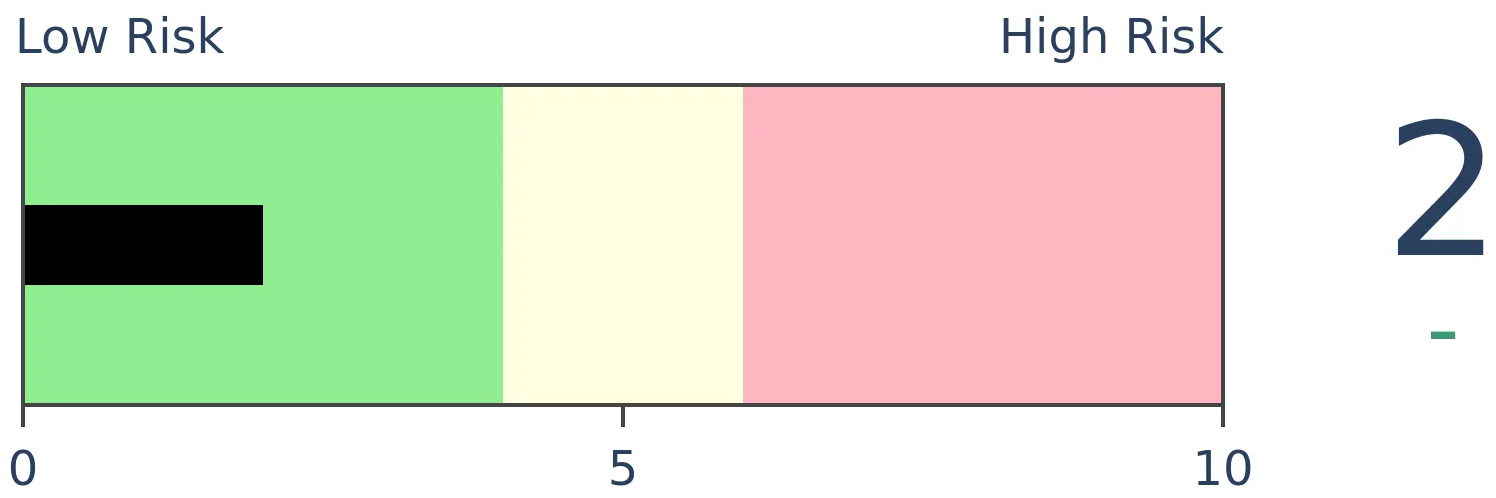
Stocks Medium-Term
|
|
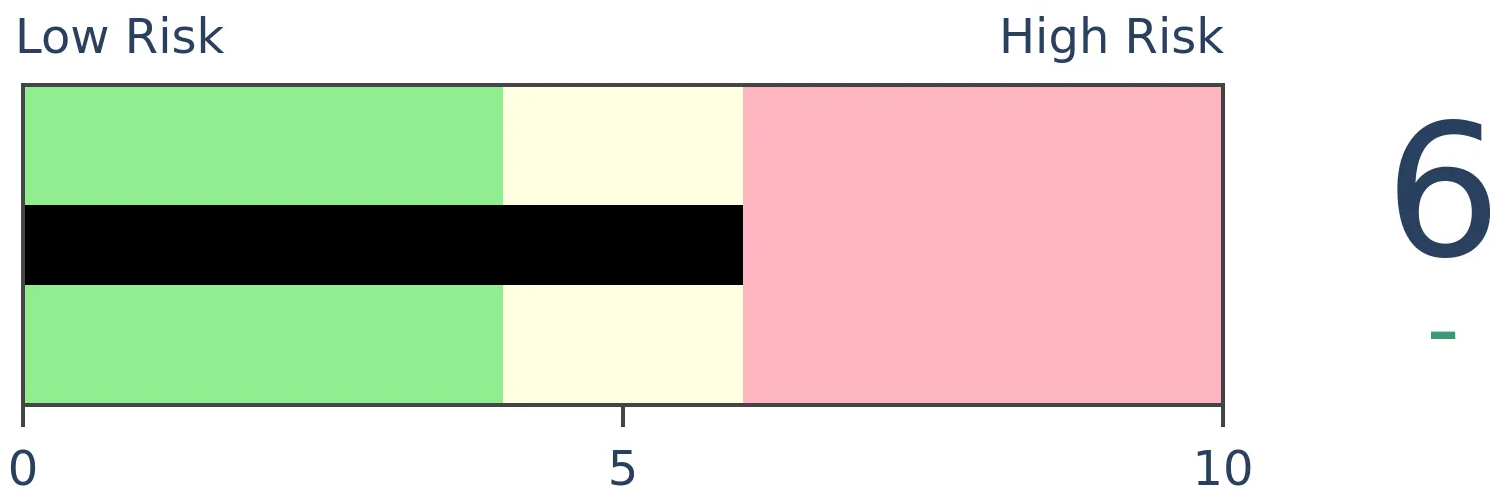
Bonds
|
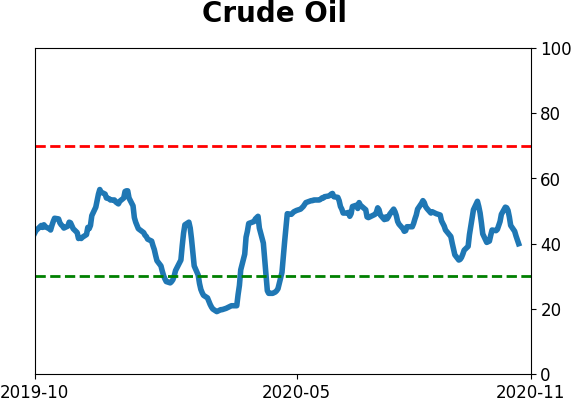
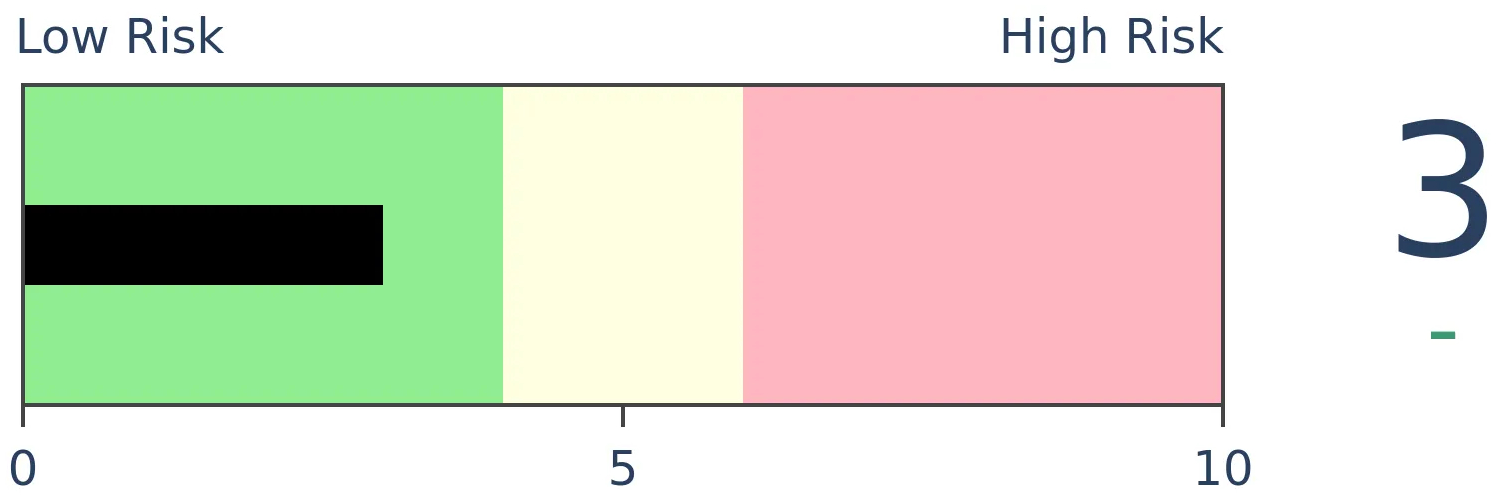
Crude Oil
|
|
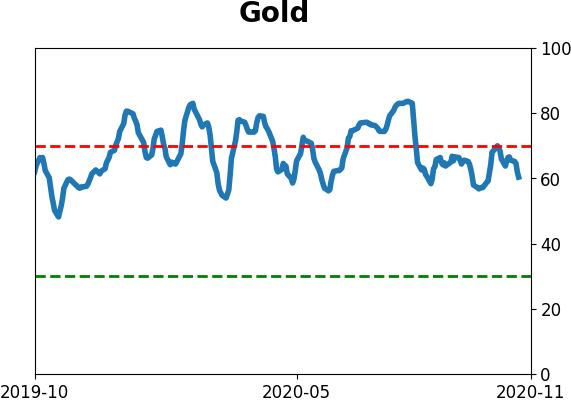
Gold
|
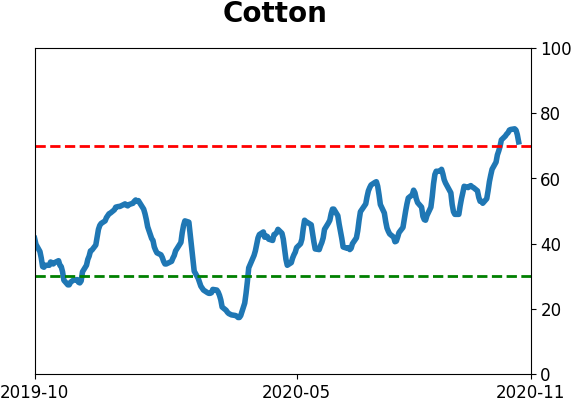
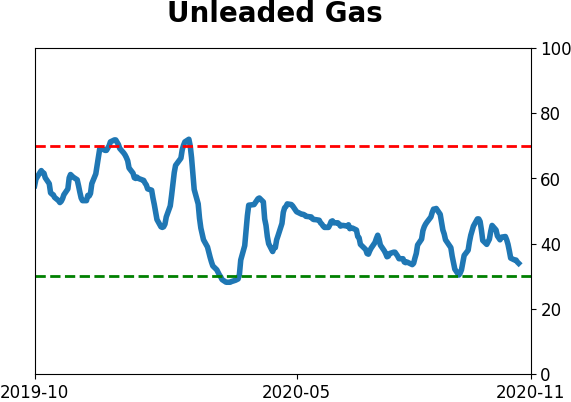
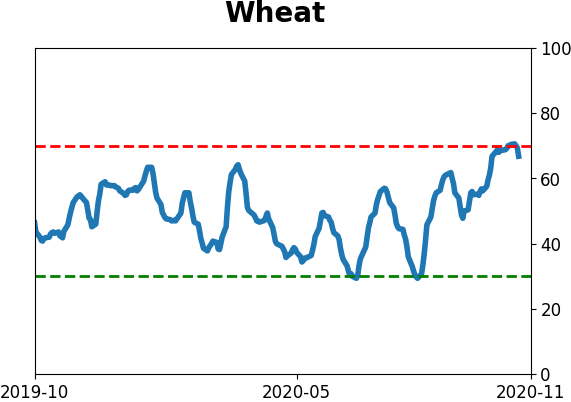
Agriculture
|
|
Research
BOTTOM LINE
In recent months (and quarters), ETF investors have pulled funds from those funds heavy on dividend-paying stocks, in favor of funds that focus on momentum. Other times we've seen this kind of flow, it was about time for dividend stocks to outperform.
FORECAST / TIMEFRAME
None
|
Despite the assumption that investors are starved for yield and will invest in anything with a pulse, that's hard to prove given how investors are allocating their money.
As the Wall Street Journal notes (emphasis added):
"The [Dividend Aristocrats Index] recently offered a dividend yield of about 2.7%—humble in nominal terms, but still greater than the S&P 500’s dividend yield of about 1.7% and more than triple the yield of the 10-year U.S. Treasury note. Even so, that hasn’t been enough to persuade investors who have yanked more than $40 billion from global dividend-focused mutual and exchange-traded funds in 2020 through Wednesday, according to data from EPFR. That surpasses the more than $3 billion that was pulled during the same approximate period in 2019. With the new coronavirus having upturned the economy, many investors have instead sought returns from highflying tech stocks amid worries that many of the long-established dividend payers aren’t guaranteed to deliver in the coming year."
According to Bloomberg data, this is certainly the case when looking at the behavior of ETF traders. Flows into momentum strategies has far outpaced that of dividend strategies. Since April, an average of $788 million per month has flowed out of dividend ETFs while an average of $263 million per month has flowed into momentum.
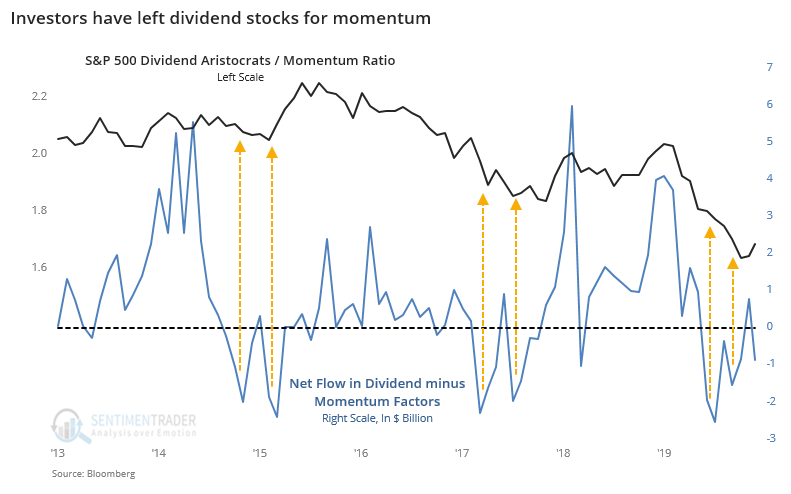
This kind of outflow rivals that of stretches in 2015 and 2017 when dividend ETFs trailed momentum. Soon after these big outflows, the tide turned more toward dividend stocks.
We can go back further on a quarterly basis and see the same pattern over the past 15 years.
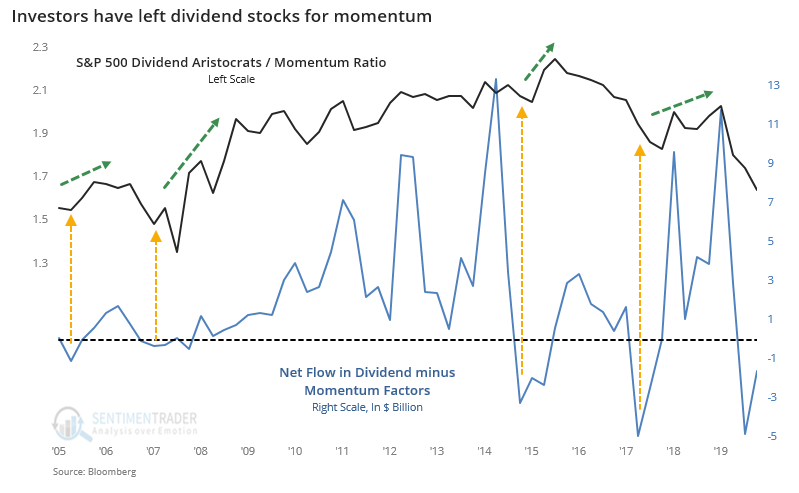
Once again, recent quarters rival the most extreme on record. Other times when there was a flow away from dividend stocks and toward momentum, it was after those dividend stocks showed relative underperformance. And in the quarters ahead, they reasserted themselves relative to momentum.
BOTTOM LINE
On Monday and Wednesday, selling pressure was heavy enough to push the 3-day average of both NYSE Up Issues and Up Volume below 20%, which recovered a bit by Thursday. During relatively healthy markets, this has typically led to shorter-term weakness, but medium-term strength.
FORECAST / TIMEFRAME
None
|
On Monday and Wednesday, selling pressure was overwhelming enough that most securities fell, and most of the volume on the NYSE was focused on those issues.
The 3-day average of NYSE Up Issues and Up Volume both dropped to below 20%. That shows wholesale, get-me-out selling pressure. Often, we'll see a lot of down issues, but maybe not a lot of volume. Or maybe there will be a lot of volume flowing into relatively few declining stocks.
Earlier this week, it was both. The 3-day average of NYSE Up Issues dropped to within the lowest 0.2% of all readings since 1962.

Up Volume fell to within the lowest 0.4% of all readings.
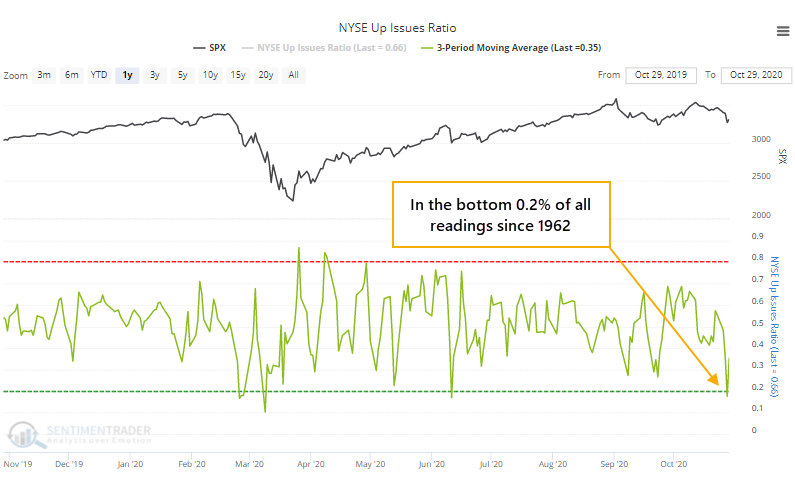
Thursday's rebound was enough to push those average back above 20%, showing a potential recovery, though longer-term measures haven't reached oversold yet and Friday's activity will change this somewhat.
It's not all that unusual to see extremely depressed breadth over a multi-day period during a bear market. It's rarer to see it when stocks have been holding up fairly well. Below, we can see every time the 3-day average of both Up Issues and Up Volume rose above 20% while the S&P 500 was above its 200-day moving average at the time.
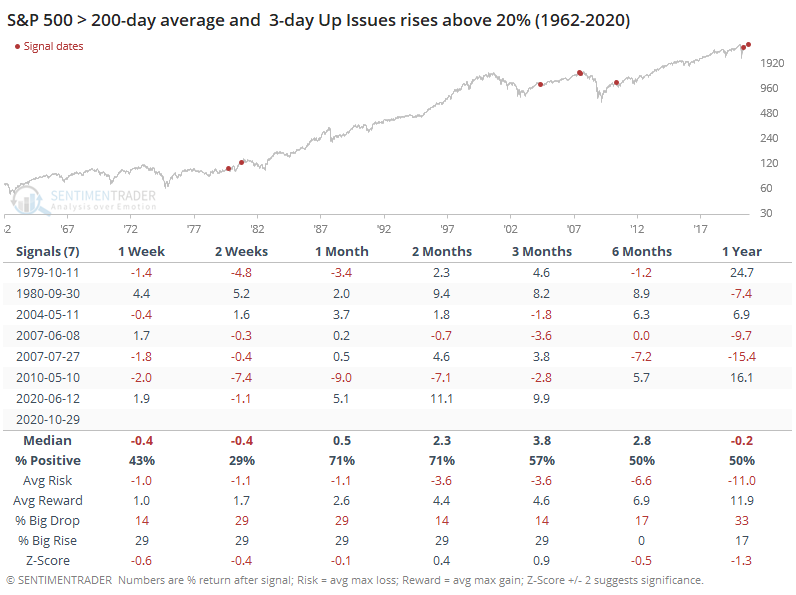
The sample size is small, but for what it's worth, the S&P tended to fall back over the short-term, then rally over the medium-term. There was only one loss of any consequence 2 months later.
If we forget about the 200-day average and just look at times when the S&P at least wasn't more than 20% below its highest level of the past 3 years, then we get more of a sample size.
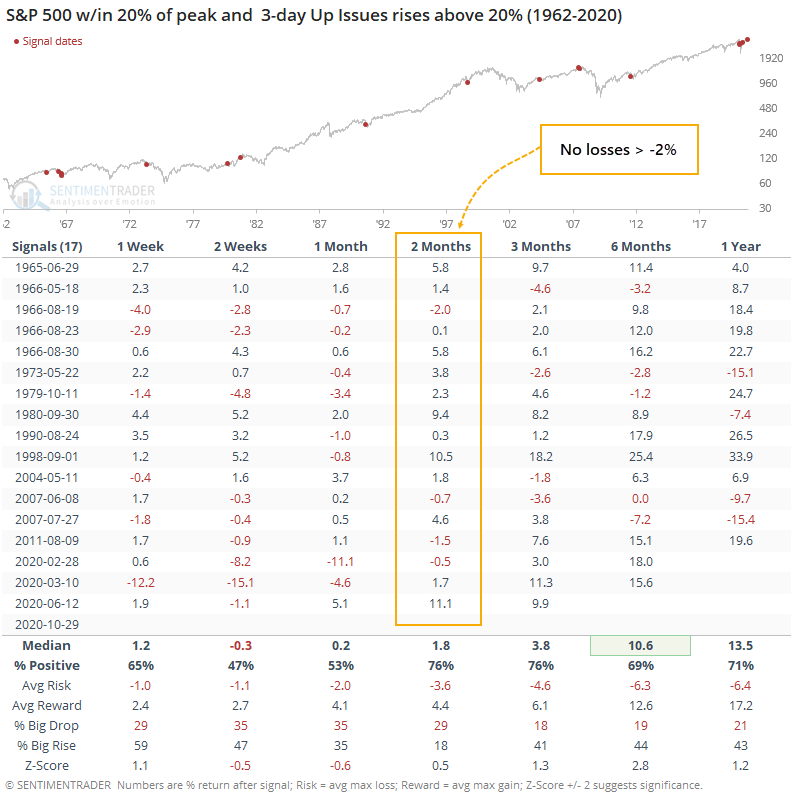
Despite many more signals, the same basic pattern held, with shorter-term weakness and medium-term strength. Over the next 2 months, there were no losses greater than -2%.
It was much more unusual if the S&P was within 10% of its prior peak, as it was this time.
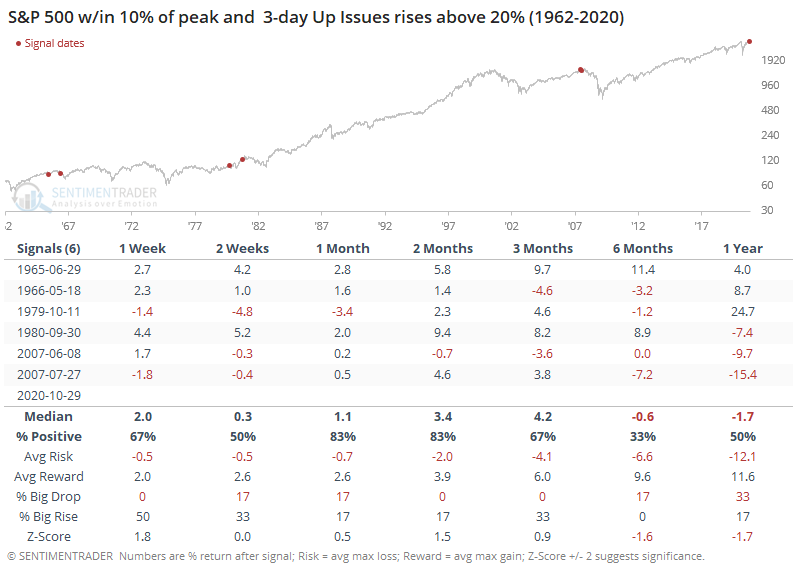
There was only a single loss during the next 1-2 months, with relatively small risk. The troubling part was the 6-12 month time frame, which showed a loss every time but once.
Overall, this kind of behavior has typically led to some shorter-term give-back of whatever gains helped to push the Up Issue and Up Volume Ratios above 20%. But over the next 1-3 months, there was a strong tendency to see gains following the selling pressure that was extreme enough to push them both below 20% in the first place.
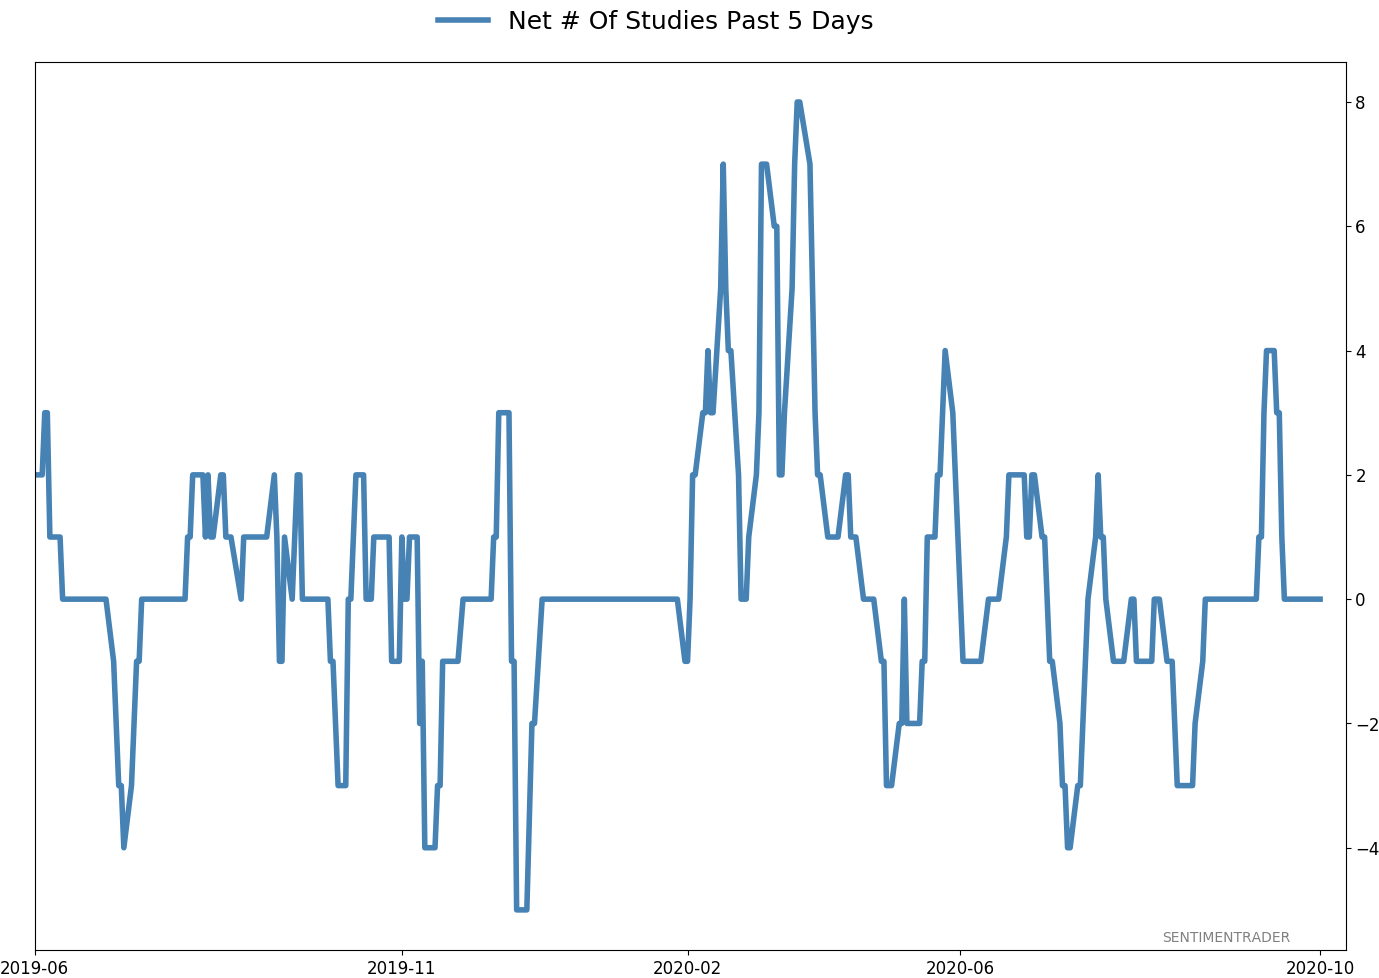
Active Studies
| Time Frame | Bullish | Bearish | | Short-Term | 0 | 0 | | Medium-Term | 4 | 8 | | Long-Term | 48 | 2 |
|
Indicators at Extremes
Portfolio
| Position | Description | Weight % | Added / Reduced | Date | | Stocks | 15.6% RSP, 10.1% VWO, 7.5% XLE, 5.1% PSCE | 38.2 | Added 5% | 2020-10-15 | | Bonds | 10% BND, 10% SCHP, 10% ANGL | 29.7 | Reduced 0.1% | 2020-10-02 | | Commodities | GCC | 2.4 | Reduced 2.1%
| 2020-09-04 | | Precious Metals | GDX | 4.7 | Added 5% | 2020-09-09 | | Special Situations | | 0.0 | Reduced 5% | 2020-10-02 | | Cash | | 25.0 | | |
|
Updates (Changes made today are underlined)
After the September swoon wrung some of the worst of the speculation out of stocks, there are some signs that it's returning, especially in the options market. It's helped to push Dumb Money Confidence above 70%. A big difference between now and August is that in August, there was a multitude of days with exceptionally odd breadth readings. Some of the biggest stocks were masking underlying weakness. Combined with heavy speculative activity, it was a dangerous setup. Now, we've seen very strong internal strength, in the broad market, as well as tech and small-cap stocks. Prior signals almost invariably led to higher prices. That's hard to square with the idea that forward returns tend to be subdued when Confidence is high, but that's less reliable during healthy market conditions, which we're seeing now (for the most part). I added some risk with small-cap energy stocks, due to an increasing number of positive signs in both small-caps and energy. This is intended as a long-term position.
RETURN YTD: -2.6% 2019: 12.6%, 2018: 0.6%, 2017: 3.8%, 2016: 17.1%, 2015: 9.2%, 2014: 14.5%, 2013: 2.2%, 2012: 10.8%, 2011: 16.5%, 2010: 15.3%, 2009: 23.9%, 2008: 16.2%, 2007: 7.8%
|
|
Phase Table
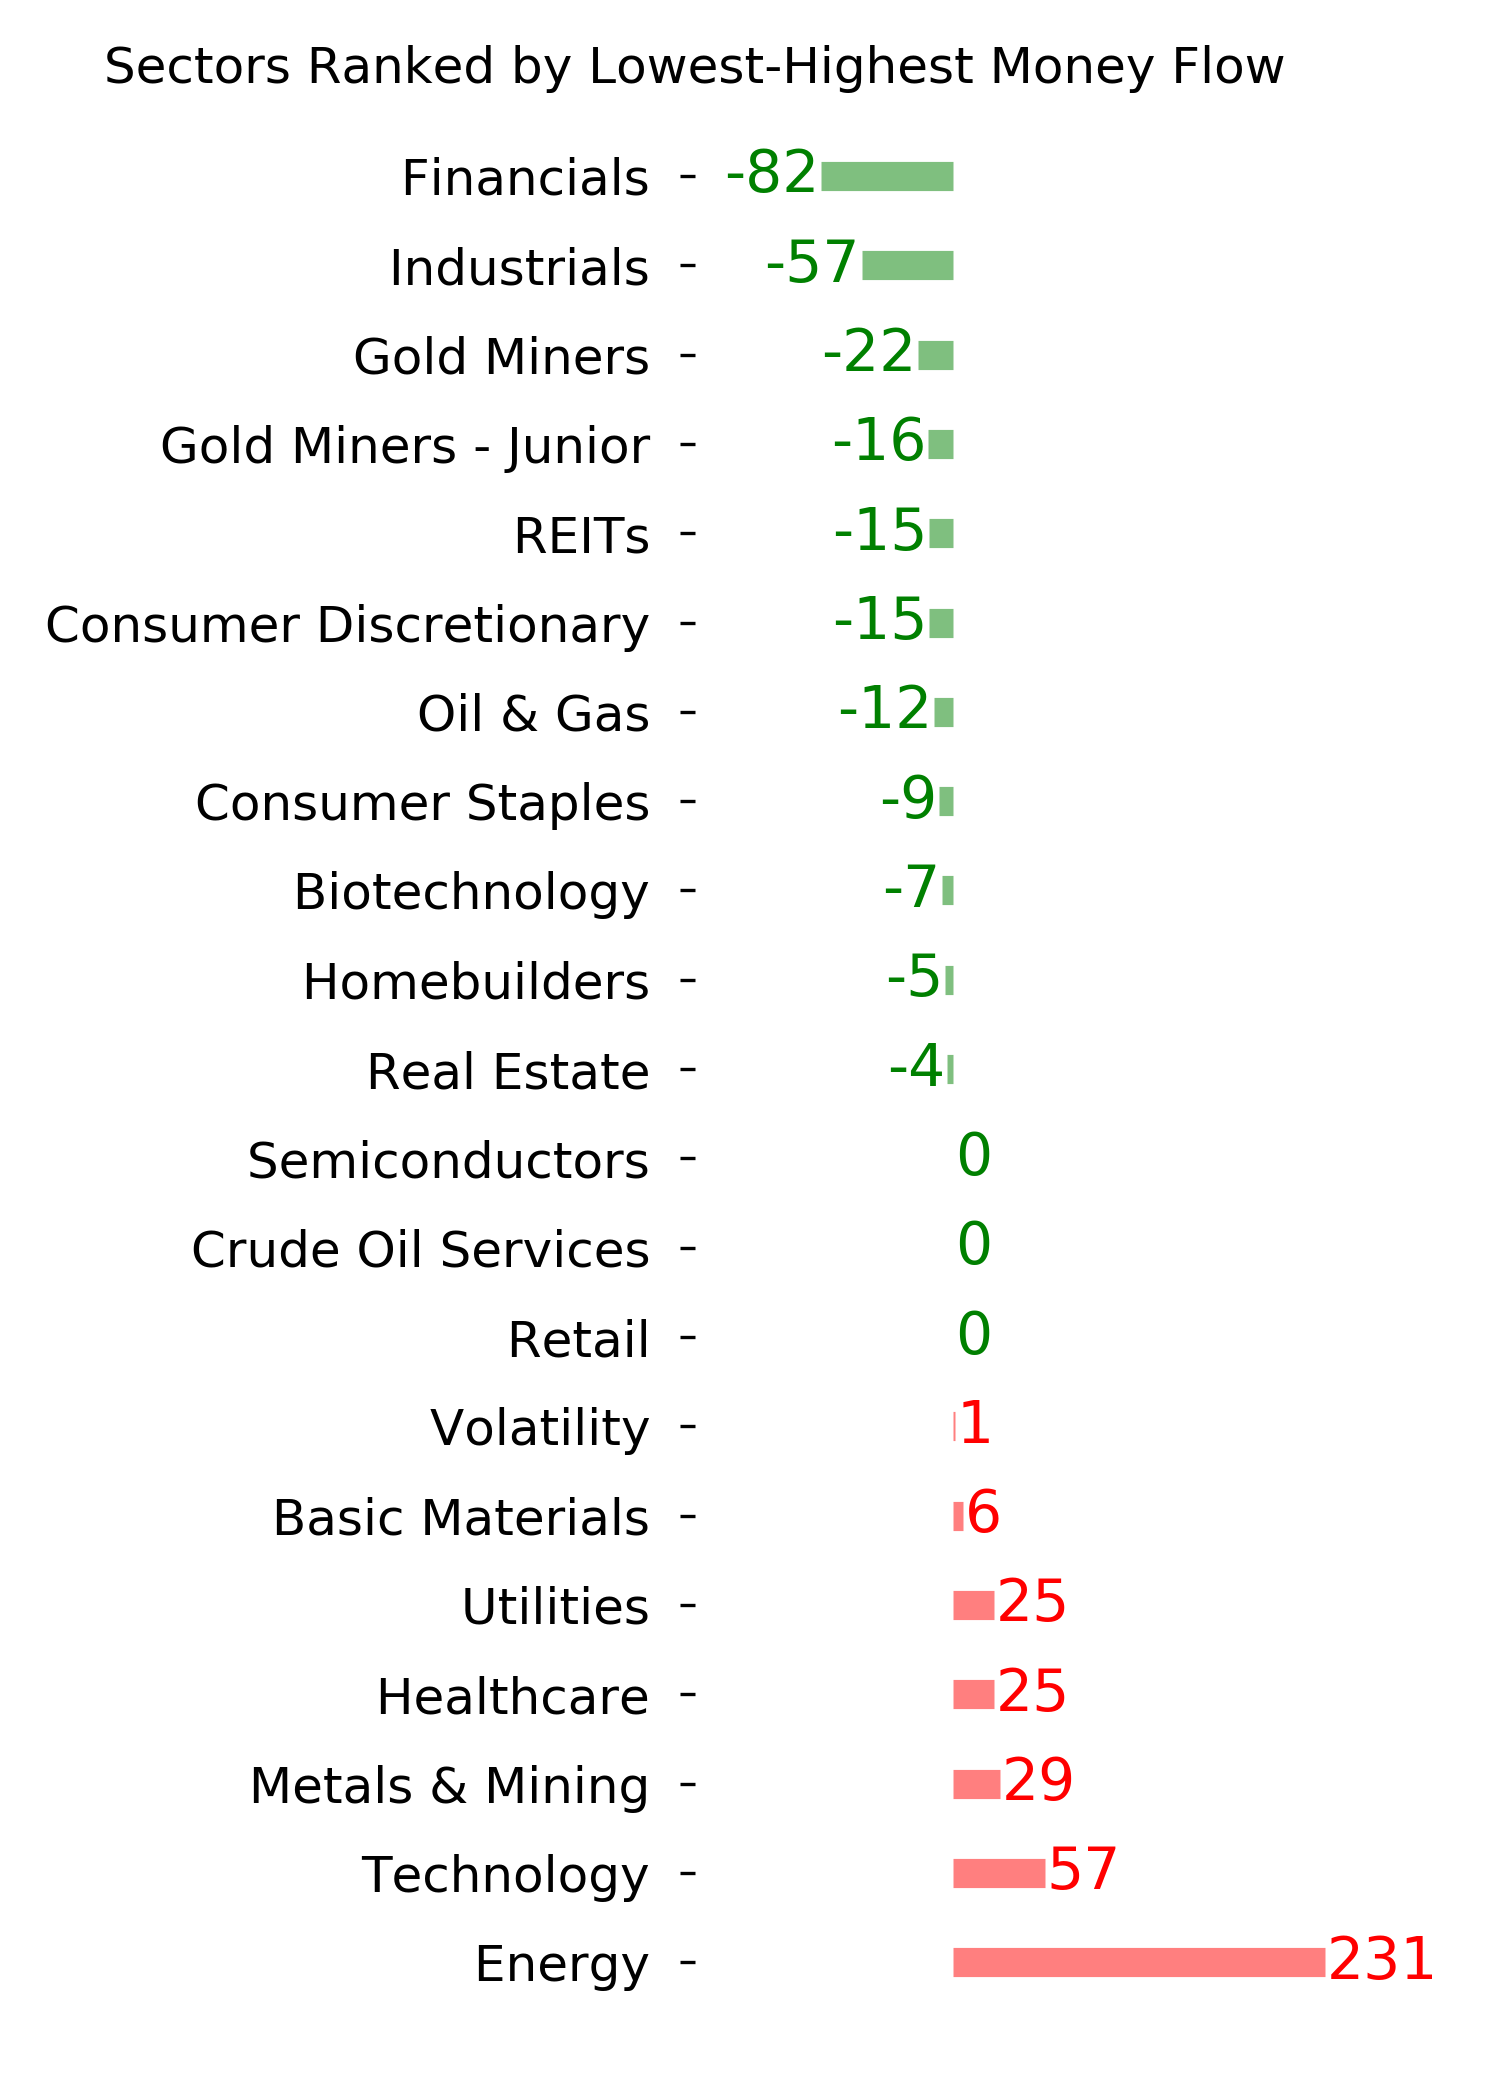
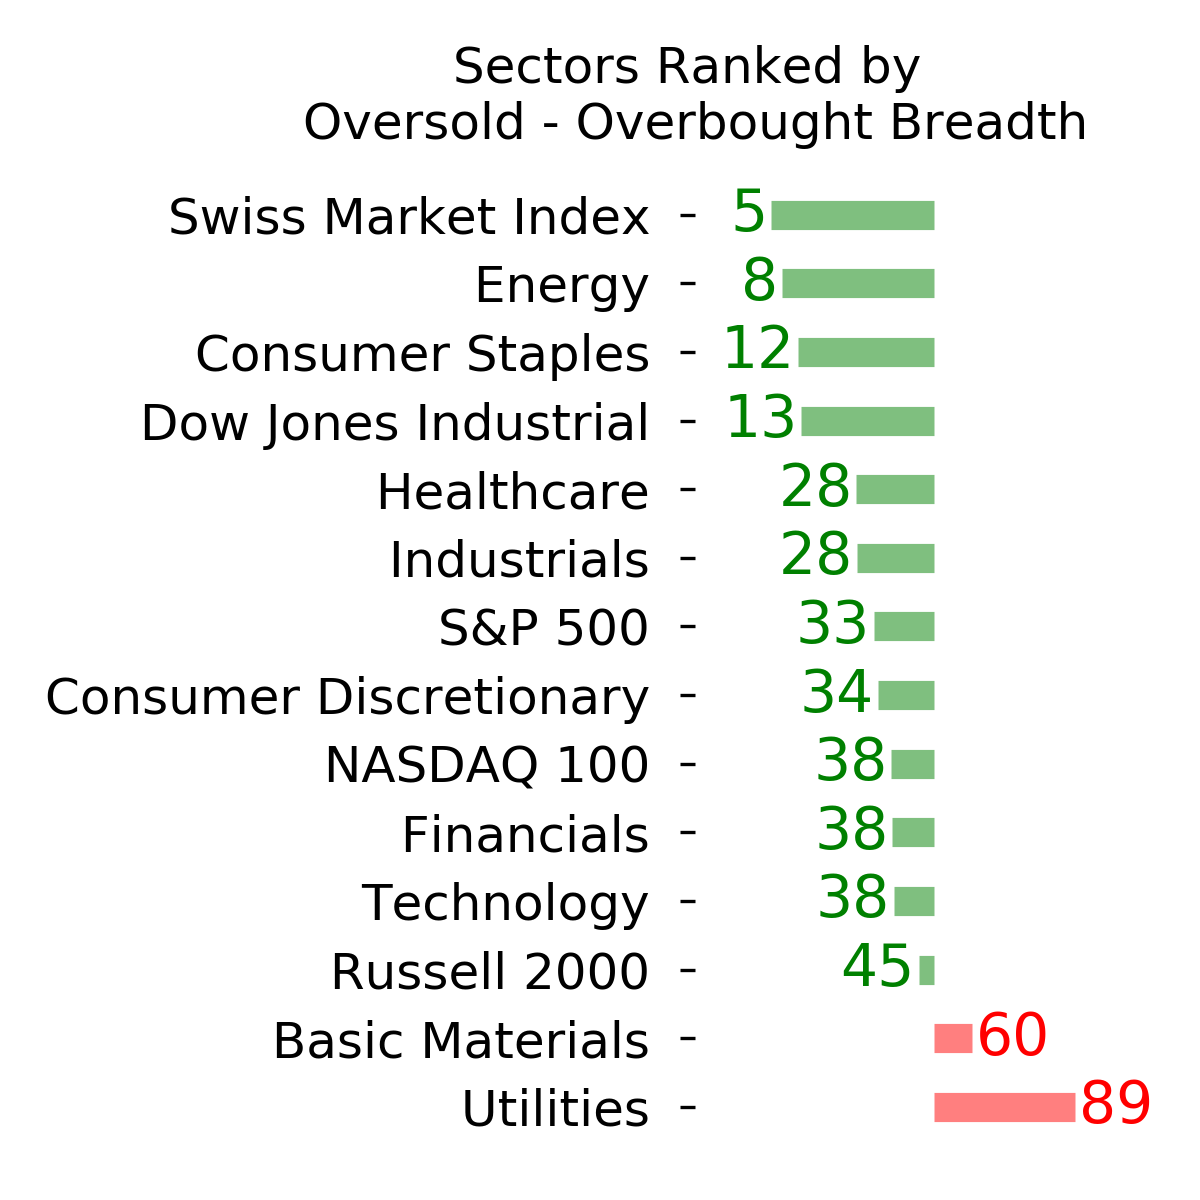
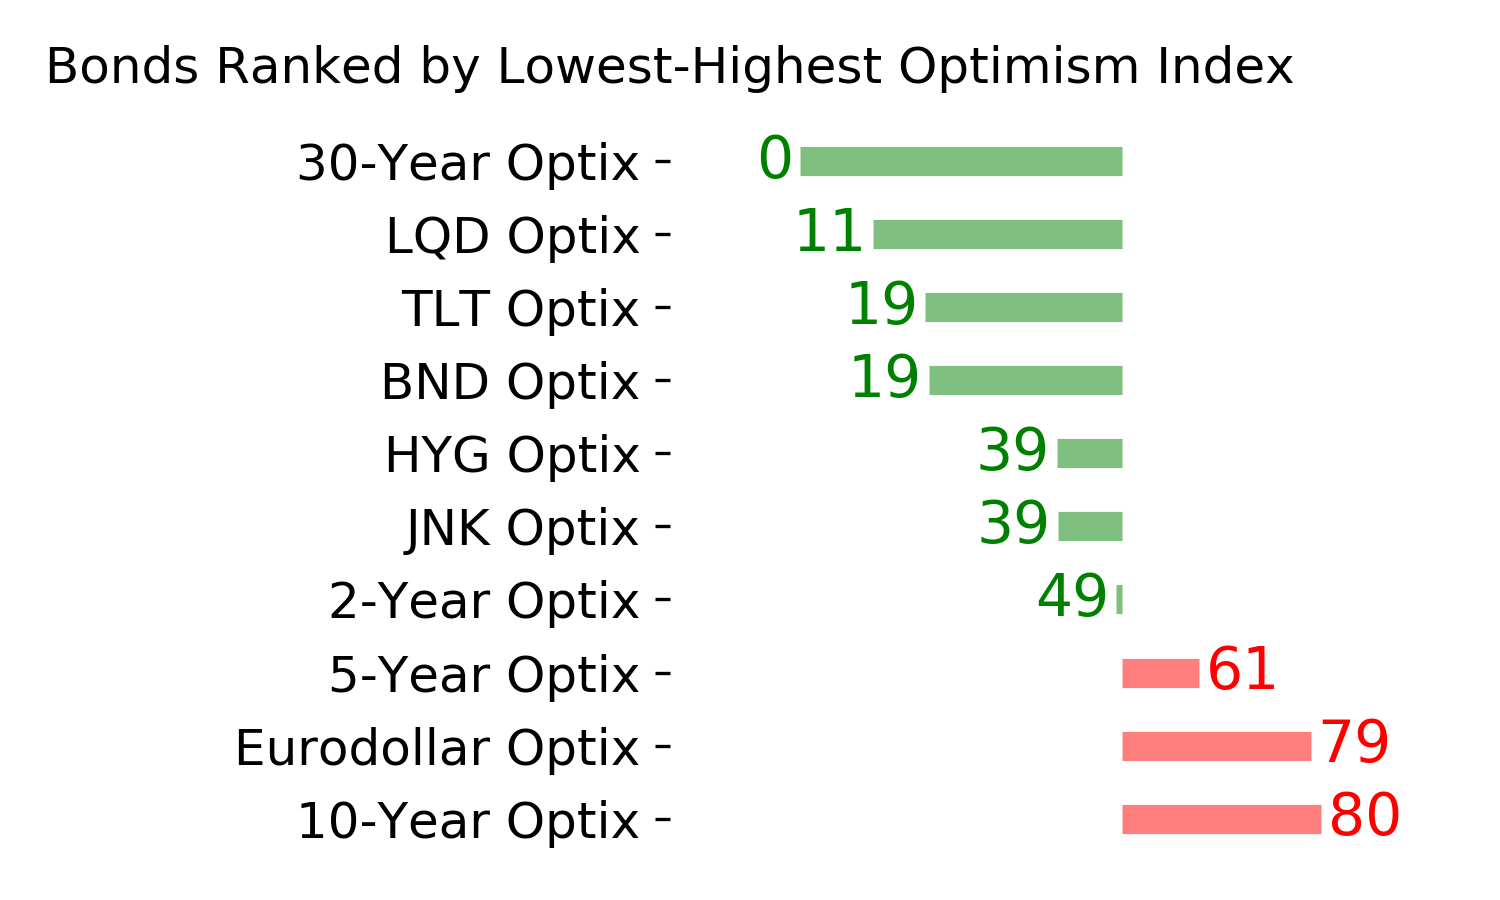
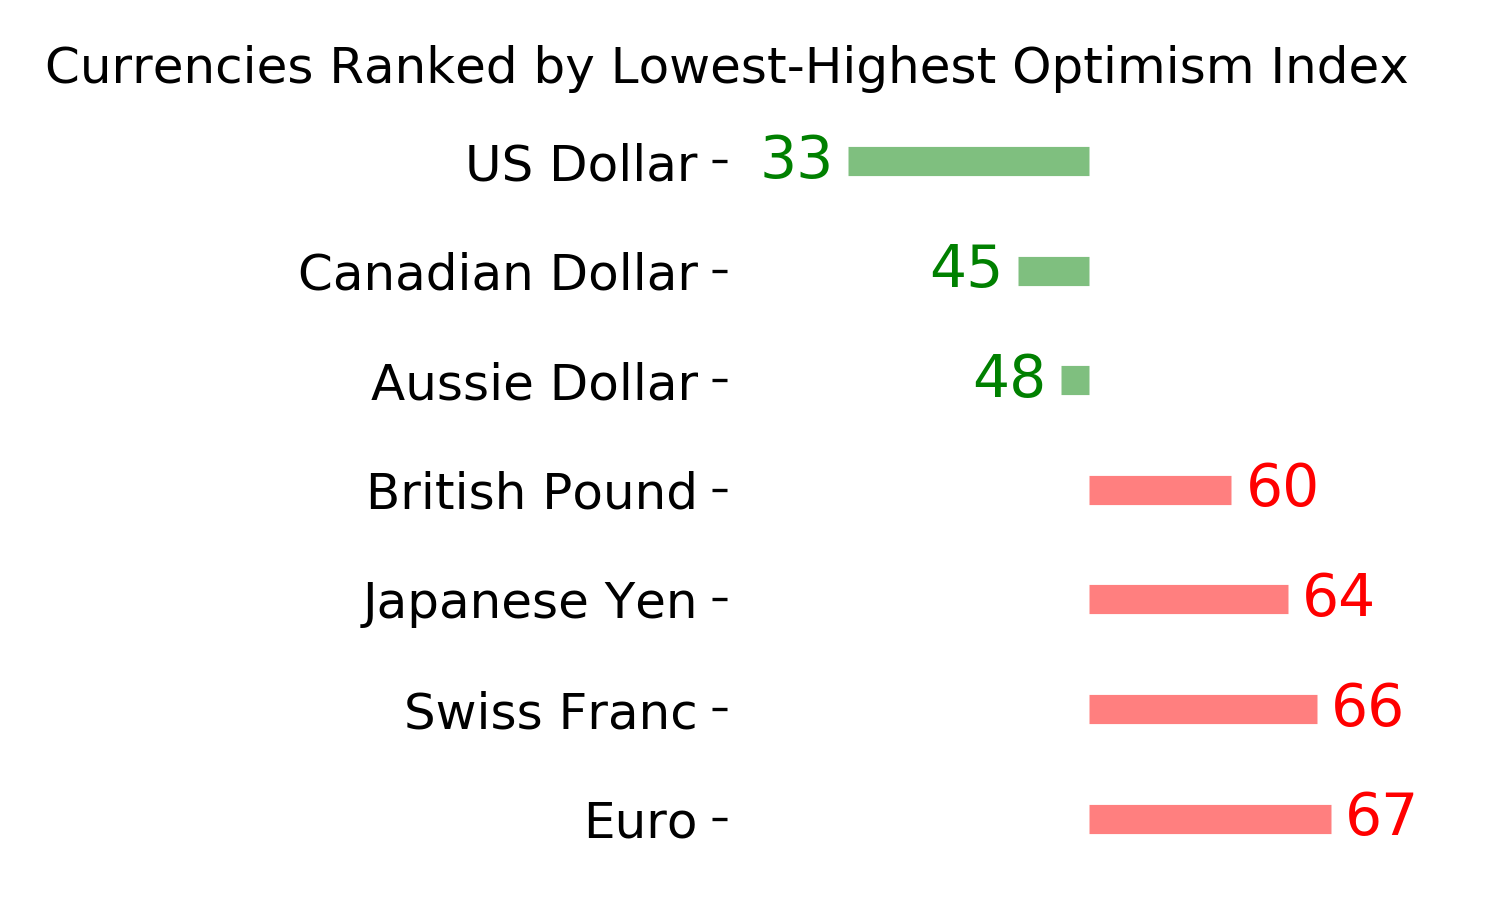
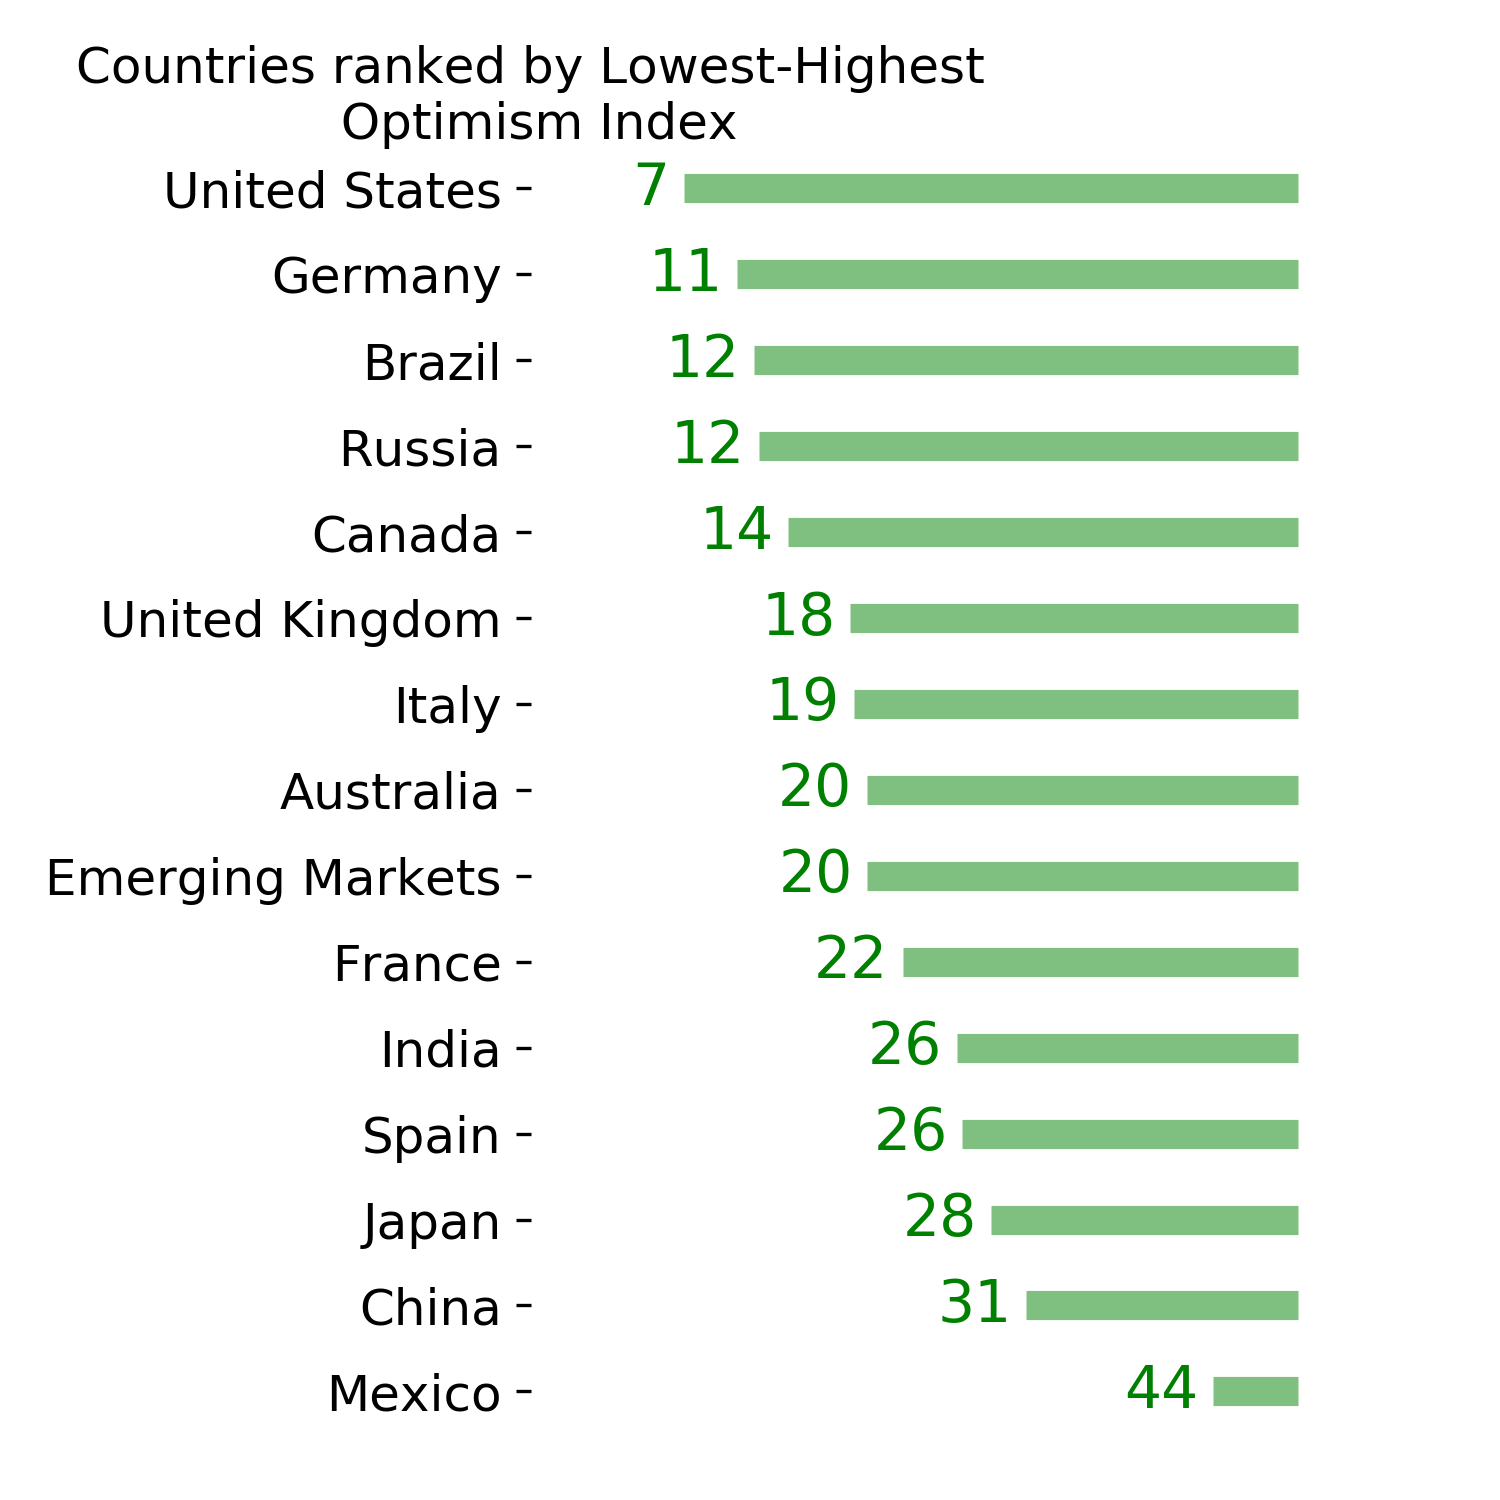
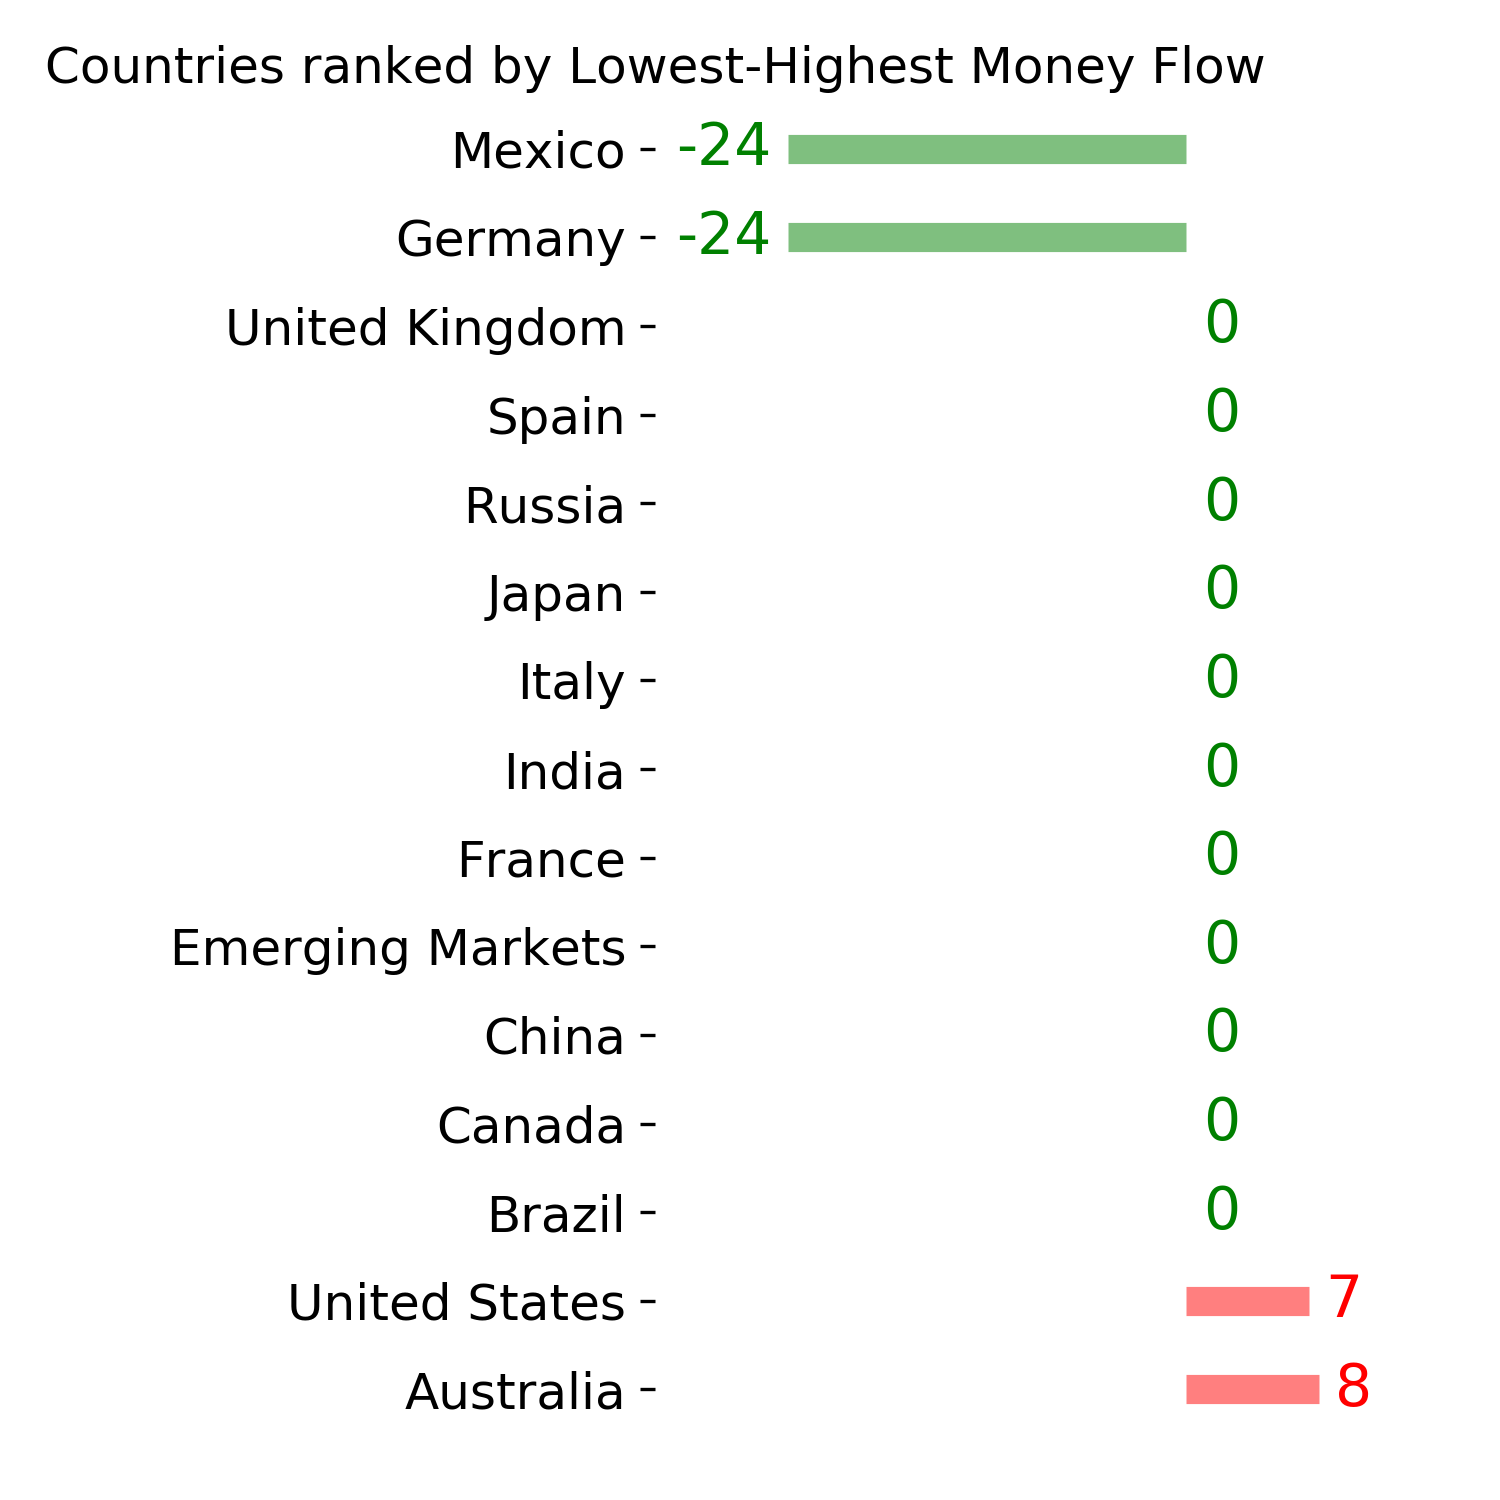
Ranks
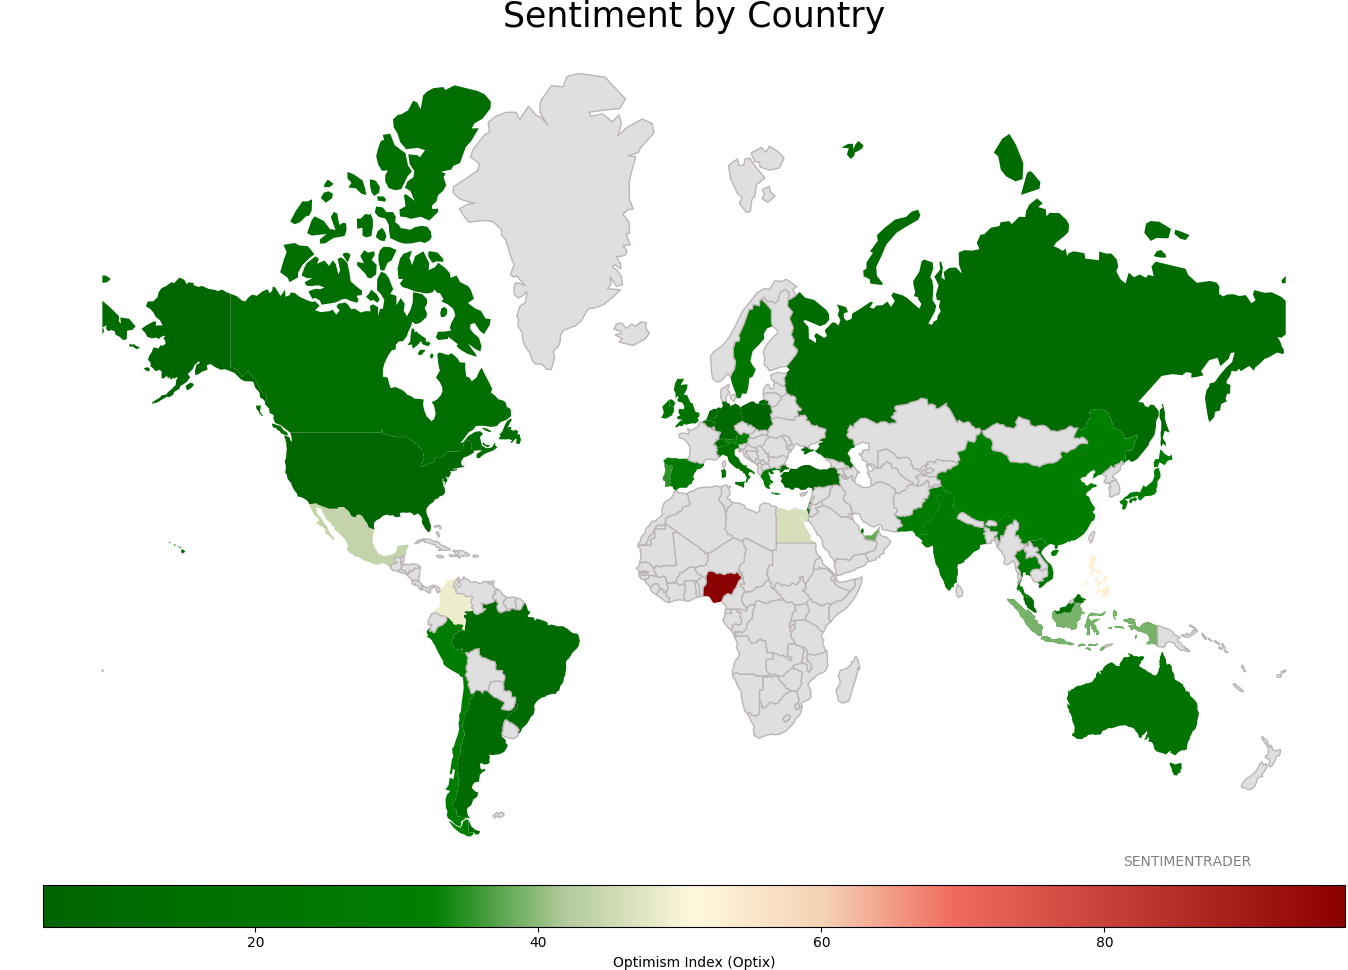
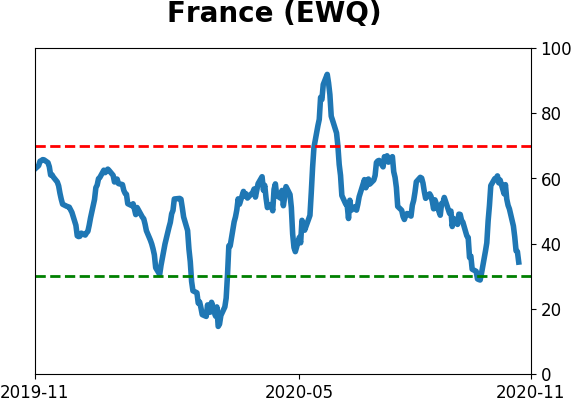
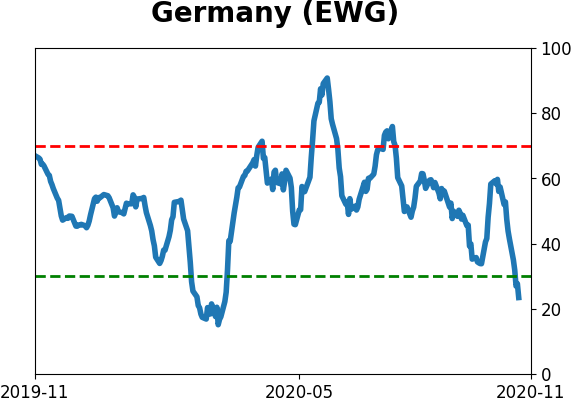
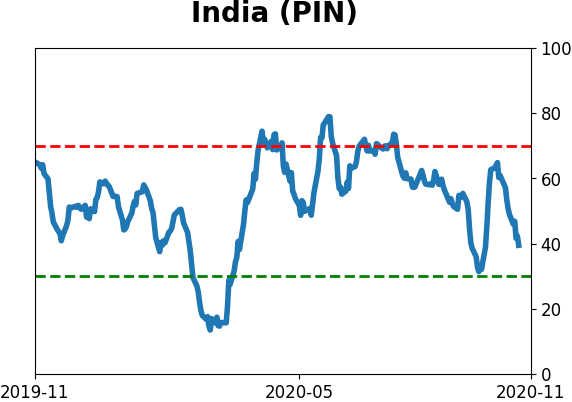
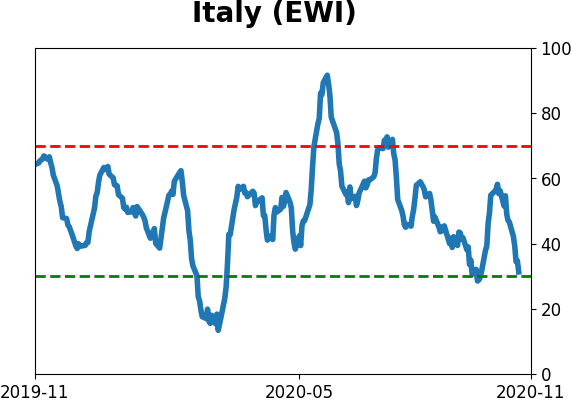
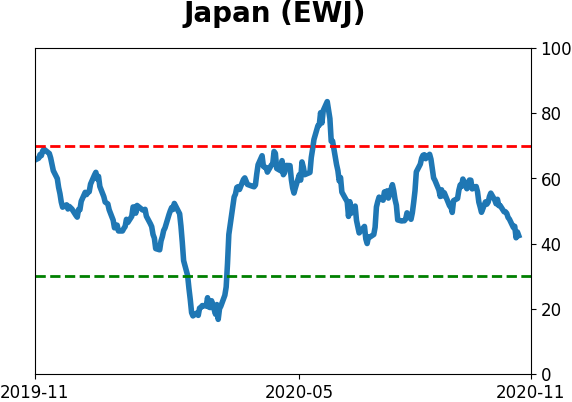
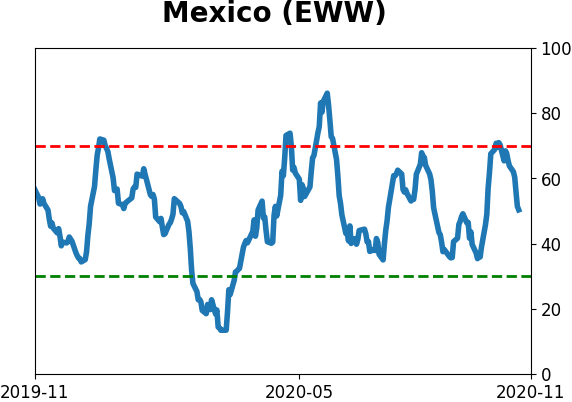
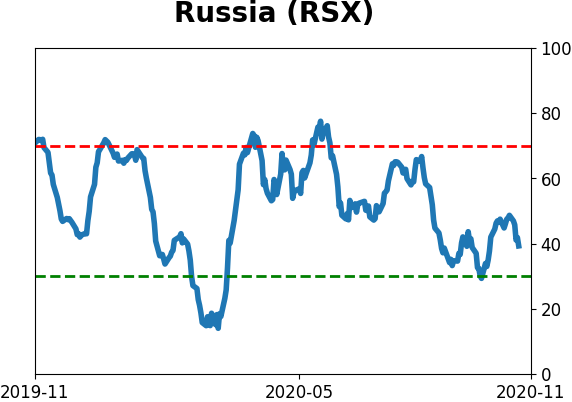
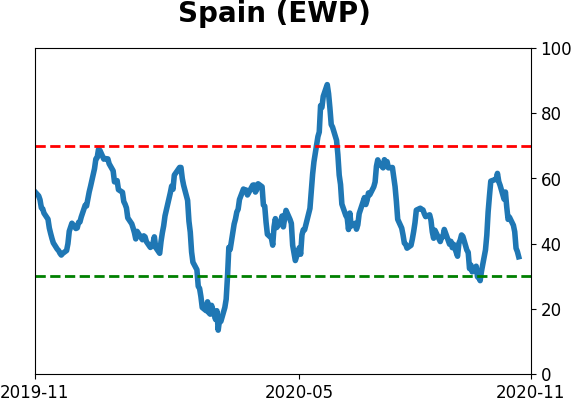
Sentiment Around The World
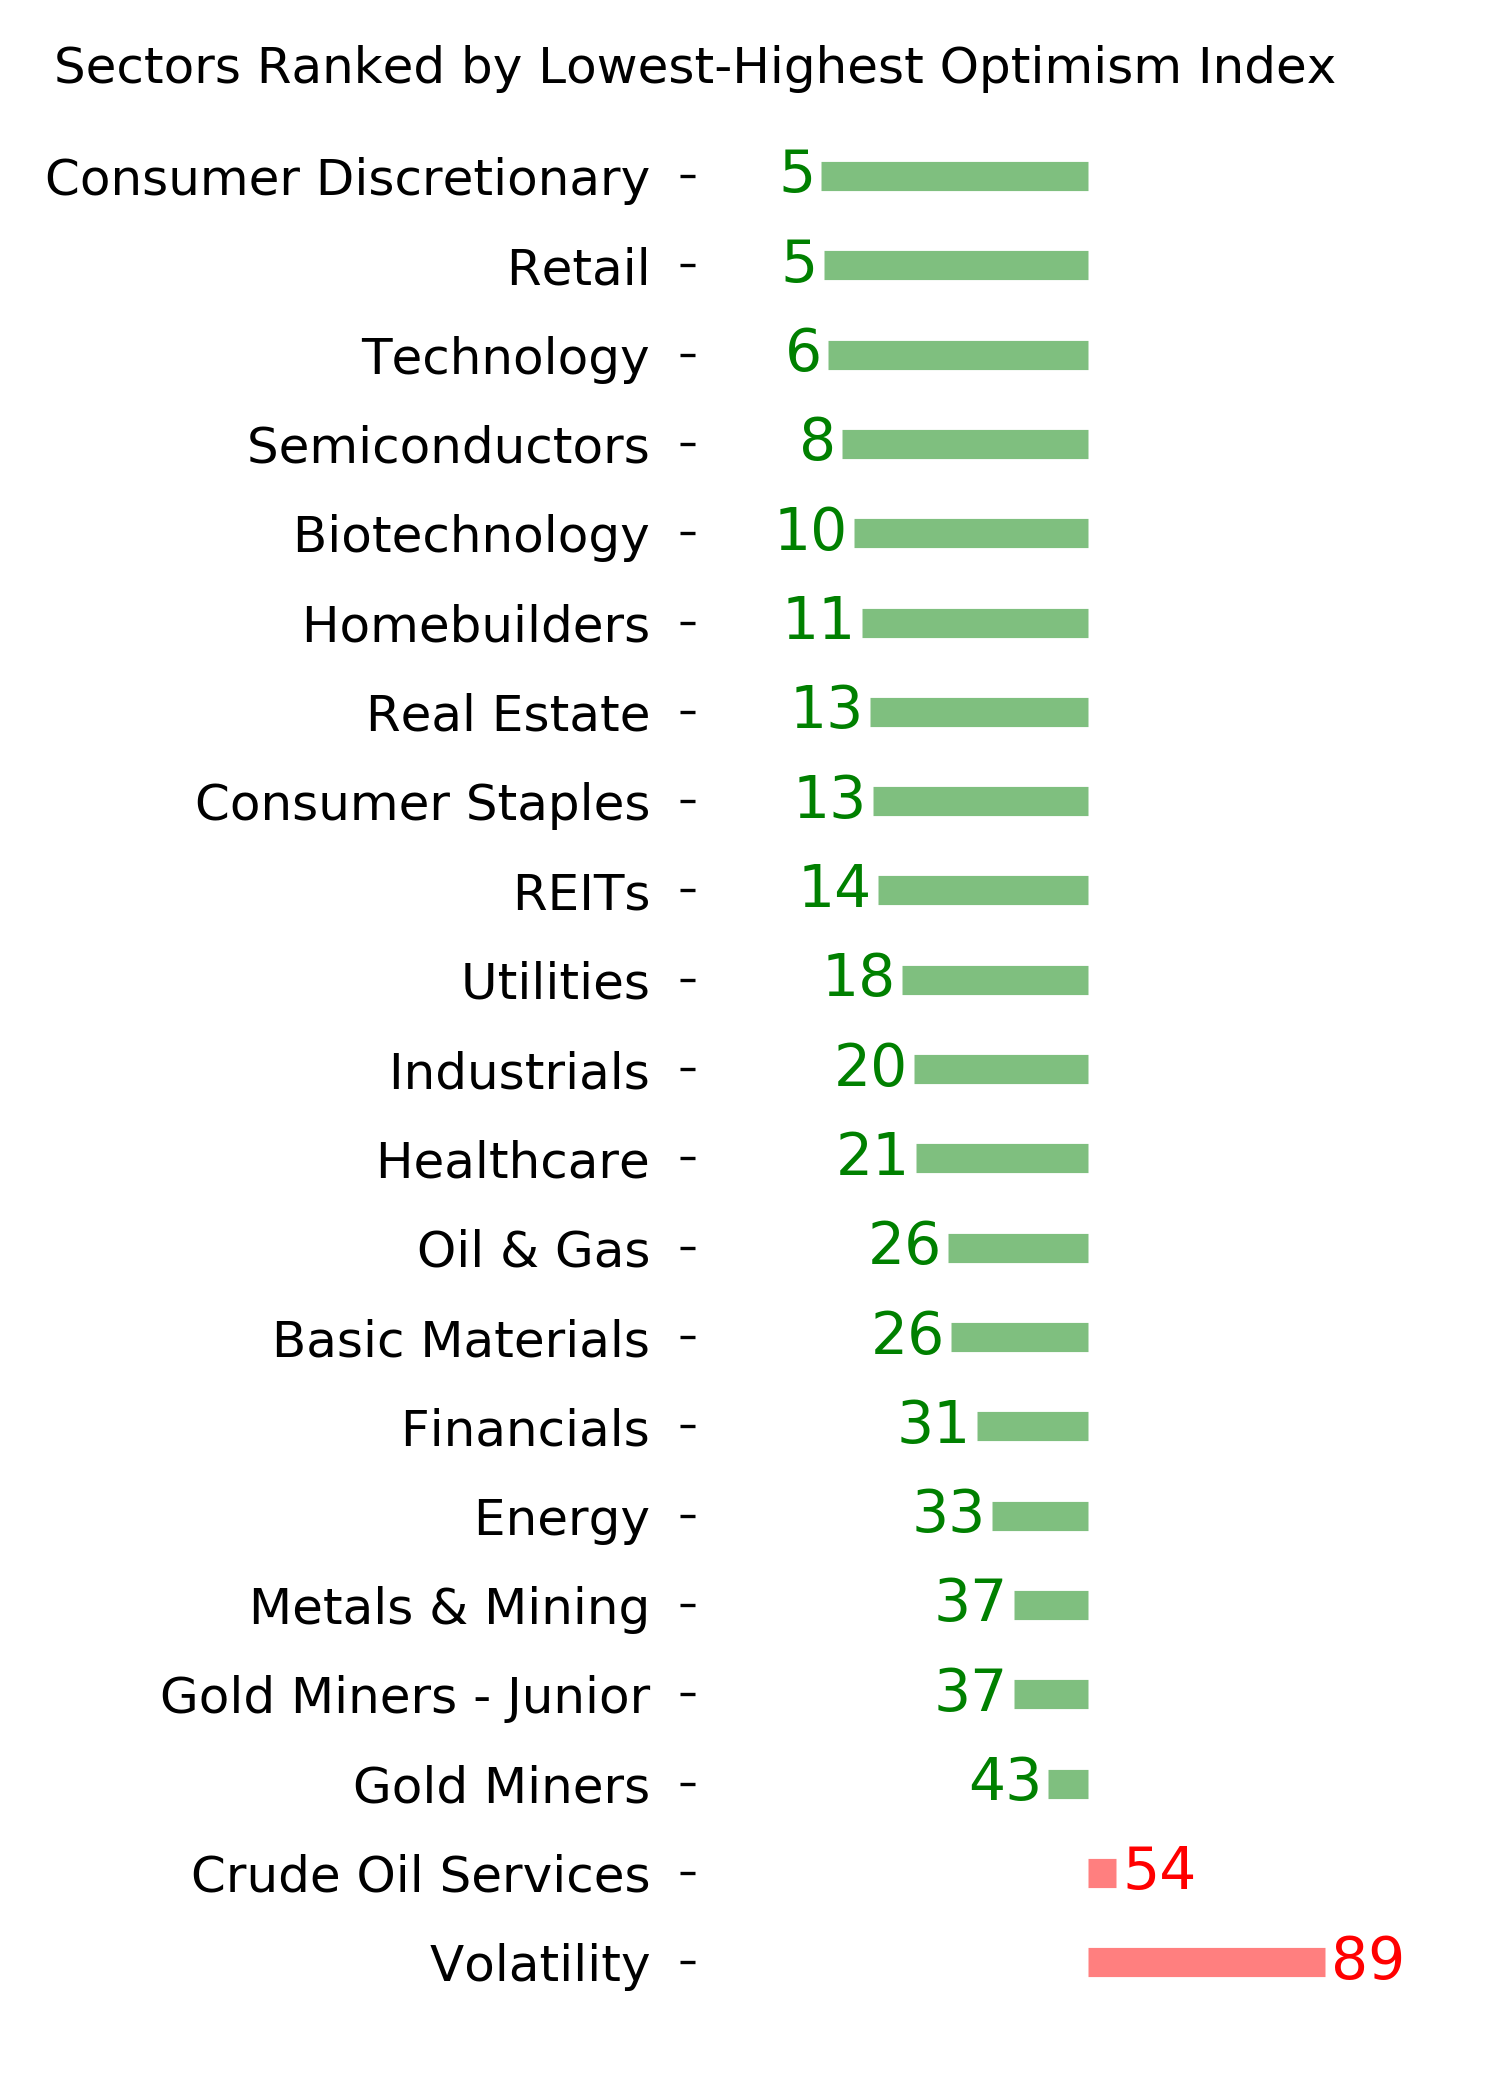
Optimism Index Thumbnails
|
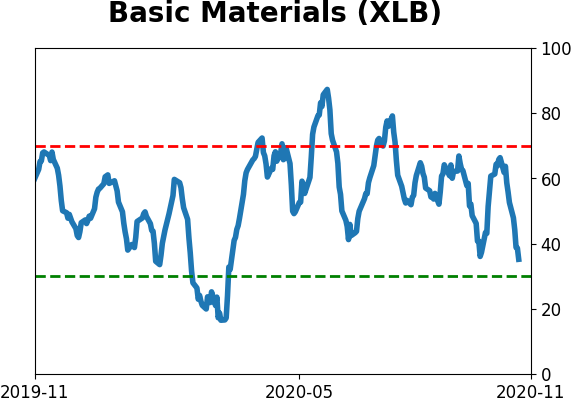
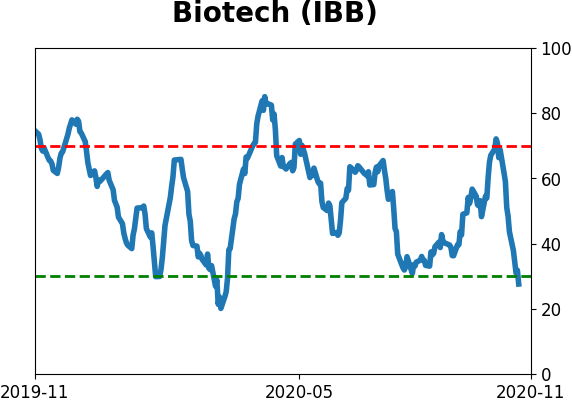
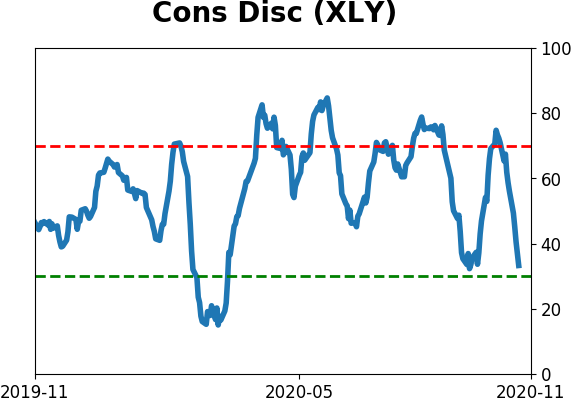
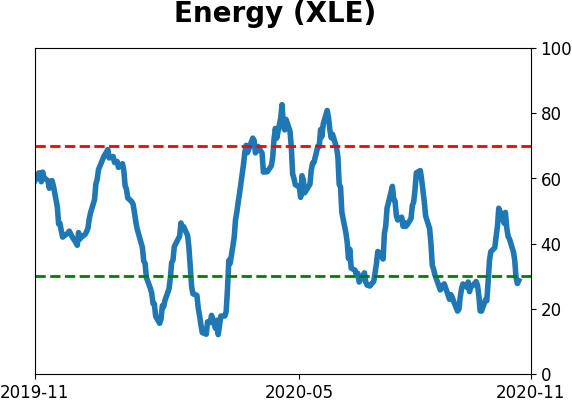
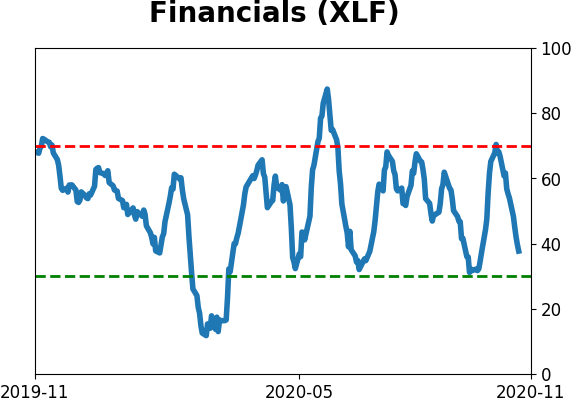
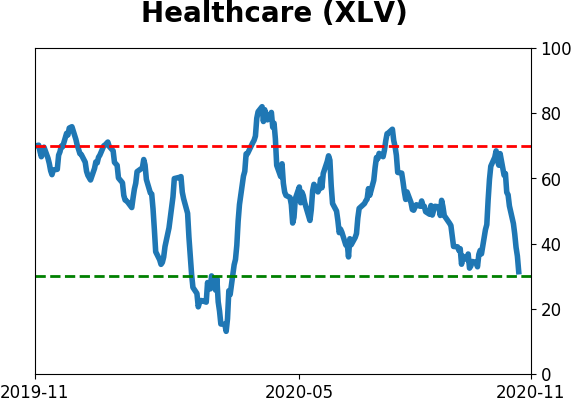
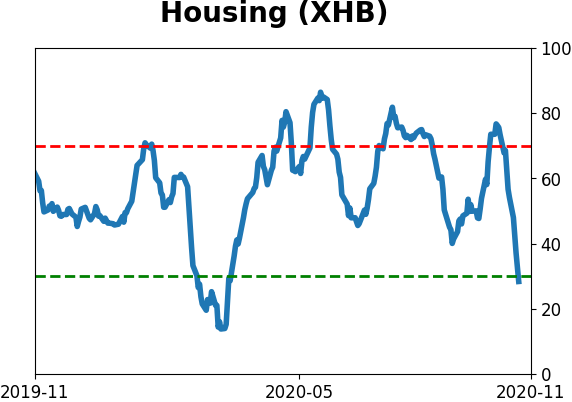
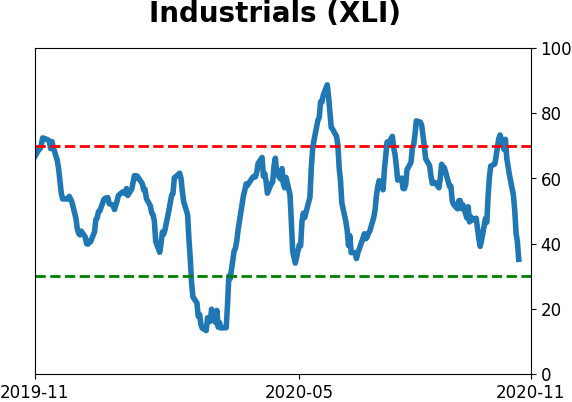
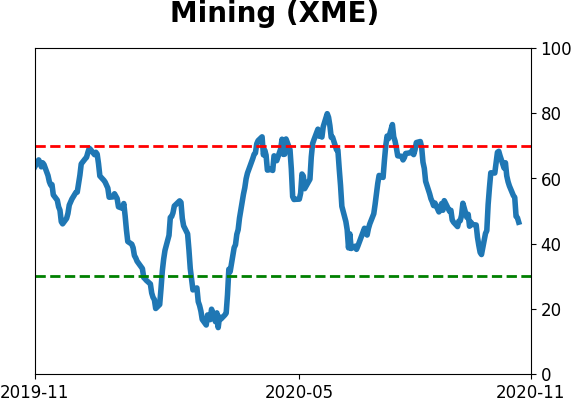
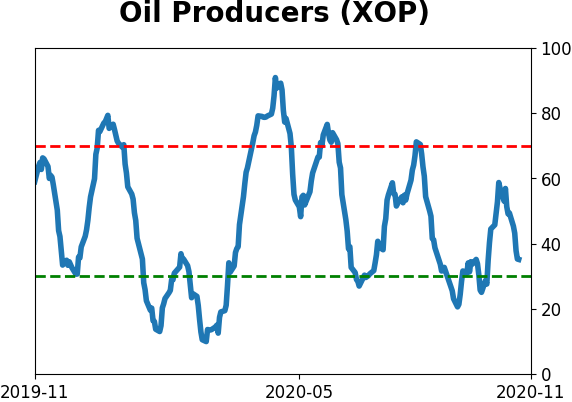
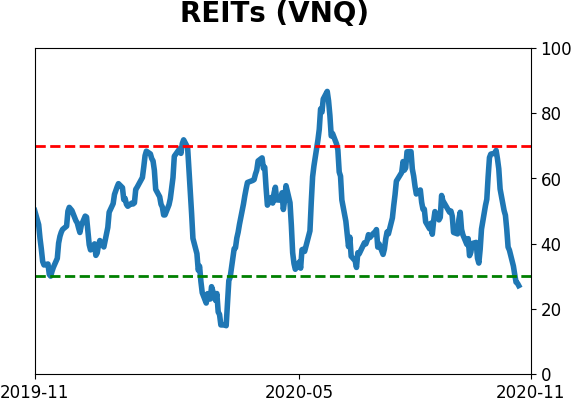
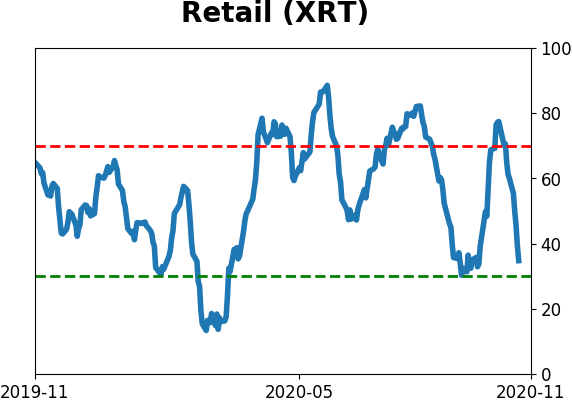
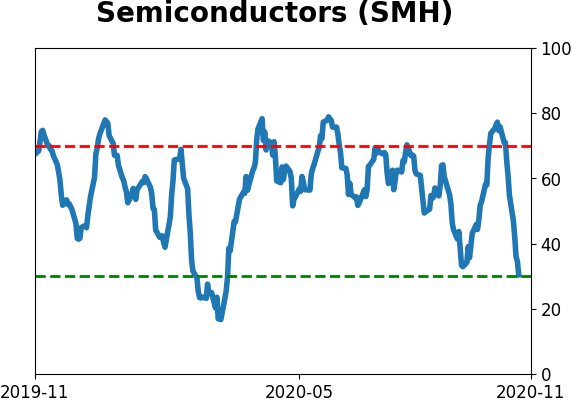
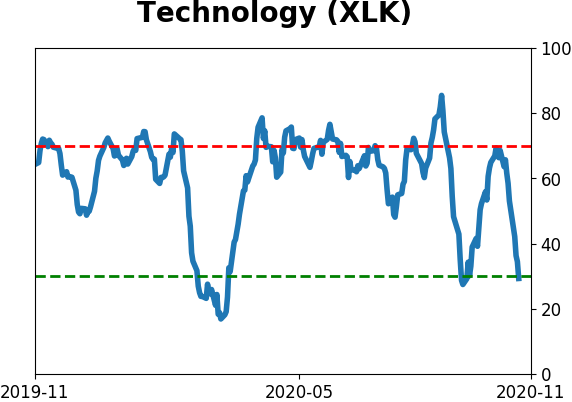
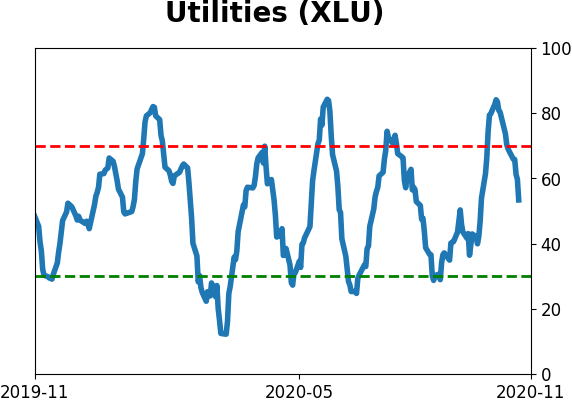
Sector ETF's - 10-Day Moving Average
|
|
|
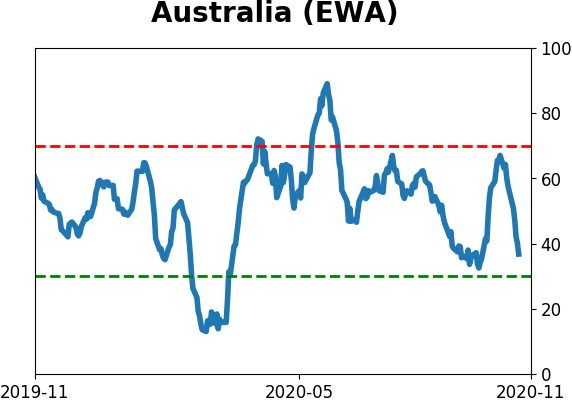
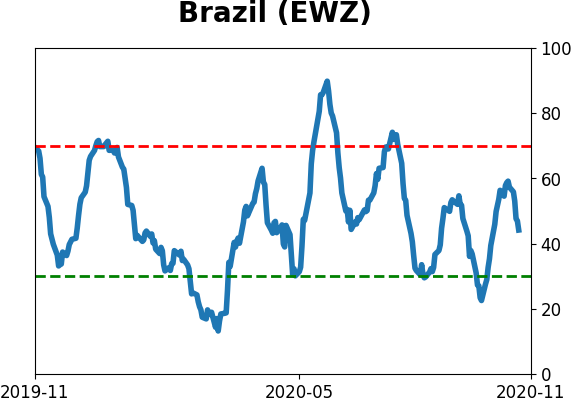
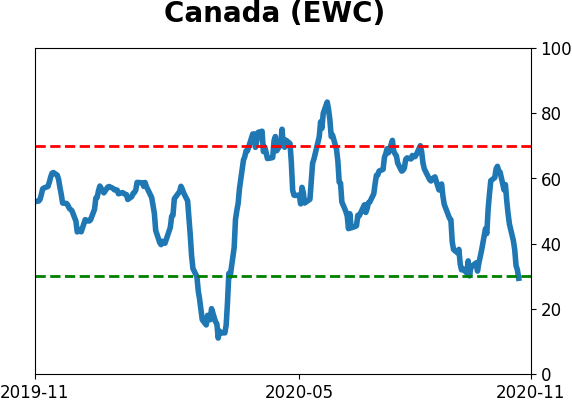
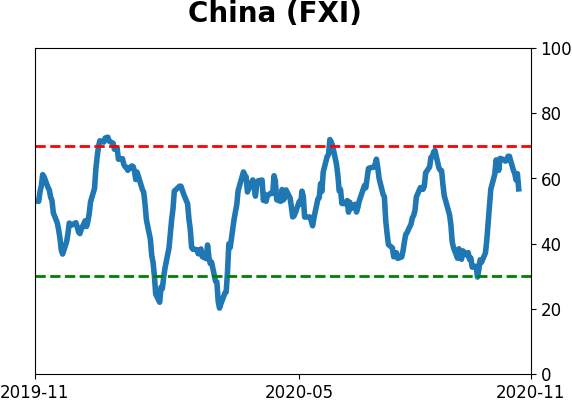
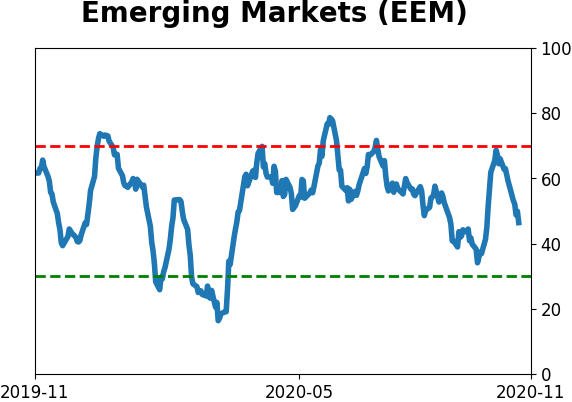
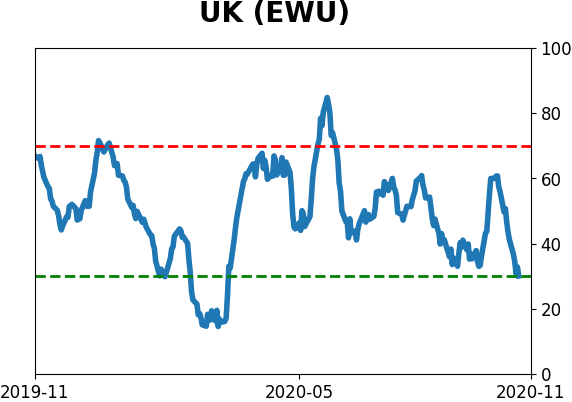
Country ETF's - 10-Day Moving Average
|
|
|
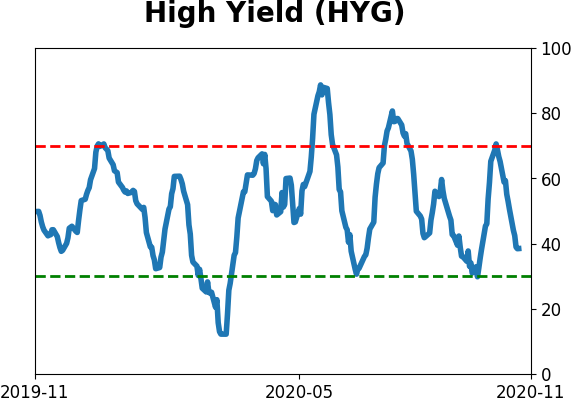
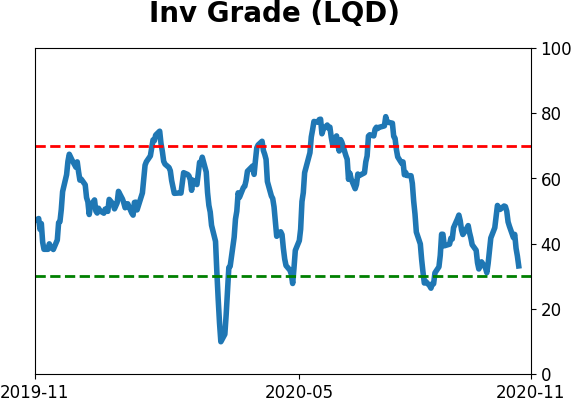
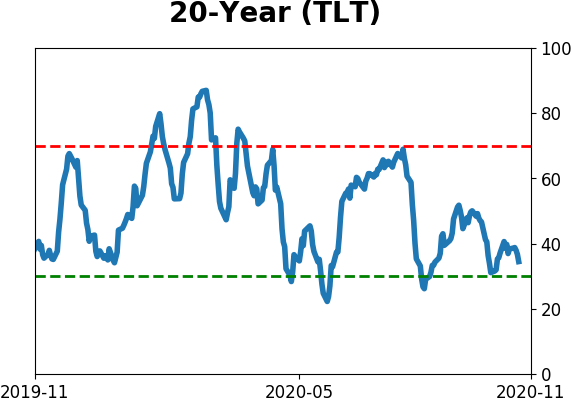
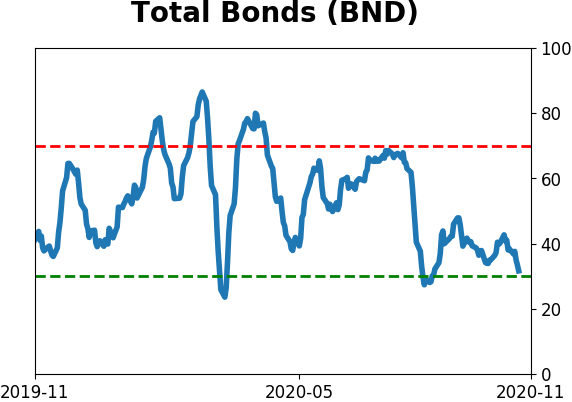
Bond ETF's - 10-Day Moving Average
|
|
|
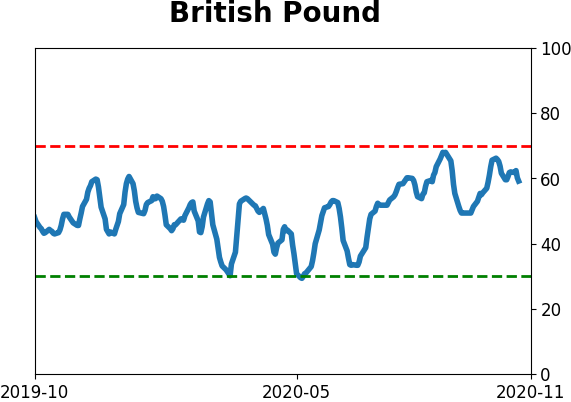
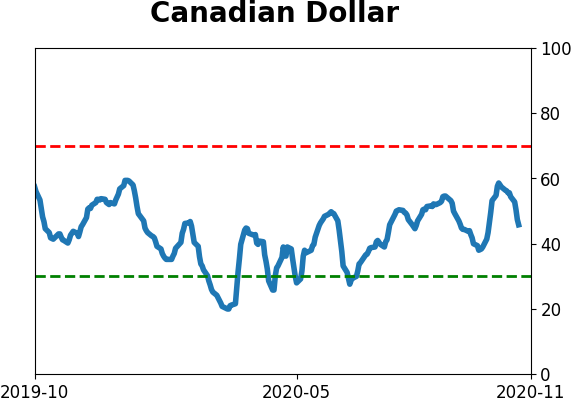
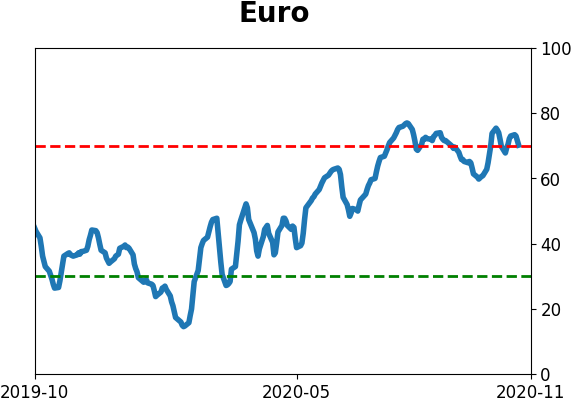
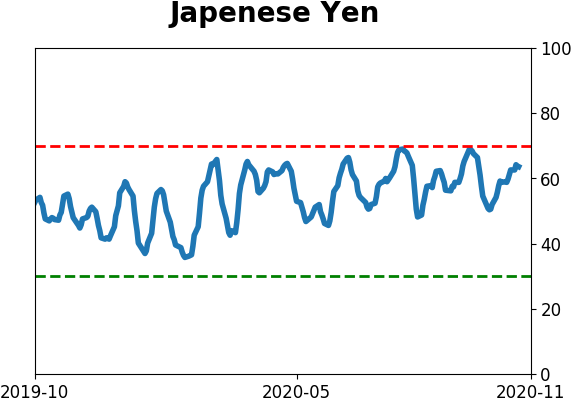
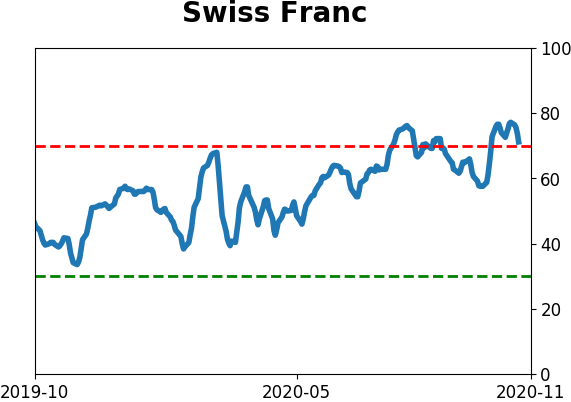
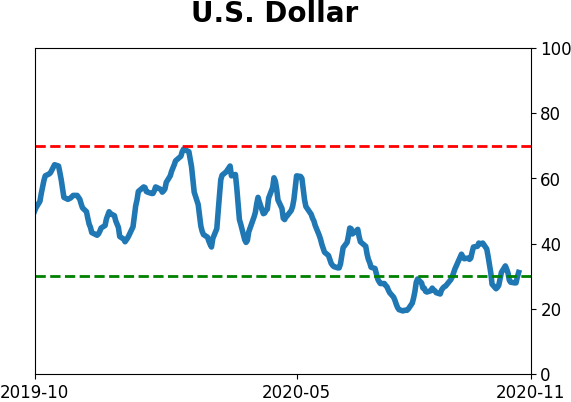
Currency ETF's - 5-Day Moving Average
|
|
|
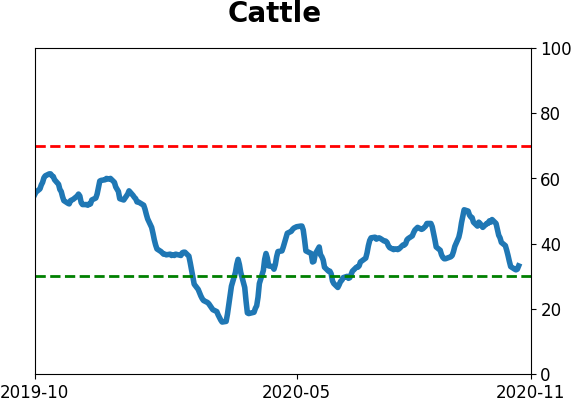
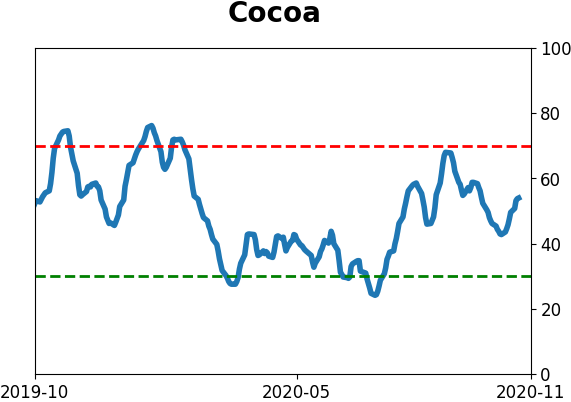
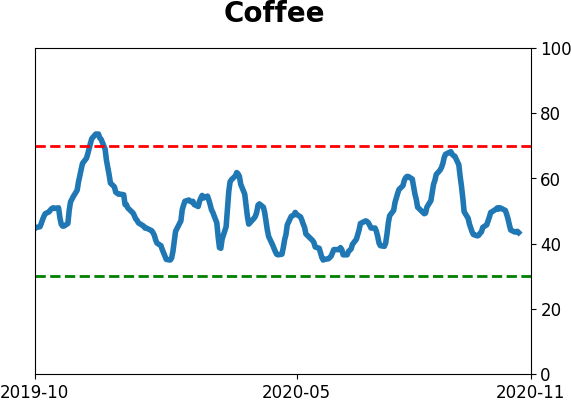
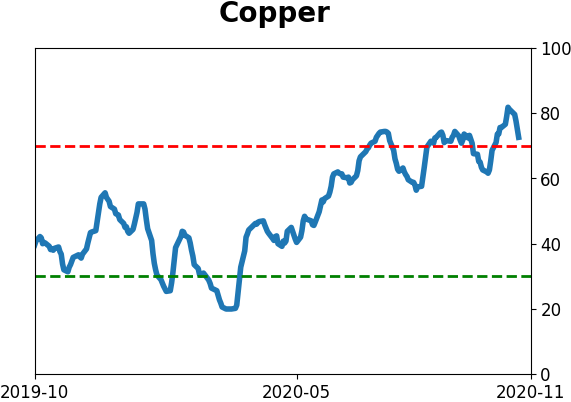
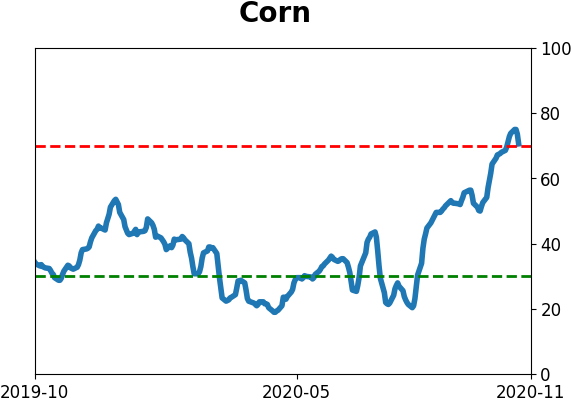
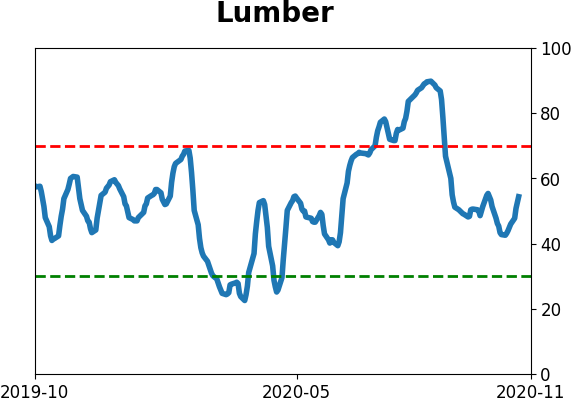
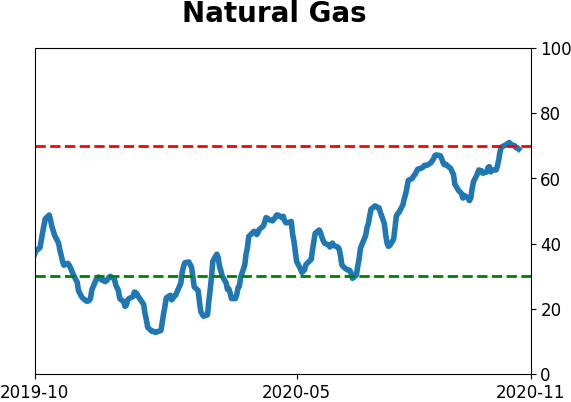
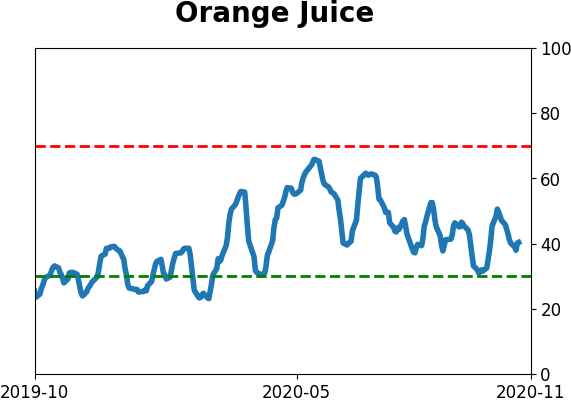
Commodity ETF's - 5-Day Moving Average
|
|