Headlines
|
|
Weekly Wrap for Oct 29 - Rally Broadens Out, Brazil Reaches Historic Oversold Levels:
This week, we saw the rally in stocks broaden out. The Advance/Decline Line for the S&P 500 and then the broader NYSE both hit record highs. That tends to preclude large, sustained drawdowns. Seasonality in stocks and sectors is very positive heading into year-end. Brazilian stocks have been pounded and breadth is nearing historic levels of oversold.
The latest Commitments of Traders report was released, covering positions through Tuesday: The 3-Year Min/Max Screen shows that "smart money" commercial hedgers established new multi-year long exposure to the Mexican peso and Japanese yen. Like most currencies, however, sustainable rallies in the currencies tended to occur once hedgers started to reverse their positions and move back toward net short. Their longs in foreign currencies coincide with a massive short position in the U.S. dollar, more than 70% of open interest. The Backtest Engine shows that the dollar rallied over the next 3 months after such a significant short position only 39% of the time, averaging a return of -0.9%. That was a decent sign for gold, which rallied 63% of the time, averaging +2.6%. In 10-Year Treasuries, hedgers hold more than 400,000 contracts net long, more than 10% of open interest. The Backtest Engine shows that the TLT fund rallied 75% of the time over the next three months, averaging +3.0%, after similar extremes. The BND fund rallied 86% of the time, averaging +1.4%.
Bottom Line:
STOCKS: Weak buy
The speculative frenzy in February is wrung out. There are some signs of pessimism, but the most compelling data show that buyers consistently tend to return once the first signs of extreme momentum end, especially as we head into a seasonally positive time of year. See the Outlook & Allocations page for more. BONDS: Hold
Various parts of the market got hit in March, with the lowest Bond Optimism Index we usually see during healthy environments. Bond prices have modest recovered and there is no edge among the data we follow. GOLD: Hold
Gold and miners were rejected after trying to recover above their 200-day averages in May. Lately, some medium-term (not long-term) oversold extremes in breadth measures among miners have triggered.
|
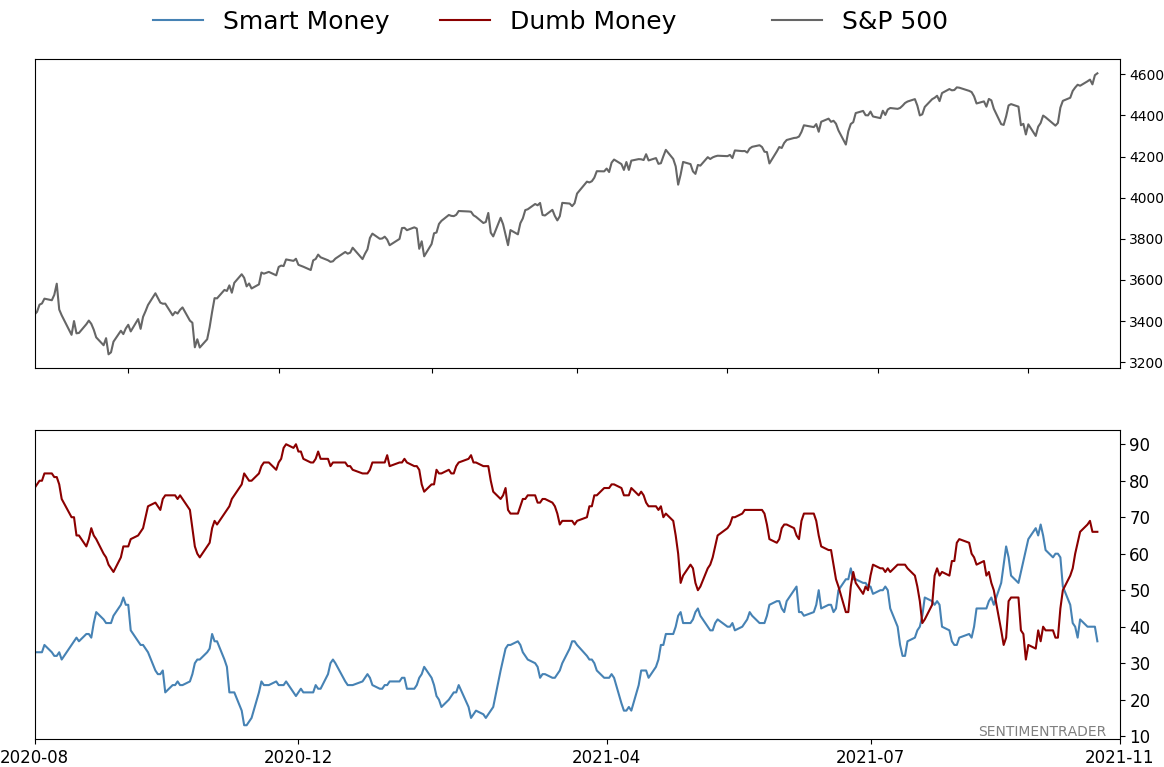
Smart / Dumb Money Confidence
|
Smart Money Confidence: 36%
Dumb Money Confidence: 66%
|
|
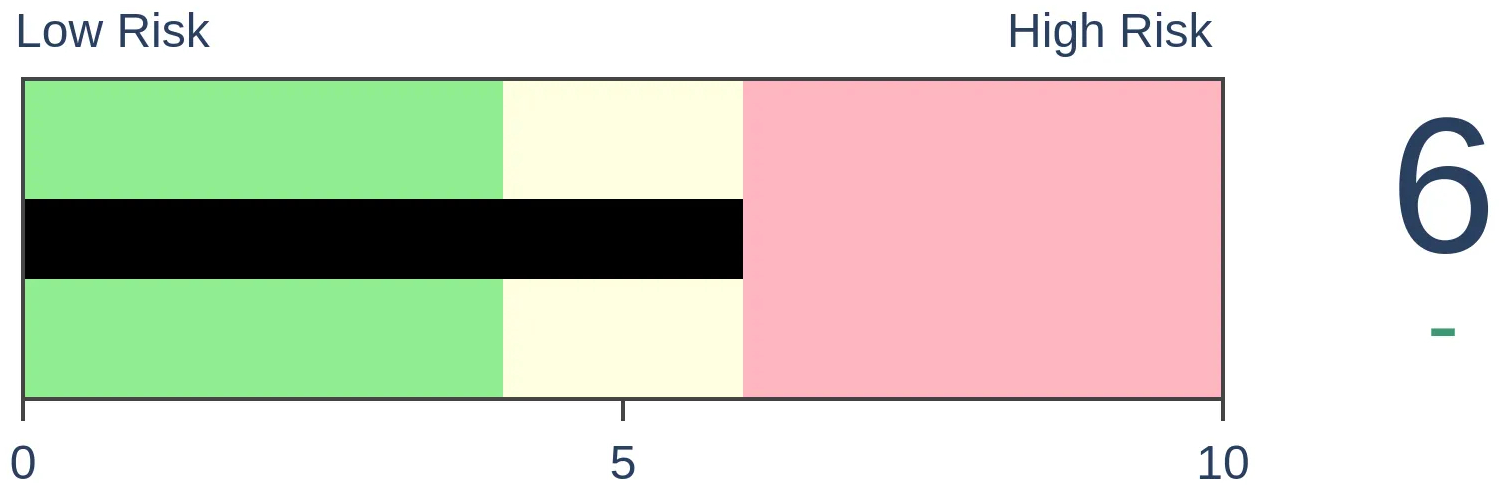
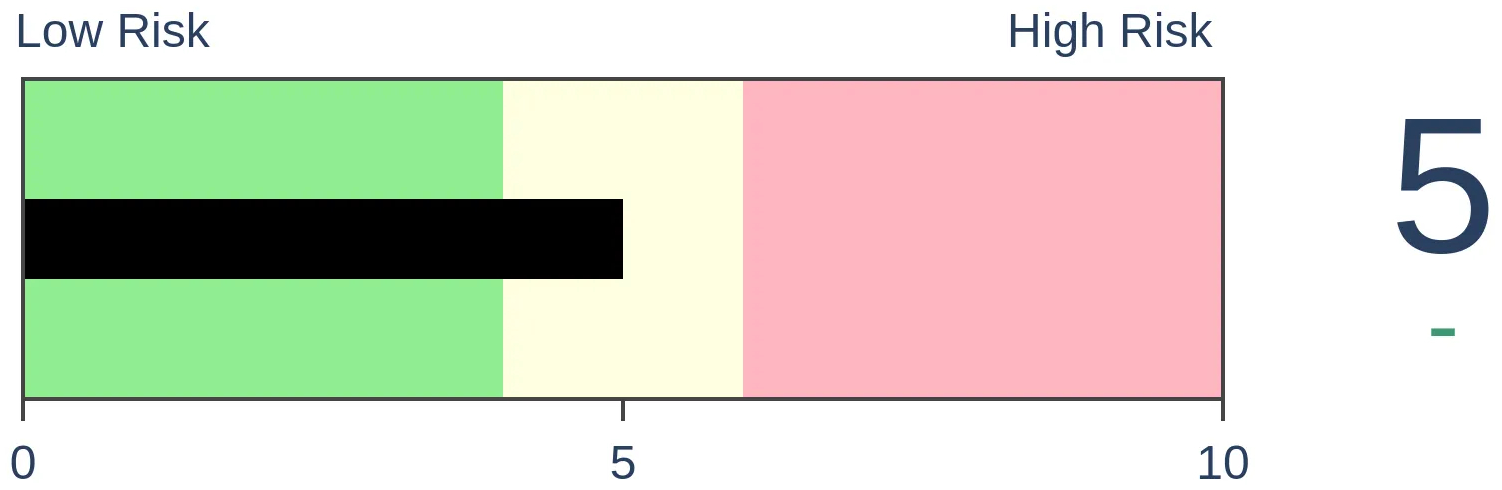
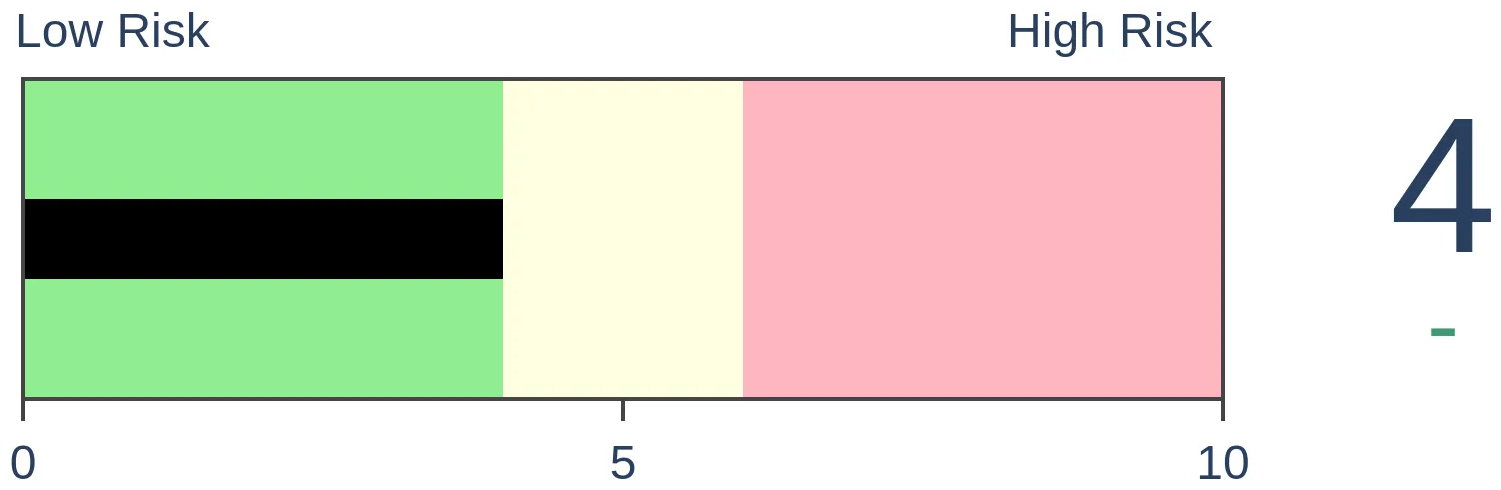
Risk Levels
Stocks Short-Term

|
Stocks Medium-Term
|
|
Bonds

|
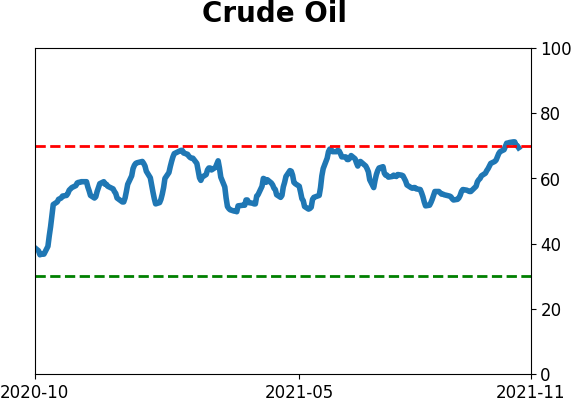
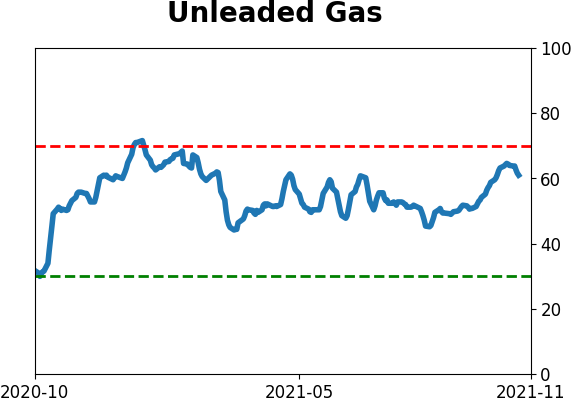
Crude Oil
|
|
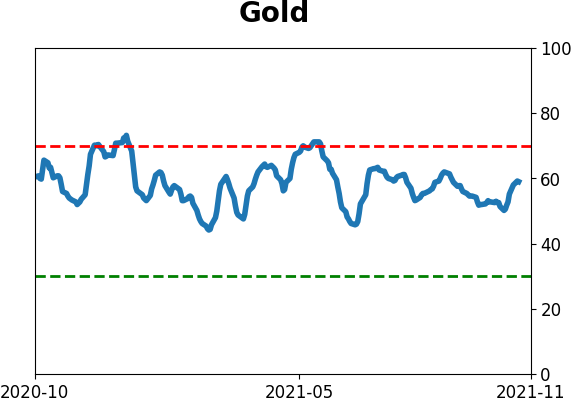
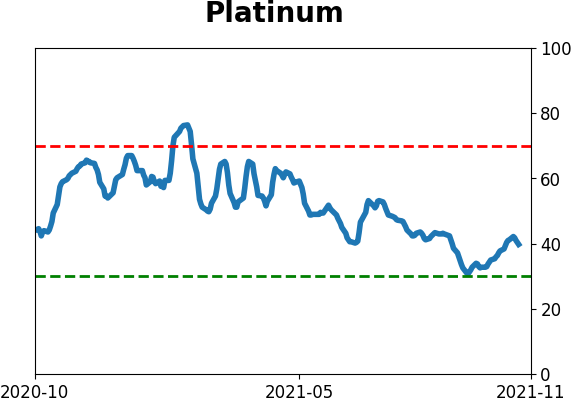
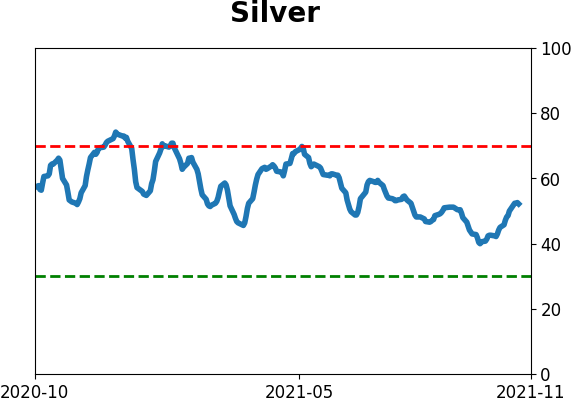
Gold
|
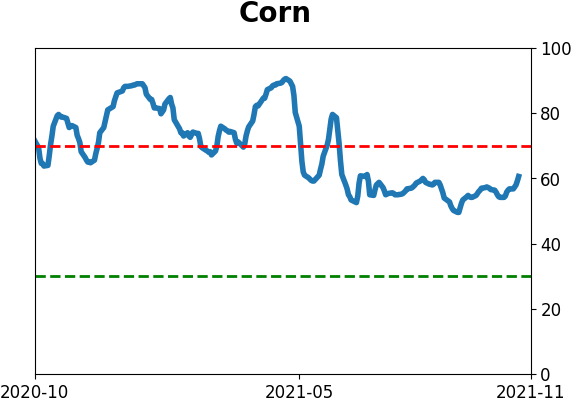
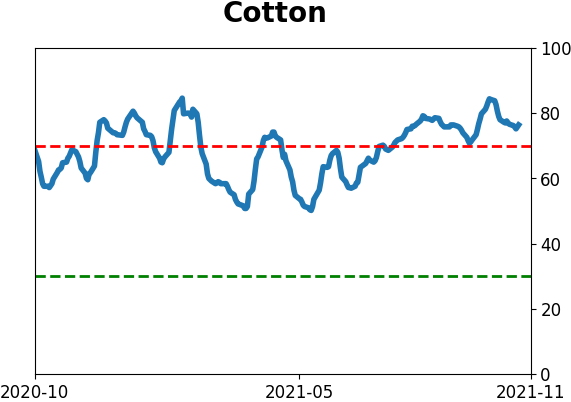
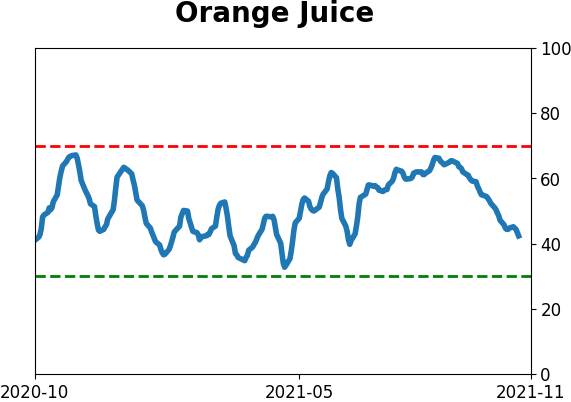
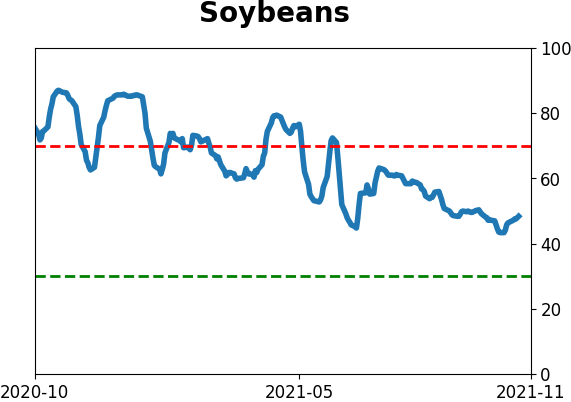
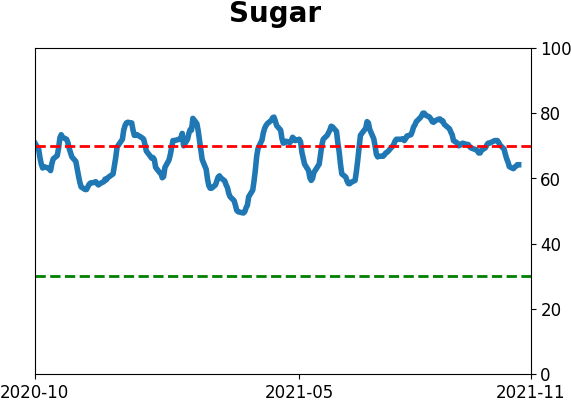
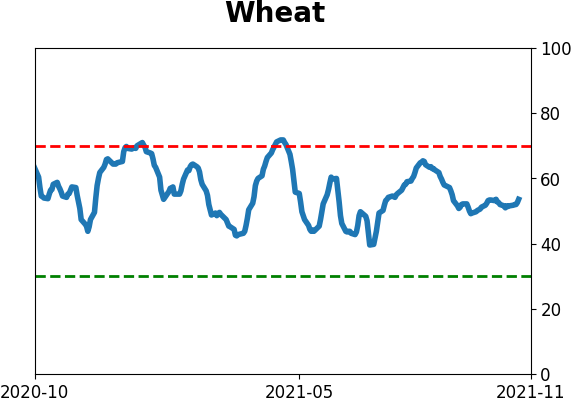
Agriculture
|
|
Research
By Jason Goepfert
BOTTOM LINE
This week, we saw the rally in stocks broaden out. The Advance/Decline Line for the S&P 500 and then the broader NYSE both hit record highs. That tends to preclude large, sustained drawdowns. Seasonality in stocks and sectors is very positive heading into year-end. Brazilian stocks have been pounded and breadth is nearing historic levels of oversold.
FORECAST / TIMEFRAME
None
|
The goal of the Weekly Wrap is to summarize our recent research. Some of it includes premium content (underlined links), but we're highlighting the key focus of the research for all. Sometimes there is a lot to digest, with this summary meant to highlight the highest conviction ideas we discussed. Tags will show any symbols and time frames related to the research.
| STOCKS |
 |  |
|
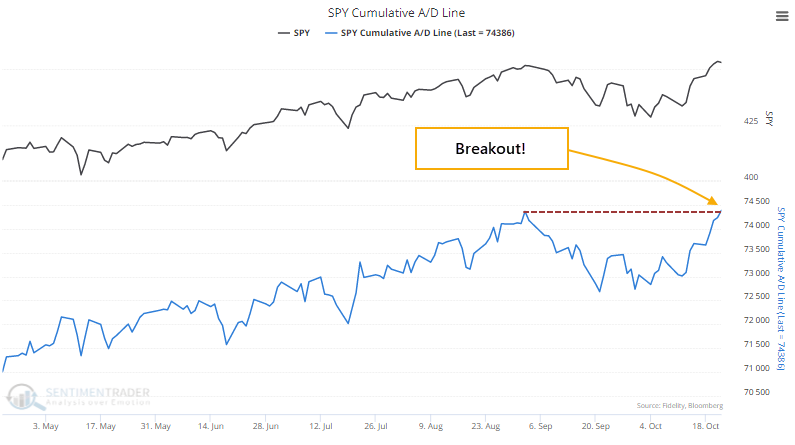
The most benchmarked index in the world is trying to hold a breakout to record highs. Supporting its case is that most of its stocks have been rising, and breadth within the index confirms its good performance.
Even though the S&P 500 settled back a bit on Friday, most of the stocks in the index gained ground. That was enough to push the S&P's Cumulative Advance/Decline Line to a new high, the first in more than 30 sessions.
Below, we can see that since 1928, the S&P 500 was three times more likely to suffer a 10% decline at some point within the next three months if the S&P's Advance/Decline Line was not at a multi-year high. When it did break out to a new high, as it did on Friday, there was only a 4.6% probability of a 10% or greater decline within the next few months and less than a 2% chance of a 20% decline.
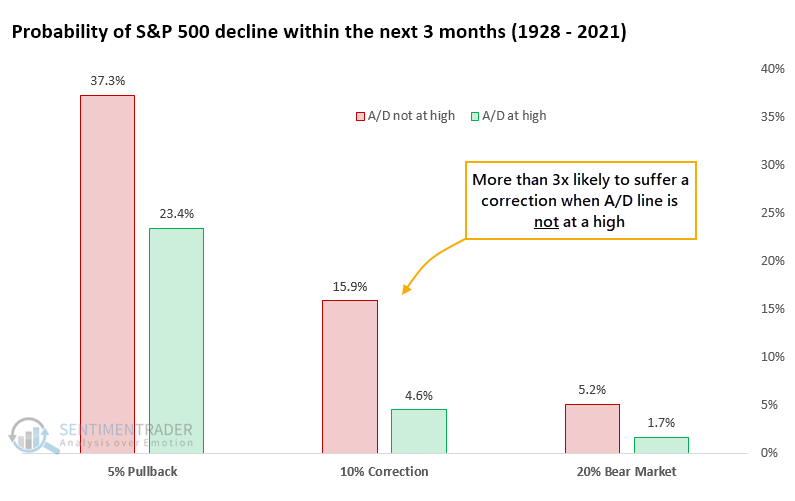
The S&P 500 can suffer a significant decline shortly after a breakout to a new high in the Advance/Decline Line. But it's sporadic and comes quickly out of the blue. Since 1928, the only two instances were the Black Monday crash in October 1987 and the pandemic crash in March 2020.
RALLY BROADENS OUT
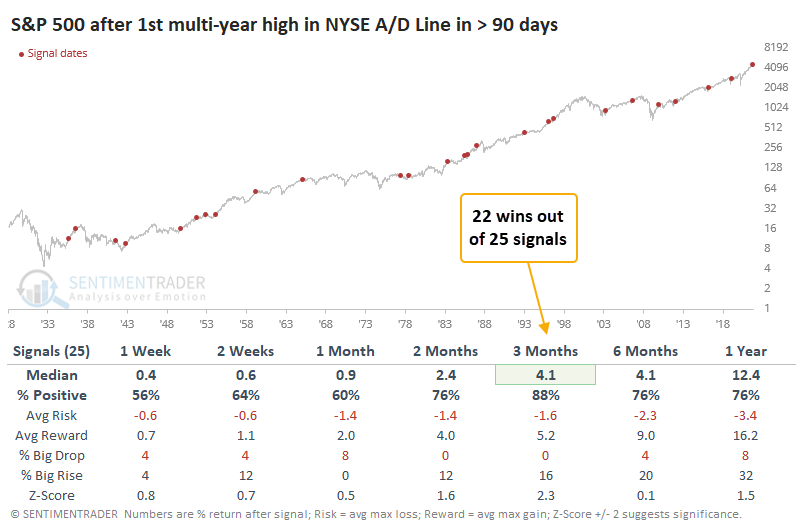
For the first time in more than 90 days, the NYSE Cumulative Advance/Decline Line is sitting at a record high.
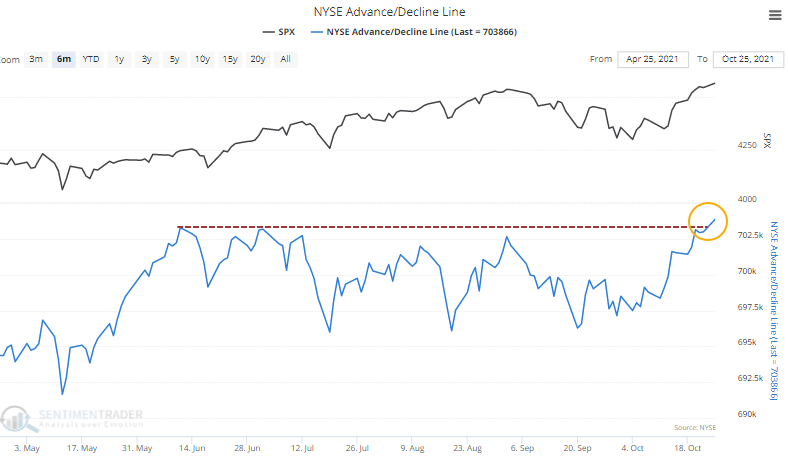
Like we saw with breakouts in the S&P 500 line on Monday, new highs in the NYSE A/D Line have consistently preceded stock gains.
Just because cumulative breadth measures like the Advance/Decline Line are sitting at new highs, it does not mean stocks can't decline. They can; they can even crash. While technicians like to focus on divergences, many 10% or greater declines began when the A/D Line was at new highs.
The biggest difference is that those significant declines usually began a prolonged "everything" rally in the A/D Line. They rarely happened when the A/D Line was just breaking out to new highs. We can never traffic in absolutes or certainties, only probabilities. Over a very long history, probabilities favor rising stocks, or at least only limited declines, after breakouts in breadth.
EQUAL-WEIGHT INDEX HITS HISTORIC STRETCH
On Monday, the S&P 500 equal-weighted index closed higher for the 10th consecutive day. And, the index simultaneously closed at a record high.
As a reminder, the version of the S&P 500 that weights all 505 member stocks equally provides a better picture of stock participation than the version which weights the members based on their market capitalization.
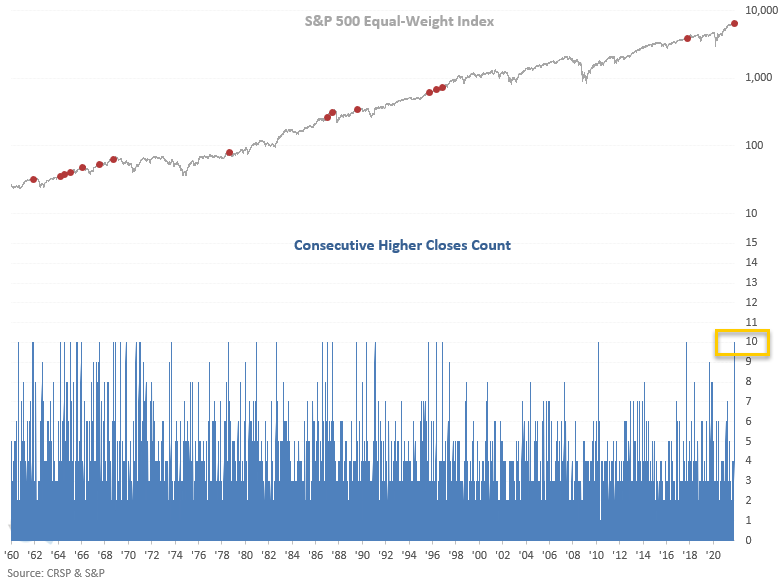
Dean noted that returns look good on a short to intermediate-term basis, especially in the first couple of weeks. So, even though momentum has been strong lately, the study results suggest that it can continue.
Given the amount of money invested in S&P 500 Index Funds and ETFs, let's apply the equal-weight signals to the cap-weighted S&P 500 index to assess the outlook for the most widely followed benchmark.
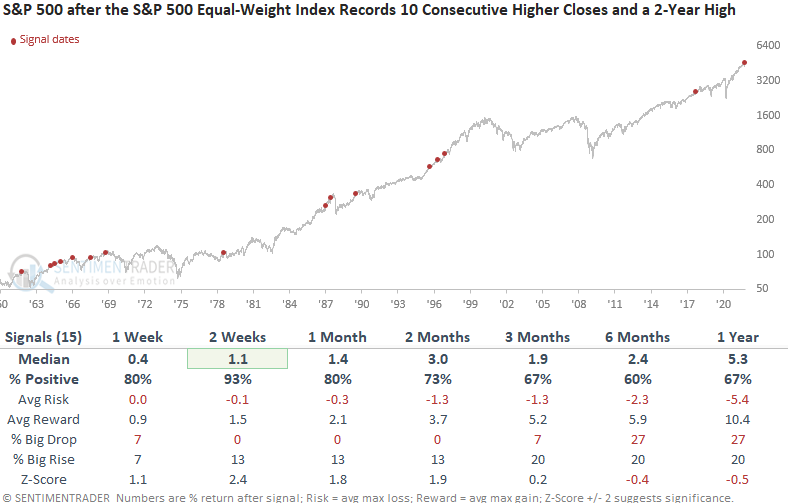
Market participation as measured by the S&P 500 equal-weighted index has been strong of late. Based on today's study results, the momentum can continue.
SEASONAL TAILWIND
It is not a secret that the 4th quarter tends to be good for stock market investors, particularly beginning in late October. Jay examined one specific period and measured the results.
The S&P 500 market appears to show seasonal strength from Trading Day of Year #208 through the end of the year. So that will be our test:
- Buy at the close of TDY #208
- Sell at the close of the last trading day of the year
We will start our test in 1953 (because before 1953, the NYSE was open for a few hours on Saturday, so there were technically more trading days in a year before 1953).
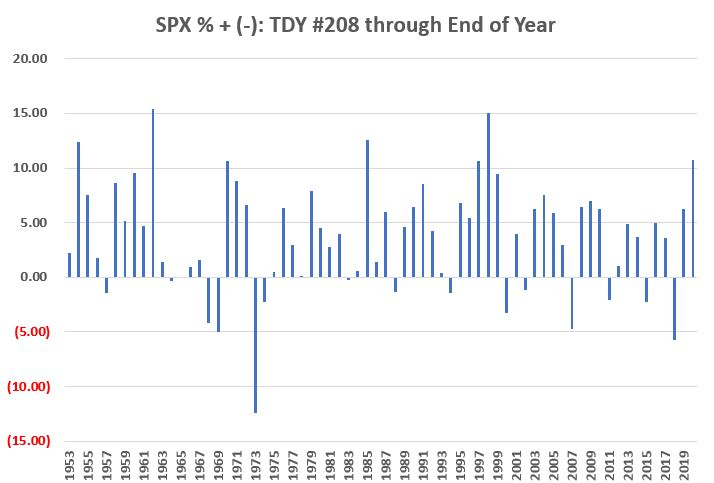
It's particularly worth noting that 85.1% of all years saw a drawdown of LESS THAN -5% between the close on TDY #208 and the end of the year.
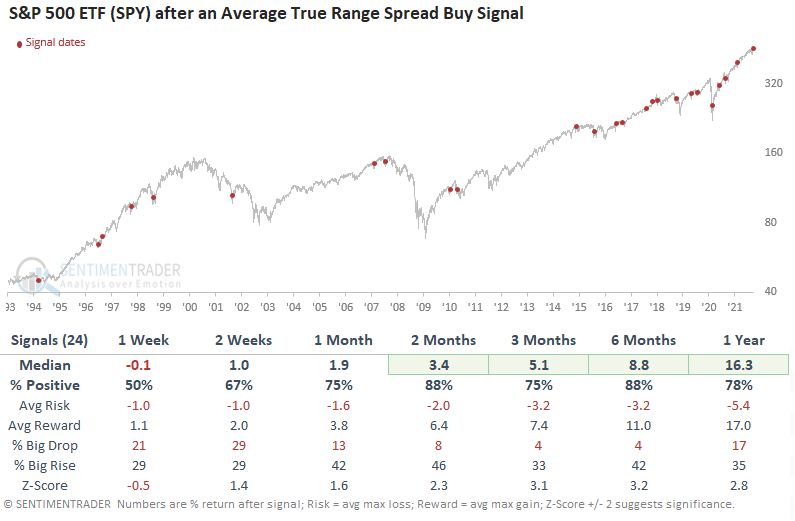
A VOLATILITY CONTRACTION BUY SIGNAL
Dean showed that the Average True Range Spread Model for the S&P 500 ETF (SPY) registered a new buy signal at the close of trading last Friday. The model looks for times when a market cycles from a period of high volatility to low volatility.
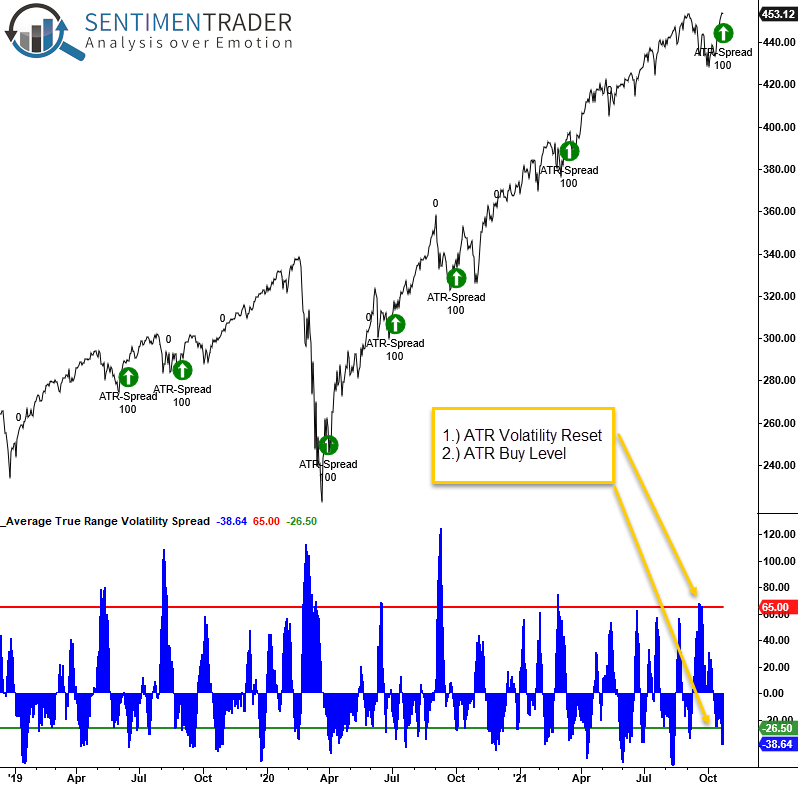
Besides the 1-week time frame, performance looks solid with several notable risk/reward profiles.
STOCKS AND SECTORS - CONSUMER STAPLES
Jay pointed out that we will soon enter a consistently seasonally favorable time of year for the consumer staples sector. How consistent, you ask? Let's take a closer look.
For our backtest data, we will use the S&P 500 Consumer Sector Index data starting in 1945. The chart below displays the cumulative total return growth of $1 invested in the Index S&P 500 Consumer Sector Index from the close of Trading Day of the Year #208 through the close of the last Trading Day of the Year.
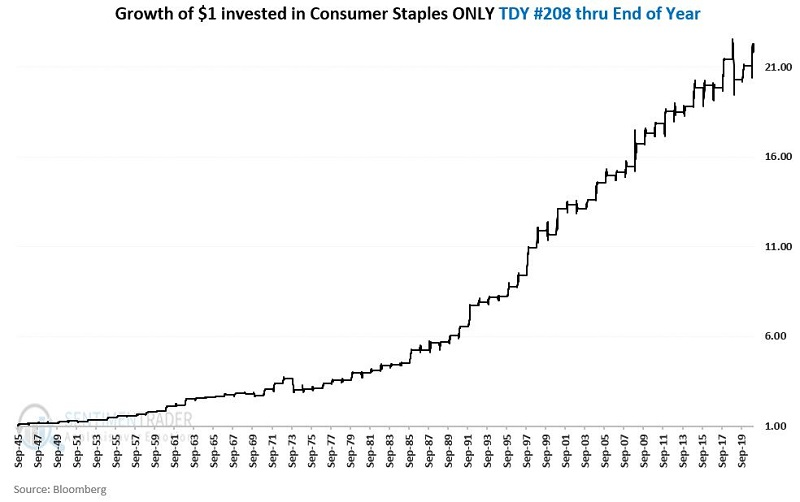
This seasonal window showed an 84% win rate combined with an Average Win/Average Loss ratio of almost 2-to-1.
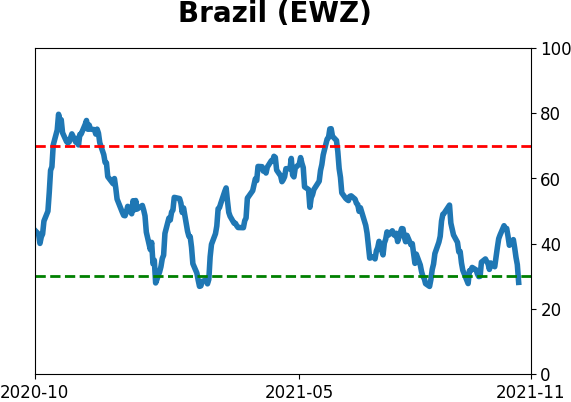
STOCKS AND SECTORS - BRAZIL
Brazil is a mess, and investors are panicking. In recent days, selling pressure has been heavy enough and broad enough to hint at indiscriminate selling.
On an average day during the past 100 sessions, 10 more stocks have declined than advanced. That's an abysmal stretch that few sectors or indexes have matched in the past 20 years. For the Ibovespa, it's the 2nd-lowest reading since 1998, barely exceeded by late October 2008.
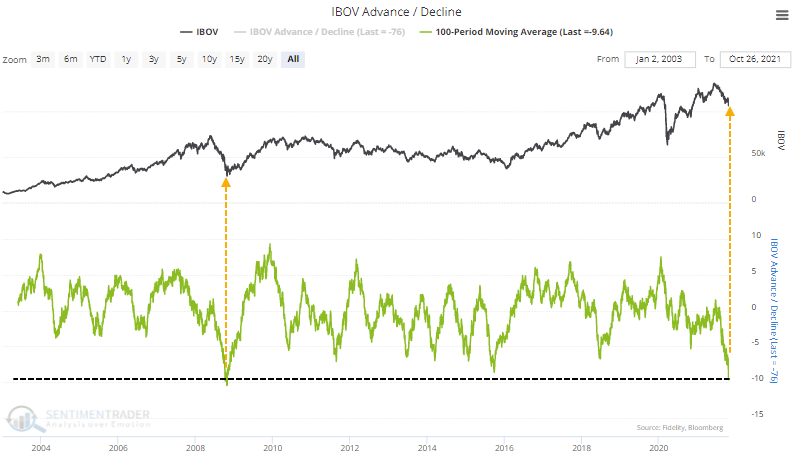
Such poor internal momentum has pushed the McClellan Summation Index for Brazilian stocks below -1000 and kept it there for most of the past few months. It's been below -975 for 56 trading days, eclipsed only by the 60 days it spent below that threshold in November 2008.
We can calculate a Breadth Panic model that aggregates the kinds of internal measures which spike when investors sell everything at once. Over the last 90 days, the Breadth Panic has risen to the highest level in 7 years.
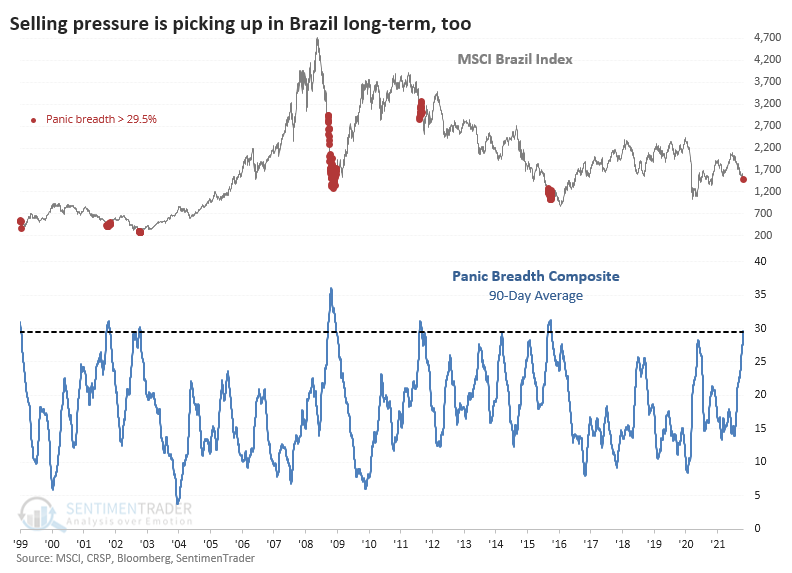
These were not automatic buy signals. Even though the MSCI Brazil Index (on which the EWZ fund is based) rallied each time over the next year, the drawdowns on a couple of them were horrendous.
There are two things to watch for a better potential opportunity:
- Outright panic that pushed 50% or more of stocks to new lows (it reached just over 30% last week)
- Enough of a recovery to stop the McClellan Summation Index from falling and curl decisively higher
Neither one guarantees a positive return, especially in the weeks ahead. Conditions like that tend to coincide with high volatility over a multi-week to multi-month time frame. But over the next 6-12 months, either condition should lead to significantly higher prices.
Jay discussed another look at breadth on Brazilian stocks and a way to trade it using options.
Possibly the most straightforward approach to trading the Brazilian stock market is to buy shares of ETF ticker EWZ. At its recent closing price of $30.09 a share, an investment of $3,009 is required to buy 100 shares. However, because the Brazilian stock market is so volatile and more of a speculation, let's look at an example trade with a lower dollar commitment.
That's a Bull Call Spread going out to October 2022.
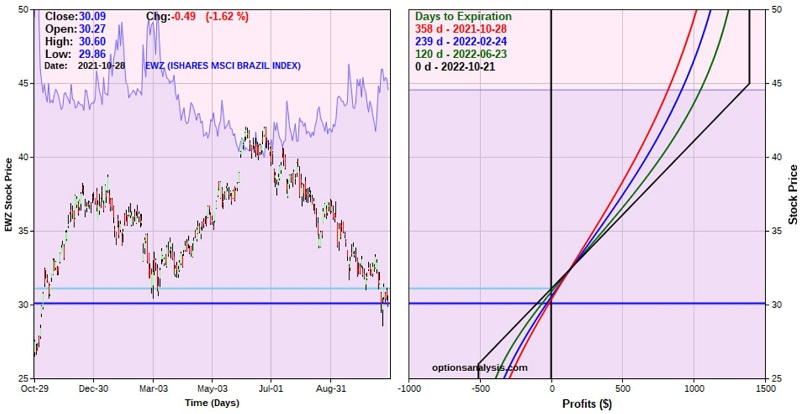
In a nutshell, this is a trade with a defined maximum risk (-$509) and a lot of time for things to work out (358 calendar days).
Things to note:
- At the time of entry, this trade has 358 days left until expiration
- Buying a 1 lot gives this trade a delta of 60.29. This means that (for now) this position will behave like a position holding roughly 60 shares of EWZ.
- The cost to enter this trade is $509 versus $1,805 to buy 60 shares of EWZ stock.
- The maximum profit potential is $1,391 if EWZ is at $45 a share at option expiration.
- The maximum risk is -$509 if EWZ is below $26 a share at option expiration.
The example trade above allows a speculator to put on something of a "set it and forget it" position in a market with explosive potential in the year ahead.
Is it too soon to jump into this troubled market? That's for each trader to decide for themselves. But whenever the time comes to "take the plunge," it may be helpful to consider the unique possibilities available via options on ticker EWZ.
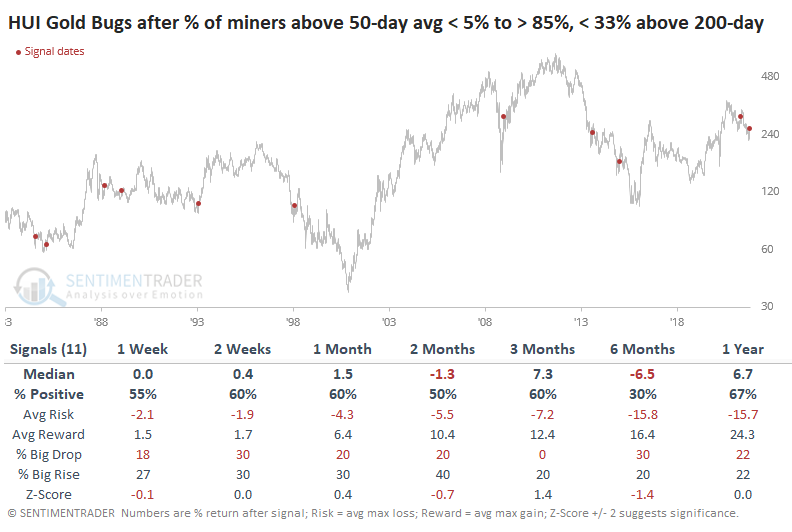
After being left for dead, companies who mine the barbarous relic have made a comeback. Gold mining stocks are showing a thrust in medium-term trends, but longer-term trends remain poor. That has preceded mostly negative returns for the HUI Gold Bugs Index.
Less than a month ago, fewer than 5% of gold mining stocks traded above their 50-day moving averages. With a surge in gold prices in recent weeks, miners got bid, and several days recorded more than 85% of the stocks trading above their averages.
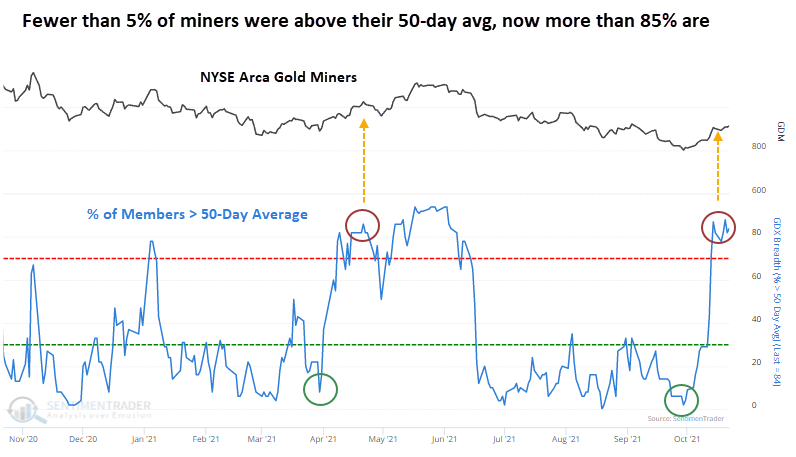
When we add a longer-term trend filter, the returns get worse. Despite the recent rally, fewer than a third of gold mining stocks are trading above their 200-day moving averages.
The table below looks for times when there was a thrust in medium-term trends, regardless of how long it took to cycle from one extreme to the other. But it only includes those dates when fewer than 33% of miners were above their 200-day averages. This shows us breadth thrusts when most of the stocks had been trading poorly.
Also, for the first time in more than 4 months, fewer than 75% of stocks are trading more than 20% below their 52-week highs. Remarkably, there have been 10 other times when miners ended a streak of at least 50 days with more than 3/4 of the stocks in bear markets. Every time, the HUI Gold Bugs Index showed a negative return either 1 or 2 months later.
It would be a more compelling setup right now if prior breadth thrusts showed a more consistently positive record, and there were fewer stocks mired in long-term downtrends. Currently, buyers have to rely on the idea that the long-term trend in these stocks has changed. That's been a very risky bet to take in this group.
Active Studies
| Time Frame | Bullish | Bearish | | Short-Term | 2 | 0 | | Medium-Term | 8 | 0 | | Long-Term | 11 | 5 |
|
Indicators at Extremes
|
% Showing Pessimism: 0%
Bullish for Stocks
|
|
Portfolio
| Position | Description | Weight % | Added / Reduced | Date | | Stocks | RSP | 10.7 | Added 6.4% | 2021-10-01 | | Bonds | 32.7% BND, 7.1% SCHP | 39.8 | Added 8.3% | 2021-10-26 | | Commodities | GCC | 2.4 | Reduced 2.1%
| 2020-09-04 | | Precious Metals | GDX | 4.6 | Reduced 4.2% | 2021-05-19 | | Special Situations | 9.8% KWEB, 4.7% XLE, 2.9% PSCE | 17.3 | Added 9.78% | 2021-10-01 | | Cash | | 24.1 | | |
|
Updates (Changes made today are underlined)
Much of our momentum and trend work has remained positive for several months, with some scattered exceptions. Almost all sentiment-related work has shown a poor risk/reward ratio for stocks, especially as speculation drove to record highs in exuberance in February. Much of that has worn off, and most of our models are back toward neutral levels. There isn't much to be excited about here. The same goes for bonds and even gold. Gold has been performing well lately and is back above long-term trend lines. The issue is that it has a poor record of holding onto gains when attempting a long-term trend change like this, so we'll take a wait-and-see approach. Momentum has ebbed quickly in recent weeks, and nearing oversold levels in some indicators. This can be a dangerous area, with a lot of short-term volatility, but we'd be more inclined to add medium- to long-term exposure rather than sell on much more of a decline, thanks to already rock-bottom exposure. Other areas look more attractive, including some overseas markets. RETURN YTD: 10.4% 2020: 8.1%, 2019: 12.6%, 2018: 0.6%, 2017: 3.8%, 2016: 17.1%, 2015: 9.2%, 2014: 14.5%, 2013: 2.2%, 2012: 10.8%, 2011: 16.5%, 2010: 15.3%, 2009: 23.9%, 2008: 16.2%, 2007: 7.8%
|
|
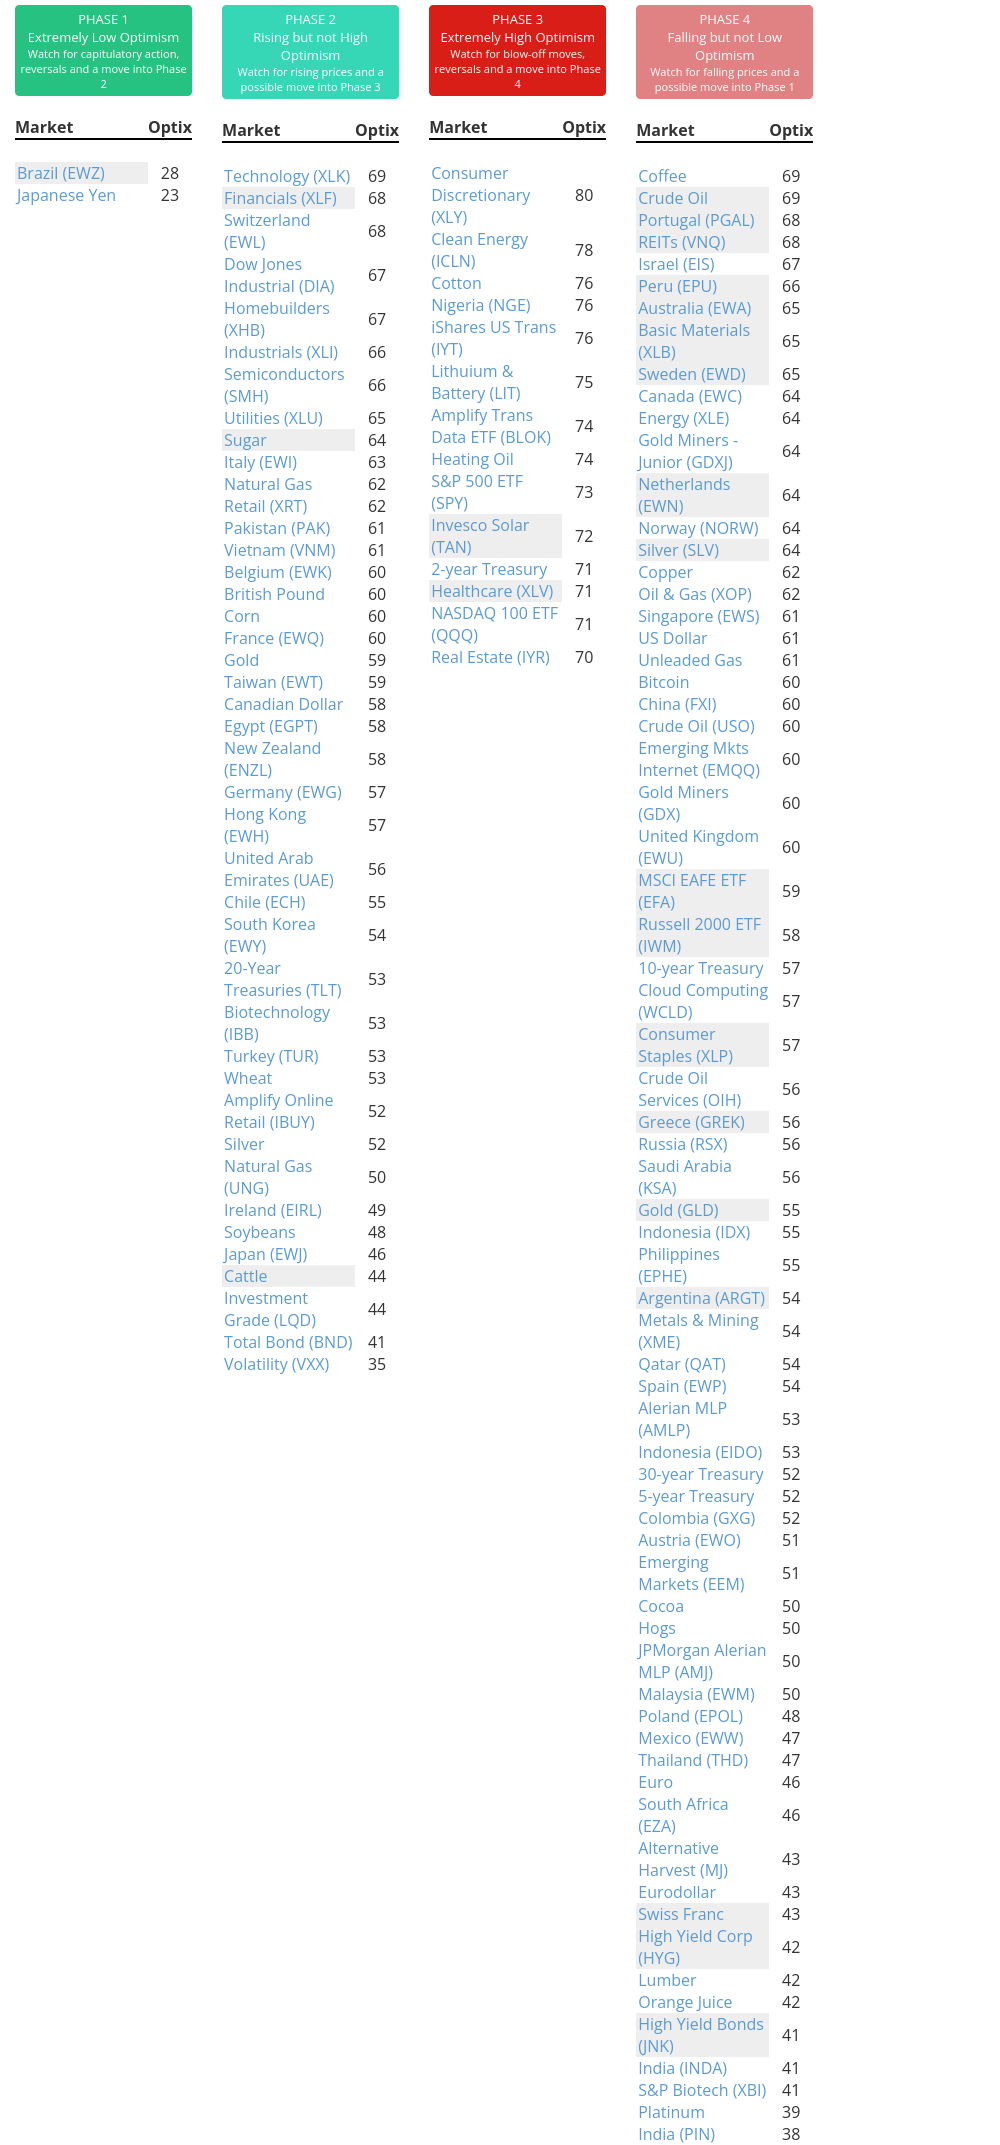
Phase Table
Ranks
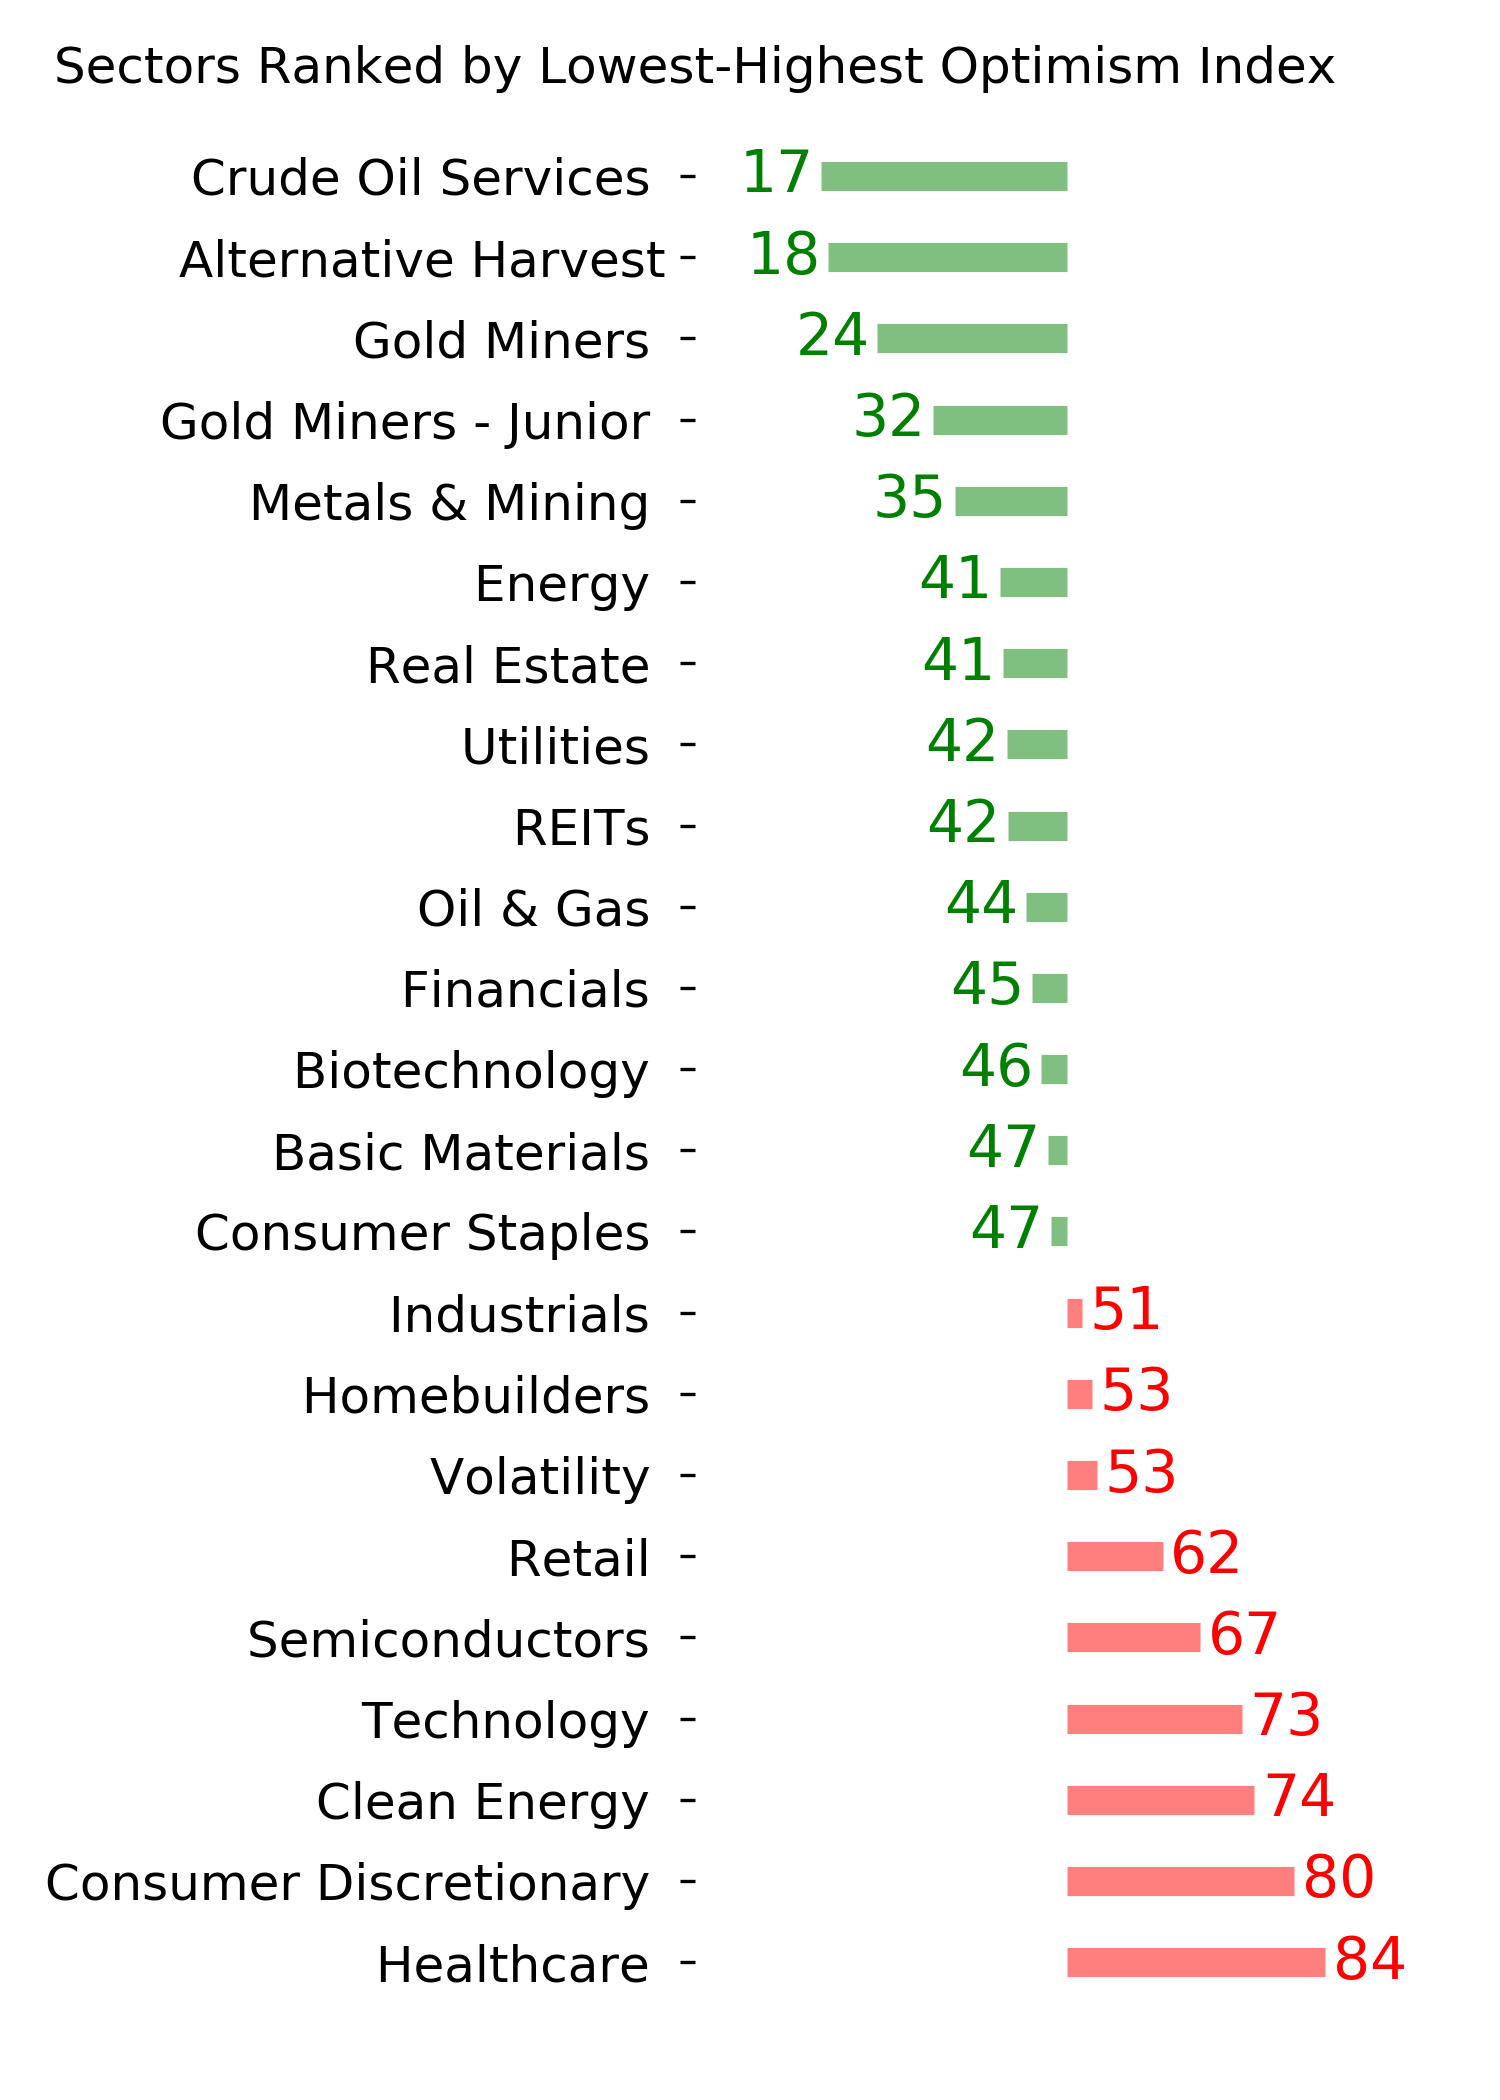
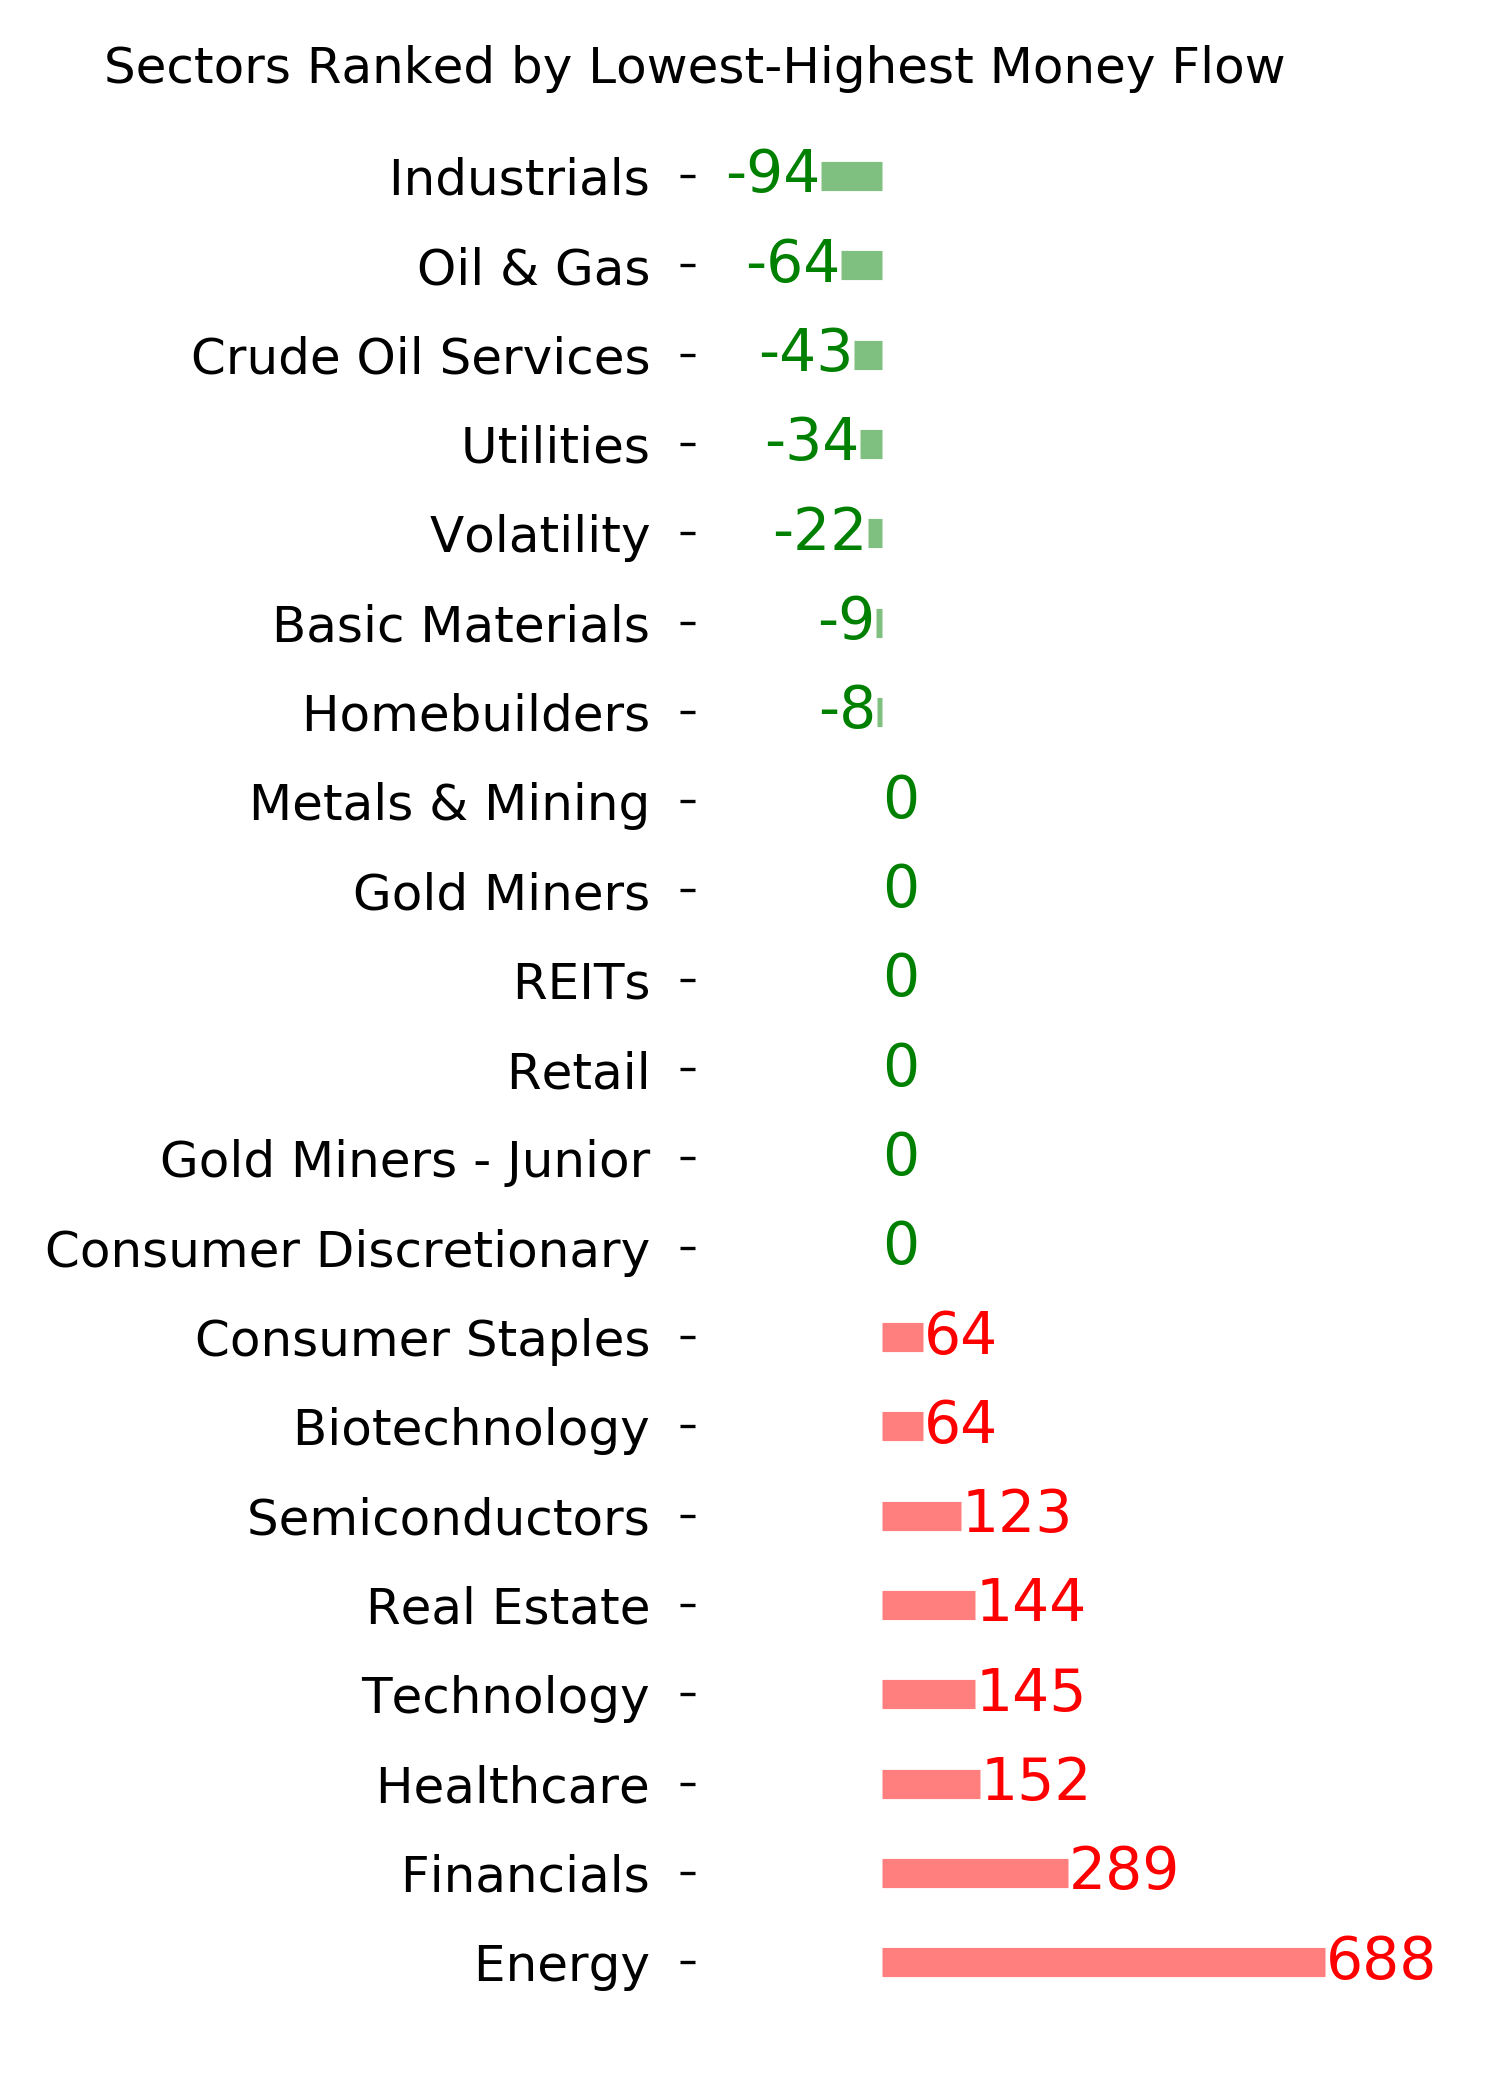
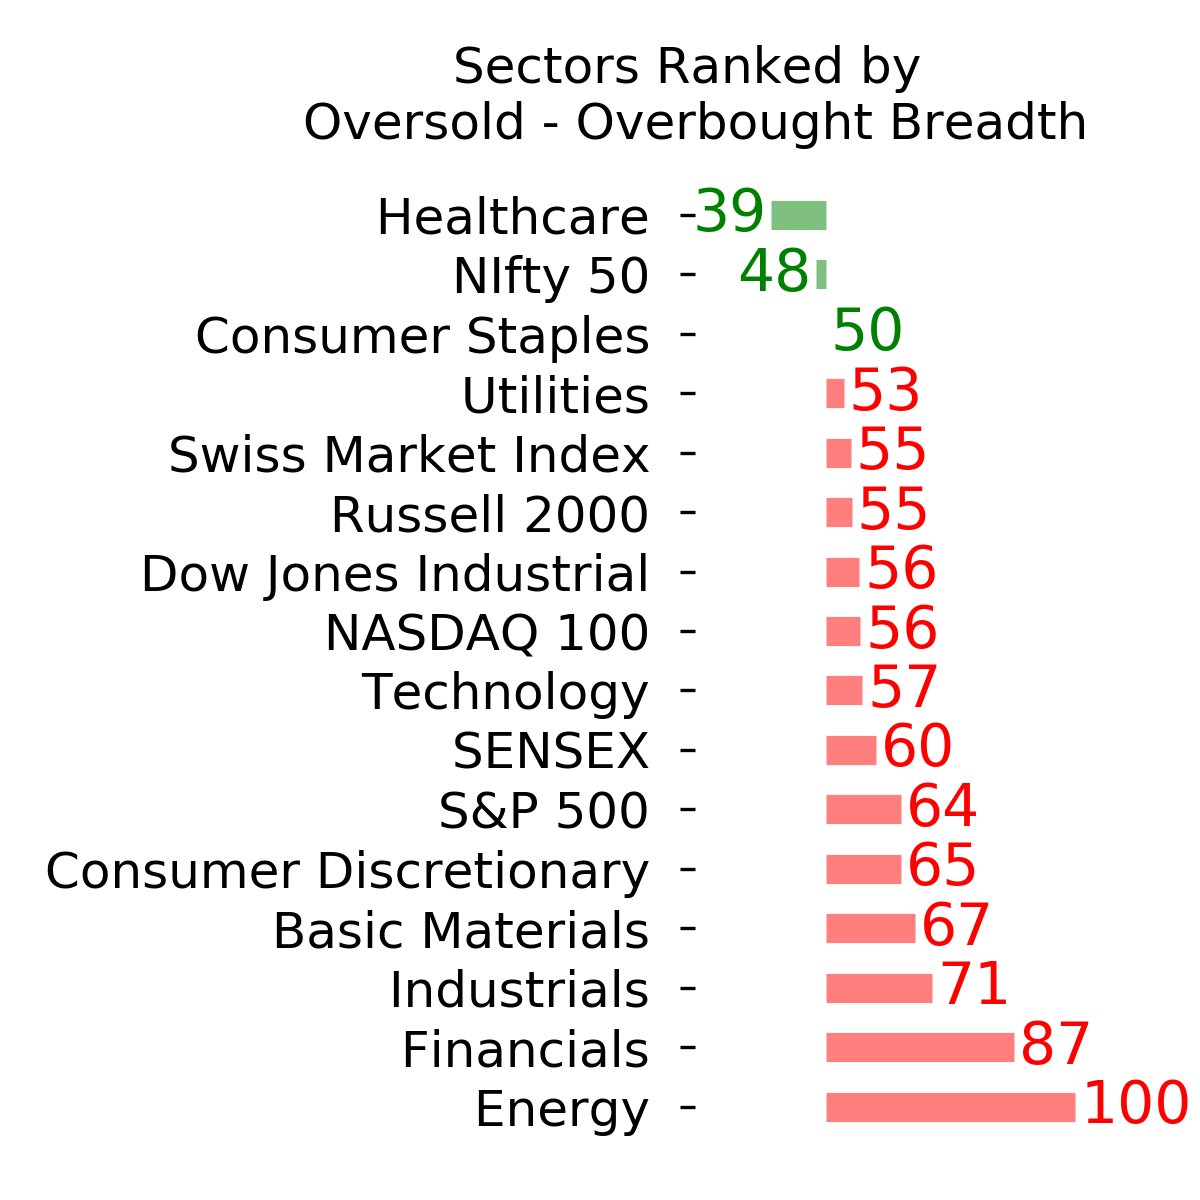
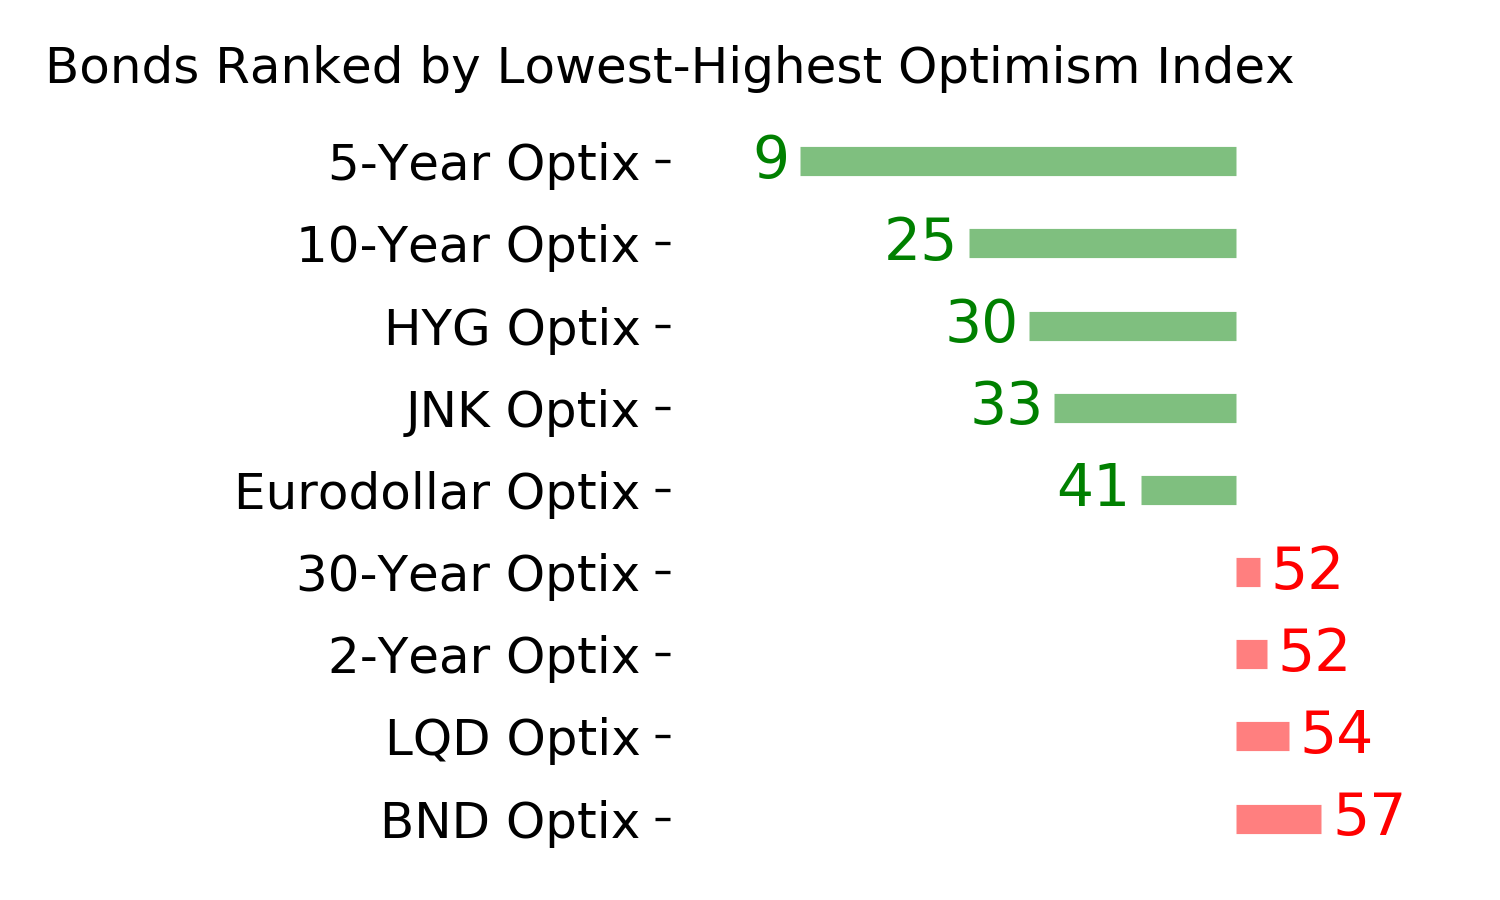
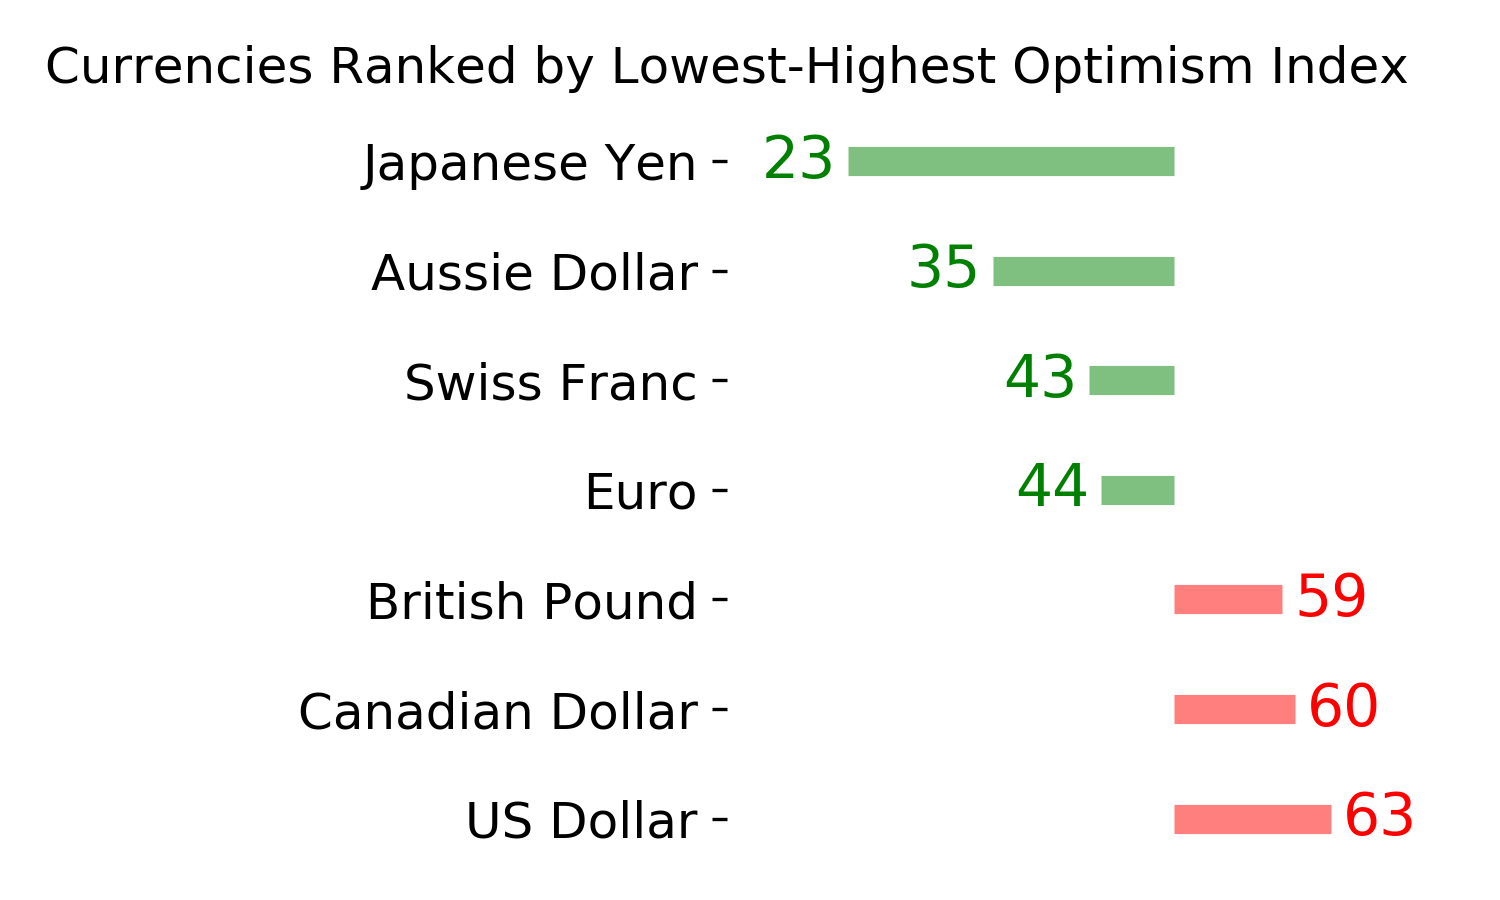
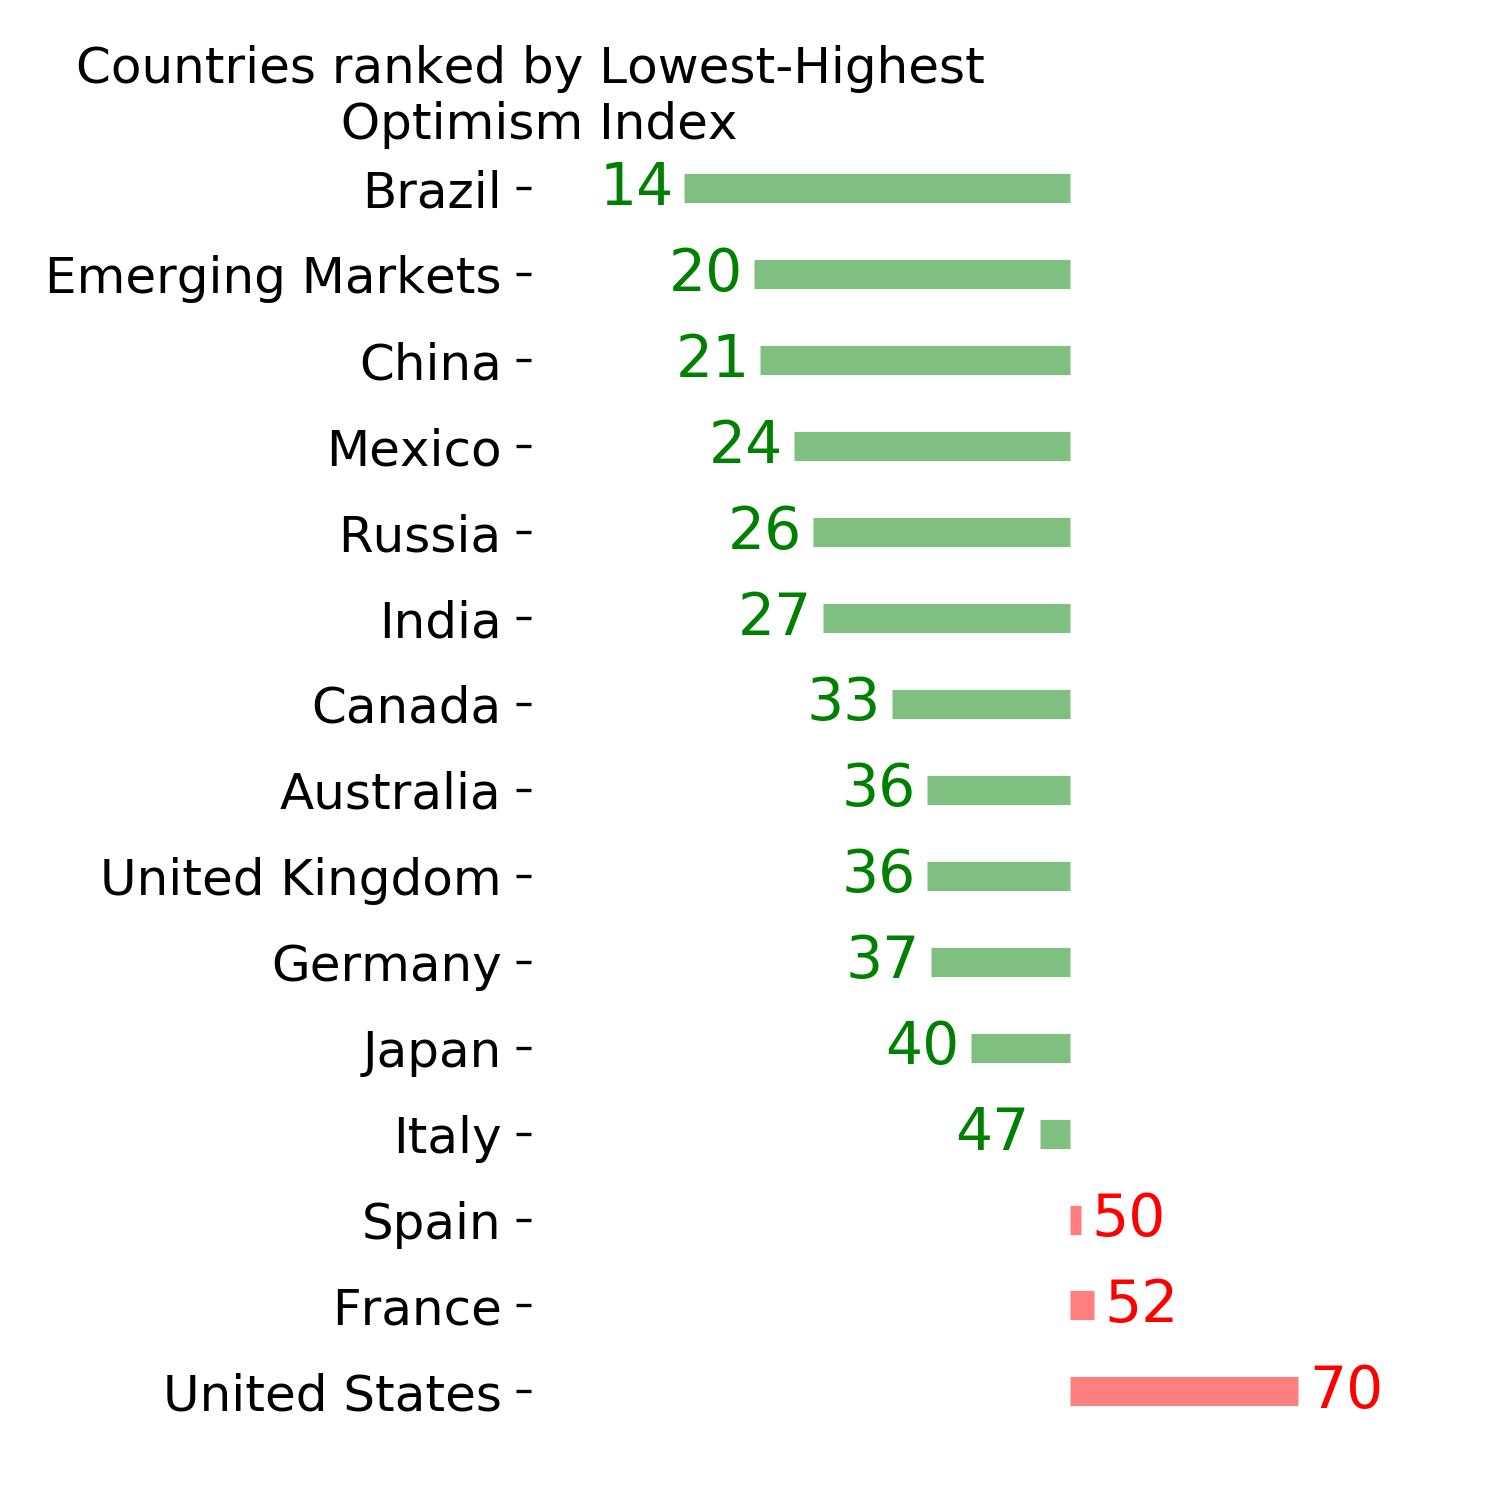
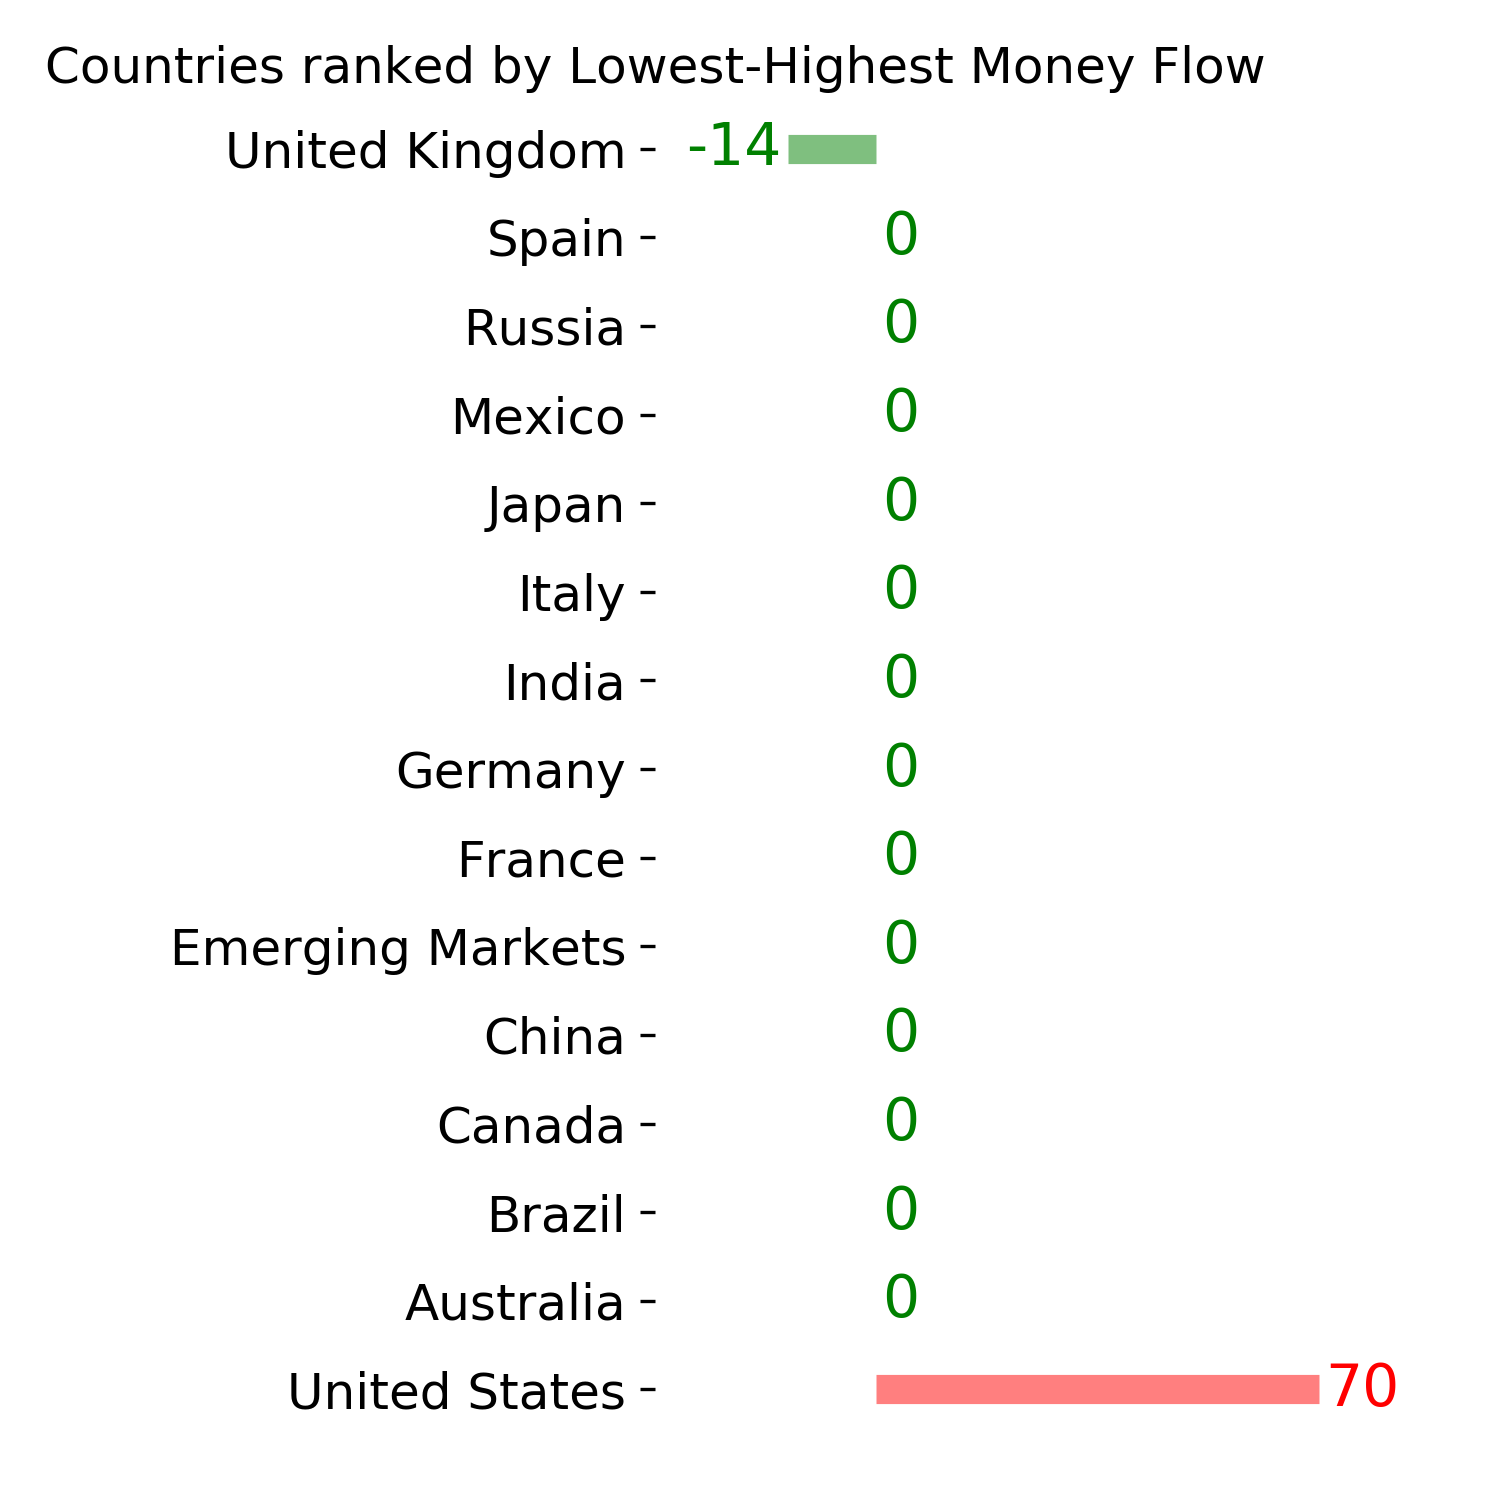
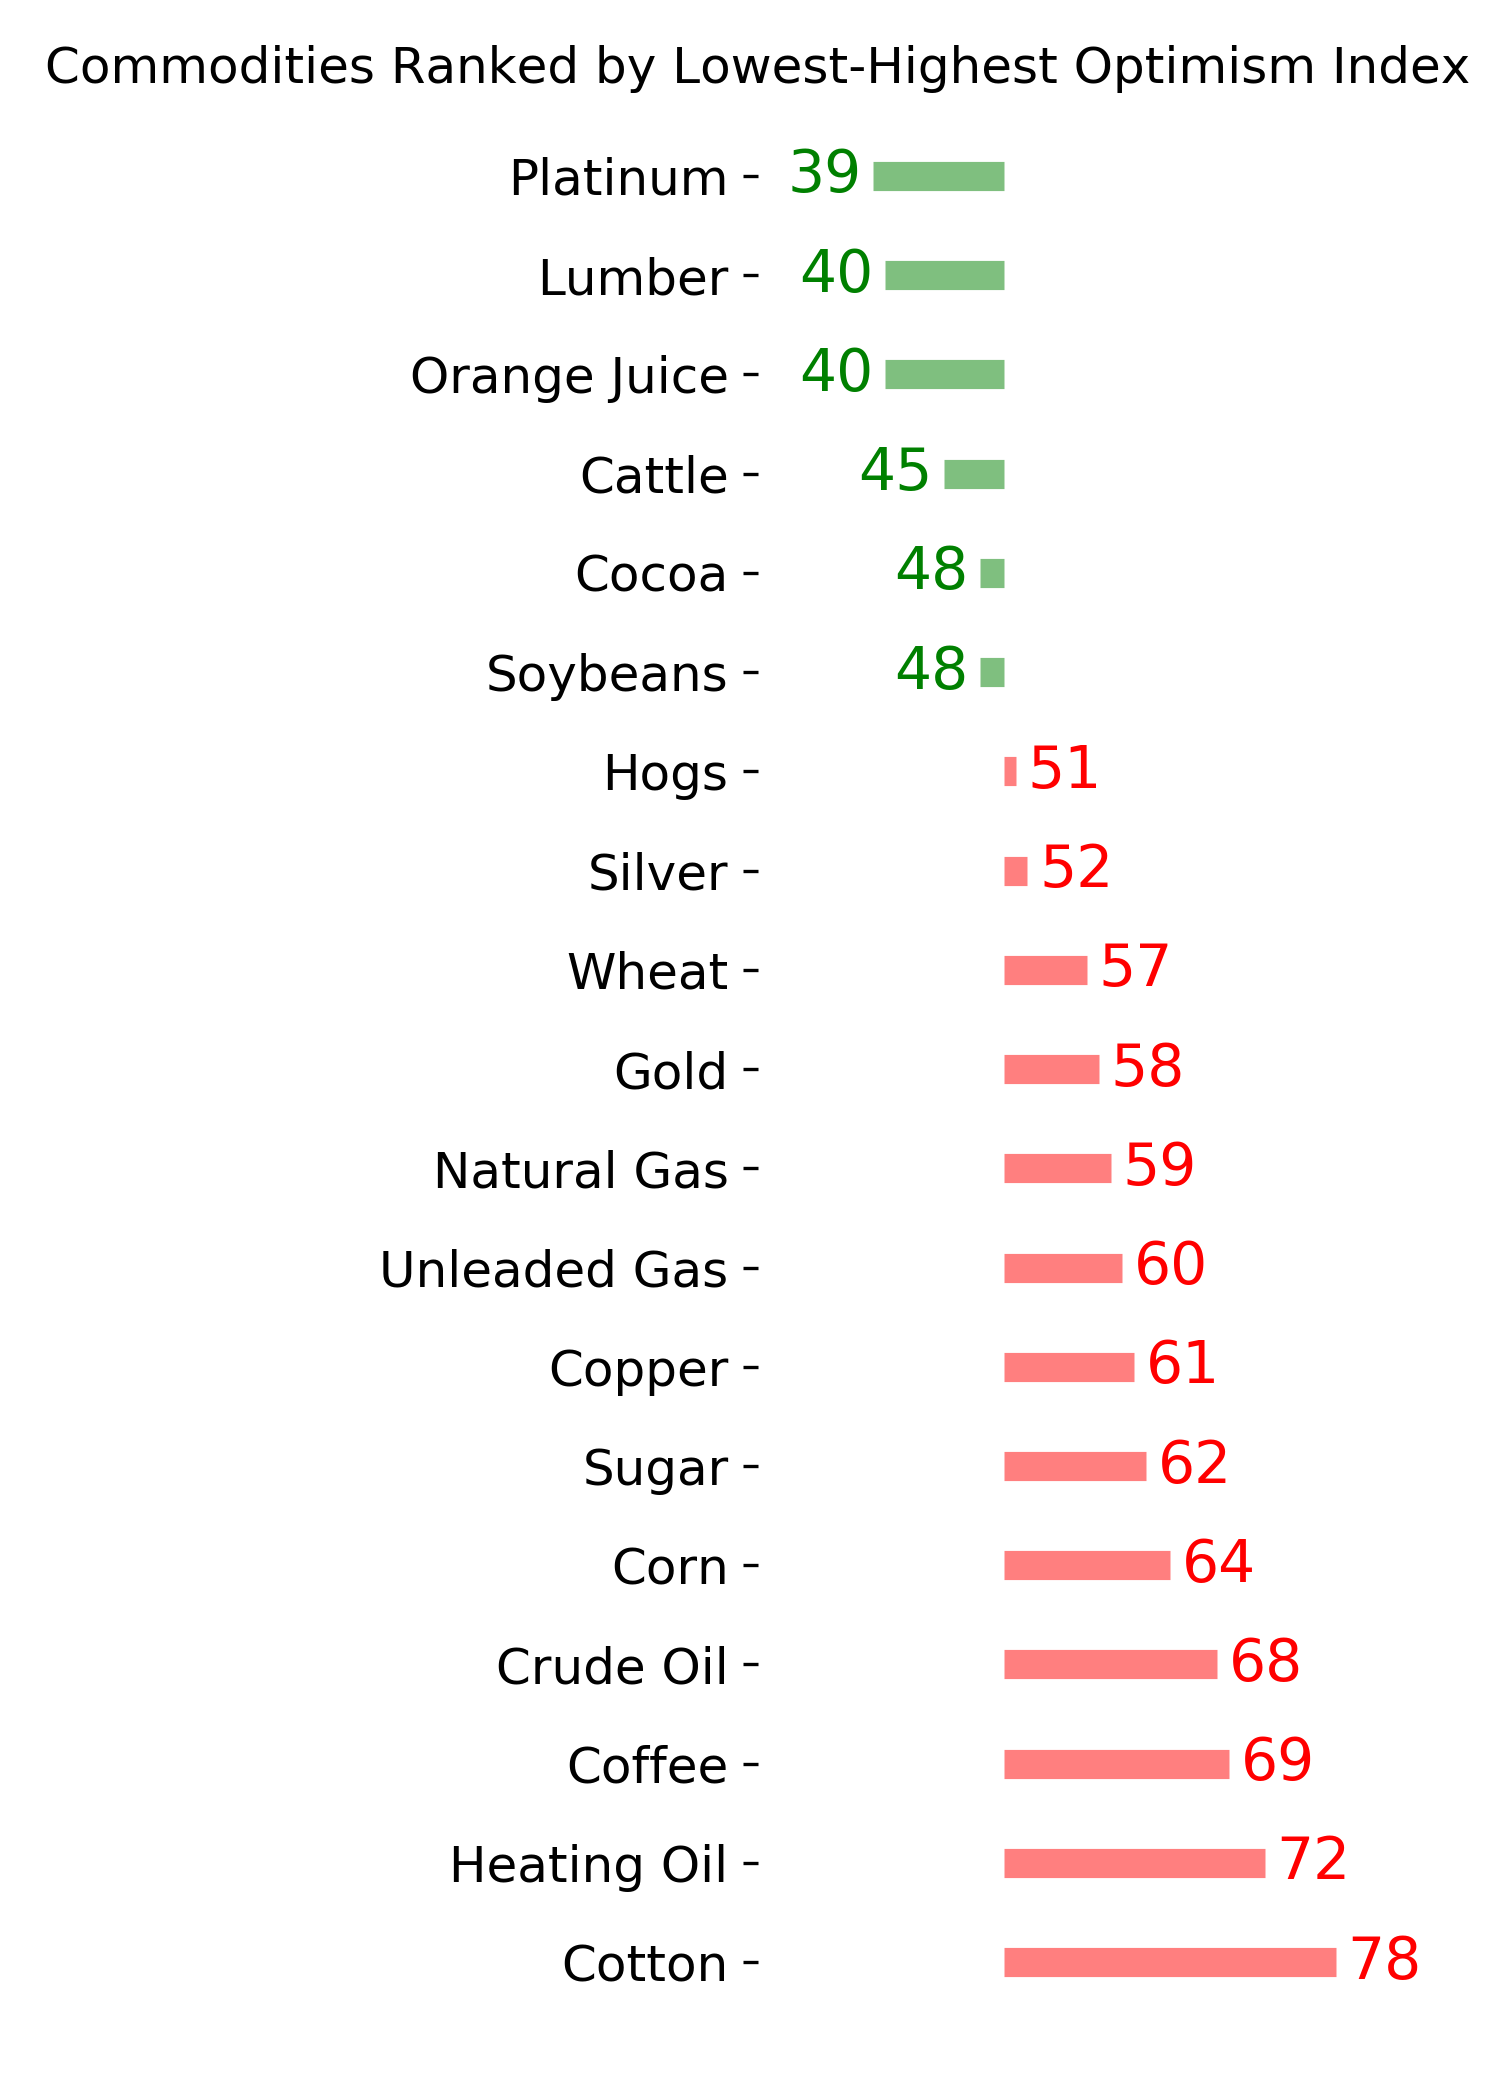
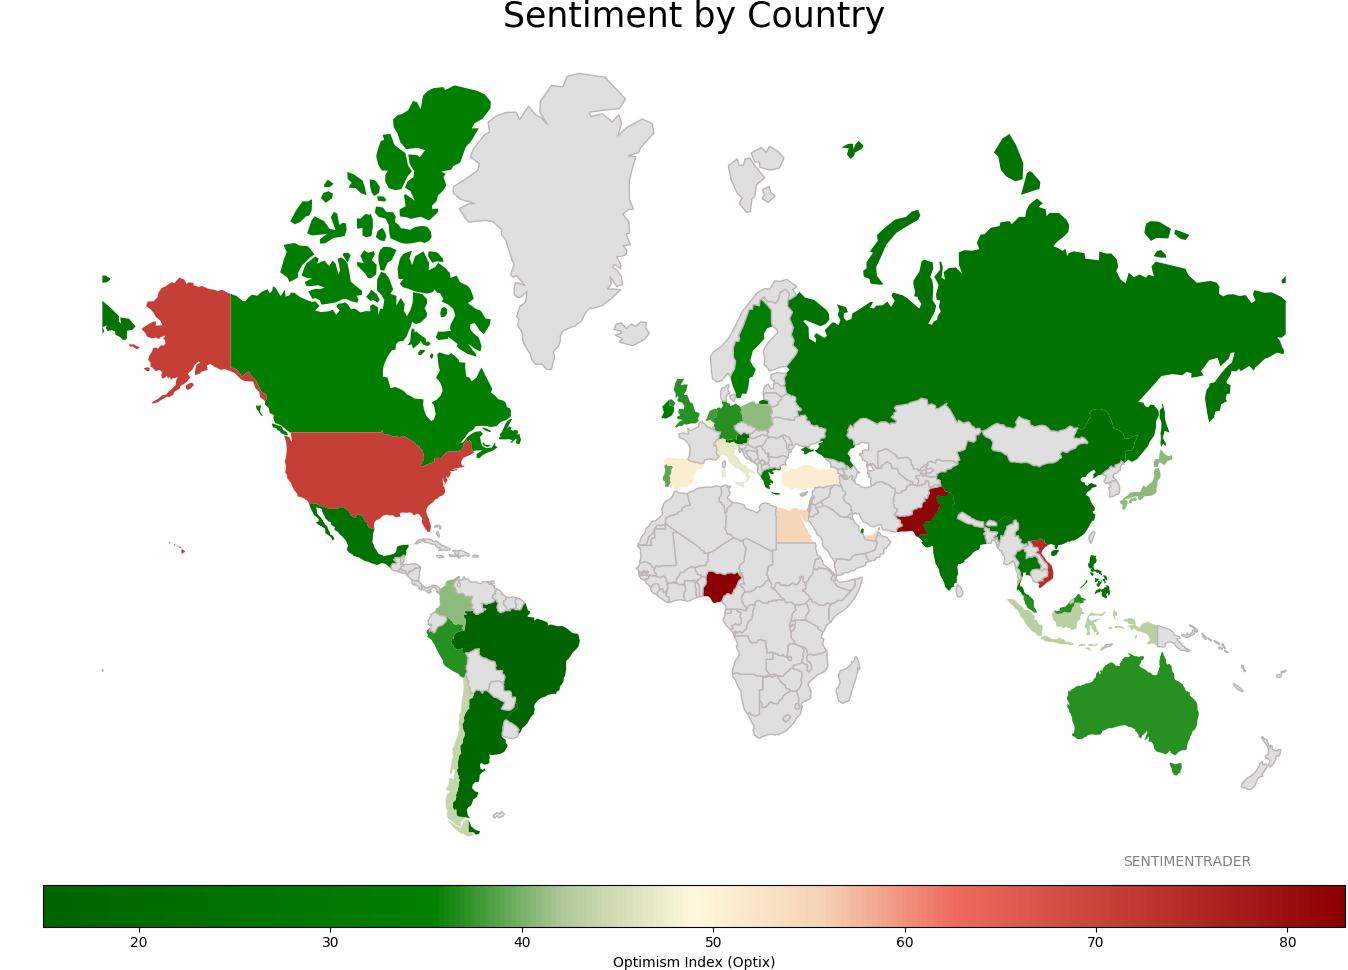
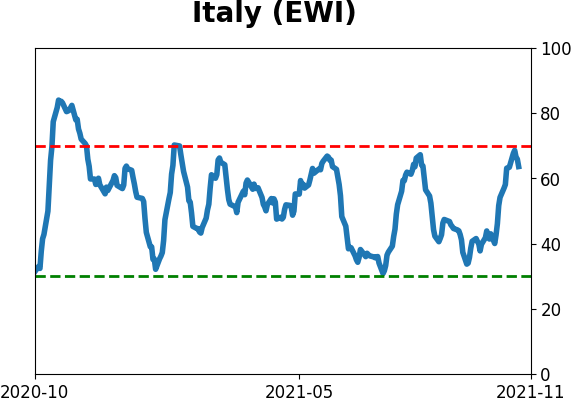
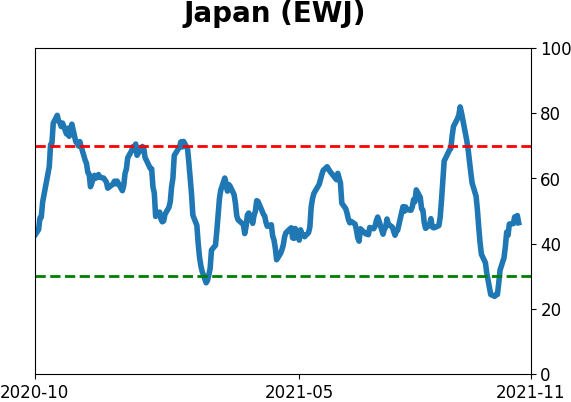
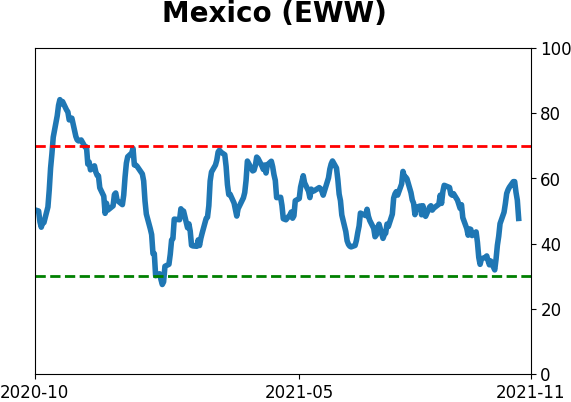
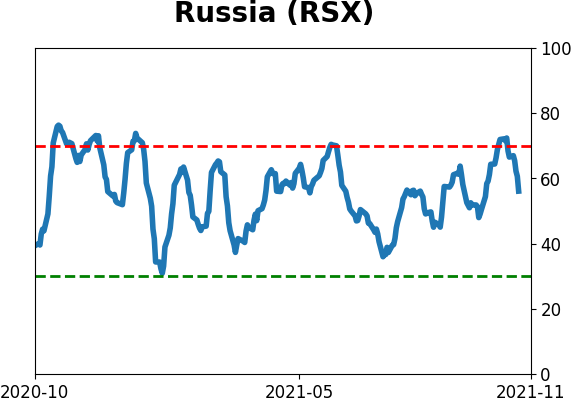
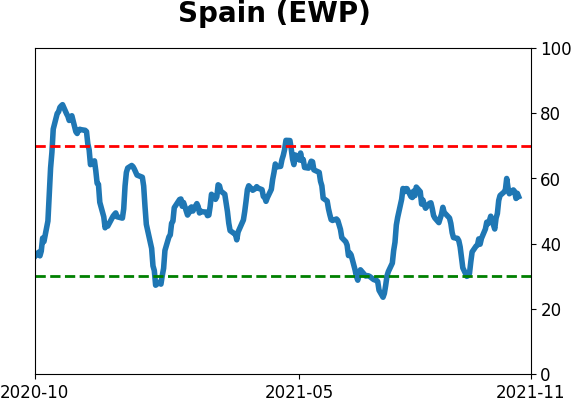
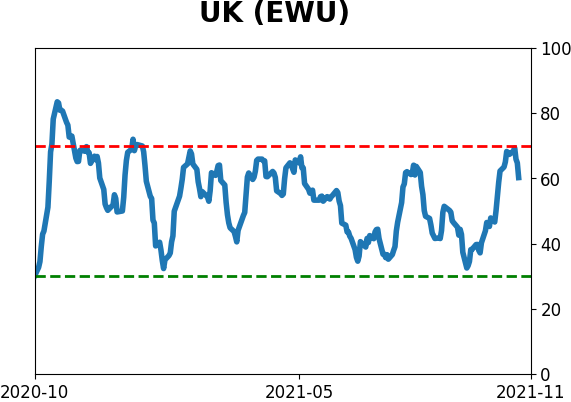
Sentiment Around The World
Optimism Index Thumbnails
|
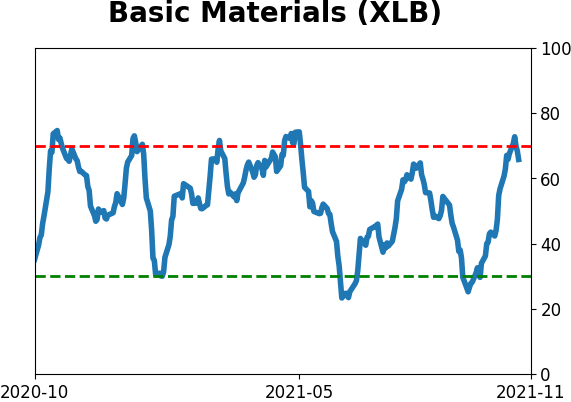
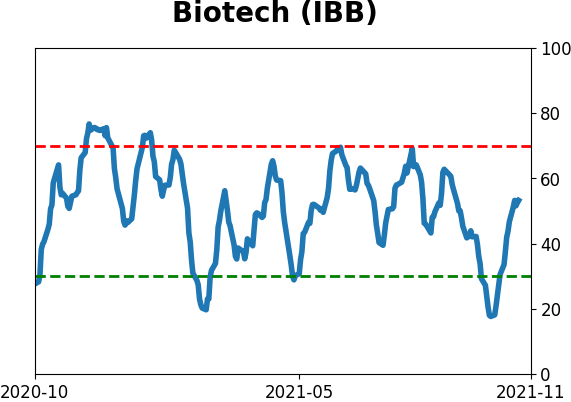
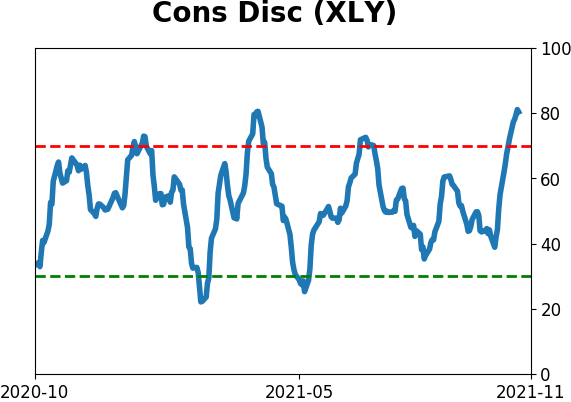
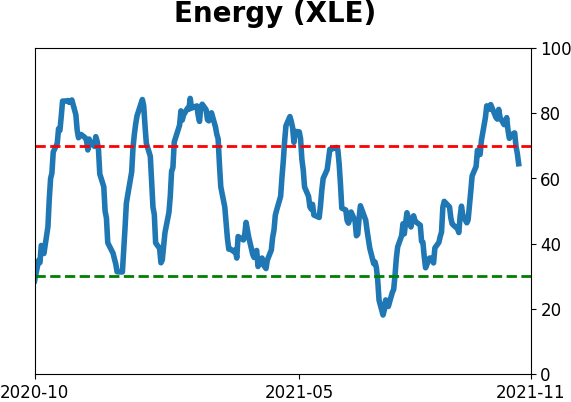
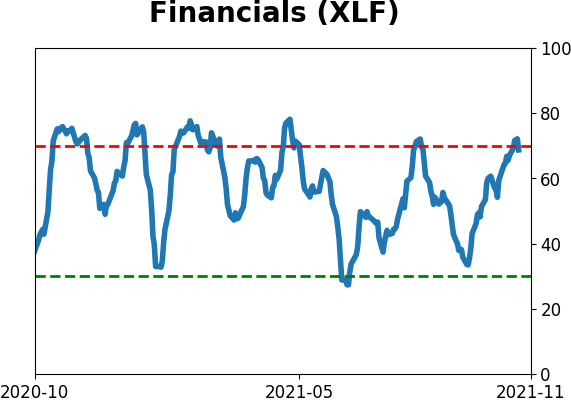
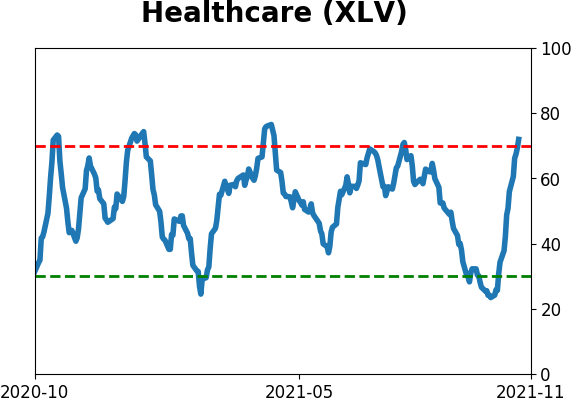
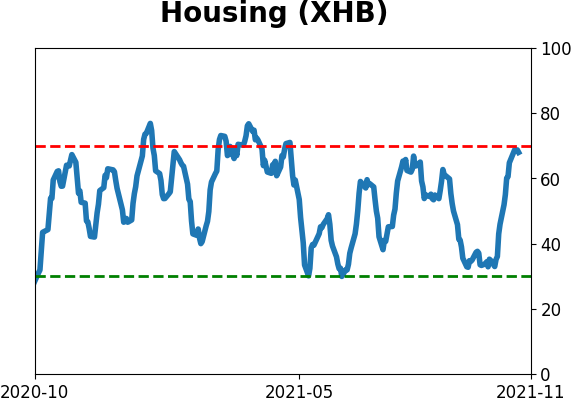
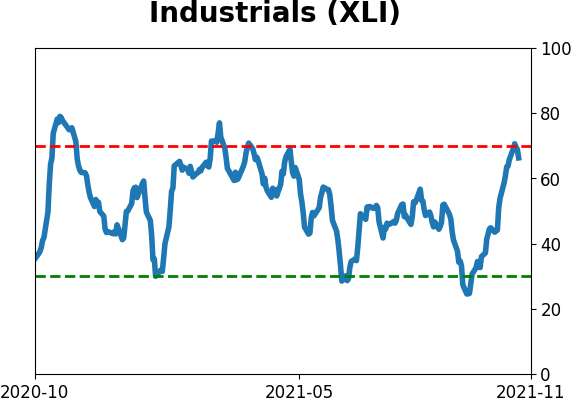
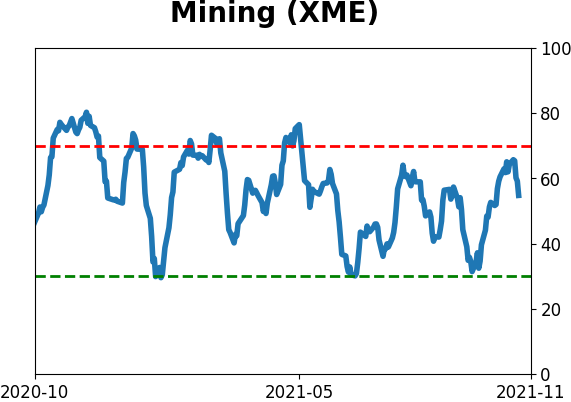
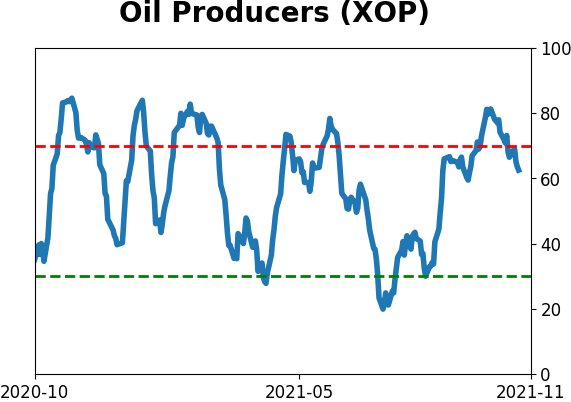
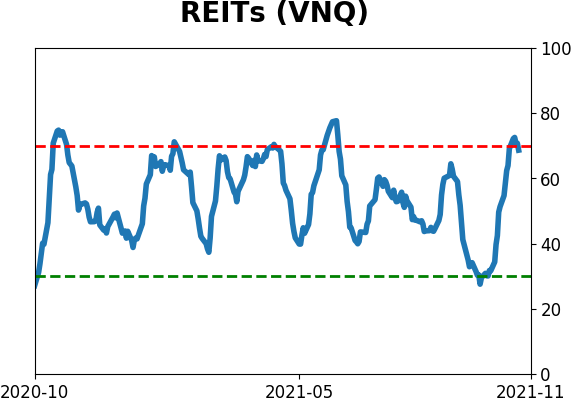
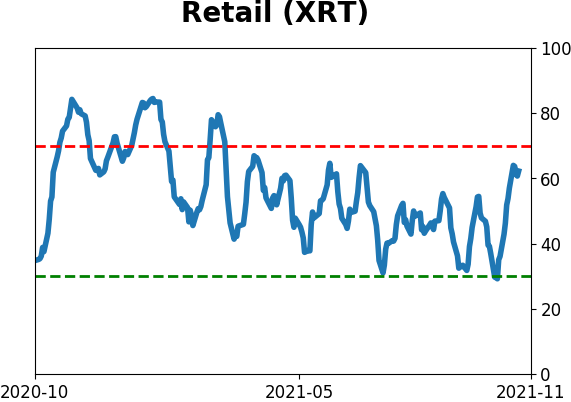
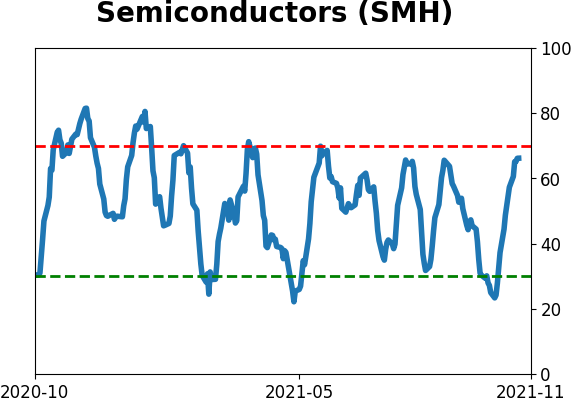
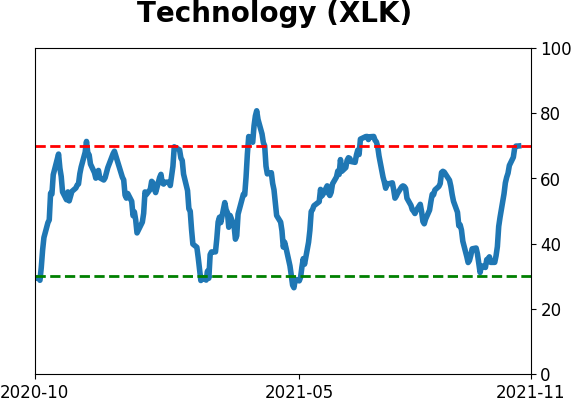
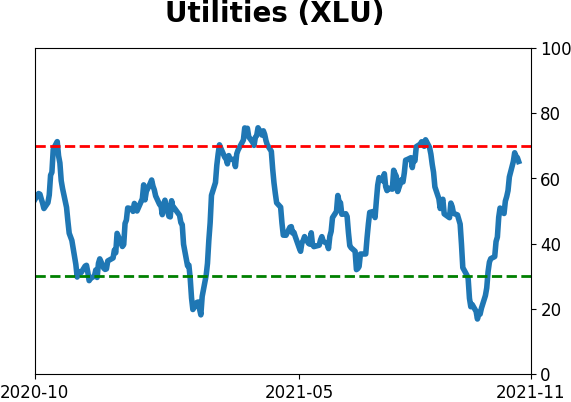
Sector ETF's - 10-Day Moving Average
|
|
|
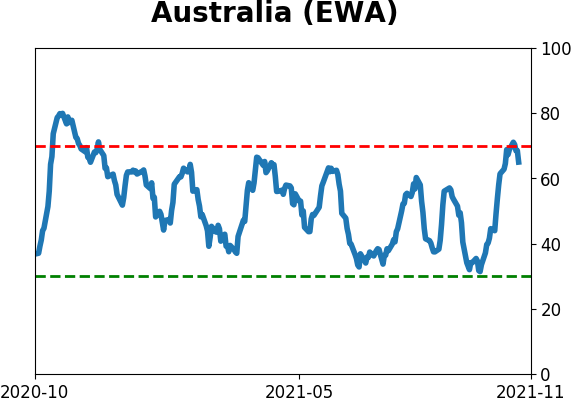
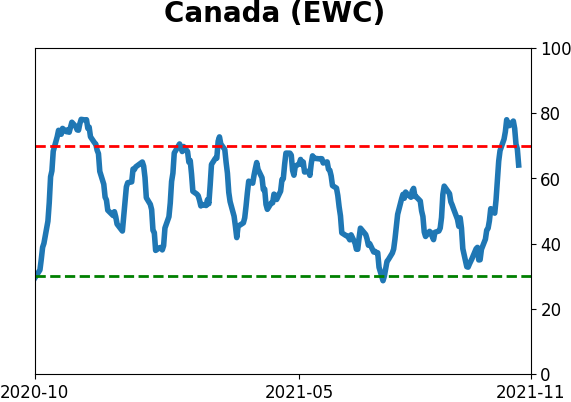
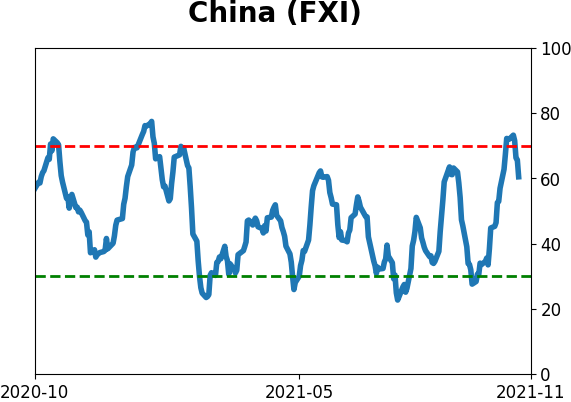
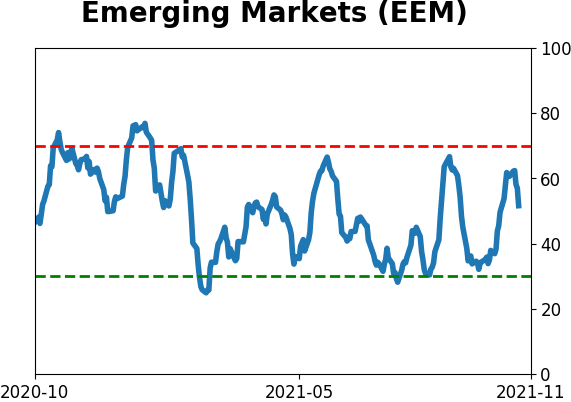
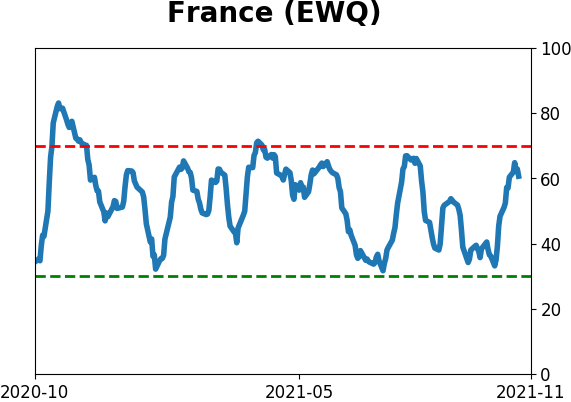
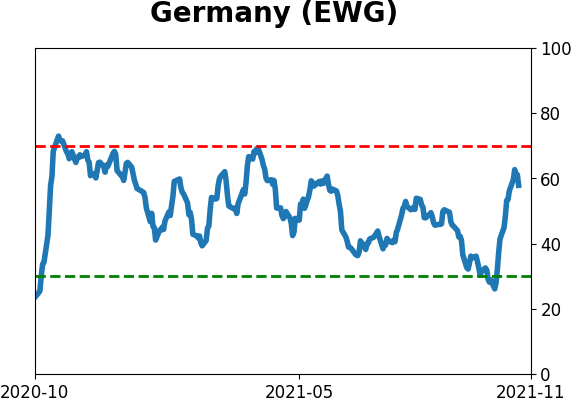
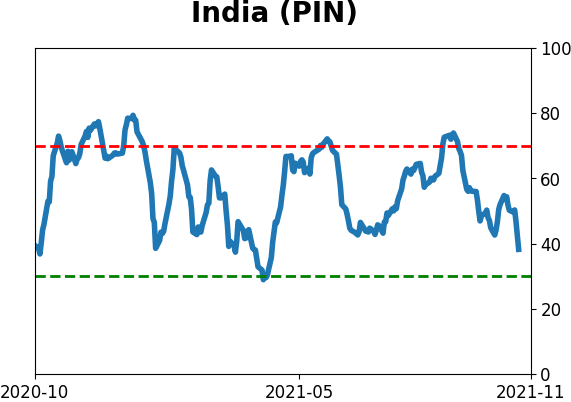
Country ETF's - 10-Day Moving Average
|
|
|
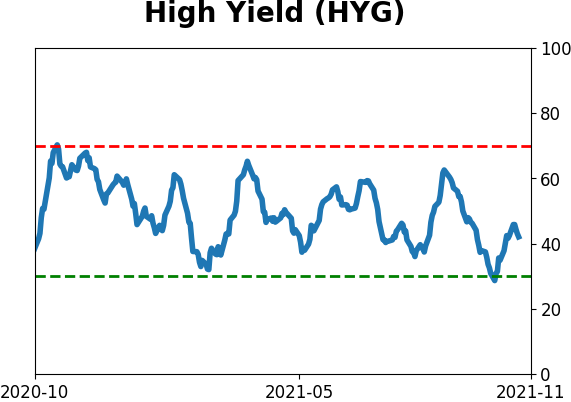
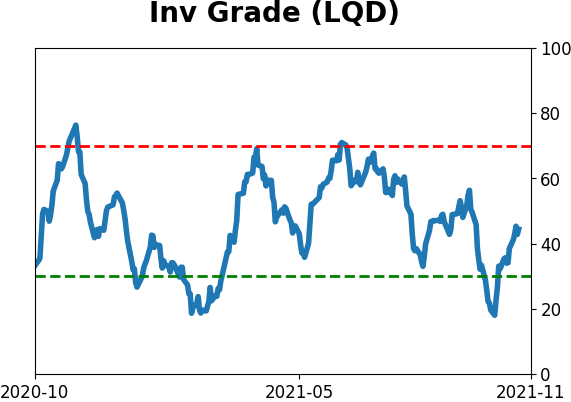
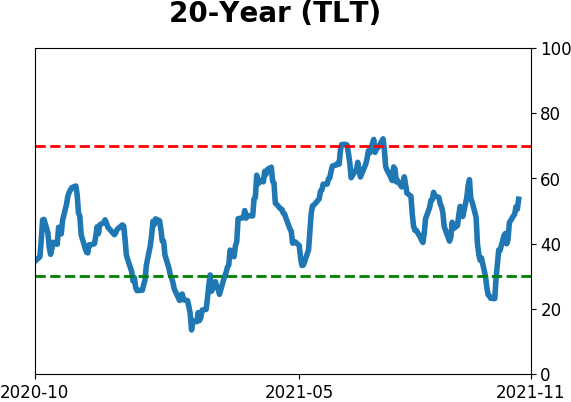
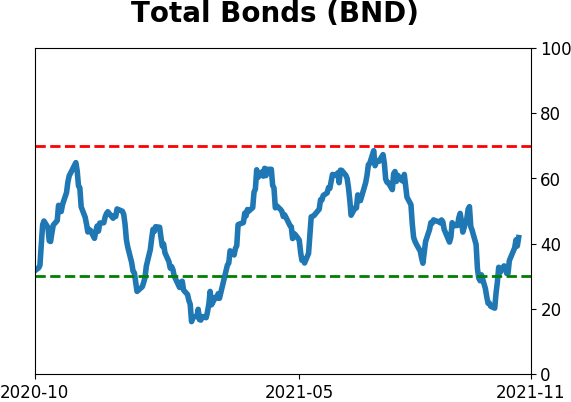
Bond ETF's - 10-Day Moving Average
|
|
|
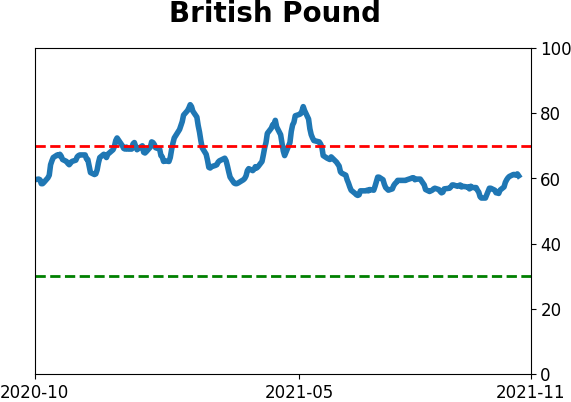
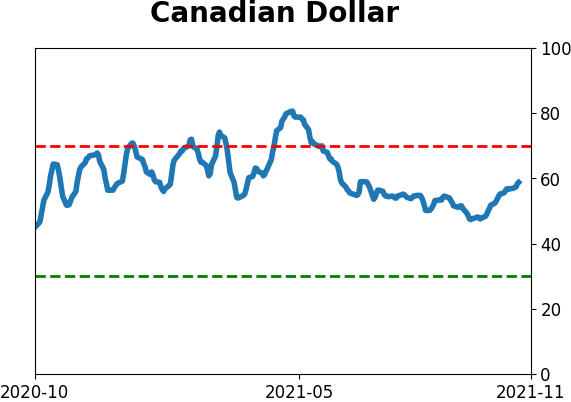
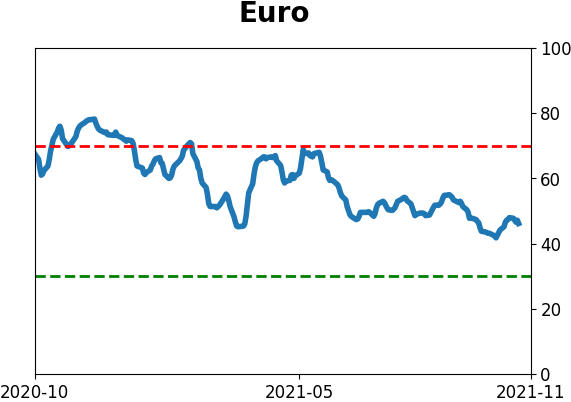
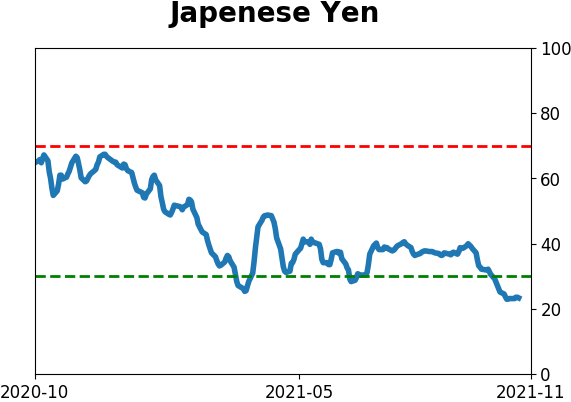
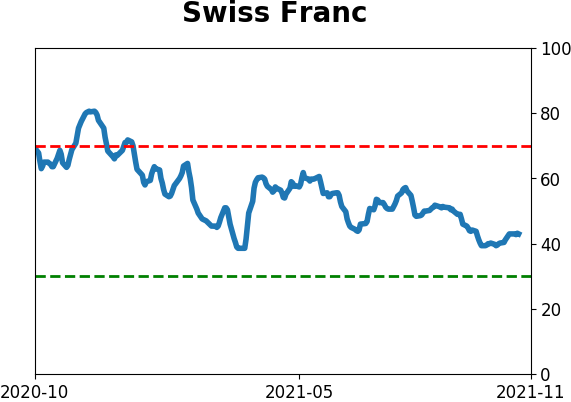
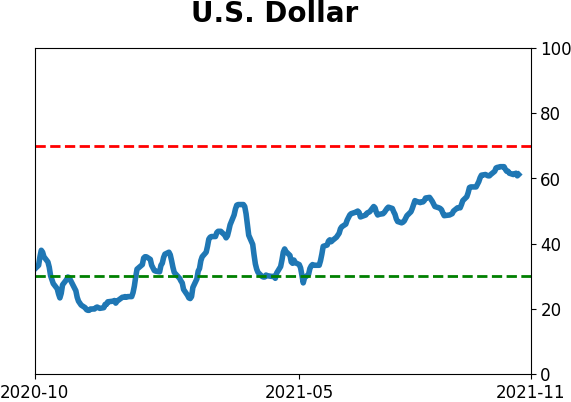
Currency ETF's - 5-Day Moving Average
|
|
|
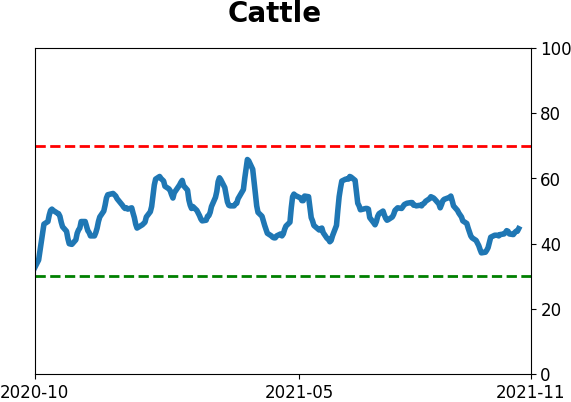
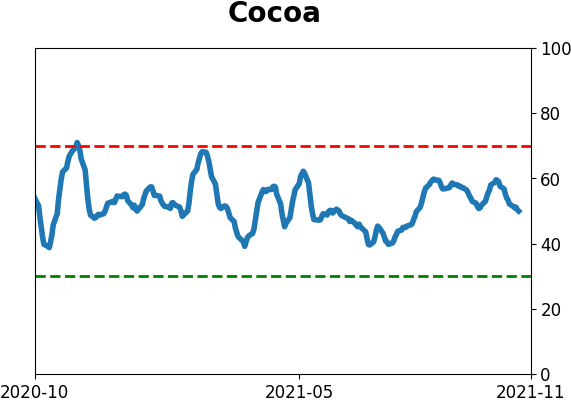
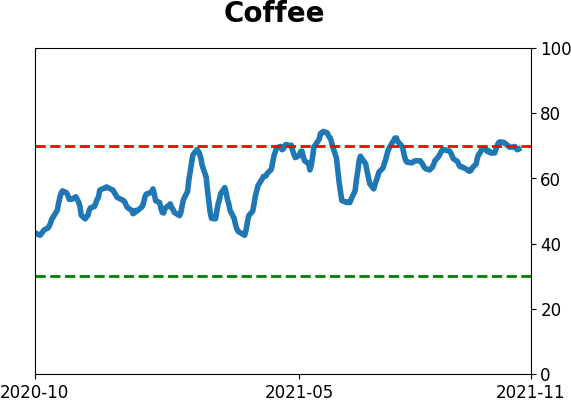
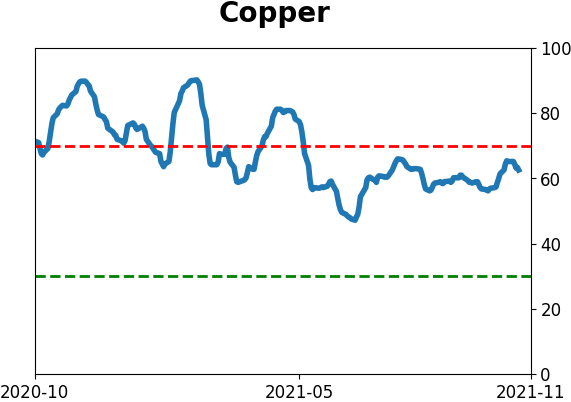
Commodity ETF's - 5-Day Moving Average
|
|