Headlines
|
|
Drawdown in energy stocks is the worst of any sector, ever:
Energy stocks have lost 60% more from their highs than did the broader market. That's the worst of any sector going back to 1928. Usually, a sector's relative losses have stopped at about 35%. Other times a sector's investors suffered that much relative to the S&P 500, it outperformed over the next 1-3 years.
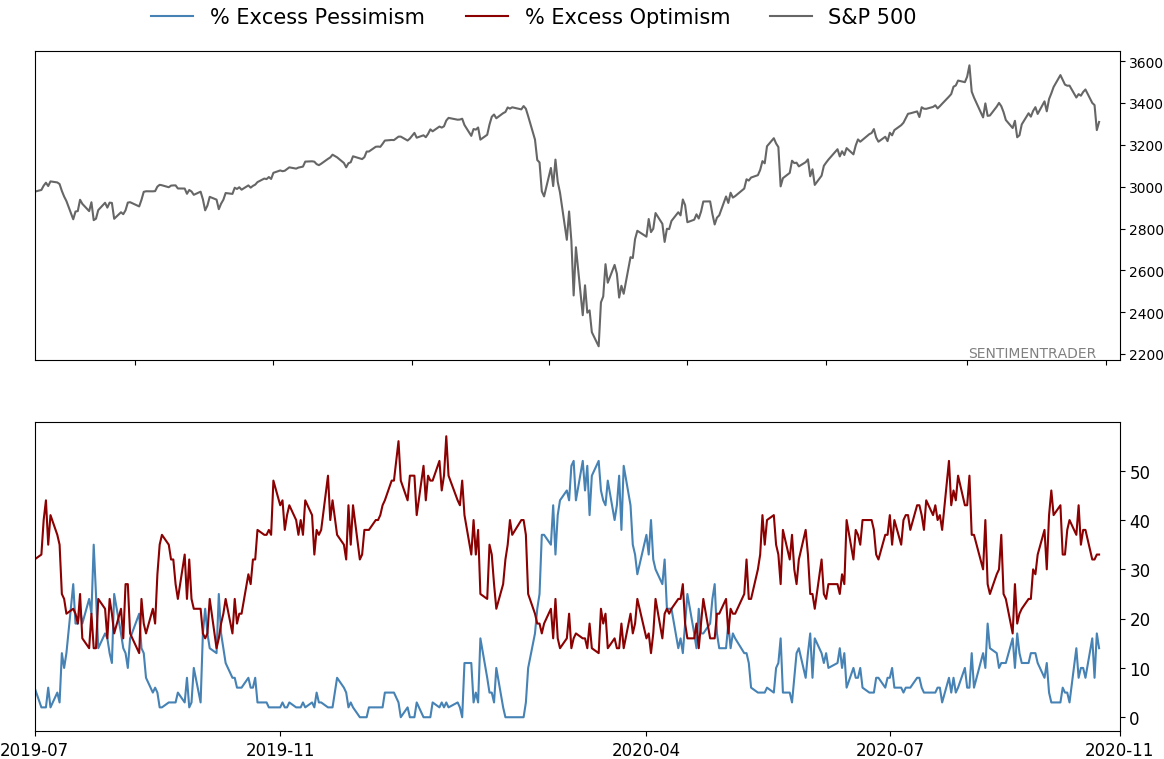
That was fast: A day after "fear" rose enough to push the VIX above 40, it fell back below. This shows that traders are only flirting with the potential for a sustained rout - most major declines see volatility spike and then stay high until the panic subsides. It's not foolproof, as it preceded big losses in September 2008 and March of this year. But 3 months later, only 1 out of 25 signals showed a loss greater than -3% in the S&P 500.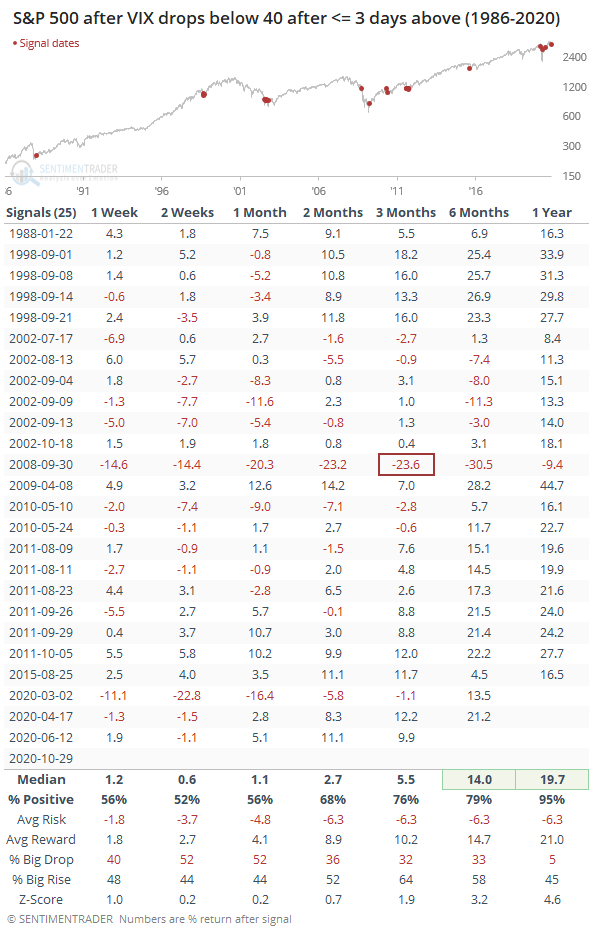
Bottom Line:
- A positive environment favors becoming aggressive on signs of excessive pessimism.
|
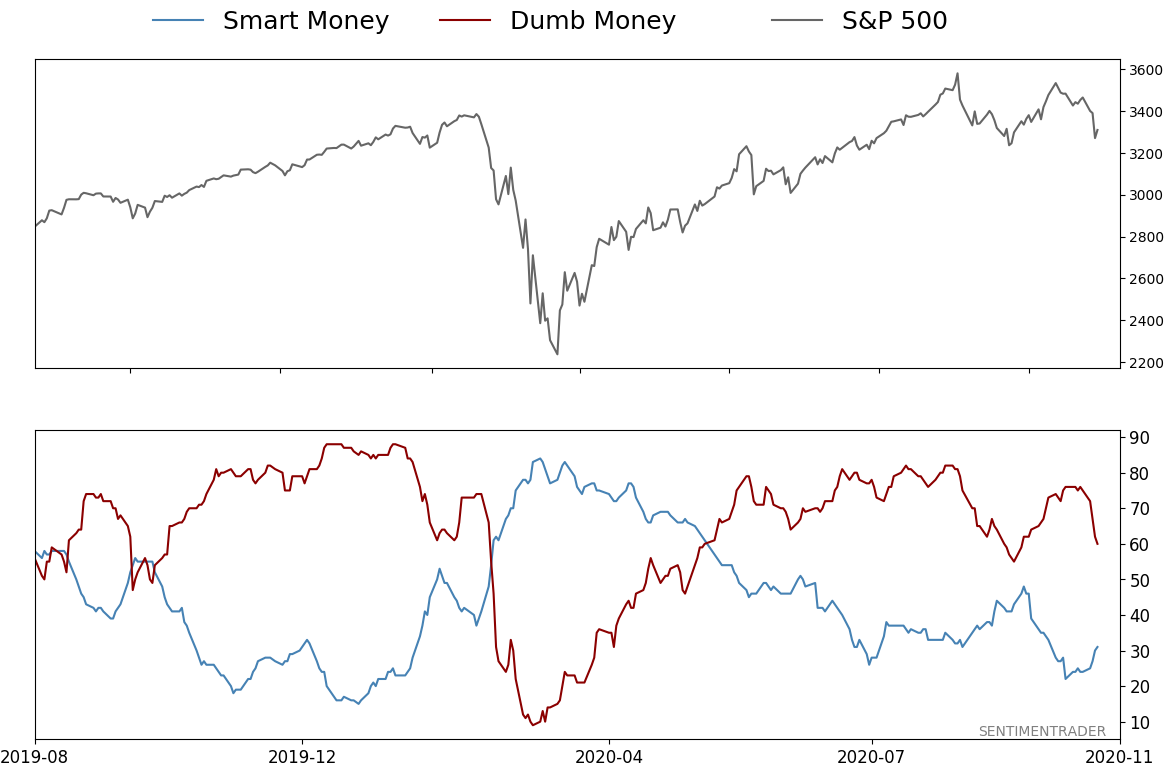
Smart / Dumb Money Confidence
|
Smart Money Confidence: 31%
Dumb Money Confidence: 60%
|
|
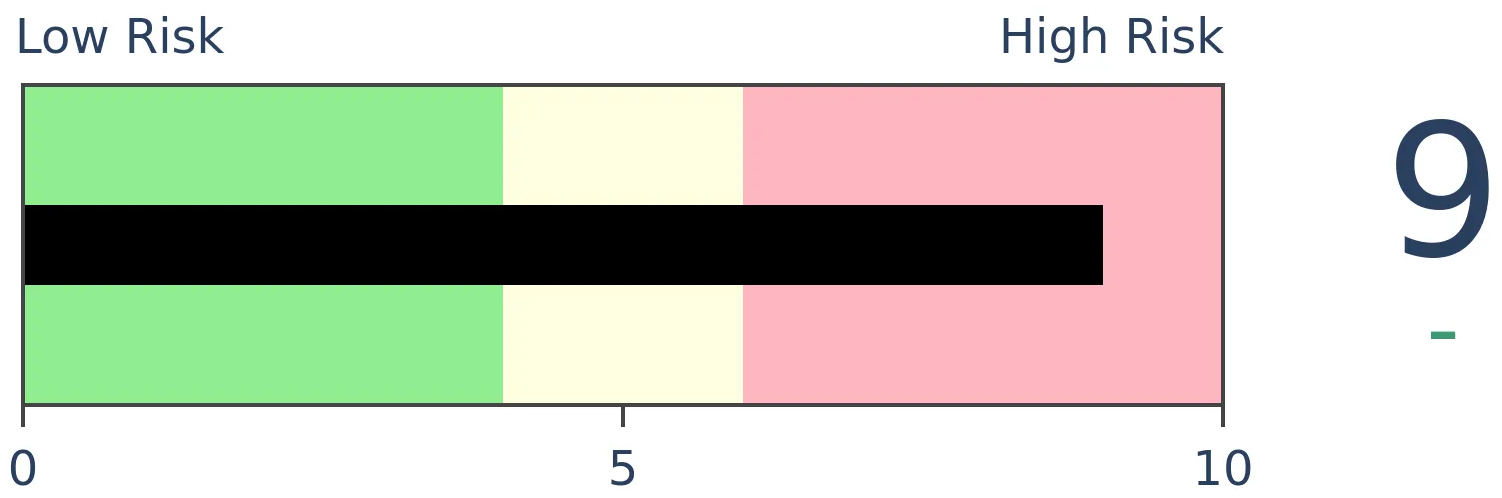
Risk Levels
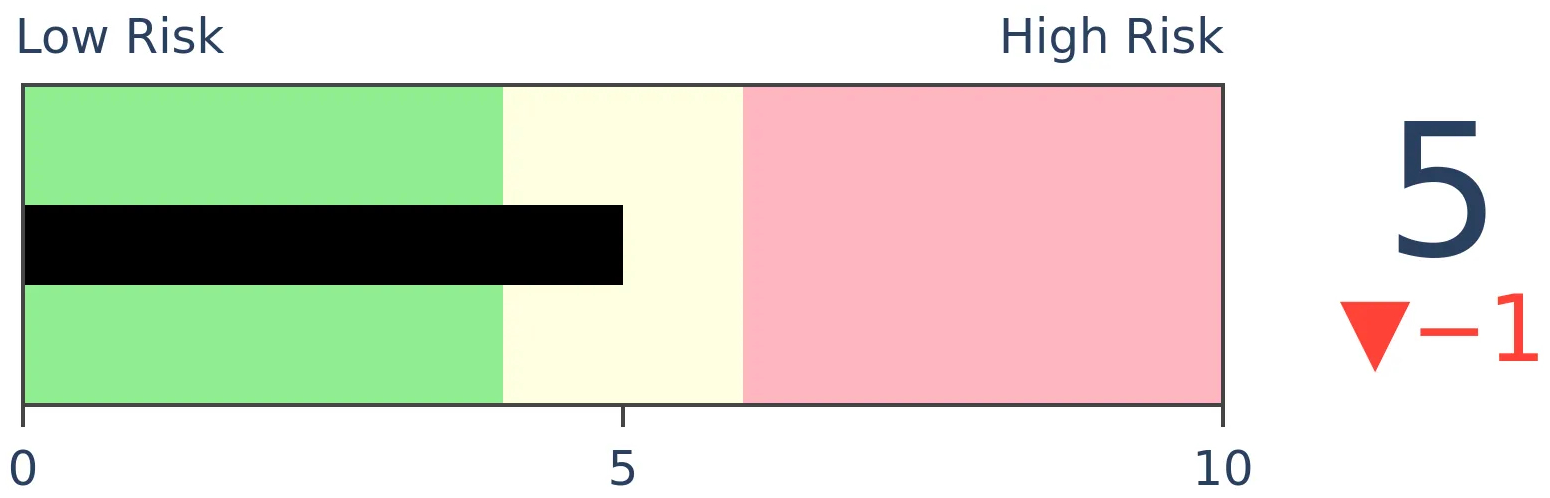
Stocks Short-Term
|
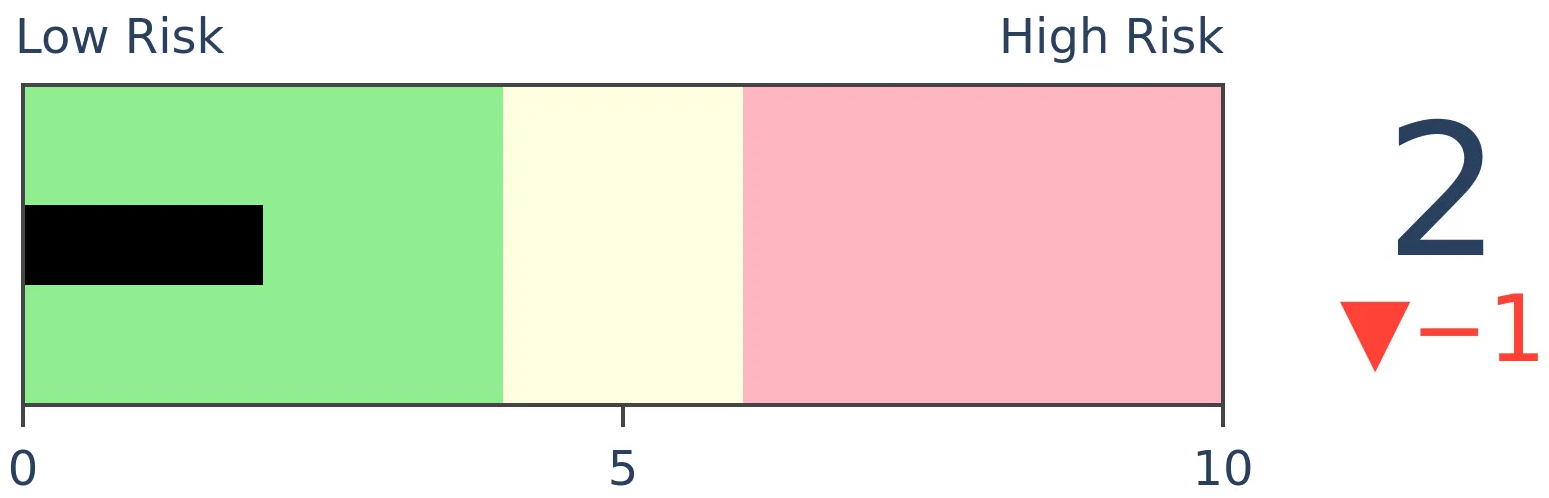
Stocks Medium-Term
|
|
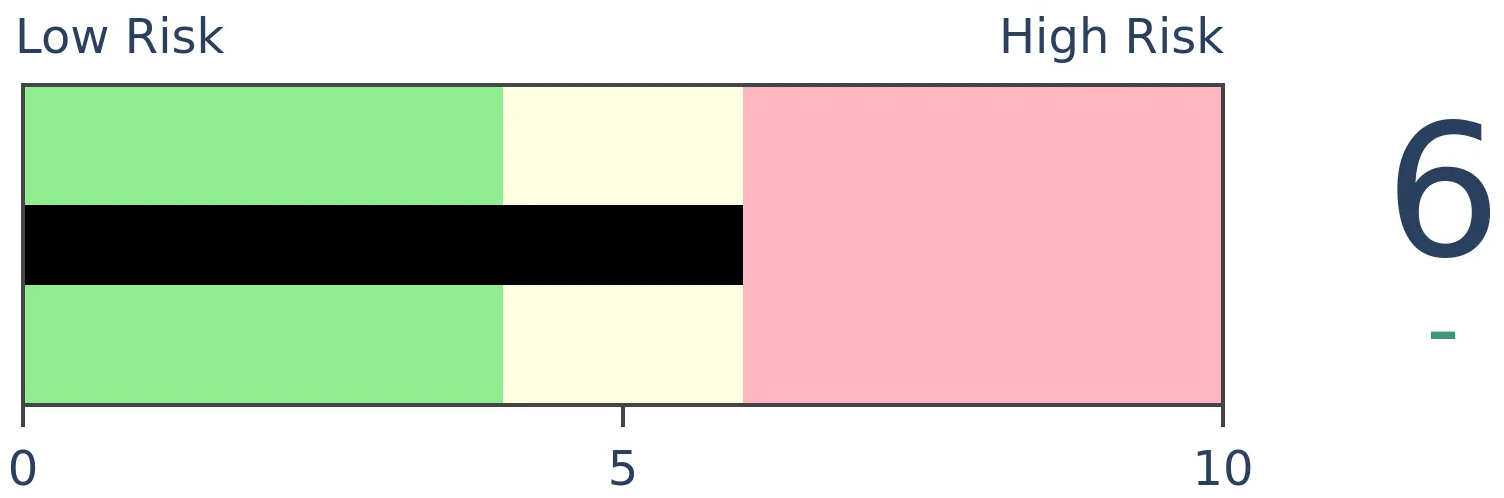
Bonds
|
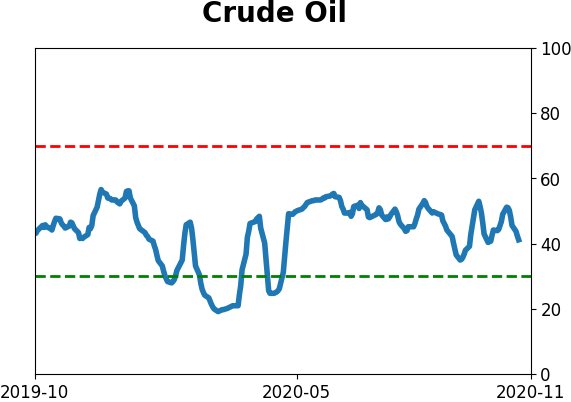
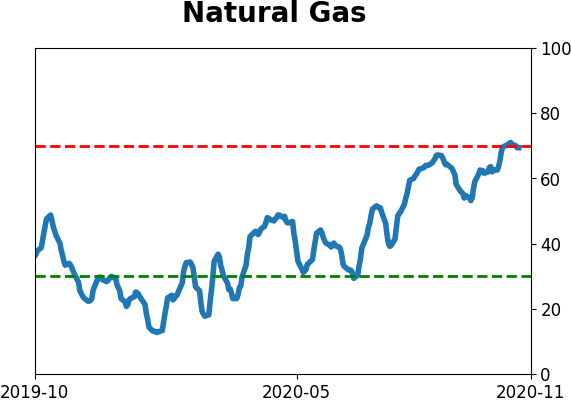
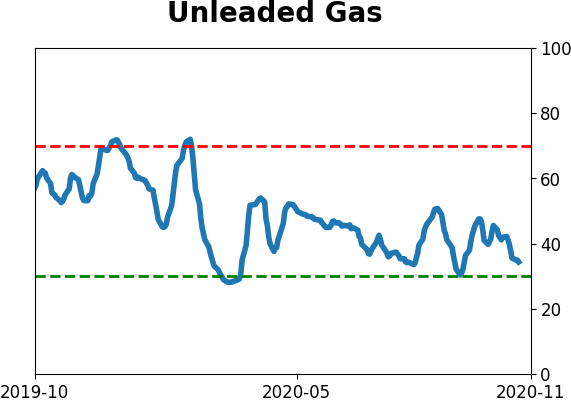
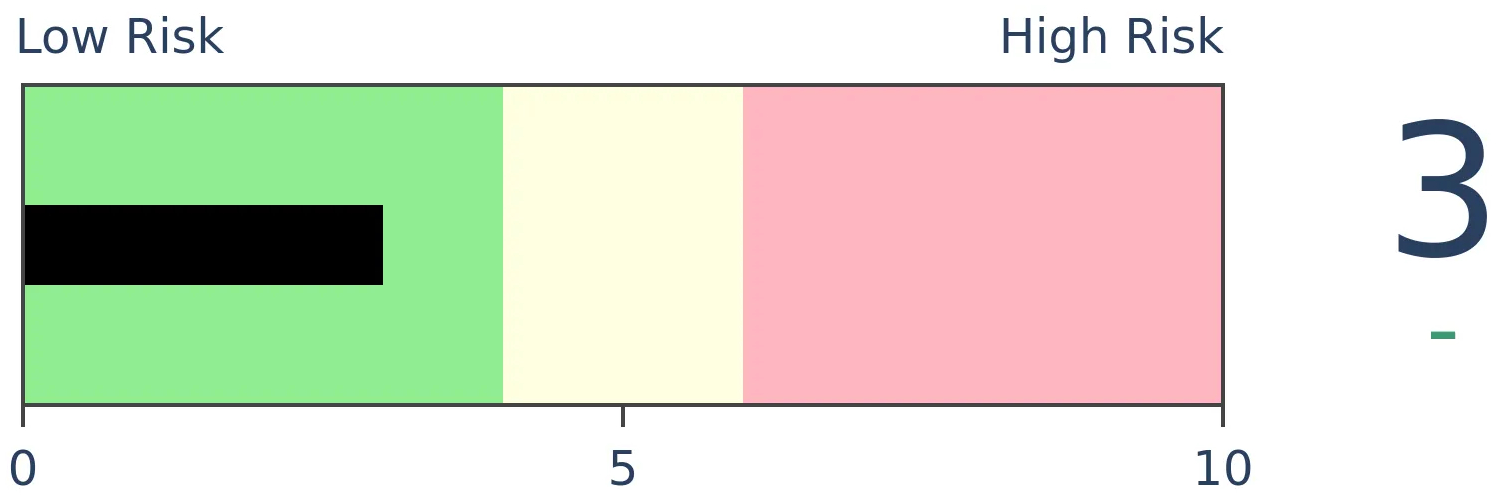
Crude Oil
|
|
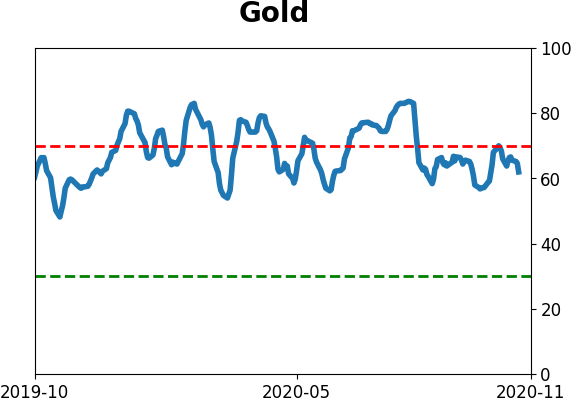
Gold
|
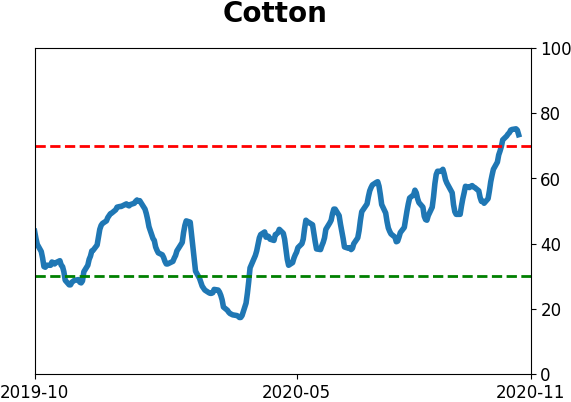
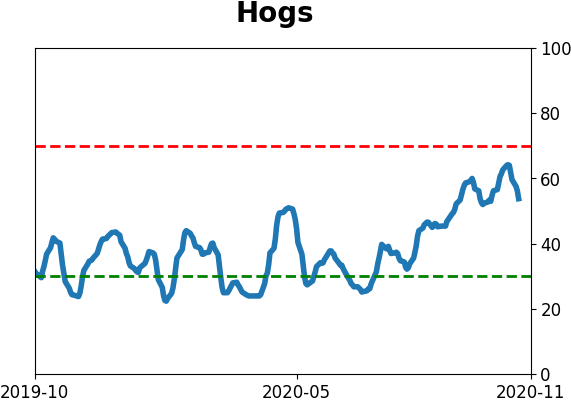
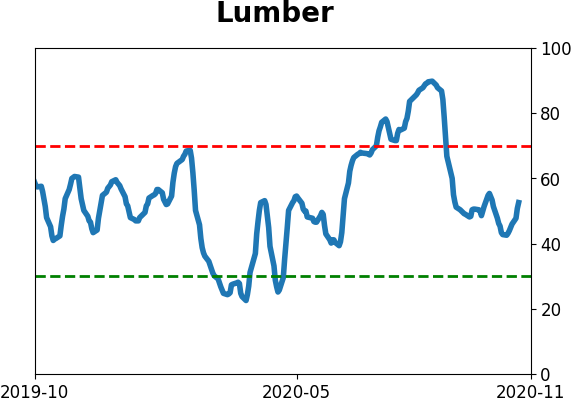
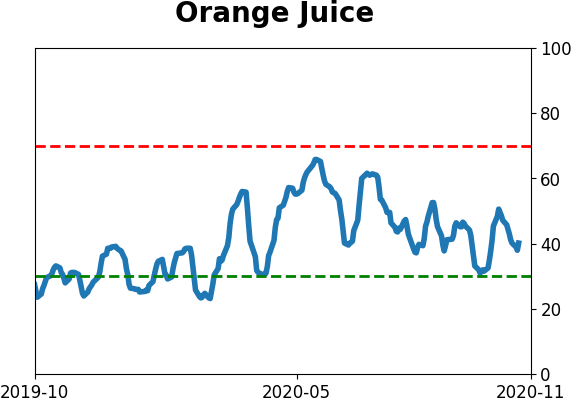
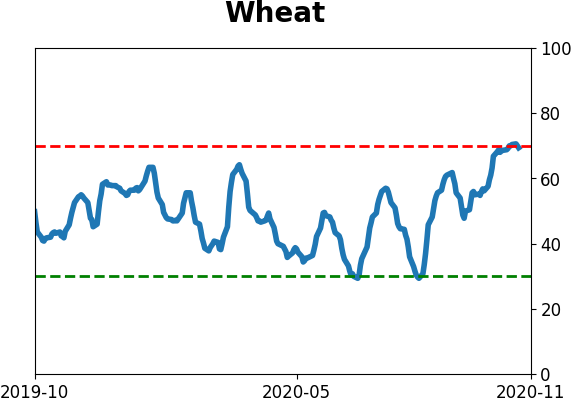
Agriculture
|
|
Research
BOTTOM LINE
Energy stocks have lost 60% more from their highs than did the broader market. That's the worst of any sector going back to 1928. Usually, a sector's relative losses have stopped at about 35%. Other times a sector's investors suffered that much relative to the S&P 500, it outperformed over the next 1-3 years.
FORECAST / TIMEFRAME
None
|
There have been two themes that got renewed interest this week, both dealing with drawdowns. The energy sector, and the value factor, have suffered massive losses relative to other sectors and factors, respectively.
We've already seen that energy has been one of the most consistently losing sectors out of any sector since 1928. It's also suffered one of the largest drawdowns. Looking at each sector's maximum loss from its latest multi-year peak can be instructive, but it's better to look at it relative to the drawdown of the broader S&P 500 index.
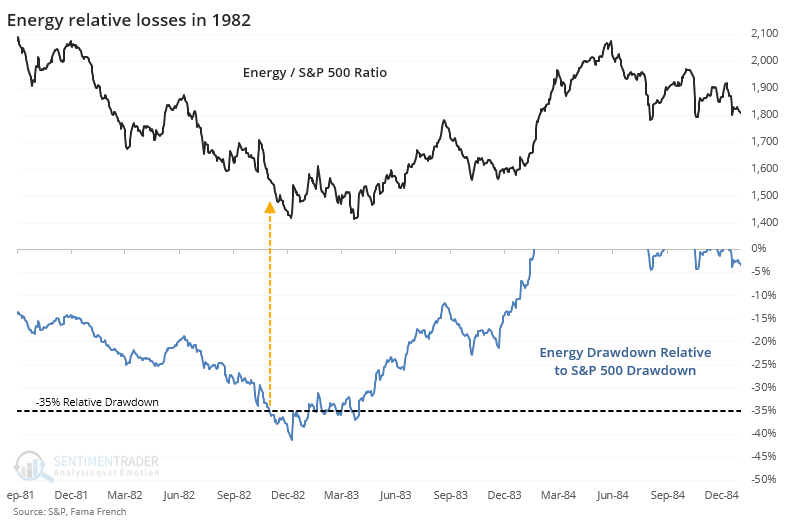
The charts below show just that. To be clear, this is each sector's maximum decline from a 3-year high, minus the drawdown in the S&P 500 index. So, it shows losses that investors suffered beyond what they would have been exposed to in the broader market.
From the charts, we can see that it's unusual for any sector over the past 90 years to suffer a drawdown that was 35% more than the drawdown in the S&P...except for energy's current malaise.
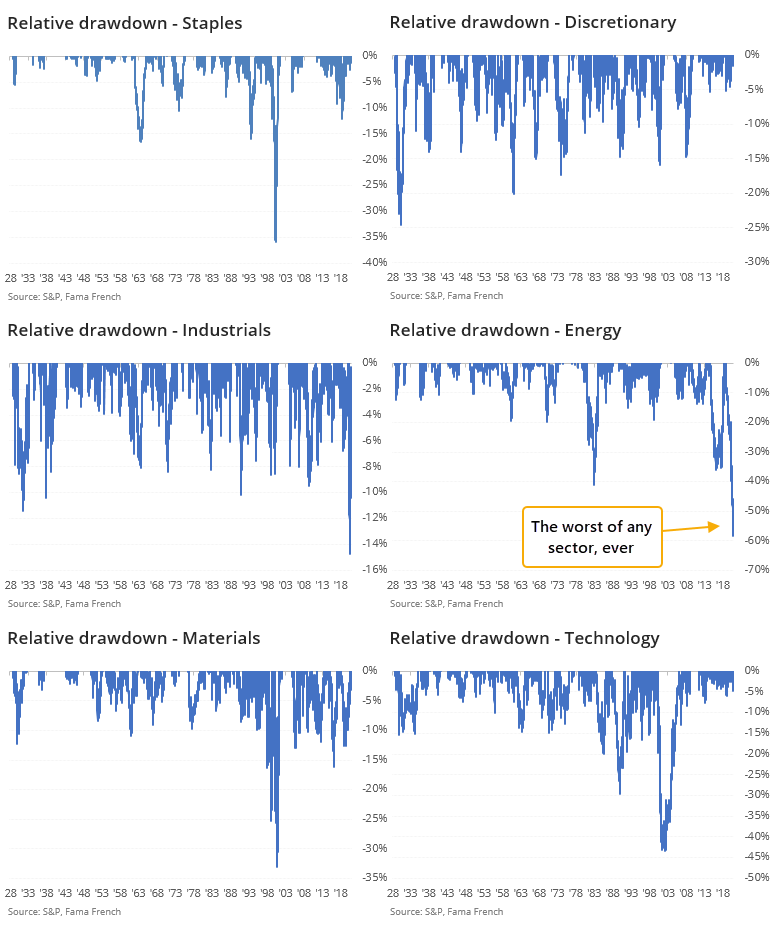
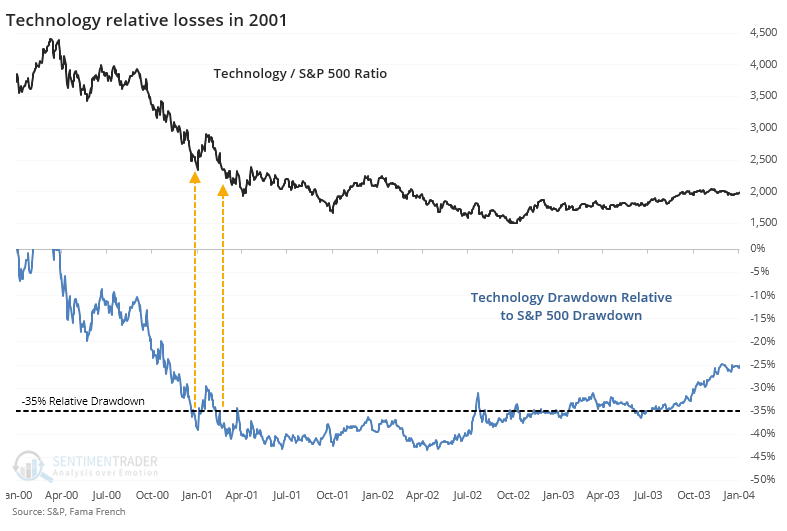
The current drawdown in energy is now about 60% more than the S&P's, by far the worst of any sector in history. It exceeds the relative losses in tech after the internet bubble burst and devastation in financials following the Great Financial Crisis. Below, we zoom in on each individual sector once its relative drawdown neared or exceeded -35%.
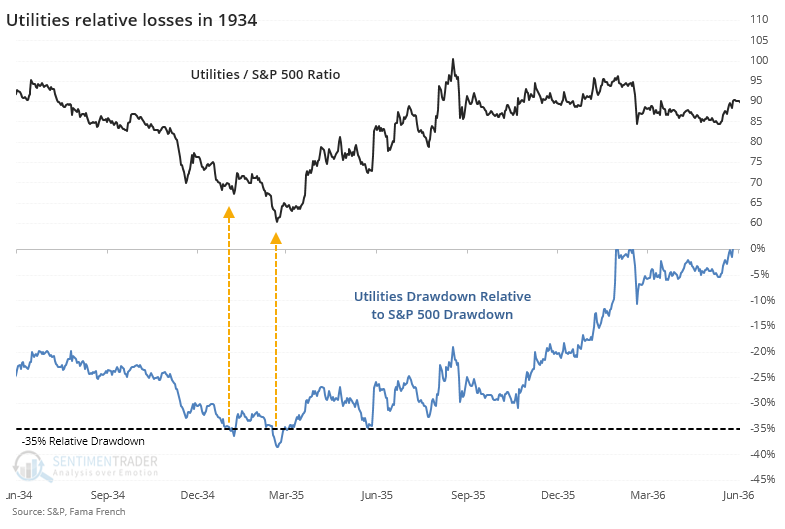
When utilities suffered this much in 1934, the ratio of that sector to the broader S&P turned and went on a year-long recovery.
The only other time when energy dropped 35% more than the broader market was in 1982, which preceded a little more weakness, then years of outperformance.
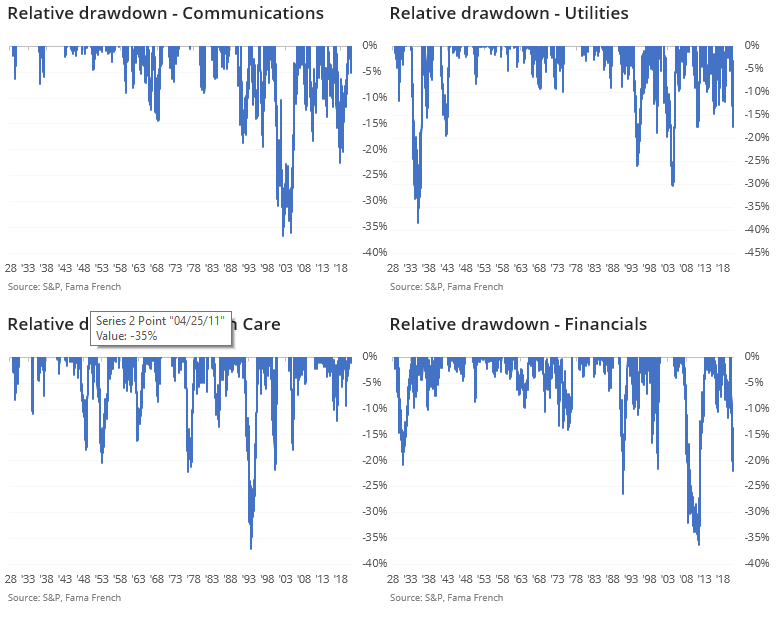
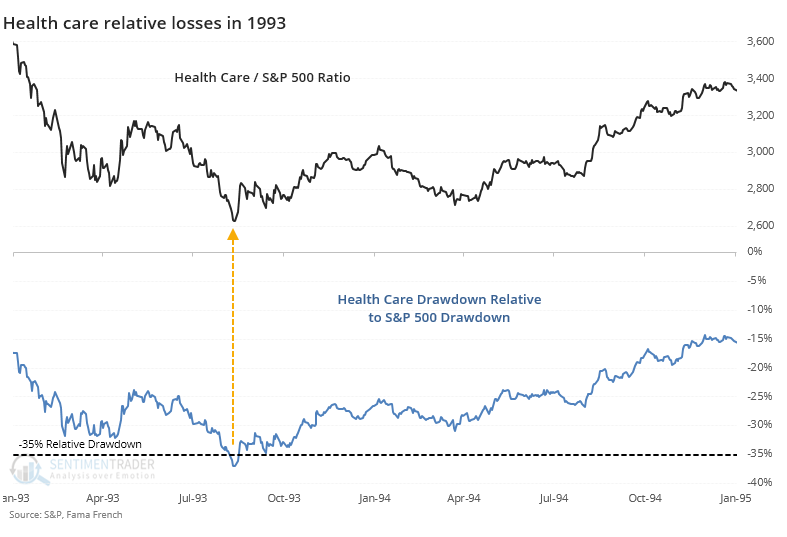
Health care stocks suffered relative devastation in 1993, which marked the bottom for that sector versus the broader market.
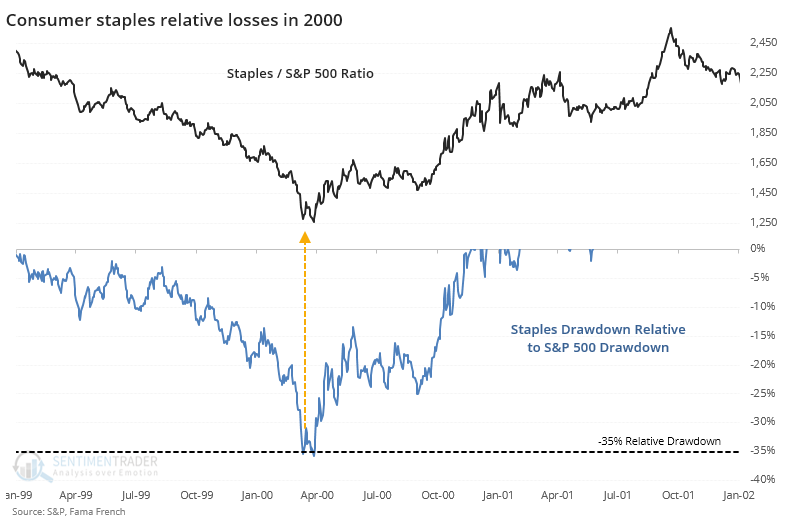
When staples fell this much relative to the broader market in 2000, they turned immediately and enjoyed massive outperformance.
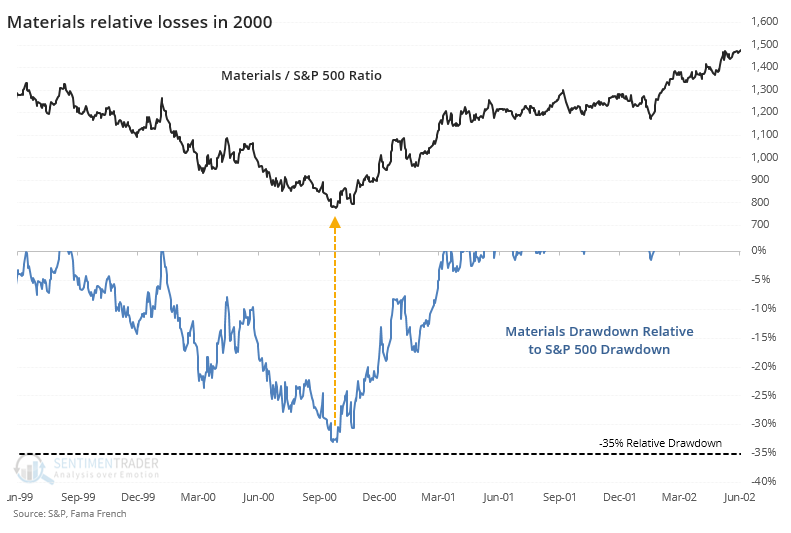
Materials stocks didn't quite fall more than 35% than the broader market in 2000, but got close, and then outperformed.
When tech stocks first dropped 35% more than the broader market in 2001, they briefly rebounded, then fell into a much more prolonged malaise.
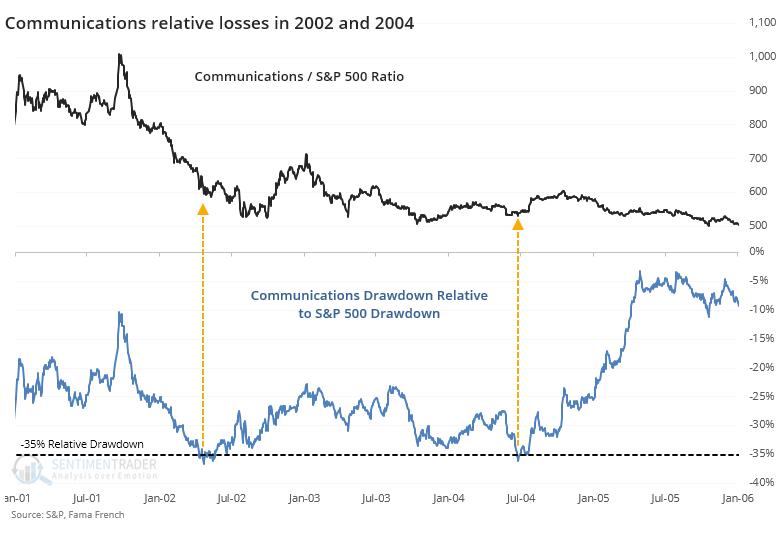
Communication stocks mostly stabilized or outperformed once their relative drawdowns exceeded 35%.
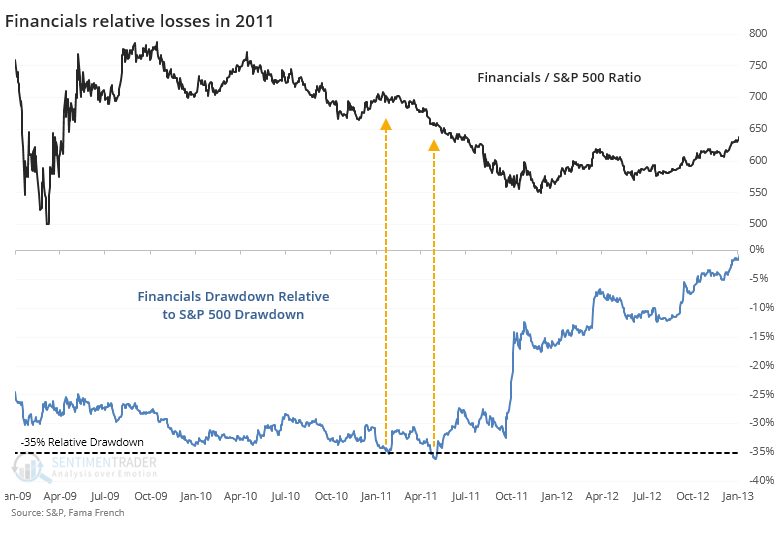
Financials got hit hard during the financial crisis, but their relative losses weren't 35% worse than the broader market's until 2011. Unlike other sectors, this did not lead to outperformance in the year(s) ahead.
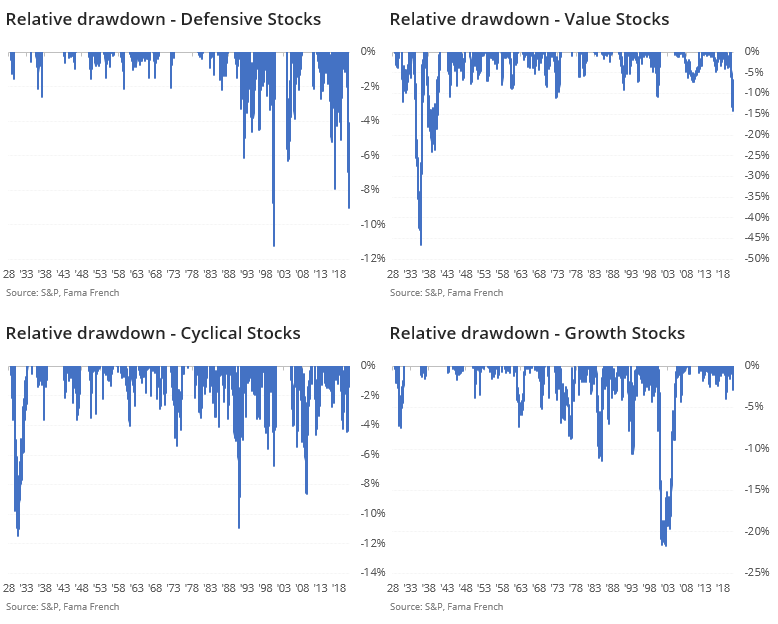
We can see this big shift in investor preferences in the past year among defensive and value stocks relative to cyclical and growth stocks. Defensive stocks dropped about 9% more from their highs than did the S&P, and value stocks about 15% more. Both are among the worst relative losses in 90 years for any of the factors.
The rout in energy stocks is historic, and maybe that's enough of a warning sign. No other sector has seen as much selling pressure in 90 years. Other times that selling pressure reached a lesser extreme, those sectors had a very strong tendency to outperform over the next 1-3 years. Energy hasn't done that and has only gone on to even further extremes.
That raises the chance of a "this time is different" scenario, the biggest extreme-can-always-get-more-extreme risk that contrary investors face. It seems unlikely that investors could suffer further relative losses in energy stocks, but that same thing could have been said 15% ago. The complete give-up in this sector should be a long-term positive, it just needs to see some stabilization for investors to realize things are morphing from bad to less bad.
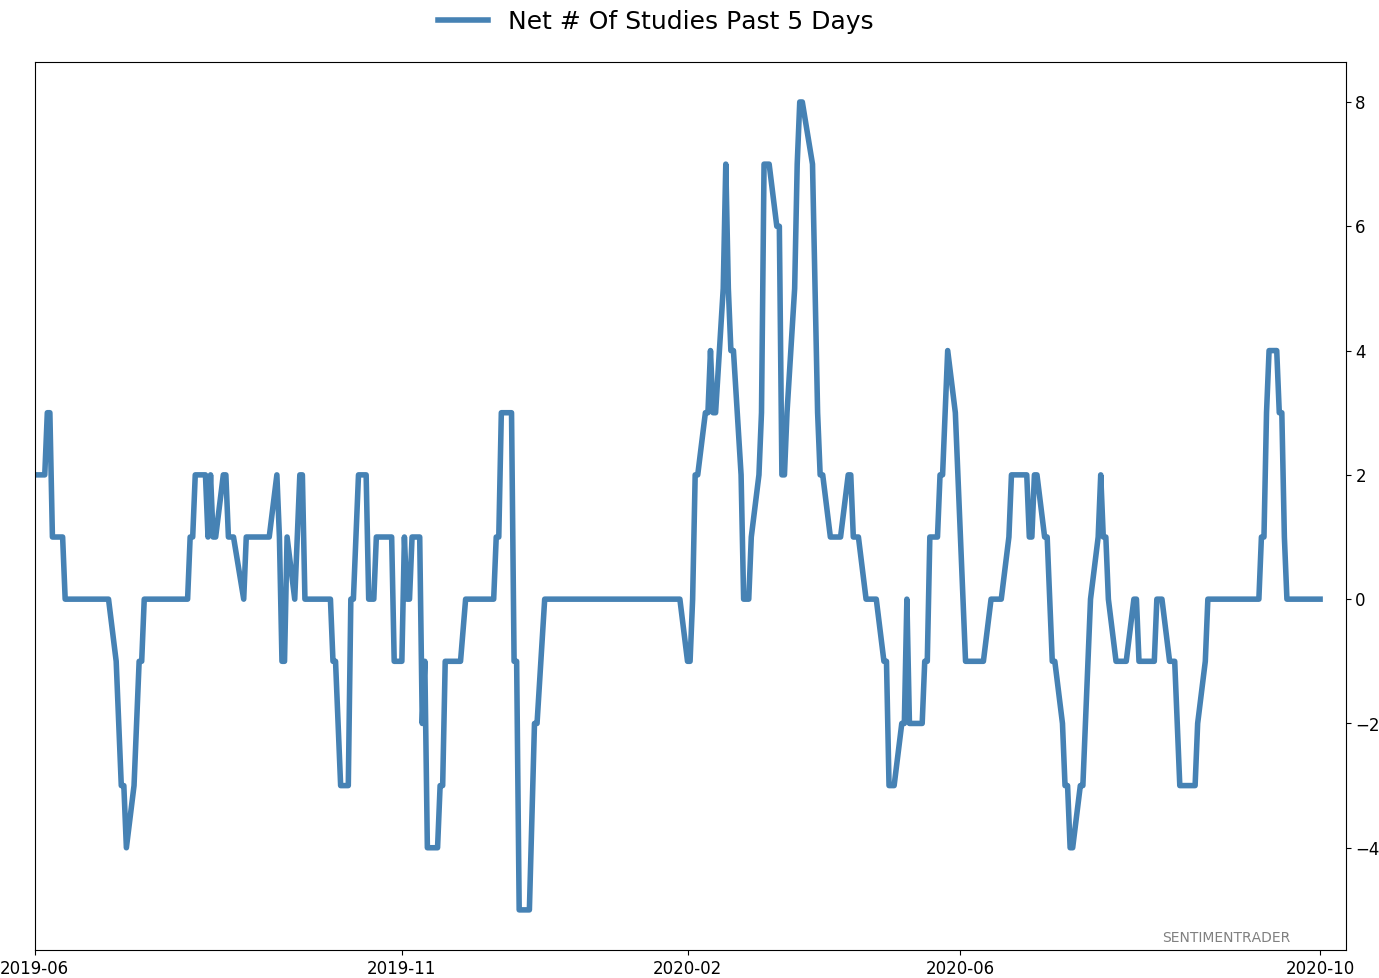
Active Studies
| Time Frame | Bullish | Bearish | | Short-Term | 0 | 0 | | Medium-Term | 4 | 8 | | Long-Term | 48 | 2 |
|
Indicators at Extremes
Portfolio
| Position | Description | Weight % | Added / Reduced | Date | | Stocks | 15.6% RSP, 10.1% VWO, 7.5% XLE, 5.1% PSCE | 38.2 | Added 5% | 2020-10-15 | | Bonds | 10% BND, 10% SCHP, 10% ANGL | 29.7 | Reduced 0.1% | 2020-10-02 | | Commodities | GCC | 2.4 | Reduced 2.1%
| 2020-09-04 | | Precious Metals | GDX | 4.7 | Added 5% | 2020-09-09 | | Special Situations | | 0.0 | Reduced 5% | 2020-10-02 | | Cash | | 25.0 | | |
|
Updates (Changes made today are underlined)
After the September swoon wrung some of the worst of the speculation out of stocks, there are some signs that it's returning, especially in the options market. It's helped to push Dumb Money Confidence above 70%. A big difference between now and August is that in August, there was a multitude of days with exceptionally odd breadth readings. Some of the biggest stocks were masking underlying weakness. Combined with heavy speculative activity, it was a dangerous setup. Now, we've seen very strong internal strength, in the broad market, as well as tech and small-cap stocks. Prior signals almost invariably led to higher prices. That's hard to square with the idea that forward returns tend to be subdued when Confidence is high, but that's less reliable during healthy market conditions, which we're seeing now (for the most part). I added some risk with small-cap energy stocks, due to an increasing number of positive signs in both small-caps and energy. This is intended as a long-term position.
RETURN YTD: -2.5% 2019: 12.6%, 2018: 0.6%, 2017: 3.8%, 2016: 17.1%, 2015: 9.2%, 2014: 14.5%, 2013: 2.2%, 2012: 10.8%, 2011: 16.5%, 2010: 15.3%, 2009: 23.9%, 2008: 16.2%, 2007: 7.8%
|
|
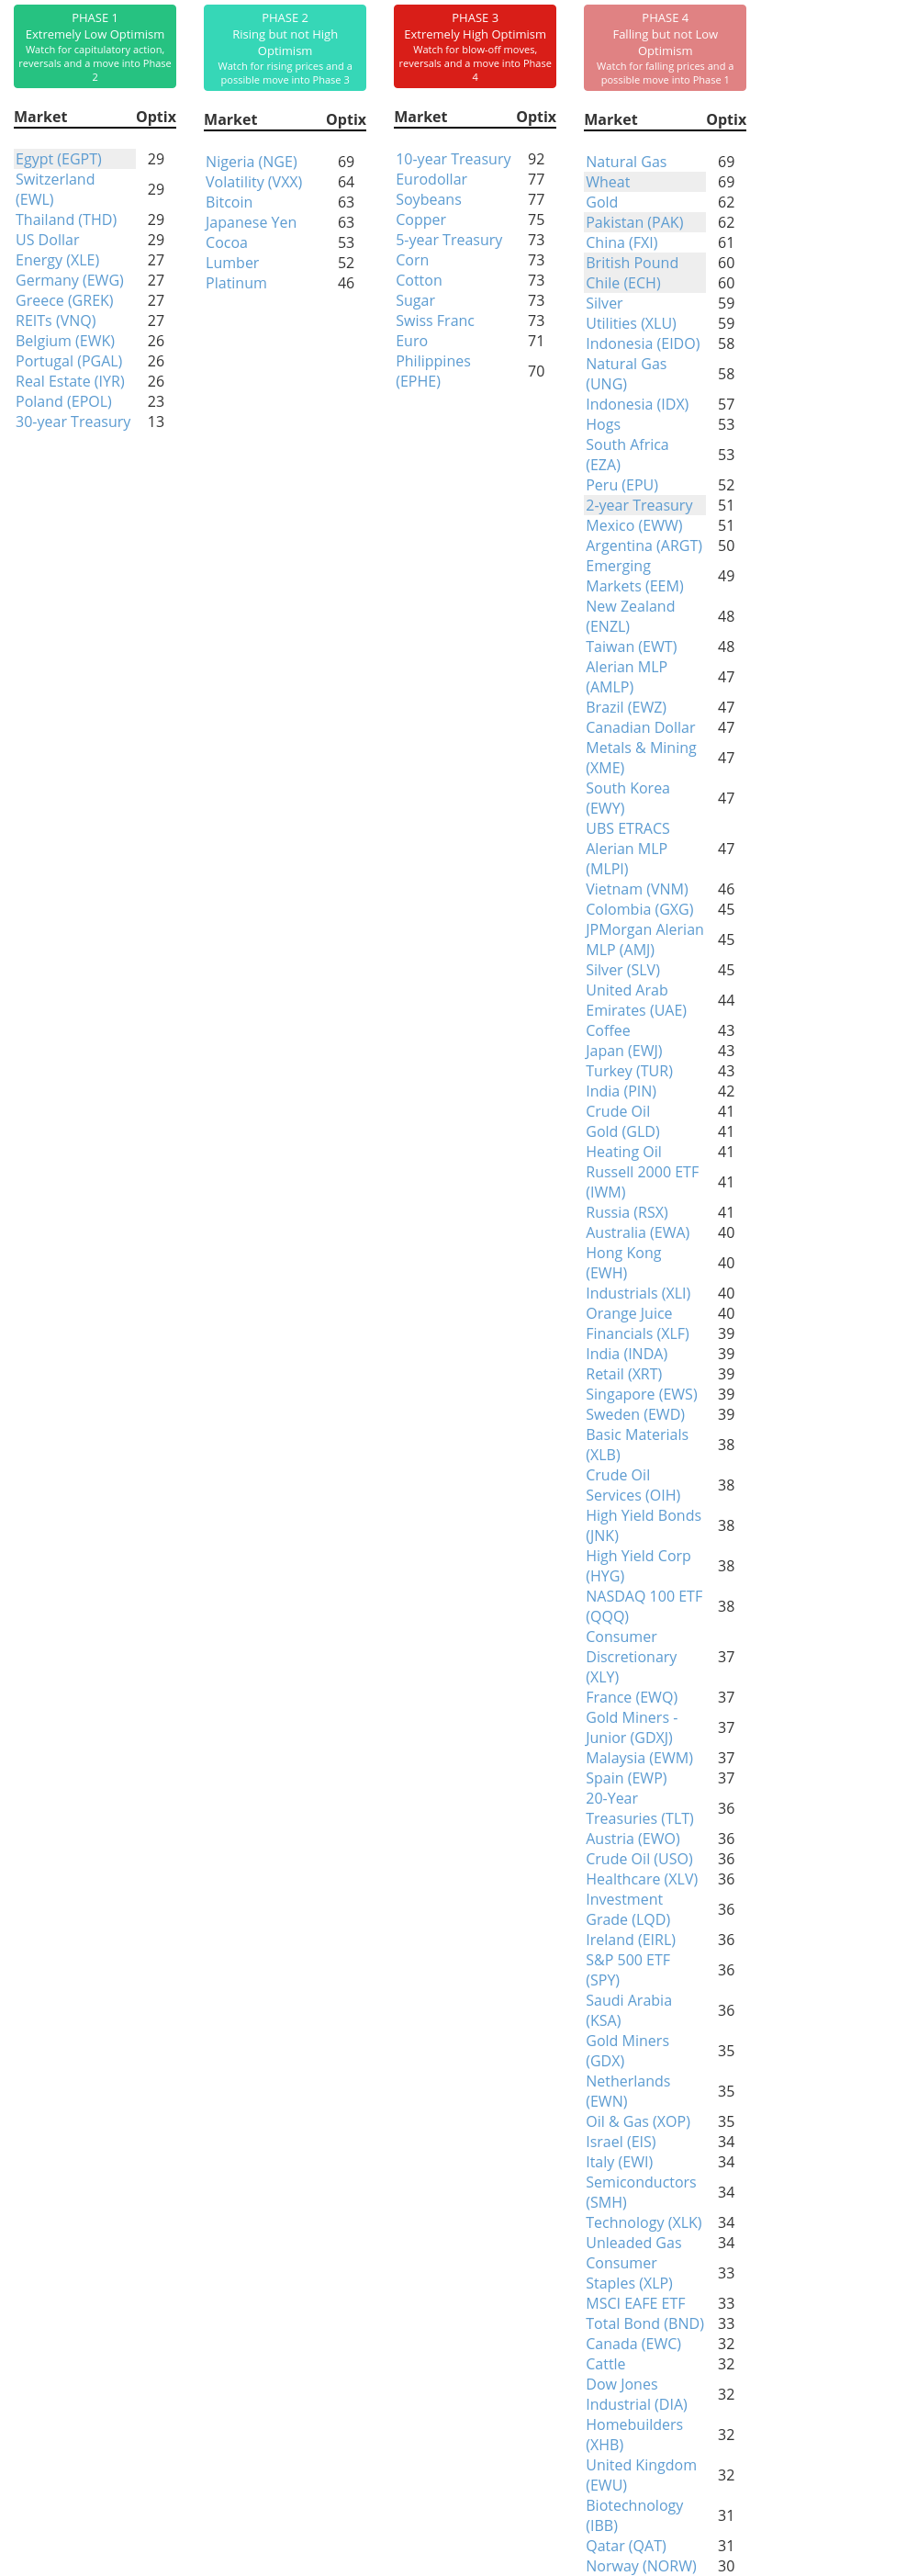
Phase Table
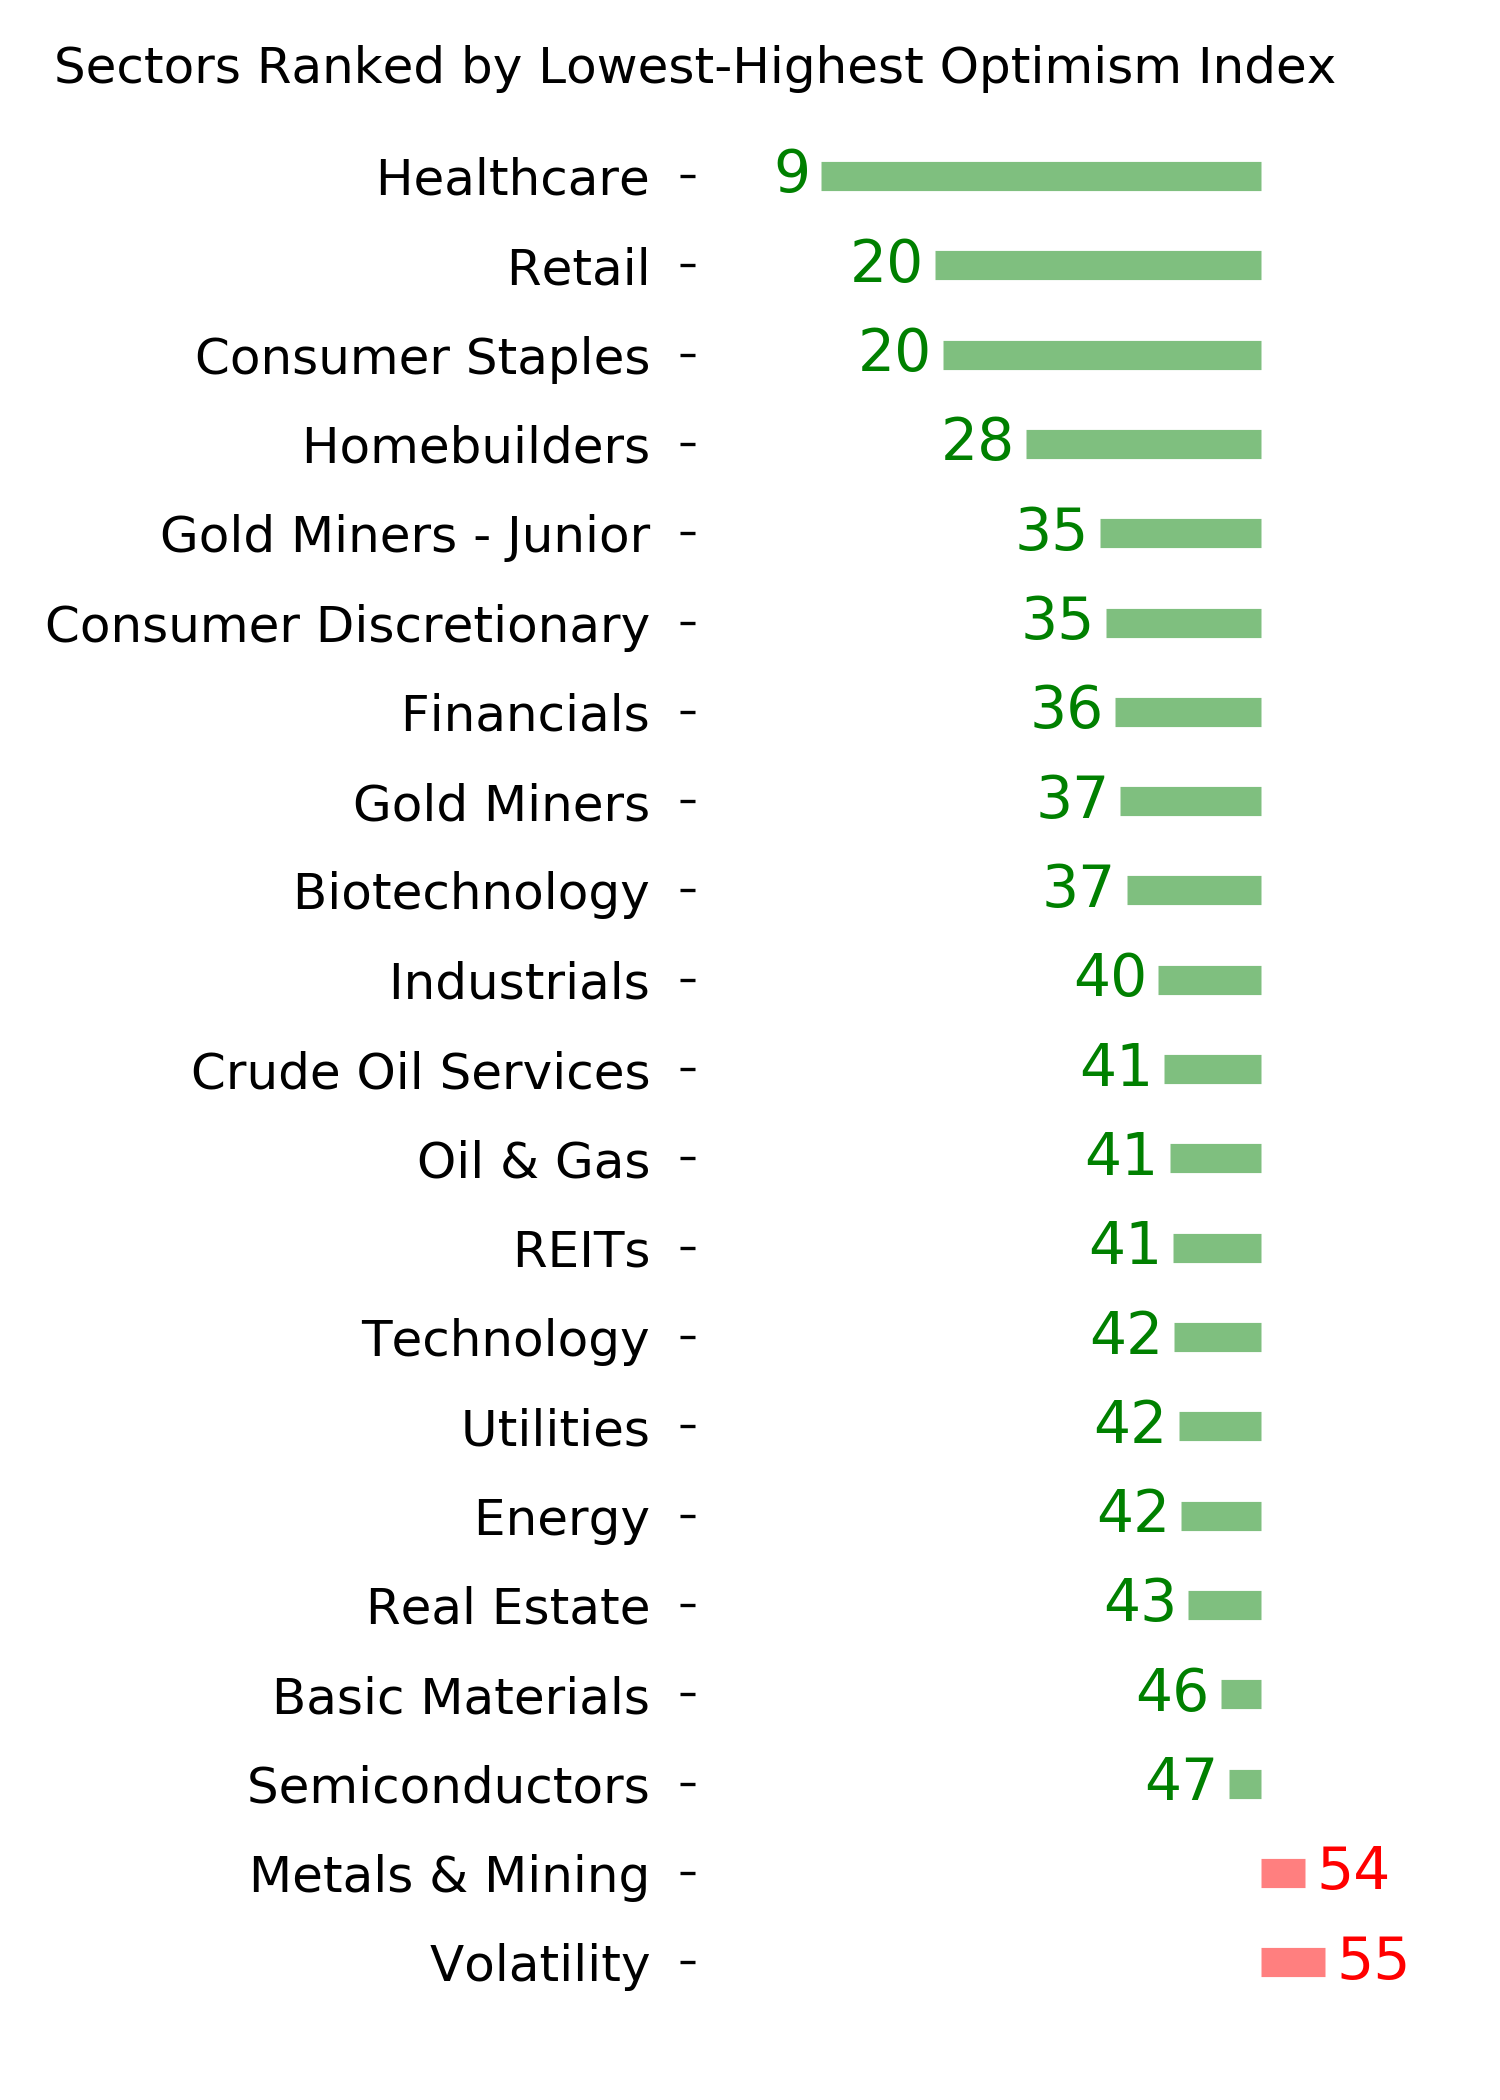
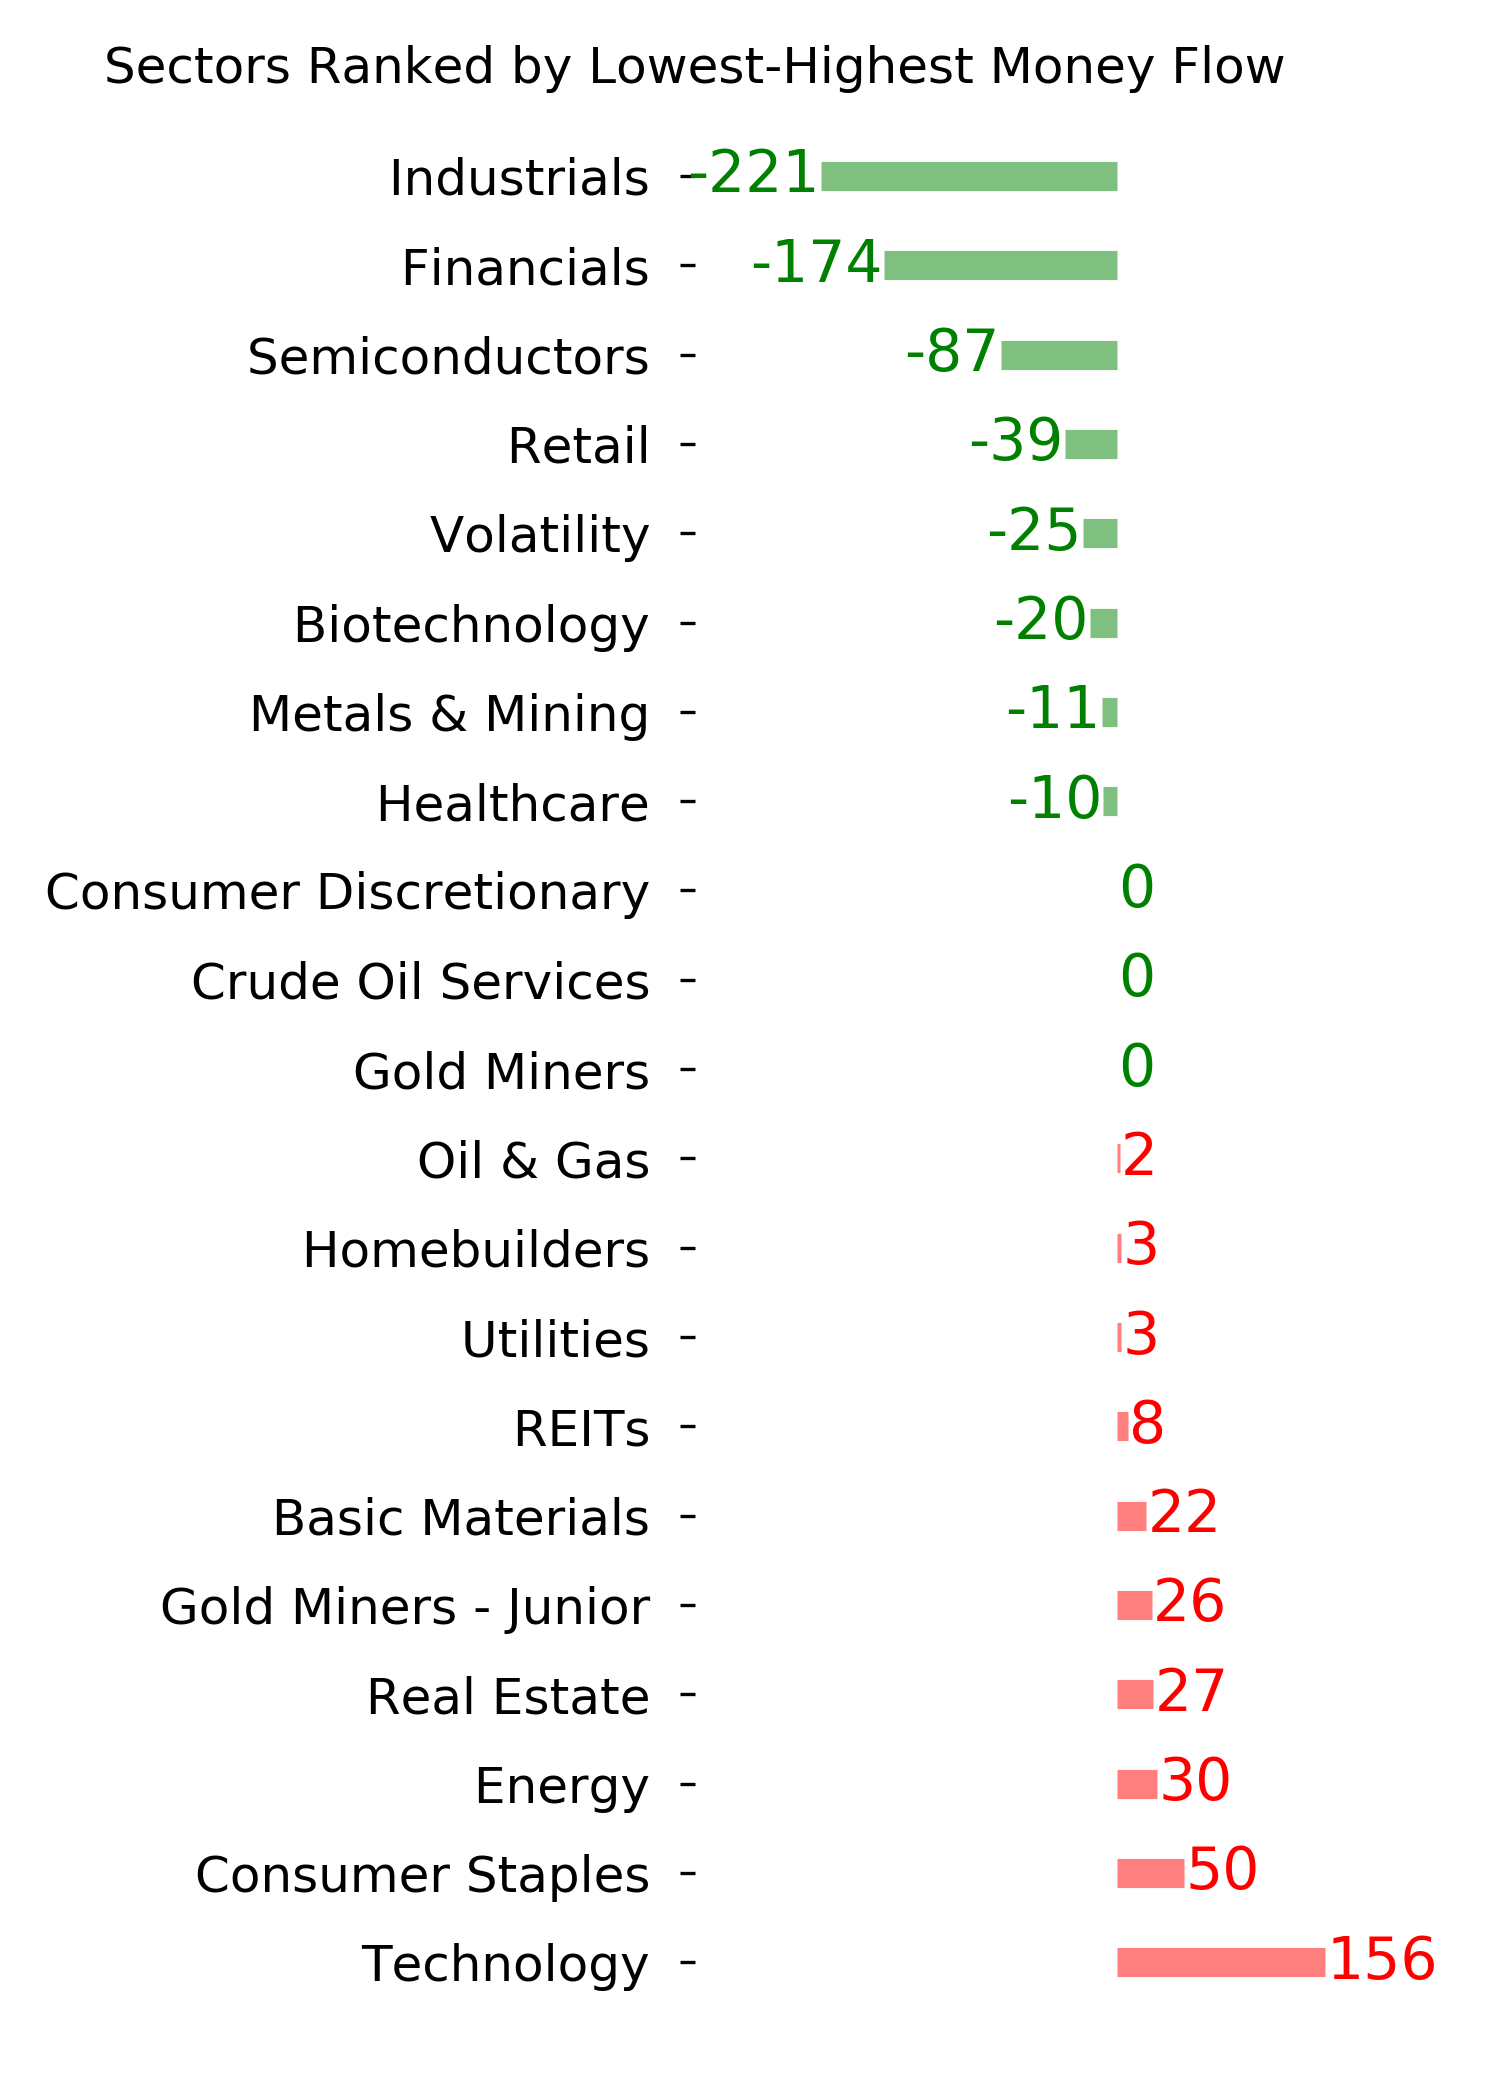
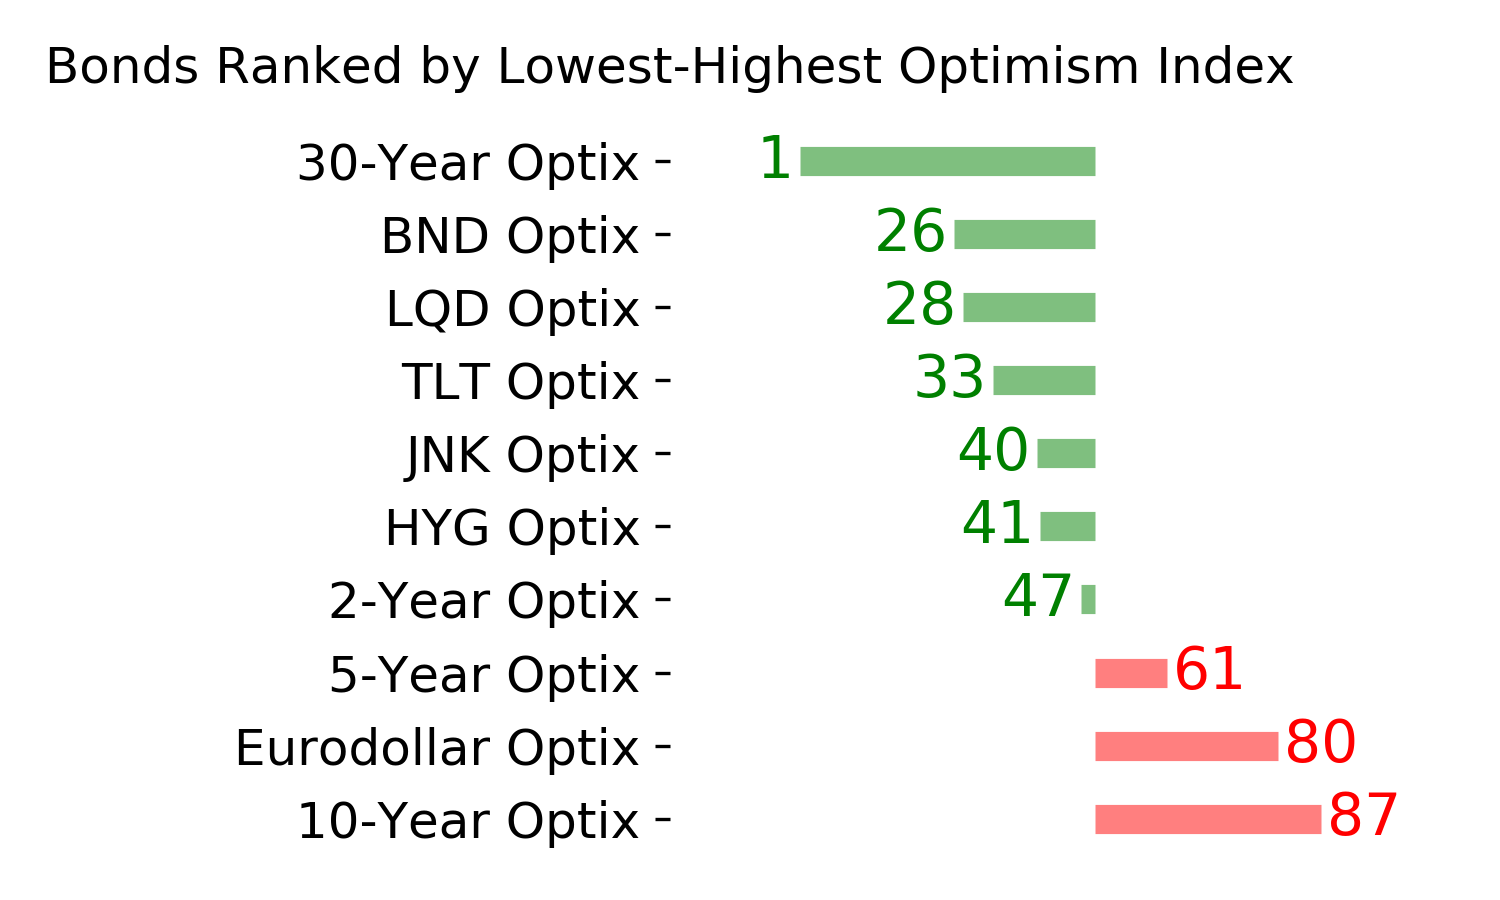
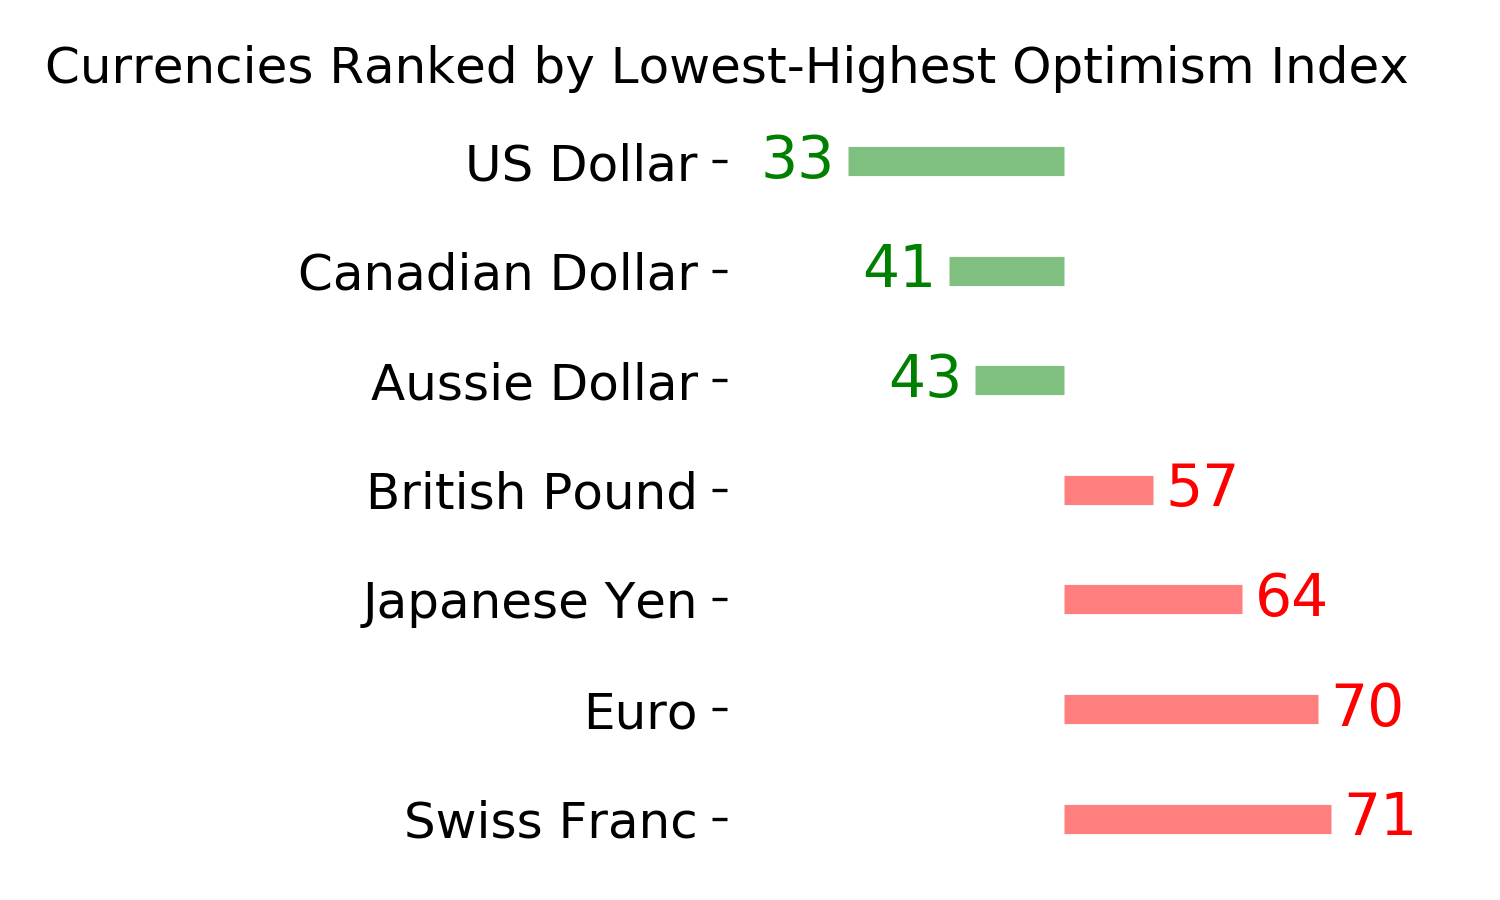
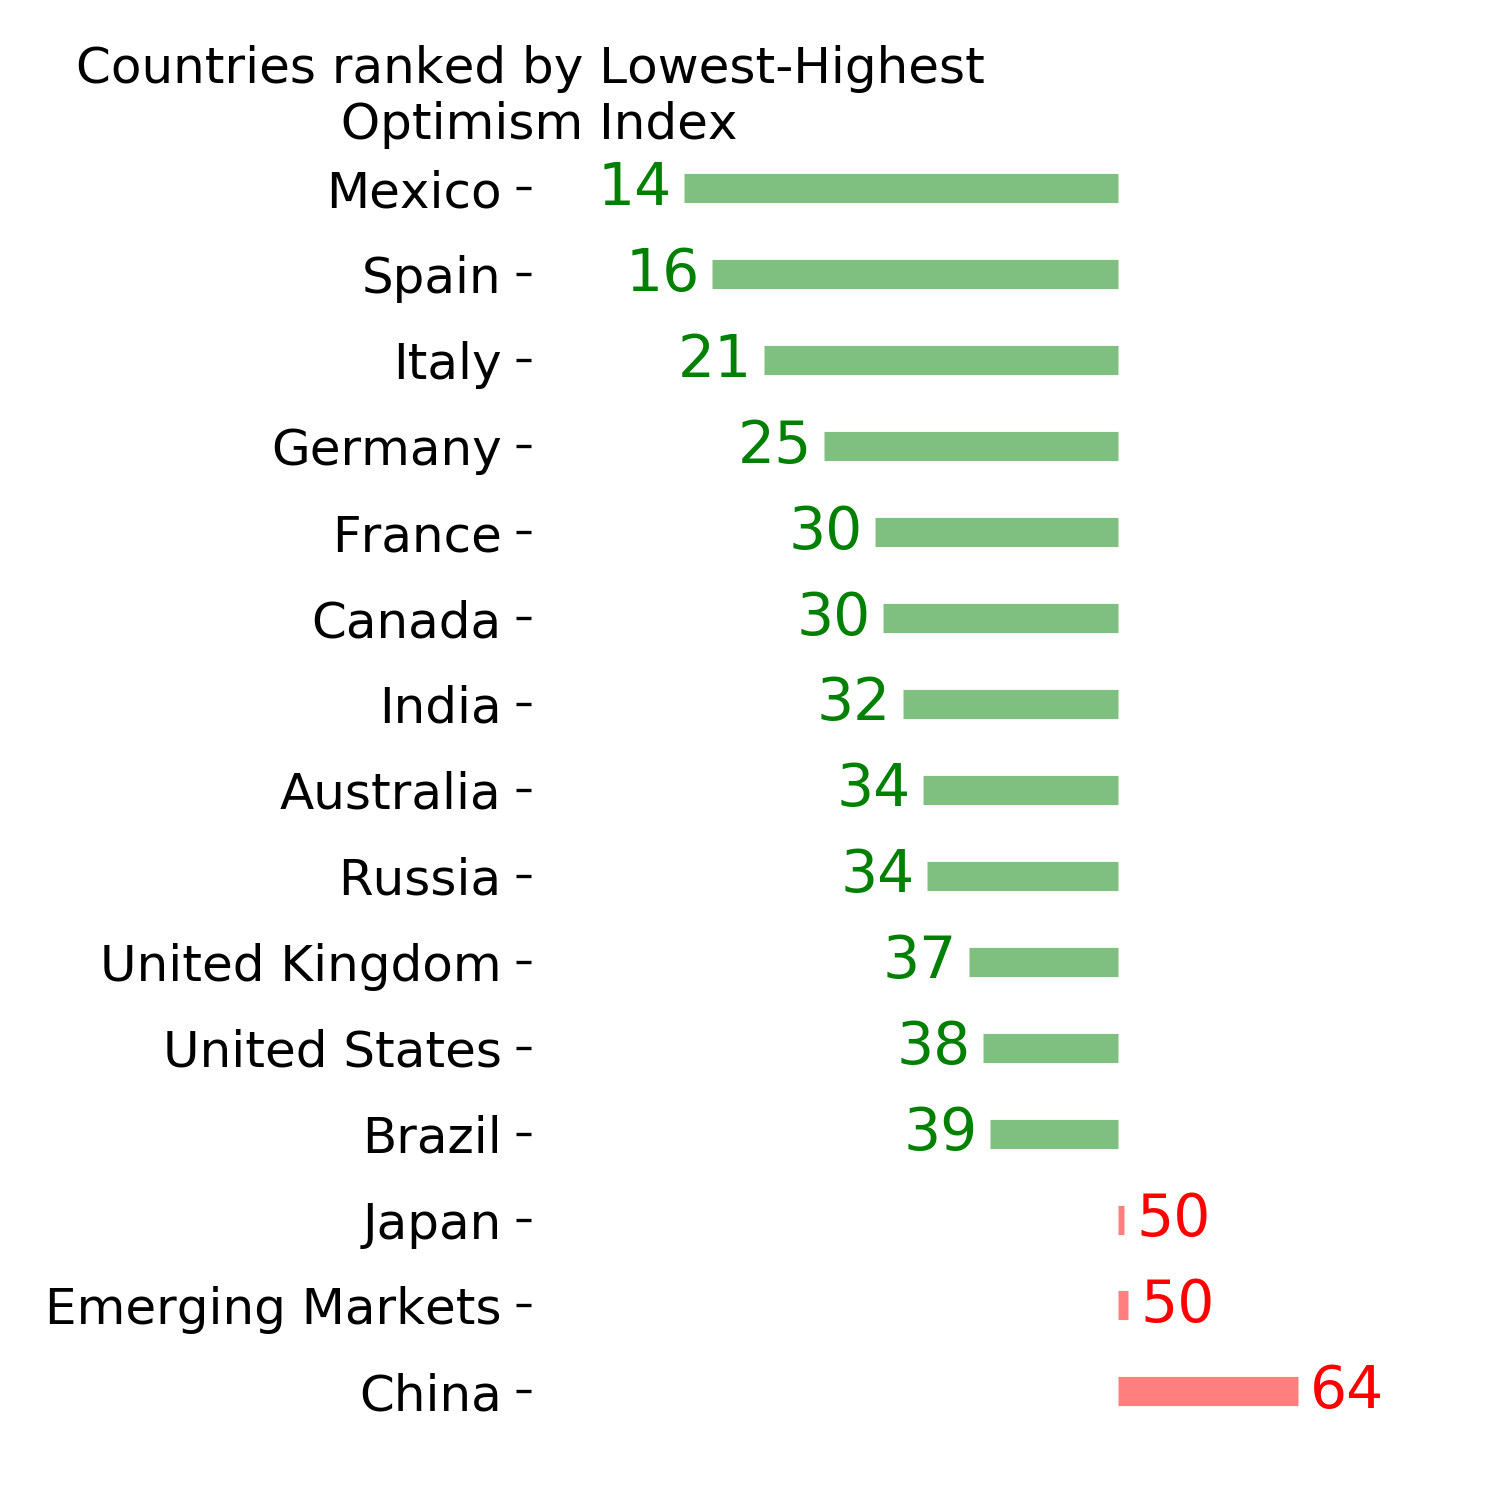
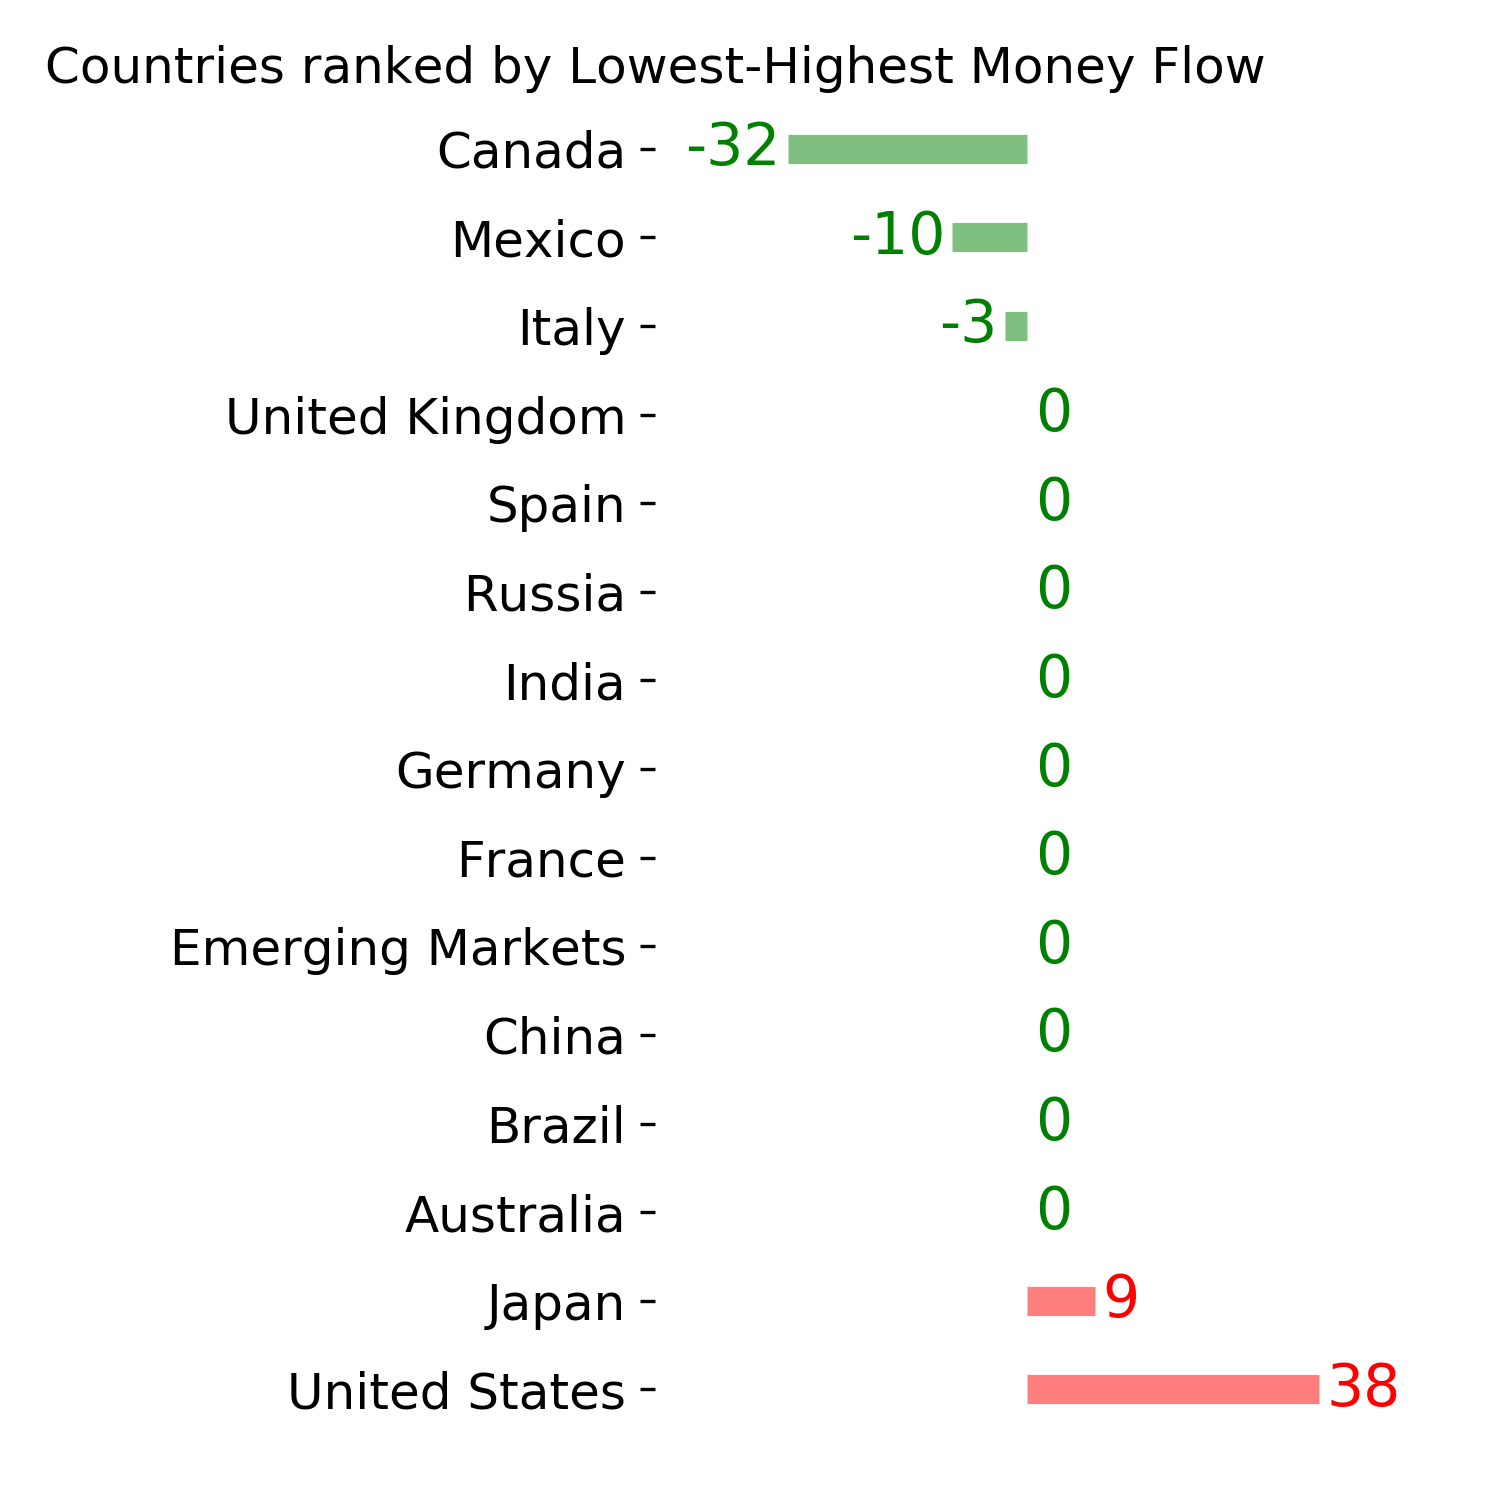
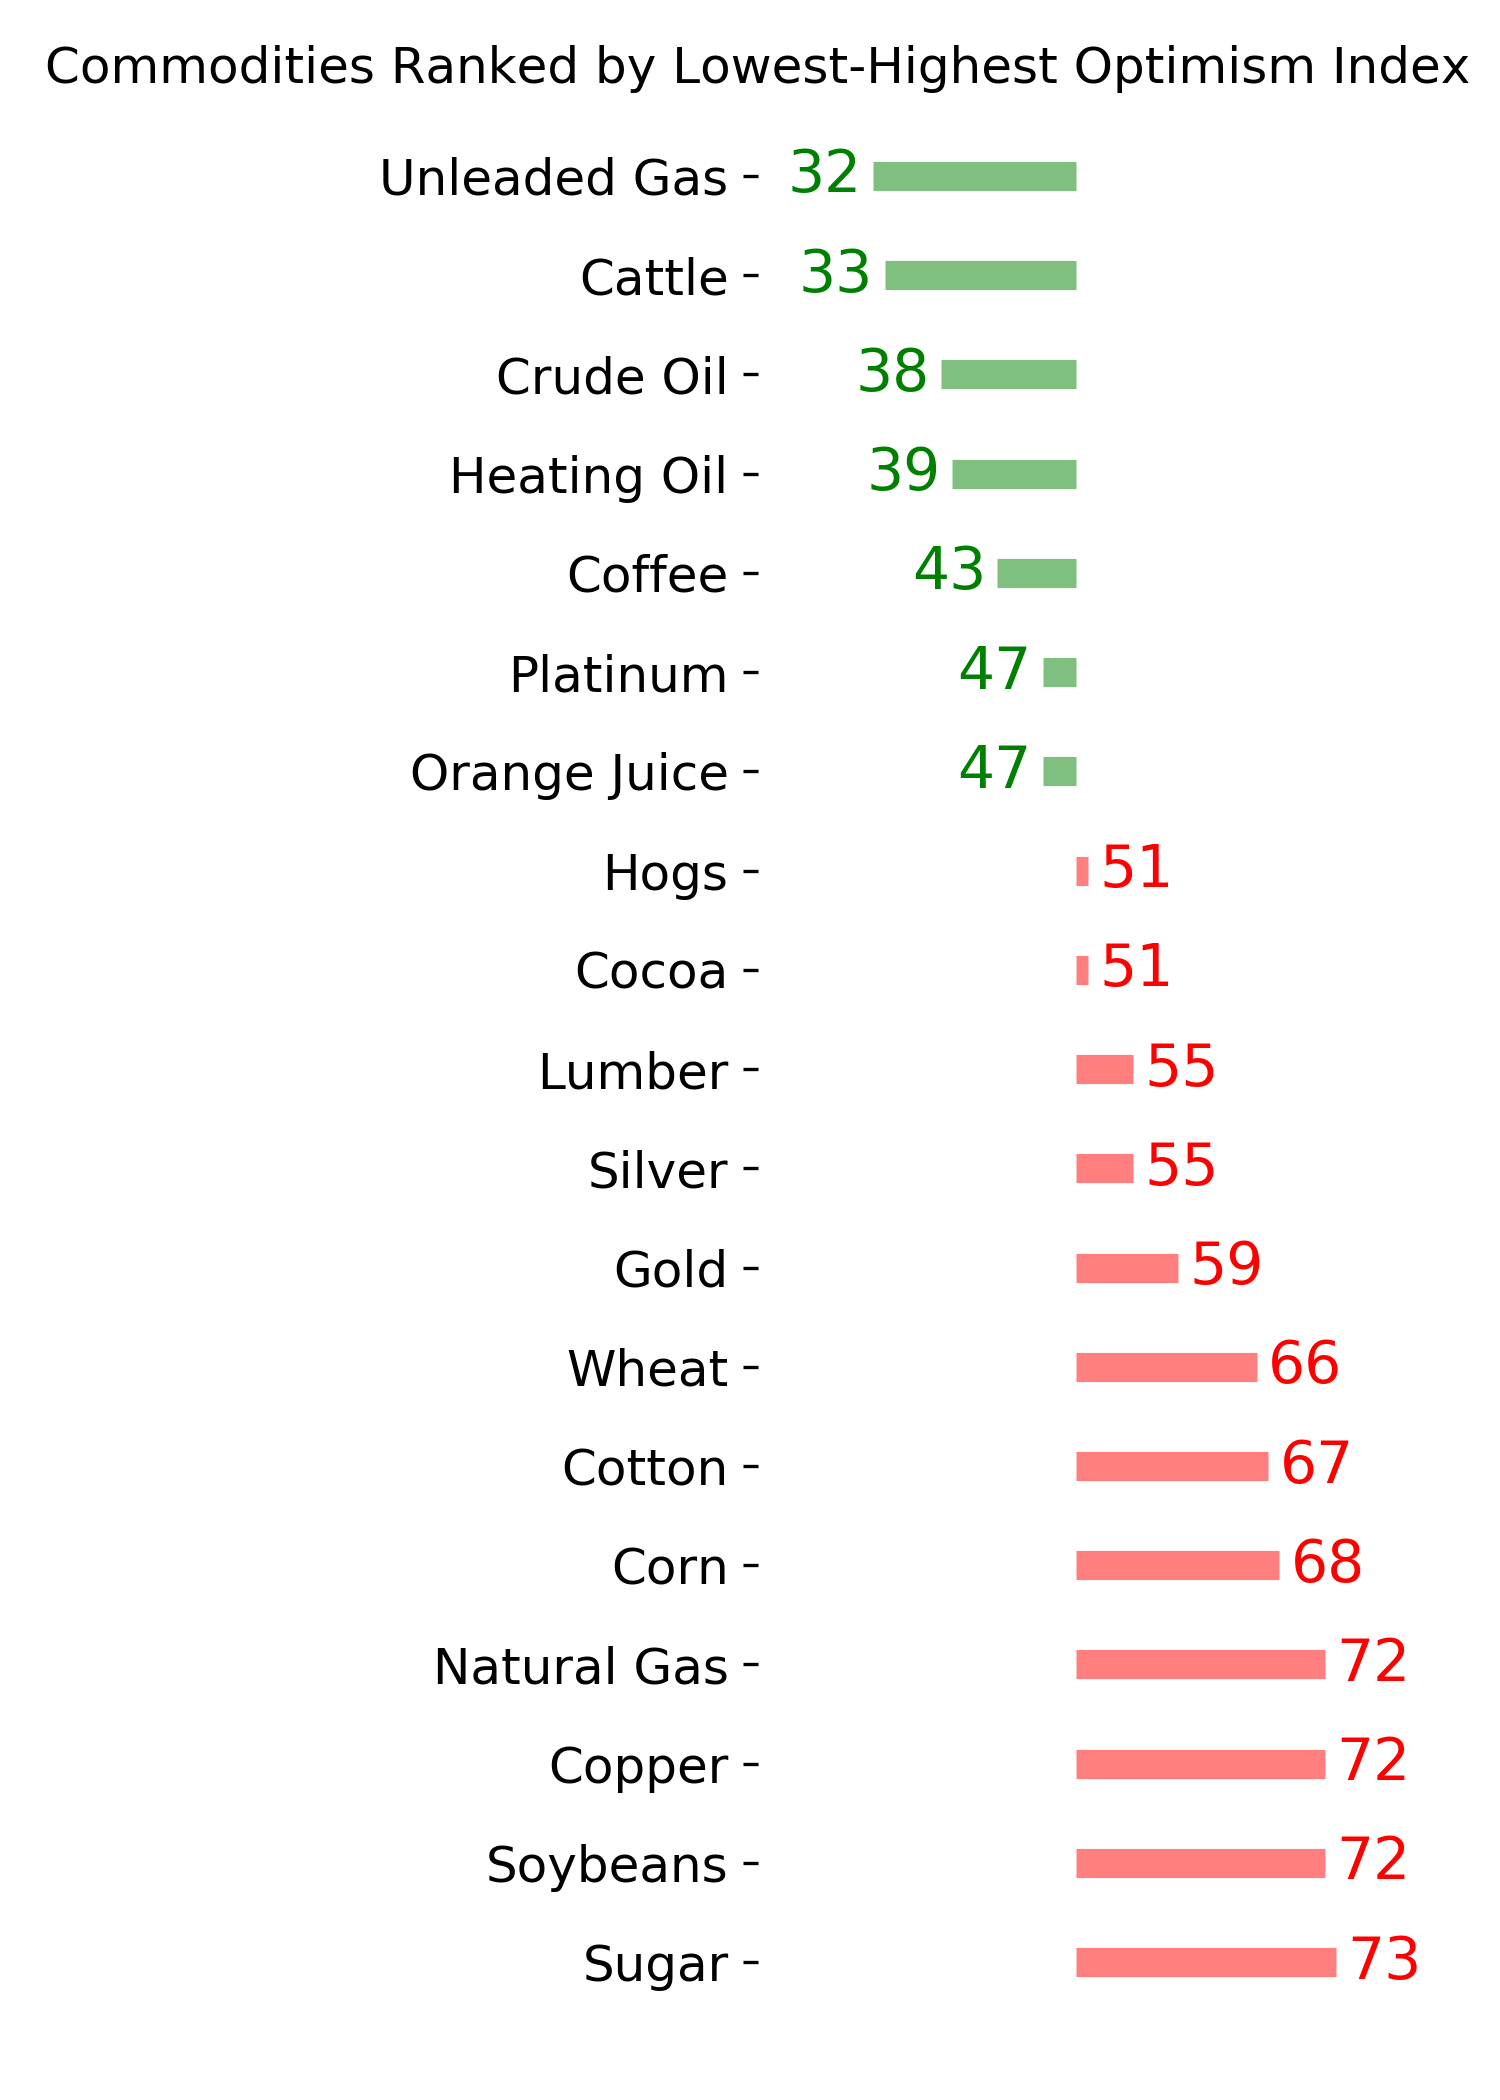
Ranks
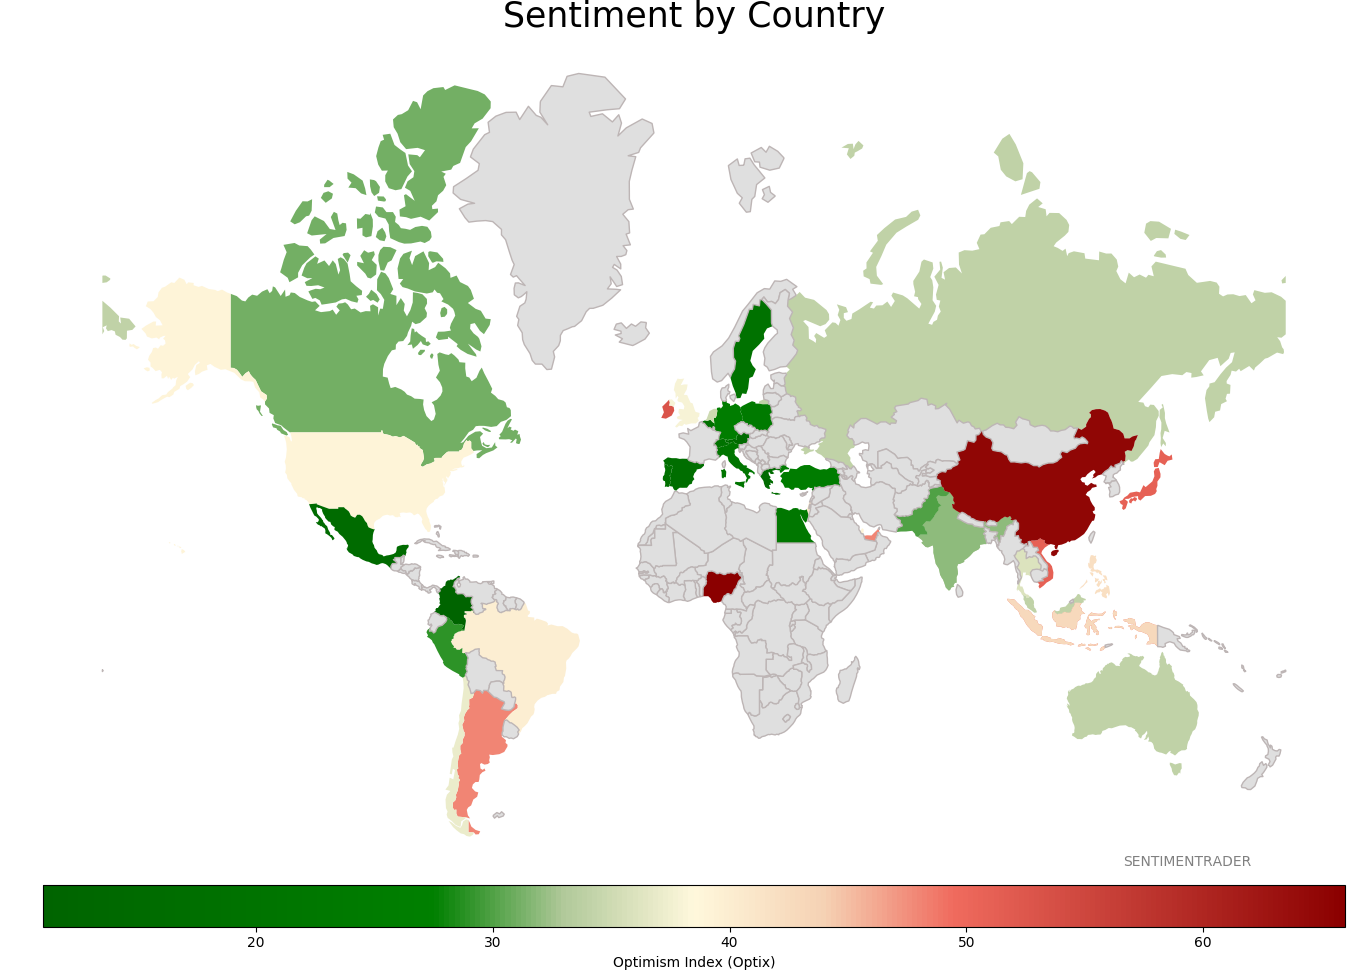
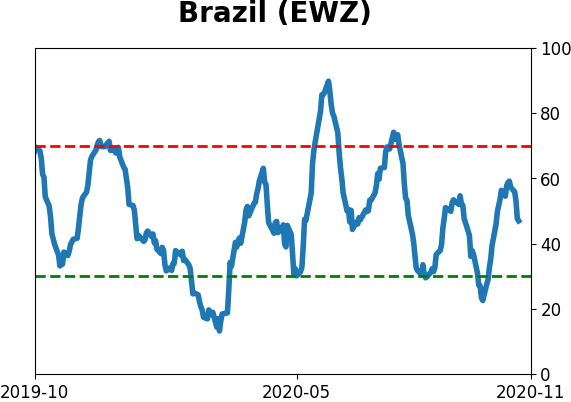
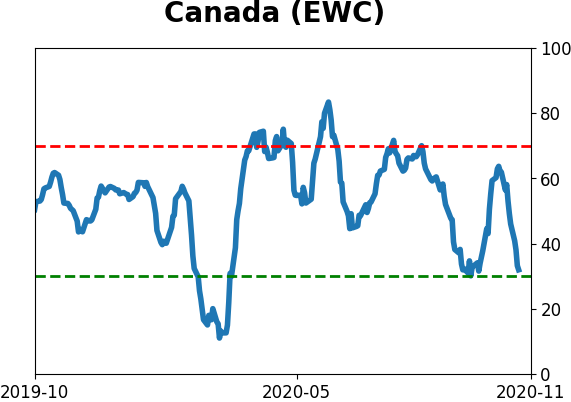
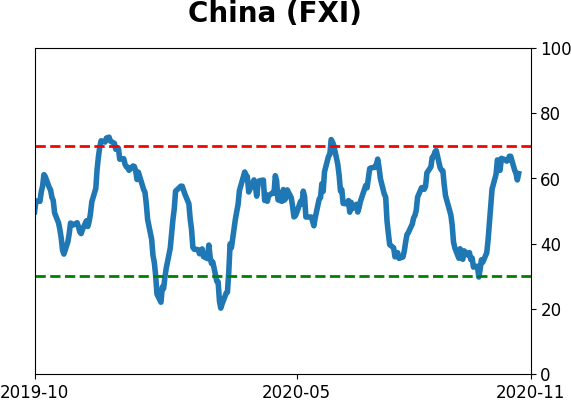
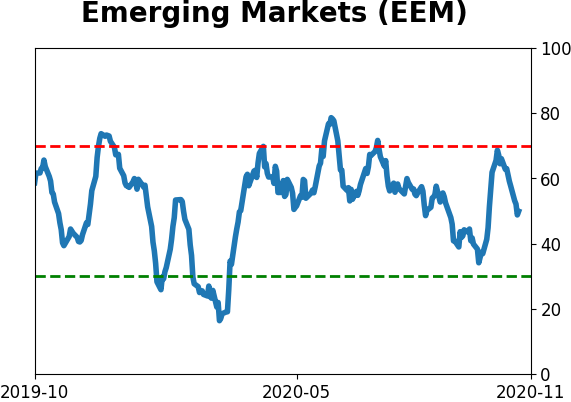
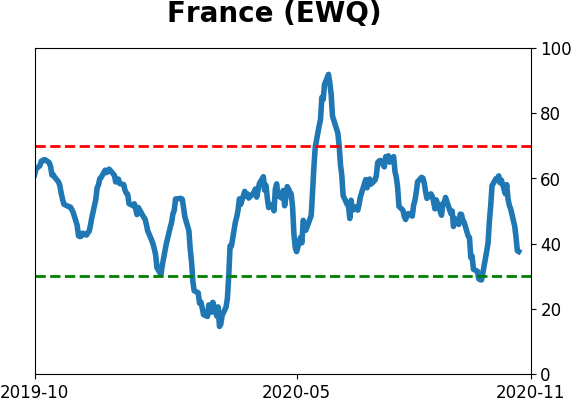
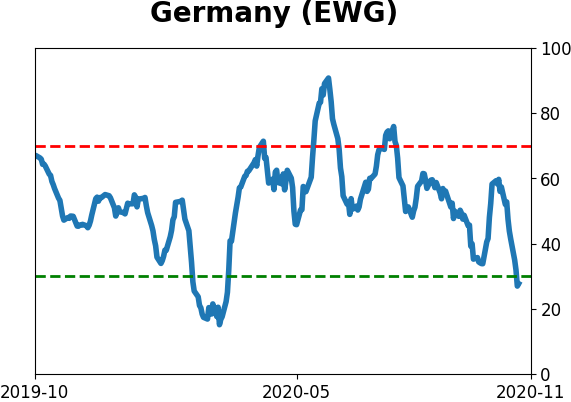
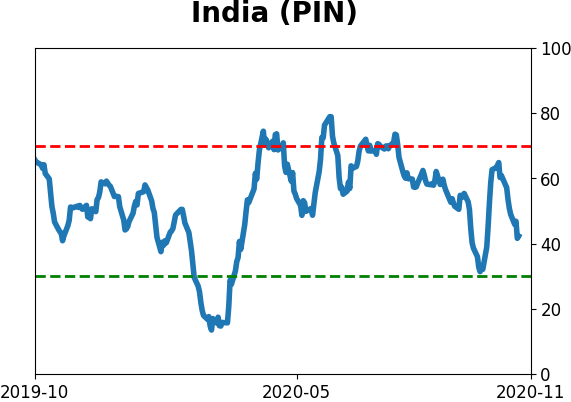
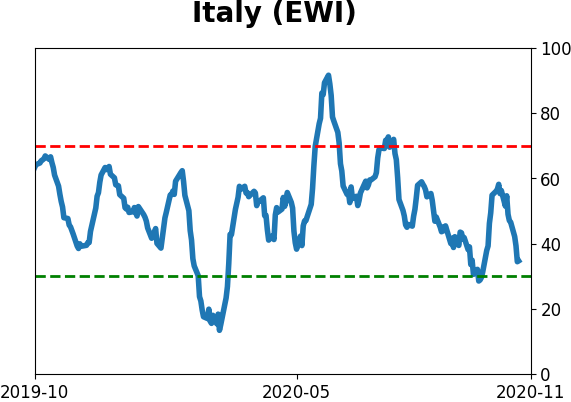
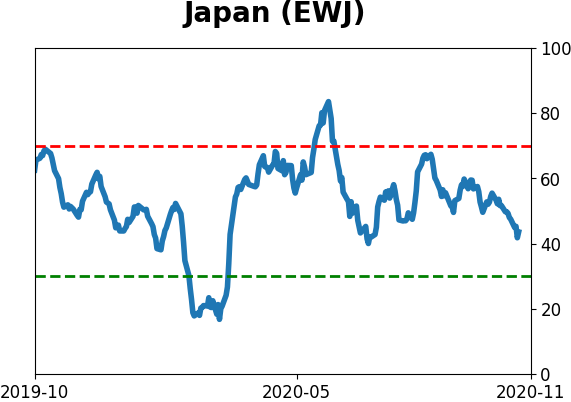
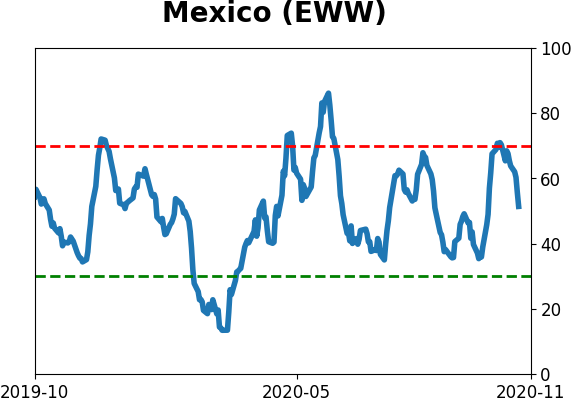
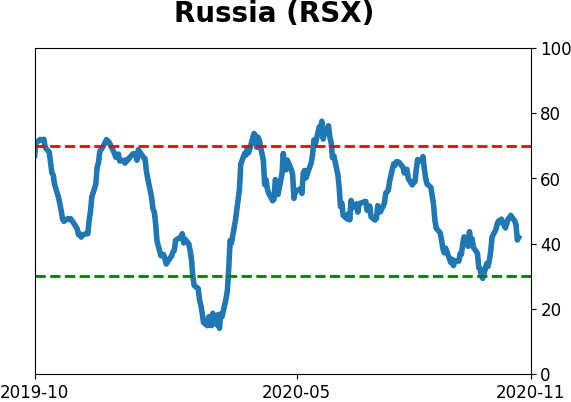
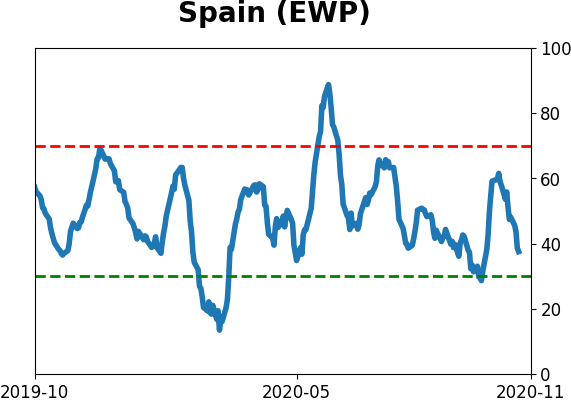
Sentiment Around The World
Optimism Index Thumbnails
|
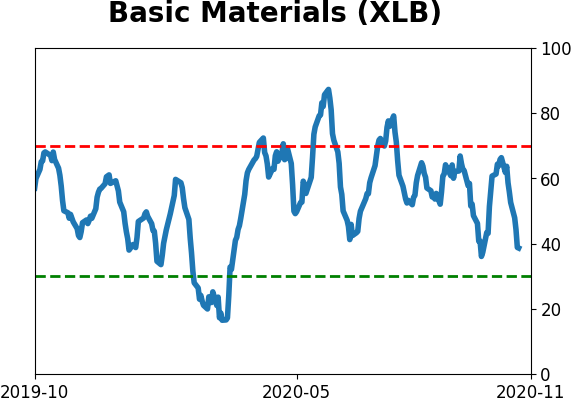
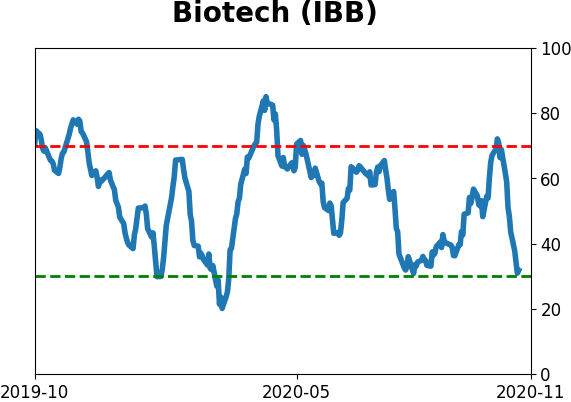
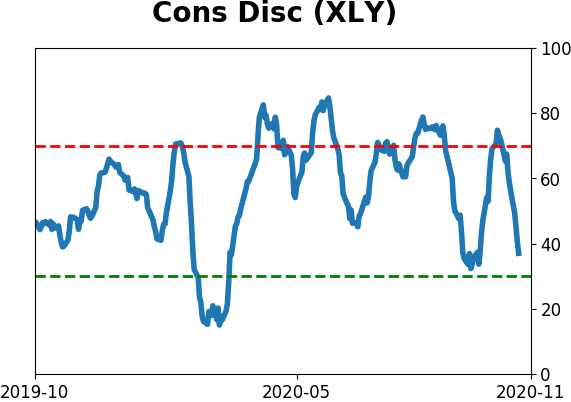
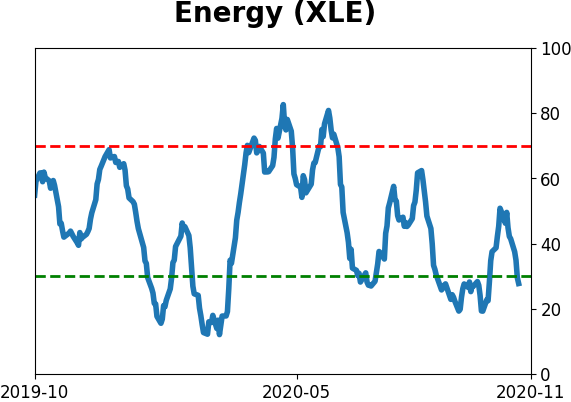
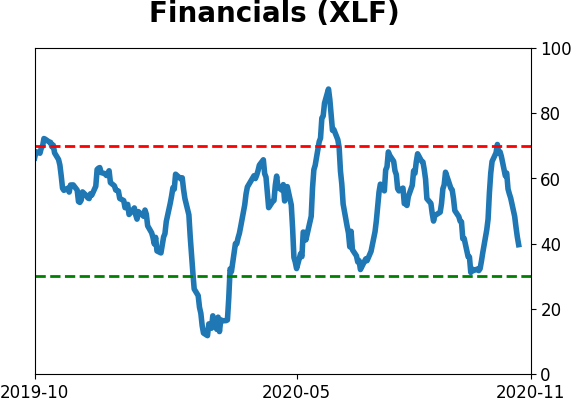
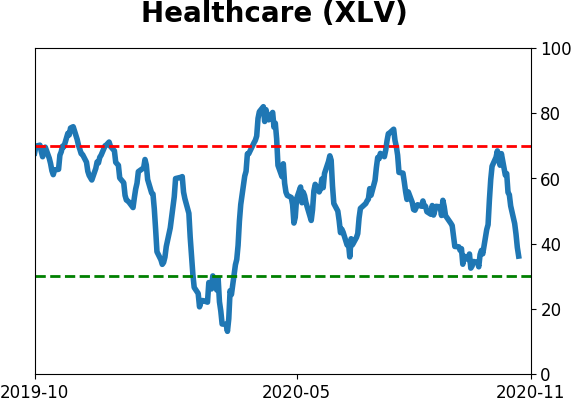
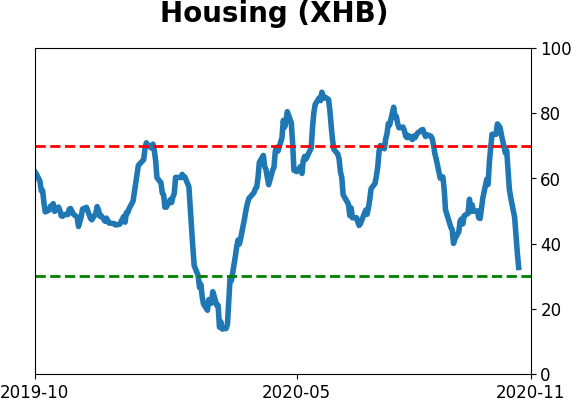
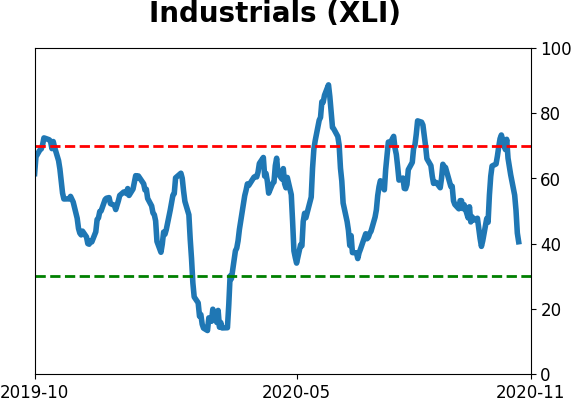
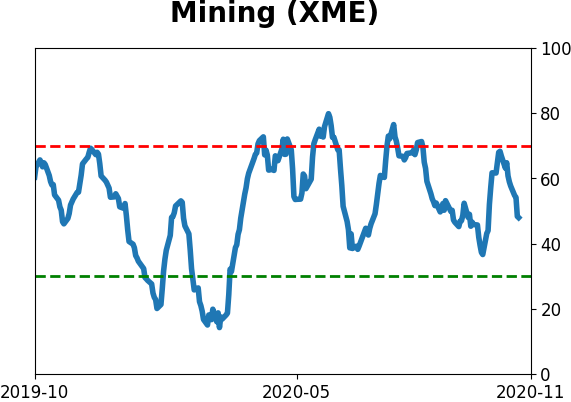
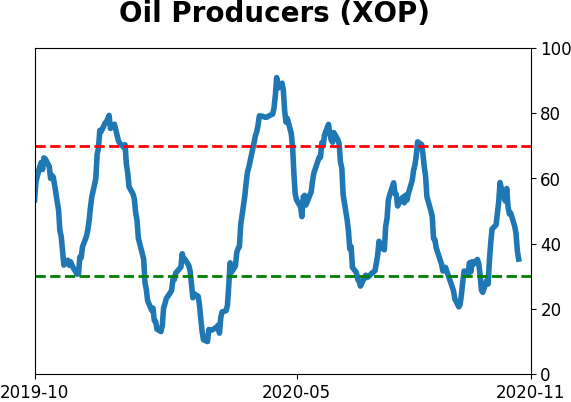
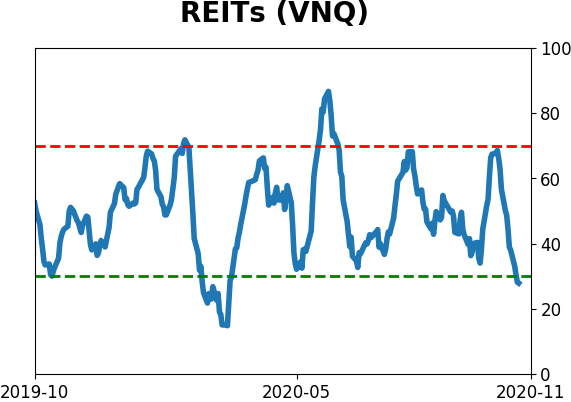
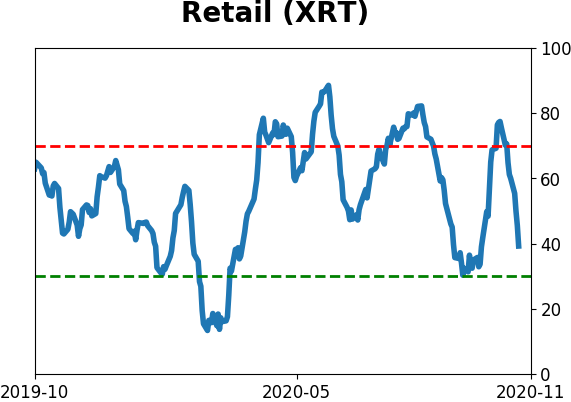
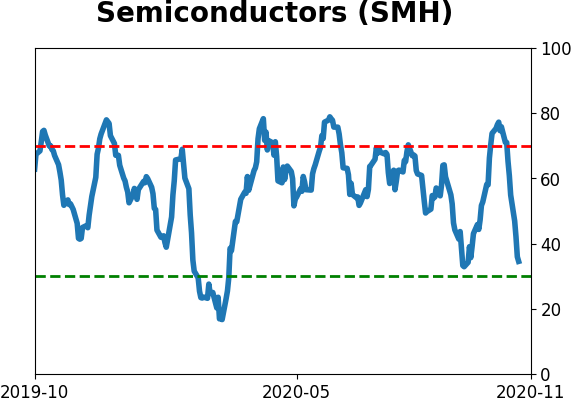
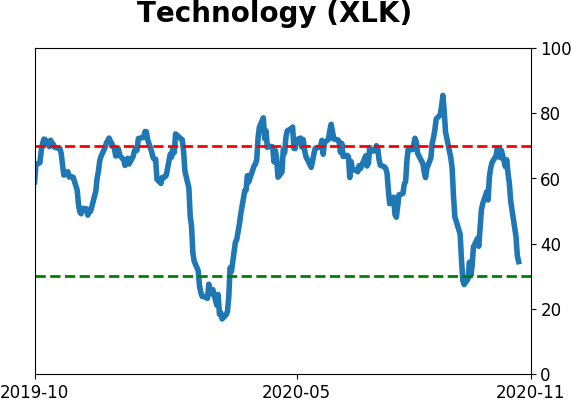
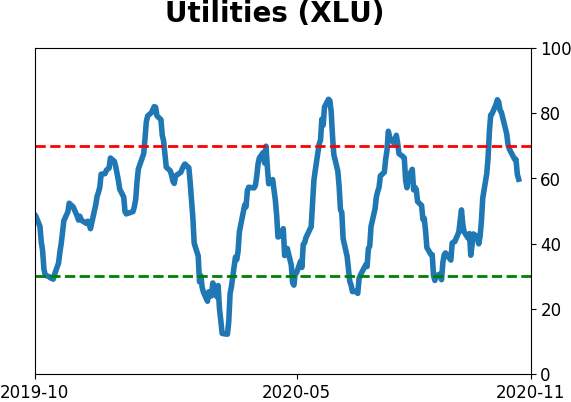
Sector ETF's - 10-Day Moving Average
|
|
|
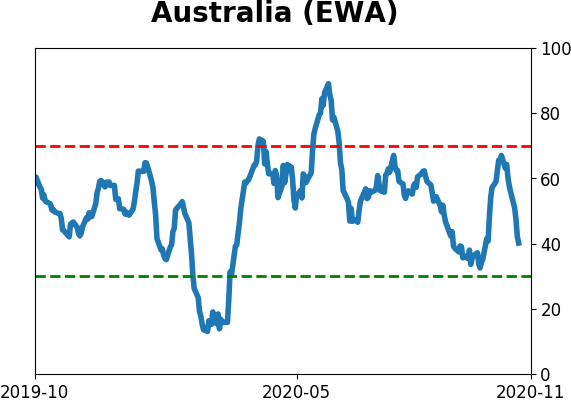
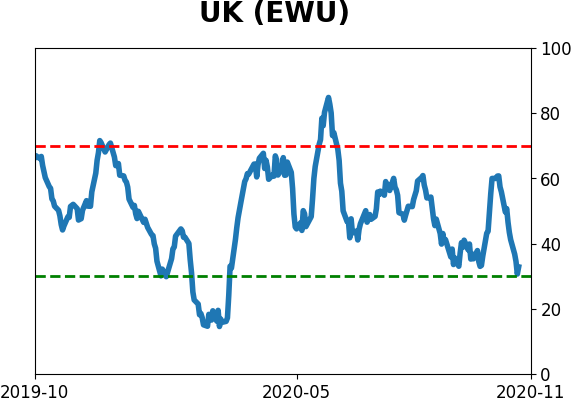
Country ETF's - 10-Day Moving Average
|
|
|
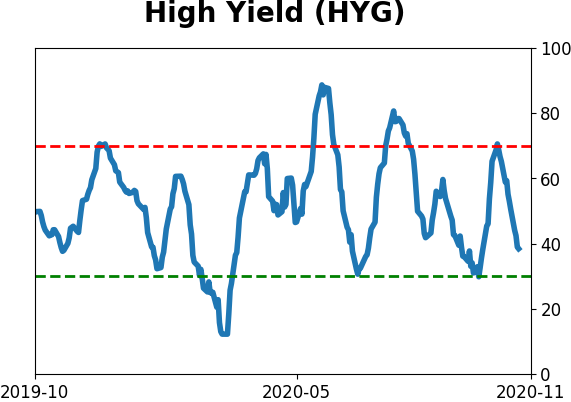
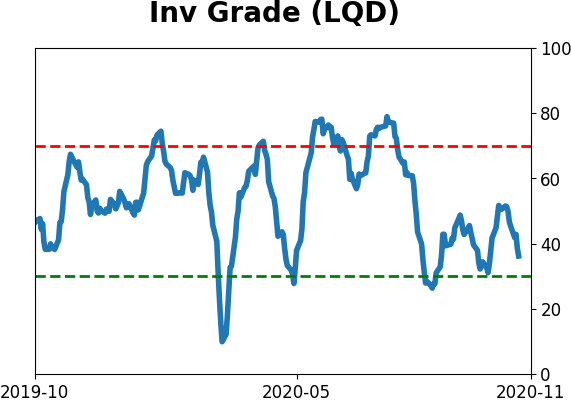
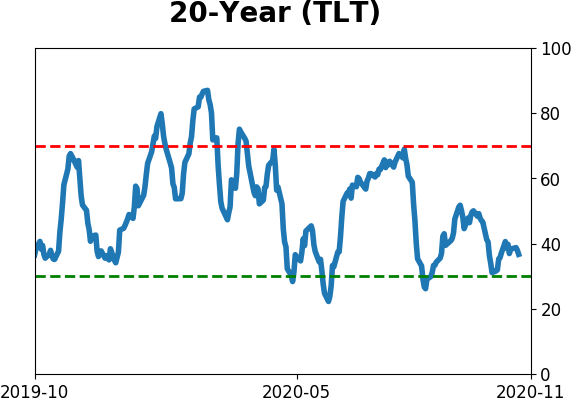
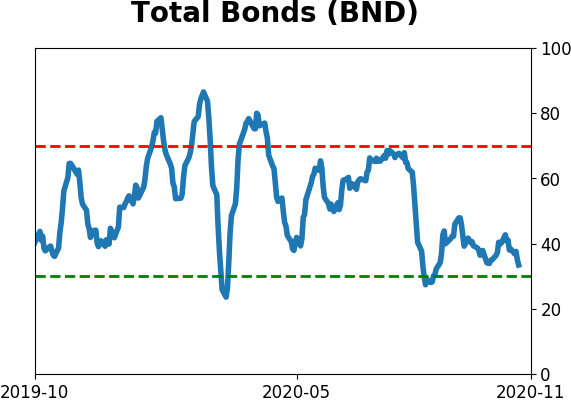
Bond ETF's - 10-Day Moving Average
|
|
|
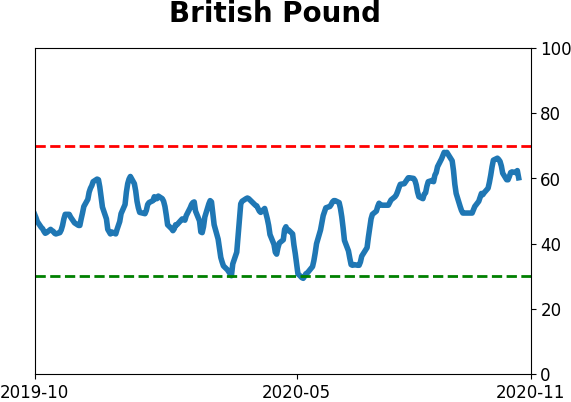
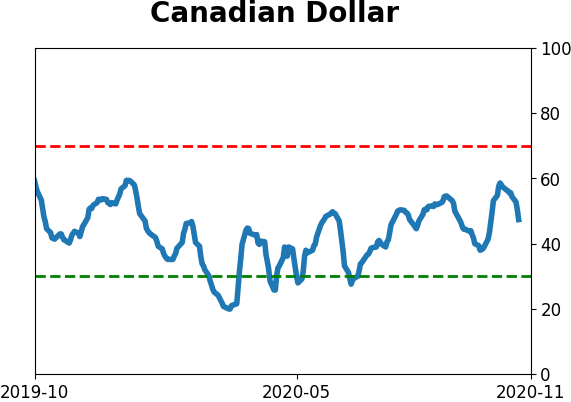
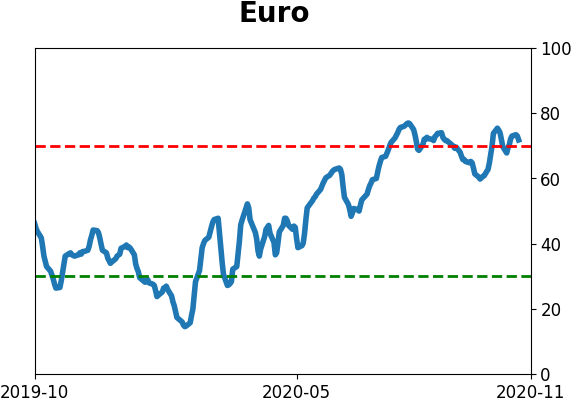
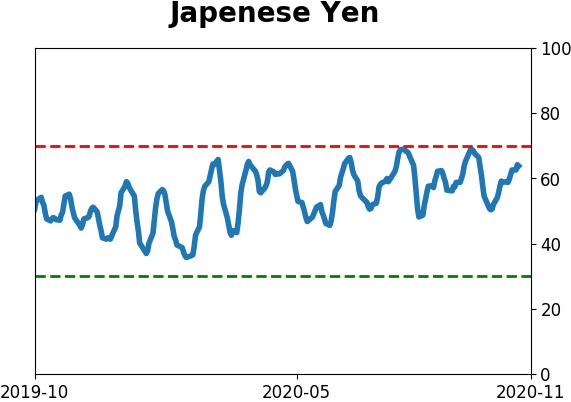
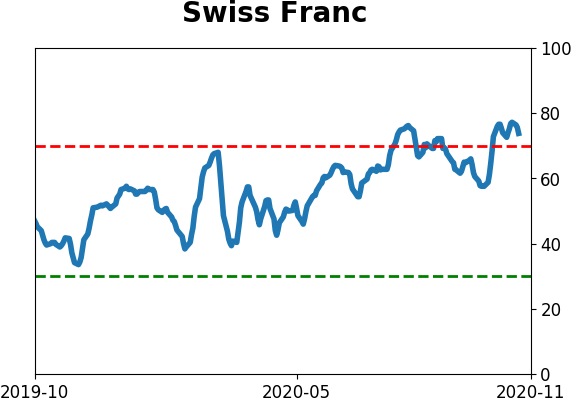
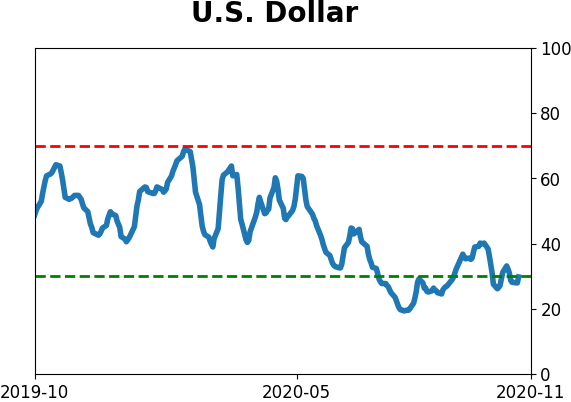
Currency ETF's - 5-Day Moving Average
|
|
|
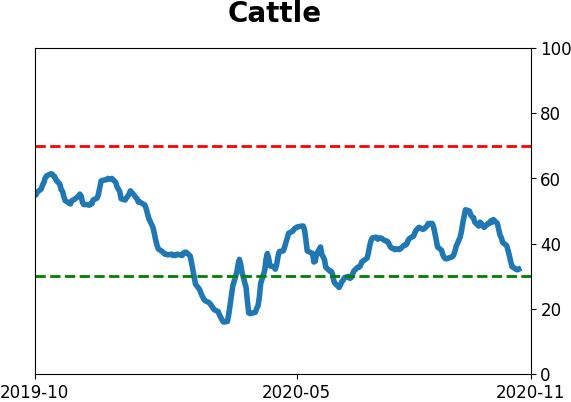
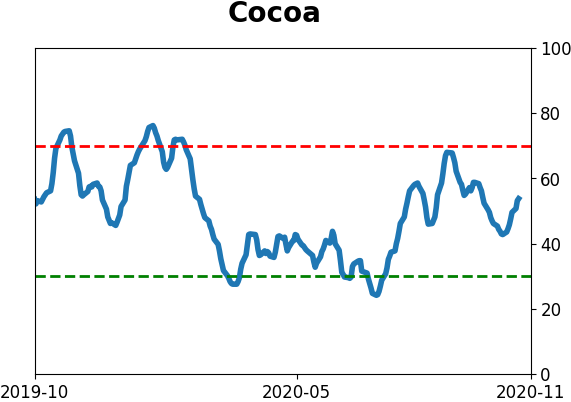
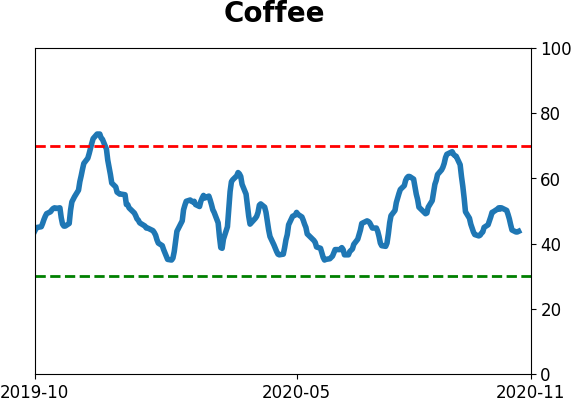
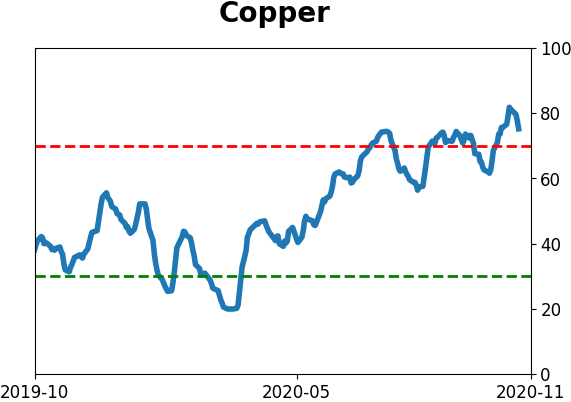
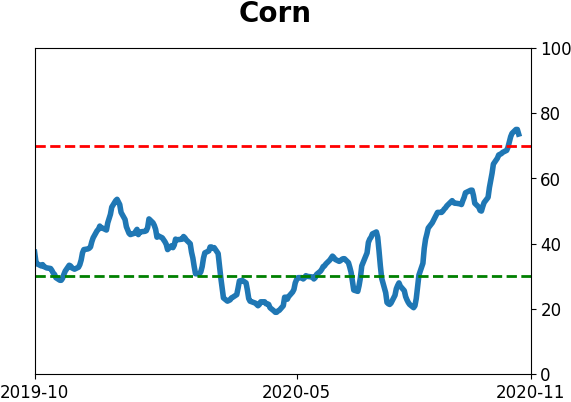
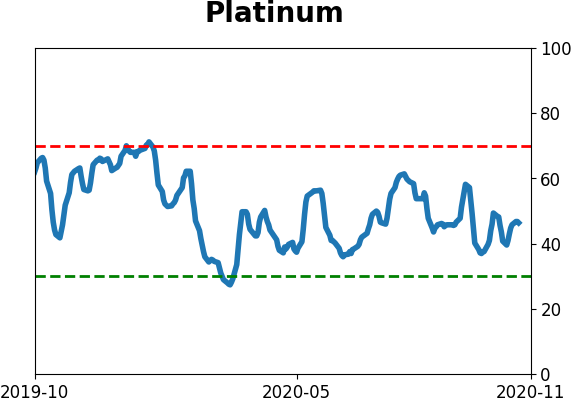
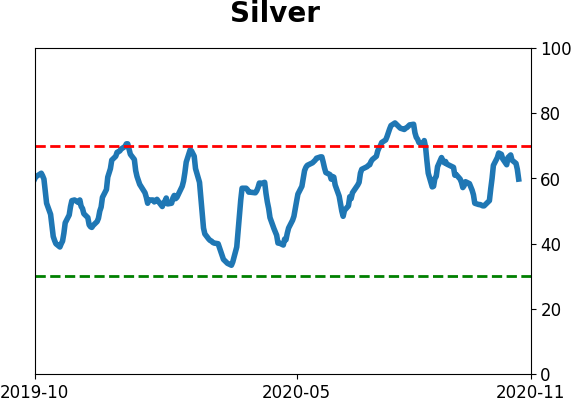
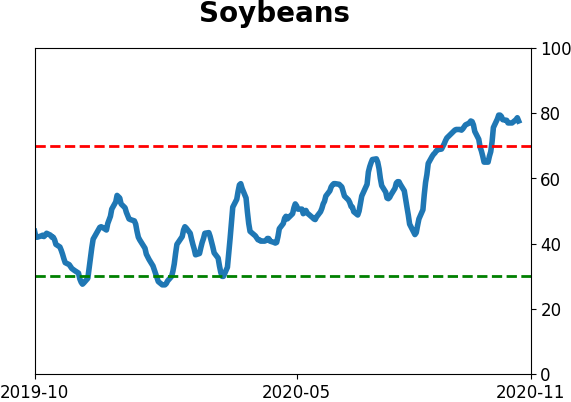
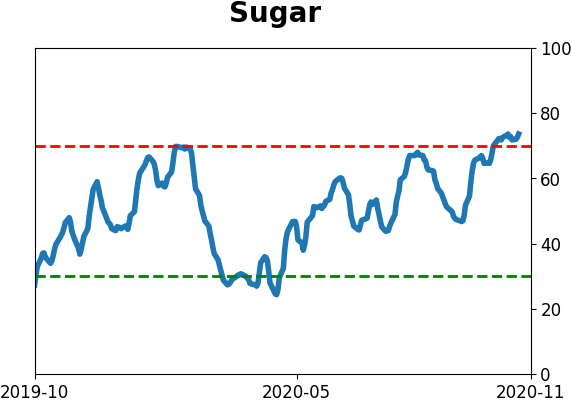
Commodity ETF's - 5-Day Moving Average
|
|