Headlines
|
|
Brazil Nears Panic Amid Historic Selling Pressure:
There has been heavy selling in Brazilian stocks. Breadth on the Ibovespa exchange has been historically bad, nearing the worst in 20 years. Panic conditions are setting in with indiscriminate selling, but it's not quite at a point that indicates a complete washout.
Bottom Line:
STOCKS: Weak buy
The speculative frenzy in February is wrung out. There are some signs of pessimism, but the most compelling data show that buyers consistently tend to return once the first signs of extreme momentum end, especially as we head into a seasonally positive time of year. See the Outlook & Allocations page for more. BONDS: Hold
Various parts of the market got hit in March, with the lowest Bond Optimism Index we usually see during healthy environments. Bond prices have modest recovered and there is no edge among the data we follow. GOLD: Hold
Gold and miners were rejected after trying to recover above their 200-day averages in May. Lately, some medium-term (not long-term) oversold extremes in breadth measures among miners have triggered.
|
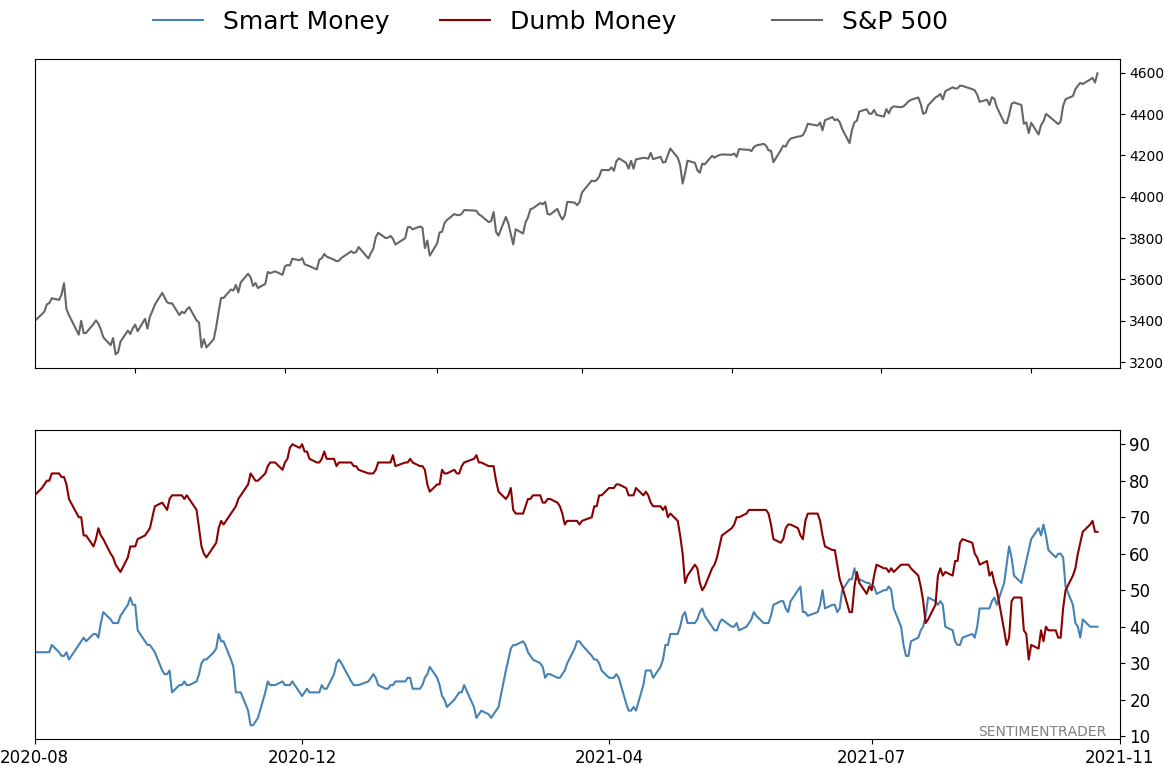
Smart / Dumb Money Confidence
|
Smart Money Confidence: 40%
Dumb Money Confidence: 66%
|
|
Risk Levels
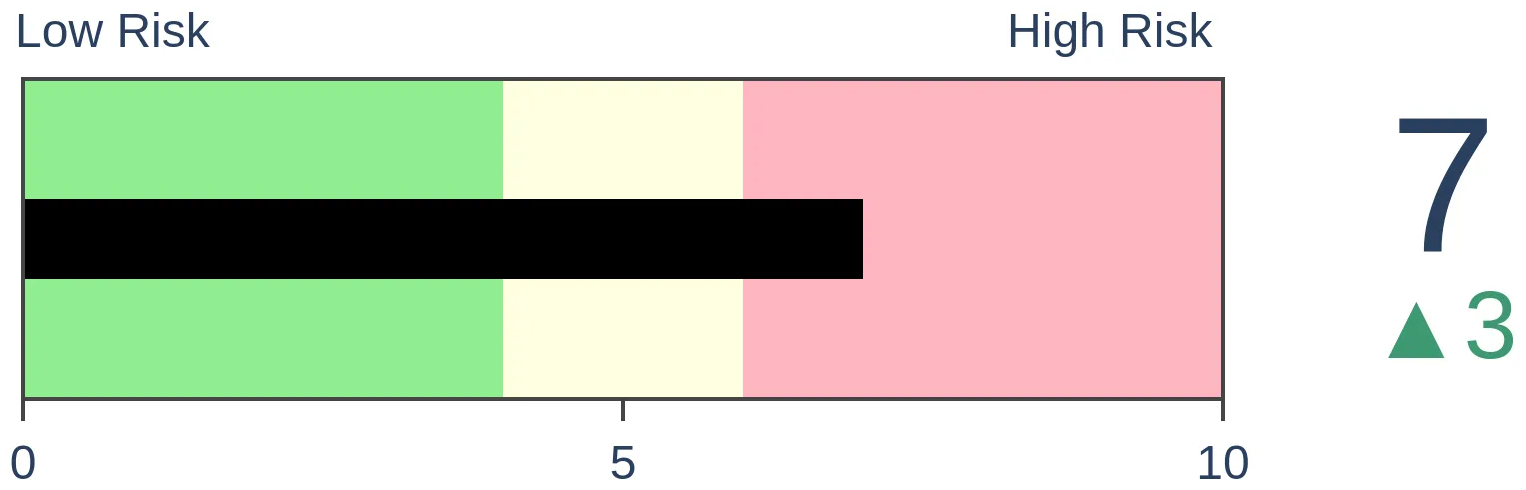
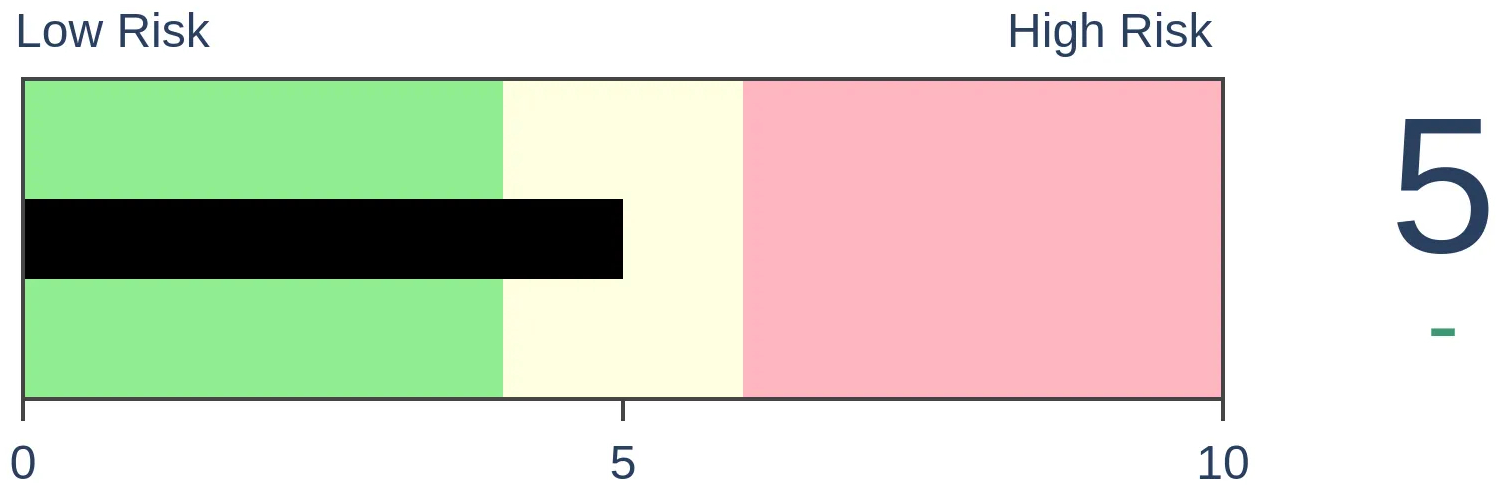
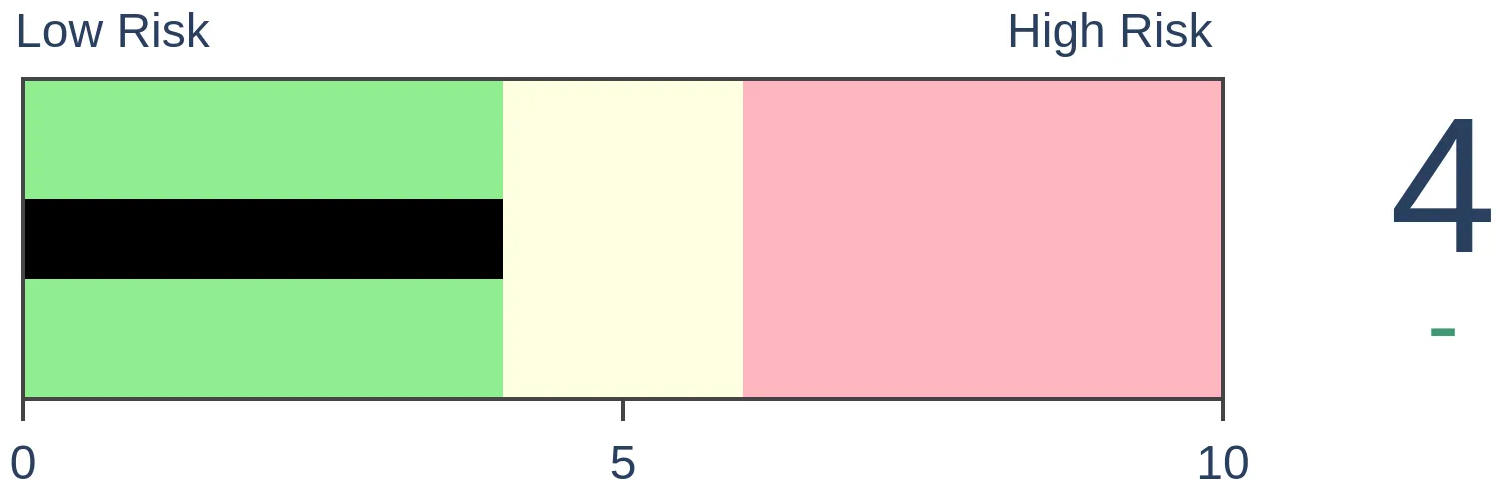
Stocks Short-Term
|
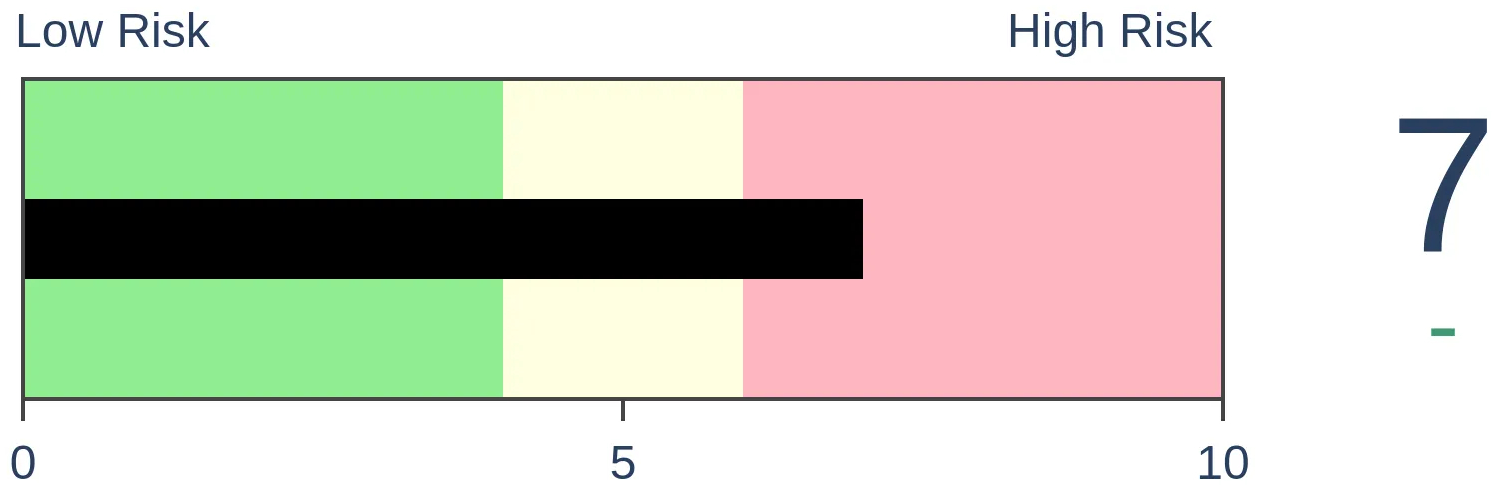
Stocks Medium-Term
|
|
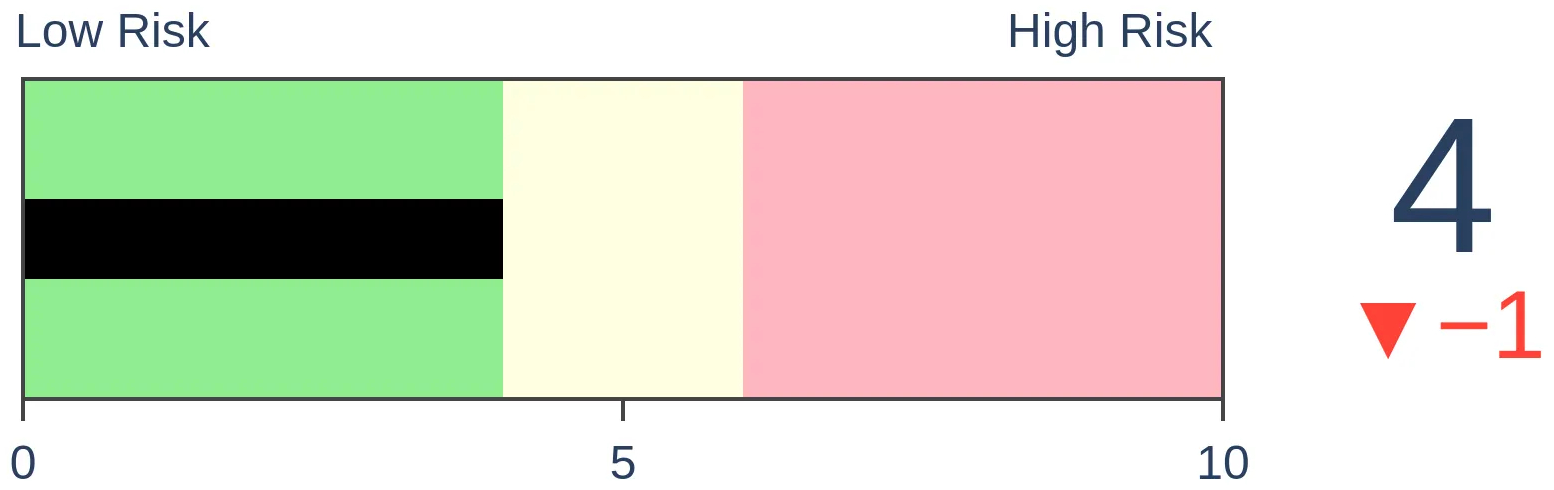
Bonds
|
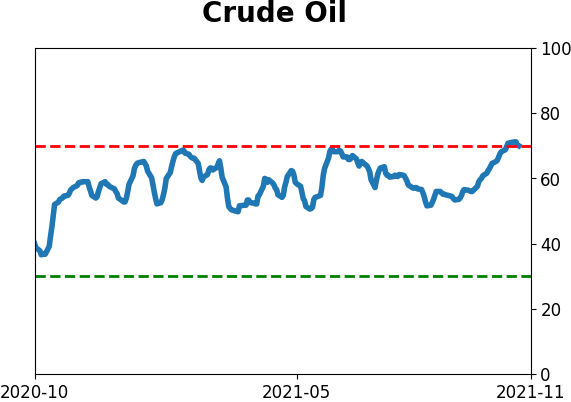
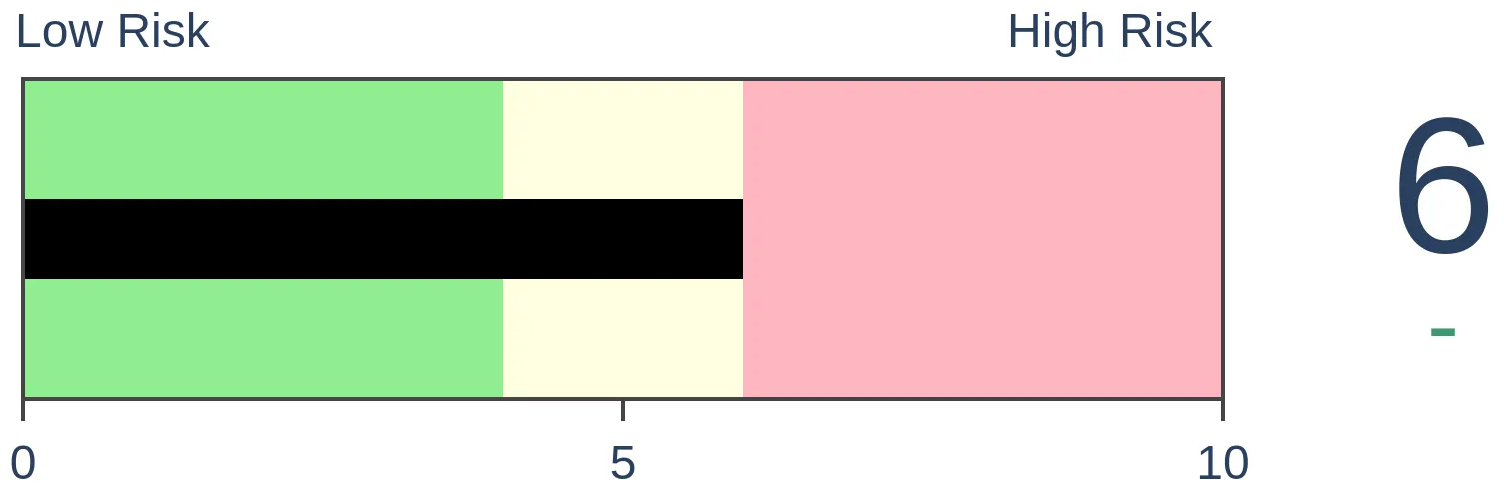
Crude Oil
|
|
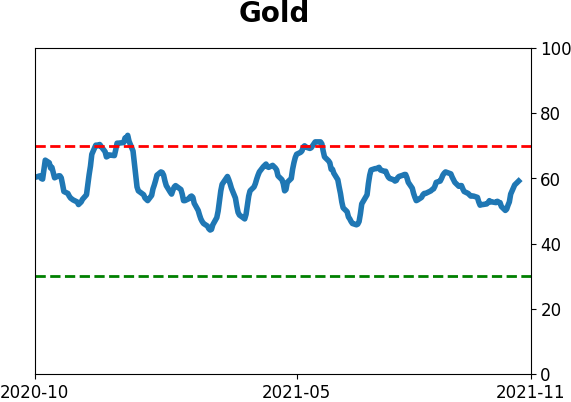
Gold
|
Agriculture
|
|
Research
By Jason Goepfert
BOTTOM LINE
There has been heavy selling in Brazilian stocks. Breadth on the Ibovespa exchange has been historically bad, nearing the worst in 20 years. Panic conditions are setting in with indiscriminate selling, but it's not quite at a point that indicates a complete washout.
FORECAST / TIMEFRAME
EWZ -- Up, Long-Term
|
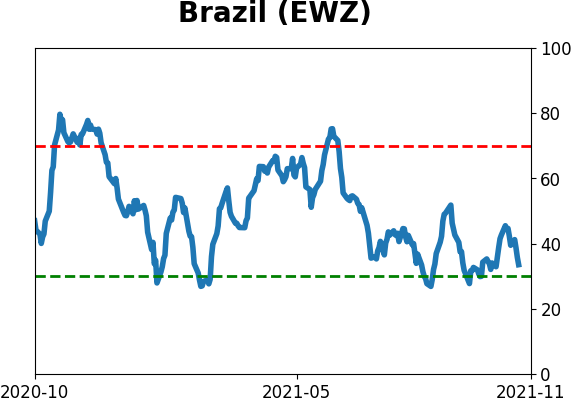
Brazil is a mess, and investors are panicking.
In recent days, selling pressure has been heavy enough and broad enough to hint at indiscriminate selling. Investors have been focused less on positives like plunging Covid cases and surging demand for commodities, and more on negatives like political turmoil and rising interest rates.
Per Bloomberg:
"Local assets have tumbled in recent days as President Jair Bolsonaro's administration seeks ways to boost spending ahead of next year's election and bypass fiscal rules meant to keep budgets in check."
And CNBC:
"The first problem is a slowdown in China that will likely have a knock-on effect on Brazil as one of its largest trading and export partners."
HISTORICALLY POOR BREADTH
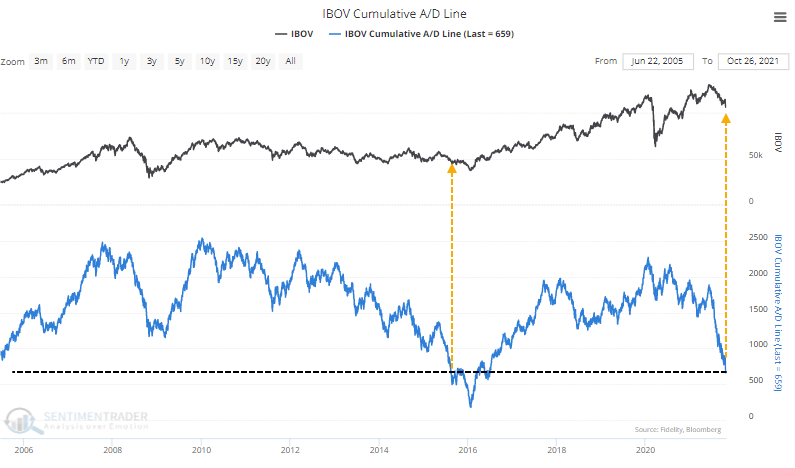
Breadth metrics are horrid. So many stocks on the Ibovespa exchange have been declining consistently that the Cumulative Advance/Decline Line has plunged to the 2nd-lowest level in 15 years.
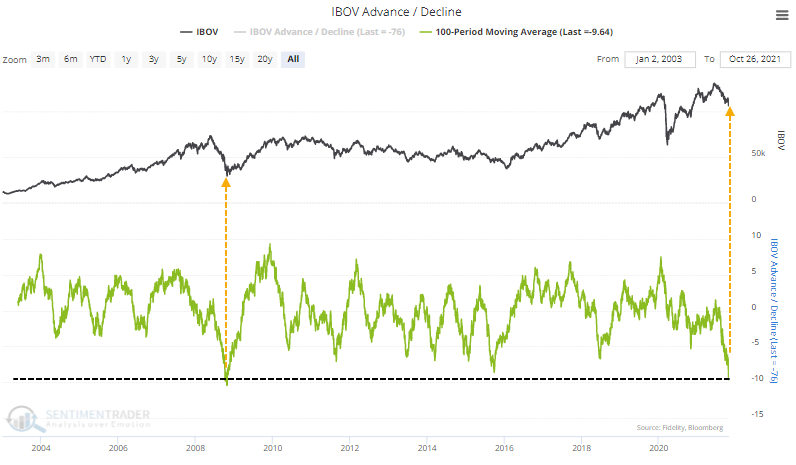
On an average day during the past 100 sessions, 10 more stocks have declined than advanced. That's an abysmal stretch that few sectors or indexes have matched in the past 20 years. For the Ibovespa, it's the 2nd-lowest reading since 1998, barely exceeded by late October 2008.
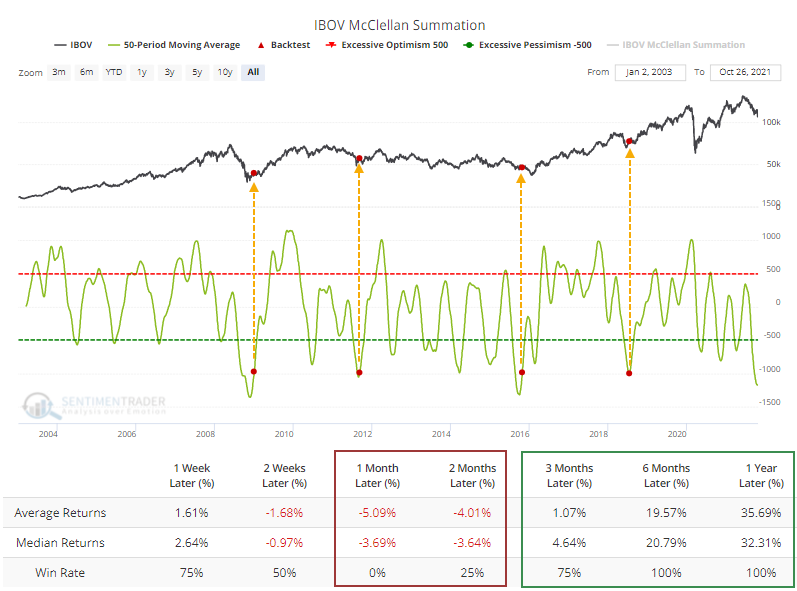
Such poor internal momentum has pushed the McClellan Summation Index for Brazilian stocks below -1000 and kept it there for most of the past few months. It's been below -975 for 56 trading days, eclipsed only by the 60 days it spent below that threshold in November 2008.
After other times a 50-day average of the Summation Index fell below -1000 and started to curl higher, the Ibovespa did exceedingly well over the medium- to long-term after suffering shorter-term volatility. The Backtest Engine shows an average gain of 36% over the next year. It hasn't triggered yet; momentum needs to stop sliding first.
SELLING PRESSURE SHOWS NEAR-PANIC
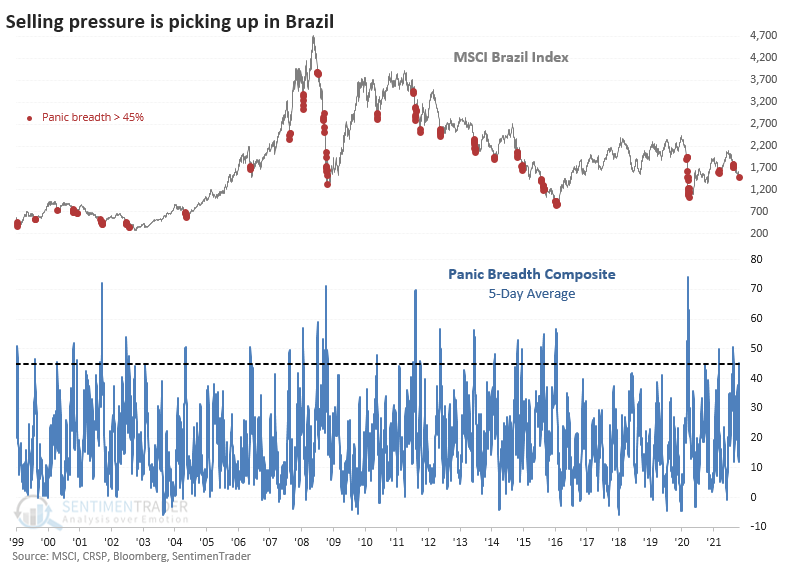
Like we did with the Hang Seng and Industrials sector in September, we can calculate a Breadth Panic model that aggregates the kinds of internal measures which spike when investors sell everything at once.
Over the past week, that has averaged 45%, ranking in the top 3% of all days since 1999. It has spiked even higher during all-out crashes, so there is room for it to get more extreme if things truly collapse.
But it's not just the past week. Over the last 90 days, the Breadth Panic has risen to the highest level in 7 years.
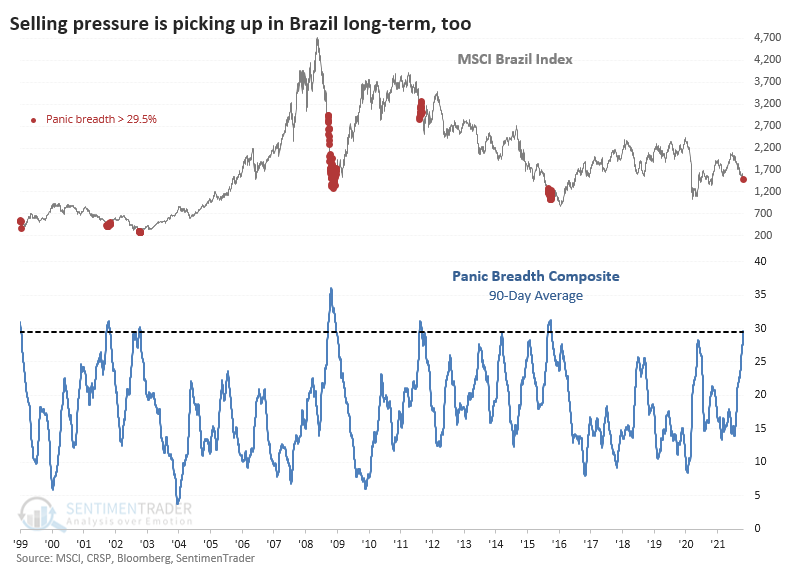
There have only been a handful of times when both the 5-day and 90-day averages were comparable to what we're seeing now.
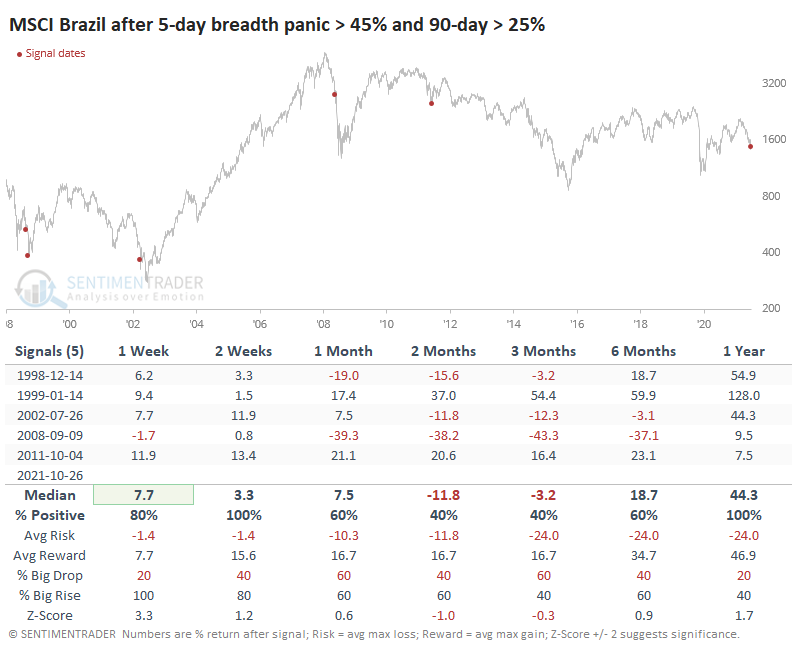
These were not automatic buy signals. Even though the MSCI Brazil Index (on which the EWZ fund is based) rallied each time over the next year, the drawdowns on a couple of them were horrendous. And with a tiny sample size, such variability makes the signal even more unreliable than it would otherwise be.
There are two things to watch for a better potential opportunity:
- Outright panic that pushes 50% or more of stocks to new lows (it reached just over 30% last week)
- Enough of a recovery to stop the McClellan Summation Index from falling and curl decisively higher
Neither one guarantees a positive return, especially in the weeks ahead. Conditions like that tend to coincide with high volatility over a multi-week to multi-month time frame. But over the next 6-12 months, either condition should lead to significantly higher prices.
Active Studies
| Time Frame | Bullish | Bearish | | Short-Term | 2 | 0 | | Medium-Term | 8 | 0 | | Long-Term | 11 | 5 |
|
Indicators at Extremes
Portfolio
| Position | Description | Weight % | Added / Reduced | Date | | Stocks | RSP | 10.7 | Added 6.4% | 2021-10-01 | | Bonds | 32.7% BND, 7.1% SCHP | 39.8 | Added 8.3% | 2021-10-26 | | Commodities | GCC | 2.4 | Reduced 2.1%
| 2020-09-04 | | Precious Metals | GDX | 4.6 | Reduced 4.2% | 2021-05-19 | | Special Situations | 9.8% KWEB, 4.7% XLE, 2.9% PSCE | 17.3 | Added 9.78% | 2021-10-01 | | Cash | | 24.1 | | |
|
Updates (Changes made today are underlined)
Much of our momentum and trend work has remained positive for several months, with some scattered exceptions. Almost all sentiment-related work has shown a poor risk/reward ratio for stocks, especially as speculation drove to record highs in exuberance in February. Much of that has worn off, and most of our models are back toward neutral levels. There isn't much to be excited about here. The same goes for bonds and even gold. Gold has been performing well lately and is back above long-term trend lines. The issue is that it has a poor record of holding onto gains when attempting a long-term trend change like this, so we'll take a wait-and-see approach. Momentum has ebbed quickly in recent weeks, and nearing oversold levels in some indicators. This can be a dangerous area, with a lot of short-term volatility, but we'd be more inclined to add medium- to long-term exposure rather than sell on much more of a decline, thanks to already rock-bottom exposure. Other areas look more attractive, including some overseas markets. RETURN YTD: 11.0% 2020: 8.1%, 2019: 12.6%, 2018: 0.6%, 2017: 3.8%, 2016: 17.1%, 2015: 9.2%, 2014: 14.5%, 2013: 2.2%, 2012: 10.8%, 2011: 16.5%, 2010: 15.3%, 2009: 23.9%, 2008: 16.2%, 2007: 7.8%
|
|
Phase Table
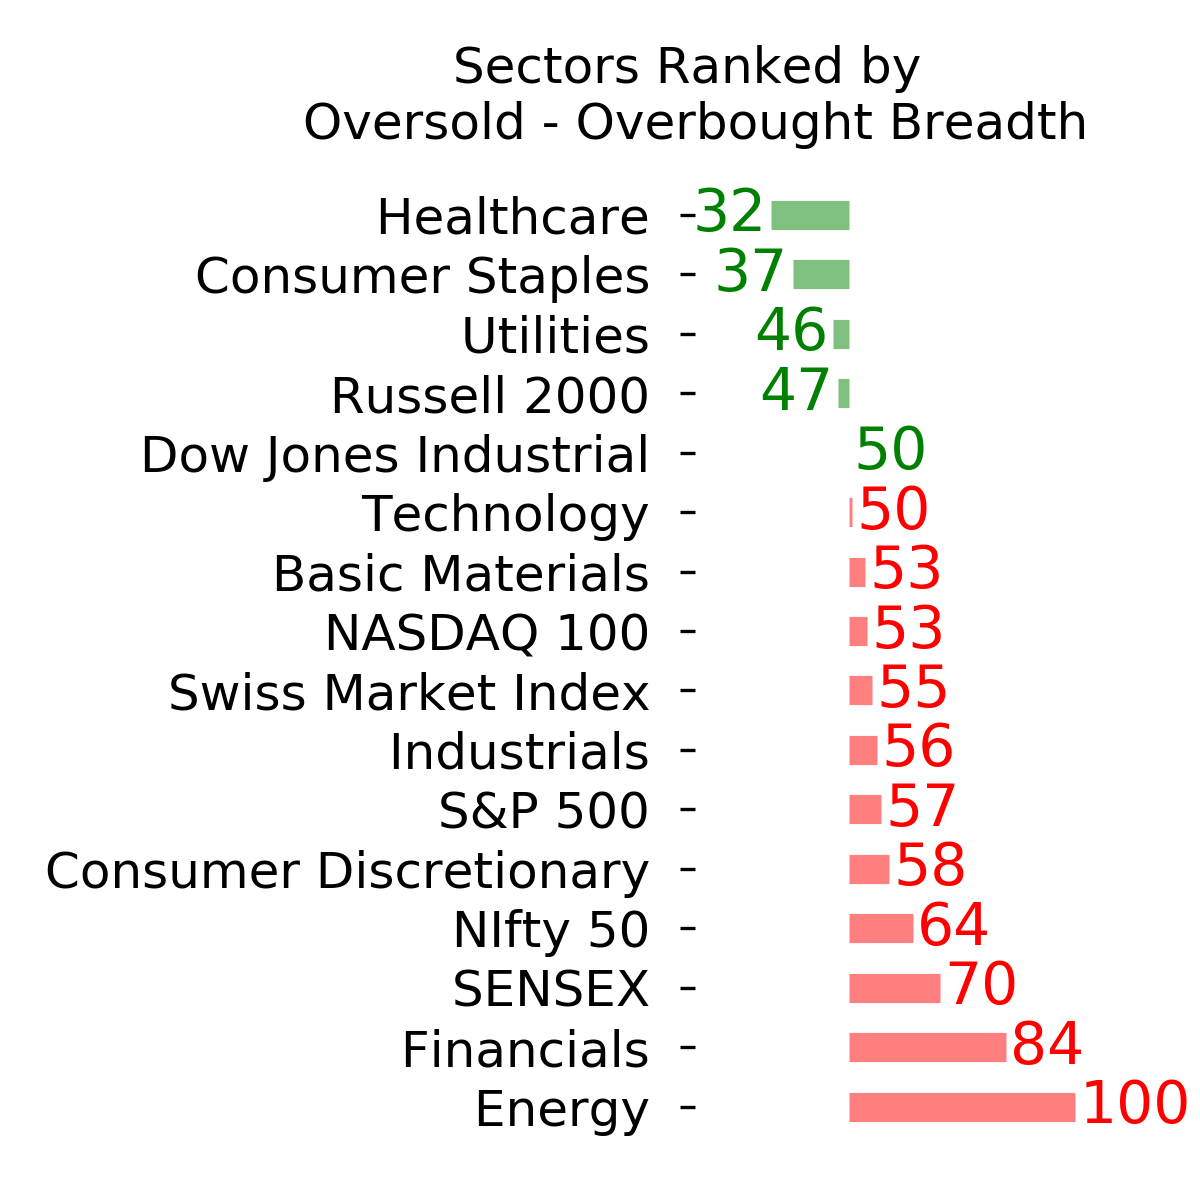
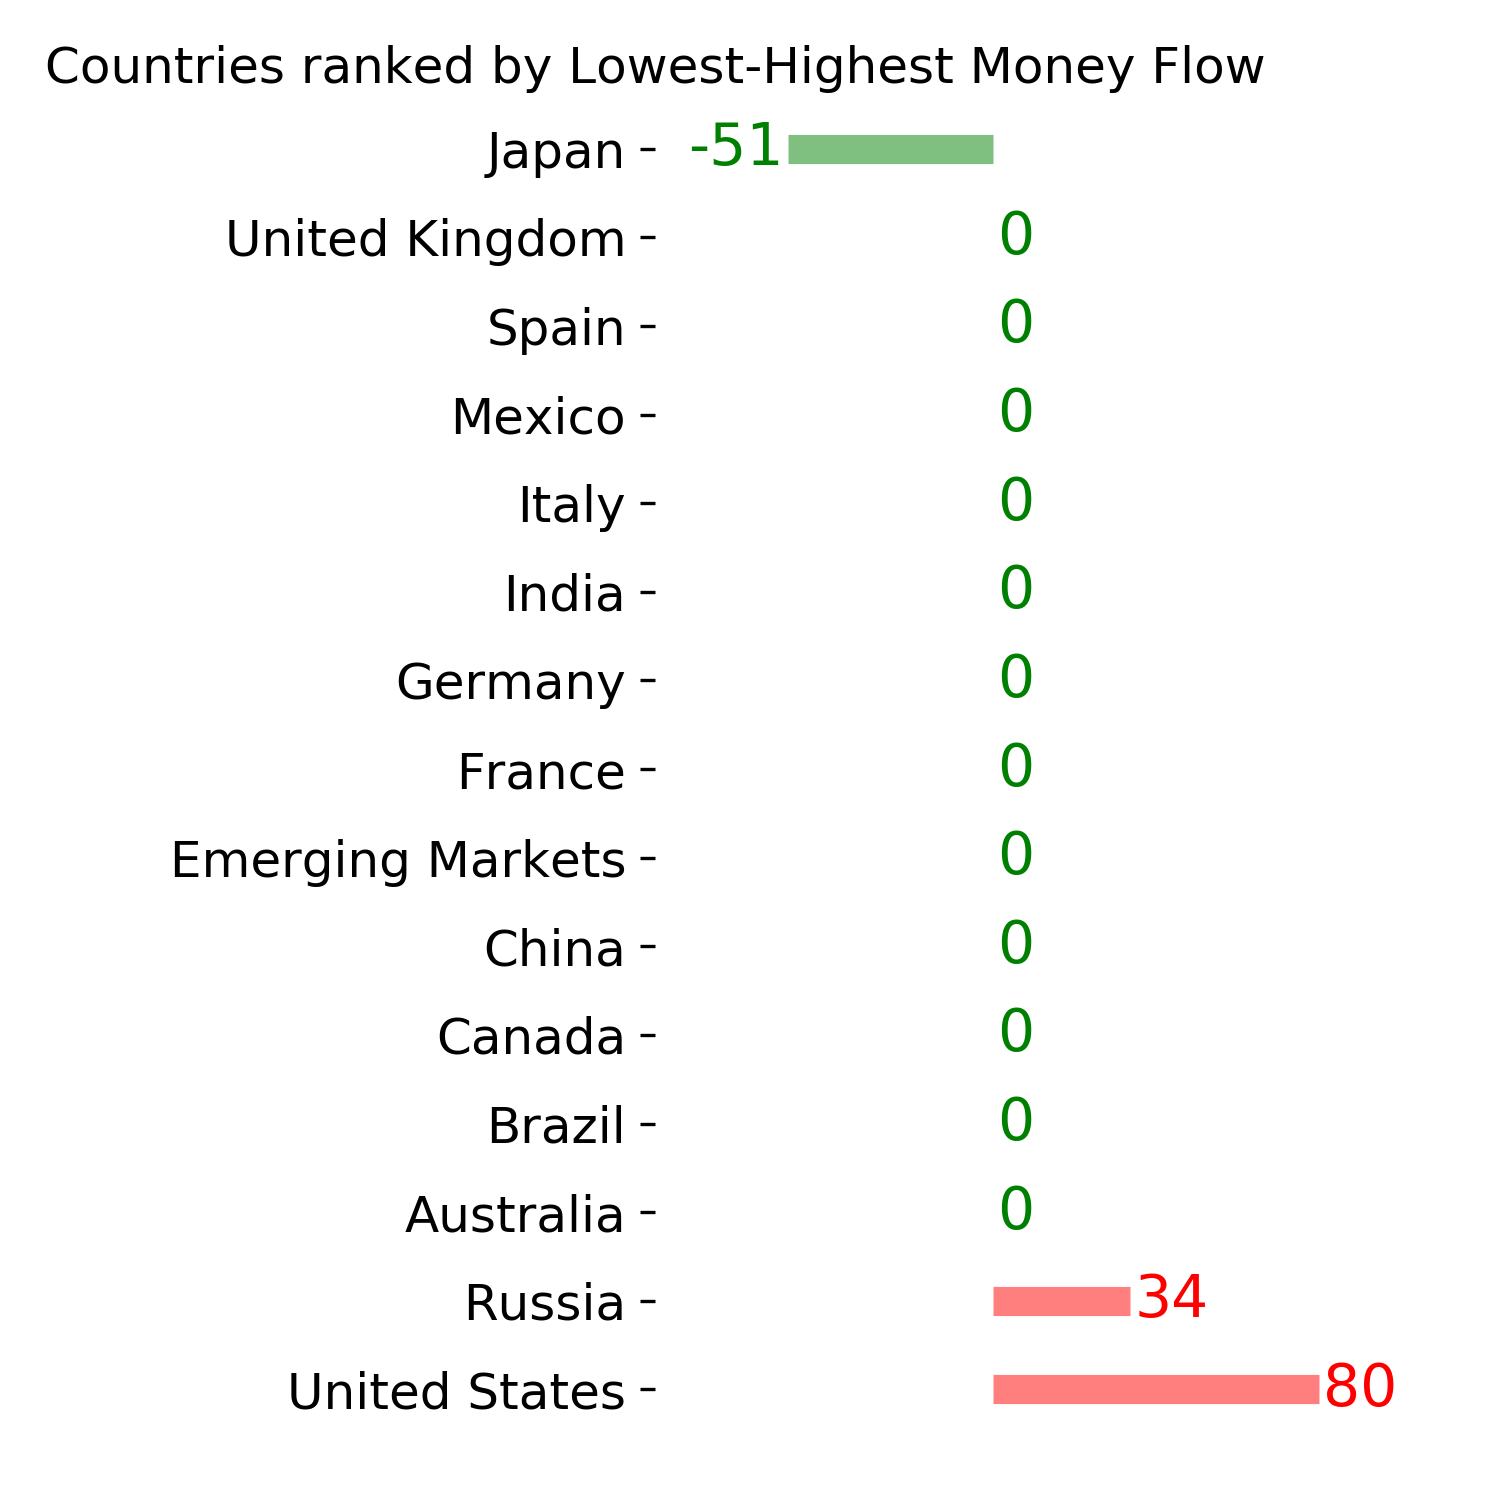
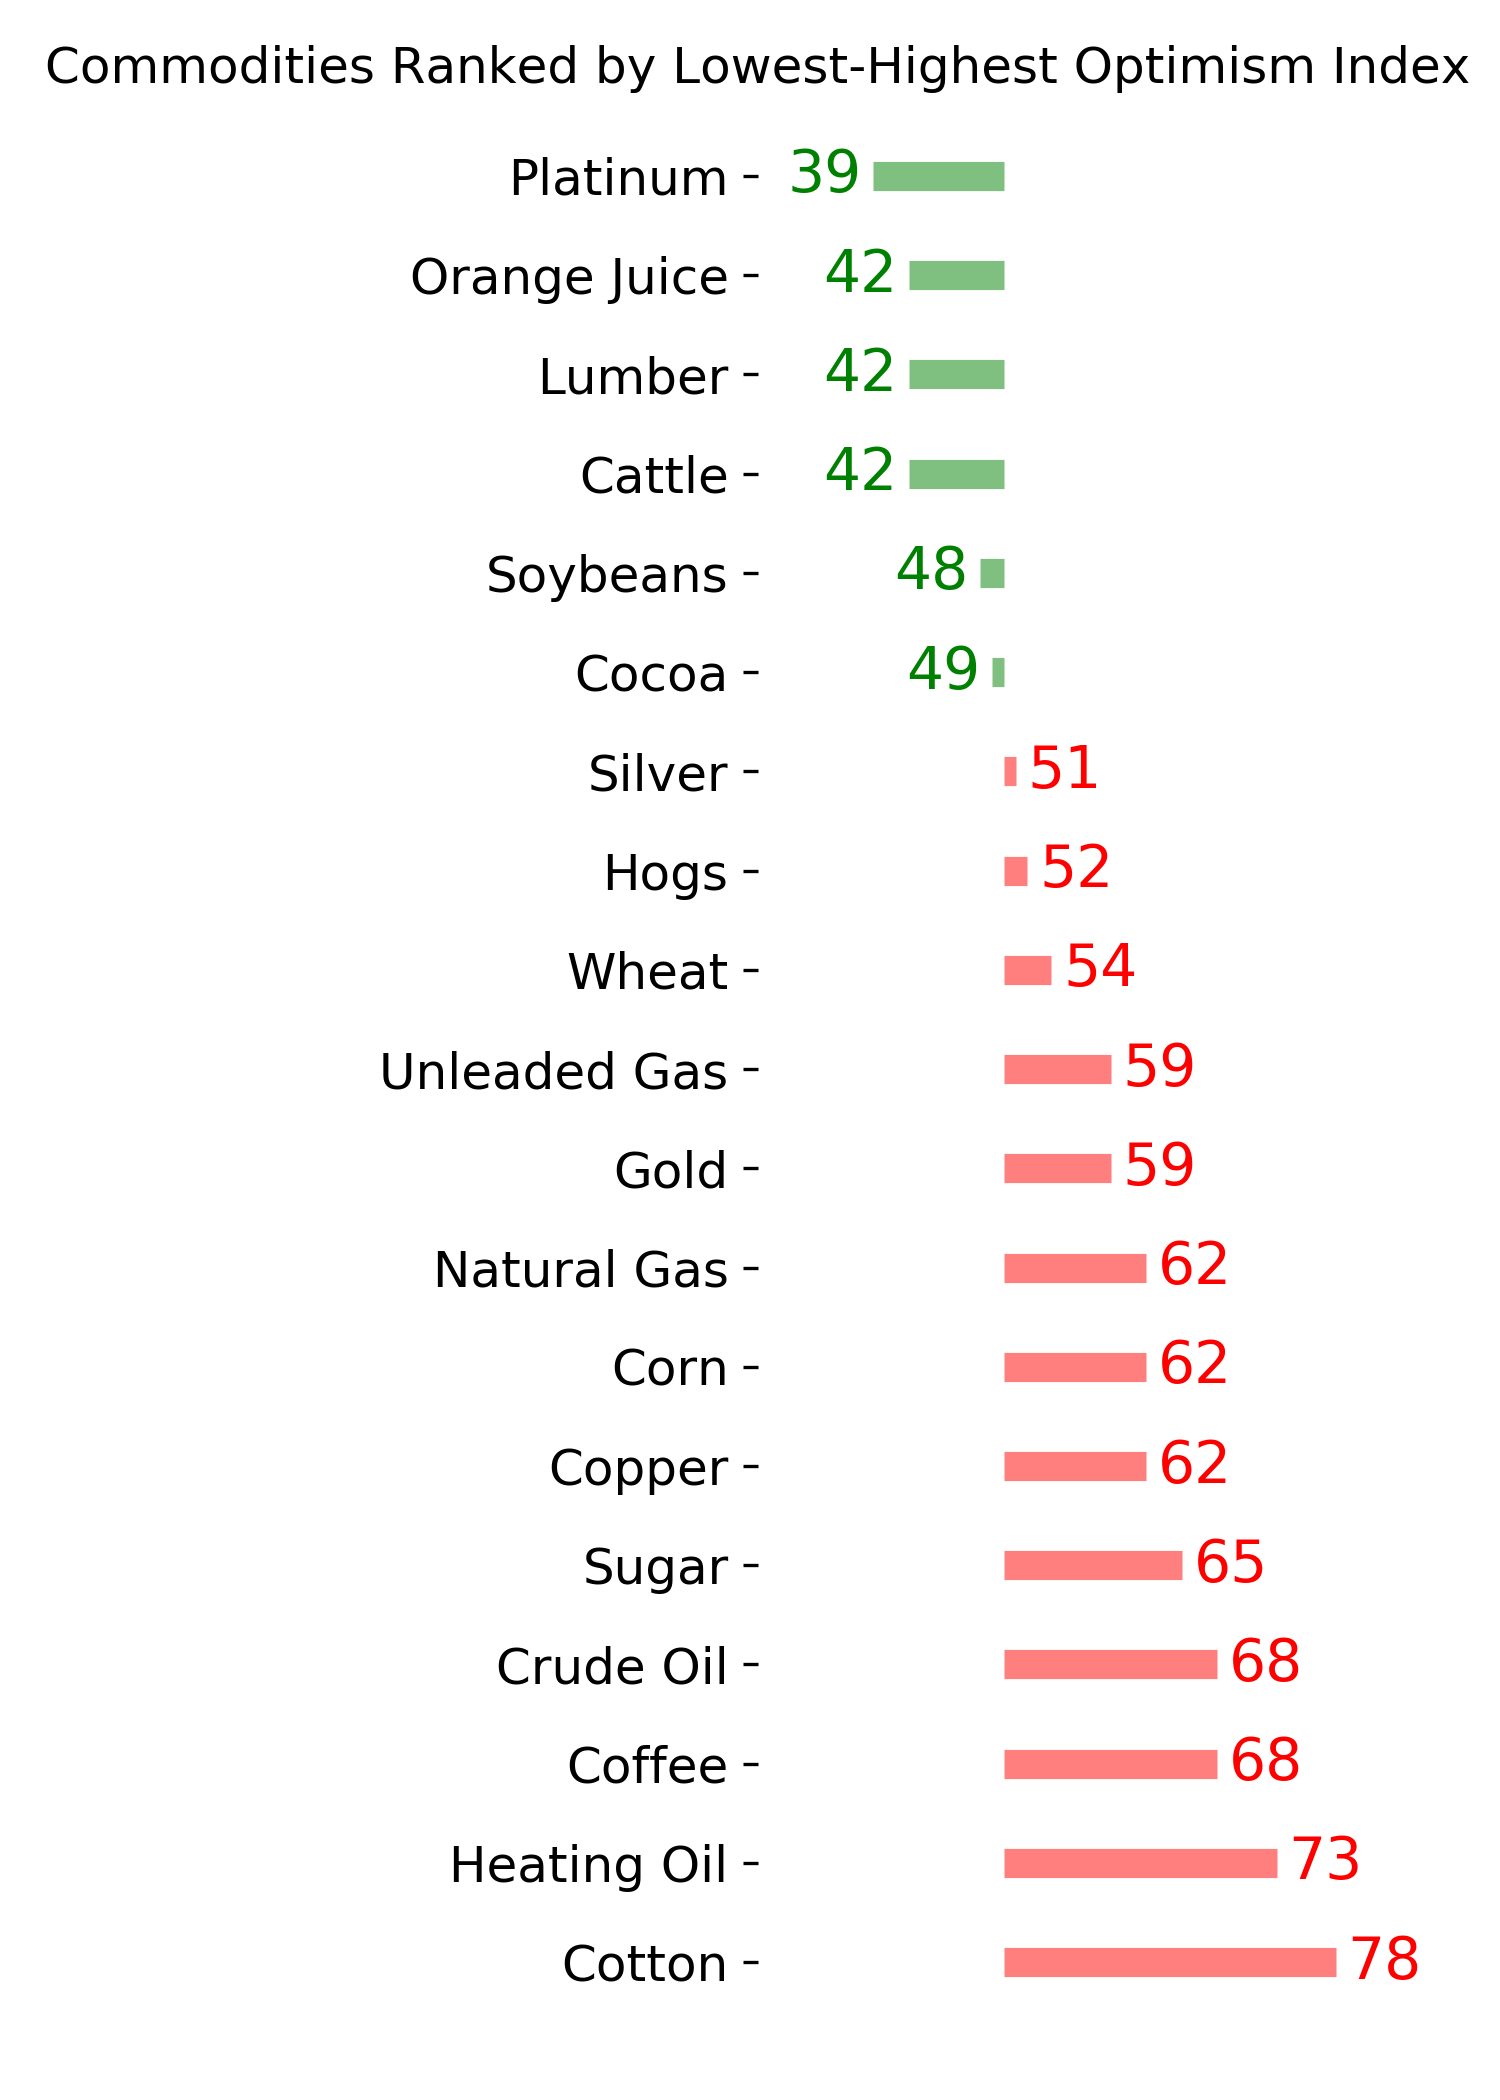
Ranks
Sentiment Around The World
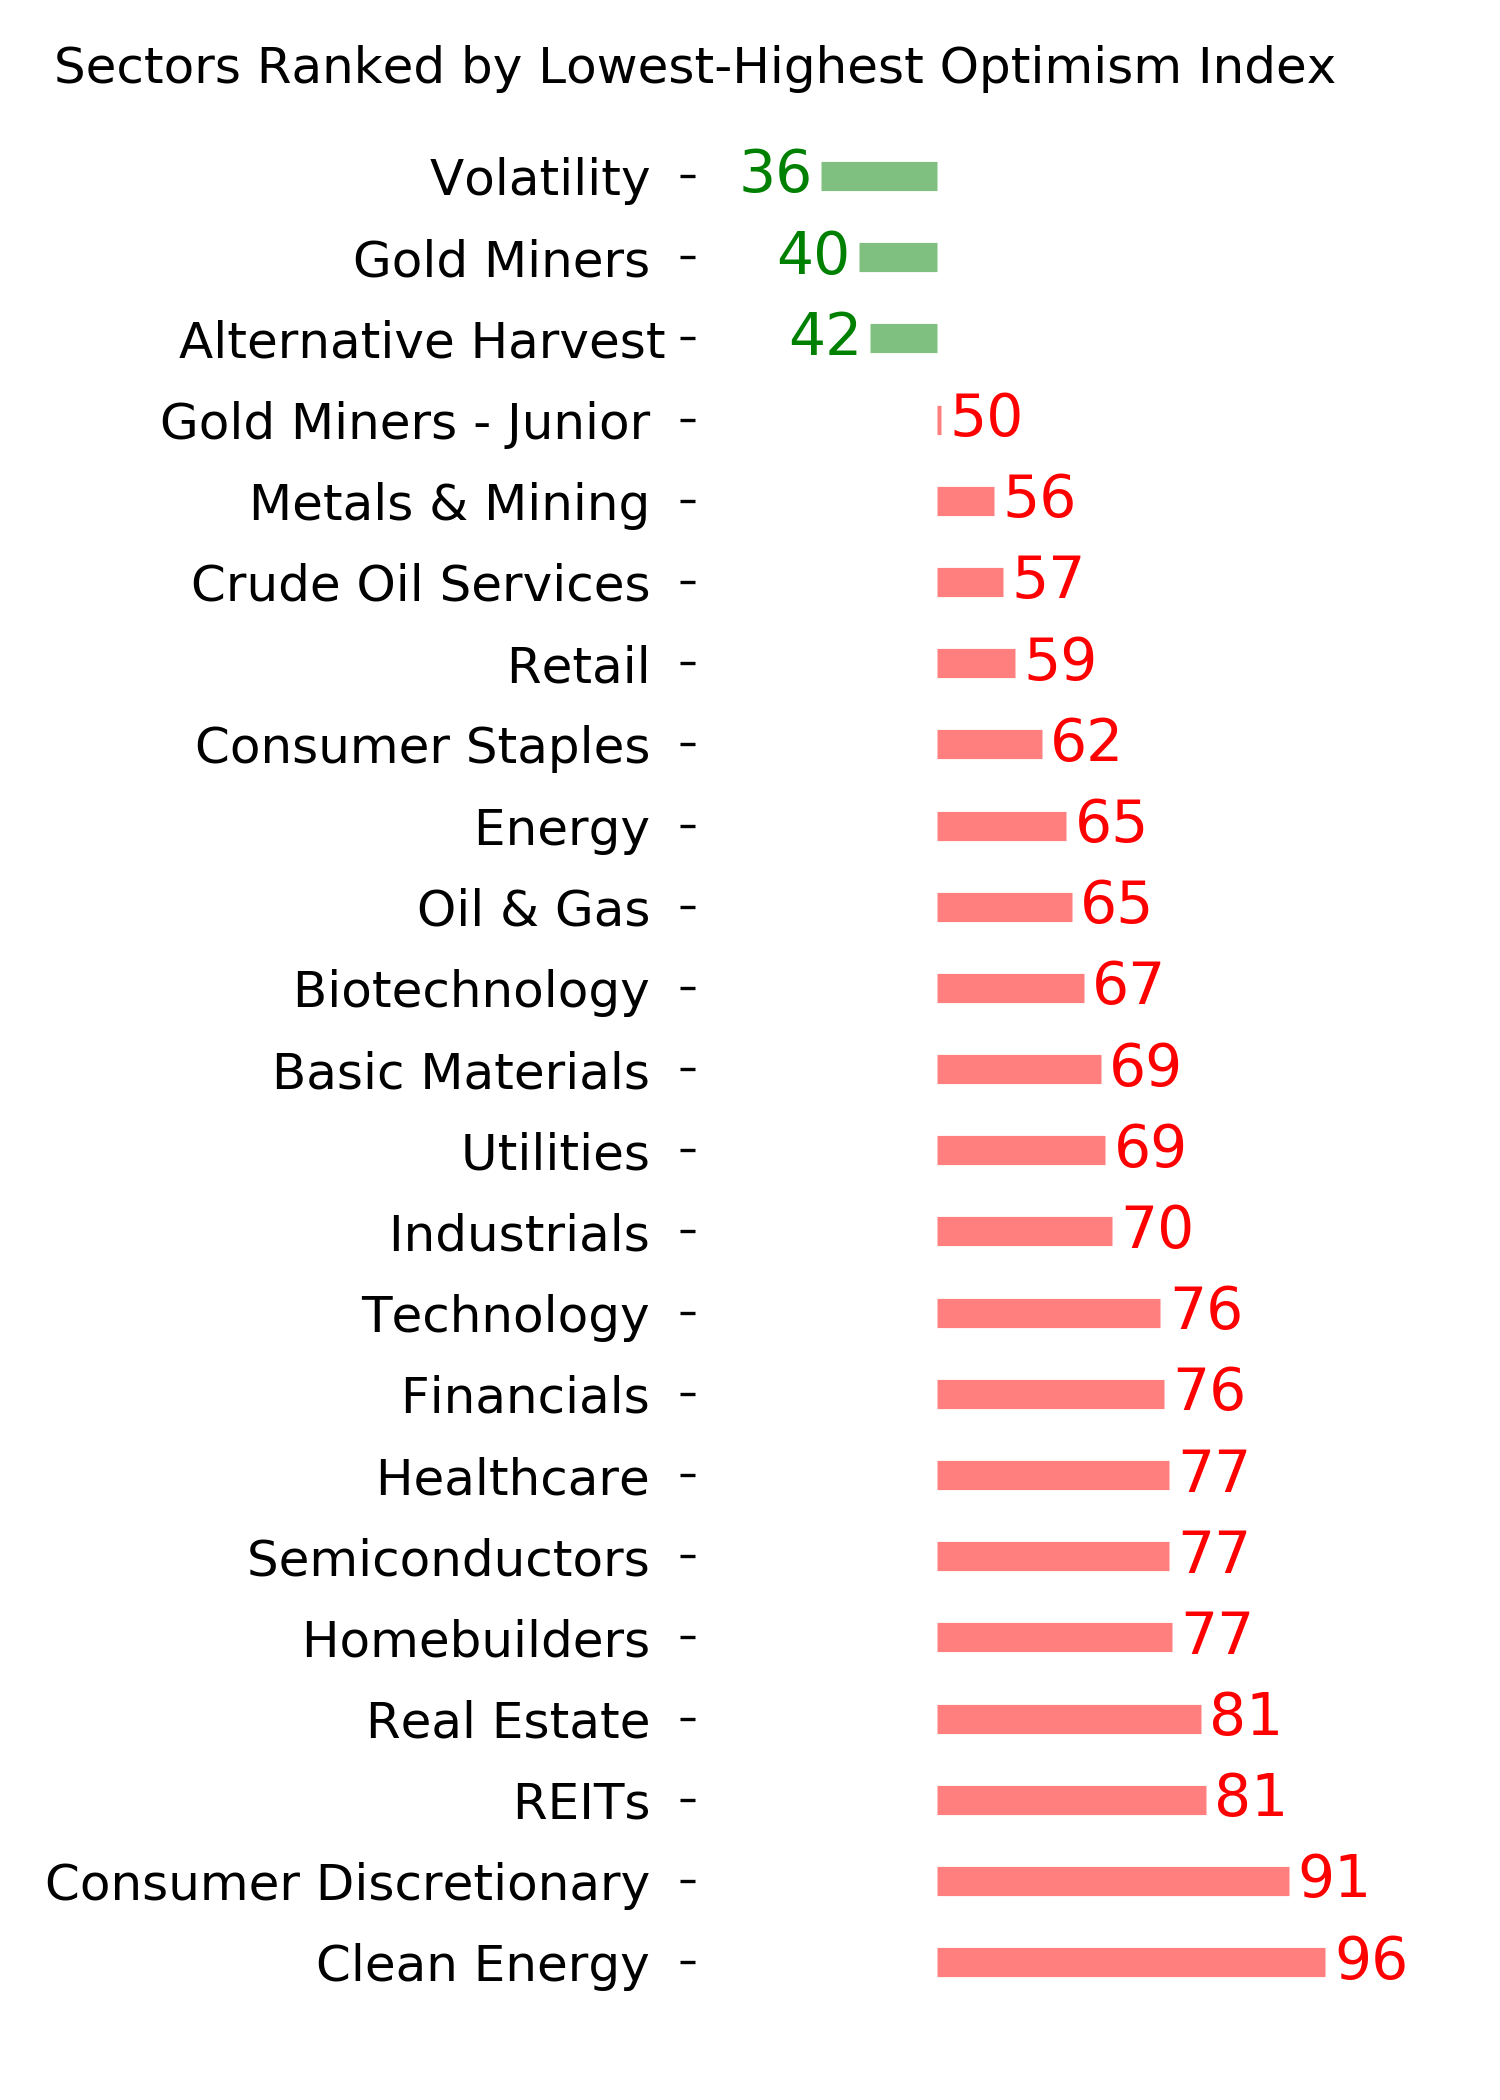
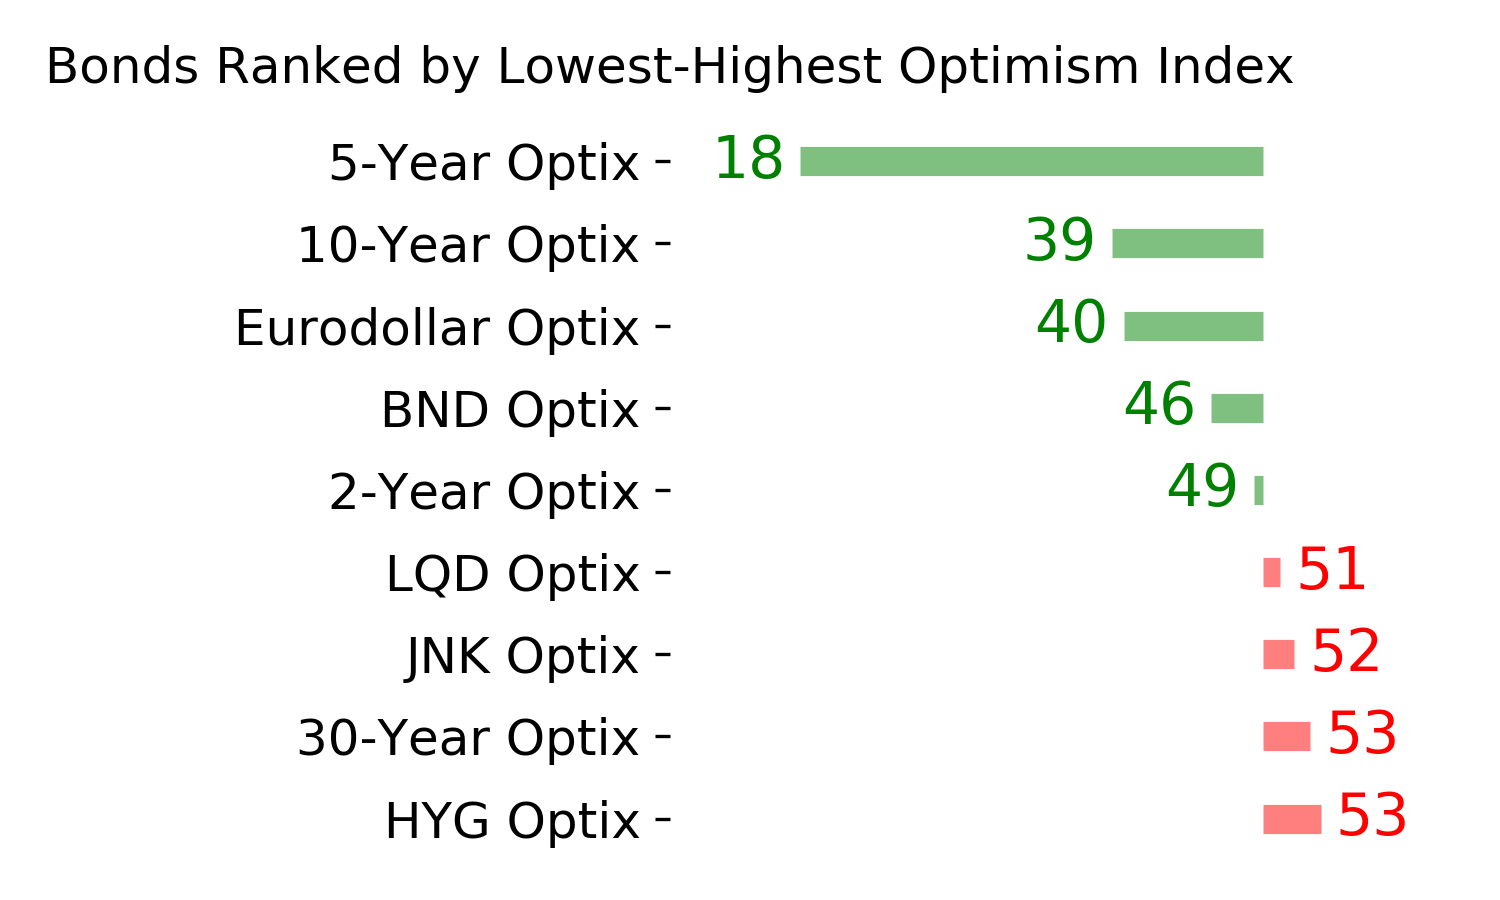
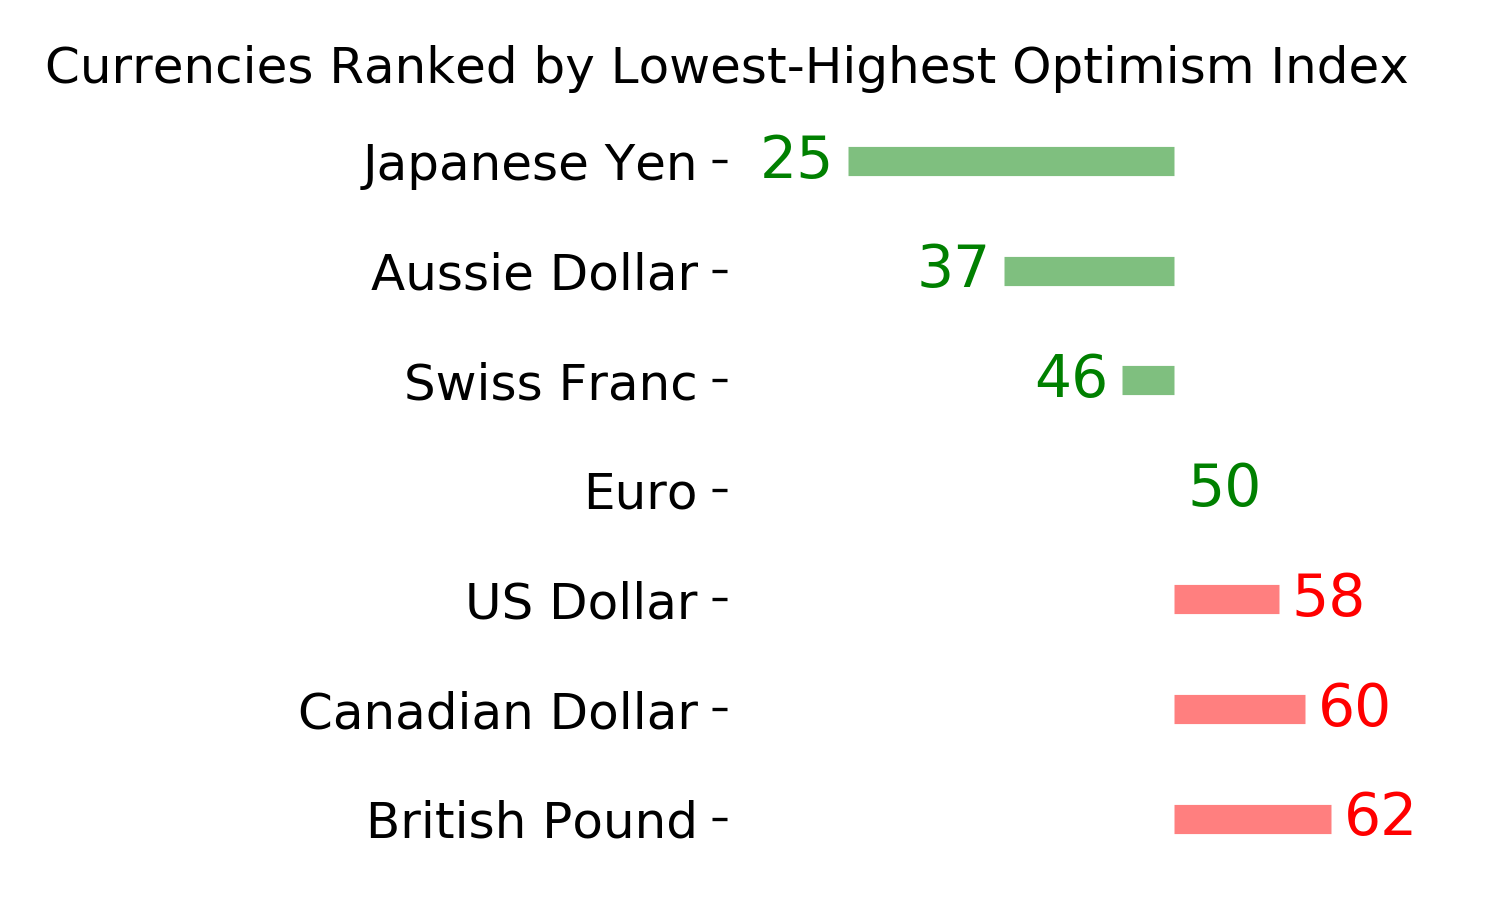
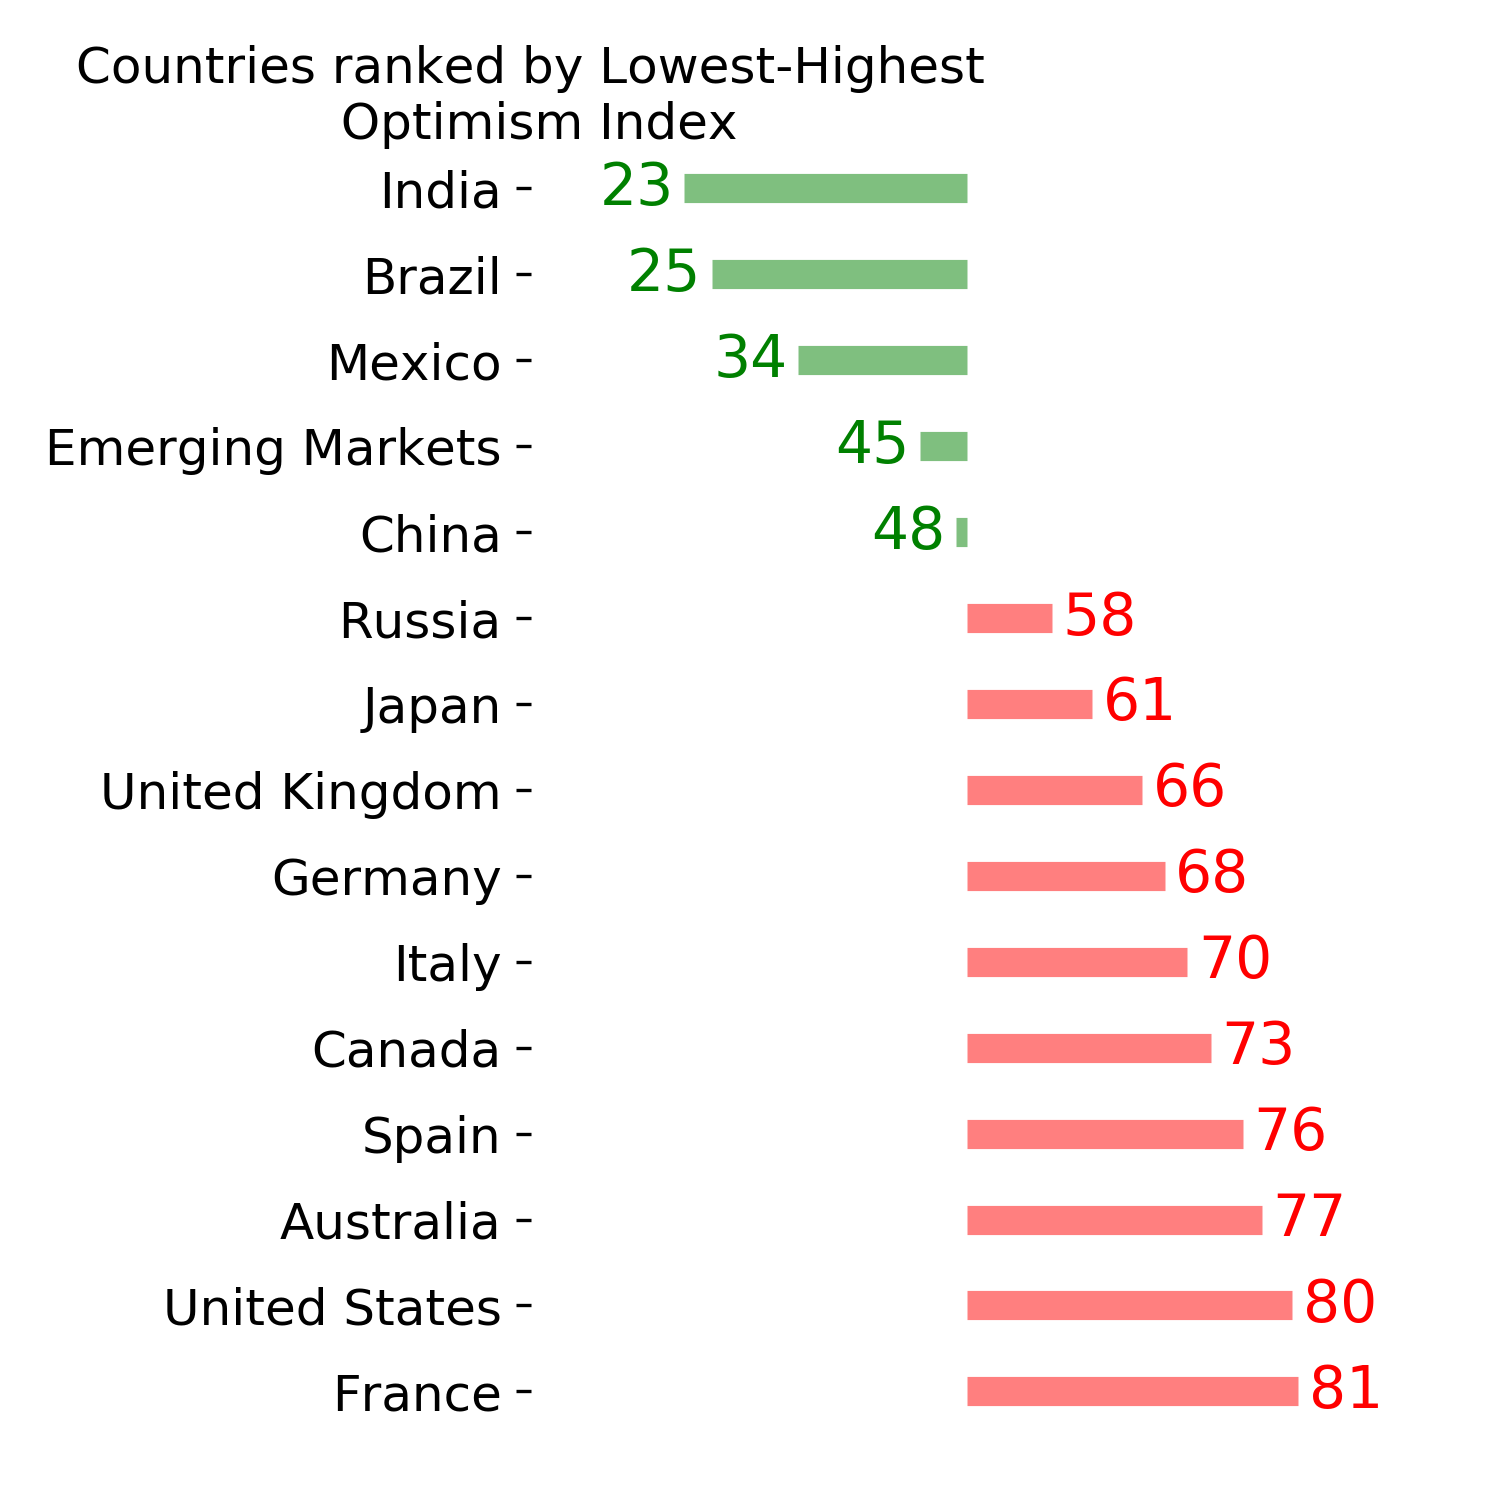
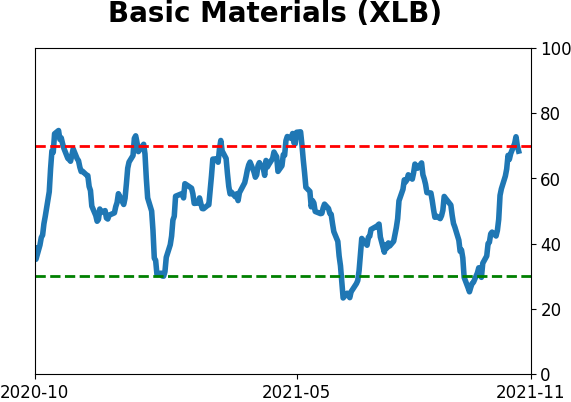
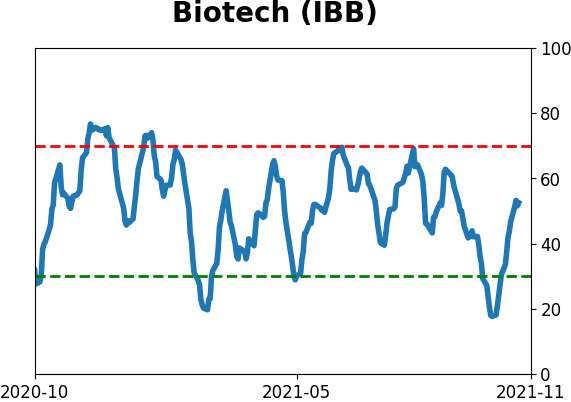
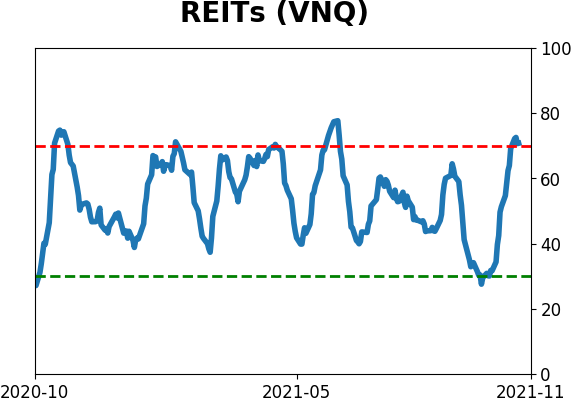
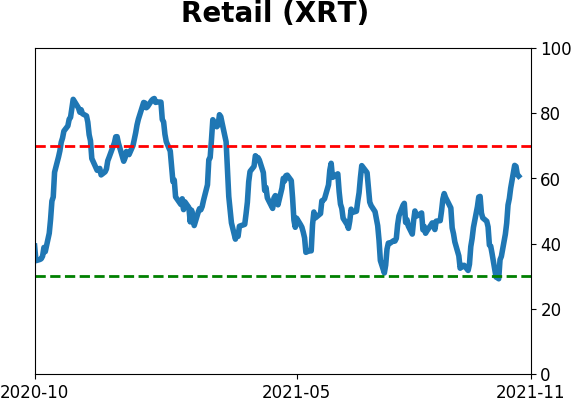
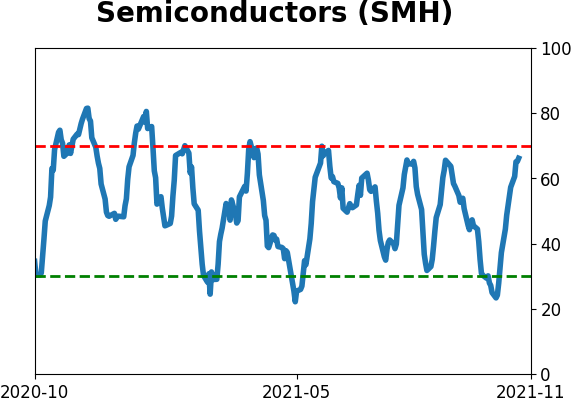
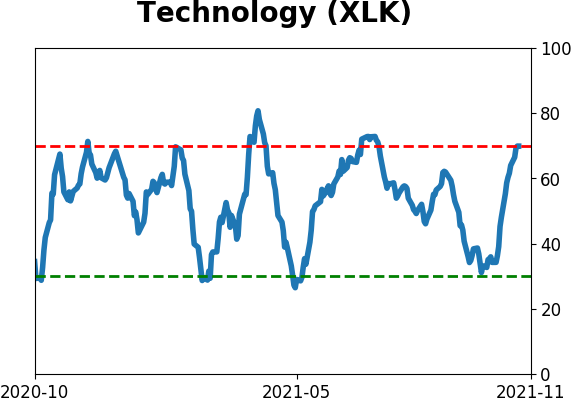
Optimism Index Thumbnails
|
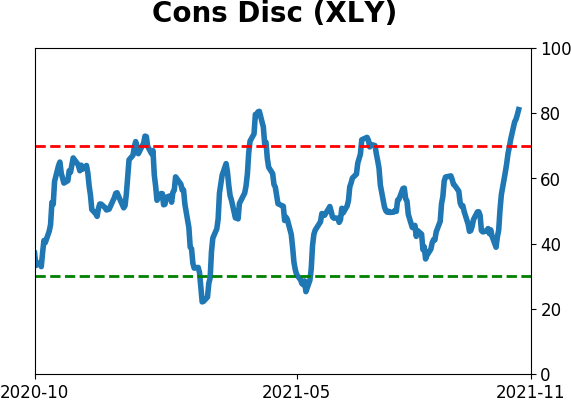
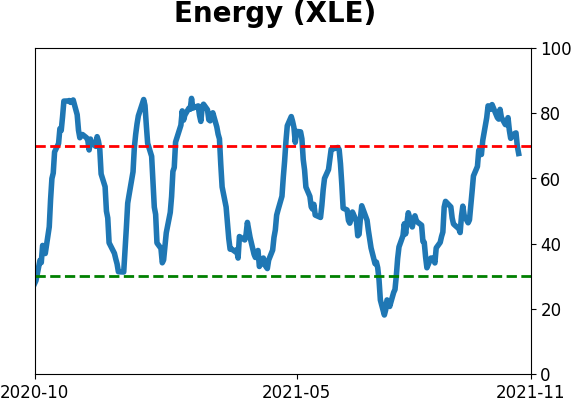
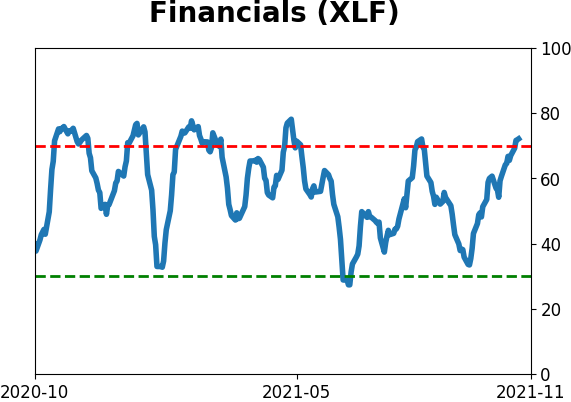
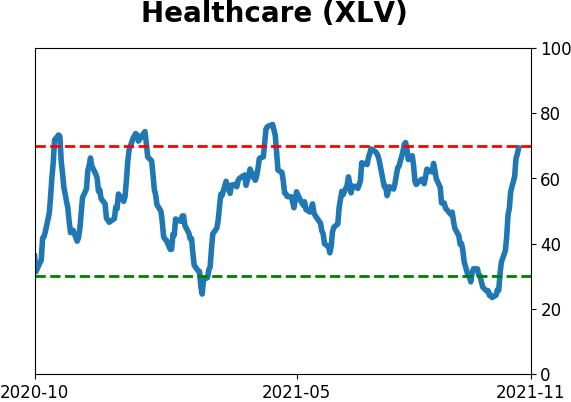
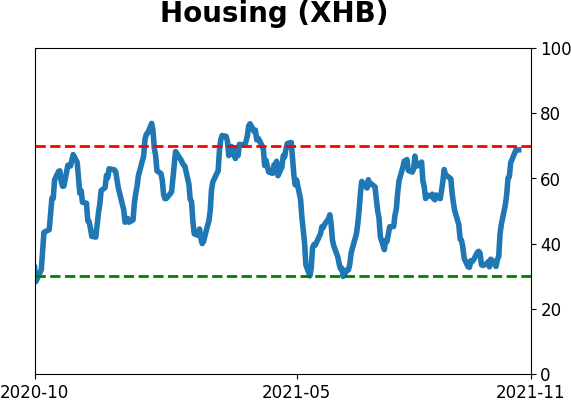
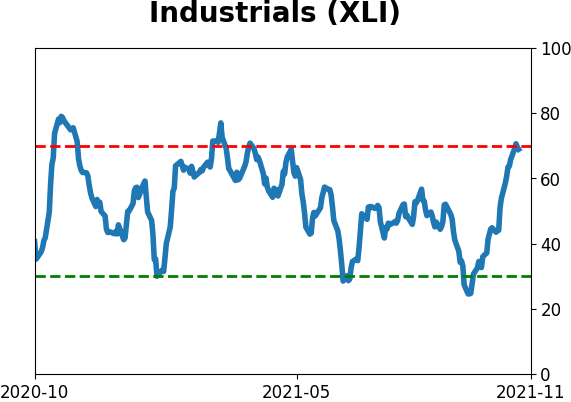
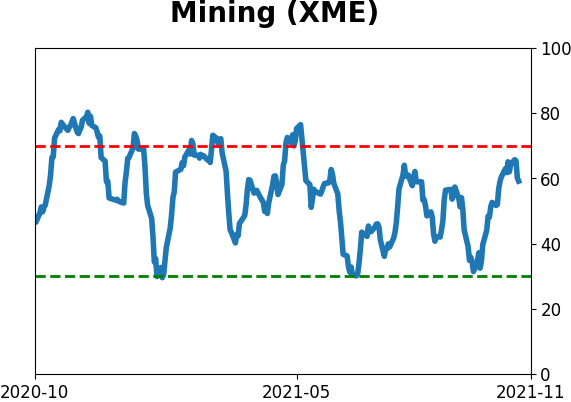
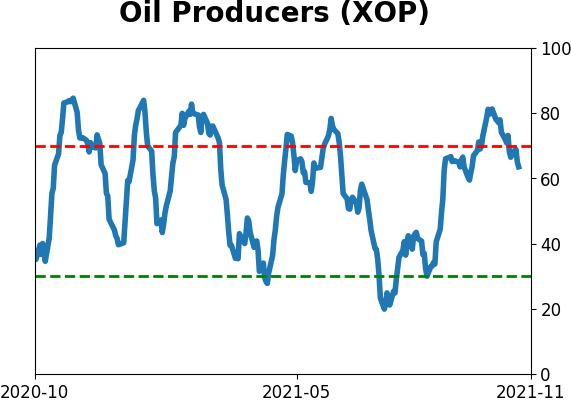
Sector ETF's - 10-Day Moving Average
|
|
|
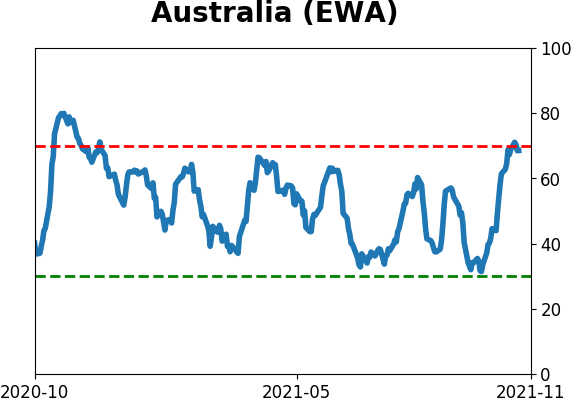
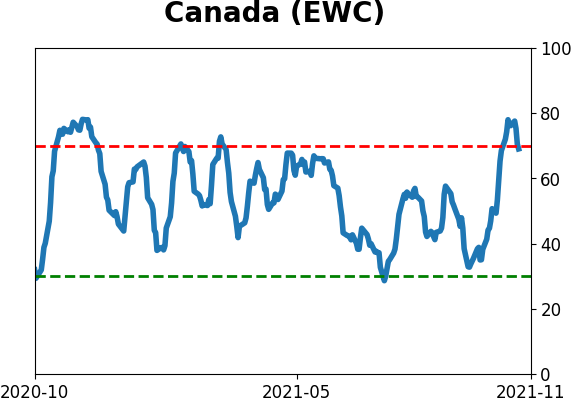
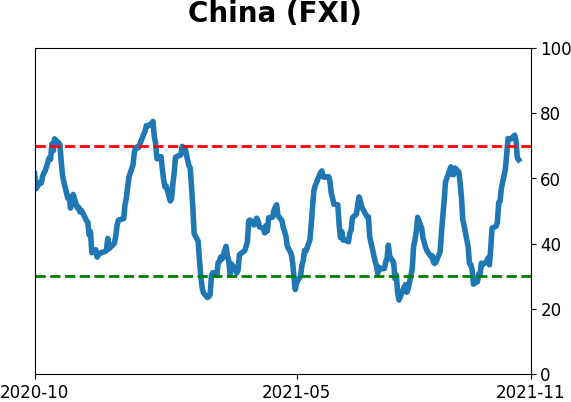
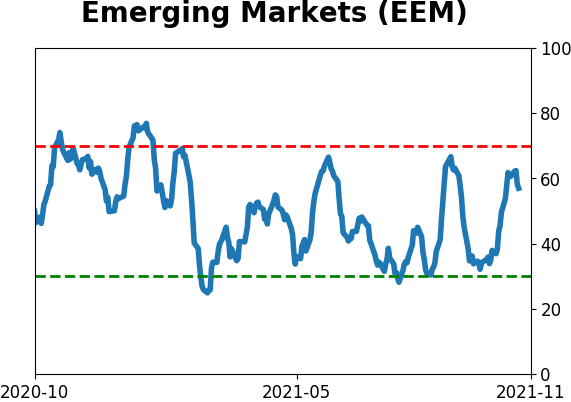
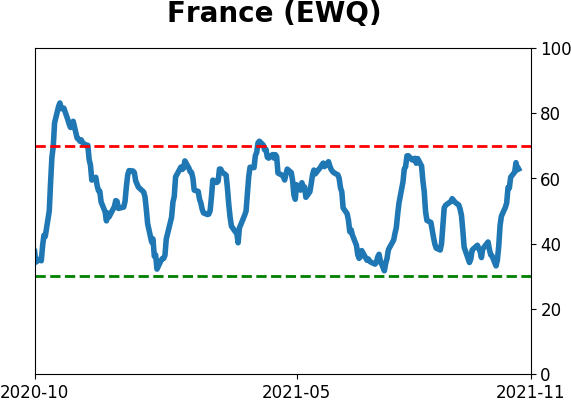
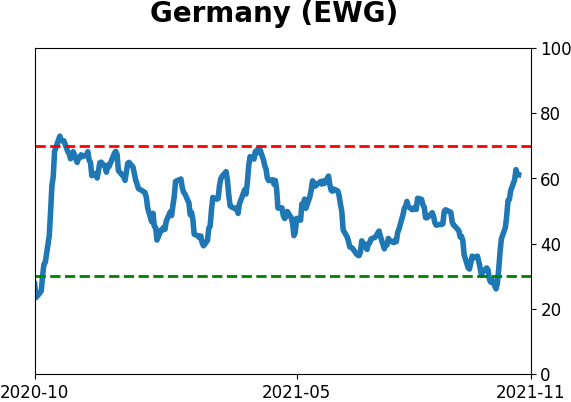
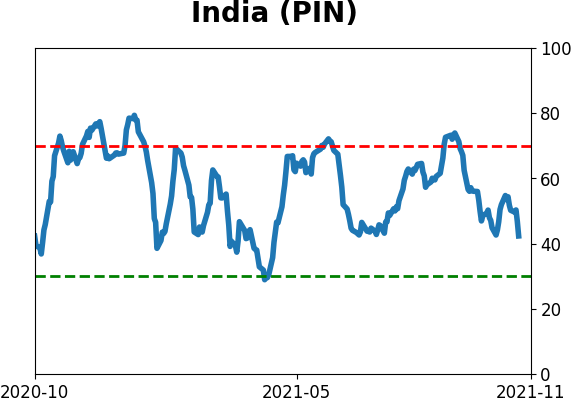
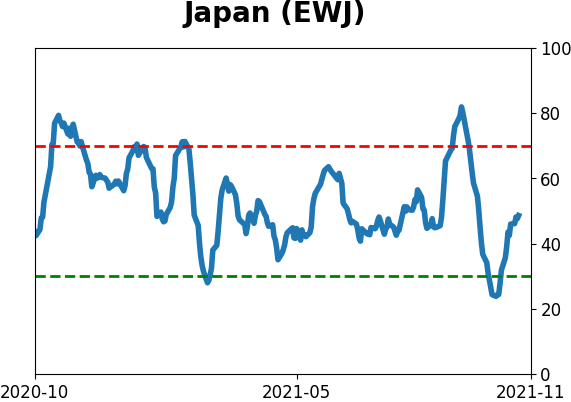
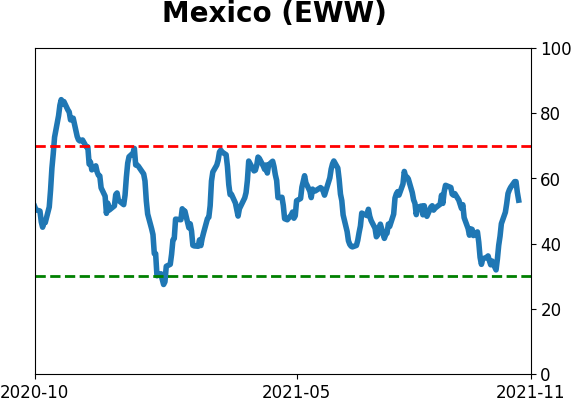
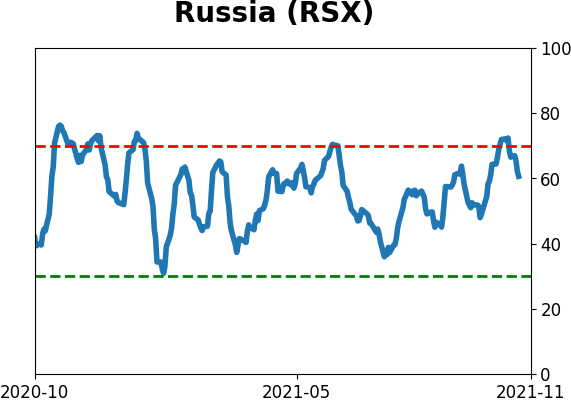
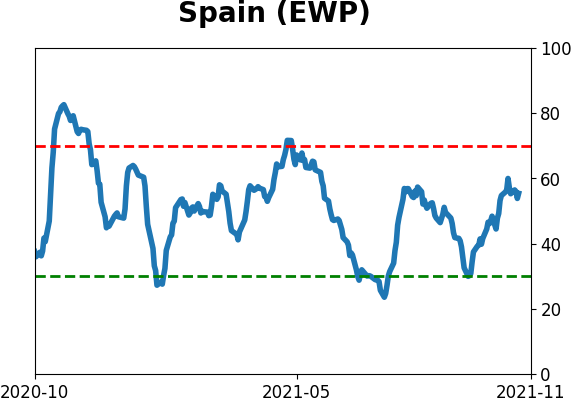
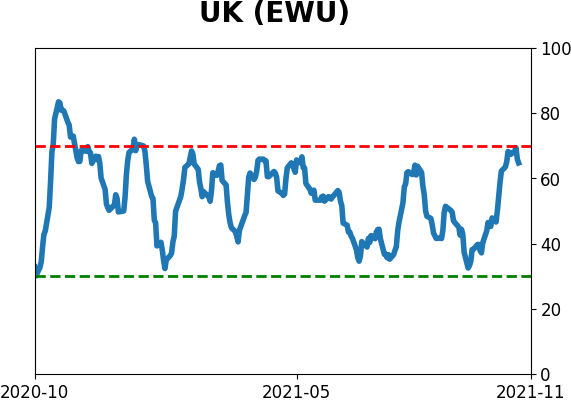
Country ETF's - 10-Day Moving Average
|
|
|
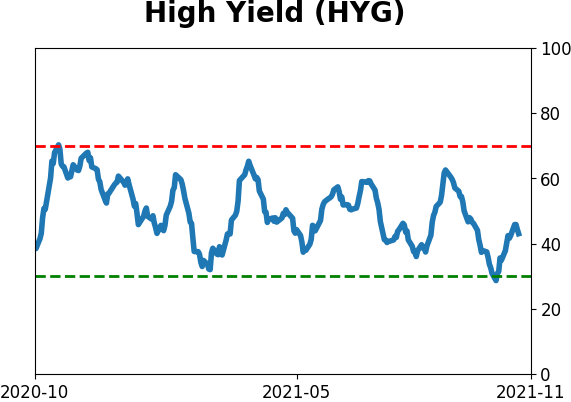
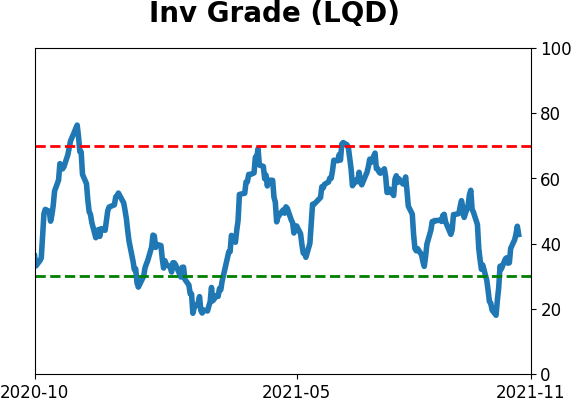
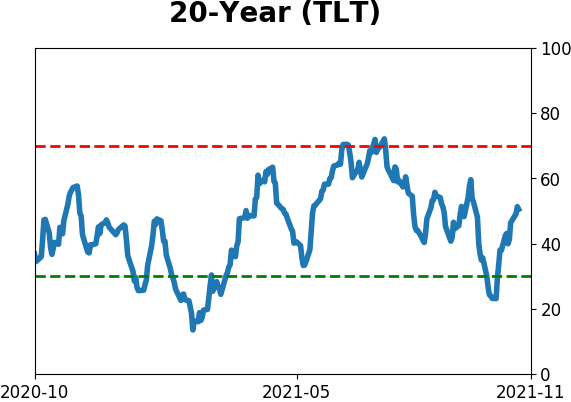
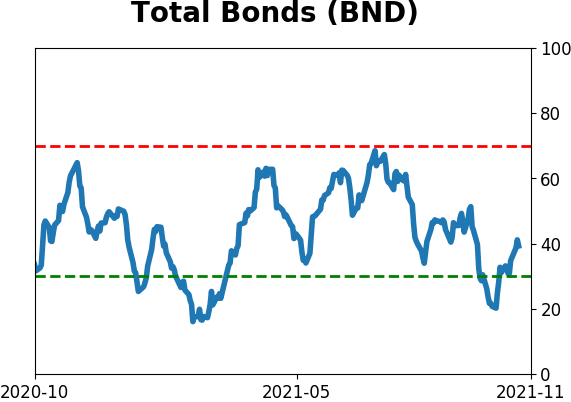
Bond ETF's - 10-Day Moving Average
|
|
|
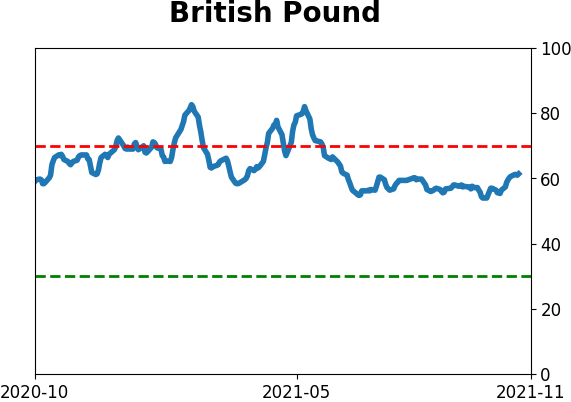
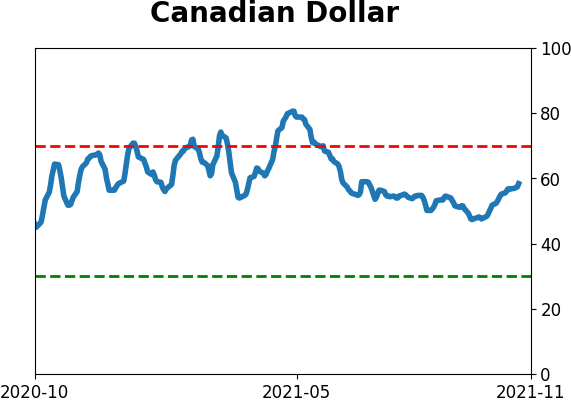
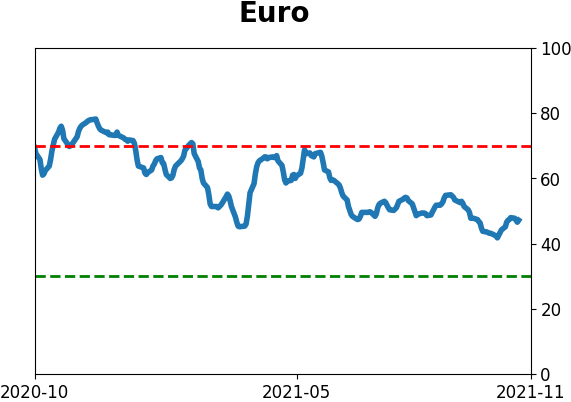
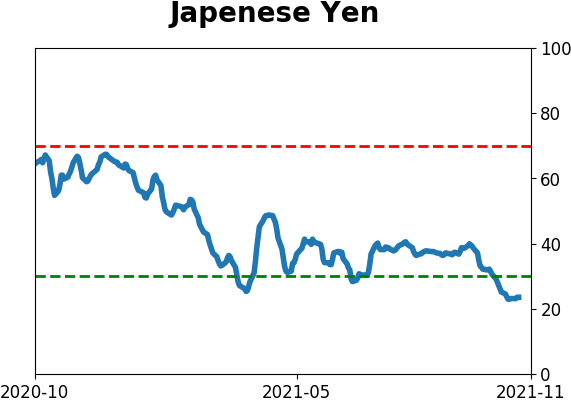
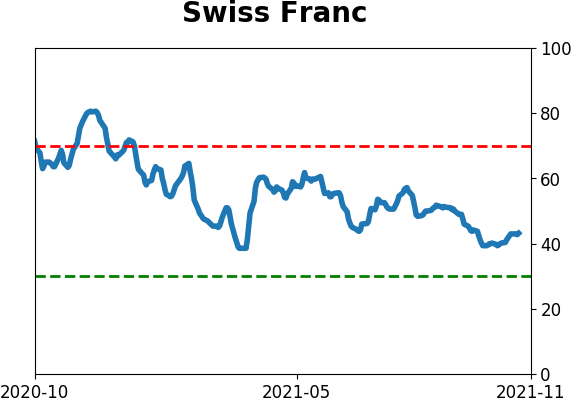
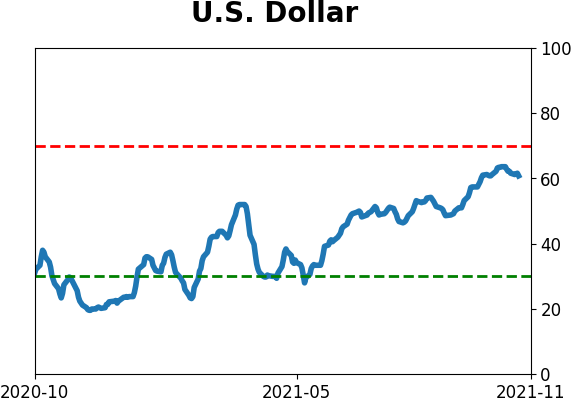
Currency ETF's - 5-Day Moving Average
|
|
|
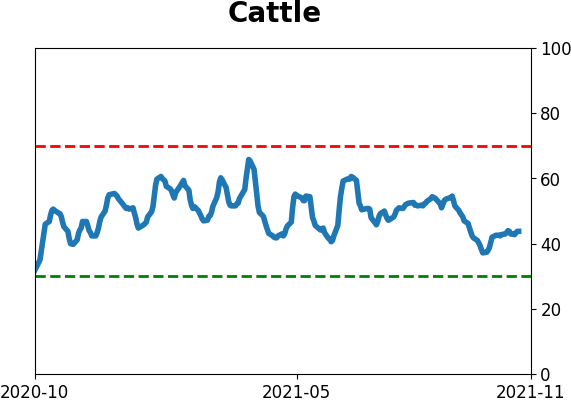
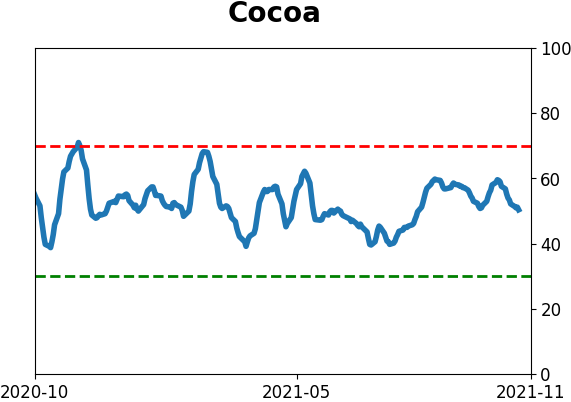
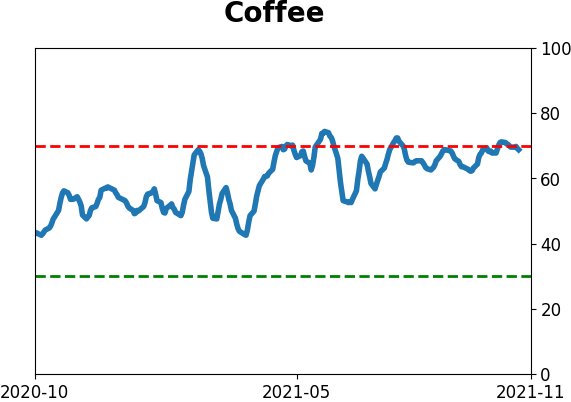
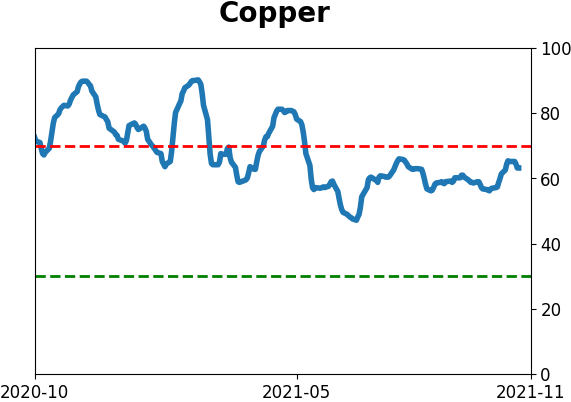
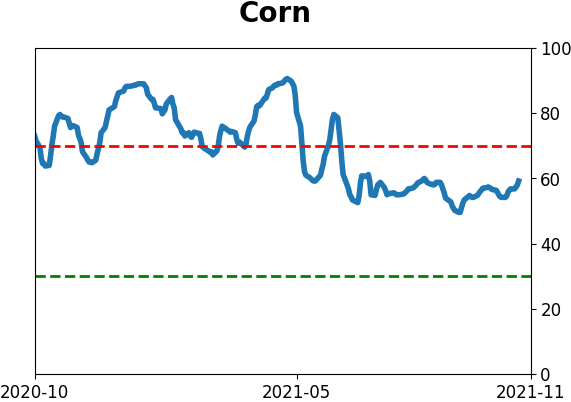
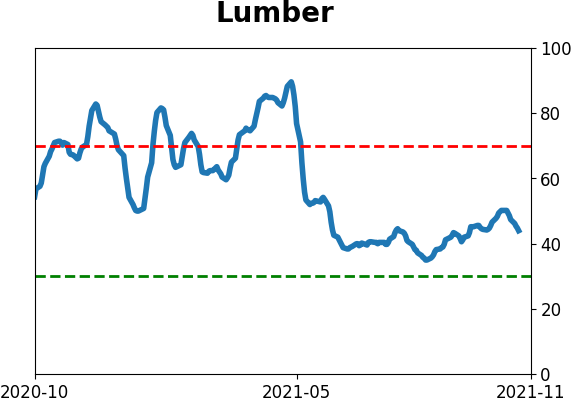
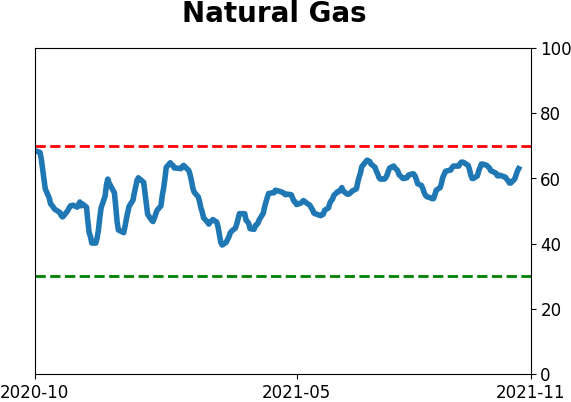
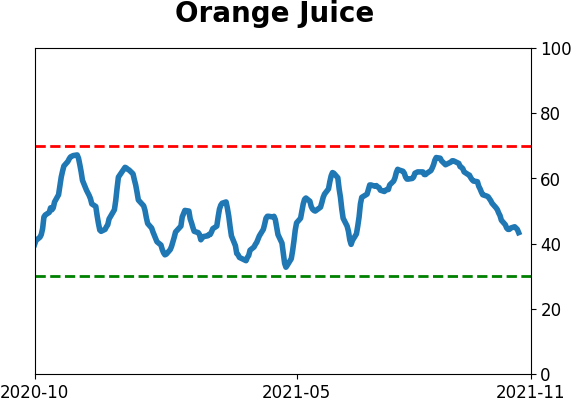
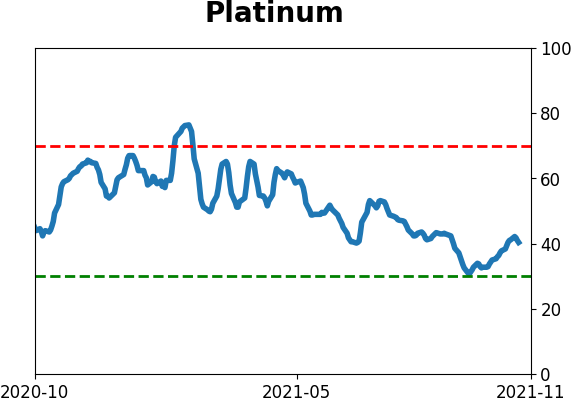
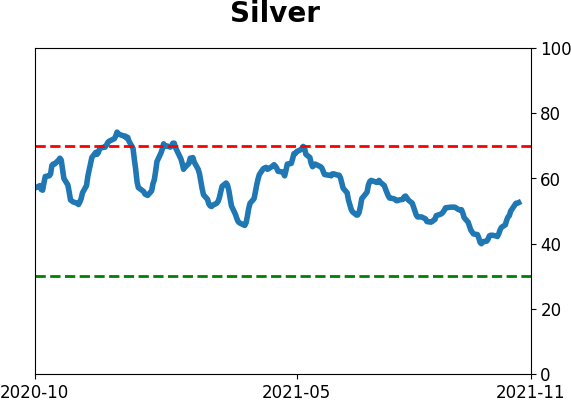
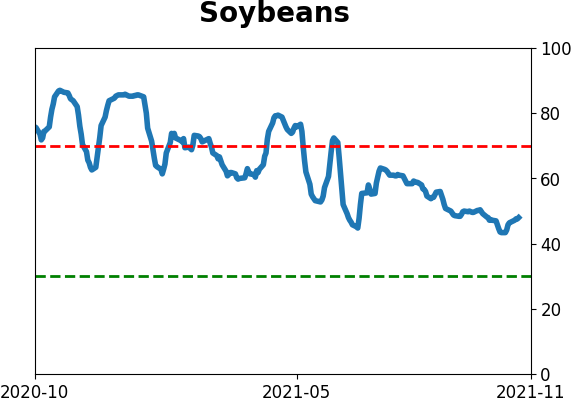
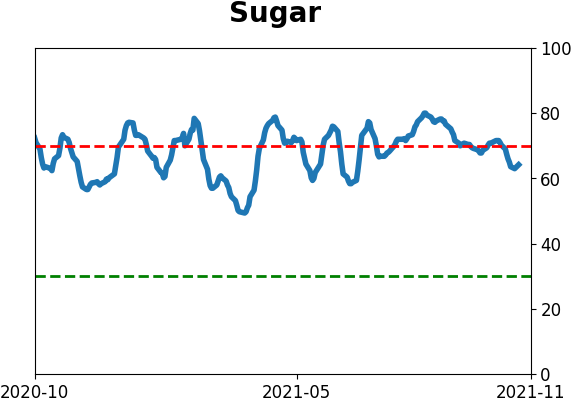
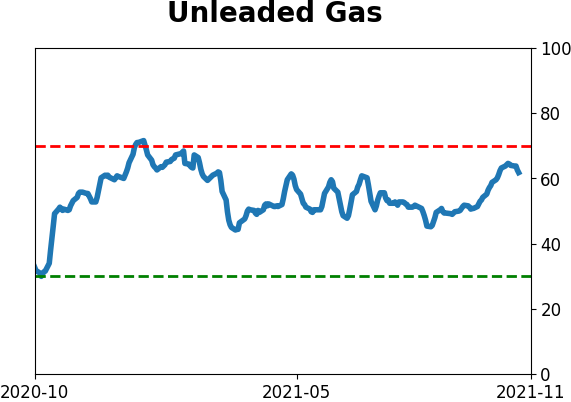
Commodity ETF's - 5-Day Moving Average
|
|