Headlines
|
|
Gold Miners Thrust but Have a Lot To Prove:
Gold mining companies have a seen a medium-term breadth thrust, with 85% of stocks rising above their 50-day moving averages. But few are yet above their 200-day averages, and fewer still have emerged out of bear markets. This has usually resulted in lower prices.
Bottom Line:
STOCKS: Weak buy
The speculative frenzy in February is wrung out. There are some signs of pessimism, but the most compelling data show that buyers consistently tend to return once the first signs of extreme momentum end, especially as we head into a seasonally positive time of year. See the Outlook & Allocations page for more. BONDS: Hold
Various parts of the market got hit in March, with the lowest Bond Optimism Index we usually see during healthy environments. Bond prices have modest recovered and there is no edge among the data we follow. GOLD: Hold
Gold and miners were rejected after trying to recover above their 200-day averages in May. Lately, some medium-term (not long-term) oversold extremes in breadth measures among miners have triggered.
|
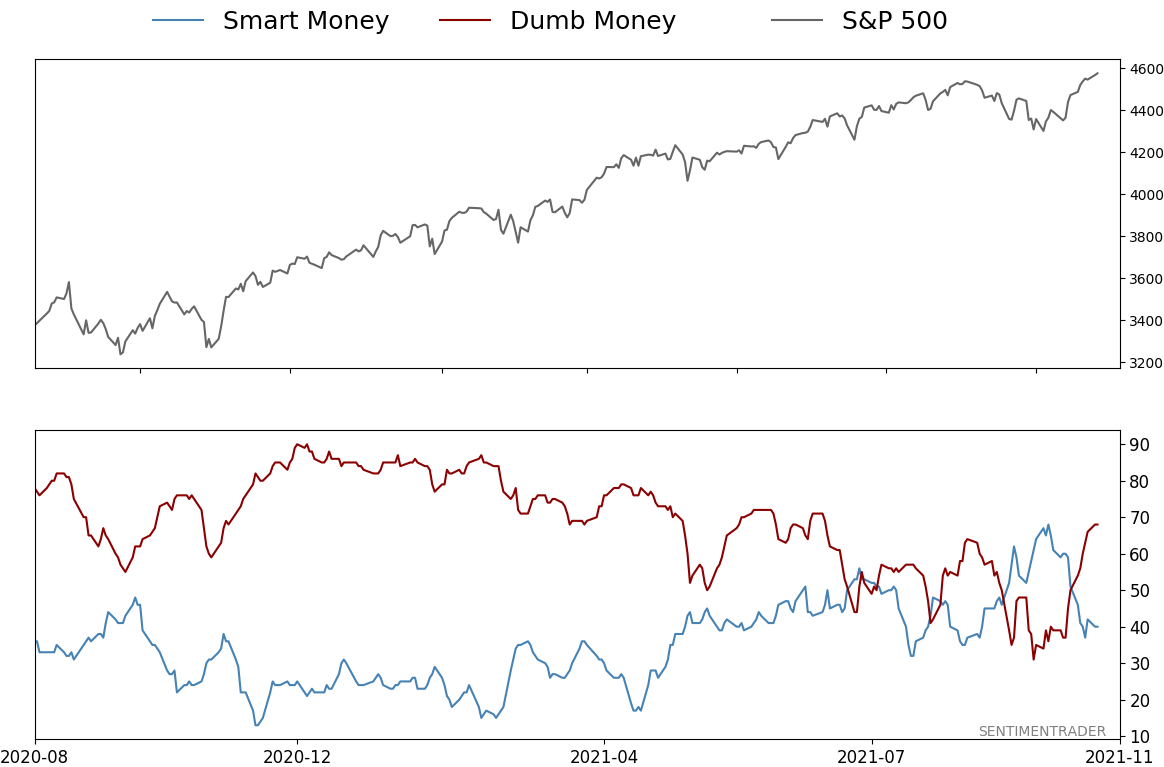
Smart / Dumb Money Confidence
|
Smart Money Confidence: 40%
Dumb Money Confidence: 68%
|
|
Risk Levels
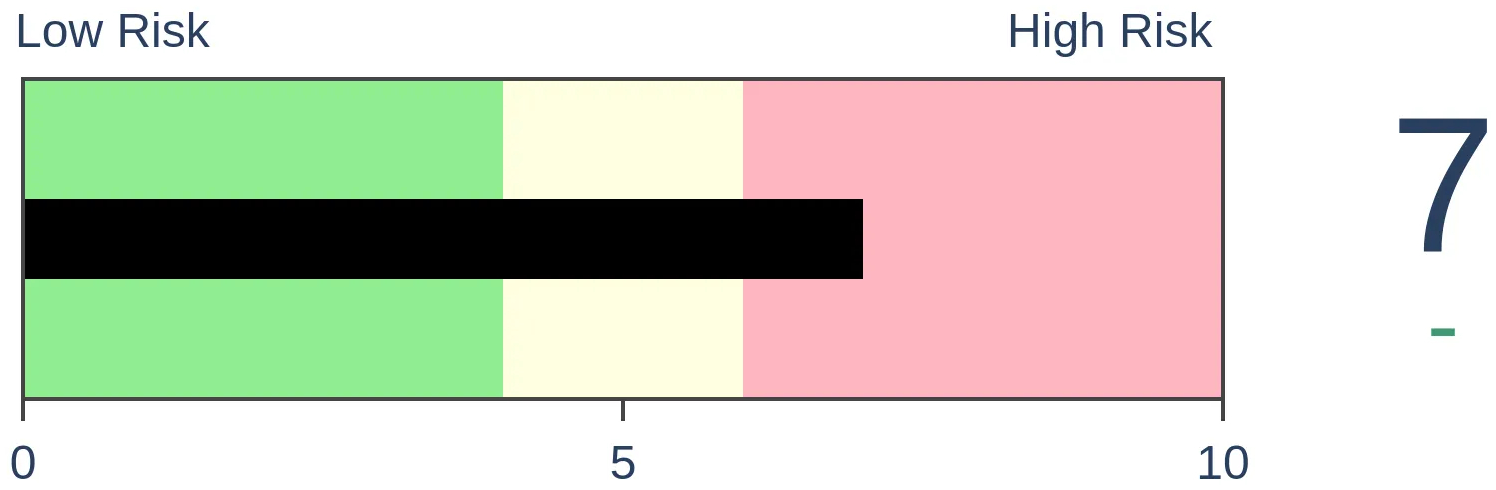
Stocks Short-Term
|
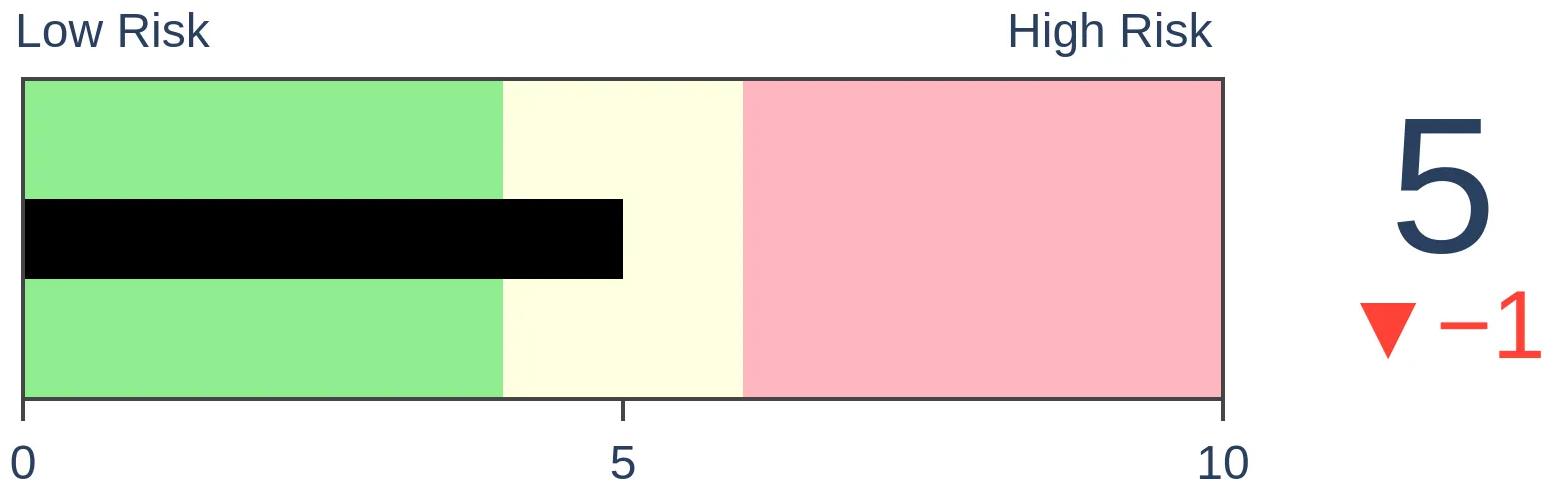
Stocks Medium-Term

|
|
Bonds
|
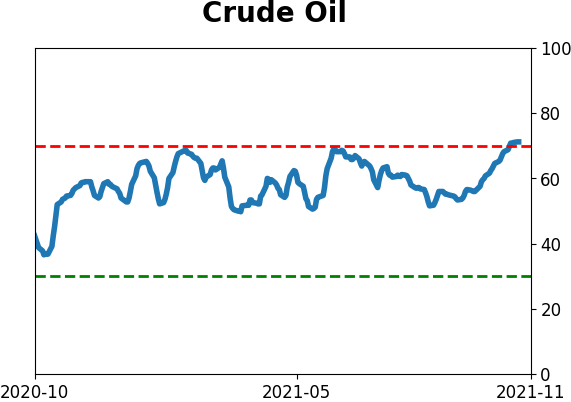
Crude Oil
|
|
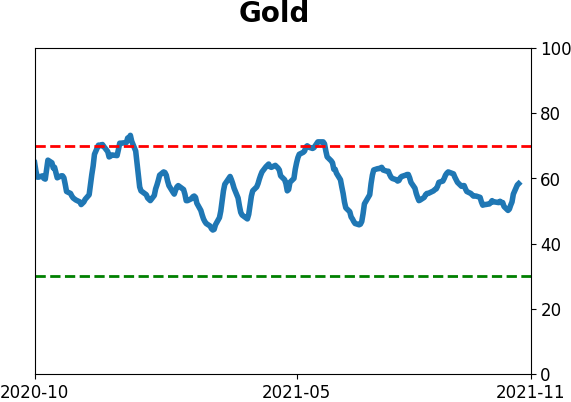
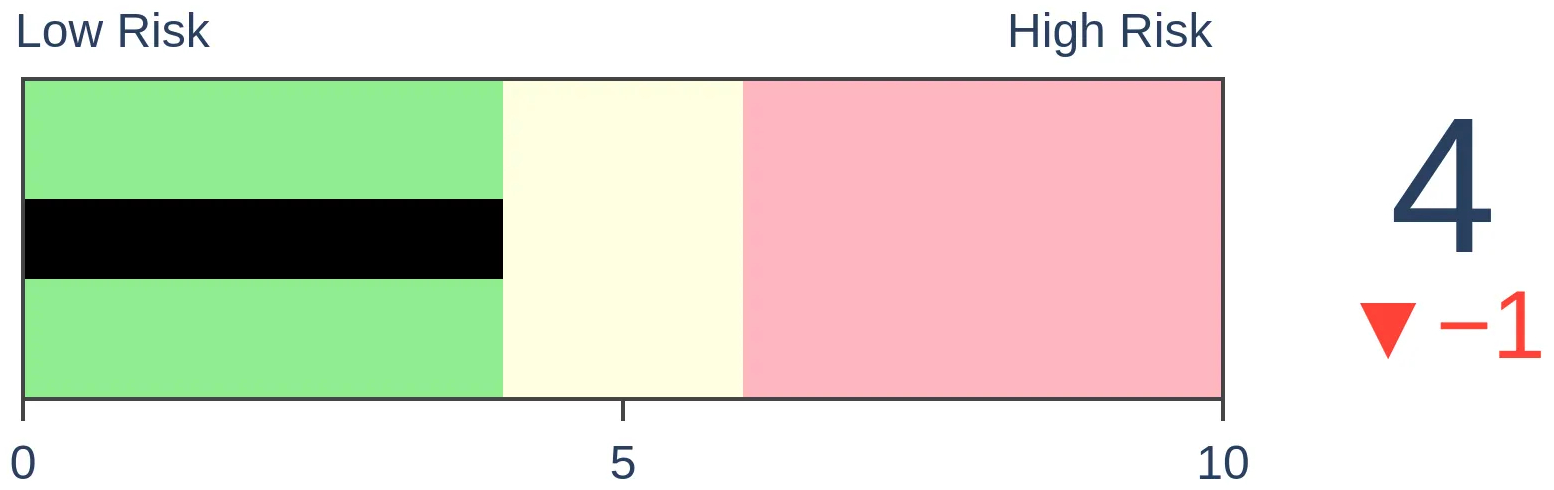
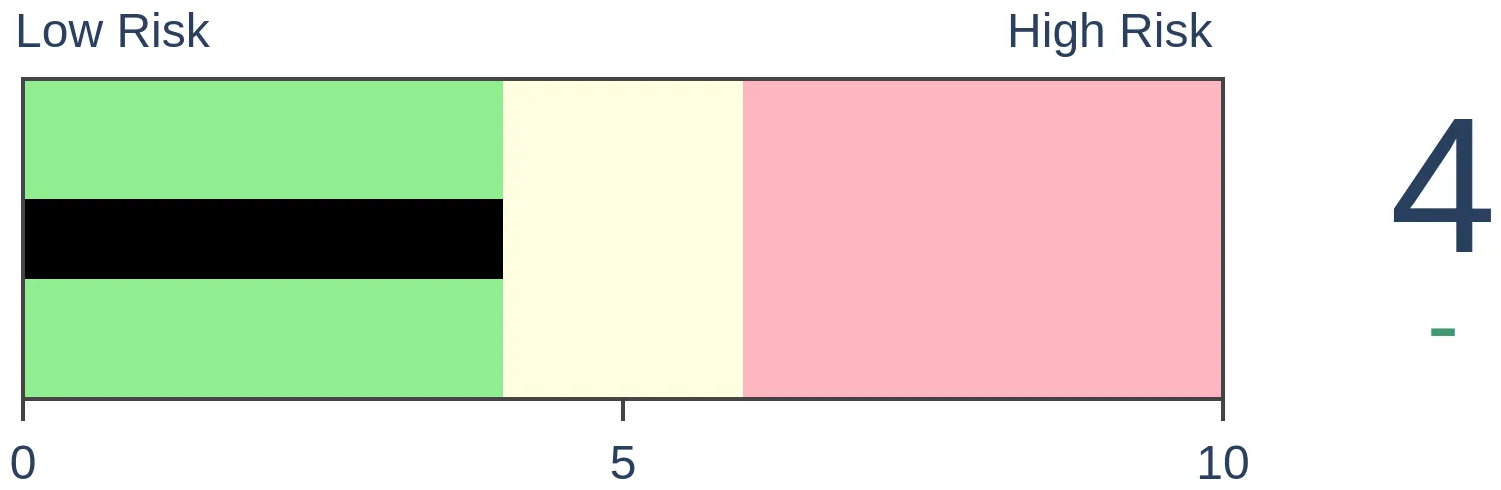
Gold
|
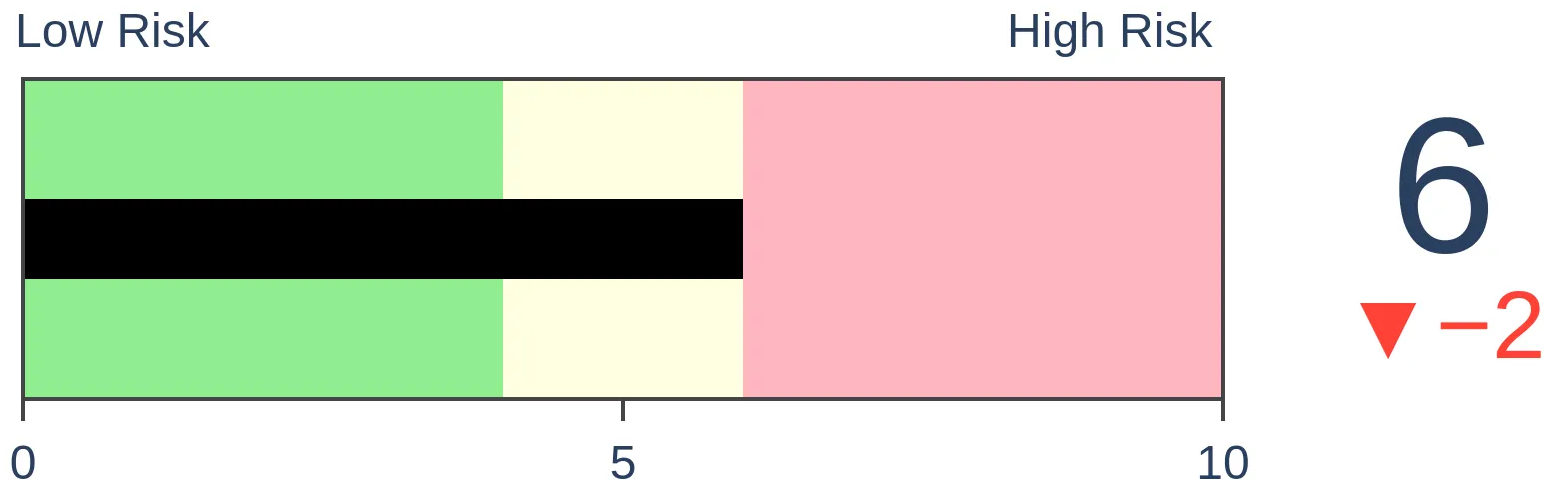
Agriculture
|
|
Research
By Jason Goepfert
BOTTOM LINE
Gold mining companies have a seen a medium-term breadth thrust, with 85% of stocks rising above their 50-day moving averages. But few are yet above their 200-day averages, and fewer still have emerged out of bear markets. This has usually resulted in lower prices.
FORECAST / TIMEFRAME
None
|
After being left for dead, companies who mine the barbarous relic have made a comeback. Gold mining stocks are showing a thrust in medium-term trends, but longer-term trends remain poor. That has preceded mostly negative returns for the HUI Gold Bugs Index.
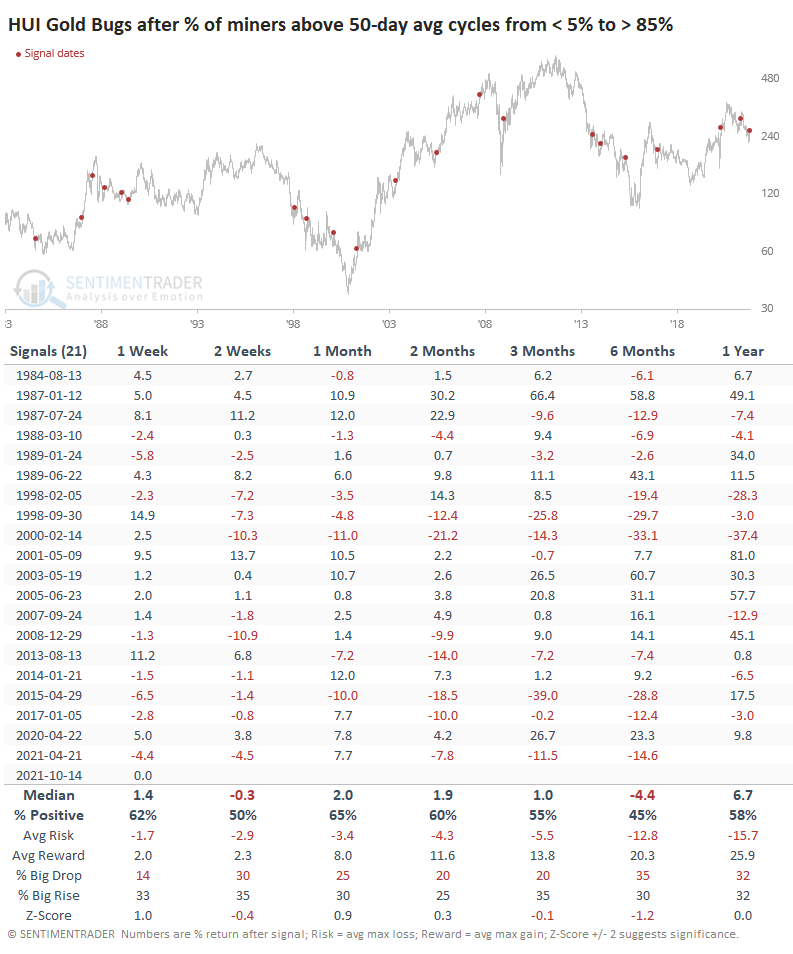
Less than a month ago, fewer than 5% of gold mining stocks traded above their 50-day moving averages. With a surge in gold prices in recent weeks, miners got bid, and several days recorded more than 85% of the stocks trading above their averages.
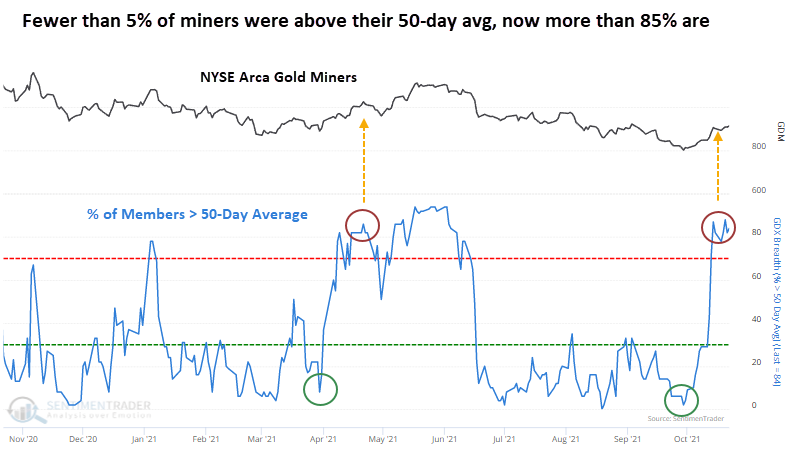
When these stocks have cycled like this, from few to most of them trading above their 50-day averages within 30 days, the sector showed mediocre returns. It rallied most of the time over the next 1-2 months but then often saw those gains peter out. Over the next 6 months, the average return was a woeful -4.4%.
RESULTS ARE WORSE IN LONG-TERM DOWNTRENDS
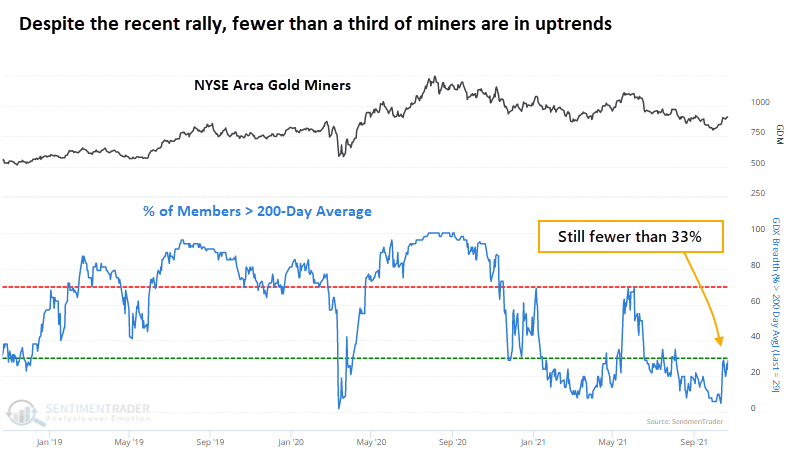
When we add a longer-term trend filter, the returns get worse. Despite the recent rally, fewer than a third of gold mining stocks are trading above their 200-day moving averages.
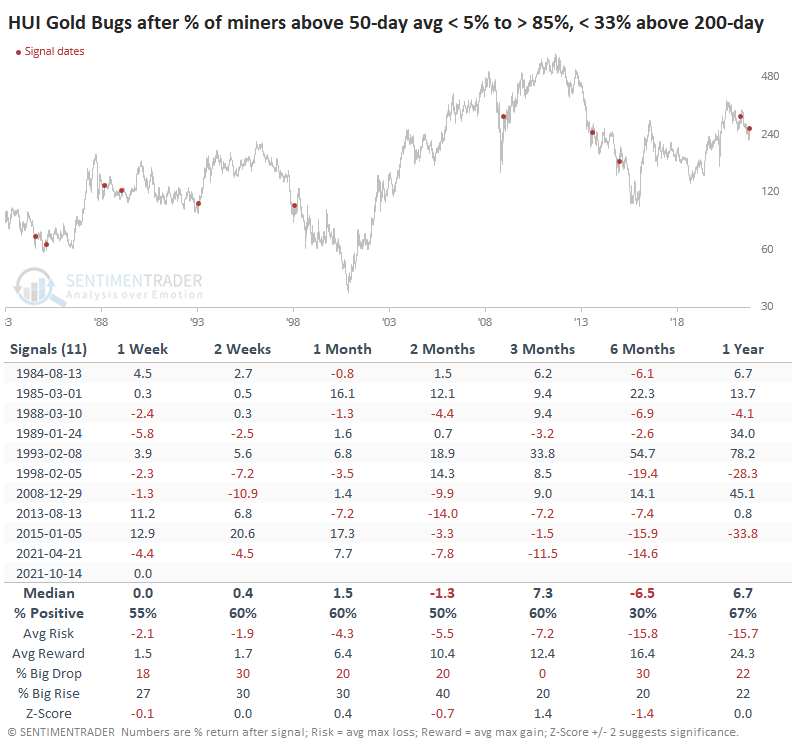
The table below looks for times when there was a thrust in medium-term trends, regardless of how long it took to cycle from one extreme to the other. But it only includes those dates when fewer than 33% of miners were above their 200-day averages. This shows us breadth thrusts when most of the stocks had been trading poorly.
FEWER STOCKS IN BEAR MARKETS, BUT BAD MARKET ENVIRONMENT
The improvement in longer-term trends has been slight, but it's been enough to allow more of them to climb out of bear market territory. For the first time in more than 4 months, fewer than 75% of stocks are trading more than 20% below their 52-week highs.
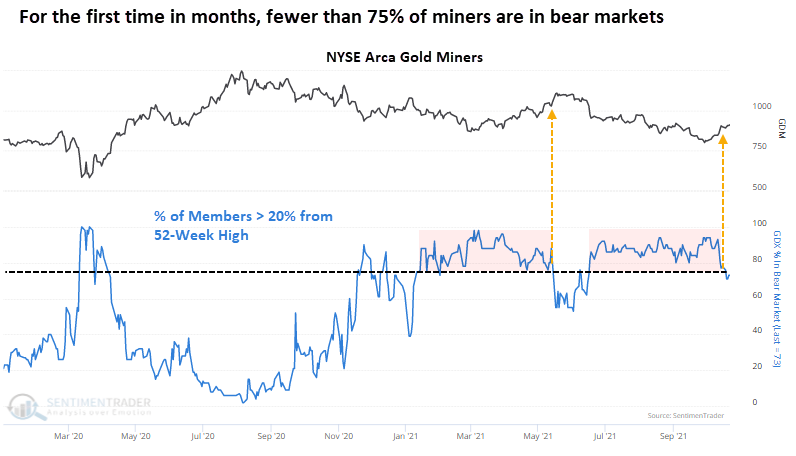
It seems like that should be a good thing. It wasn't.
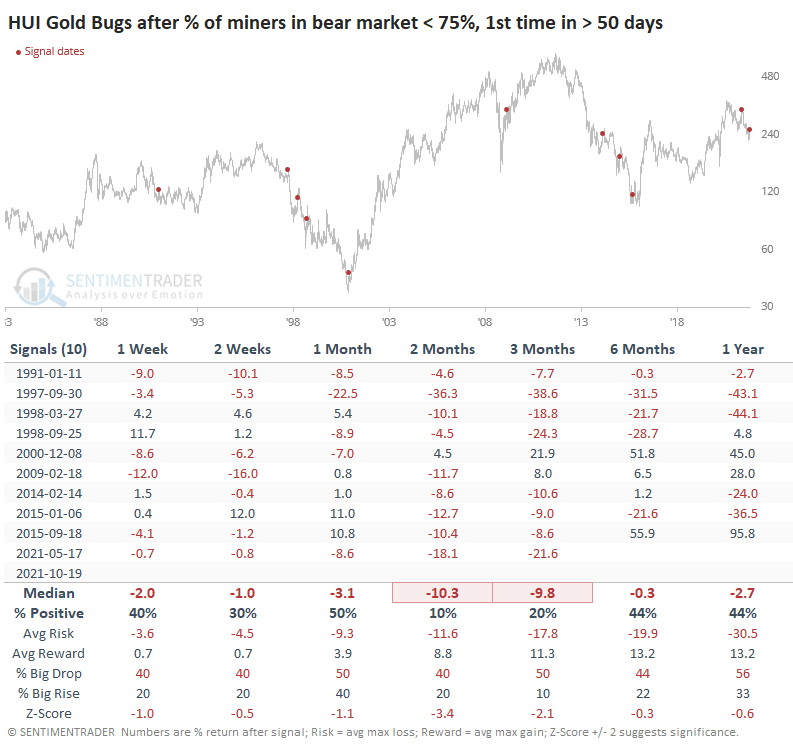
Remarkably, there have been 10 other times when miners ended a streak of at least 50 days with more than 3/4 of the stocks in bear markets. Every time, the HUI Gold Bugs Index showed a negative return either 1 or 2 months later, with 9 of the 10 showing a negative 2-month return.
OTHER SIGNS POINT TO TROUBLE
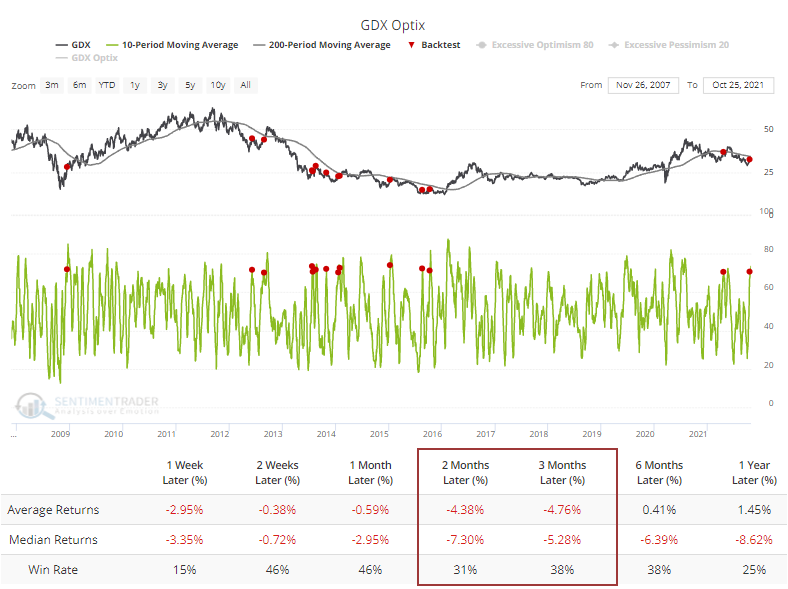
There isn't much to get excited about when taking a spin through some other indicators focused on gold or gold mining stocks. The 10-day average Optimism Index on the GDX fund has climbed above 70%, even while the fund is trading below a declining 200-day moving average. According to the Backtest Engine, the fund has had a tough time maintaining upside momentum.
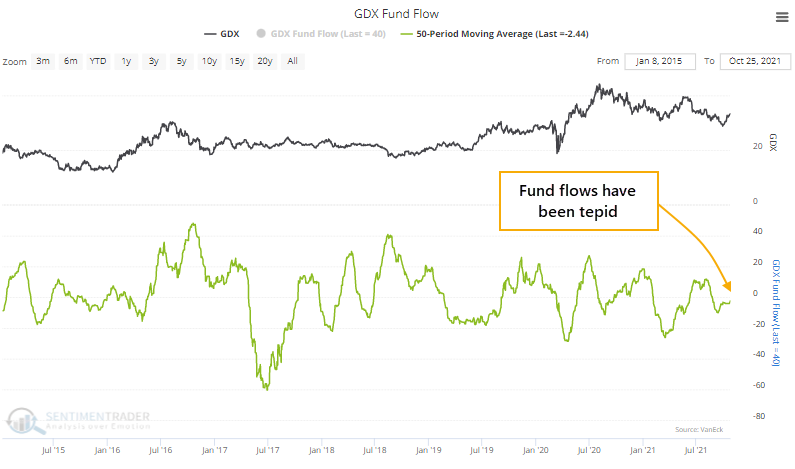
Fund flows into GDX have been tepid over the past 50 sessions. So, we do not see optimism there, but it's far from suggesting much pessimism, either.
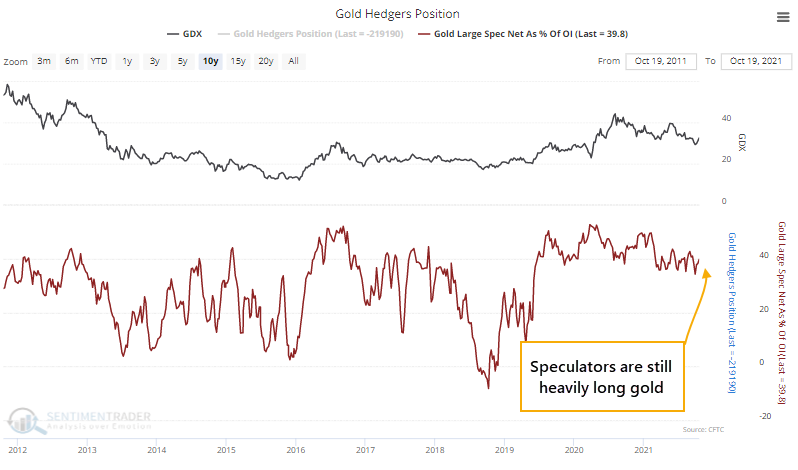
Speculators haven't shown any sign of giving up on gold. They're still holding about 40% of open interest net long. In years past, when this is around 40% or higher, gold mining stocks have struggled to sustain rallies.
Curiously, options traders in the GLD fund hold a historically high number of open put contracts relative to call contracts. That suggests pessimism, but open interest ratios aren't a great contrary indicator.
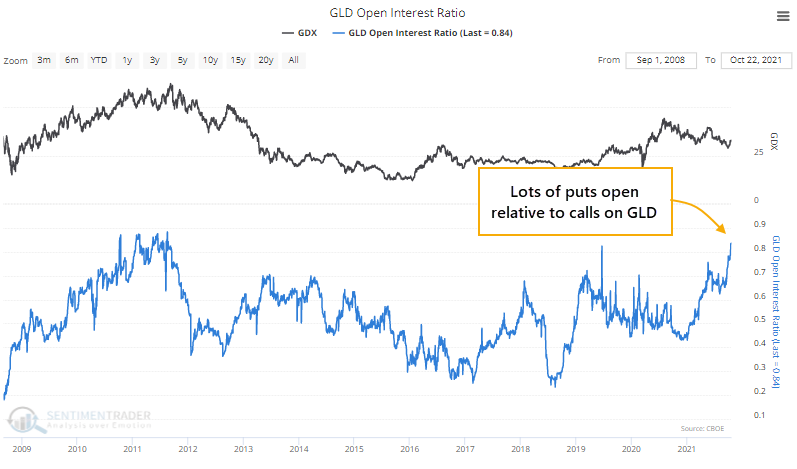
Typically, it's the opposite and suggestive of "smart money." It's been better for gold, and gold mining stocks, when speculators are holding few futures contracts net long, and at the same time, a relatively high number of call options relative to puts (yes, that seems counter-intuitive). We have the opposite situation now.
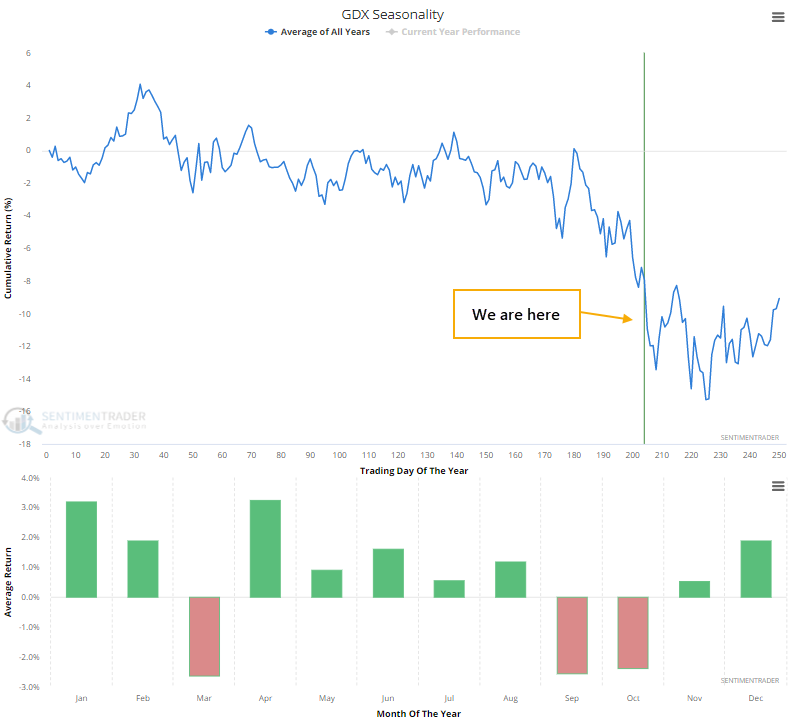
For what it's worth, miners have often struggled about this time of year, but at least the seasonal window starts to turn more positive as we move into the winter months.
There is always the potential that investors will fall out of love with the idea of crypto, become worried about fiscal or monetary policy mistakes, and give more credence to improved financial conditions among many mining stocks. All of those could blow any of these indicators out of the water and propel mining stocks on their next giant bull market.
It would be a more compelling setup right now if prior breadth thrusts showed a more consistently positive record, and there were fewer stocks mired in long-term downtrends. Currently, buyers have to rely on the idea that the long-term trend in these stocks has changed. That's been a very risky bet to take in this group.
Active Studies
| Time Frame | Bullish | Bearish | | Short-Term | 2 | 0 | | Medium-Term | 8 | 0 | | Long-Term | 11 | 5 |
|
Indicators at Extremes
Portfolio
| Position | Description | Weight % | Added / Reduced | Date | | Stocks | RSP | 10.7 | Added 6.4% | 2021-10-01 | | Bonds | 32.7% BND, 7.1% SCHP | 39.8 | Added 8.3% | 2021-10-26 | | Commodities | GCC | 2.4 | Reduced 2.1%
| 2020-09-04 | | Precious Metals | GDX | 4.6 | Reduced 4.2% | 2021-05-19 | | Special Situations | 9.8% KWEB, 4.7% XLE, 2.9% PSCE | 17.3 | Added 9.78% | 2021-10-01 | | Cash | | 24.1 | | |
|
Updates (Changes made today are underlined)
Much of our momentum and trend work has remained positive for several months, with some scattered exceptions. Almost all sentiment-related work has shown a poor risk/reward ratio for stocks, especially as speculation drove to record highs in exuberance in February. Much of that has worn off, and most of our models are back toward neutral levels. There isn't much to be excited about here. The same goes for bonds and even gold. Gold has been performing well lately and is back above long-term trend lines. The issue is that it has a poor record of holding onto gains when attempting a long-term trend change like this, so we'll take a wait-and-see approach. Momentum has ebbed quickly in recent weeks, and nearing oversold levels in some indicators. This can be a dangerous area, with a lot of short-term volatility, but we'd be more inclined to add medium- to long-term exposure rather than sell on much more of a decline, thanks to already rock-bottom exposure. Other areas look more attractive, including some overseas markets. RETURN YTD: 11.6% 2020: 8.1%, 2019: 12.6%, 2018: 0.6%, 2017: 3.8%, 2016: 17.1%, 2015: 9.2%, 2014: 14.5%, 2013: 2.2%, 2012: 10.8%, 2011: 16.5%, 2010: 15.3%, 2009: 23.9%, 2008: 16.2%, 2007: 7.8%
|
|
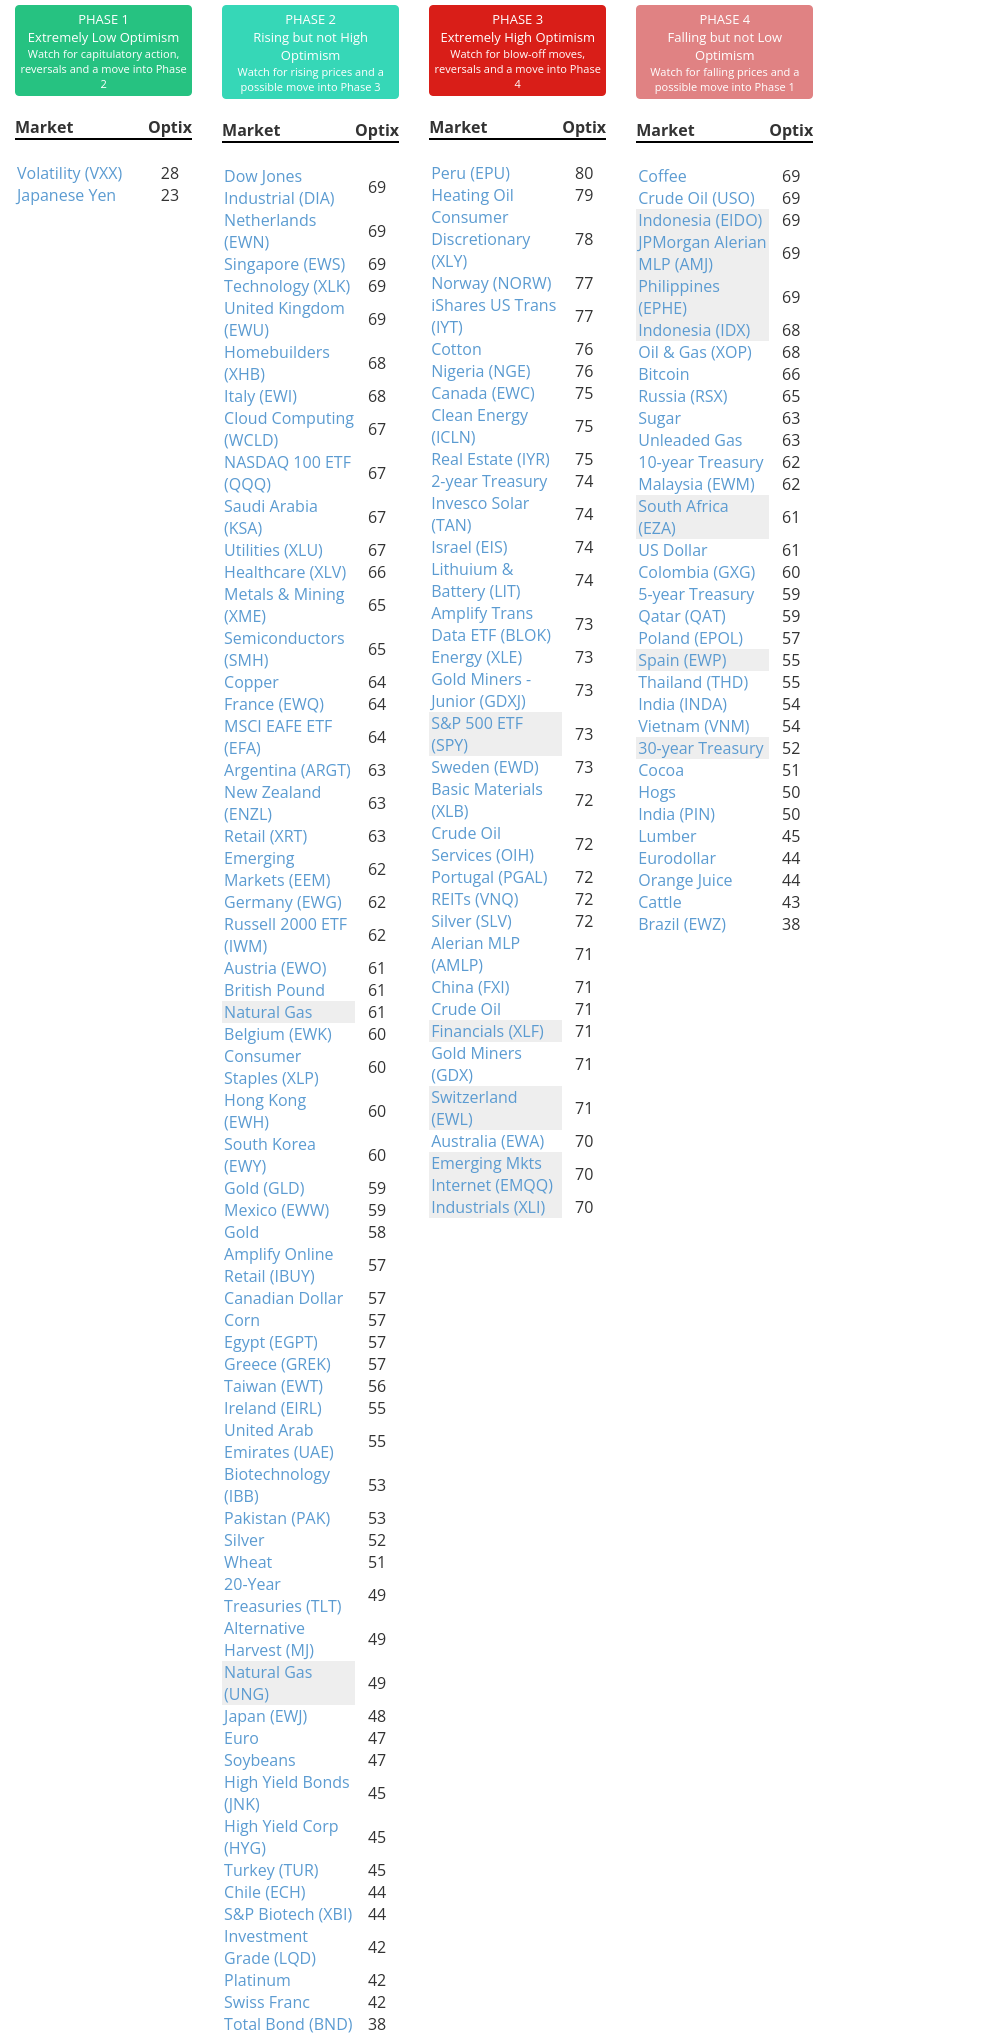
Phase Table
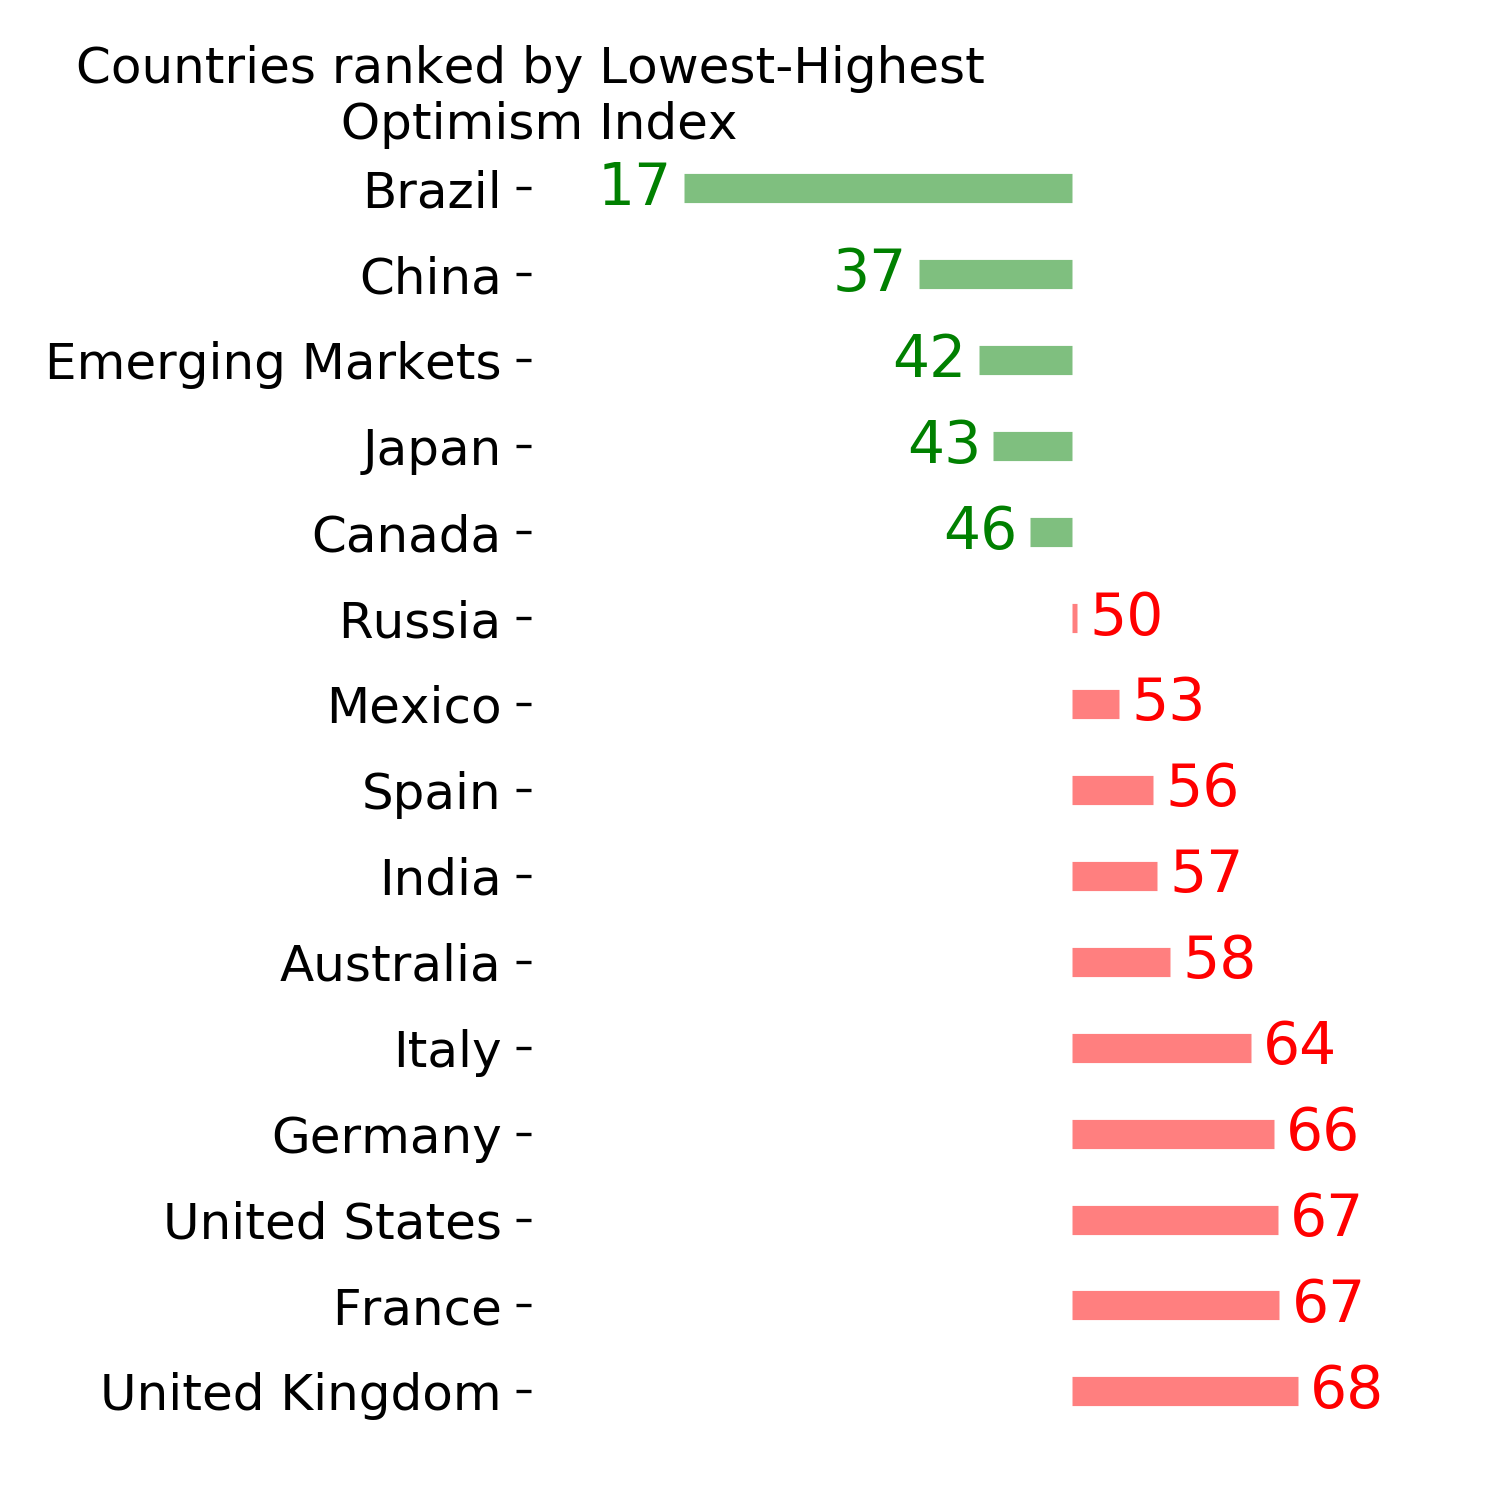
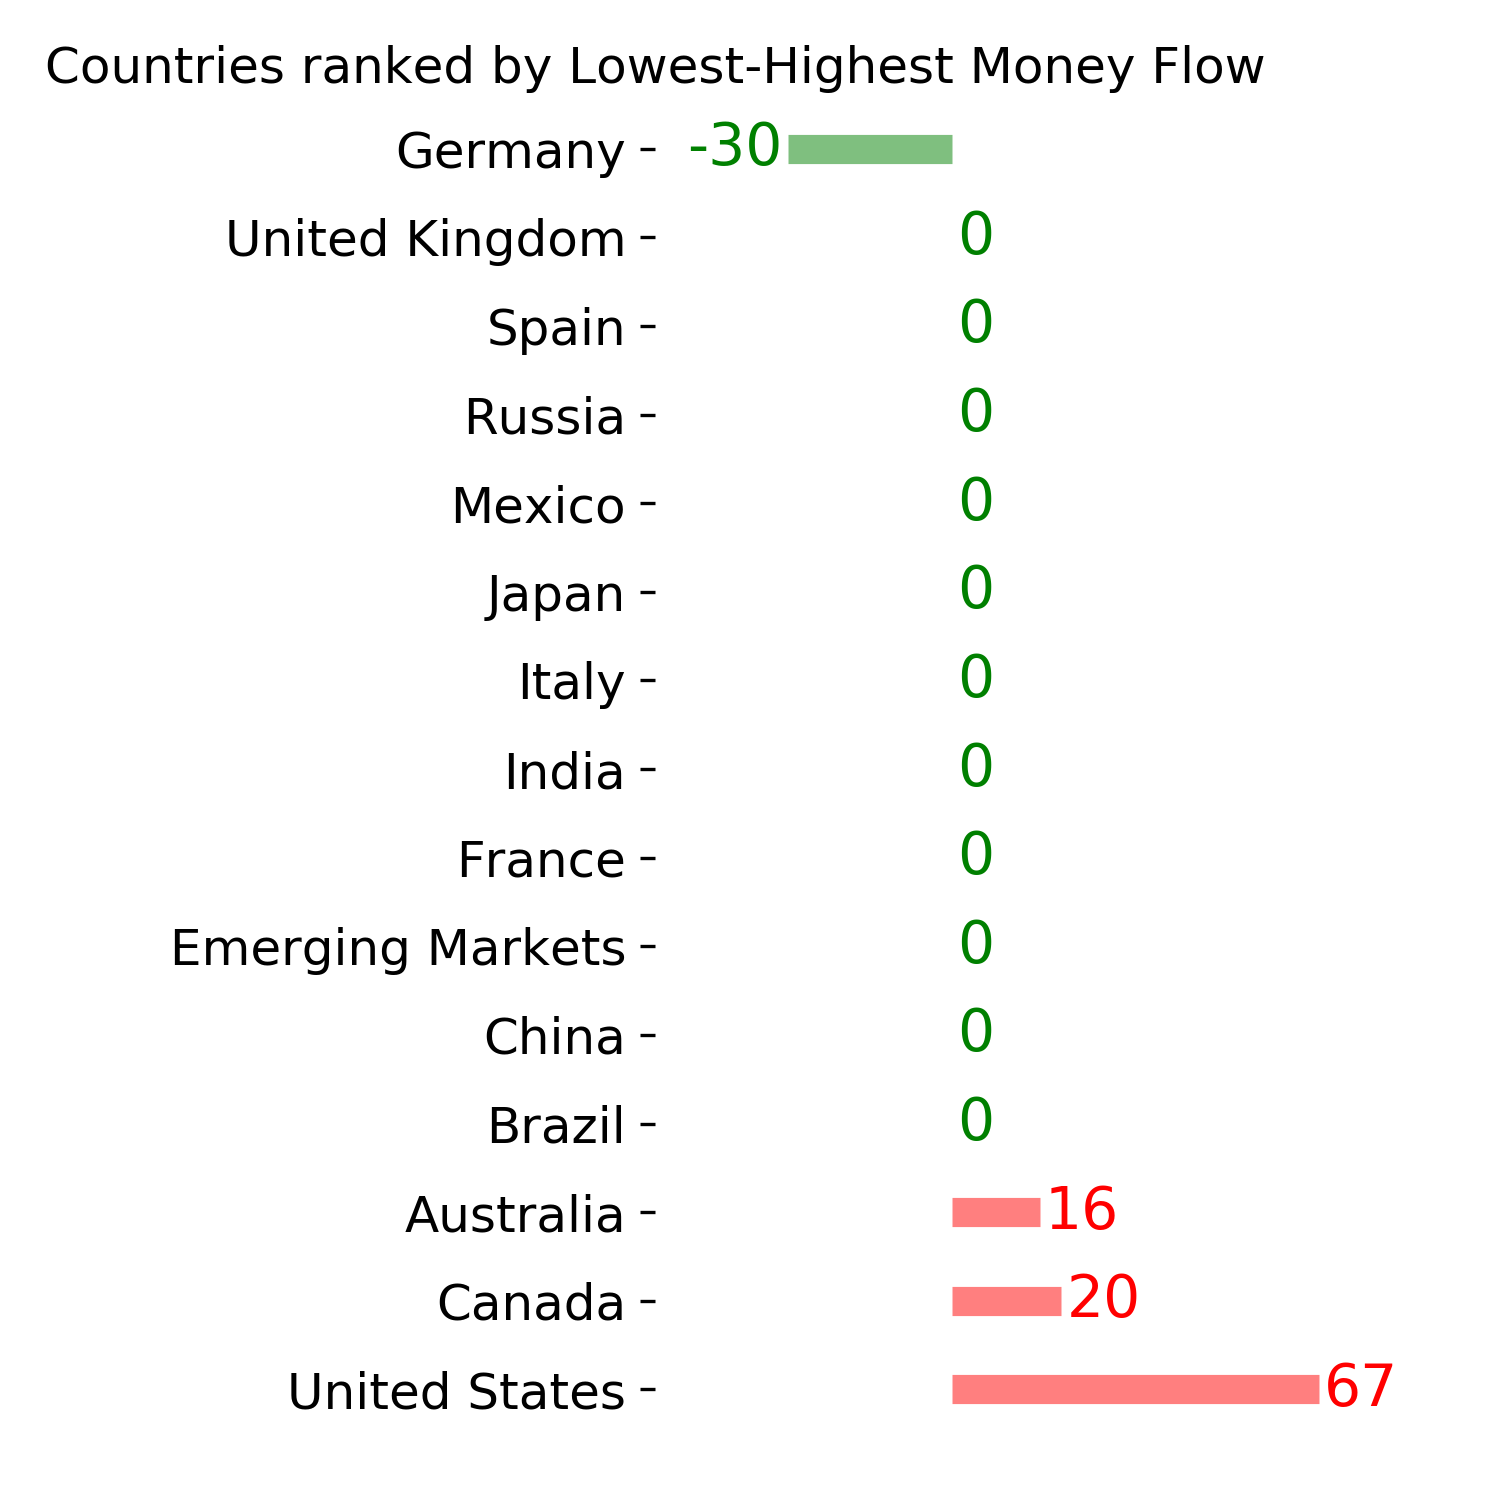
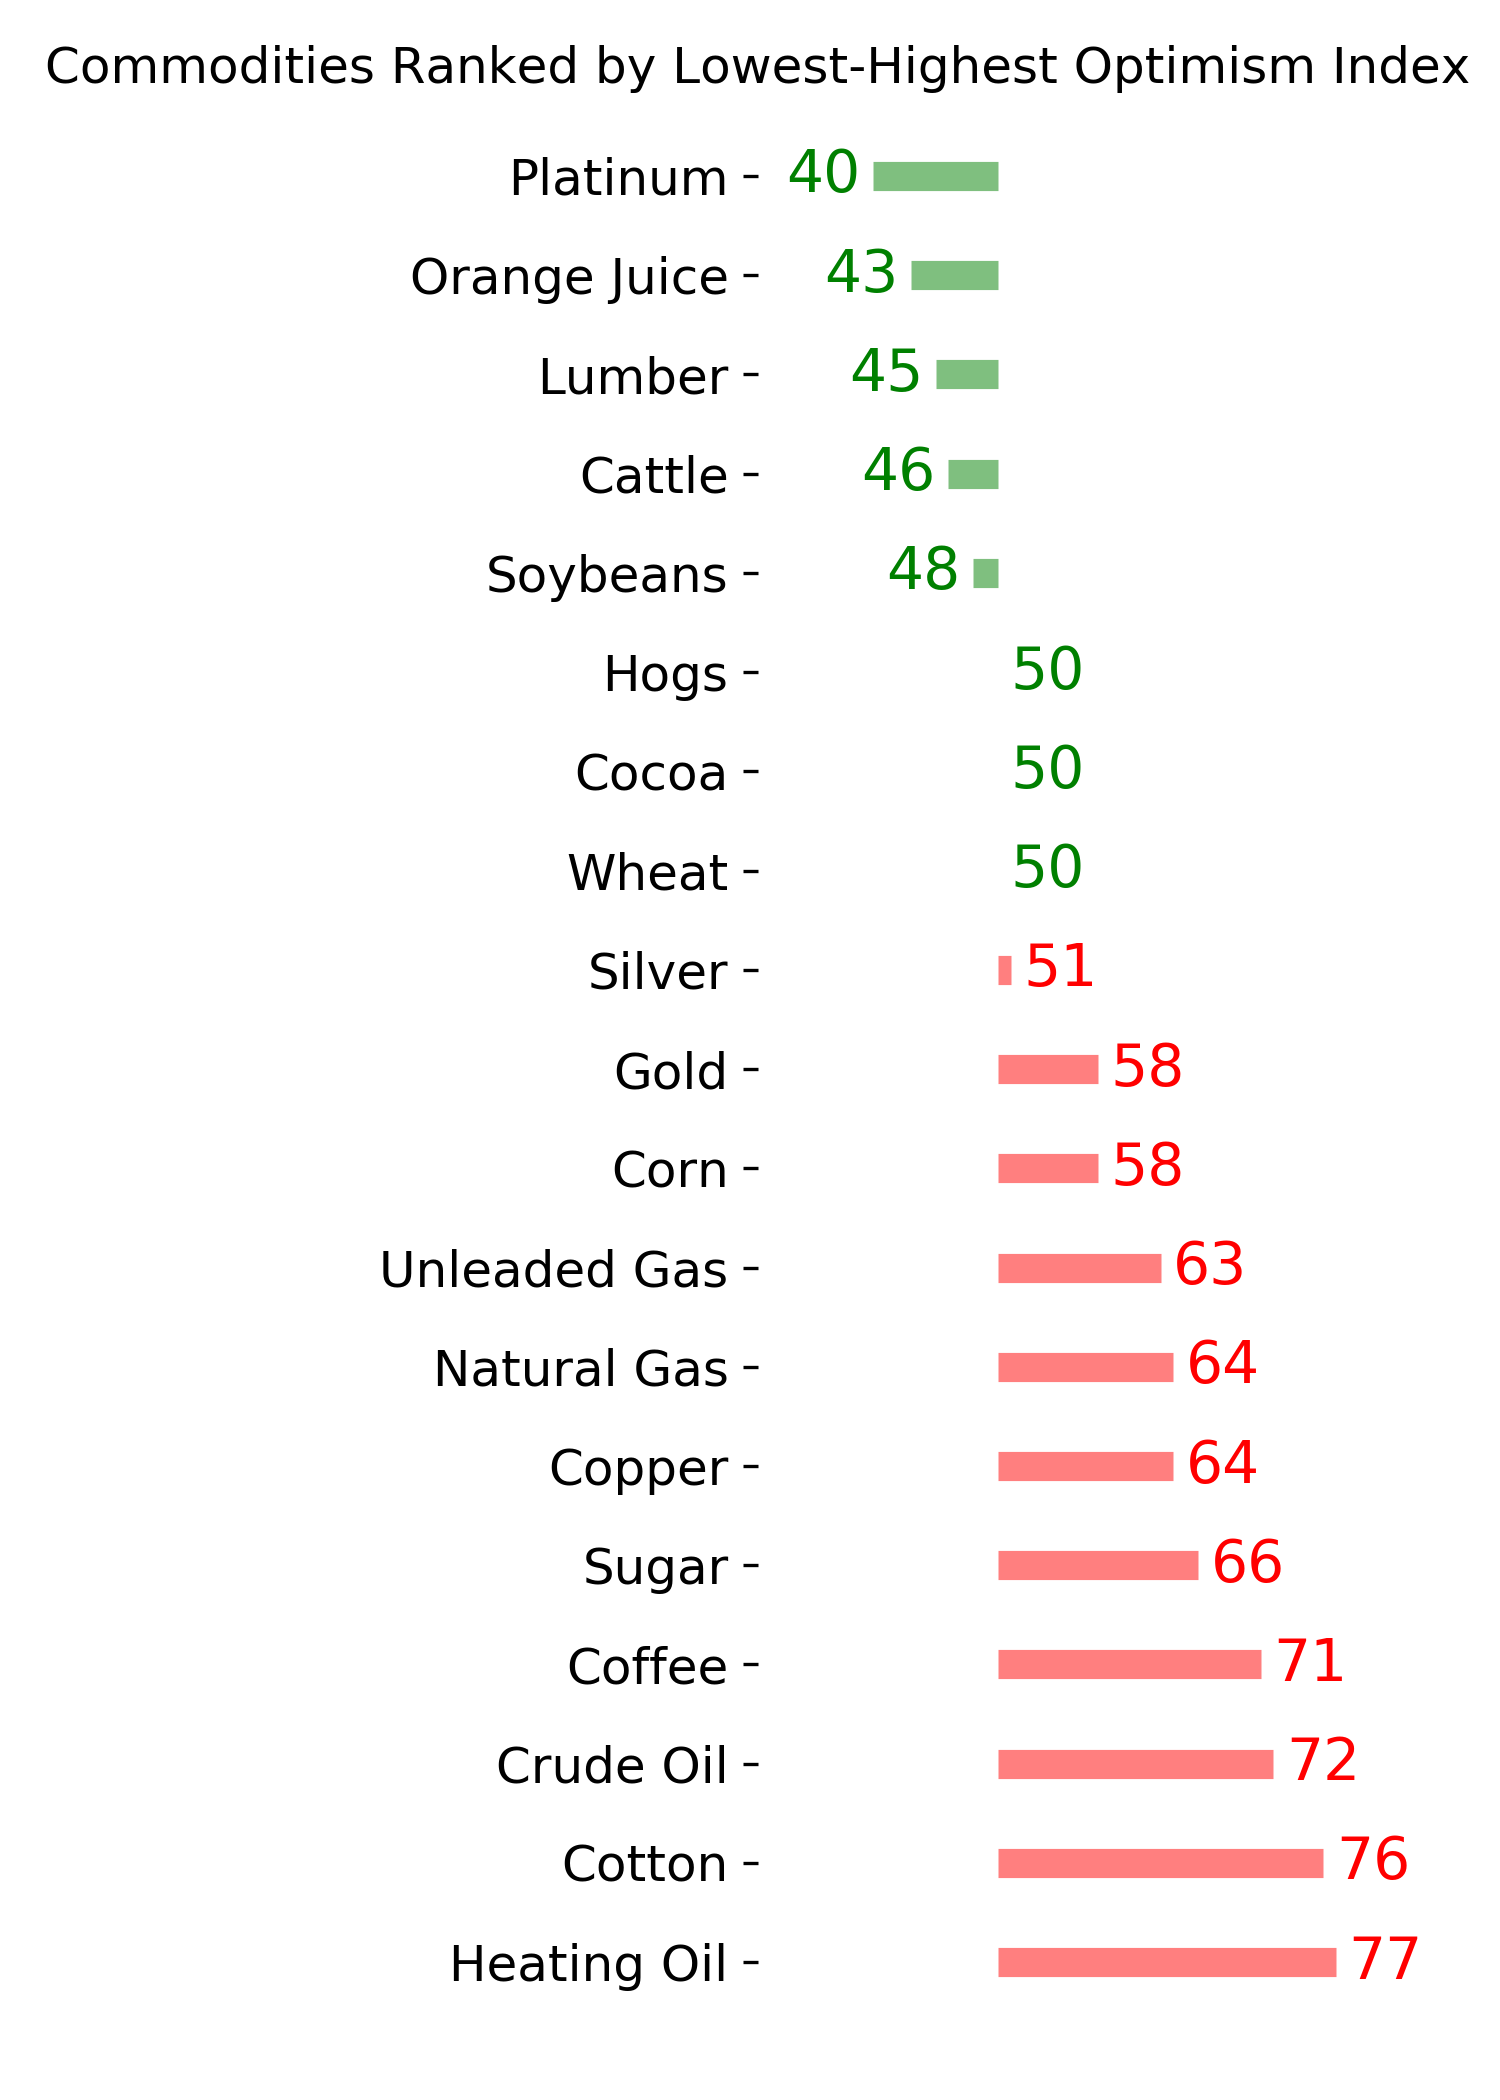
Ranks
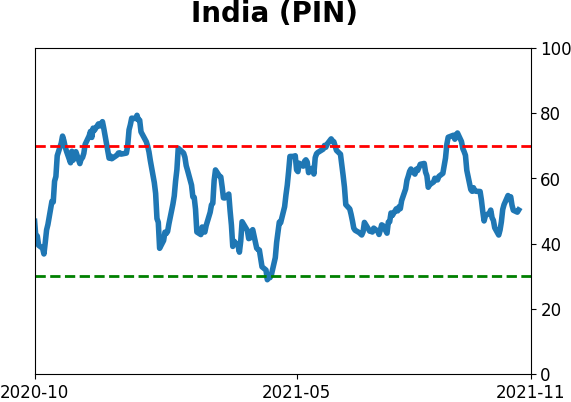
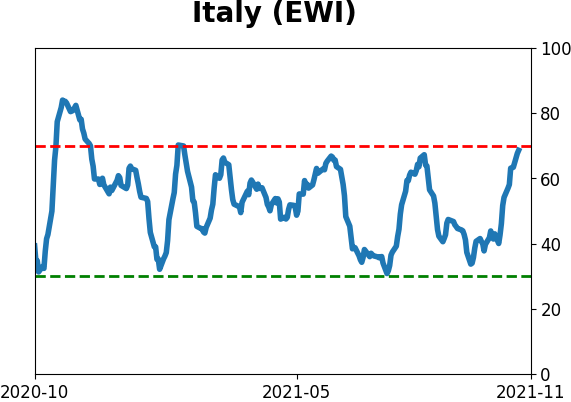
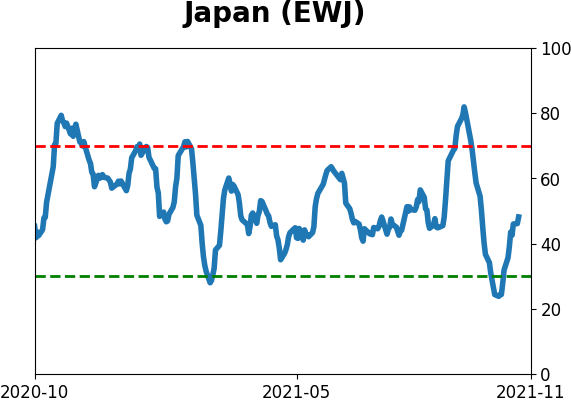
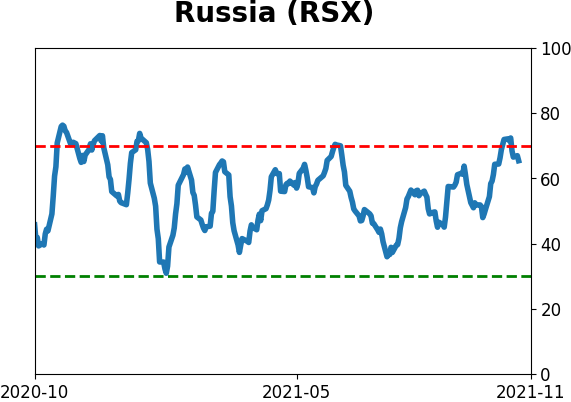
Sentiment Around The World
Optimism Index Thumbnails
|
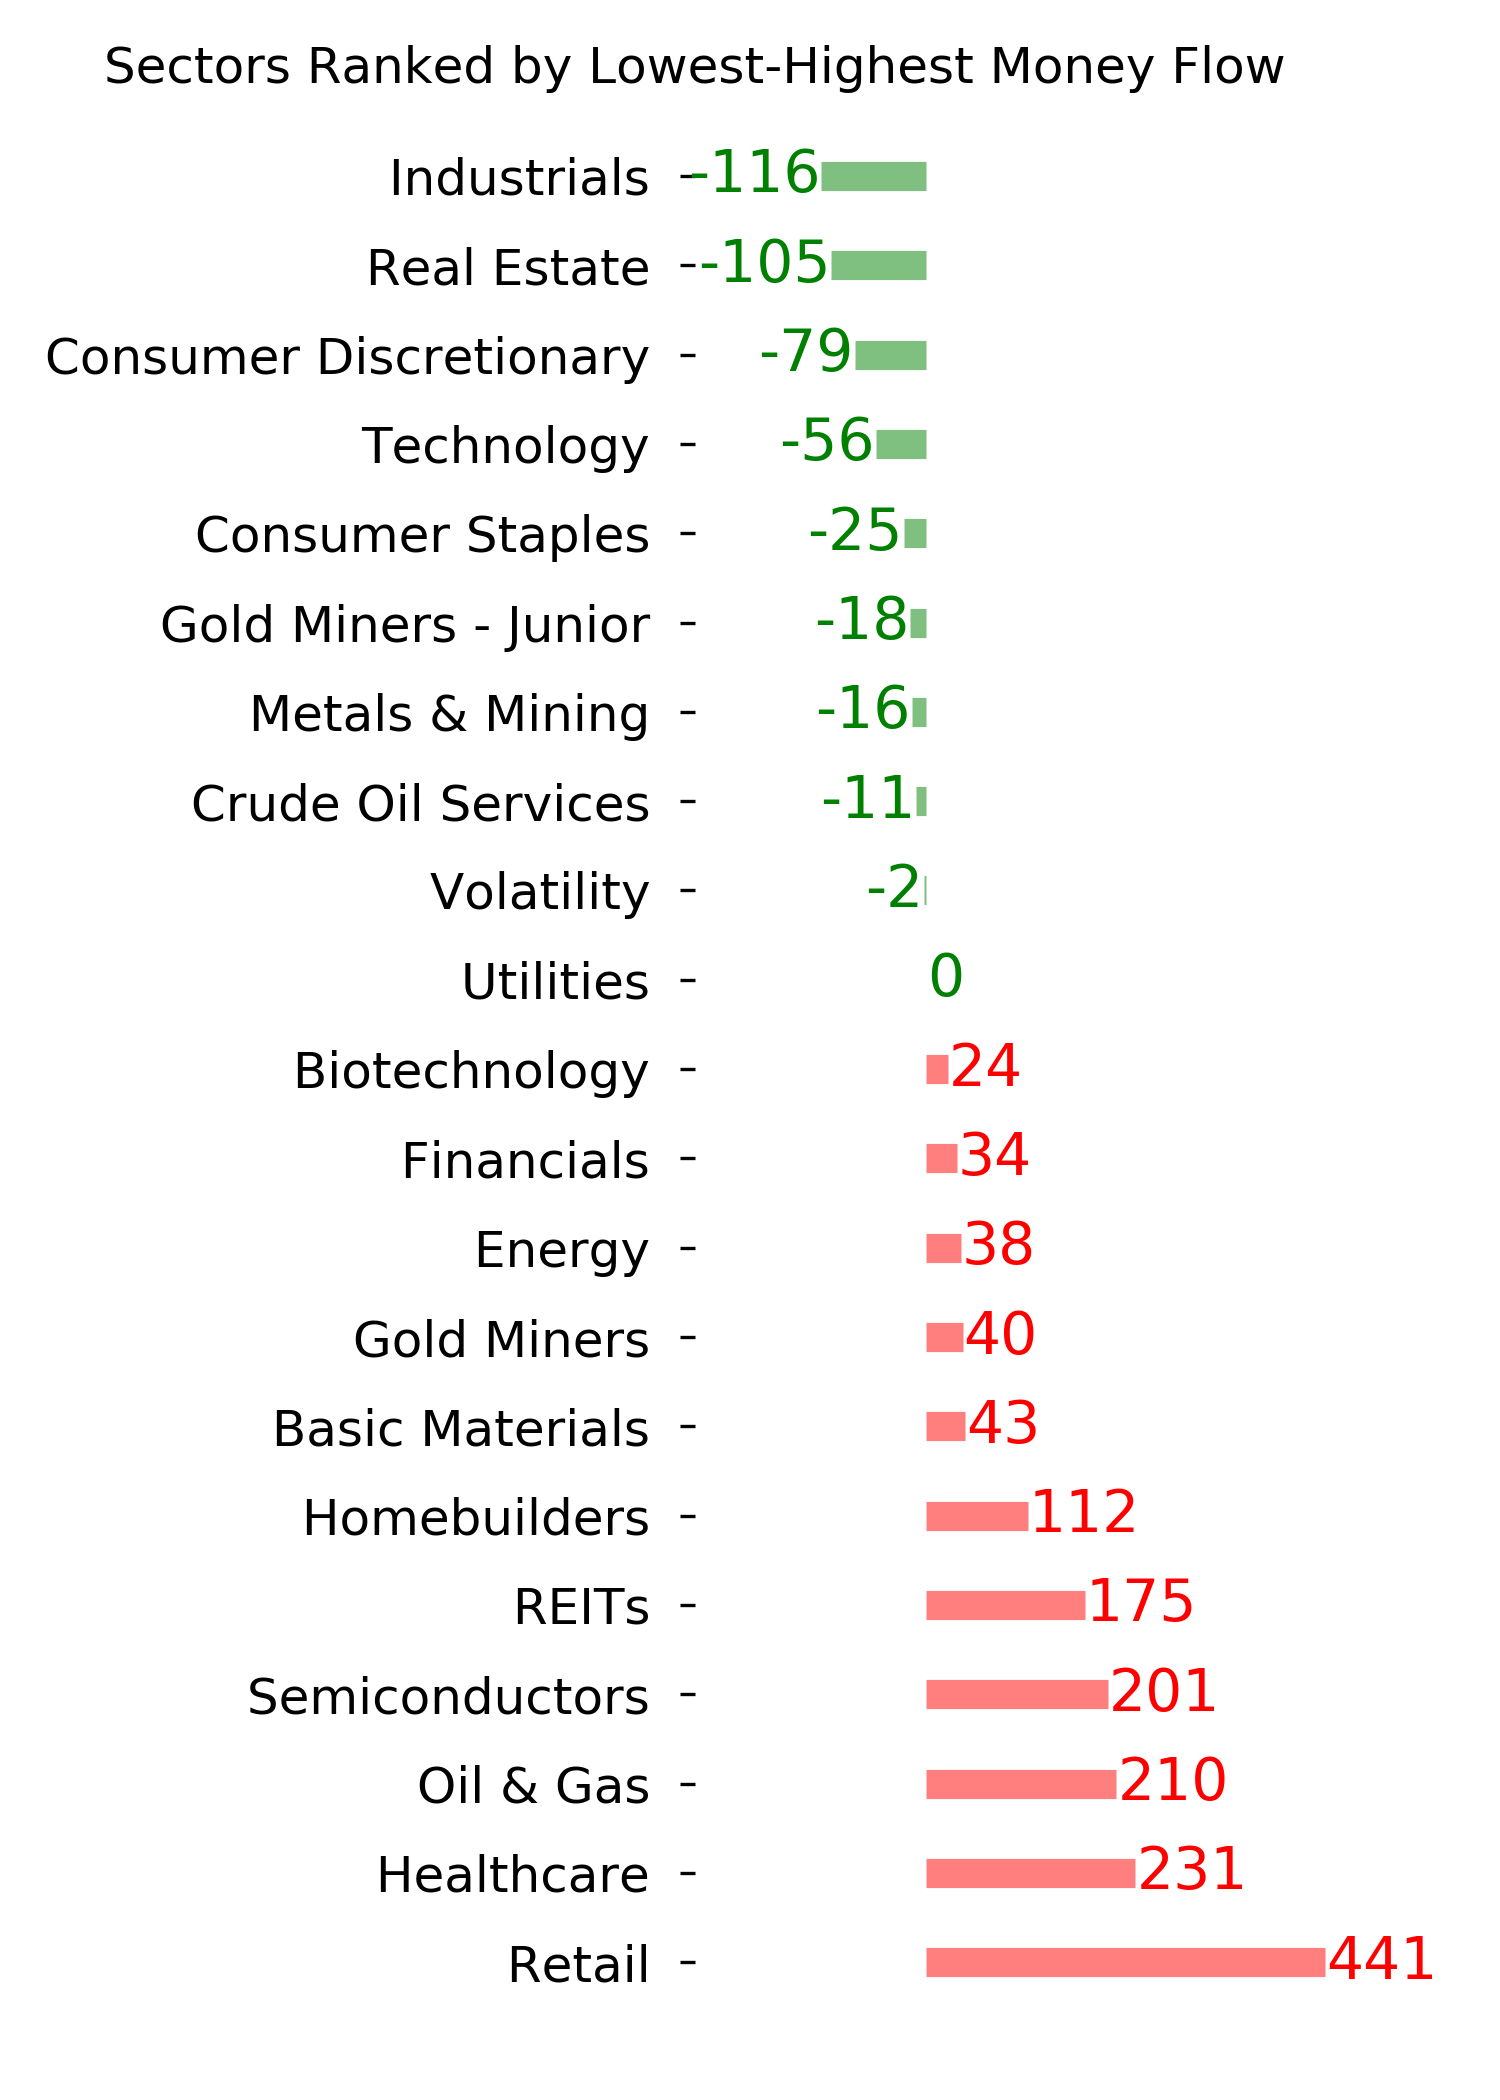
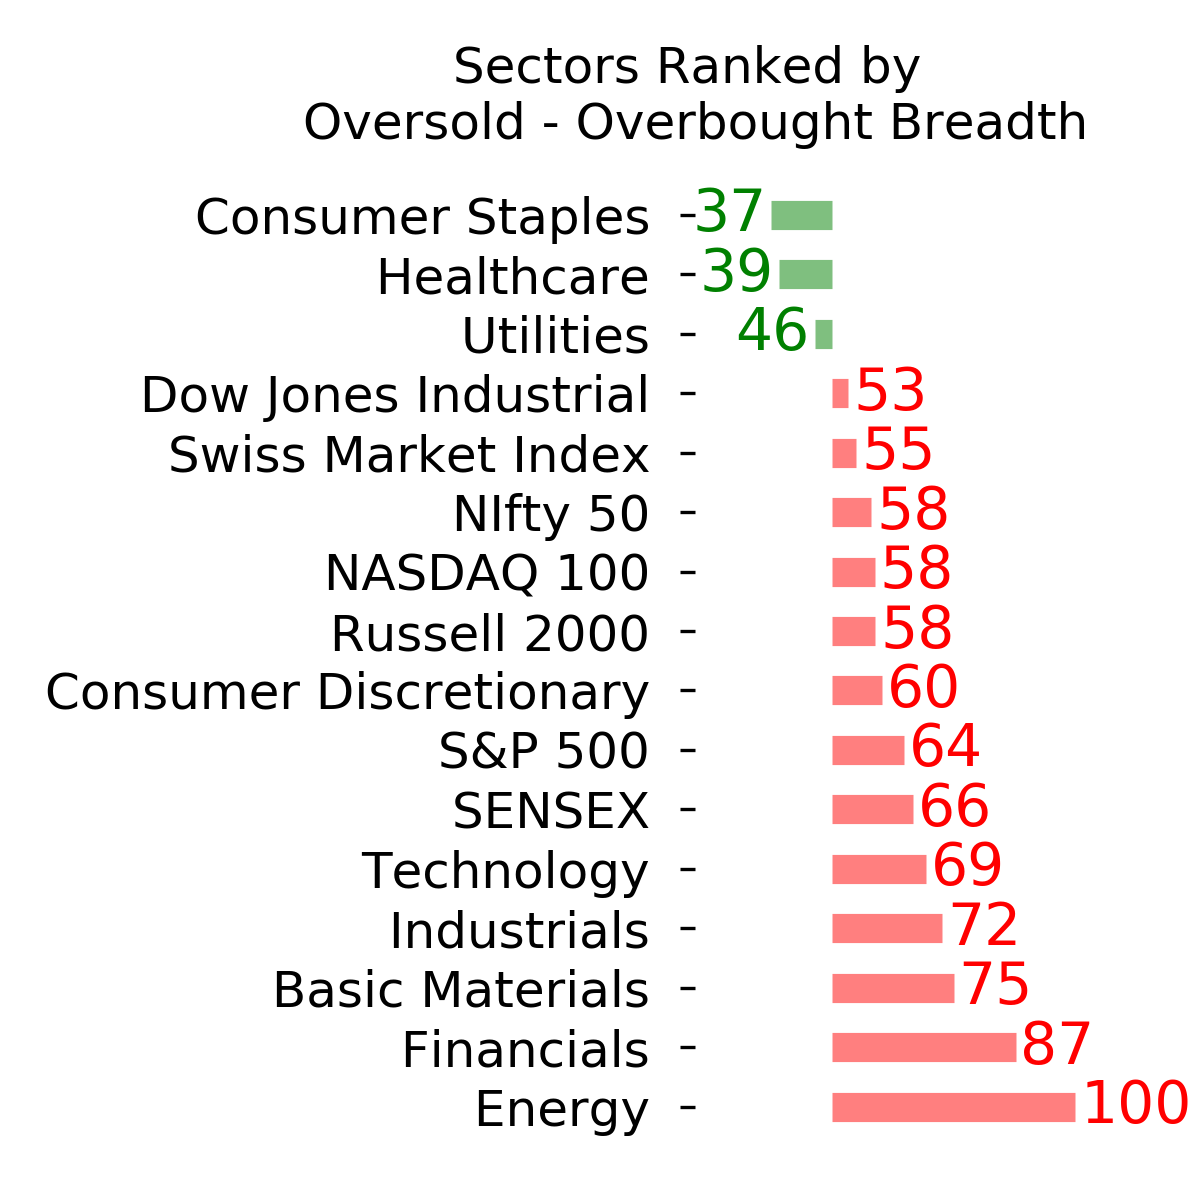
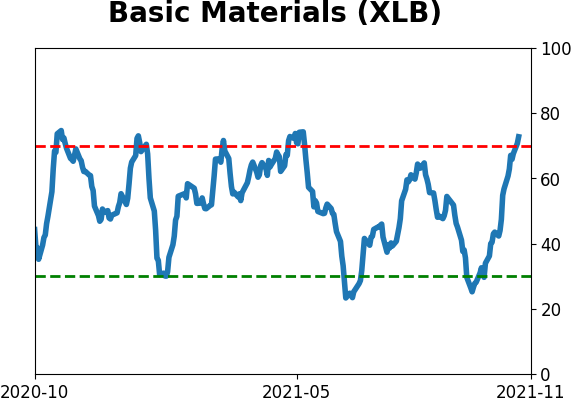
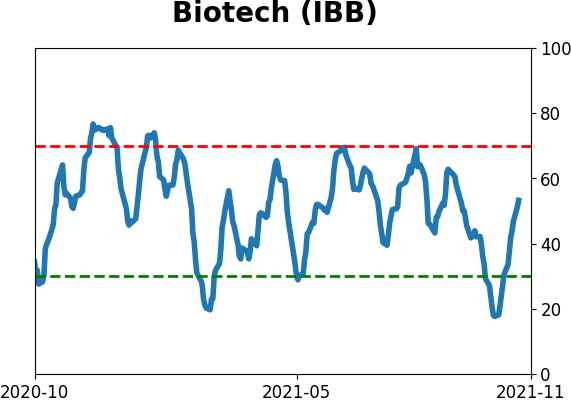
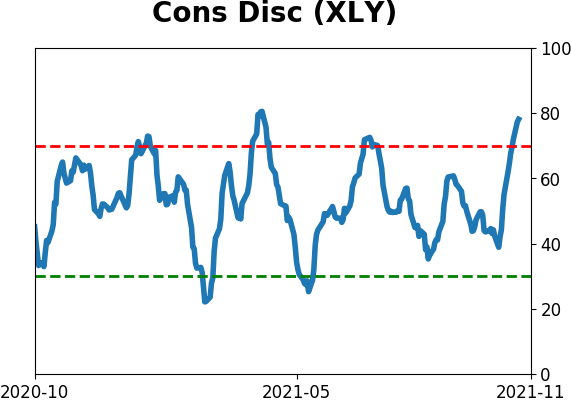
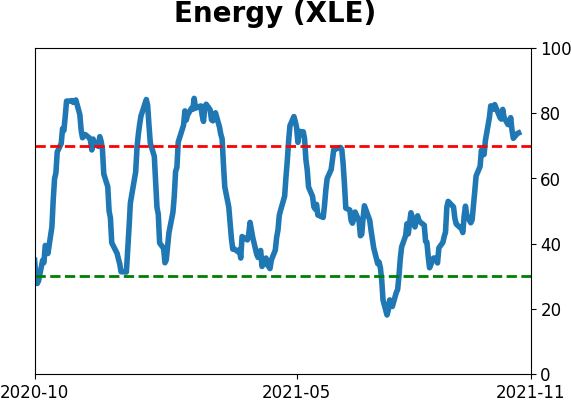
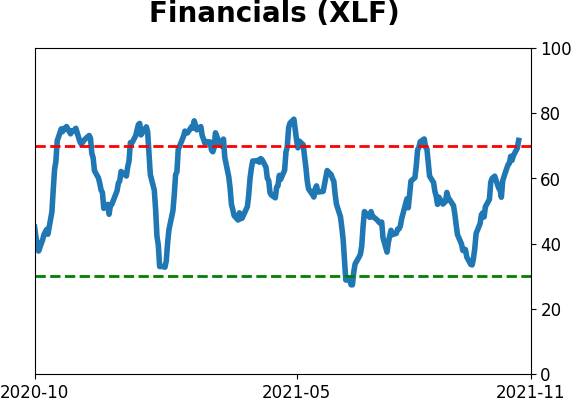
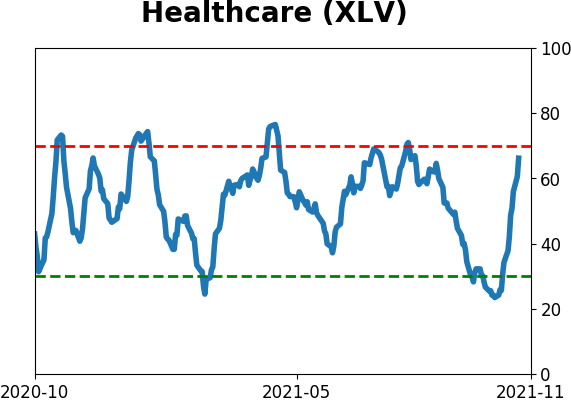
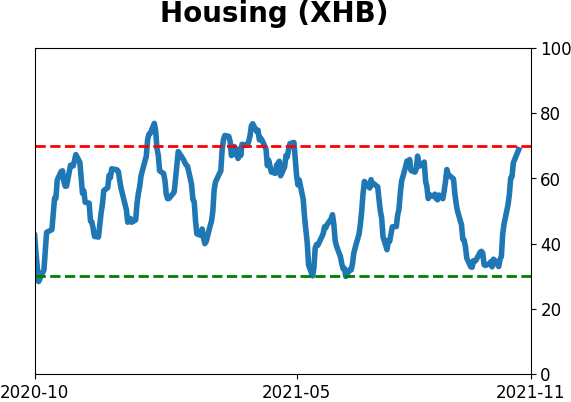
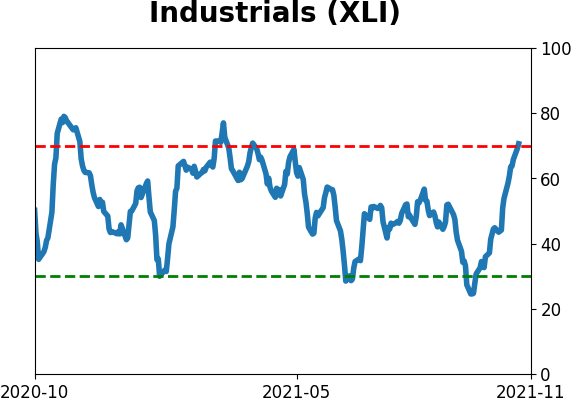
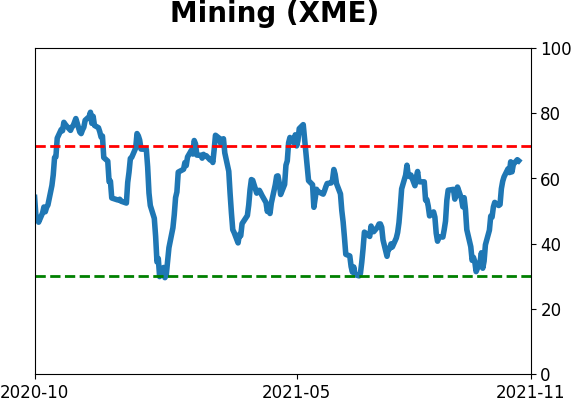
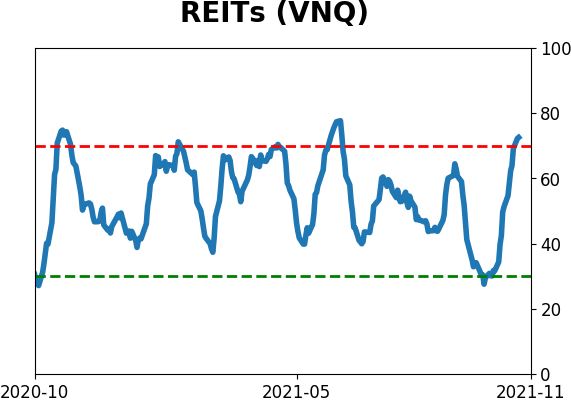
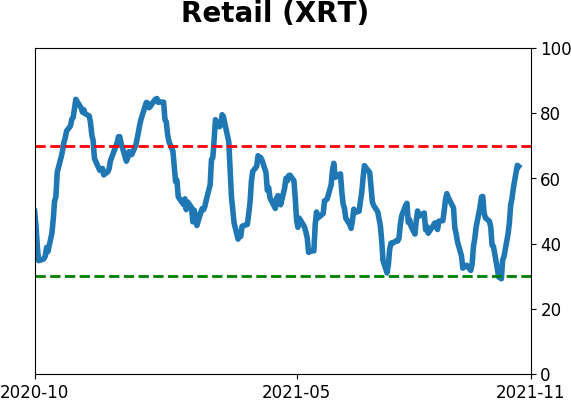
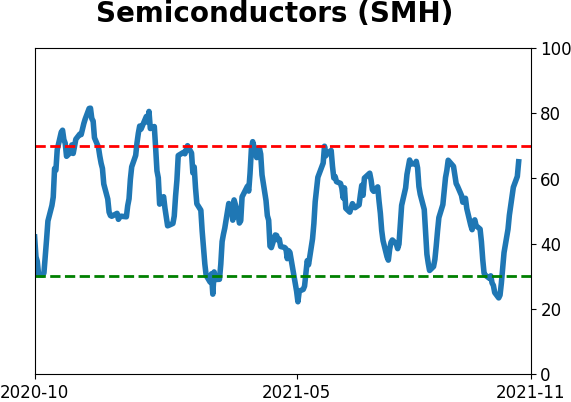
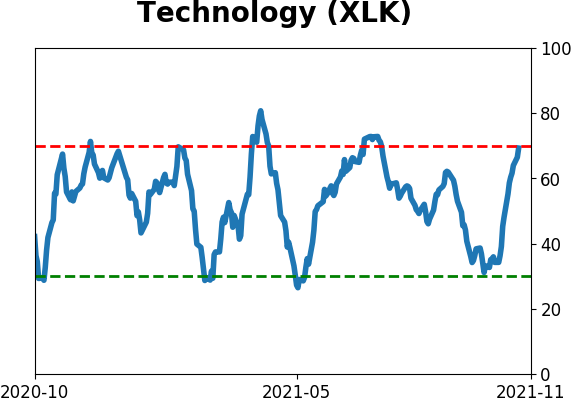
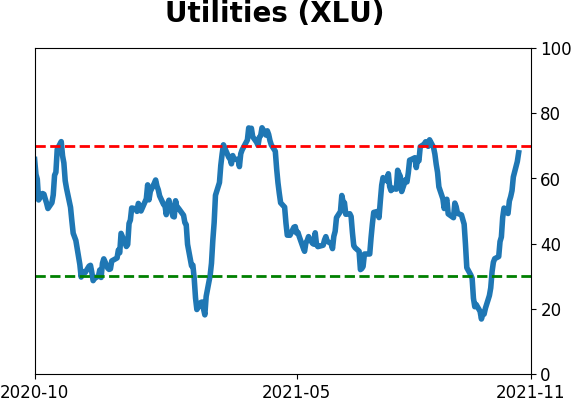
Sector ETF's - 10-Day Moving Average
|
|
|
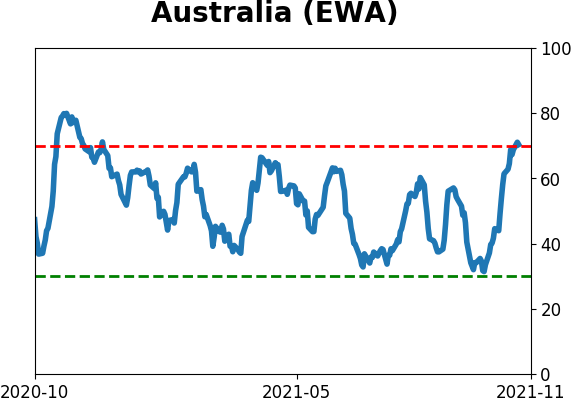
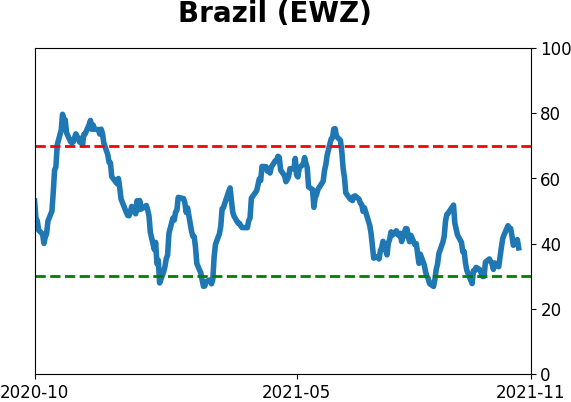
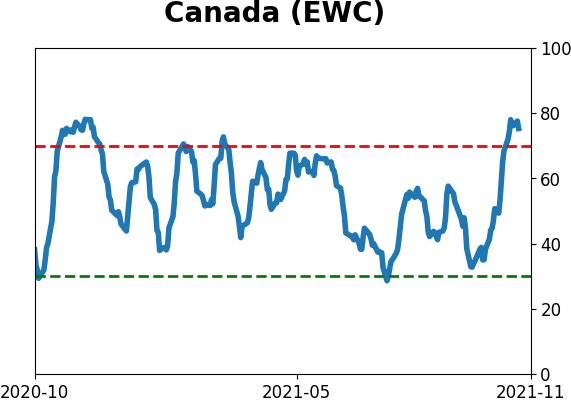
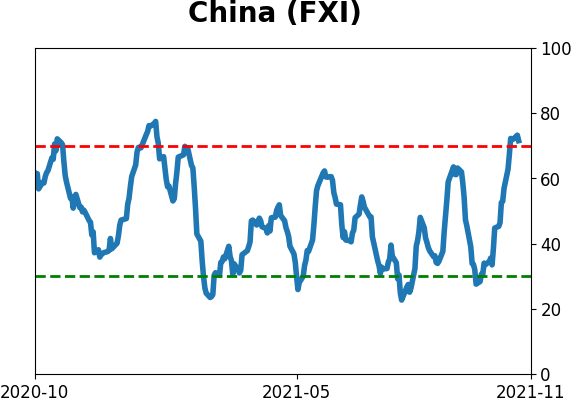
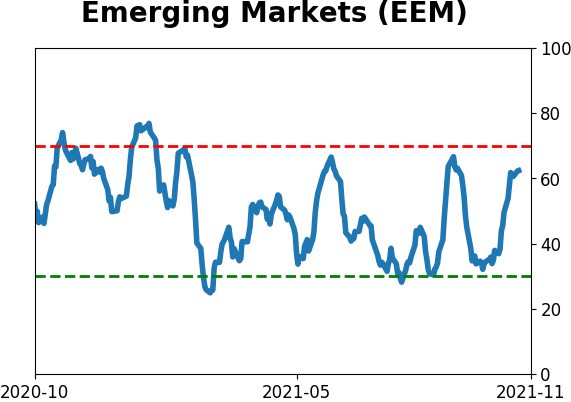
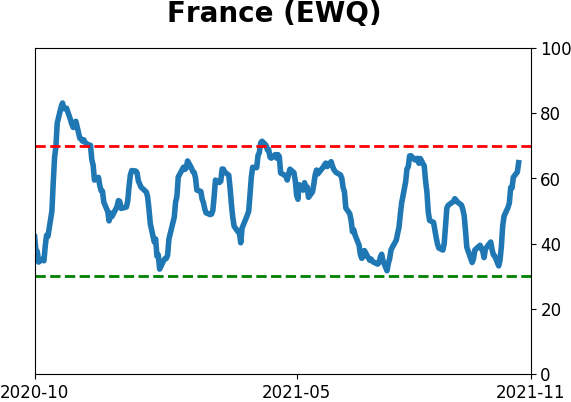
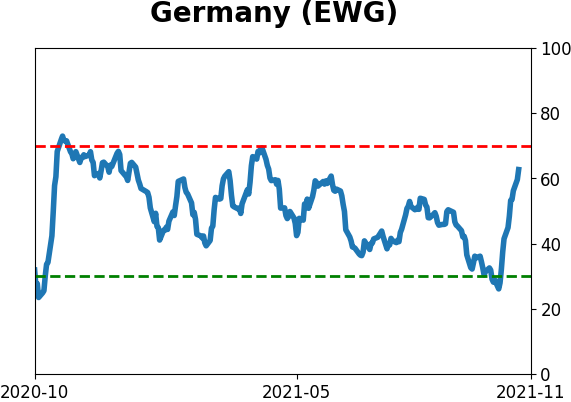
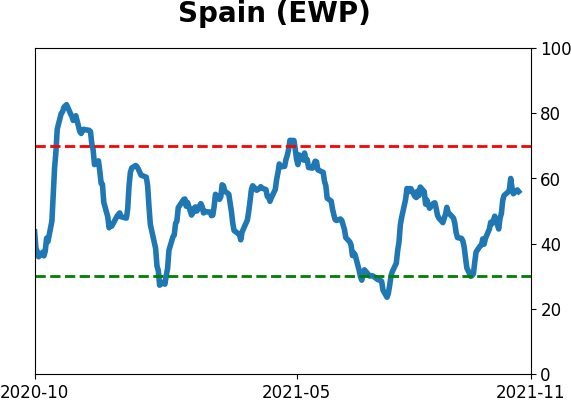
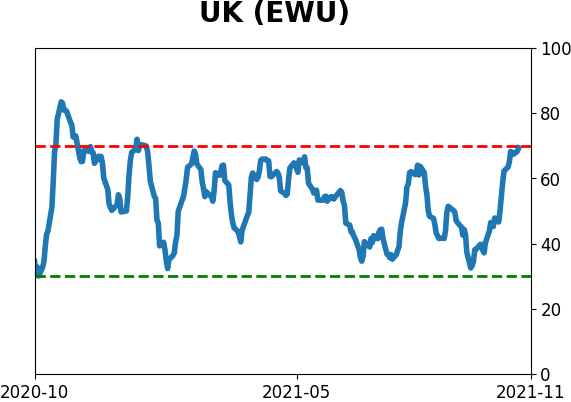
Country ETF's - 10-Day Moving Average
|
|
|
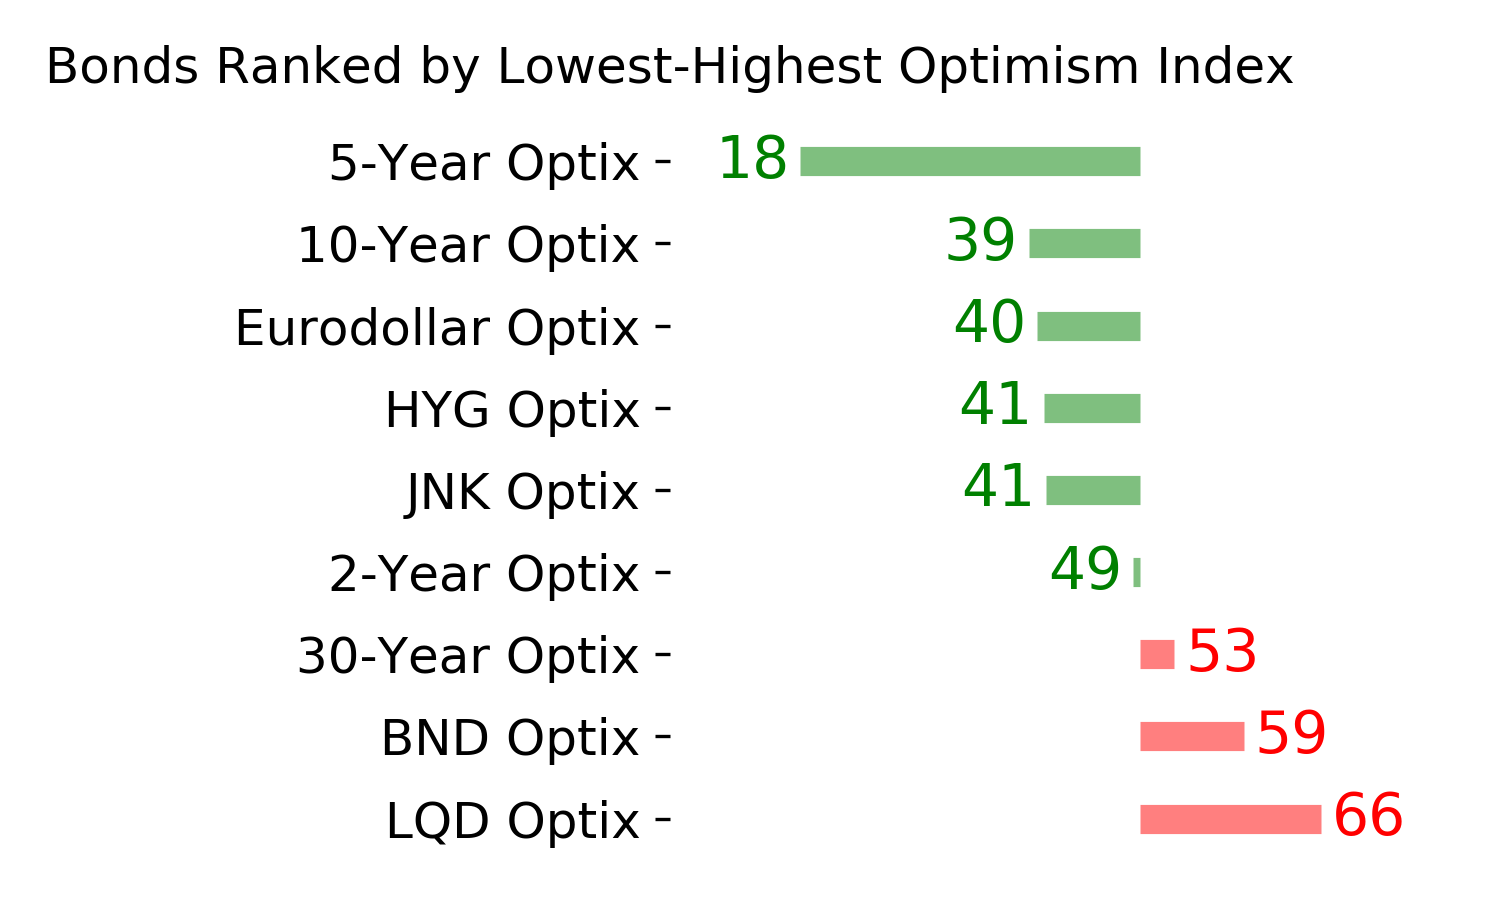
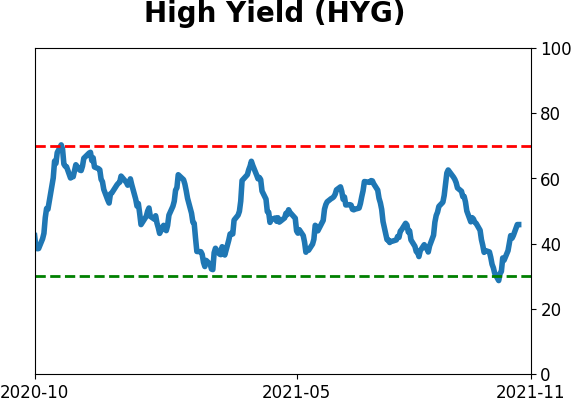
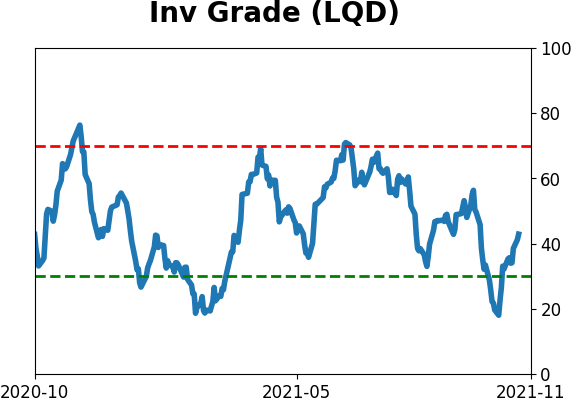
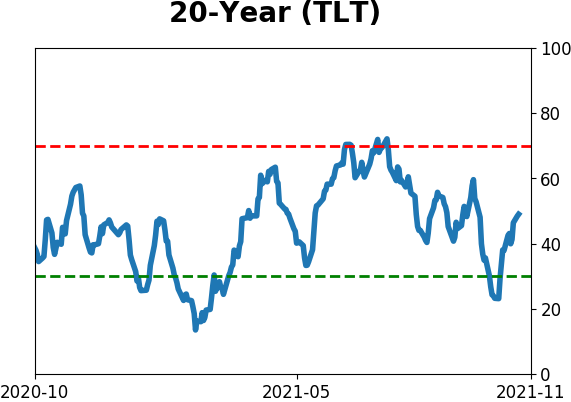
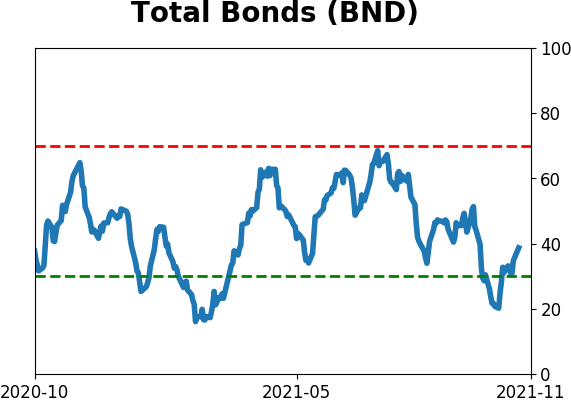
Bond ETF's - 10-Day Moving Average
|
|
|
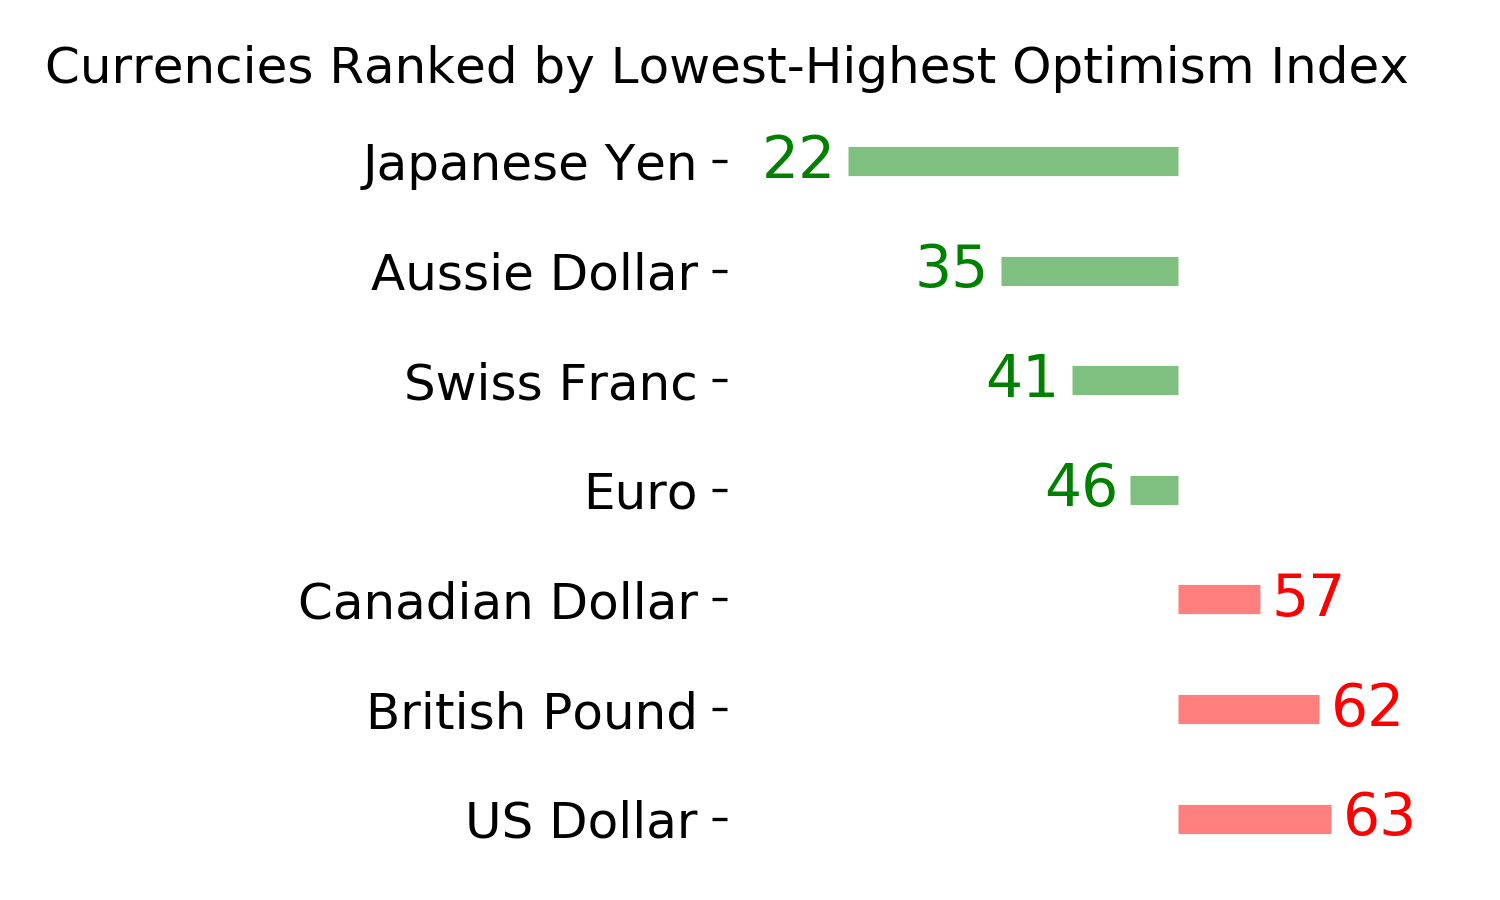
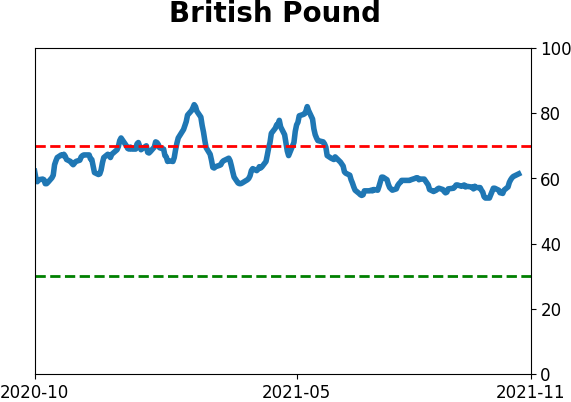
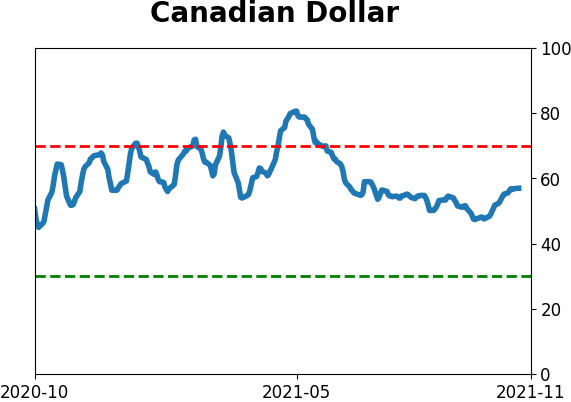
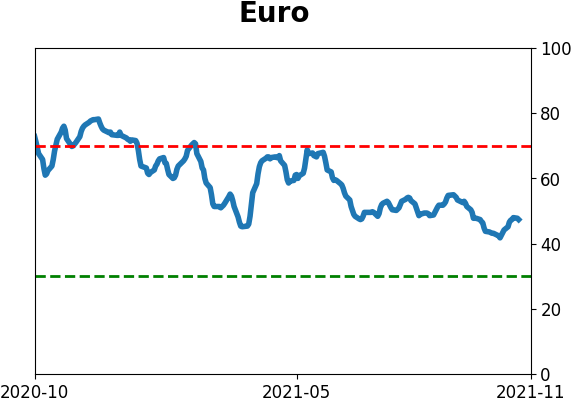
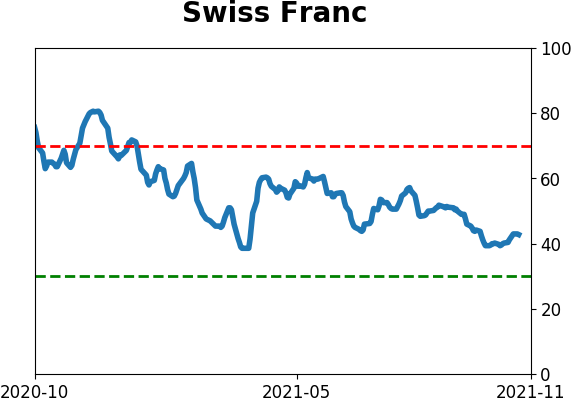
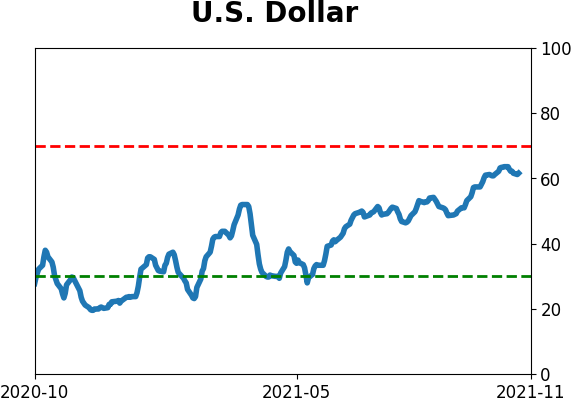
Currency ETF's - 5-Day Moving Average
|
|
|
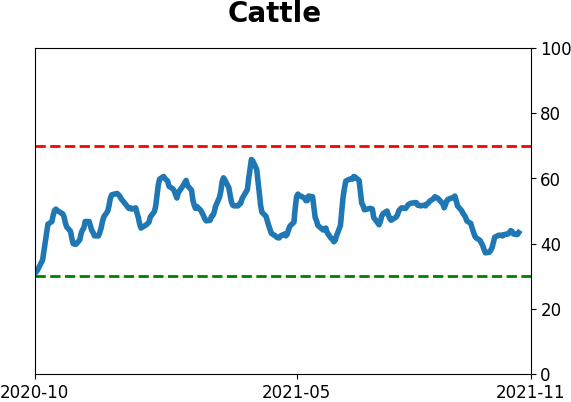
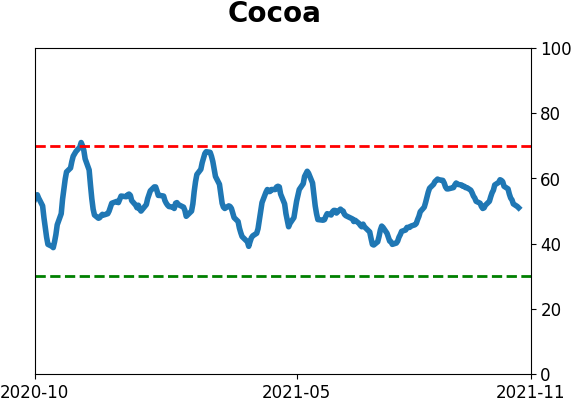
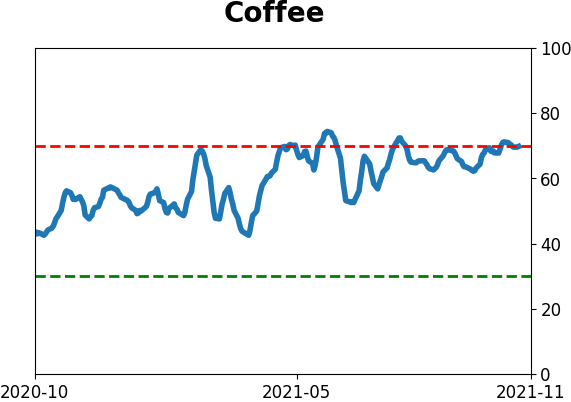
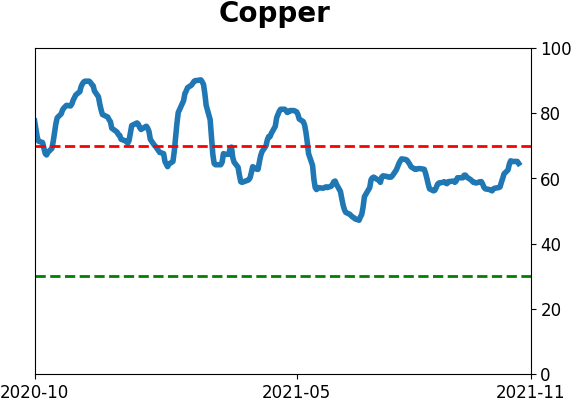
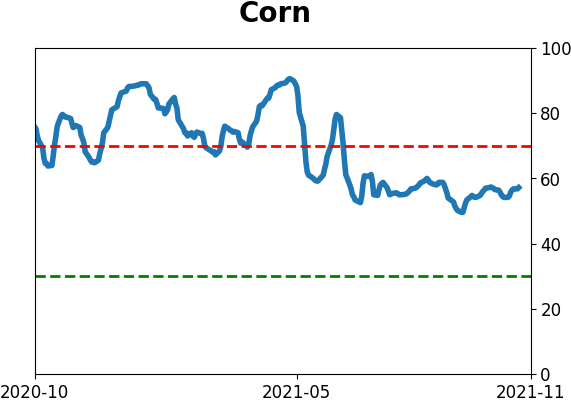
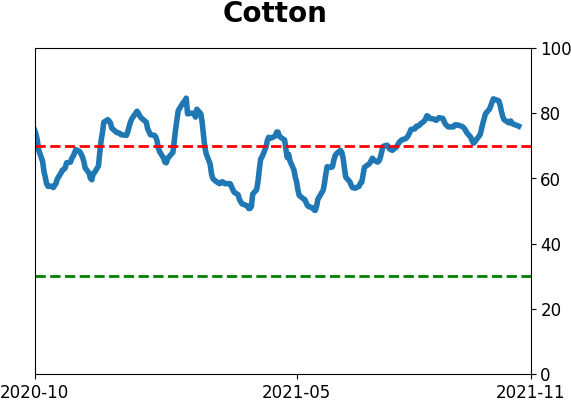
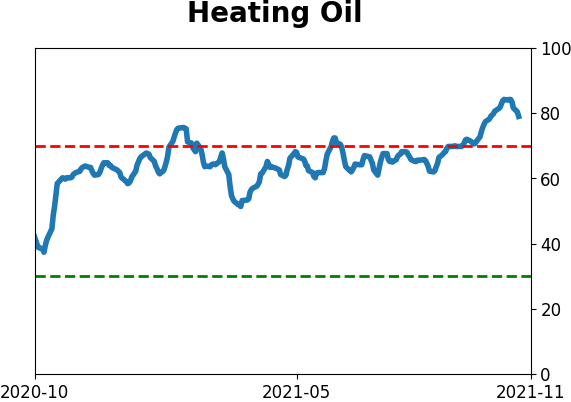
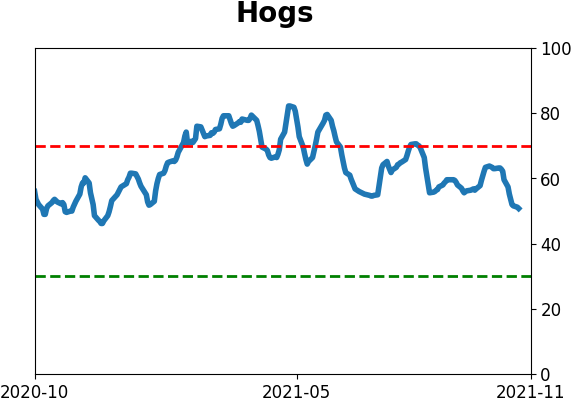
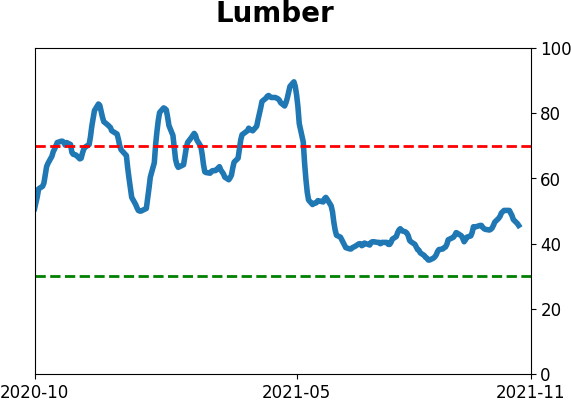
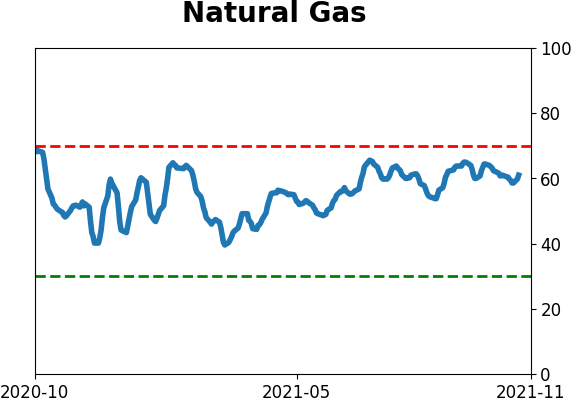
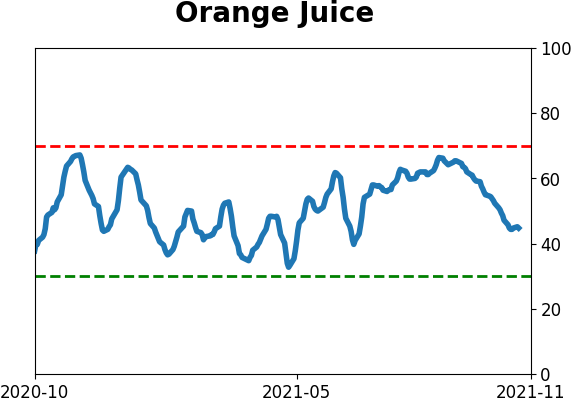
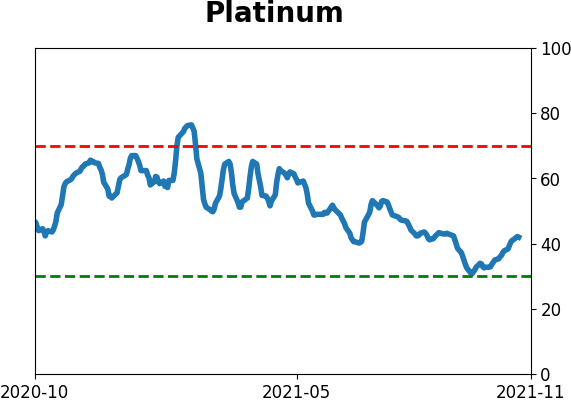
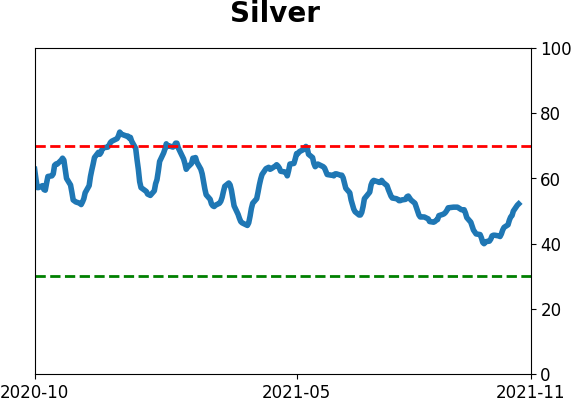
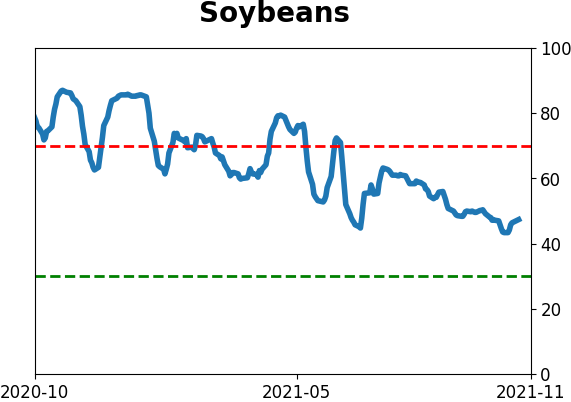
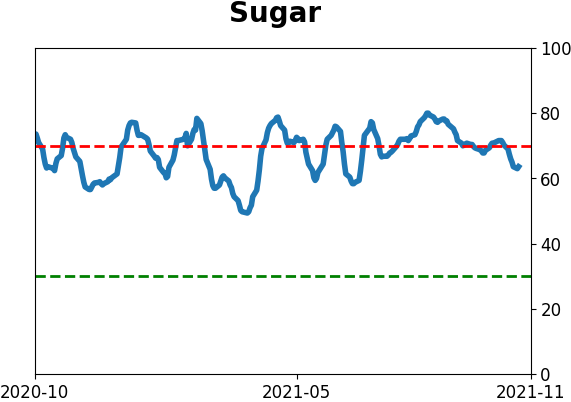
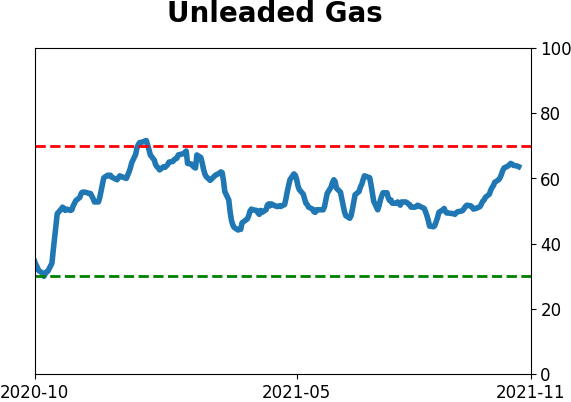
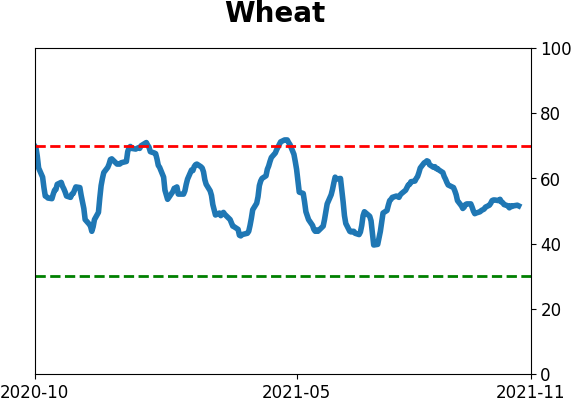
Commodity ETF's - 5-Day Moving Average
|
|