Headlines
|
|
Chinese internet stocks plunge again:
After weekend developments that apparently took investors by surprise, Chinese internet stocks plunged on Monday. It resulted in nearly 60% of the stocks falling to a 52-week low, and long-term momentum declining to nearly 15-year extremes.
|
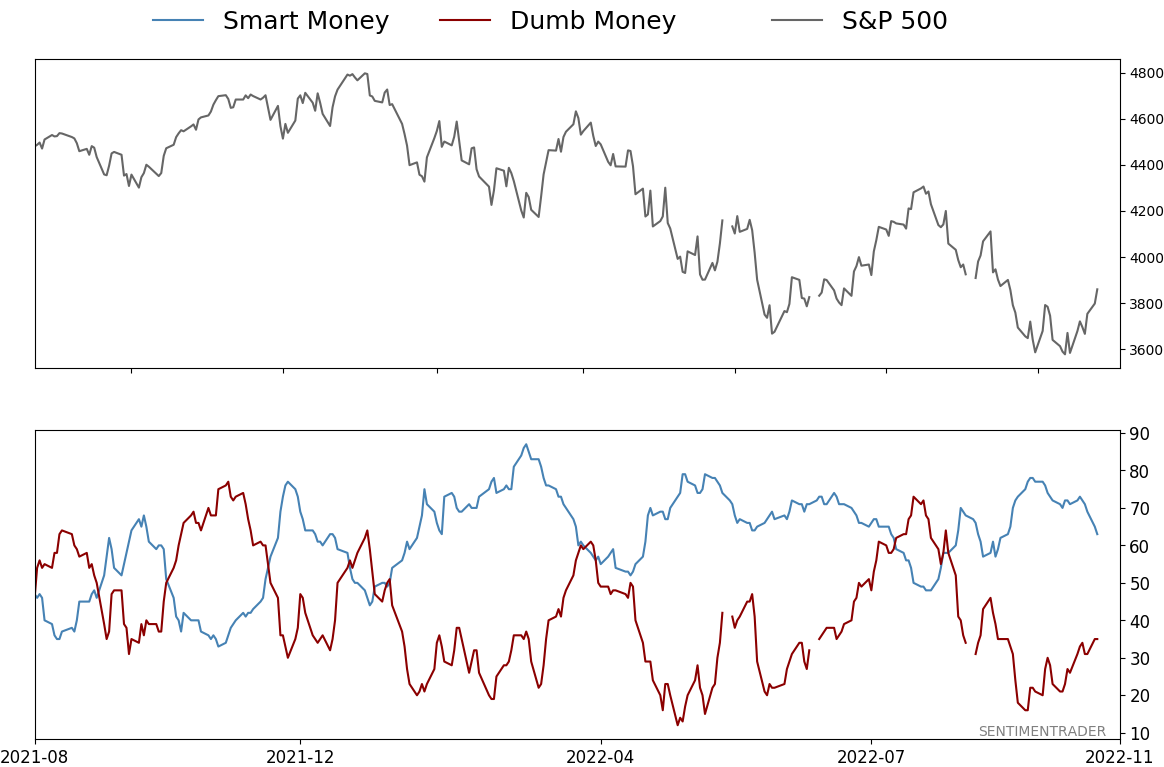
Smart / Dumb Money Confidence
|
Smart Money Confidence: 63%
Dumb Money Confidence: 35%
|
|
Risk Levels
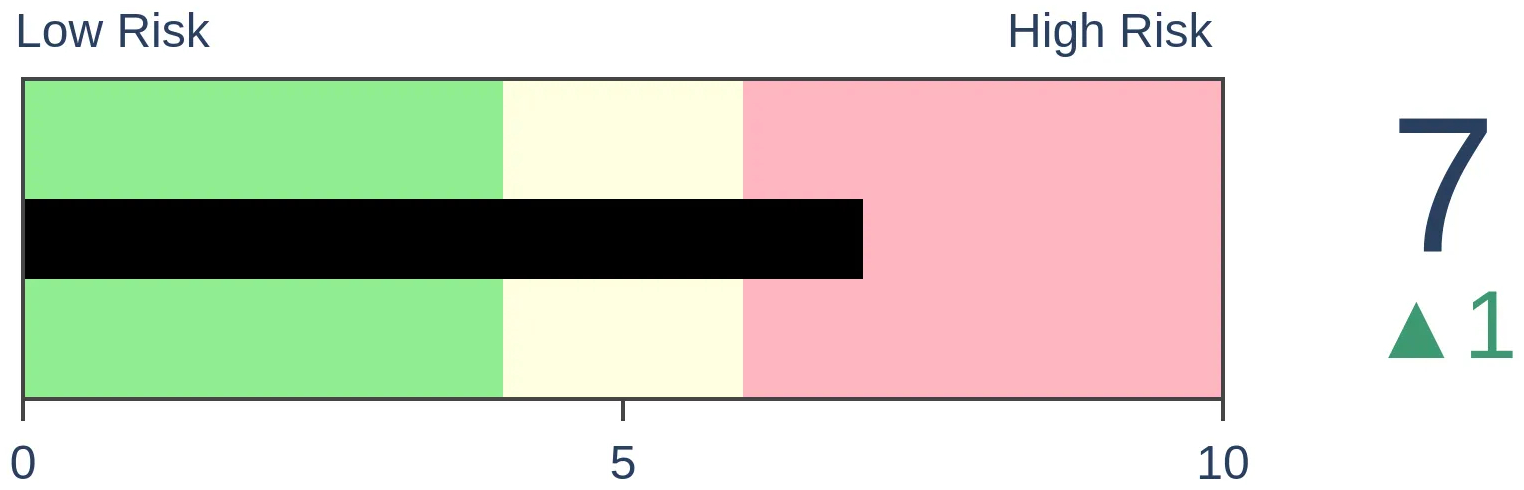
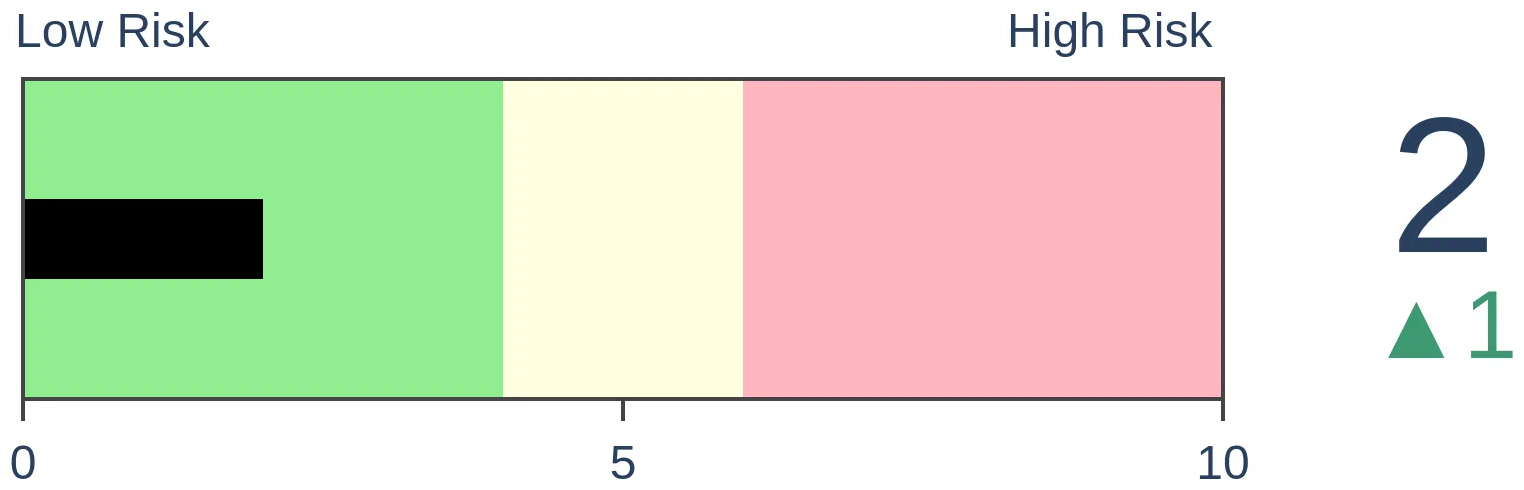
Stocks Short-Term
|
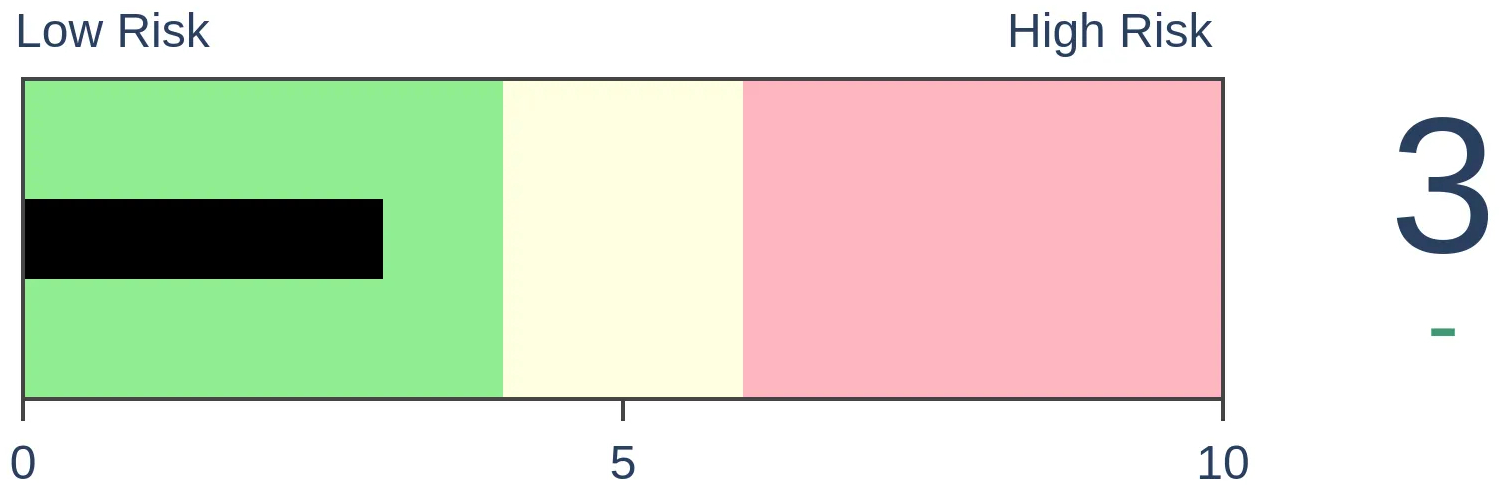
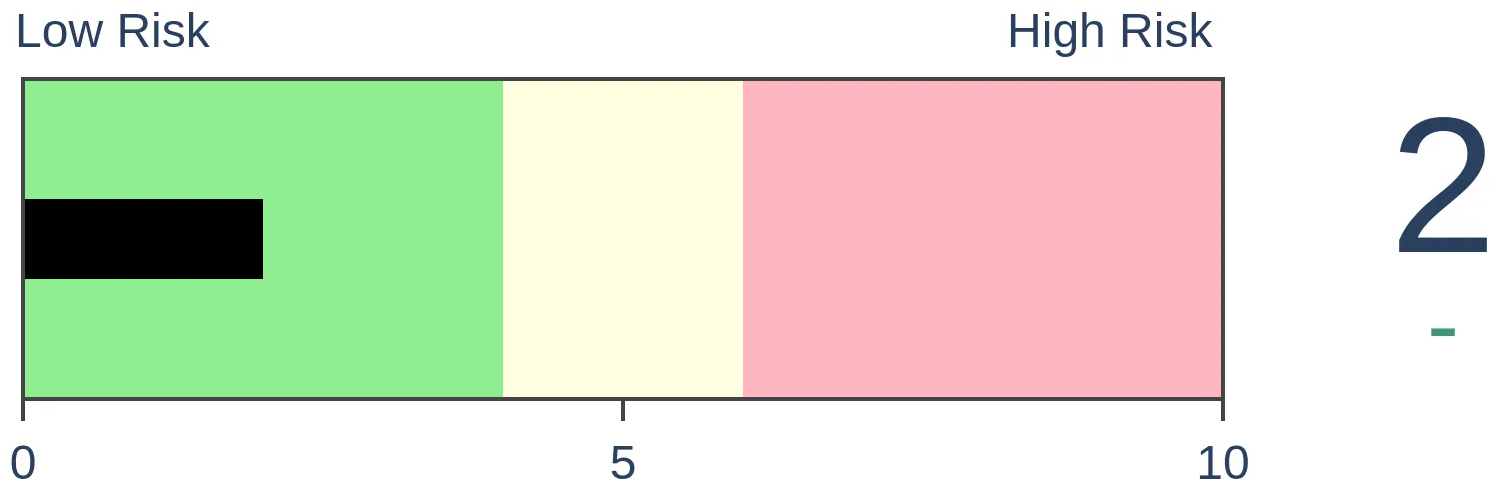
Stocks Medium-Term
|
|
Bonds
|
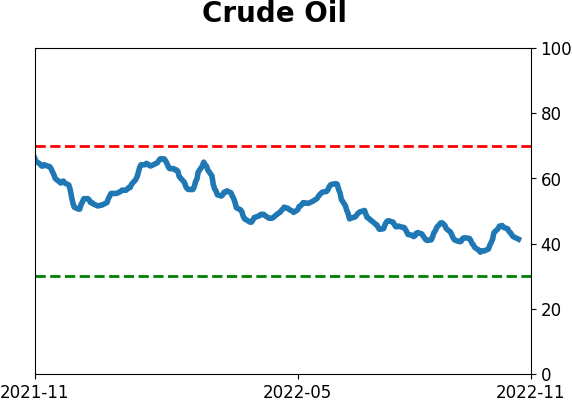
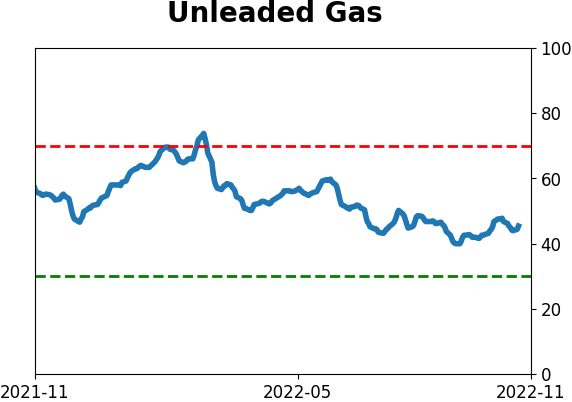
Crude Oil

|
|
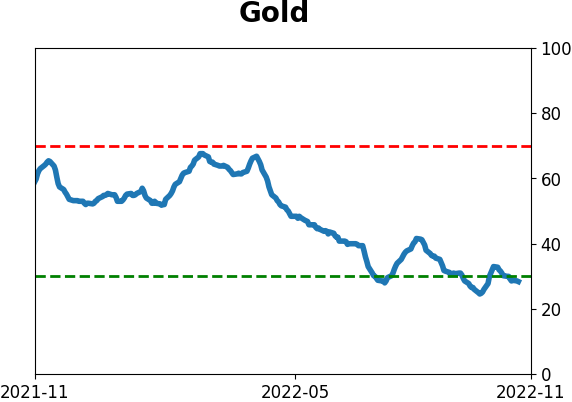
Gold
|
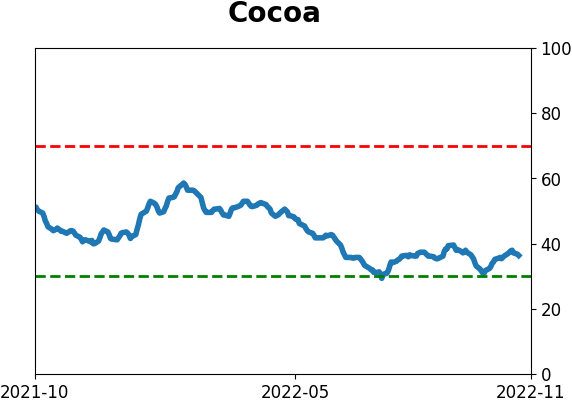
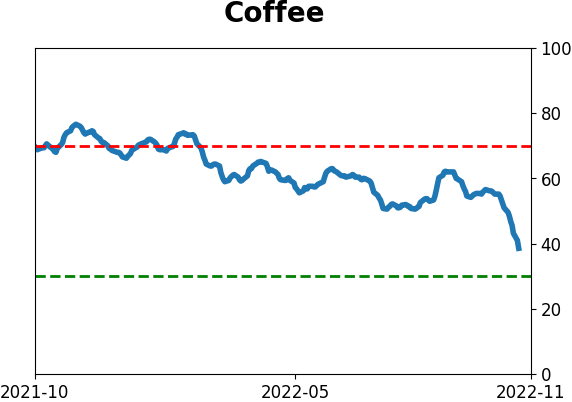
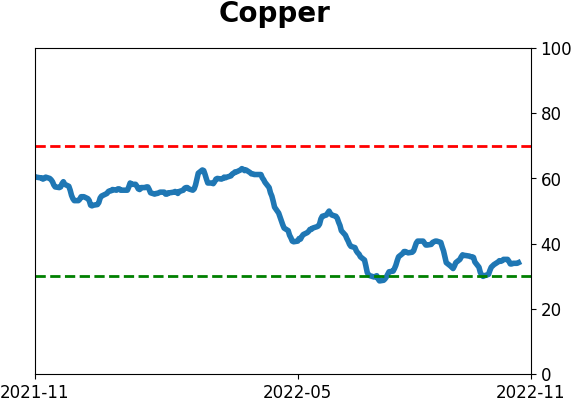
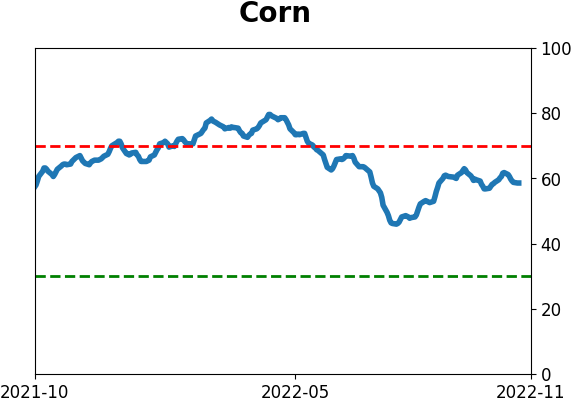
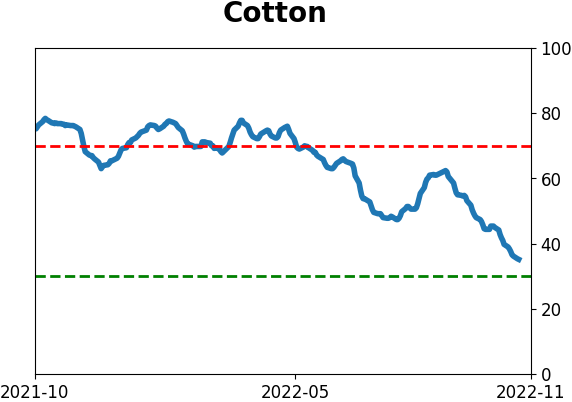
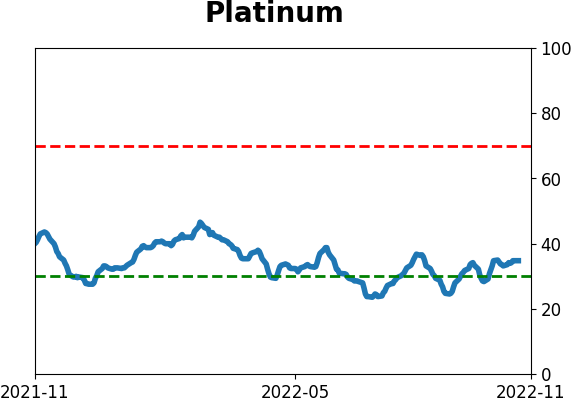
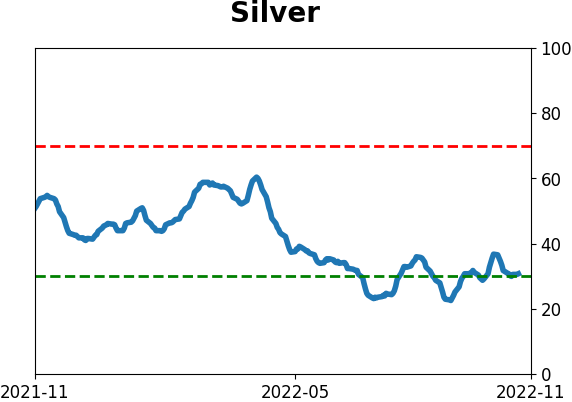
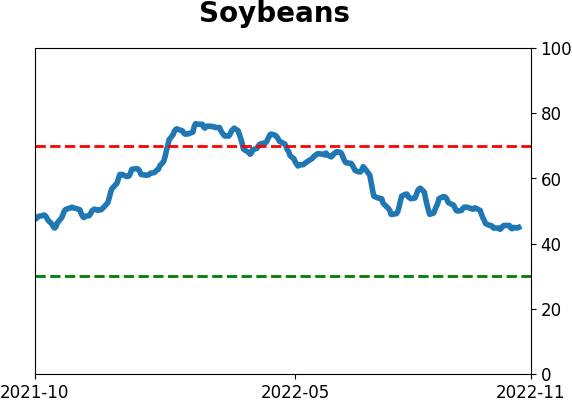
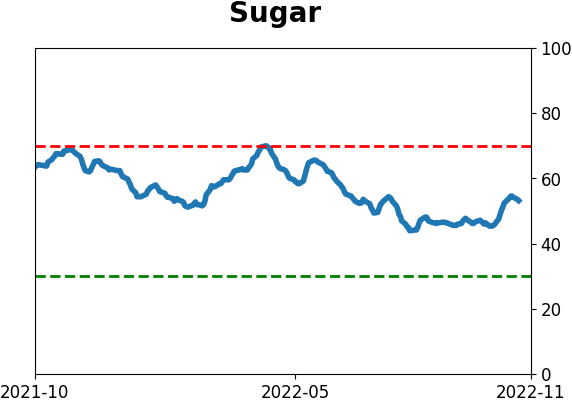
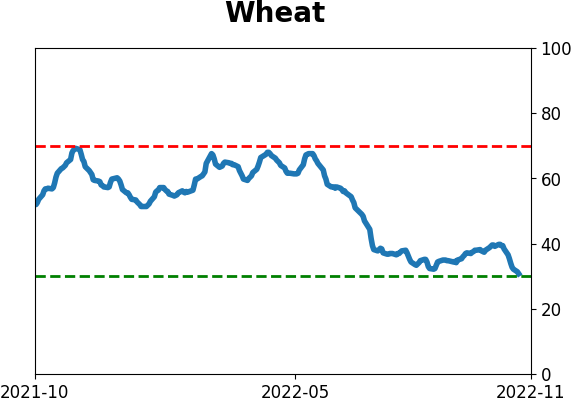
Agriculture
|
|
Research
By Jason Goepfert
BOTTOM LINE
After weekend developments that apparently took investors by surprise, Chinese internet stocks plunged on Monday. It resulted in nearly 60% of the stocks falling to a 52-week low, and long-term momentum declining to nearly 15-year extremes.
FORECAST / TIMEFRAME
None
|
Key points:
- Chinese internet stocks plunged again, with nearly 60% of the stocks hitting a 52-week low
- Long-term momentum has also dropped precipitously, challenging extremes from the past 15 years
- After similar behavior, investors had exhausted their selling, and buying interest entered the market
From uninvestable to investable and back again
Chinese internet stocks have been ground zero for pessimism in 2022. After weekend developments, that pessimism morphed into hatred so intense that, once again, there were declarations of the sector being uninvestable.
The last time we heard that kind of talk was mid-March. The putrid sentiment resulted in a wave of overwhelming selling so severe it surpassed anything we'd ever seen. In response, the stocks rallied more than 60% over the next few months.
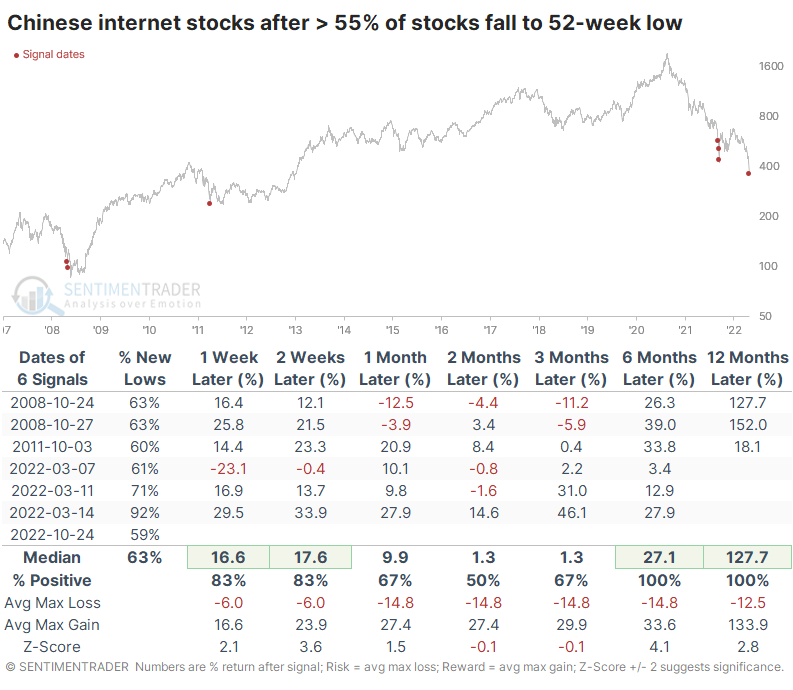
After showing some promising signs of follow-through into the early summer, the stocks peaked, and it has been nothing but a selling avalanche ever since. All the rebound gains have evaporated, and most of the stocks are trading at new lows. On Monday, nearly 60% of Chinese internet stocks hit a 52-week low, the 4th-highest reading in 15 years.
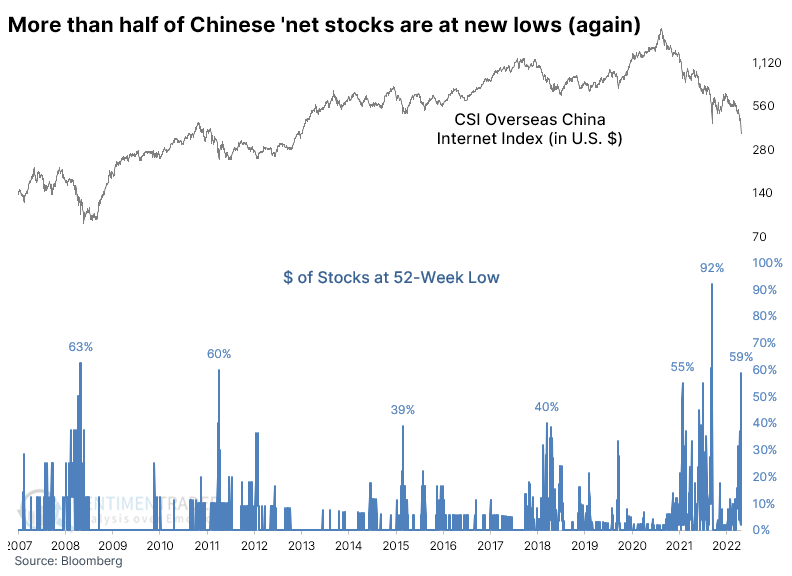
There have been six other days when more than 55% of the stocks fell to a new low on the same day. There were some hefty losses at some point after several of them, but all showed gains over the next six months.
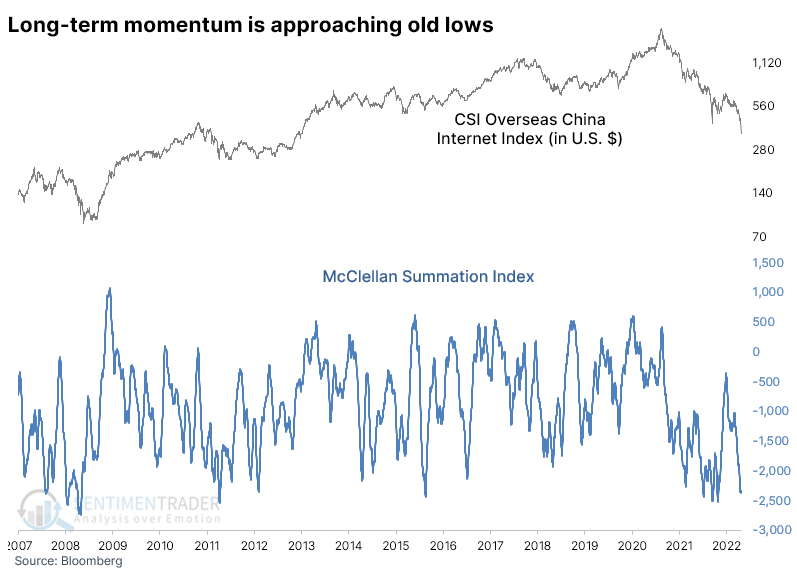
Long-term momentum drops back to an extreme
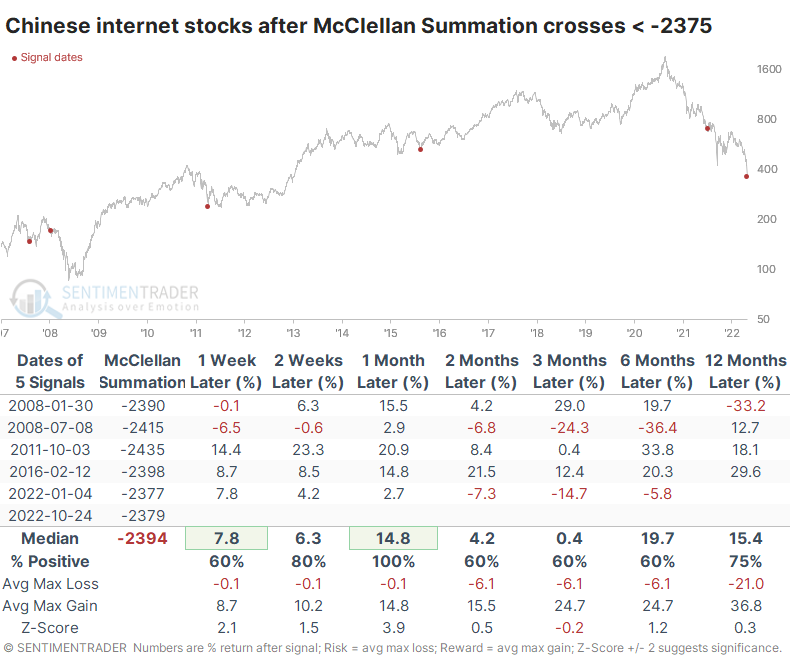
One of the better representations of long-term underlying momentum in an index is the McClellan Summation Index. It monitors the daily battle between advancing and declining securities and sums it up over time. This measure for Chinese 'net stocks has plunged again and is challenging its old lows.
After the Summation Index dropped below -2375, the sector rebounded over the next month each time. It ended up being a terrible long-term signal in 2008 and the beginning of this year, while the three other signals rallied at least 20% within the next six months.
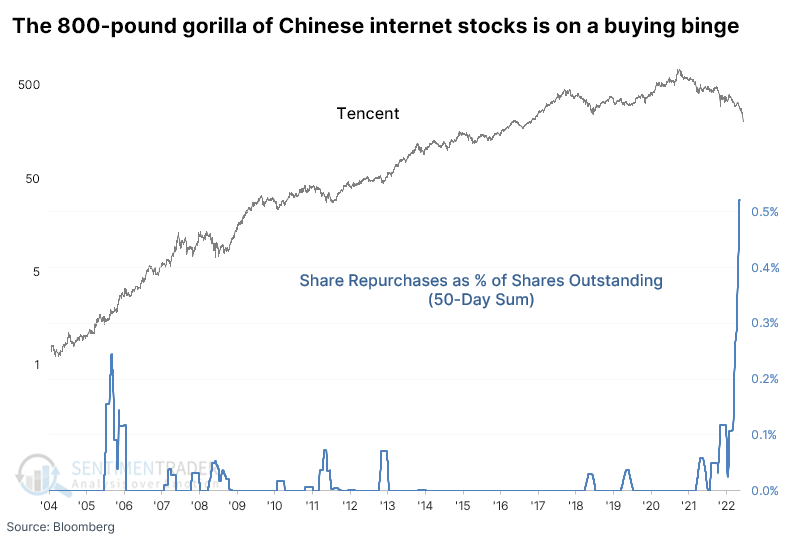
The biggest of them all is buying back shares
We've looked at Tencent before and its unblemished record of share repurchases. Their buyback programs for over a decade were almost impeccably timed, usually showing massive gains over the next 6-12 months.
Until this year.
In 2022, Tencent's share repurchases have all been underwater. In August, the company resumed its purchases on a larger scale, increased them again in September, and then nearly doubled them in October.
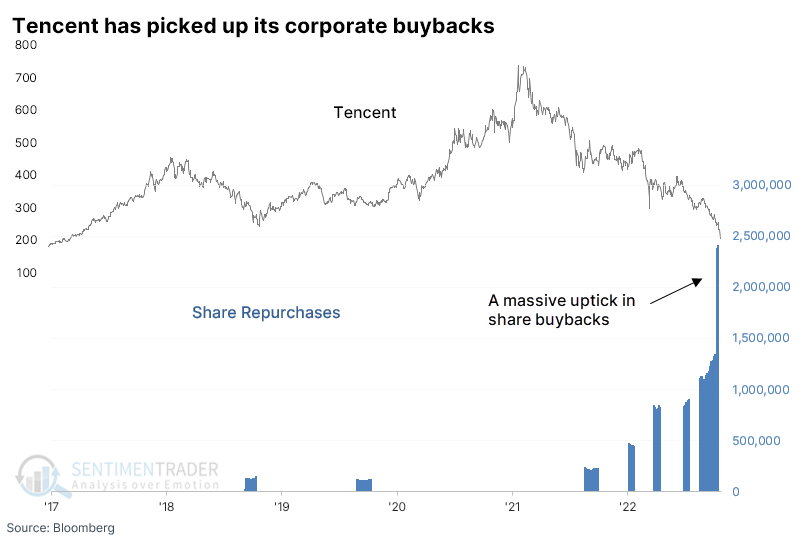
Over a 50-day span, the company bought back a record percentage of its outstanding shares, at least relative to its history as a public company. They stated they would do this in response to Prosus selling down its huge stake in the company.
What the research tells us...
This is not a macro service. We don't opine on (most) economic reports or supposed Intermarket influences. We also don't touch politics. I have no opinion, or interest in anyone else's, about President Xi's machinations. Scroll through media headlines for any turning point over the past 15 years, and it will be an exercise in "nobody knows nothin'."
Based on an objective look at the selling pressure that Chinese internet stocks have suffered, it seems more likely that value buyers will step in again. It's hard to imagine, given pretty much anything one would read in the media, but that was also the case in March. And it's kind of the entire point of watching how investors have behaved in the past and will likely repeat in the future.
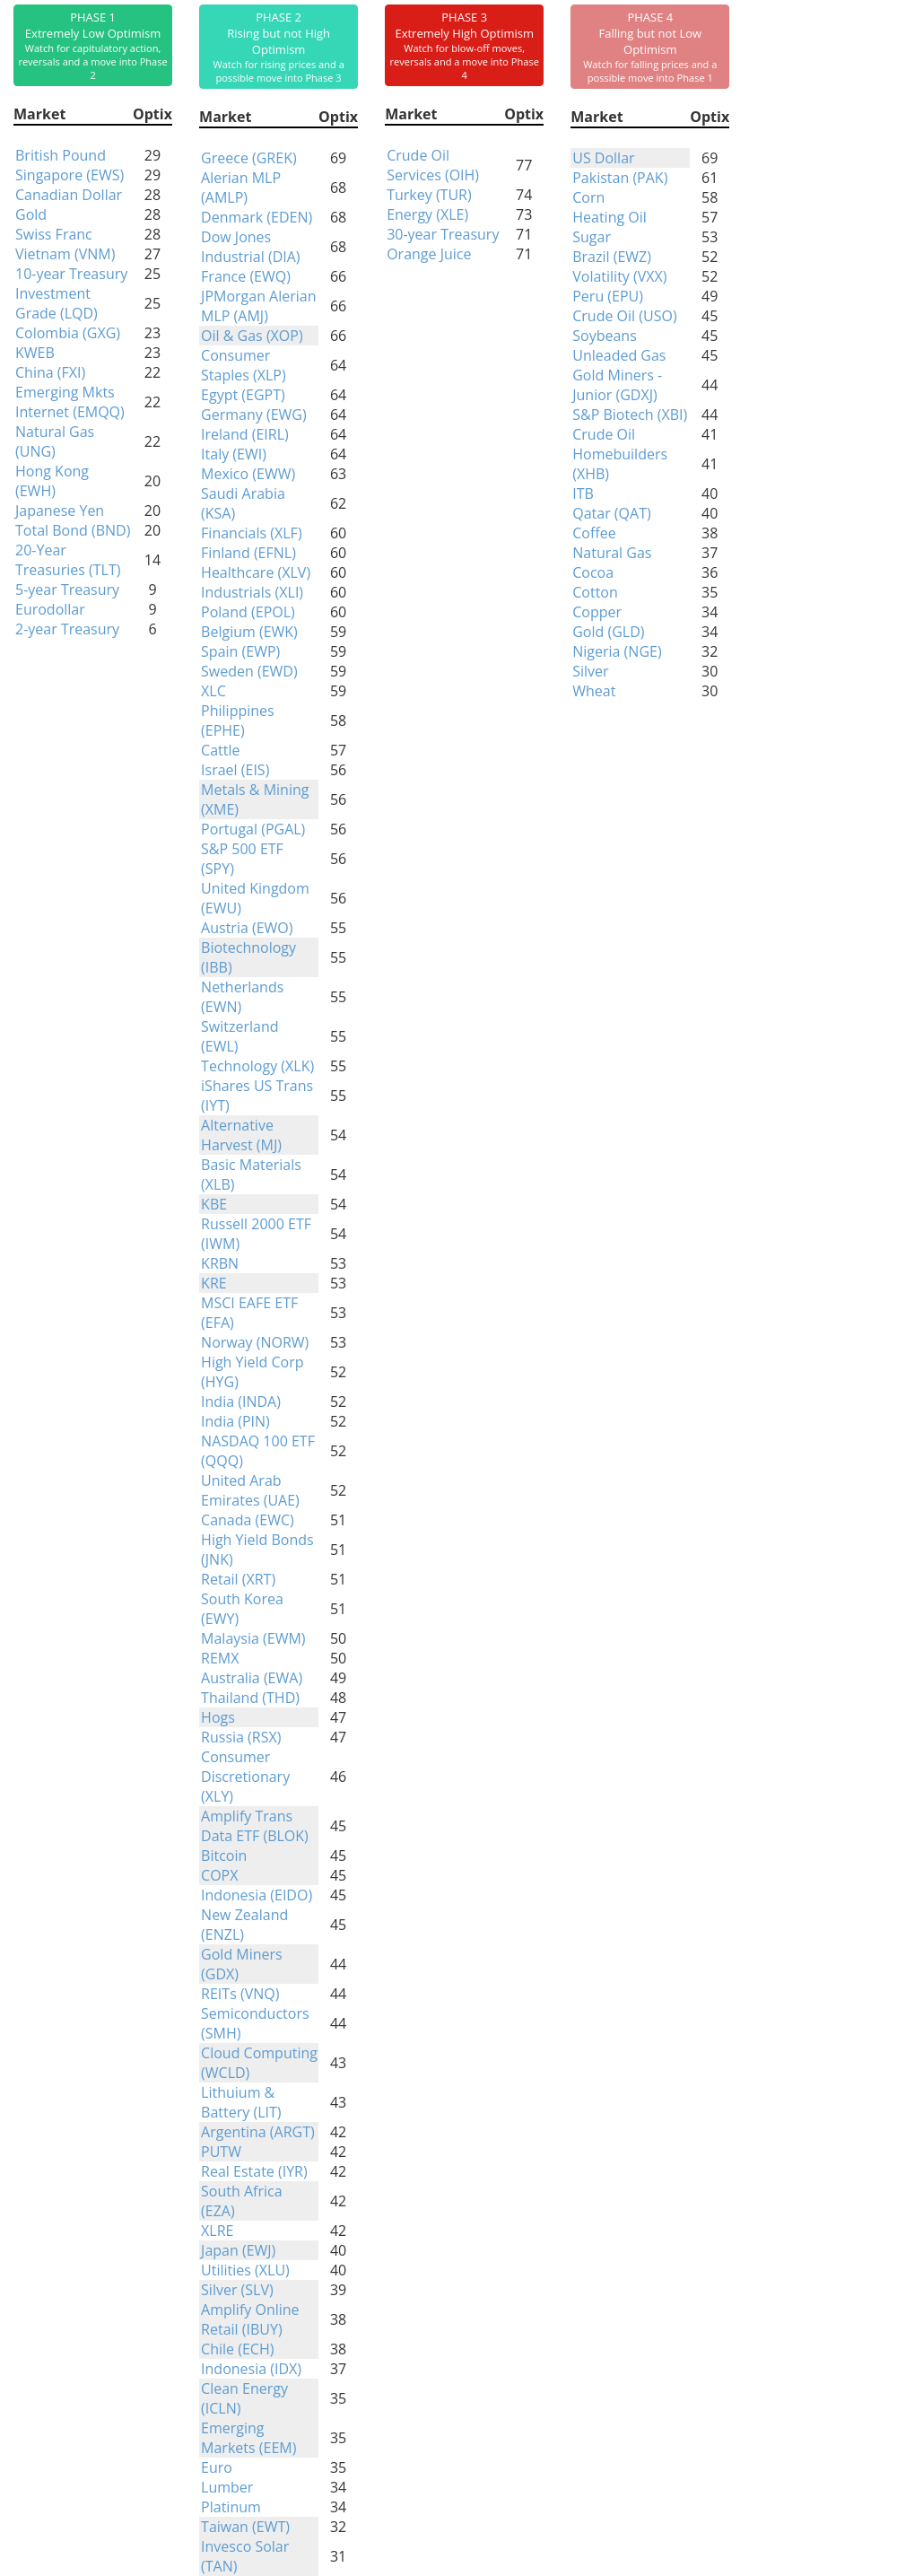
Indicators at Extremes
Phase Table
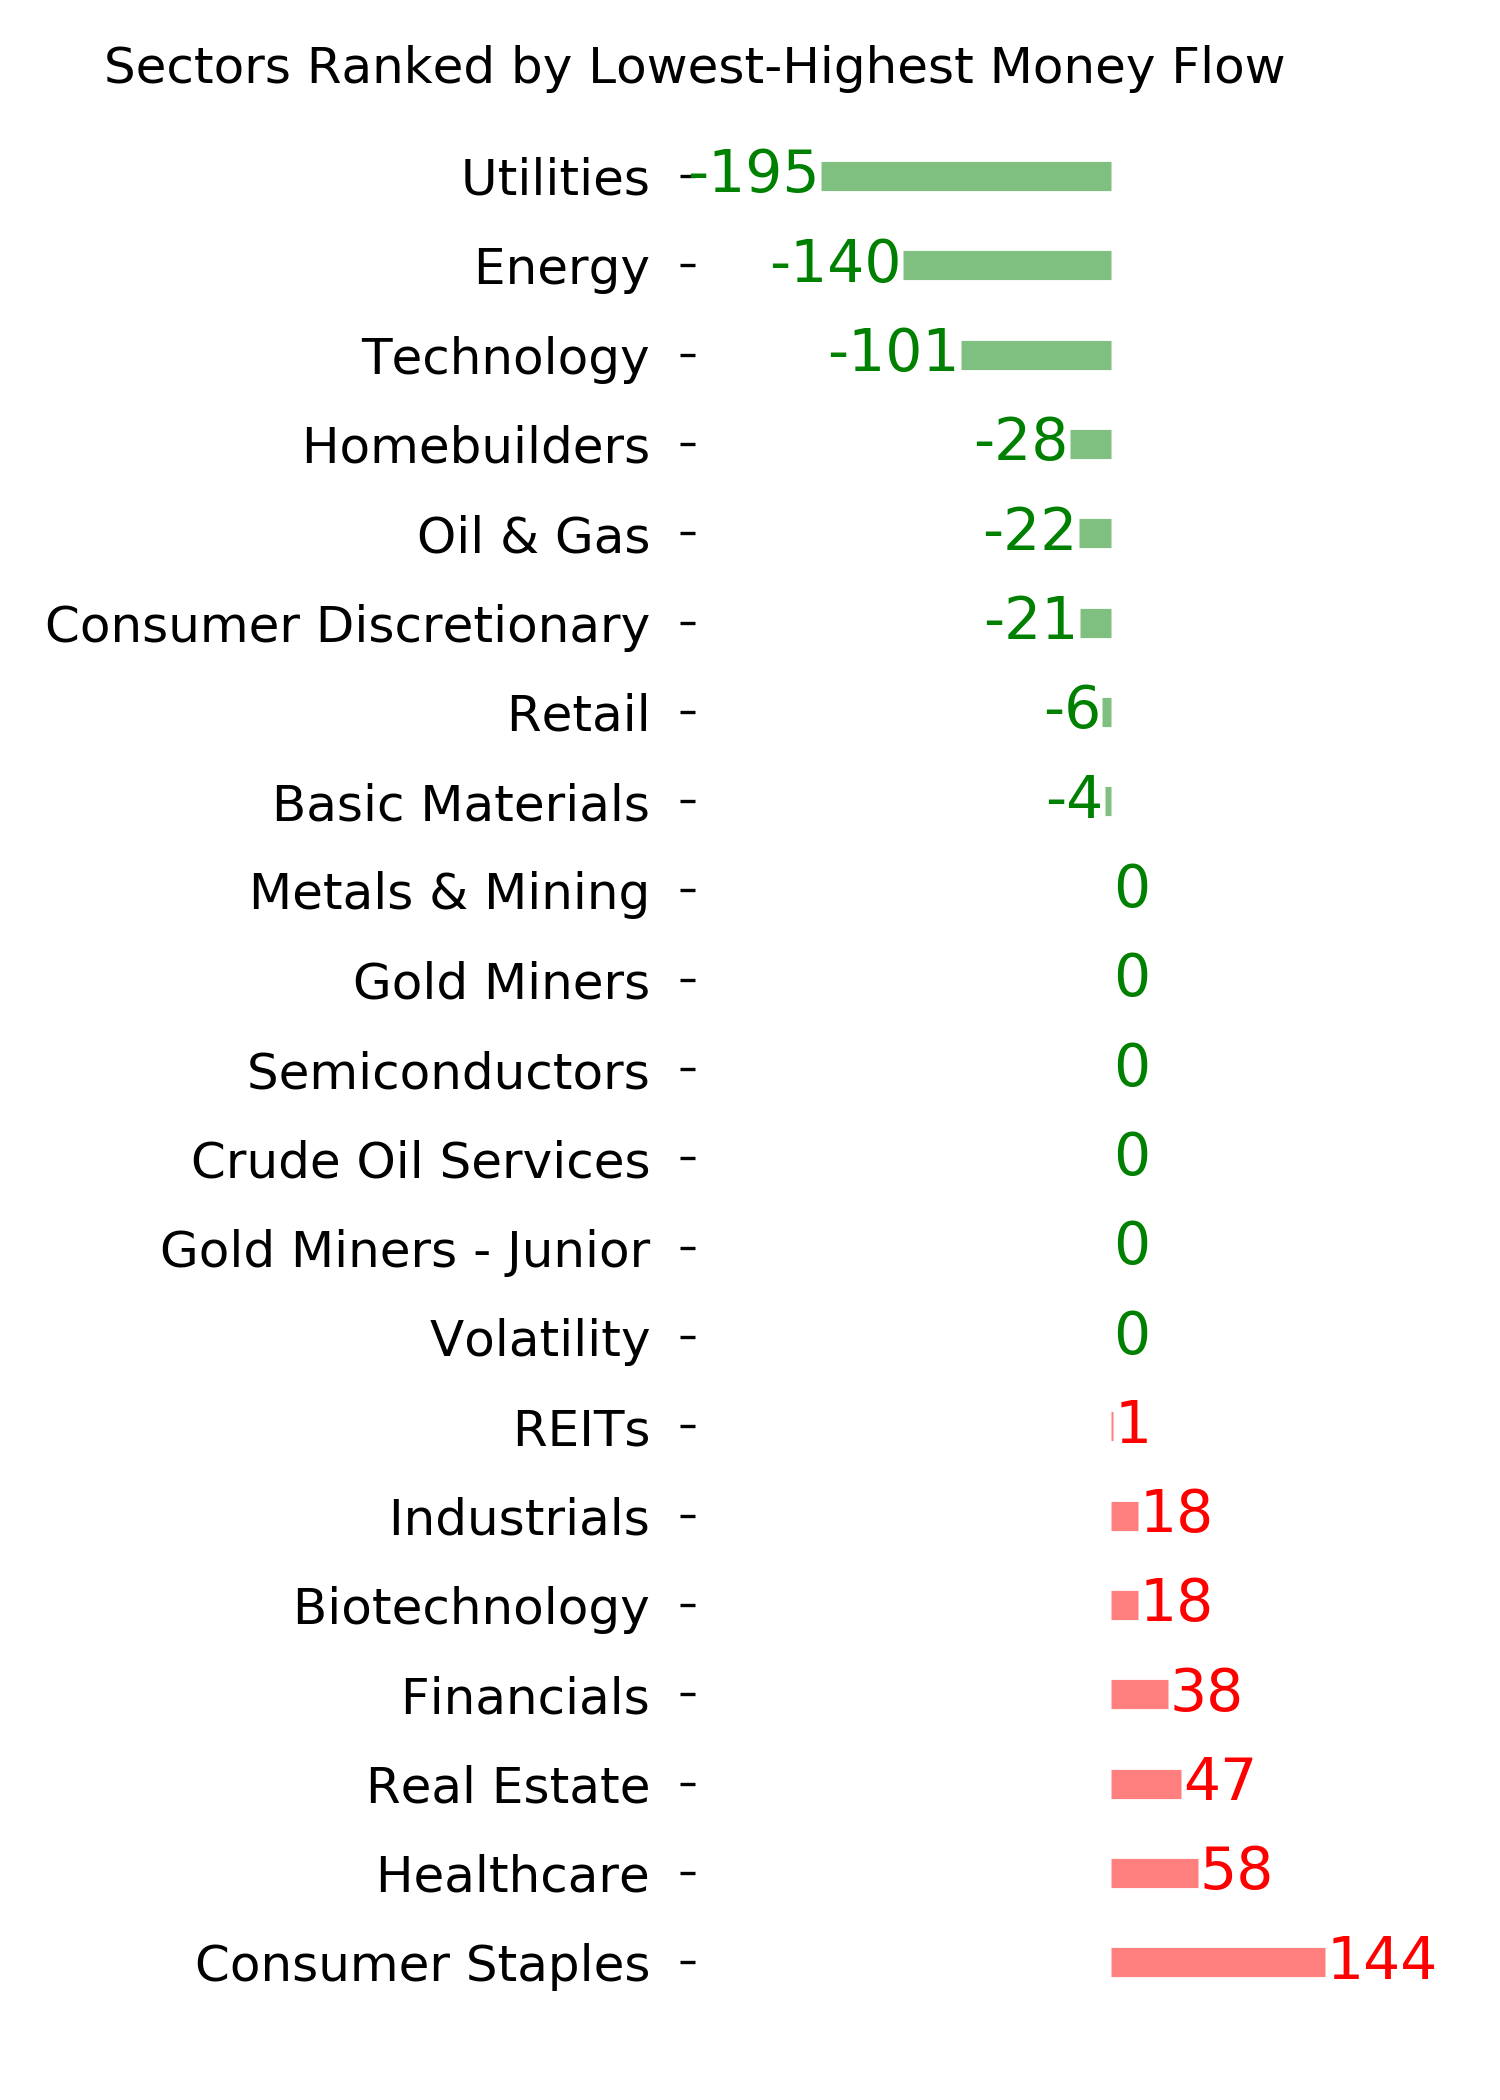
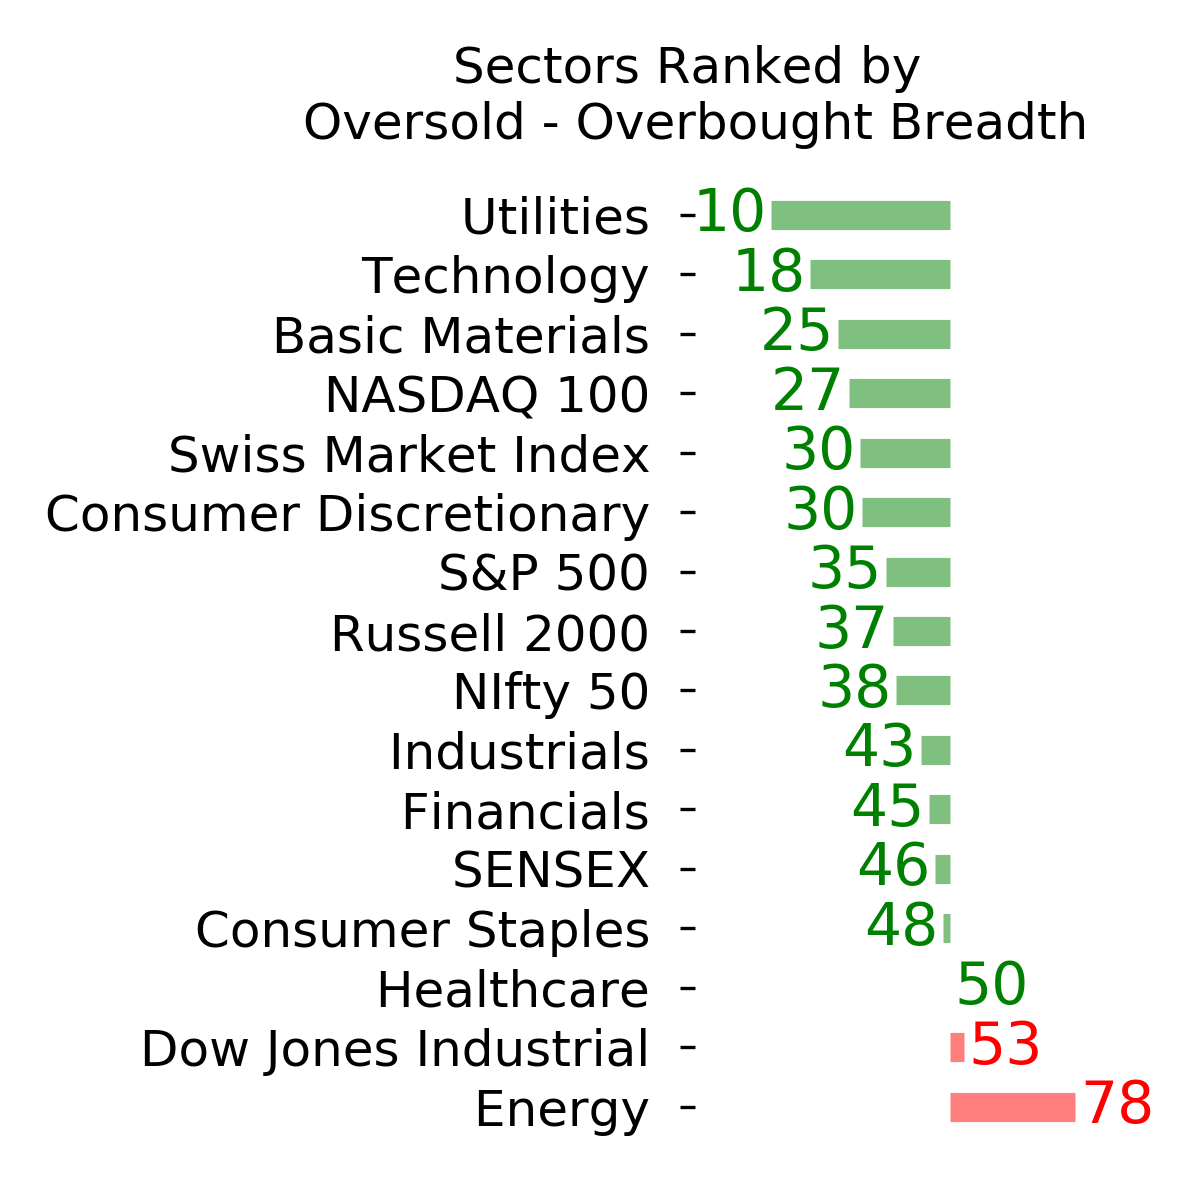
Ranks
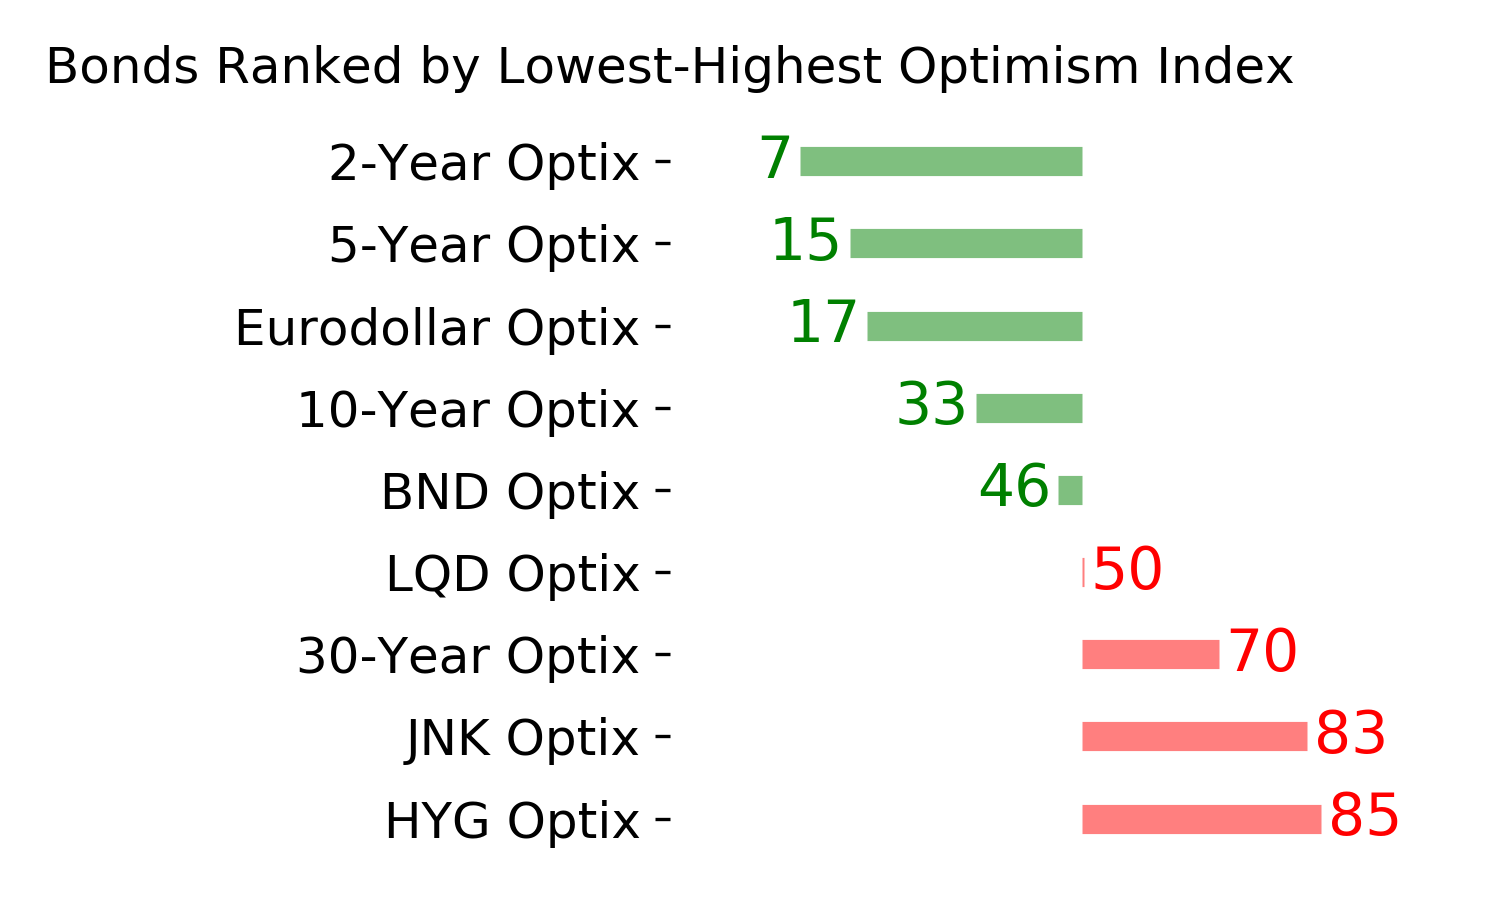
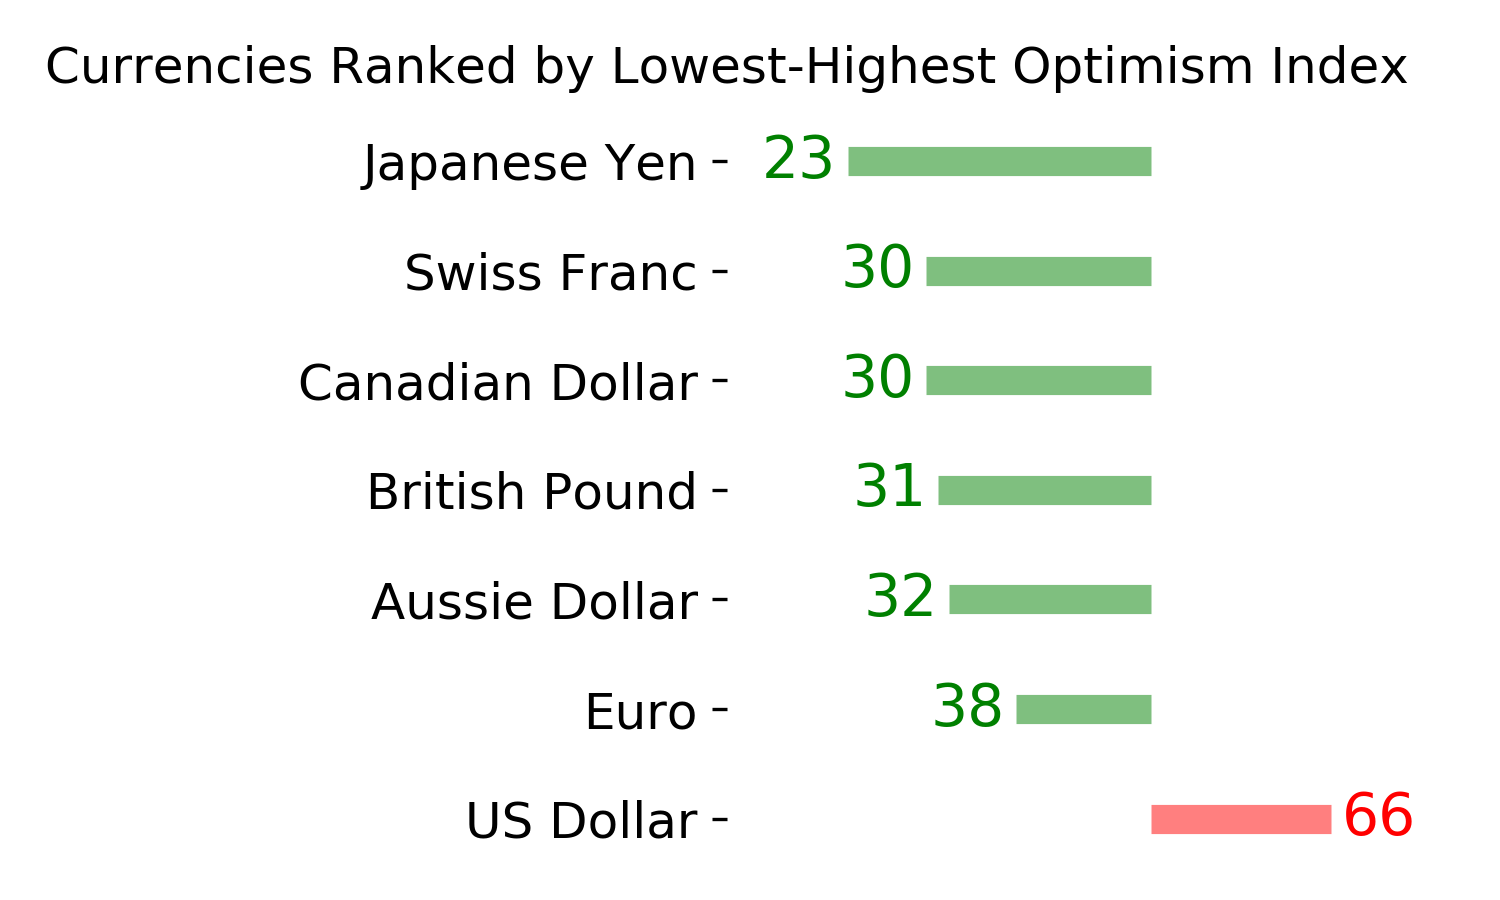
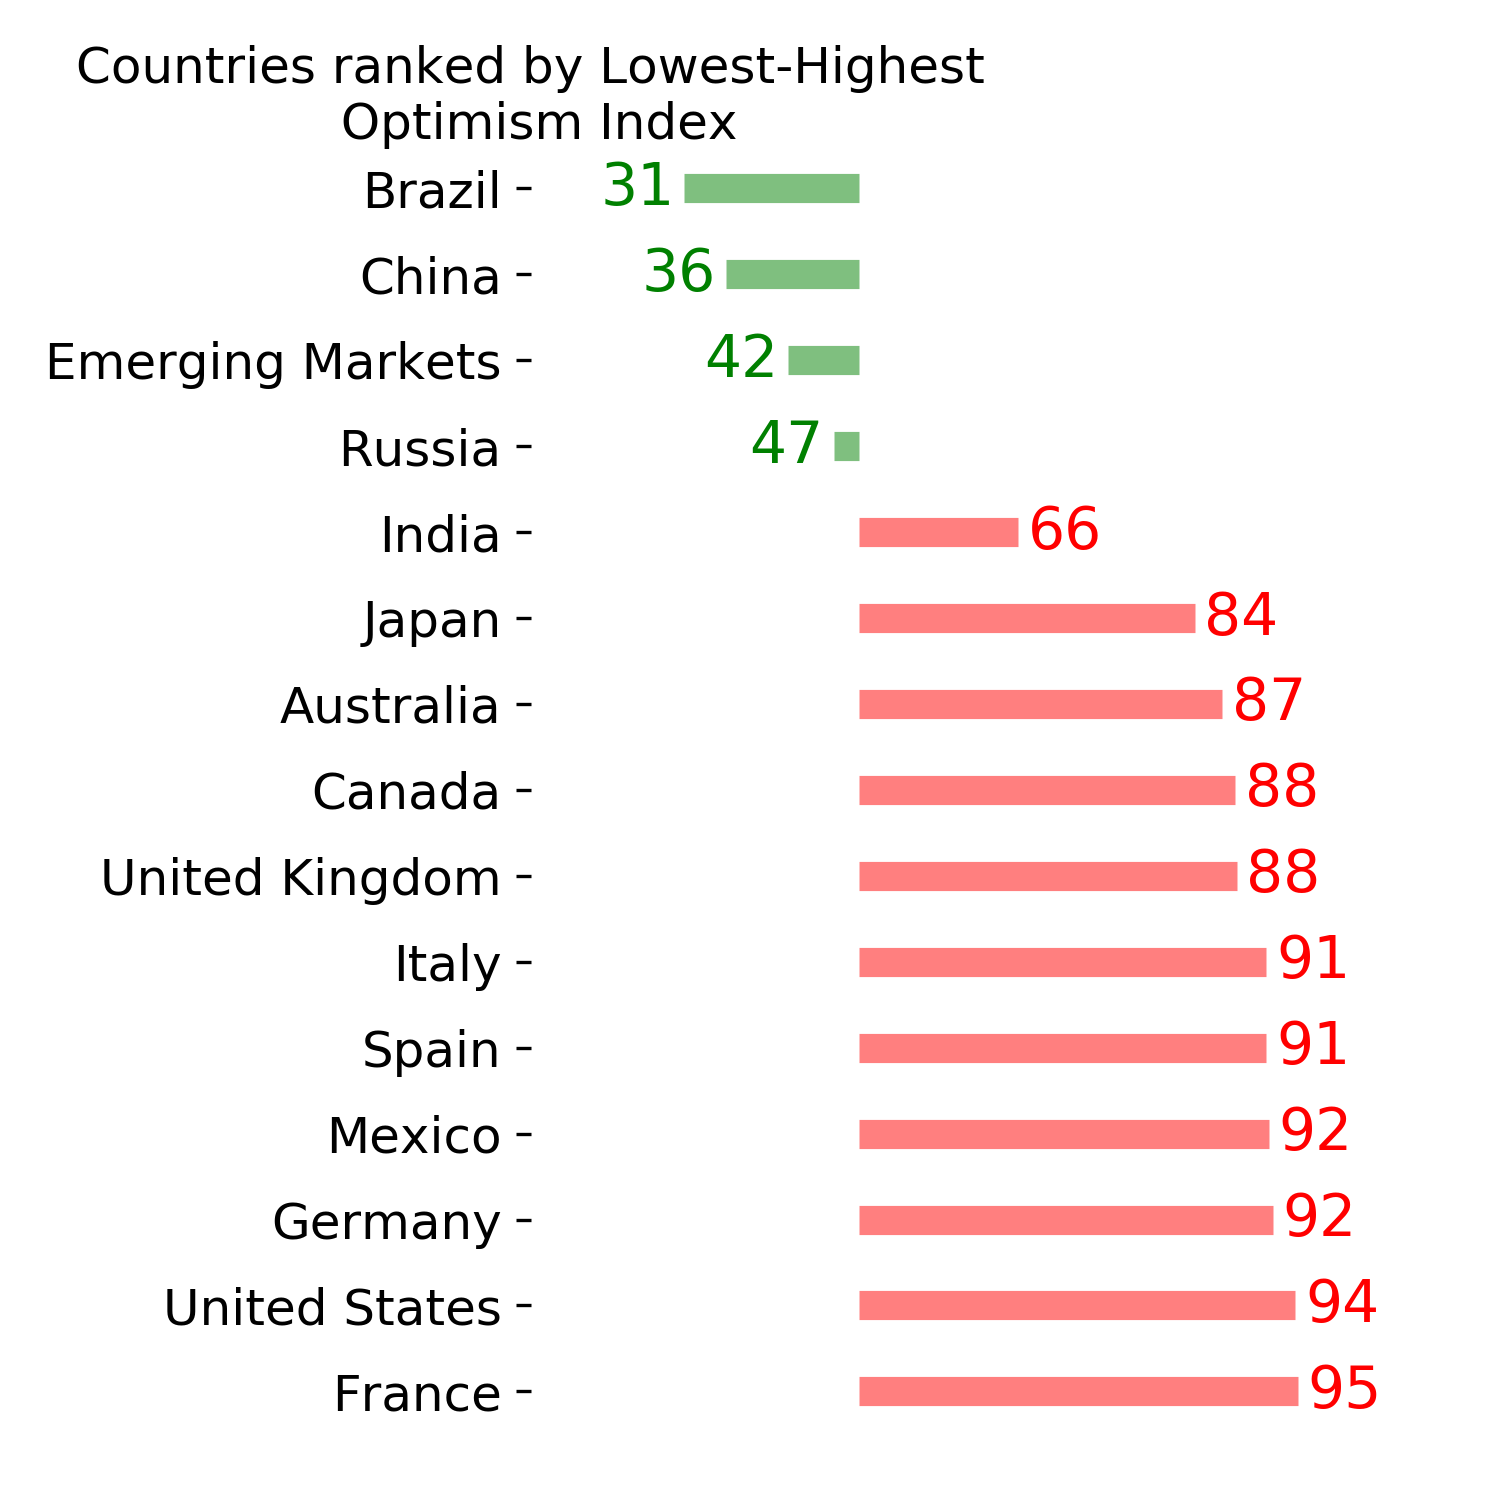
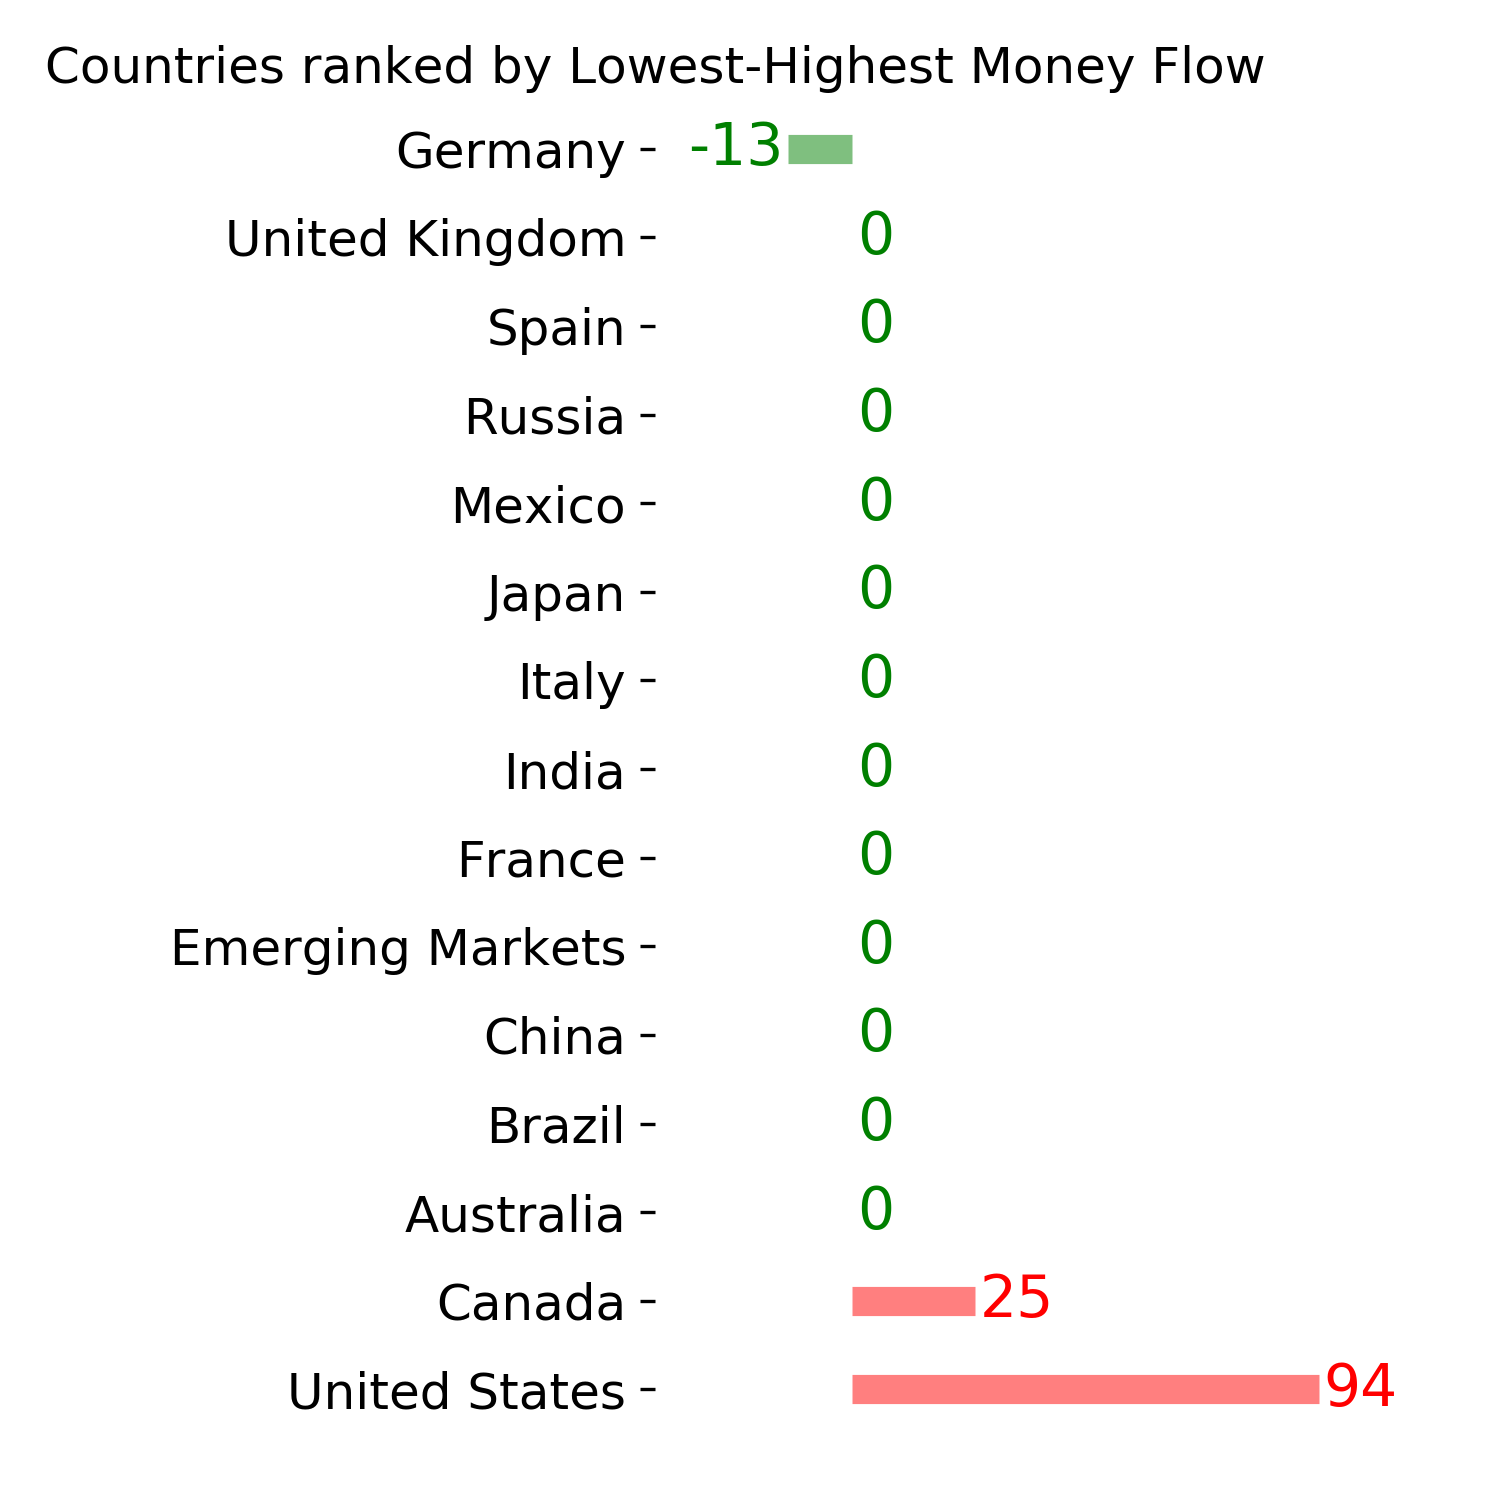
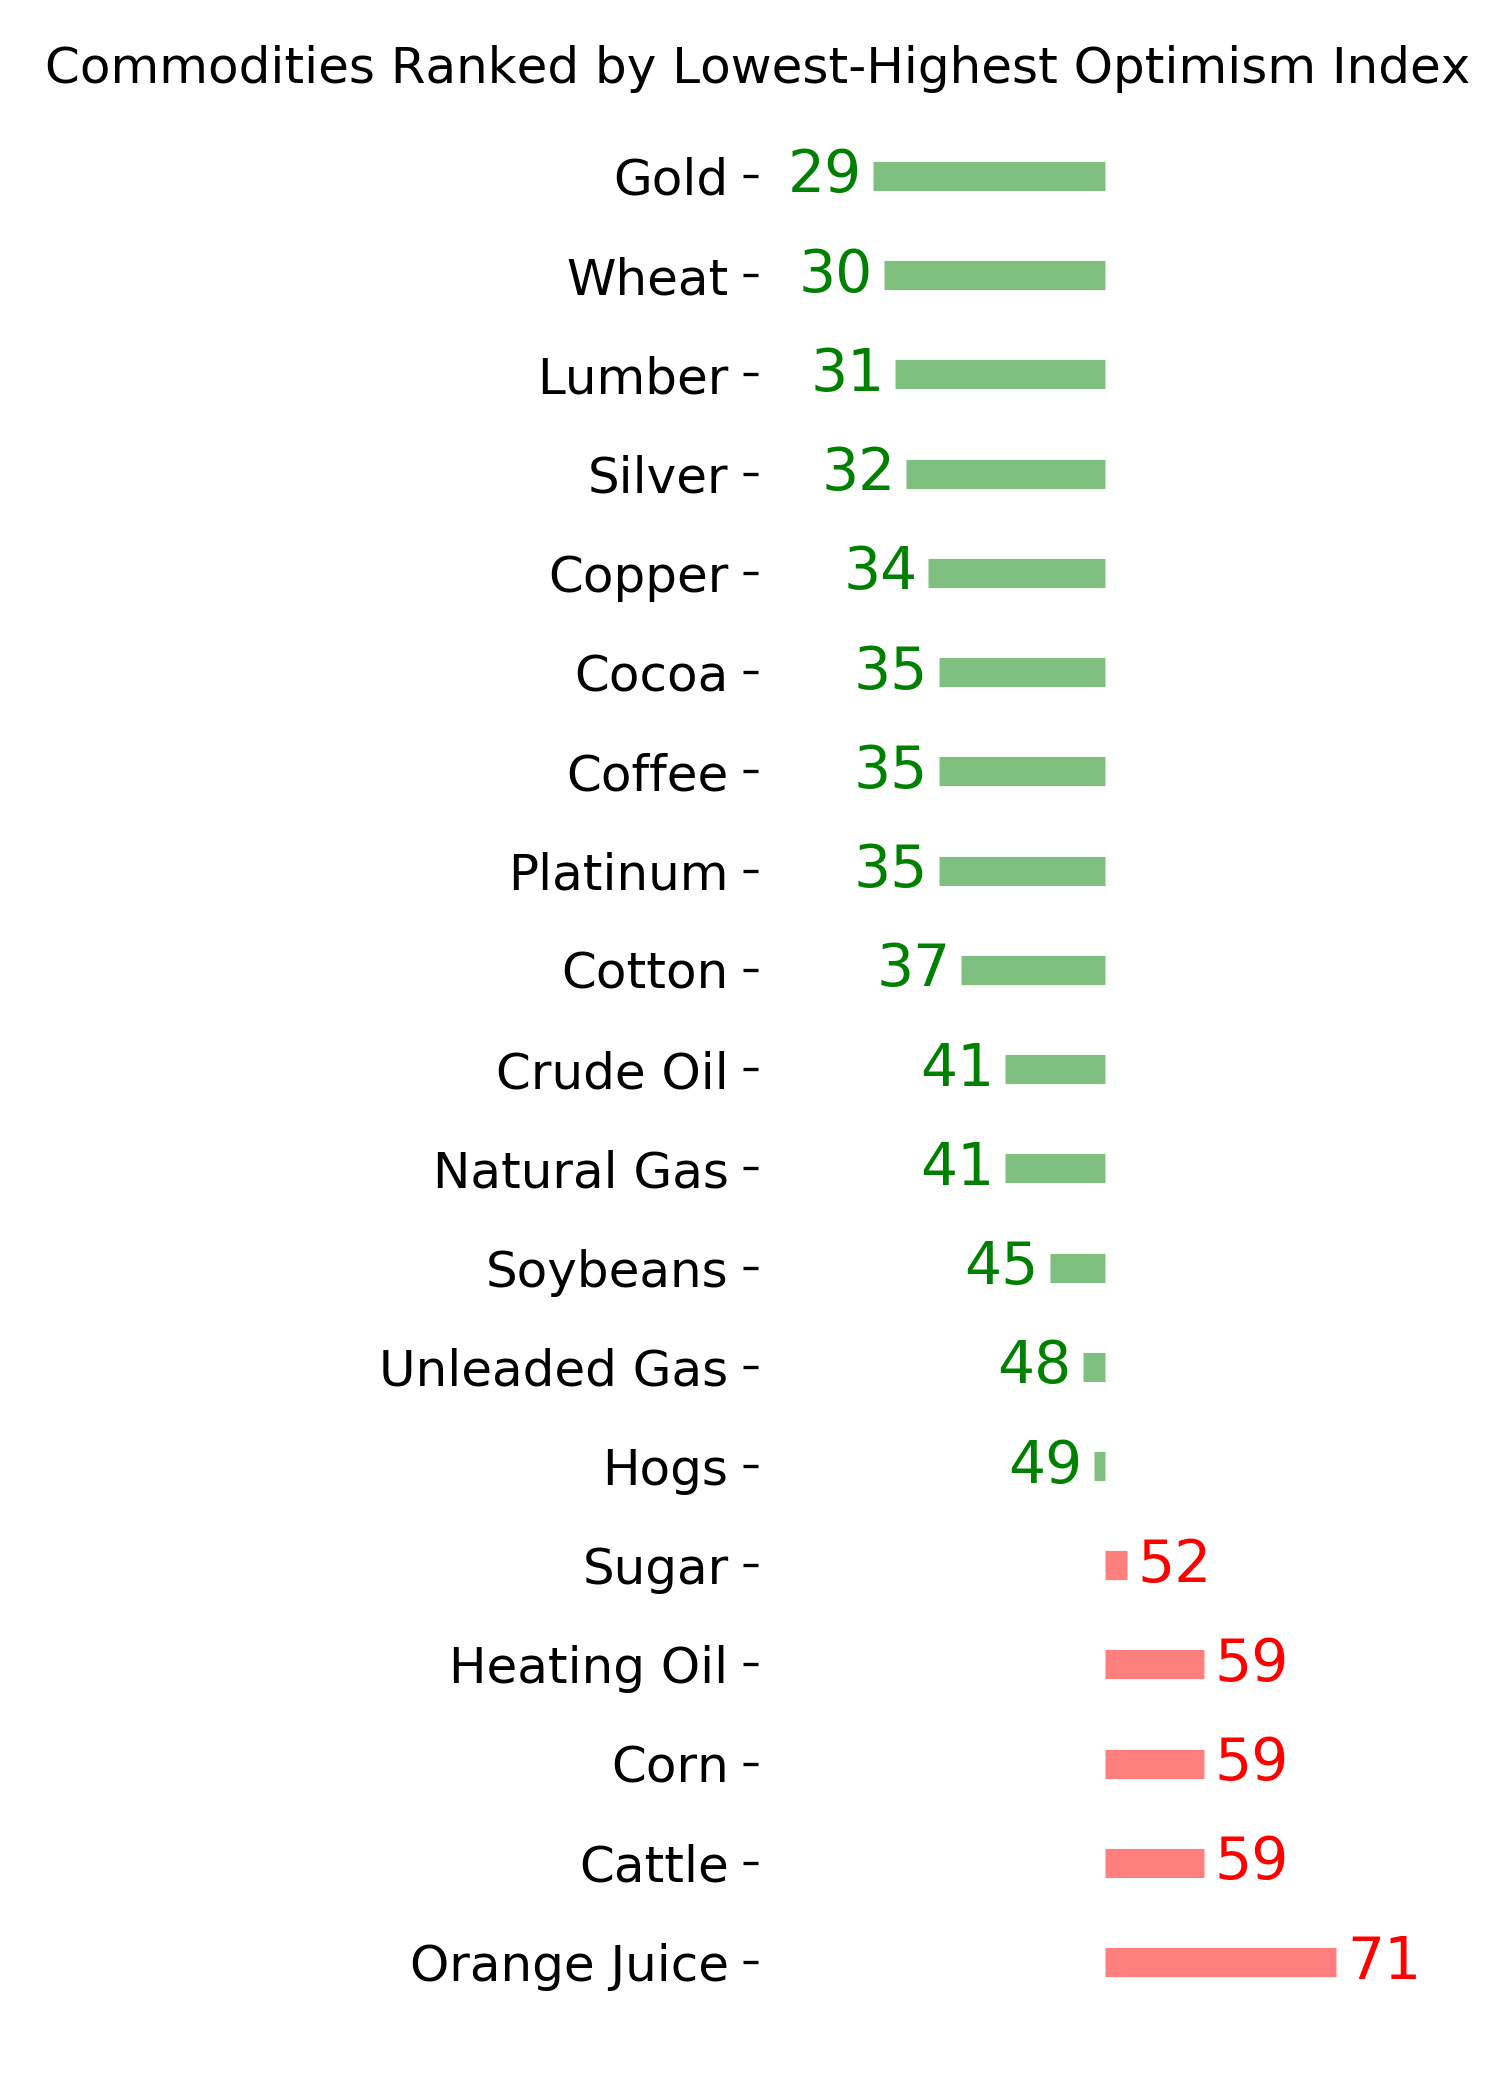
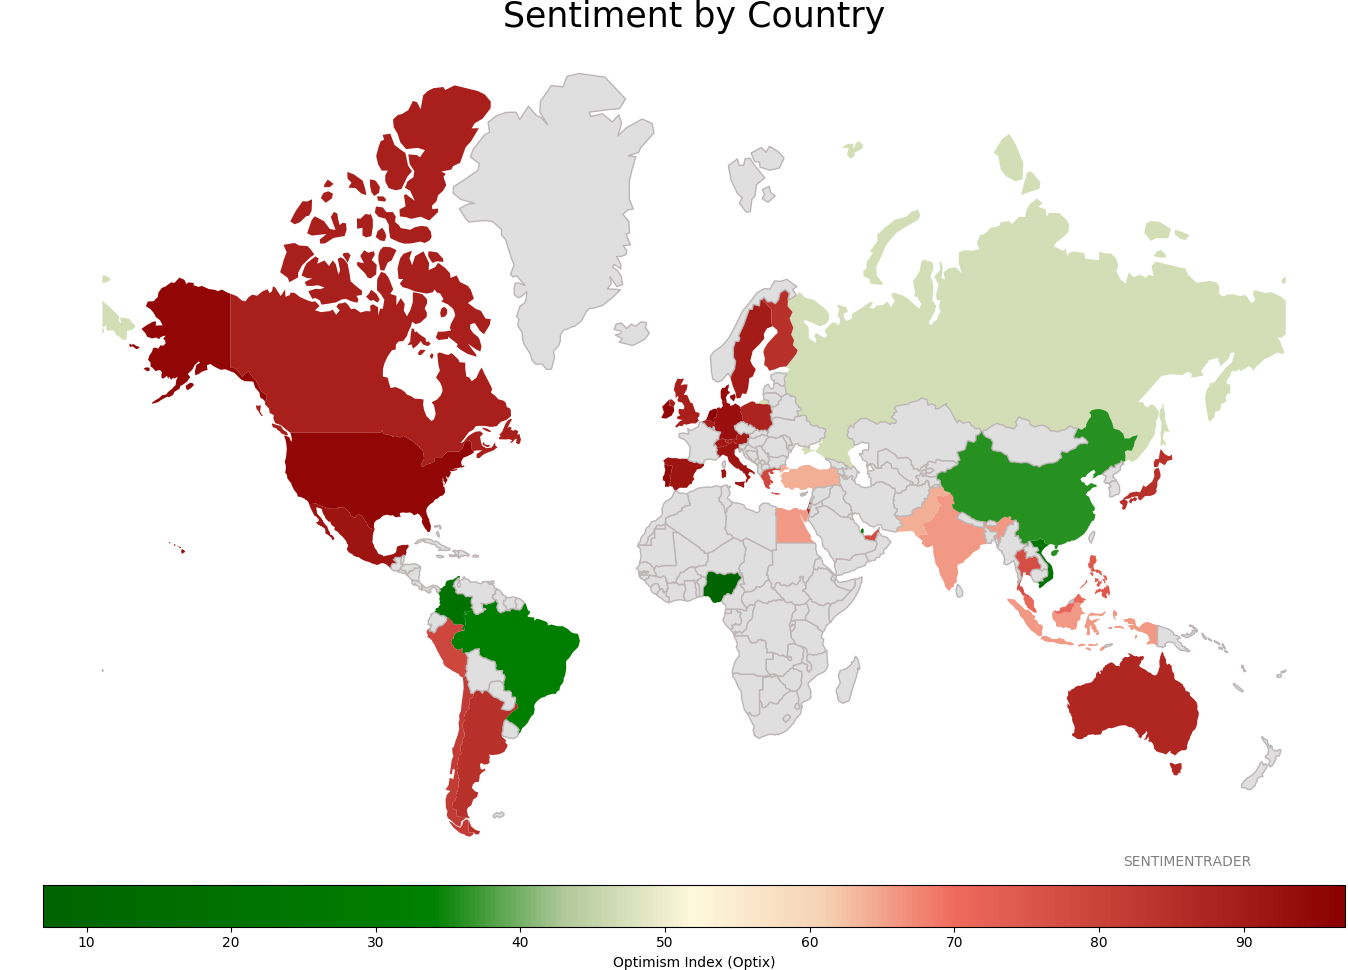
Sentiment Around The World
Optimism Index Thumbnails
|
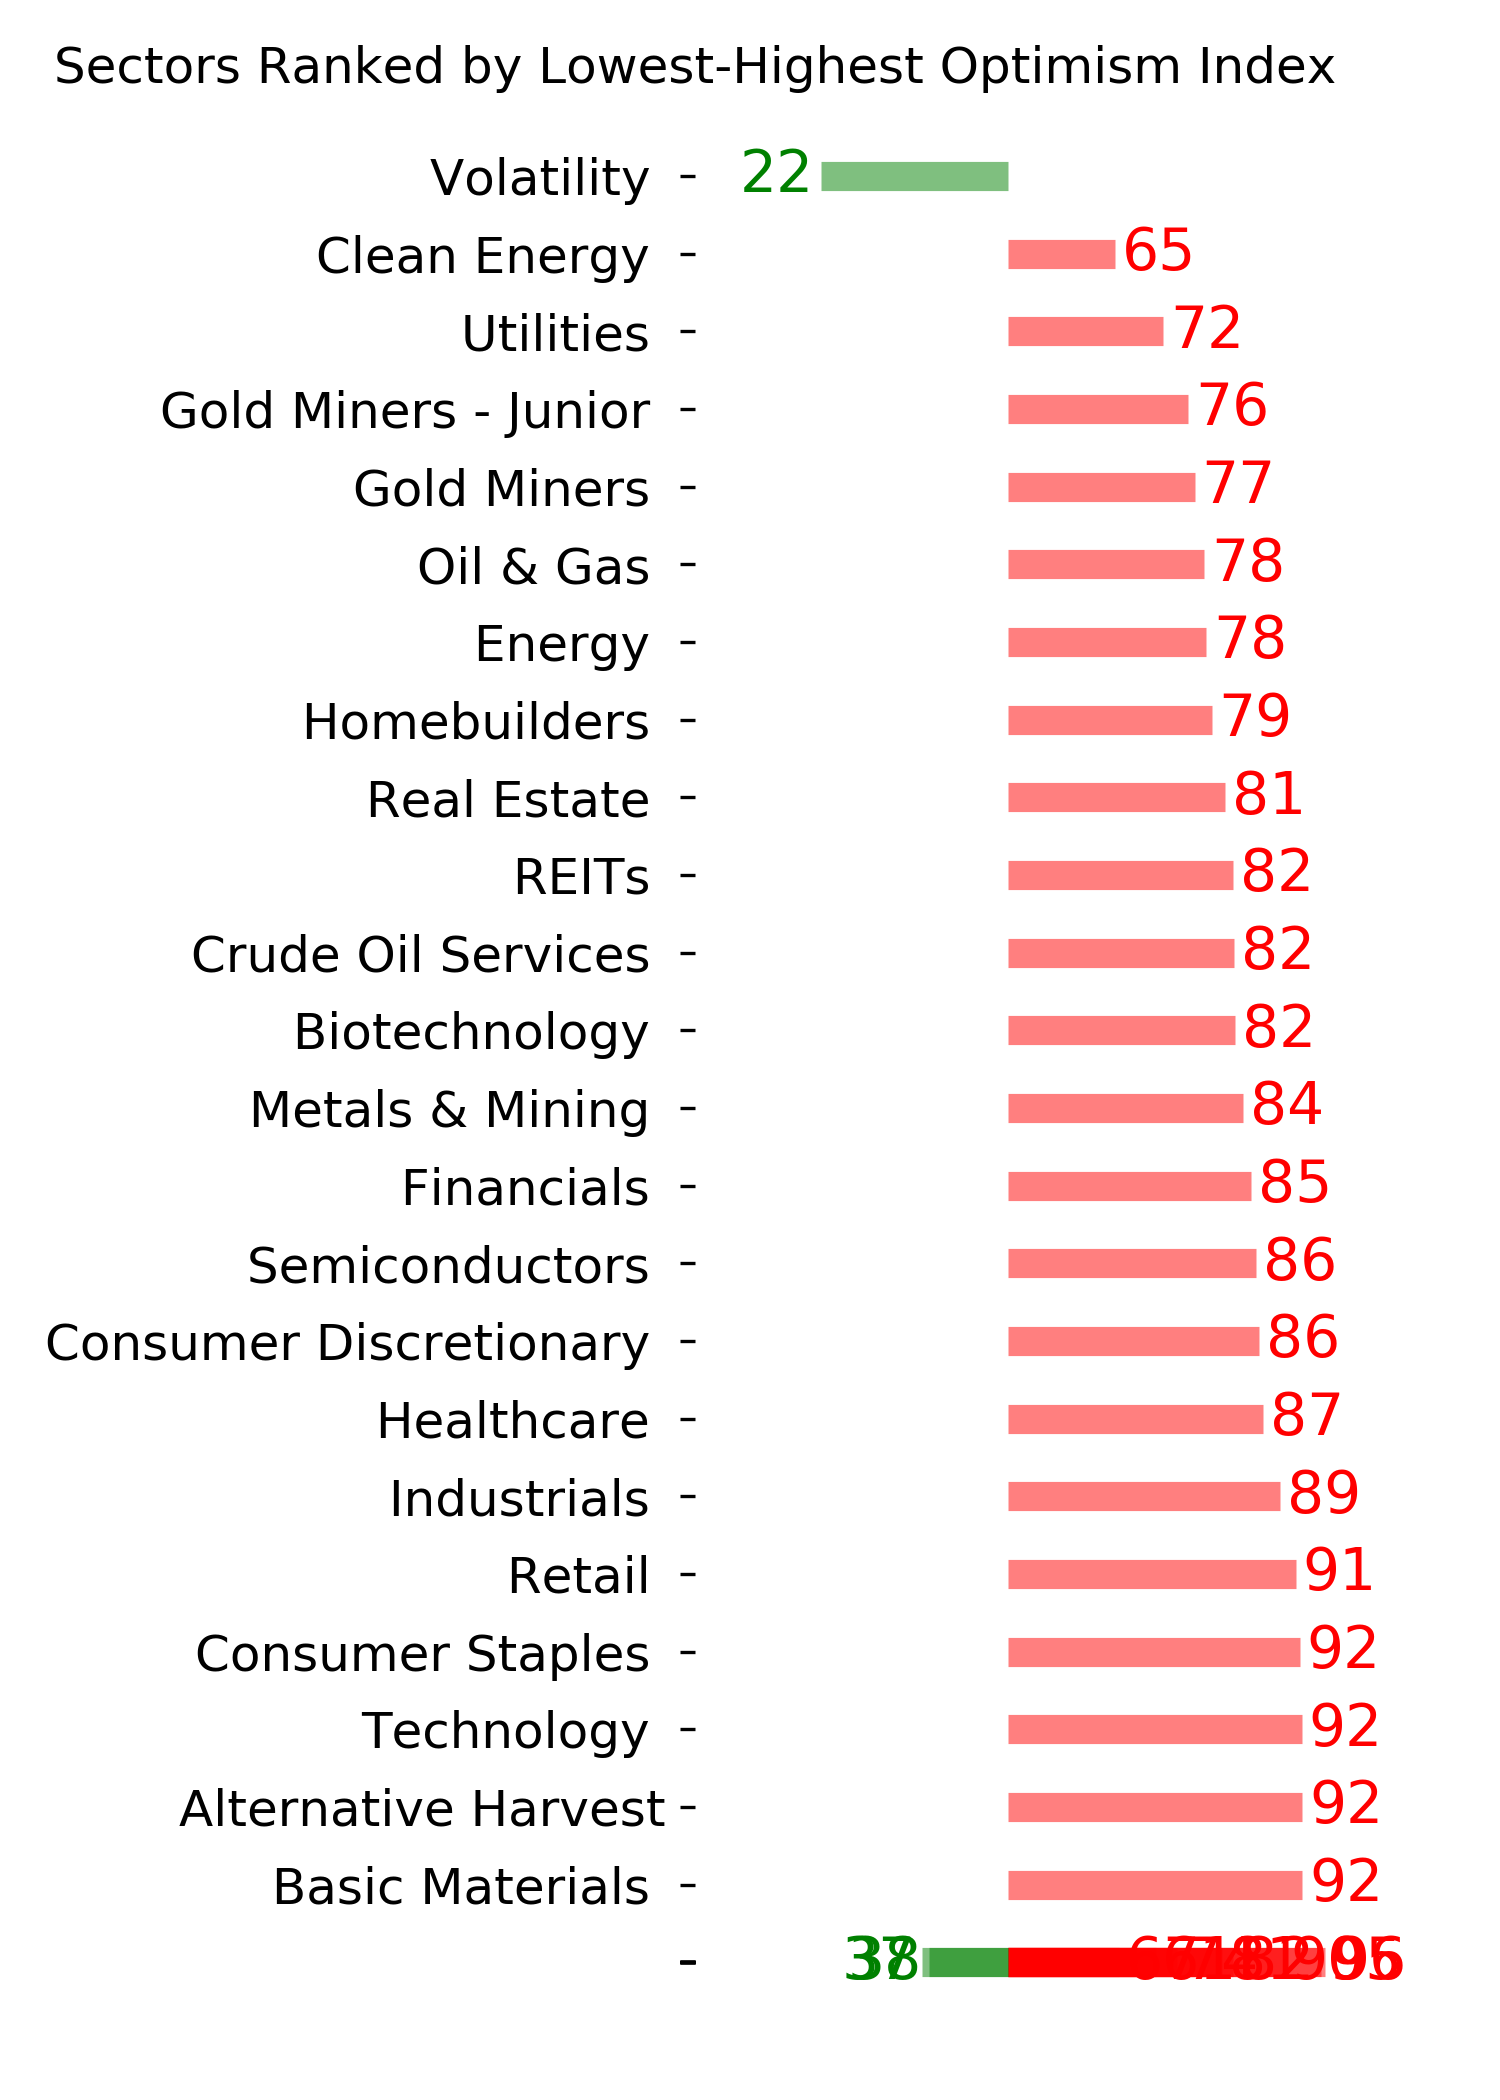
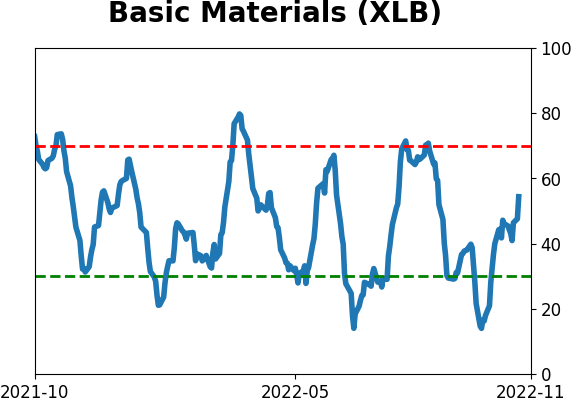
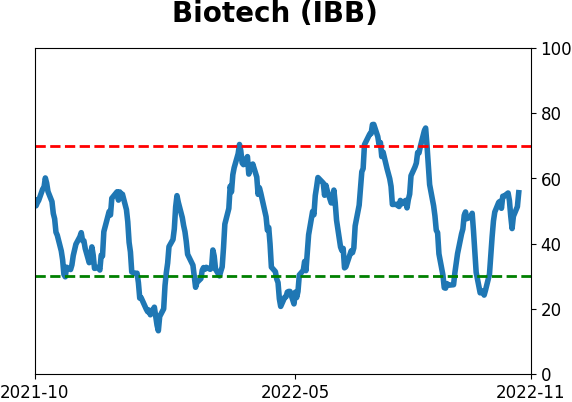
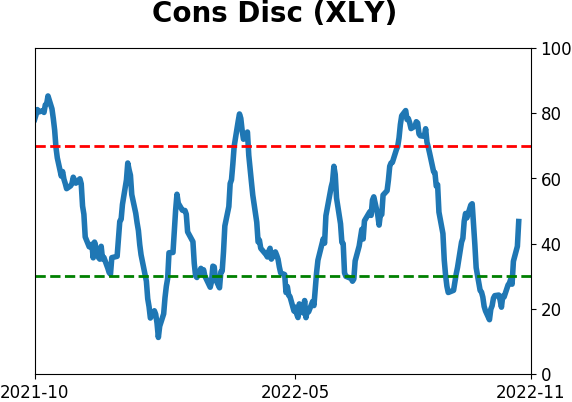
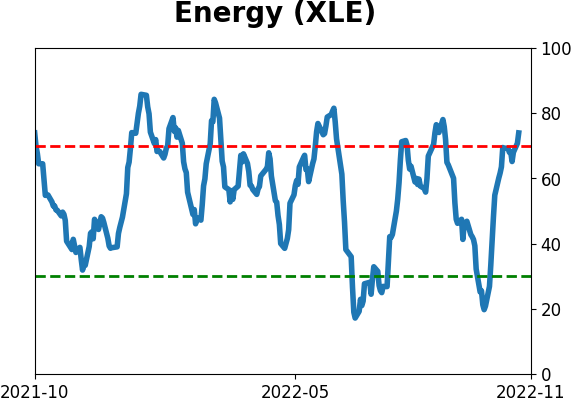
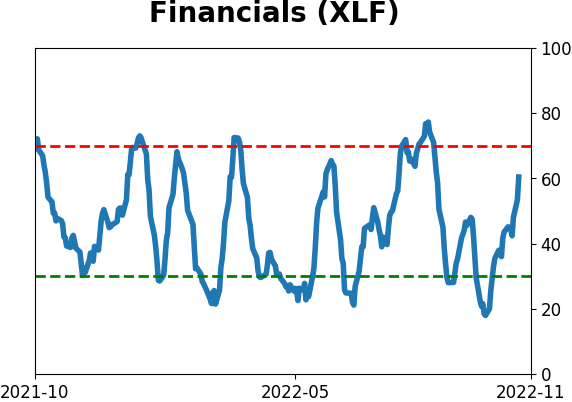
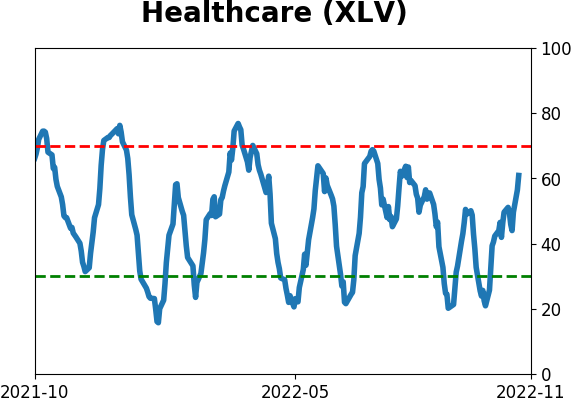
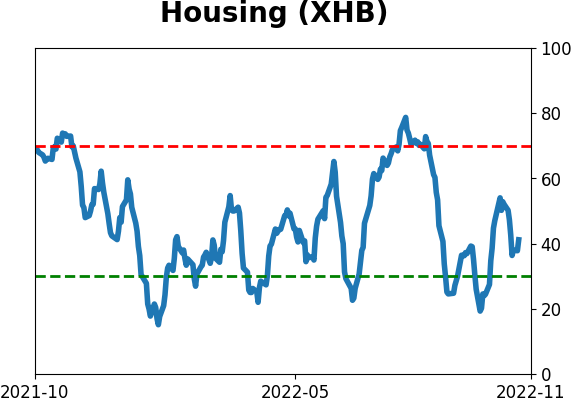
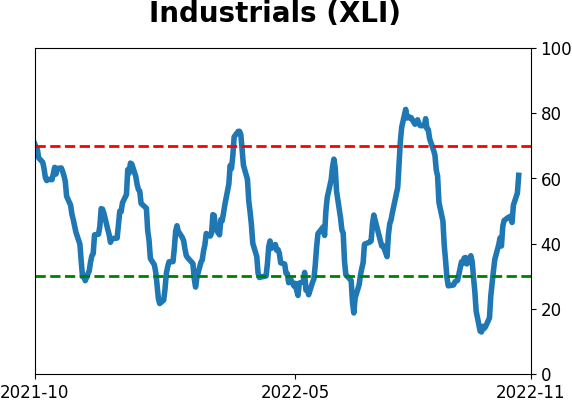
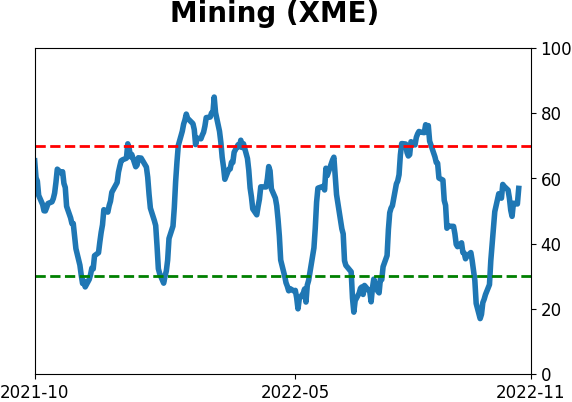
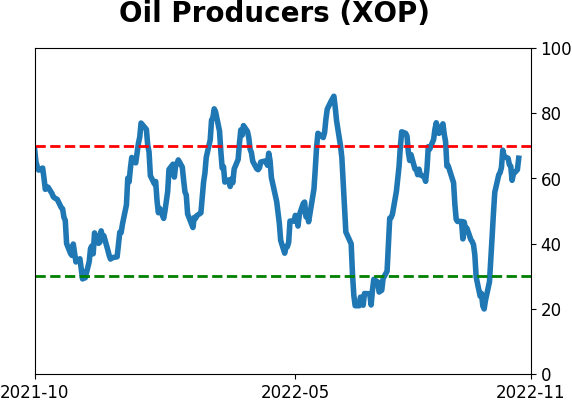
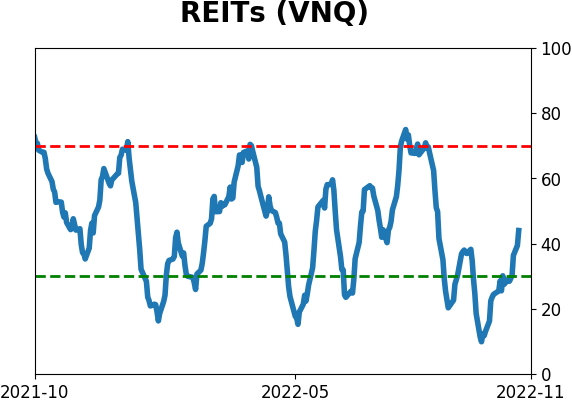
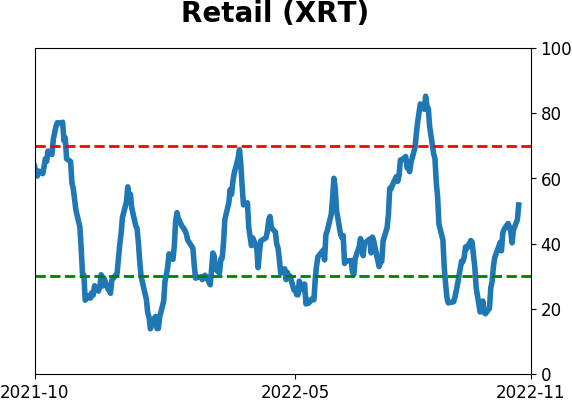
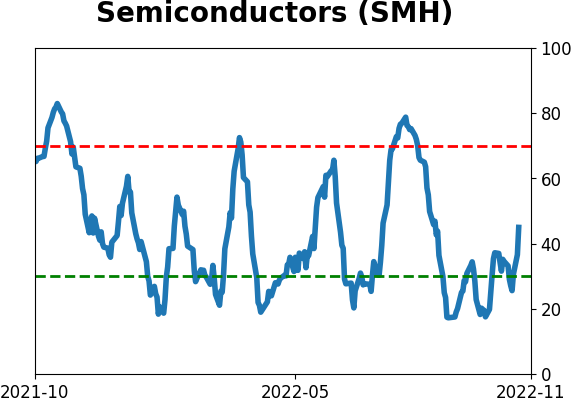
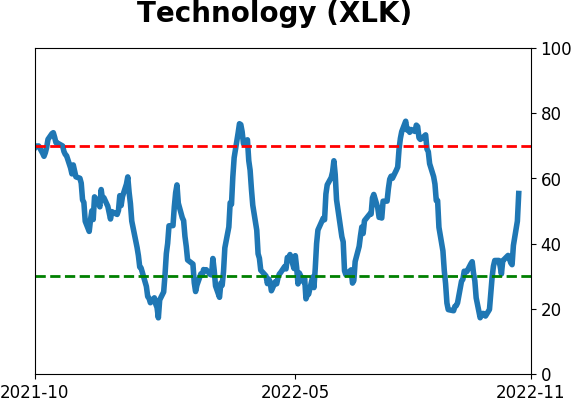
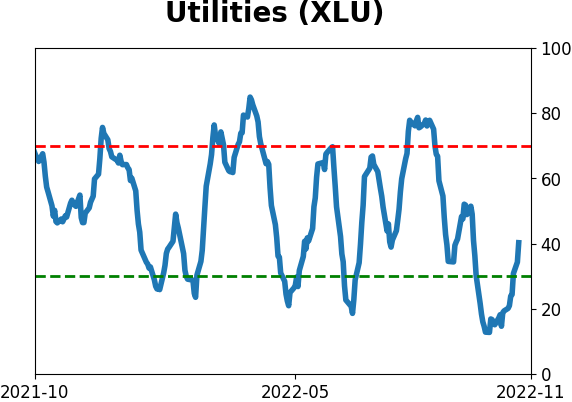
Sector ETF's - 10-Day Moving Average
|
|
|
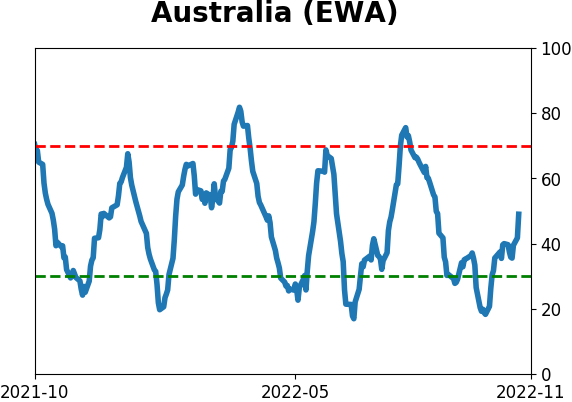
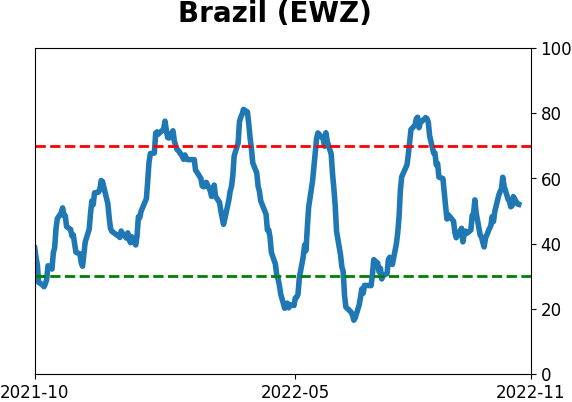
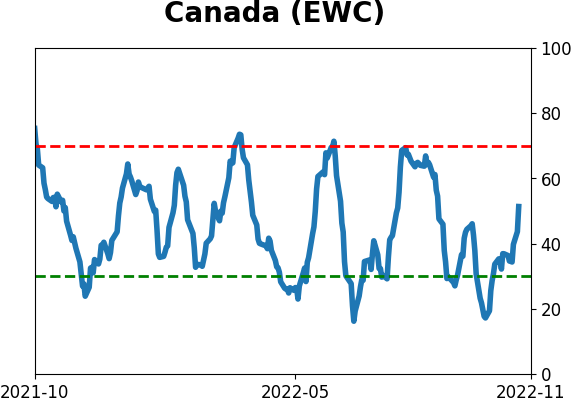
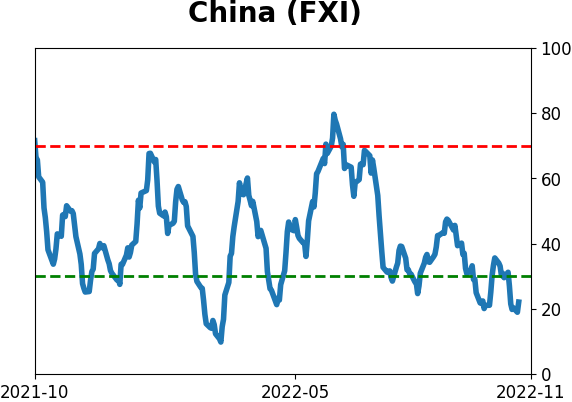
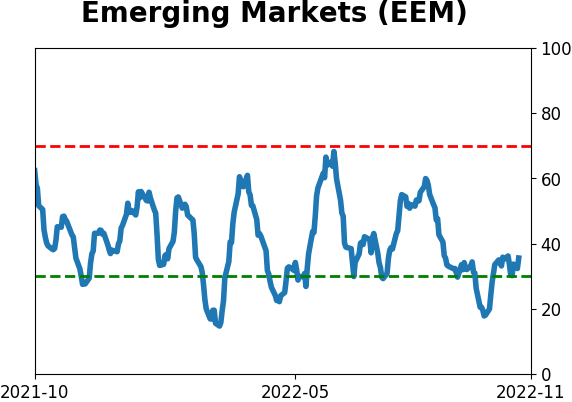
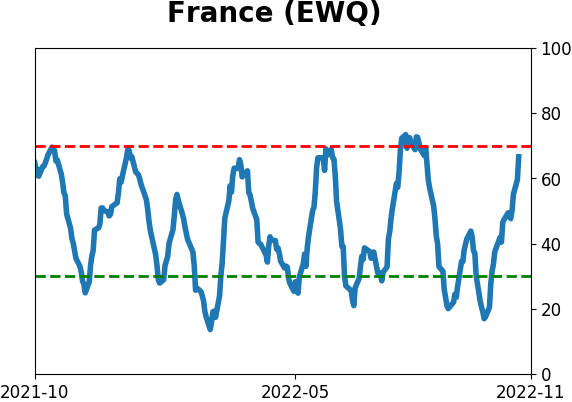
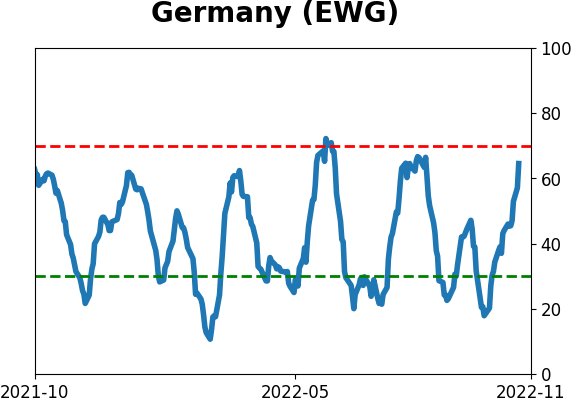
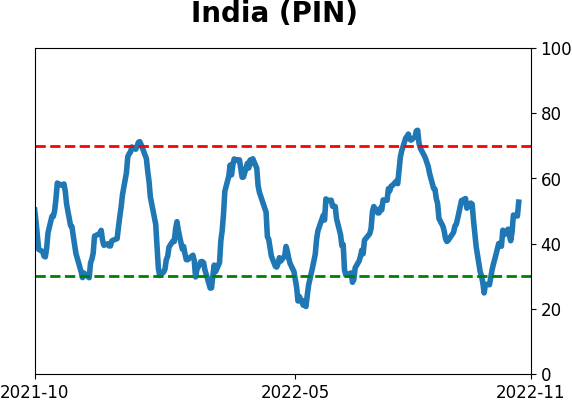
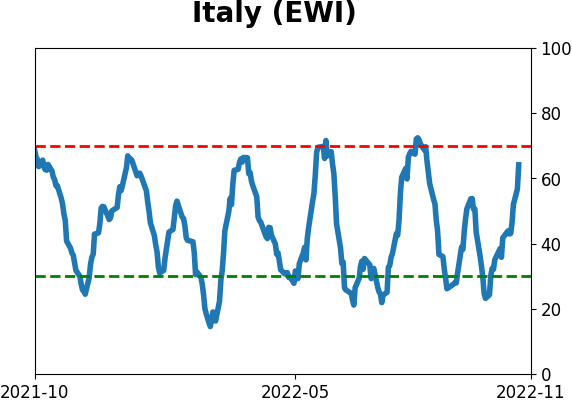
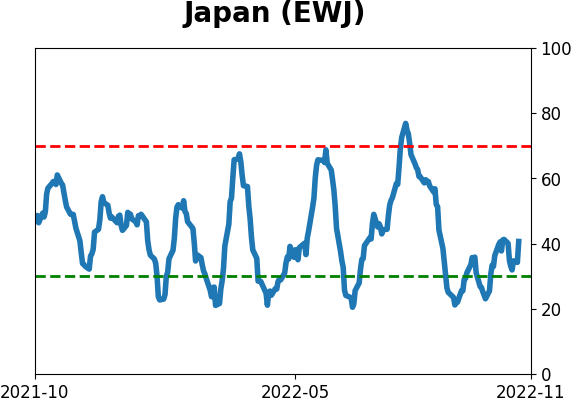
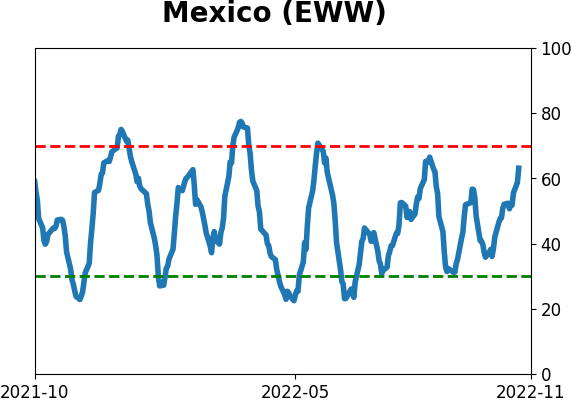
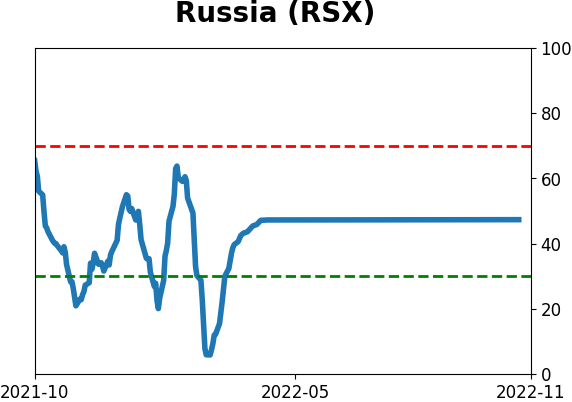
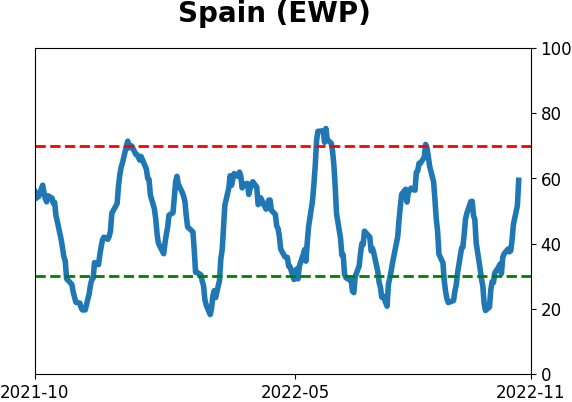
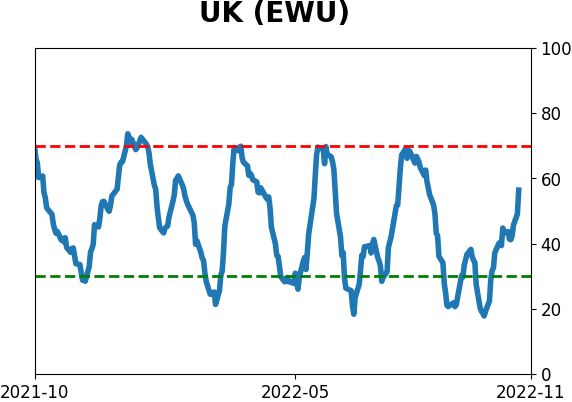
Country ETF's - 10-Day Moving Average
|
|
|
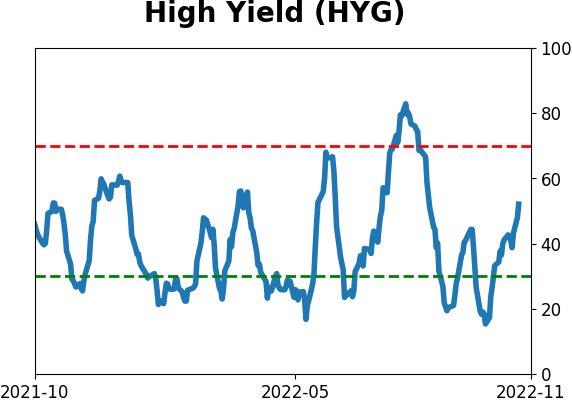
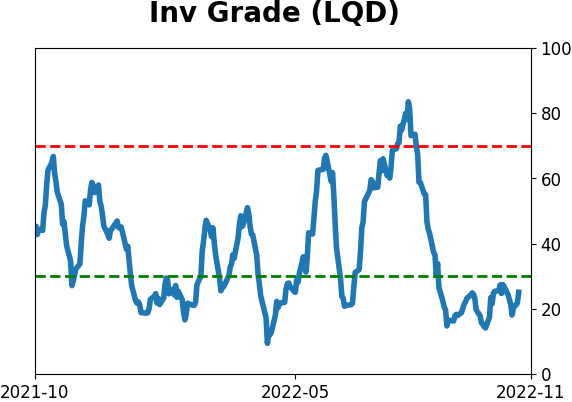
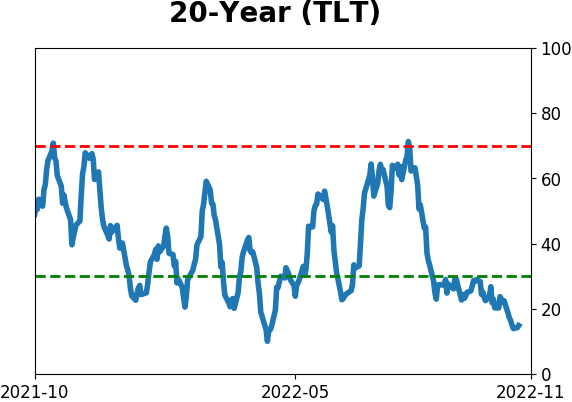
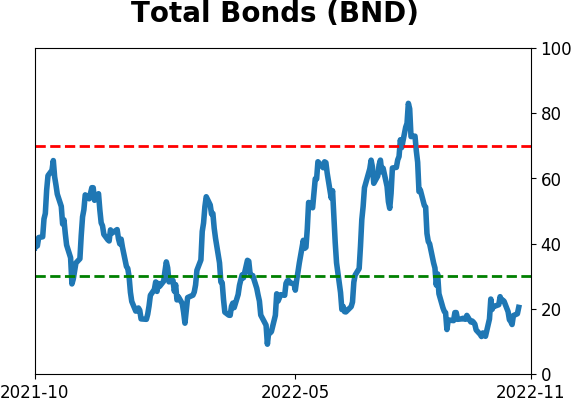
Bond ETF's - 10-Day Moving Average
|
|
|
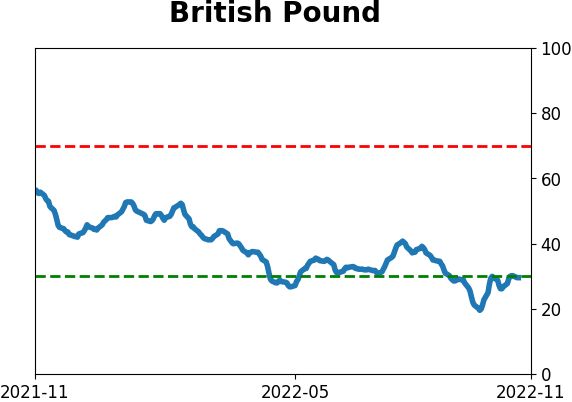
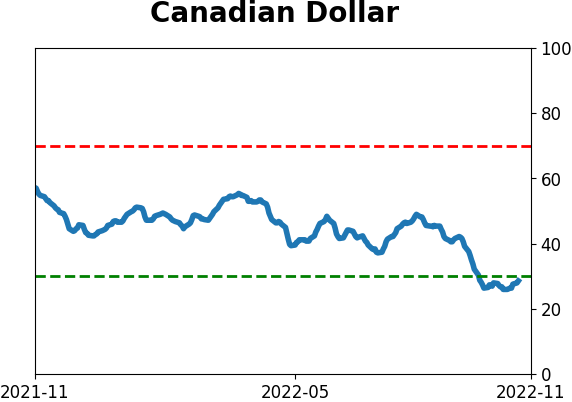
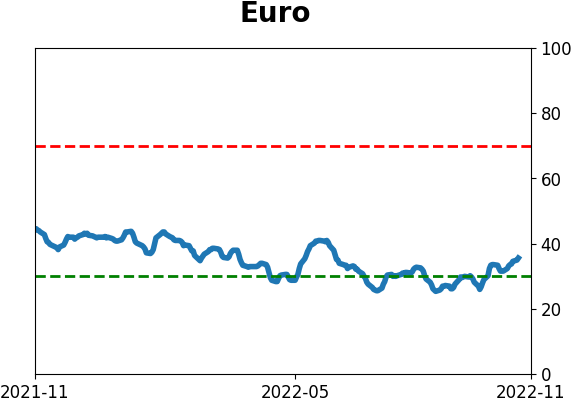
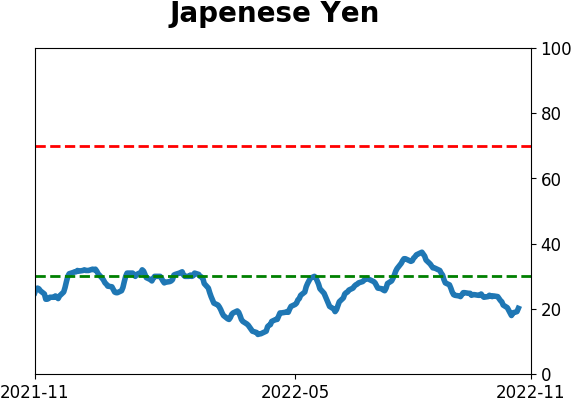
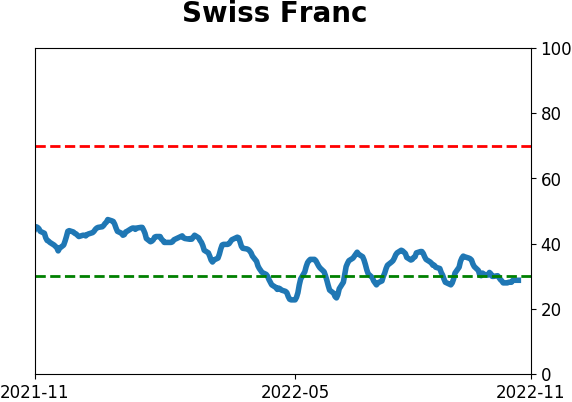
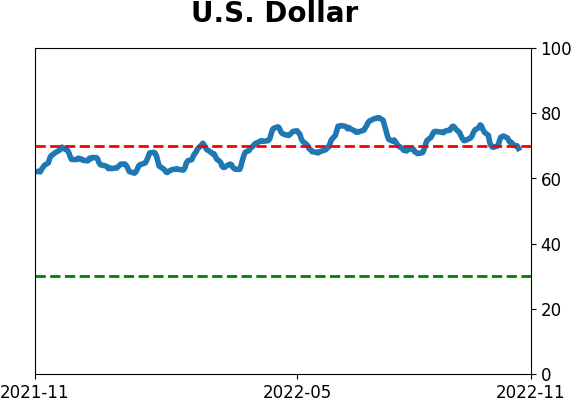
Currency ETF's - 5-Day Moving Average
|
|
|
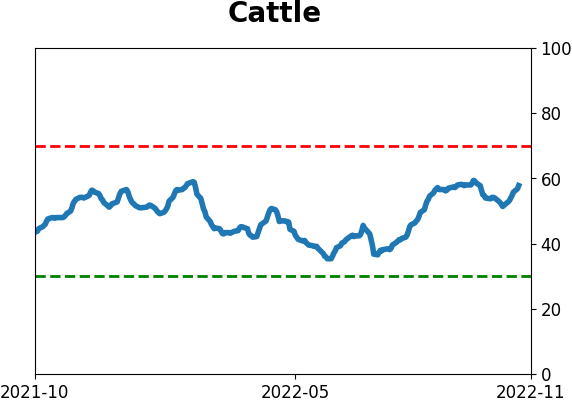
Commodity ETF's - 5-Day Moving Average
|
|