Headlines
|
|
Utility stocks see surge in new uptrends:
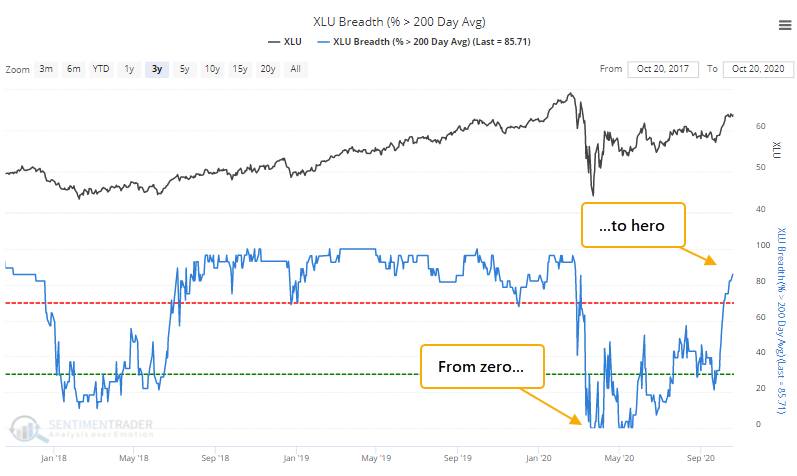
Corporate insiders at utility companies have backed off any major selling pressure, a good thing since the prices of many of these stocks continue to recover. After a complete washout as recently as mid-May, now more than 80% of these stocks are above their 200-day moving averages.
For the 1st time in months, yields near their long-term average:
The yield on 10-year Treasury notes is nearing its 200-day average for the 1st time in more than 200 days. This has typically not indicated a long-term change in trend, as the relentless bias toward lower rates knee-capped any potential rallies.
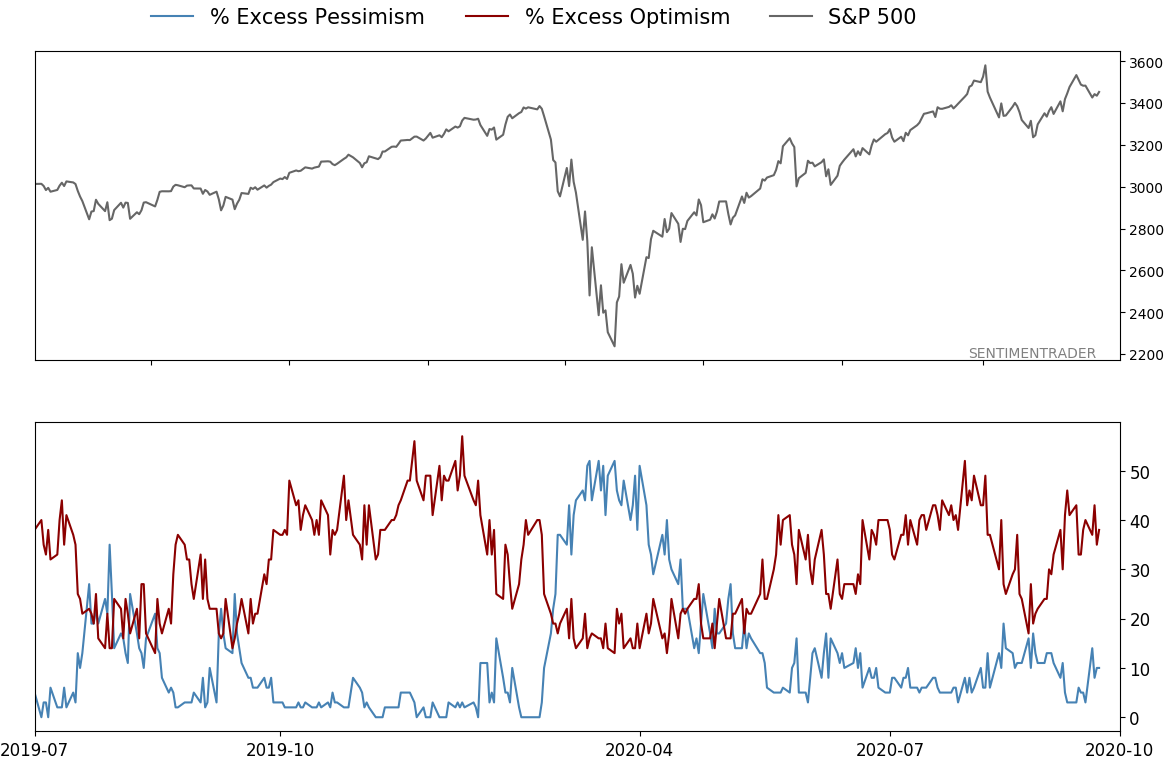
Mom and pop end record bout of pessimism: We've looked at the deep and entrenched pessimism in the AAII sentiment survey multiple times this year. It's finally time to put that to bed, as the latest survey showed more bulls than bears. This is the first week with a Bull Ratio above 50% in a whopping 34 weeks, exceeding the prior record of 22 weeks from 1991. Below, we can see that after other streaks of 12+ weeks ended, the S&P 500 did well in the months ahead, with no losses 2 months later.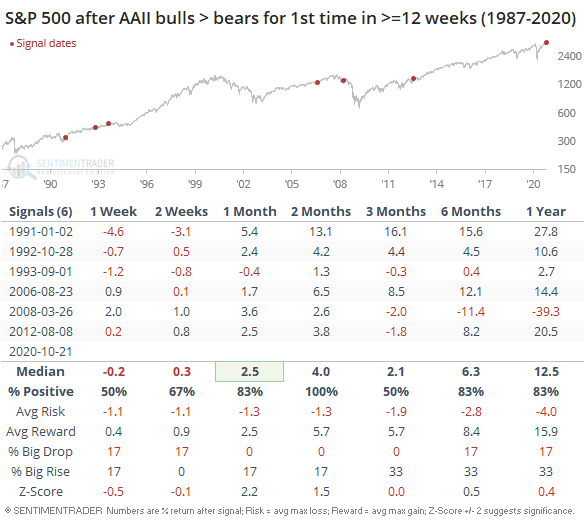
Bottom Line:
- A positive environment favors becoming aggressive on signs of excessive pessimism.
|
Smart / Dumb Money Confidence
|
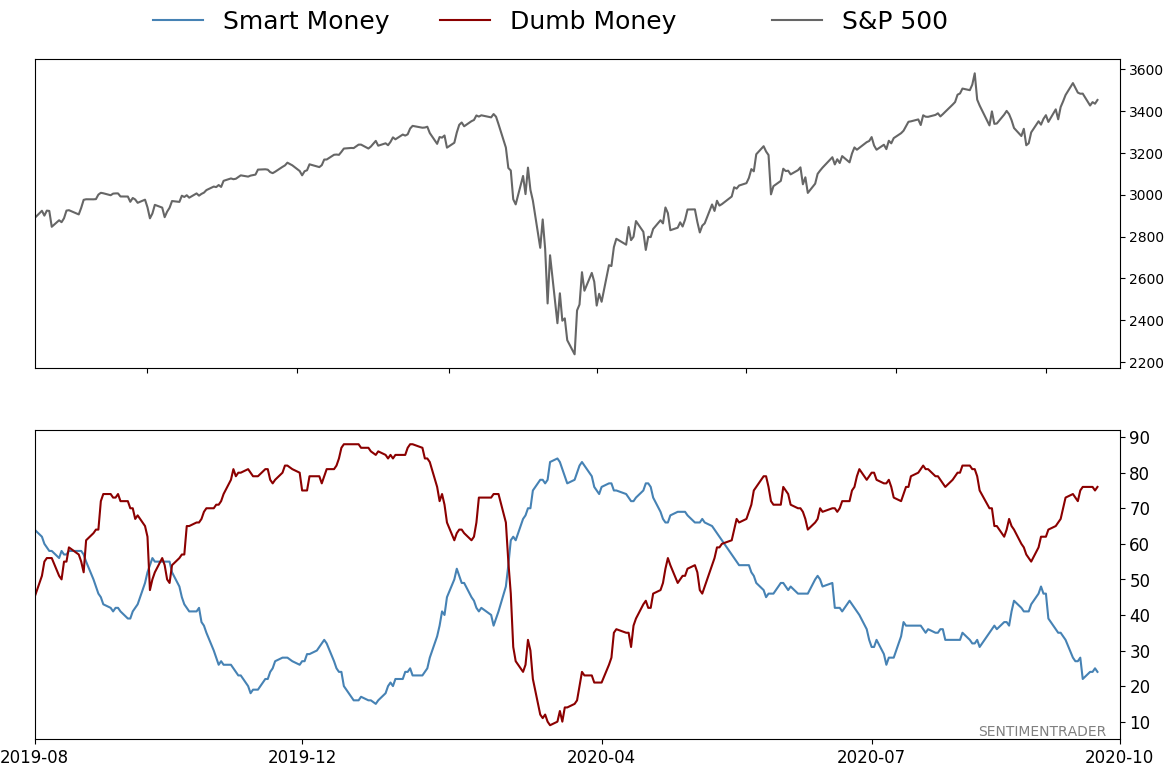
Smart Money Confidence: 24%
Dumb Money Confidence: 76%
|
|
Risk Levels
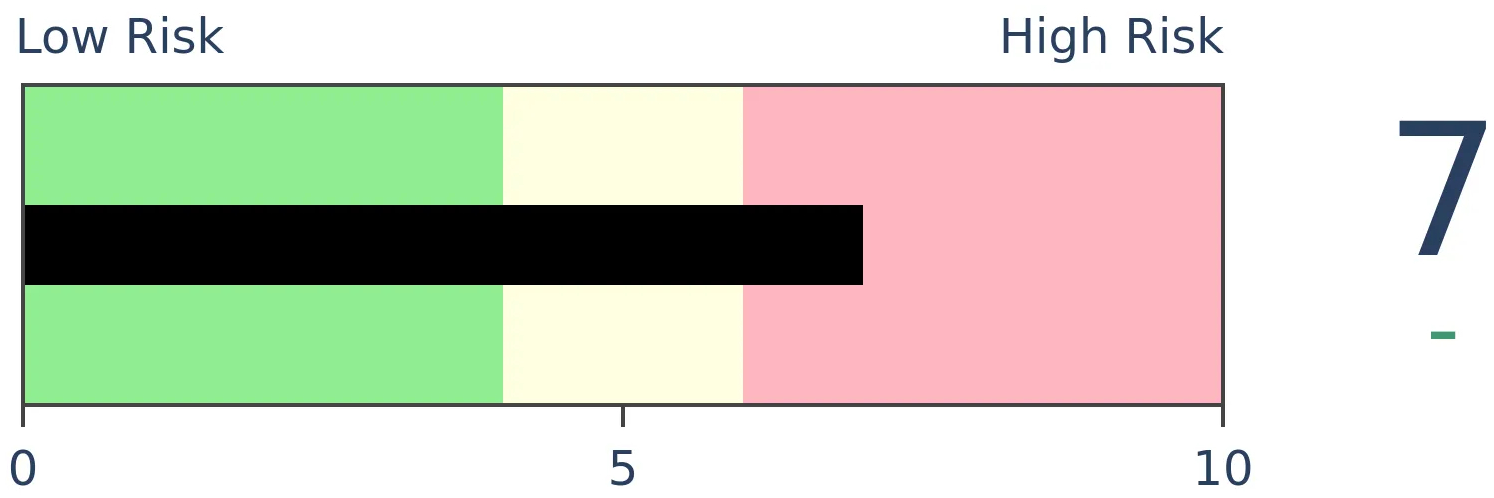
Stocks Short-Term
|
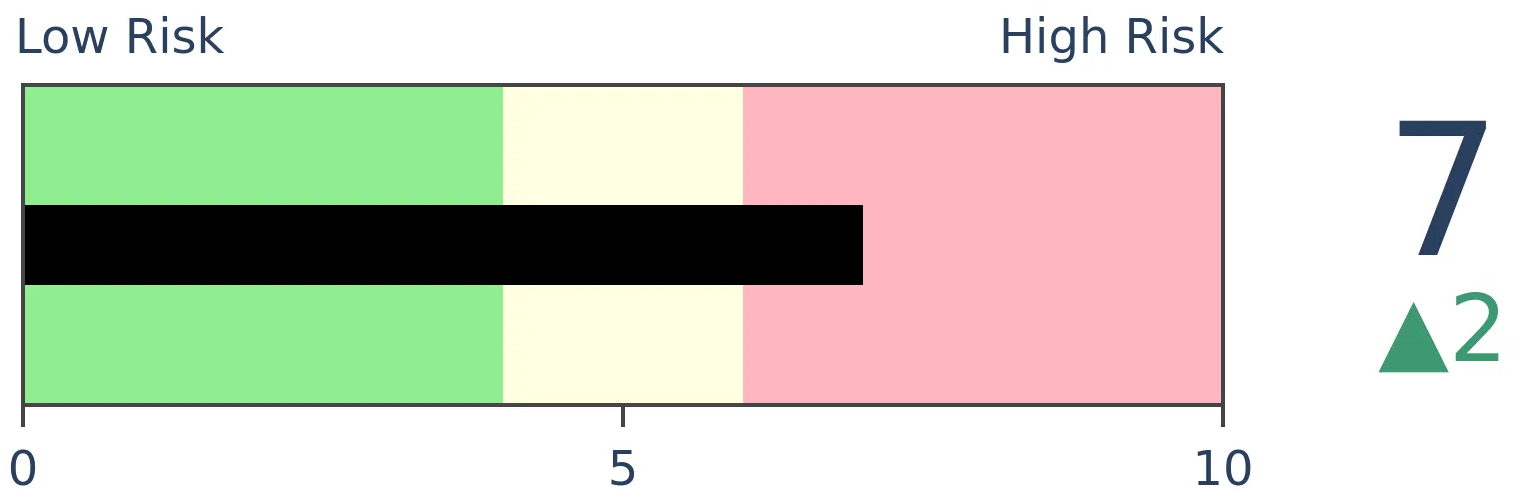
Stocks Medium-Term
|
|
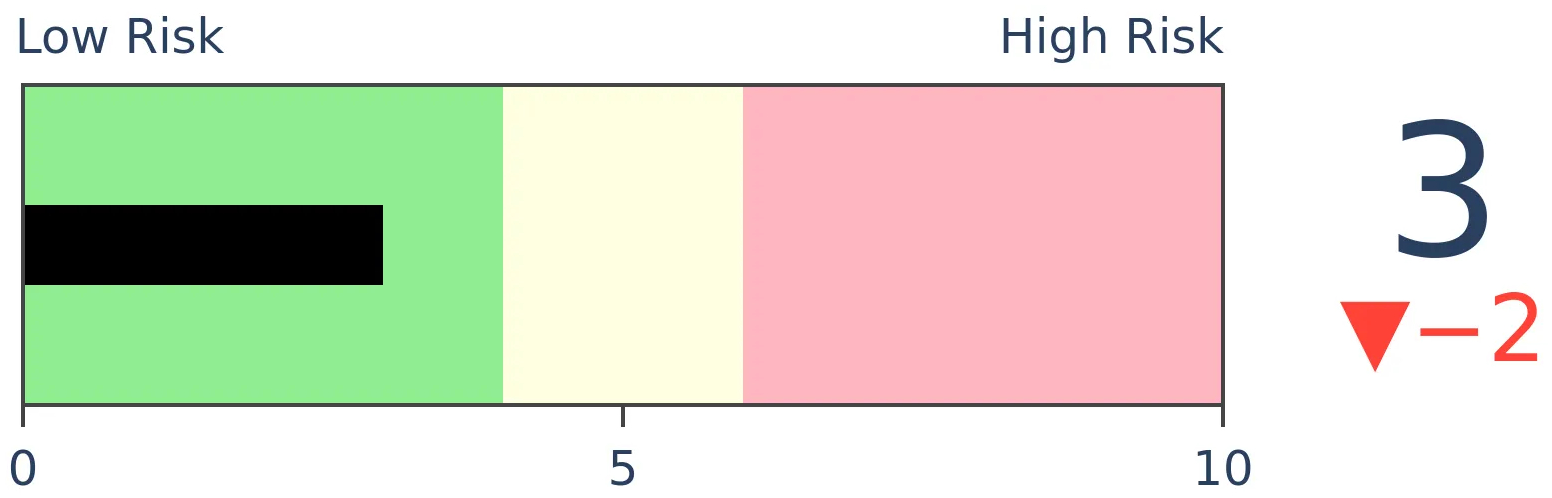
Bonds
|
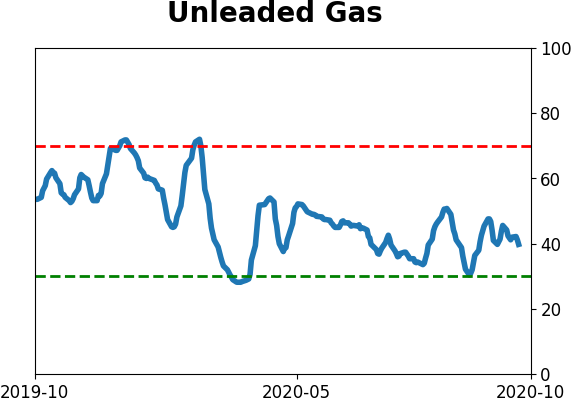
Crude Oil
|
|
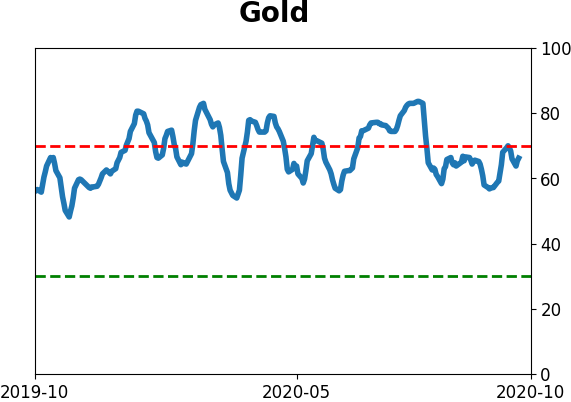
Gold
|
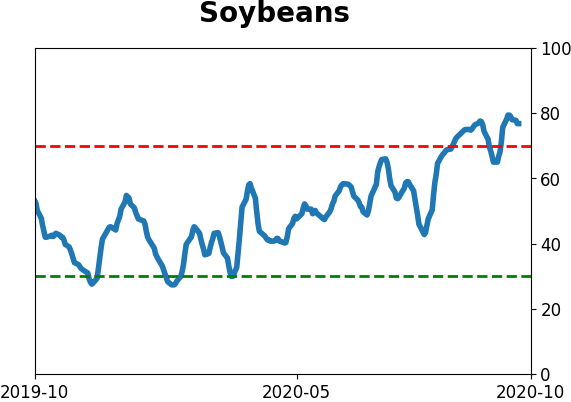
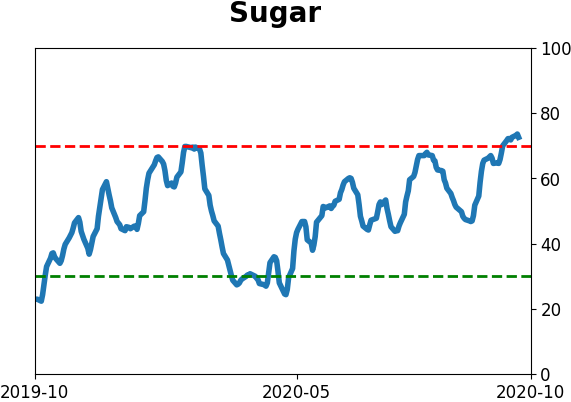
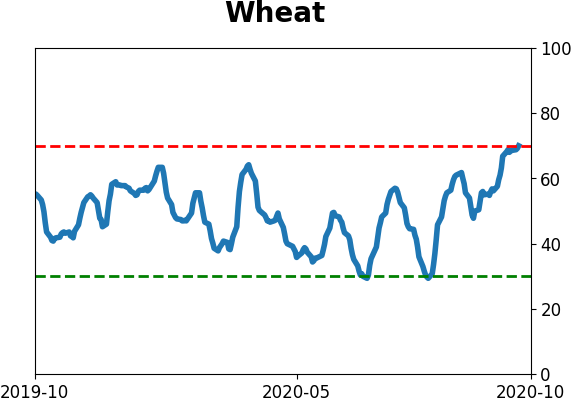
Agriculture
|
|
Research
BOTTOM LINE
Corporate insiders at utility companies have backed off any major selling pressure, a good thing since the prices of many of these stocks continue to recover. After a complete washout as recently as mid-May, now more than 80% of these stocks are above their 200-day moving averages.
FORECAST / TIMEFRAME
XLU -- Up, Long-Term
|
Utility stocks have managed to hold up better than usual. Earlier in the month, many of those stocks showed short-term surges, which typically lead to lower prices for such a staid sector.
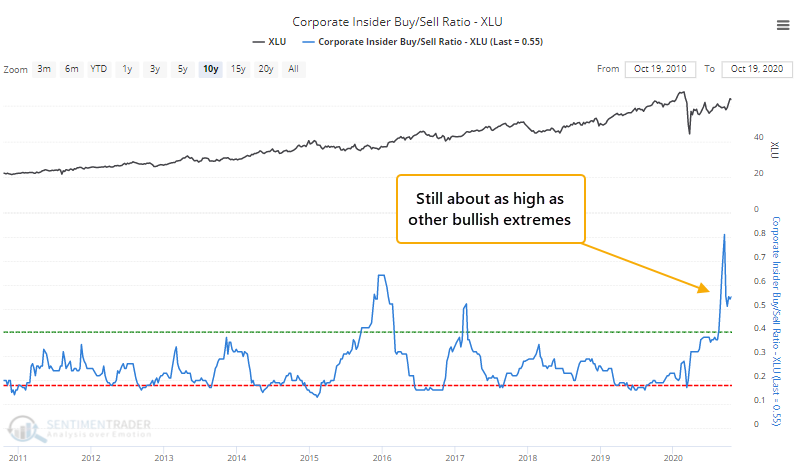
There have been positives for months, like insider buying interest. Those buys have tapered off, but sales have dropped even further, so the Buy/Sell Ratio is still impressively high.
As many of those stocks have held up, more and more of them are crossing above their long-term 200-day moving averages. There was a total wipeout in these stocks during the pandemic crash in March, and even as late as mid-May, every utility stock was below its 200-day average. Over the past week, that has climbed above 80%.
Over the past 30 years, there have been only 3 other times when this sector went from fewer than 5% of stocks above their 200-day averages to more than 80% of them being so within a year's time.
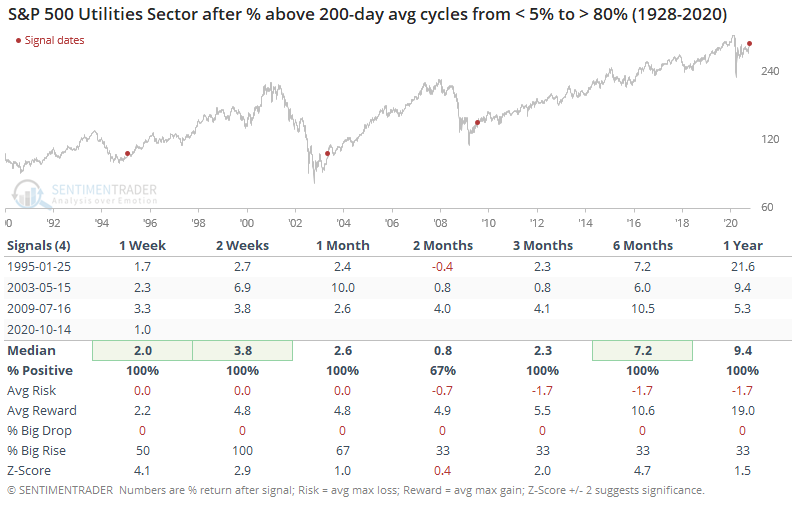
All 3 of them triggered during the initial recovery from a bear market, leading to large, sustained gains in the months ahead. The risk/reward was heavily skewed to the upside, and none of them saw an abnormally large loss at any point within the next year.
On a short-term basis, a sector like this has a lot of trouble when it reaches overbought levels. But on a medium- to long-term basis, this recovery has impressively positive precedents.
BOTTOM LINE
The yield on 10-year Treasury notes is nearing its 200-day average for the 1st time in more than 200 days. This has typically not indicated a long-term change in trend, as the relentless bias toward lower rates knee-capped any potential rallies.
FORECAST / TIMEFRAME
None
|
As investors weigh the potential for a new administration, another round of stimulus, and (hopefully) good news on the pandemic, yields on longer-term Treasuries have quietly risen.
Now, for the first time in more than 200 days, the yield on 10-year Treasury notes is nearing its 200-day moving average.
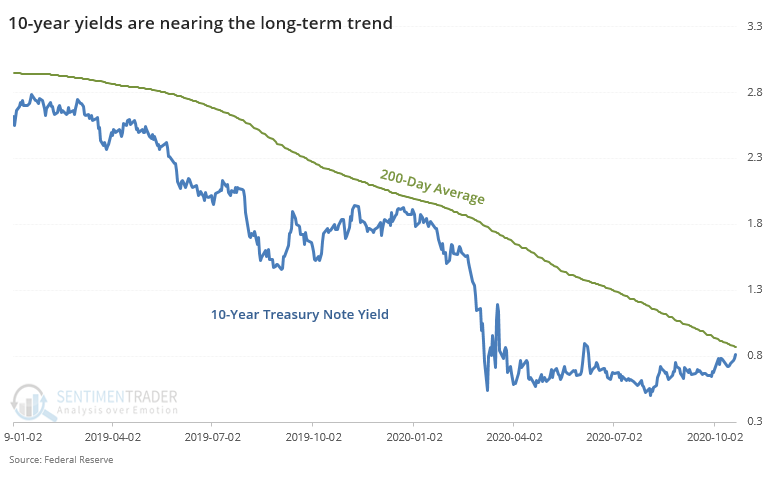
It's been more than 9 months since the yield was within 10 basis points of its average. That's one of the longest streaks in nearly 60 years.
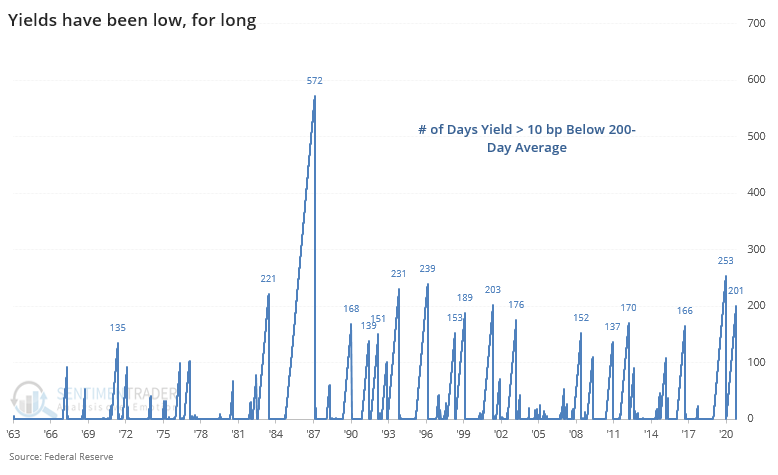
When a streak of more than 6 months of being at least 10 basis points under its 200-day average finally ended, it usually didn't precede a further rise in yields.
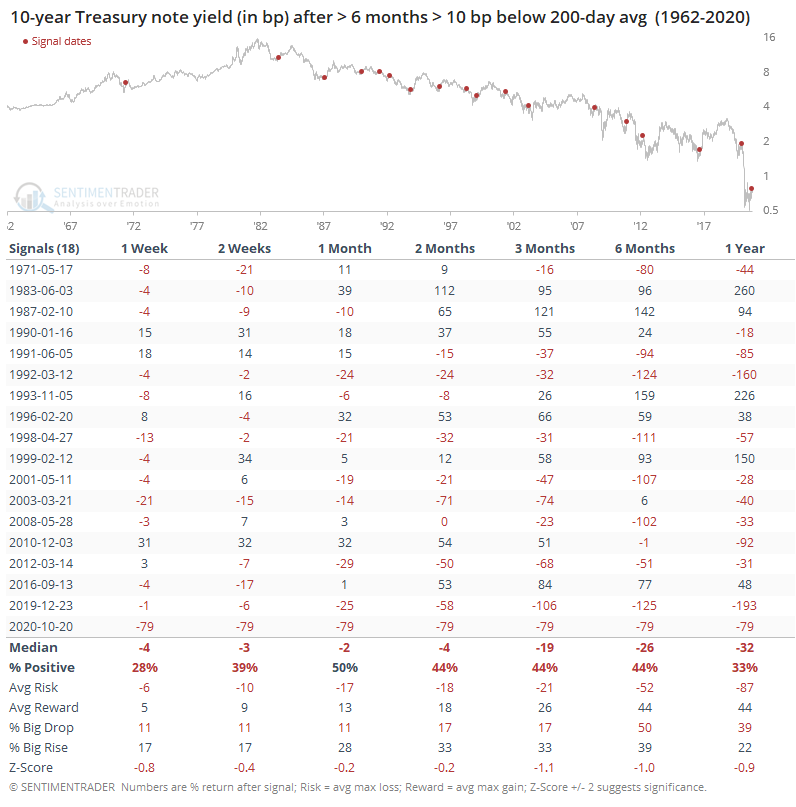
There was no time frame in which the 10-year yield rose more than half the time. Of course, the study period is dominated by the long bear market (in yields) so it would take a lot for a signal to show a high likelihood of rising yields across almost any time frame.
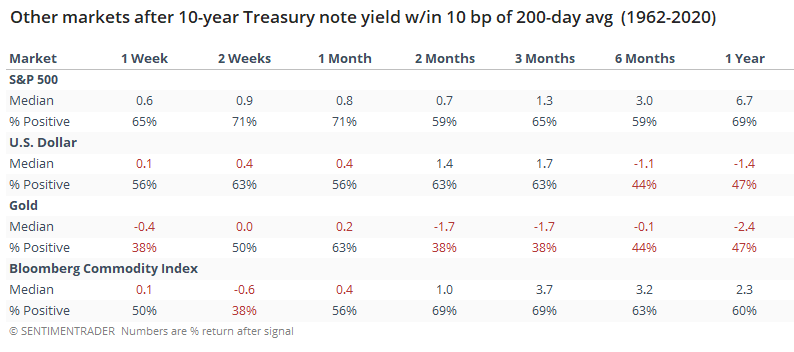
The ends of these streaks proved to be modestly positive for stocks and commodities but were inconsistent for the dollar and gold.
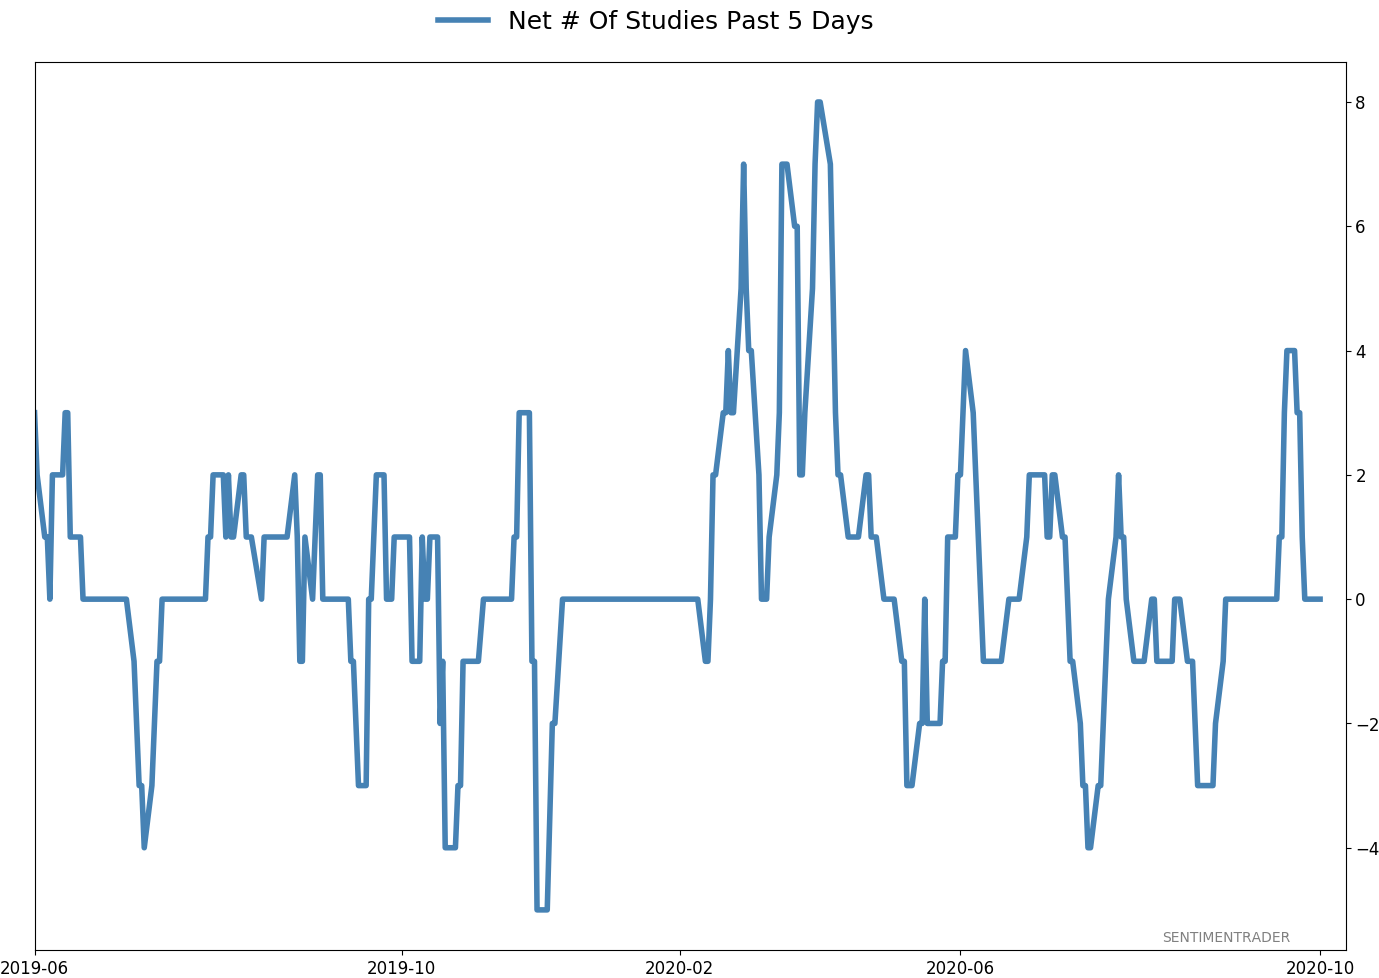
Active Studies
| Time Frame | Bullish | Bearish | | Short-Term | 0 | 0 | | Medium-Term | 4 | 8 | | Long-Term | 48 | 2 |
|
Indicators at Extremes
Portfolio
| Position | Description | Weight % | Added / Reduced | Date | | Stocks | 15.6% RSP, 10.1% VWO, 7.5% XLE, 5.1% PSCE | 38.2 | Added 5% | 2020-10-15 | | Bonds | 10% BND, 10% SCHP, 10% ANGL | 29.7 | Reduced 0.1% | 2020-10-02 | | Commodities | GCC | 2.4 | Reduced 2.1%
| 2020-09-04 | | Precious Metals | GDX | 4.7 | Added 5% | 2020-09-09 | | Special Situations | | 0.0 | Reduced 5% | 2020-10-02 | | Cash | | 25.0 | | |
|
Updates (Changes made today are underlined)
After the September swoon wrung some of the worst of the speculation out of stocks, there are some signs that it's returning, especially in the options market. It's helped to push Dumb Money Confidence above 70%. A big difference between now and August is that in August, there was a multitude of days with exceptionally odd breadth readings. Some of the biggest stocks were masking underlying weakness. Combined with heavy speculative activity, it was a dangerous setup. Now, we've seen very strong internal strength, in the broad market, as well as tech and small-cap stocks. Prior signals almost invariably led to higher prices. That's hard to square with the idea that forward returns tend to be subdued when Confidence is high, but that's less reliable during healthy market conditions, which we're seeing now (for the most part). I added some risk with small-cap energy stocks, due to an increasing number of positive signs in both small-caps and energy. This is intended as a long-term position.
RETURN YTD: 0.0% 2019: 12.6%, 2018: 0.6%, 2017: 3.8%, 2016: 17.1%, 2015: 9.2%, 2014: 14.5%, 2013: 2.2%, 2012: 10.8%, 2011: 16.5%, 2010: 15.3%, 2009: 23.9%, 2008: 16.2%, 2007: 7.8%
|
|
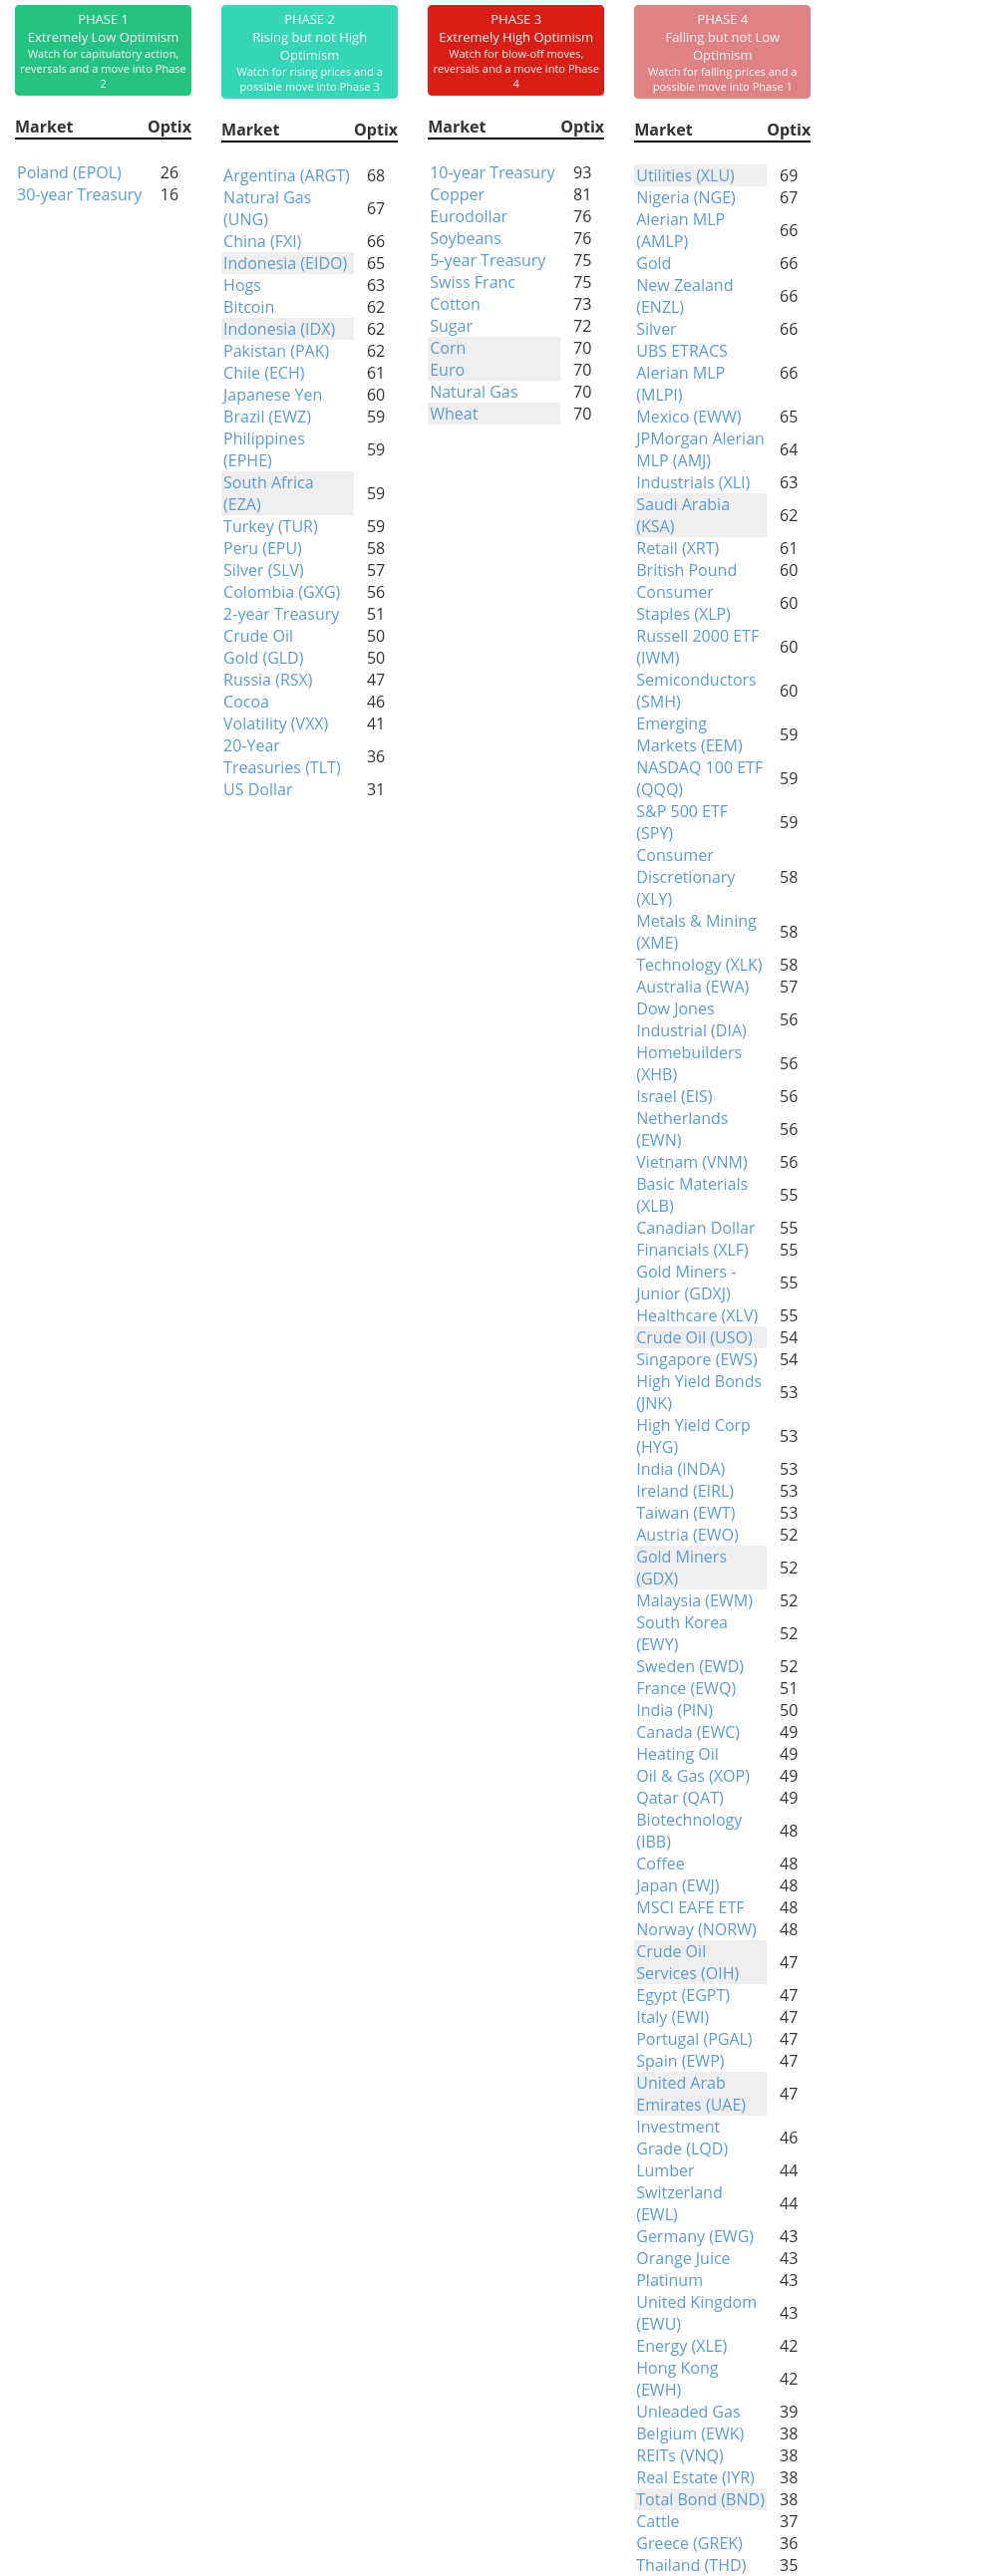
Phase Table
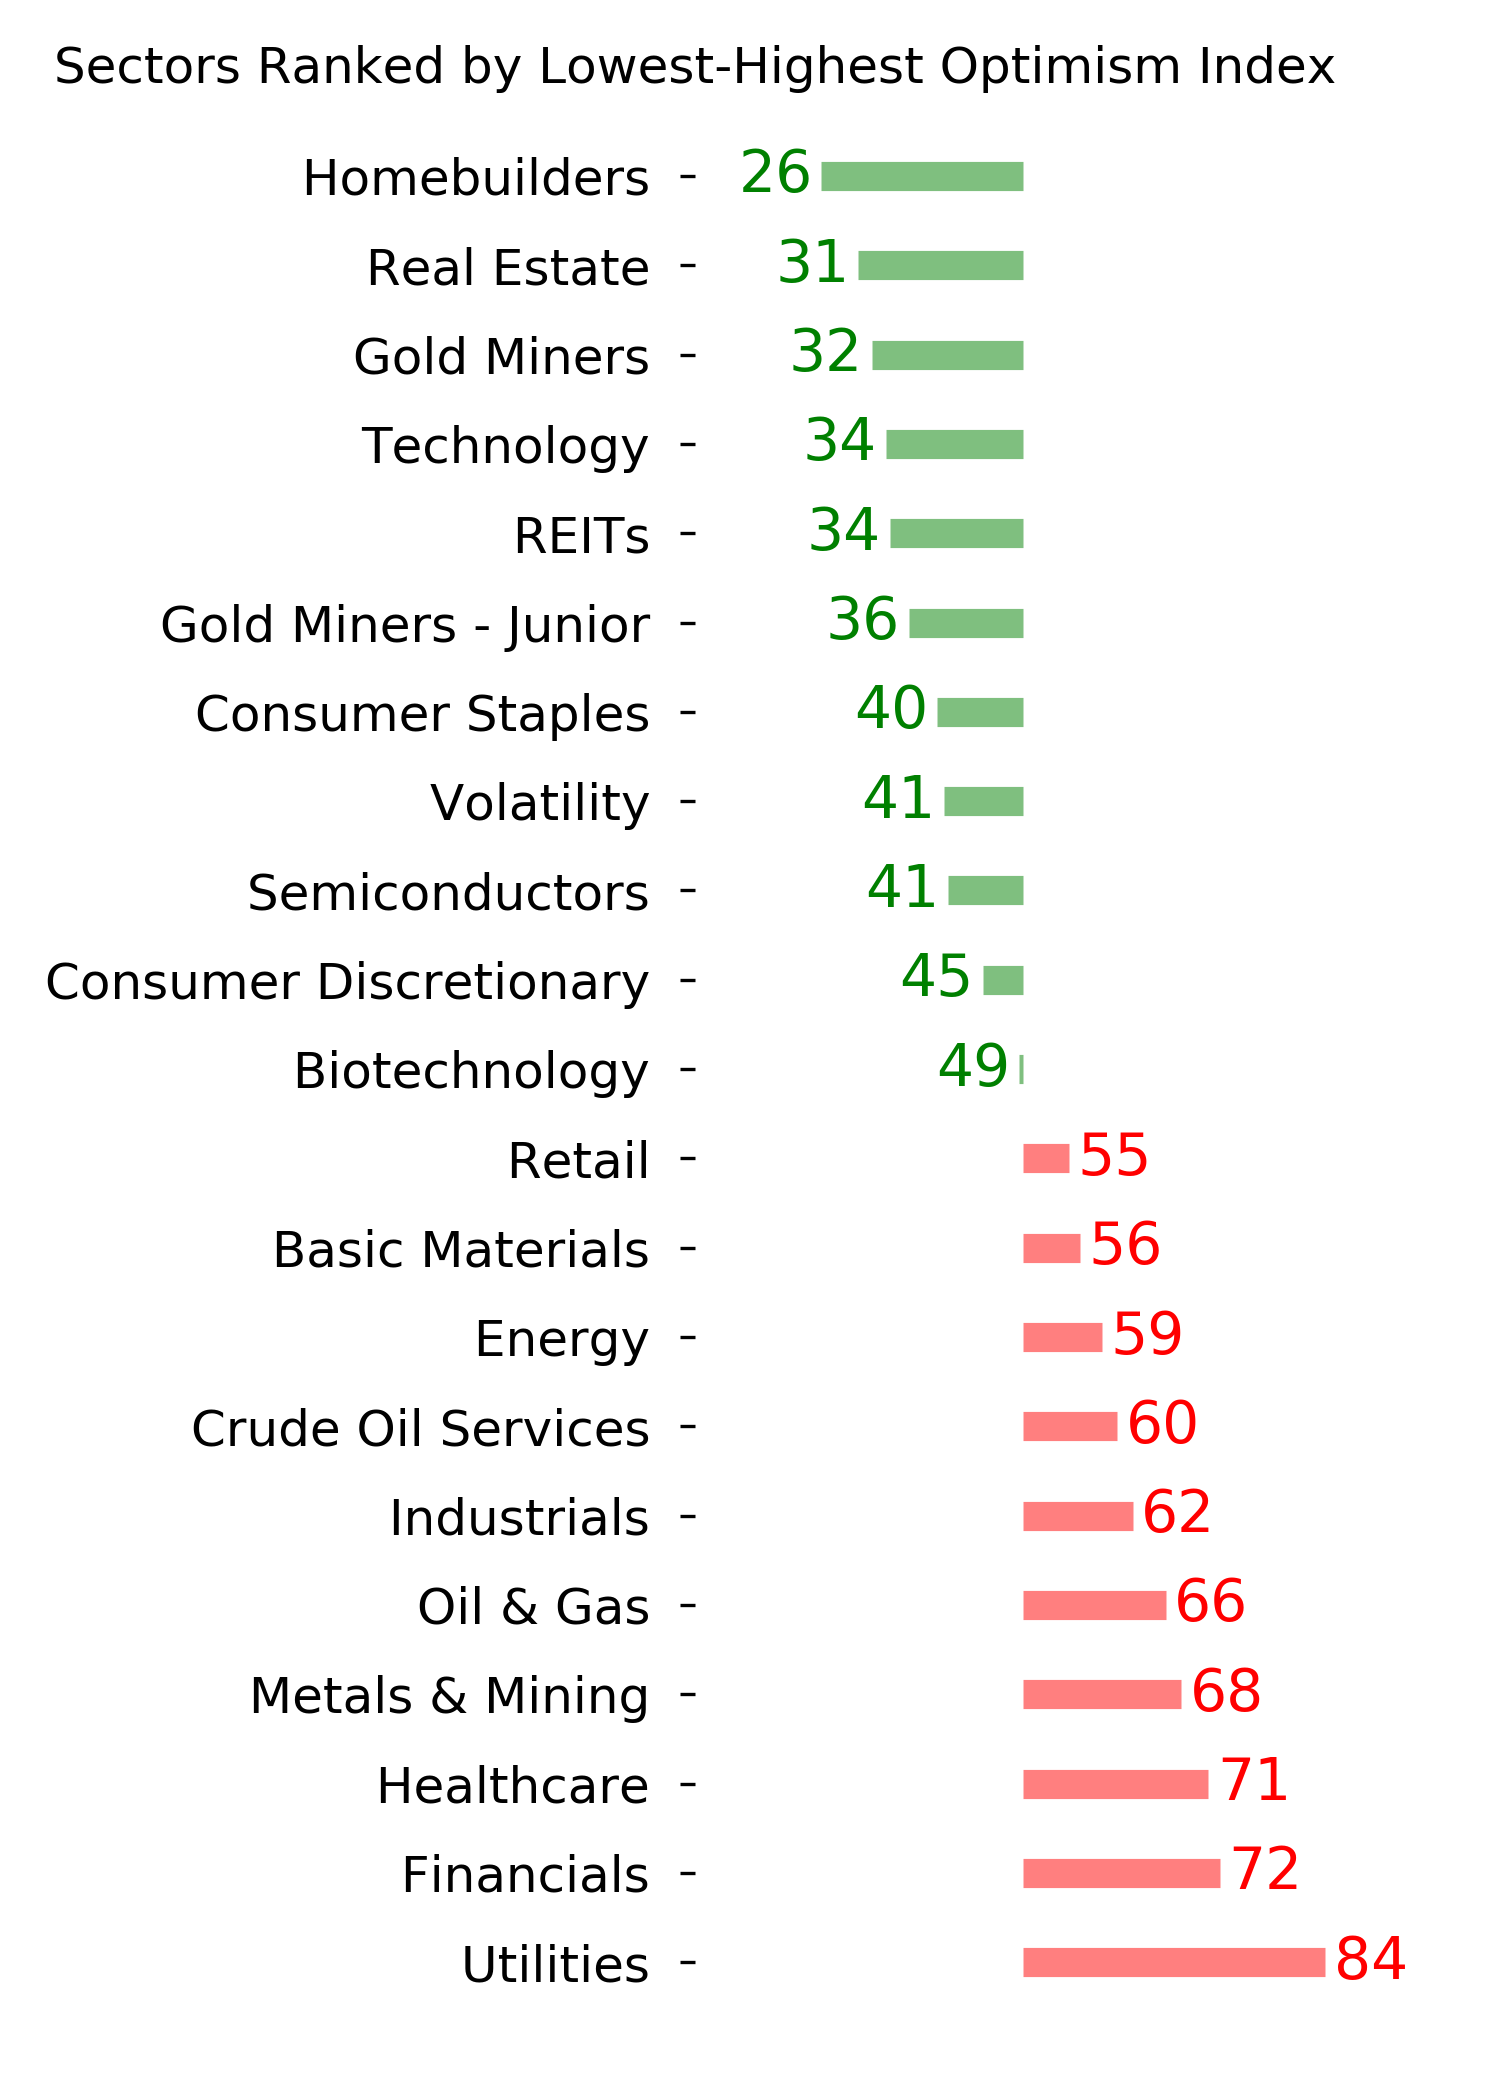
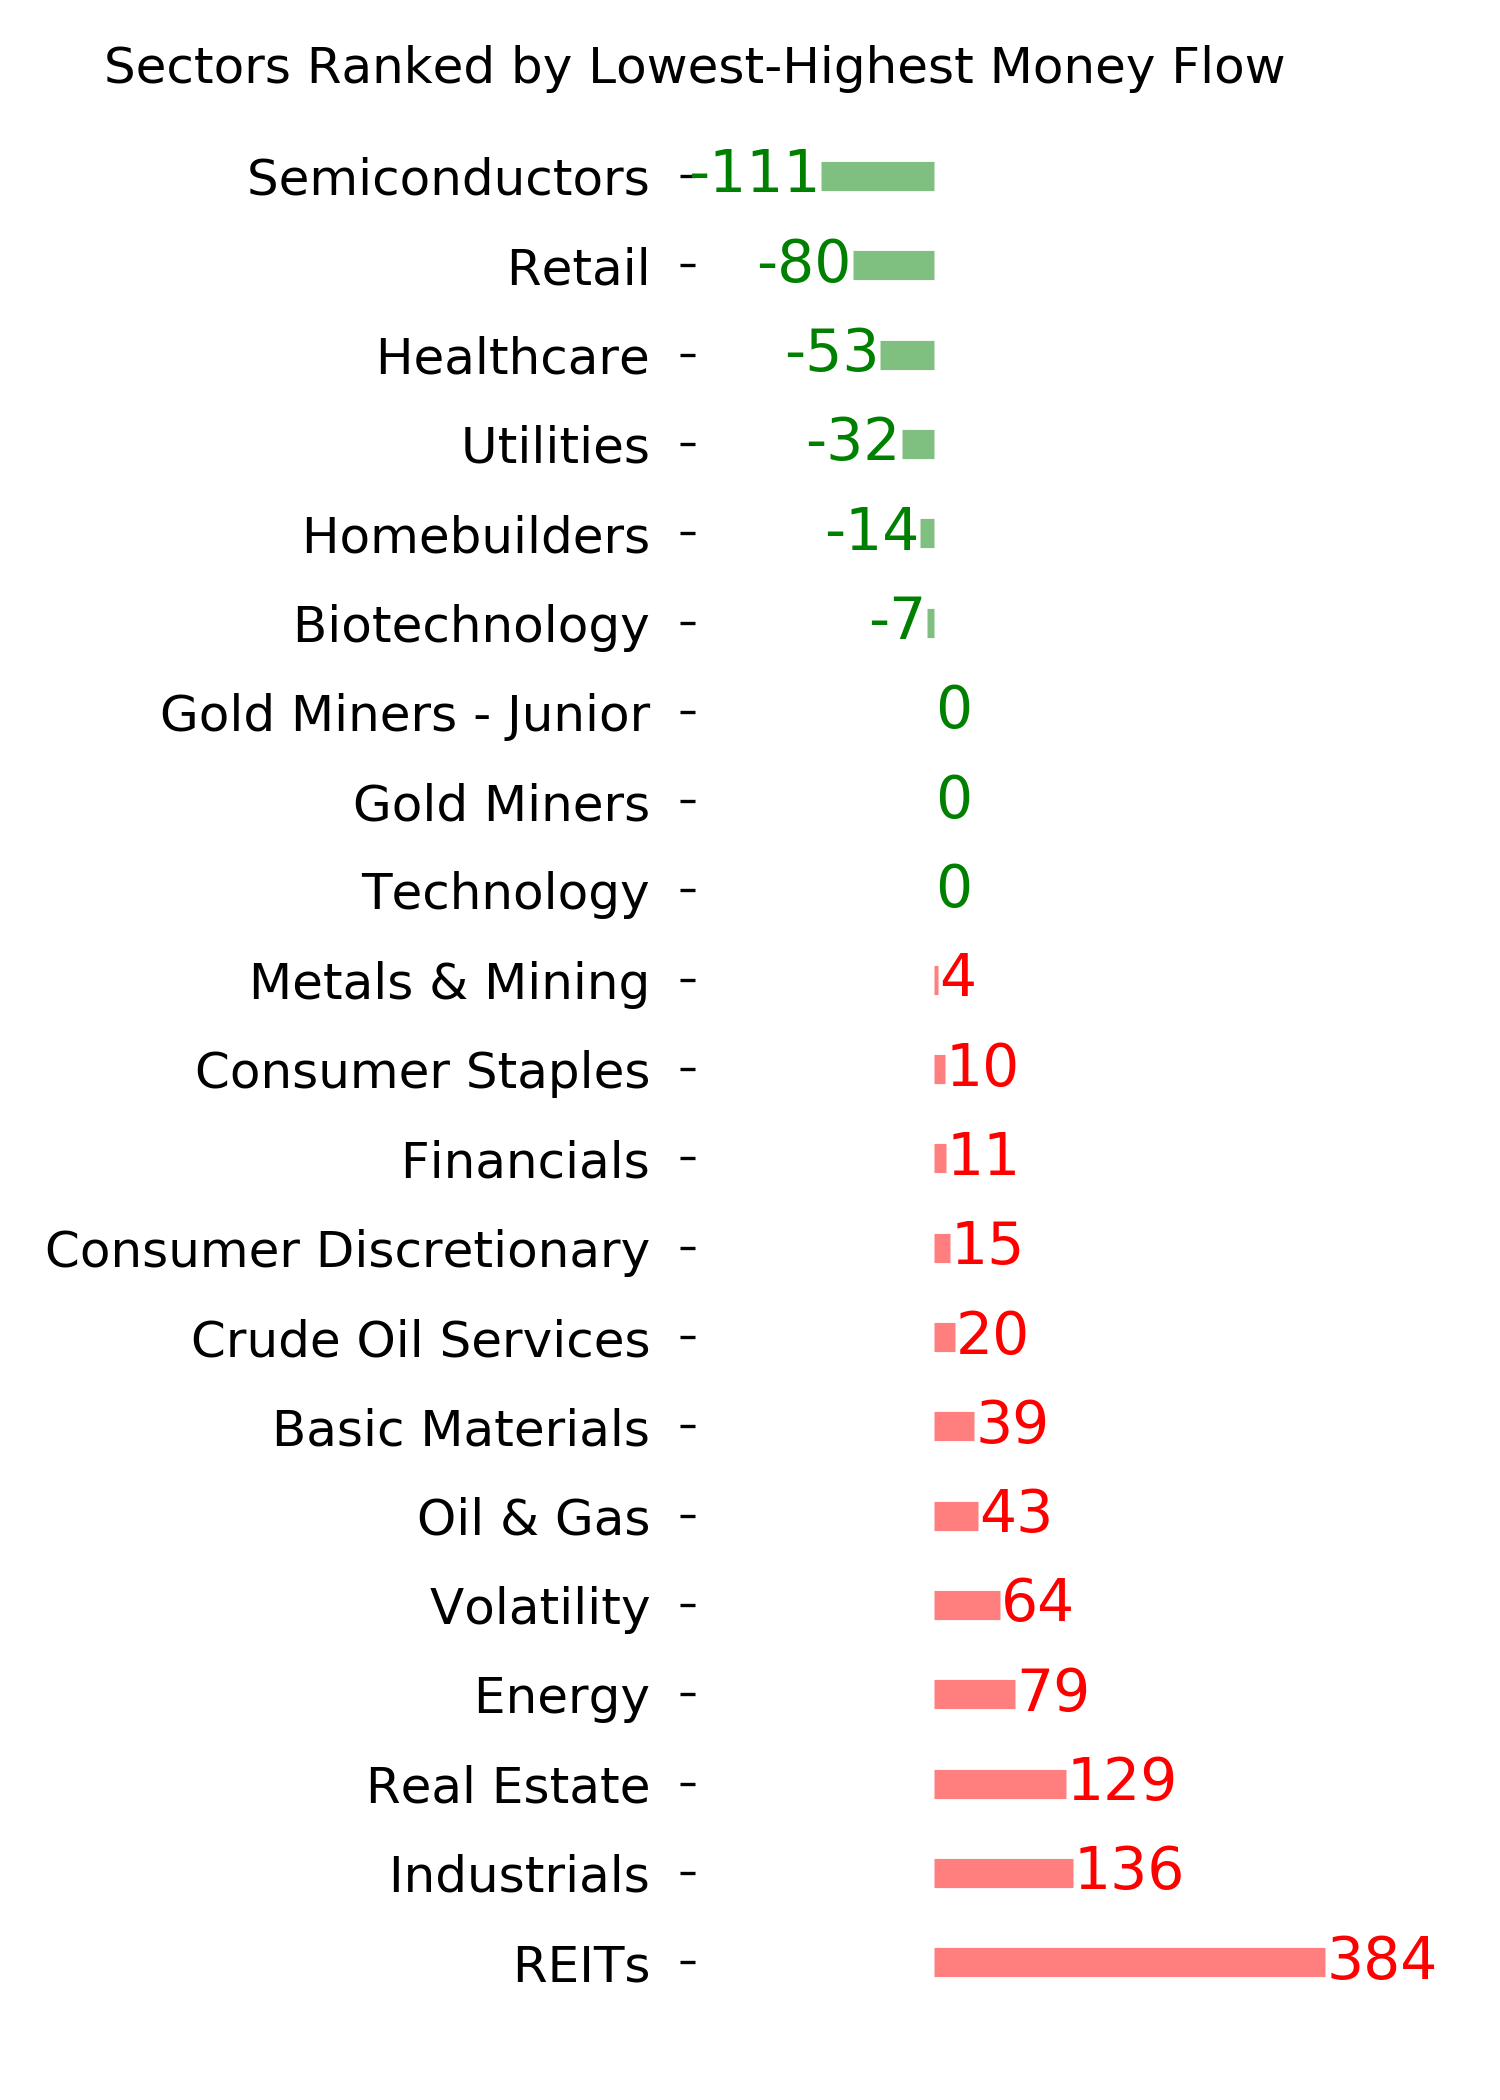
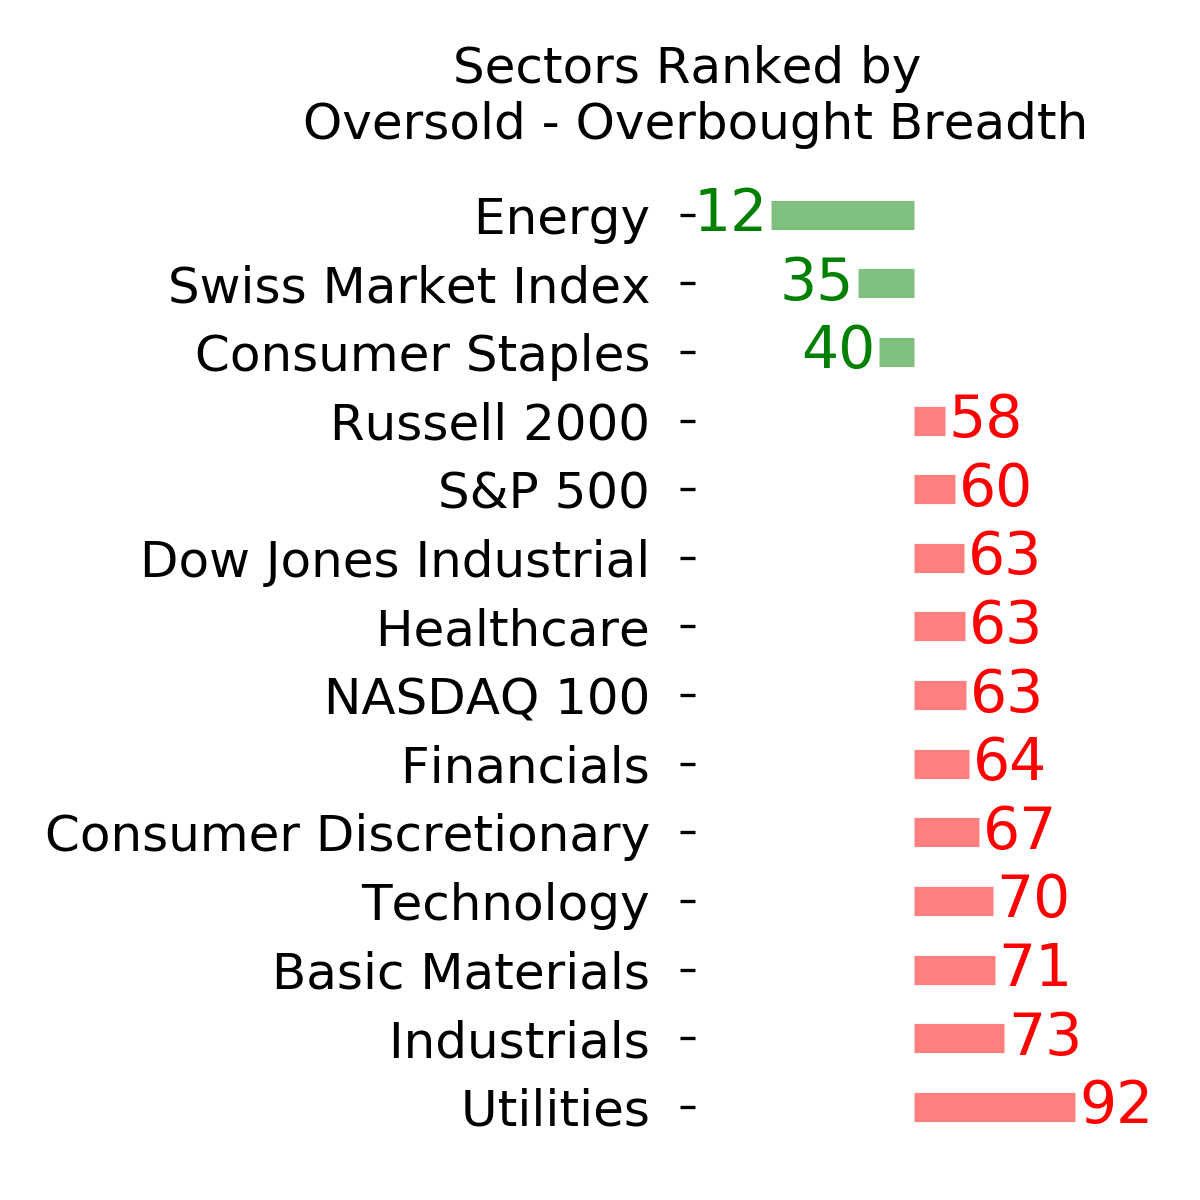
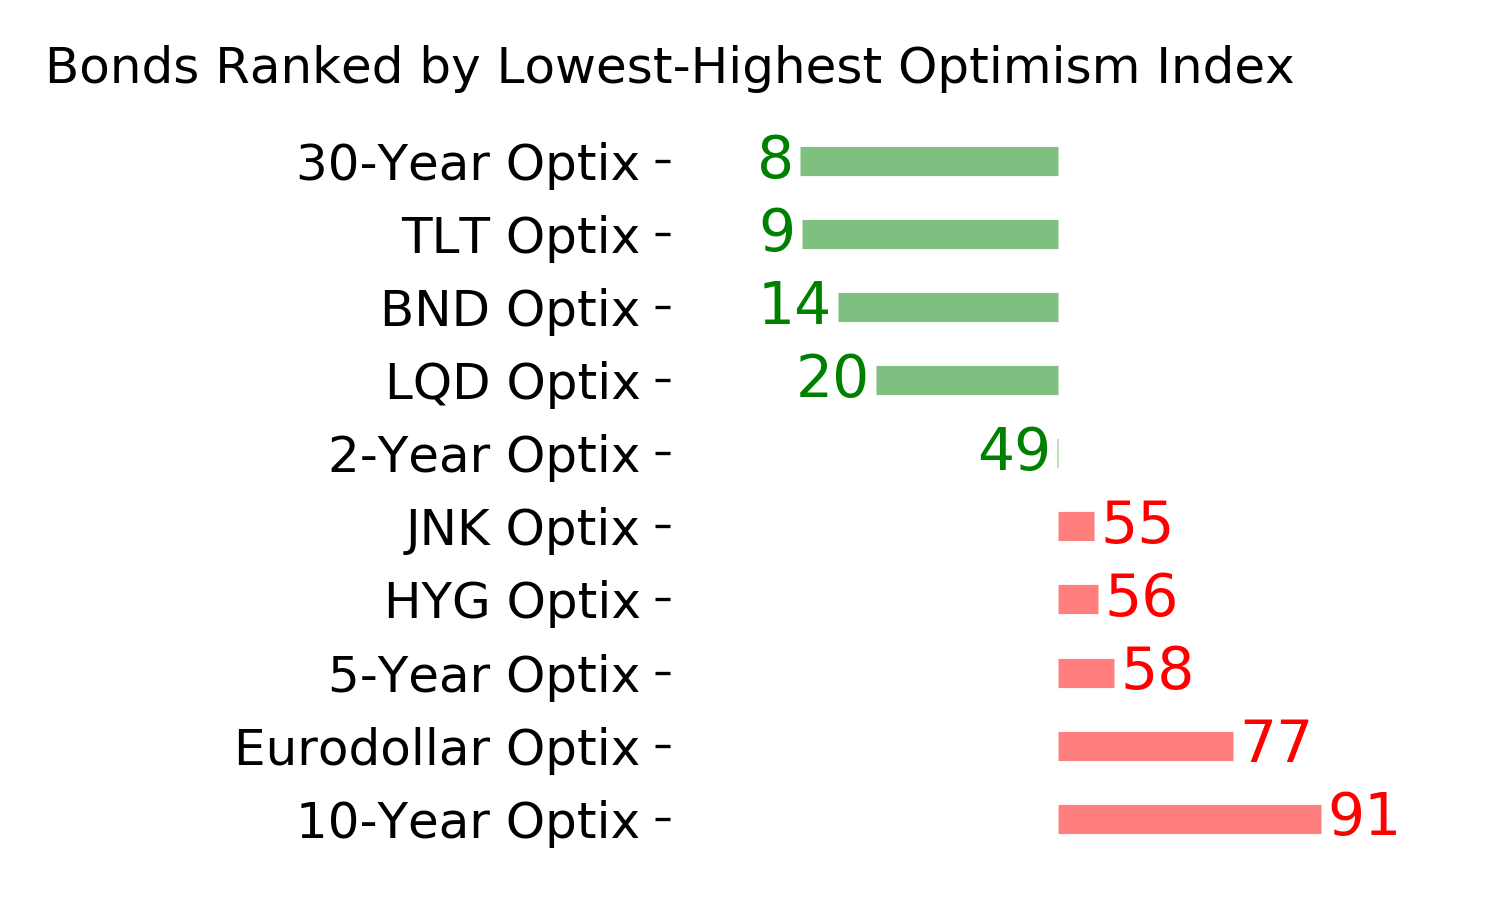
Ranks
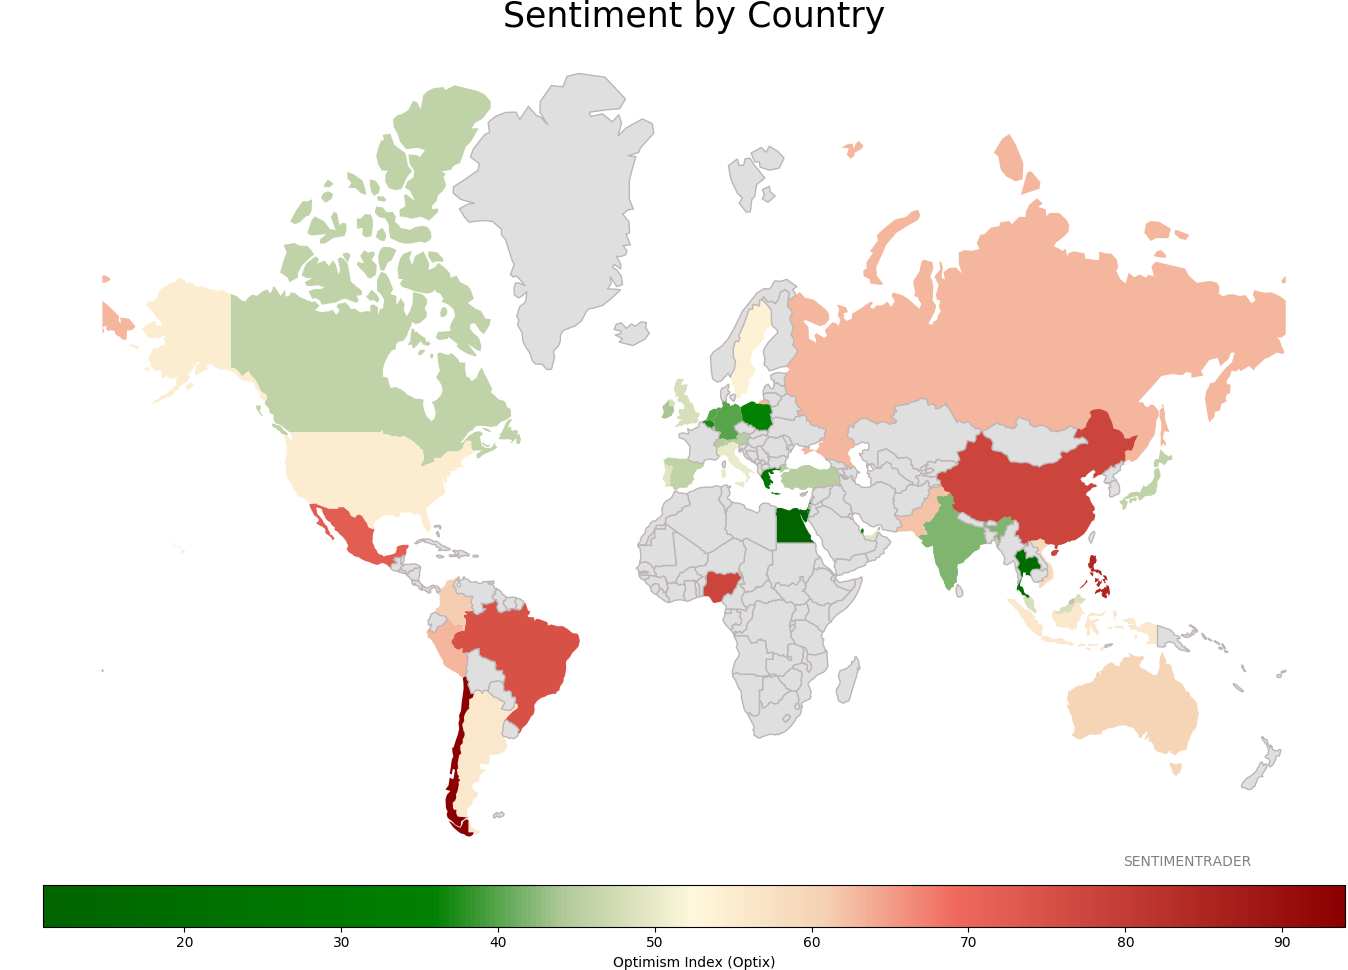
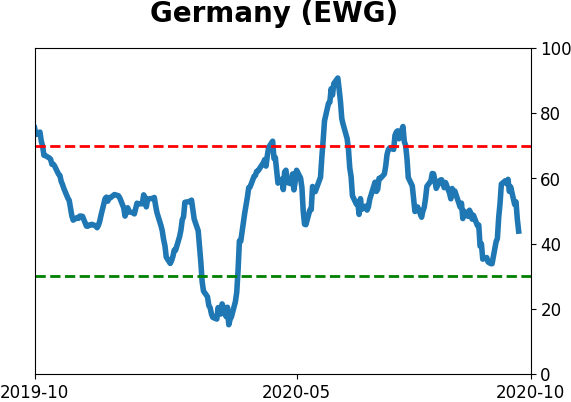
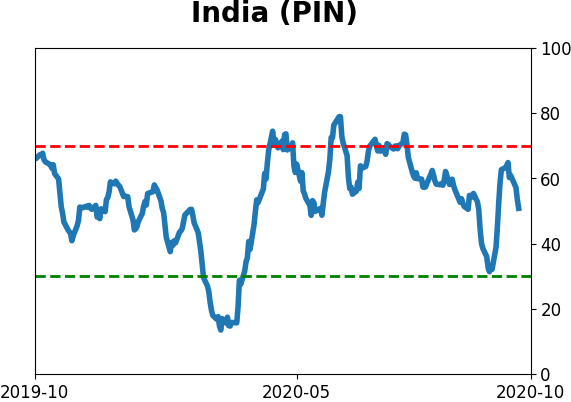
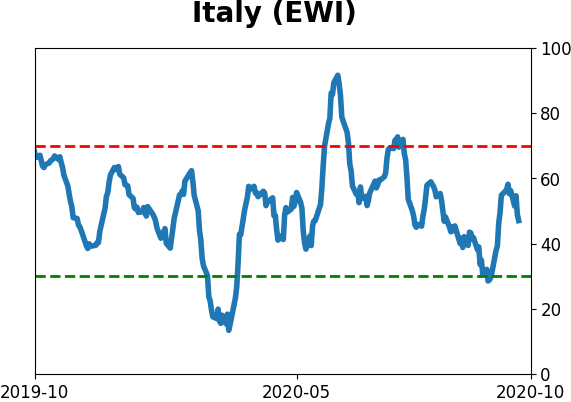
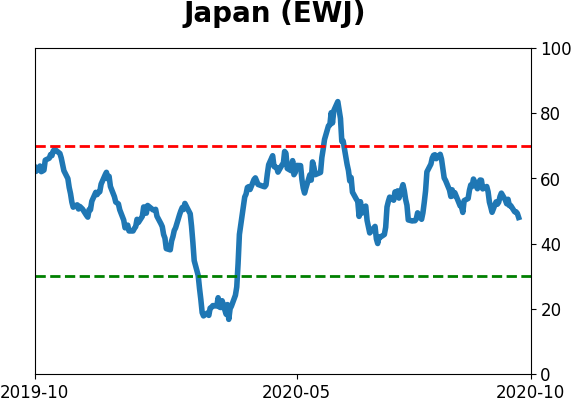
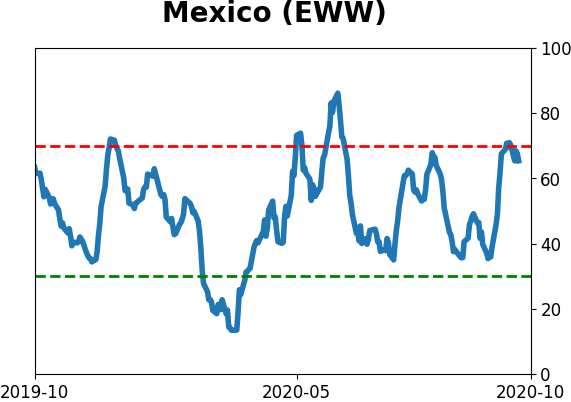
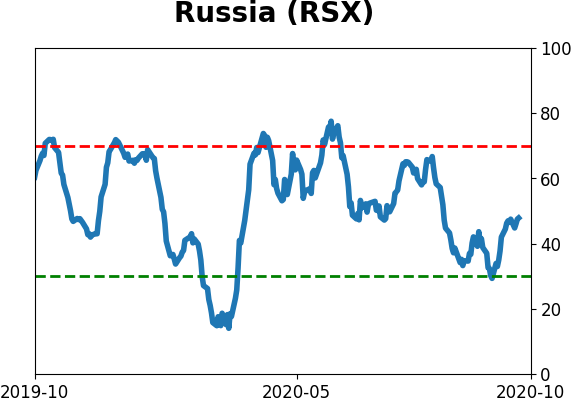
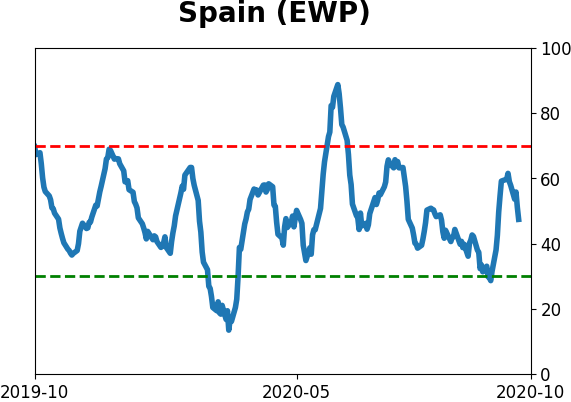
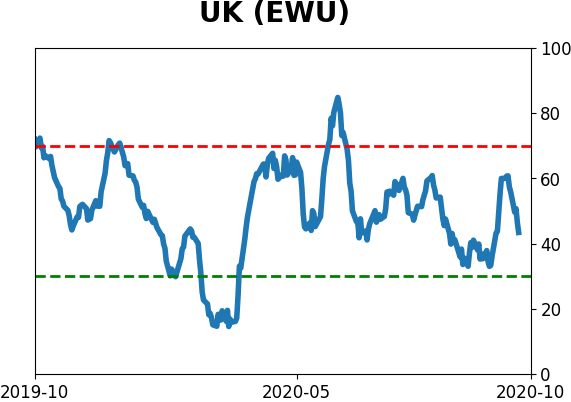
Sentiment Around The World
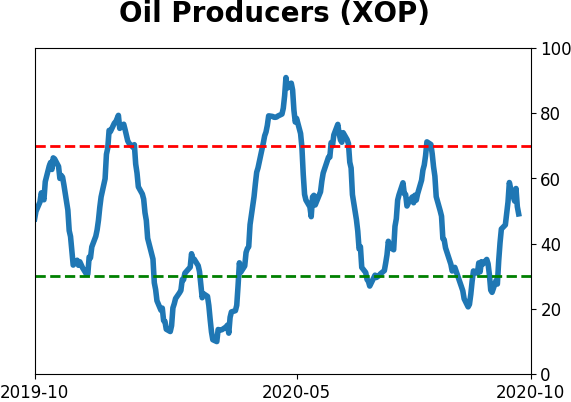
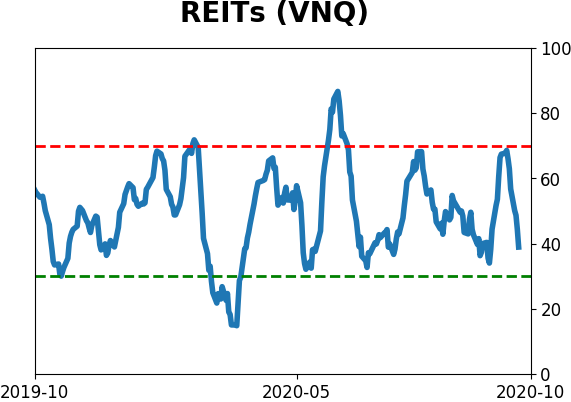
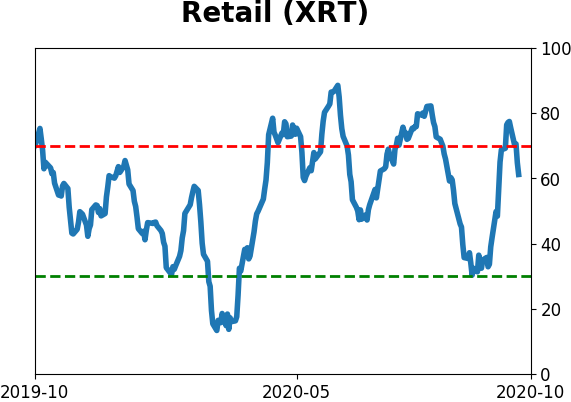
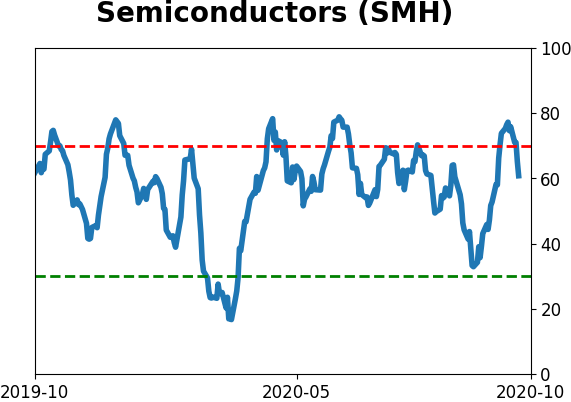
Optimism Index Thumbnails
|
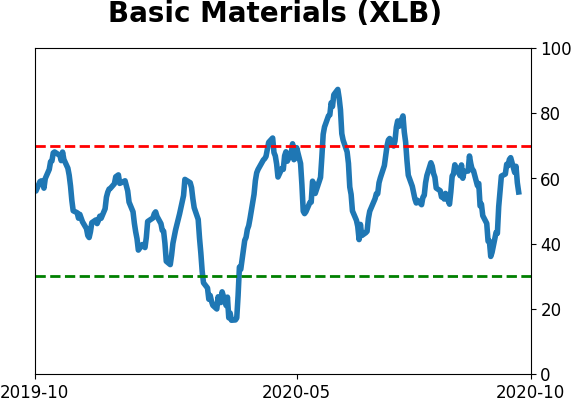
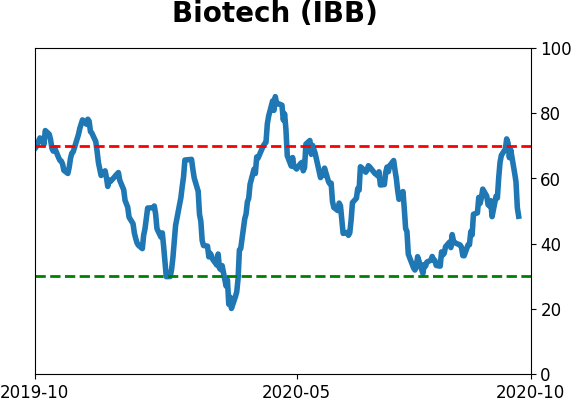
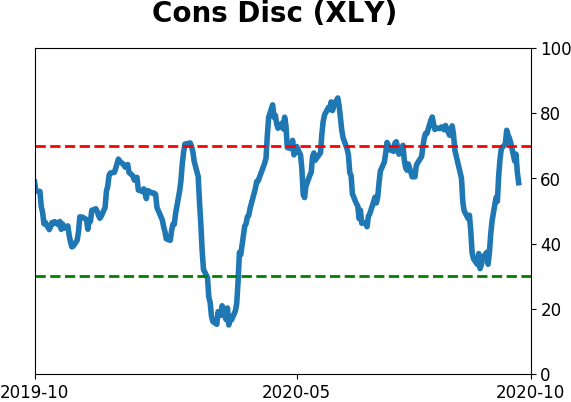
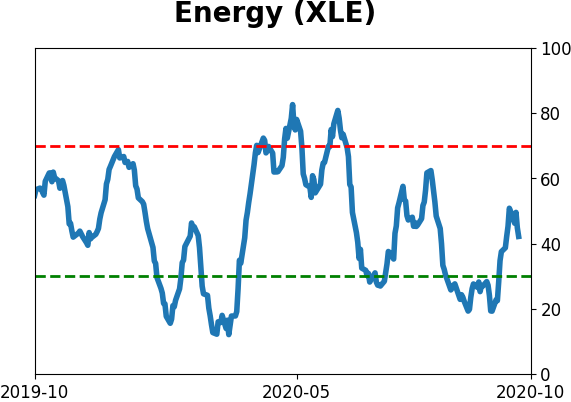
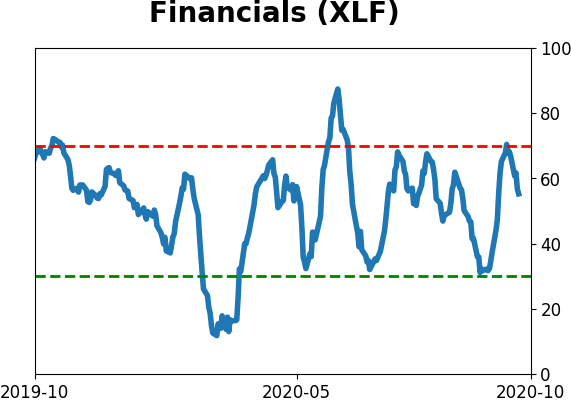
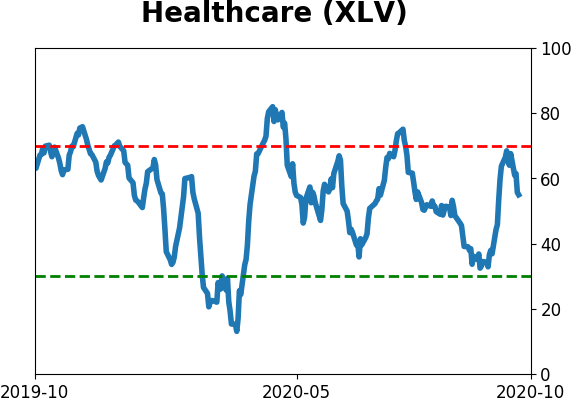
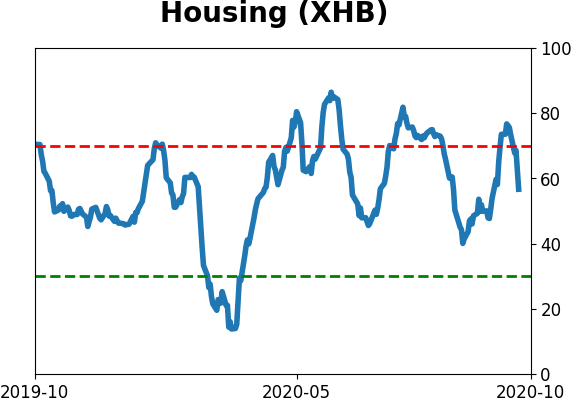
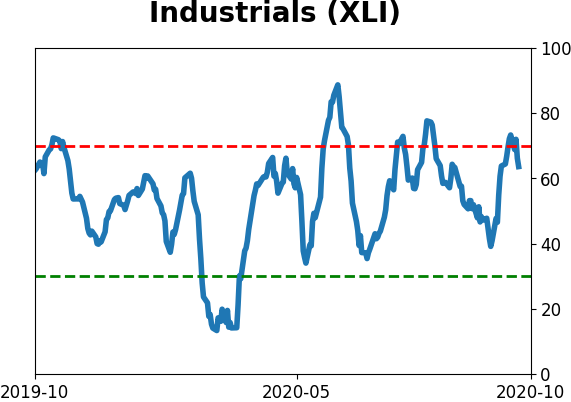
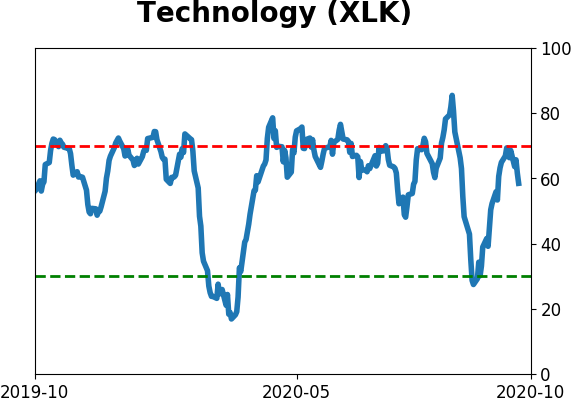
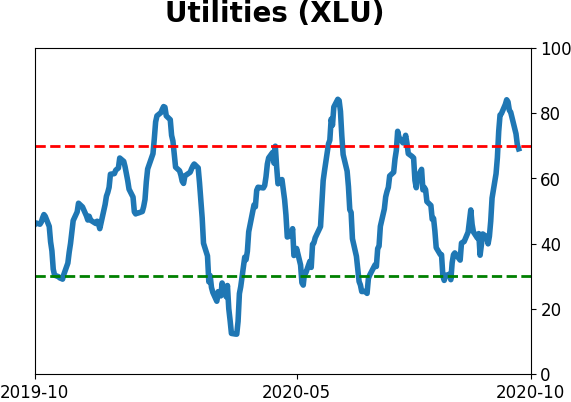
Sector ETF's - 10-Day Moving Average
|
|
|
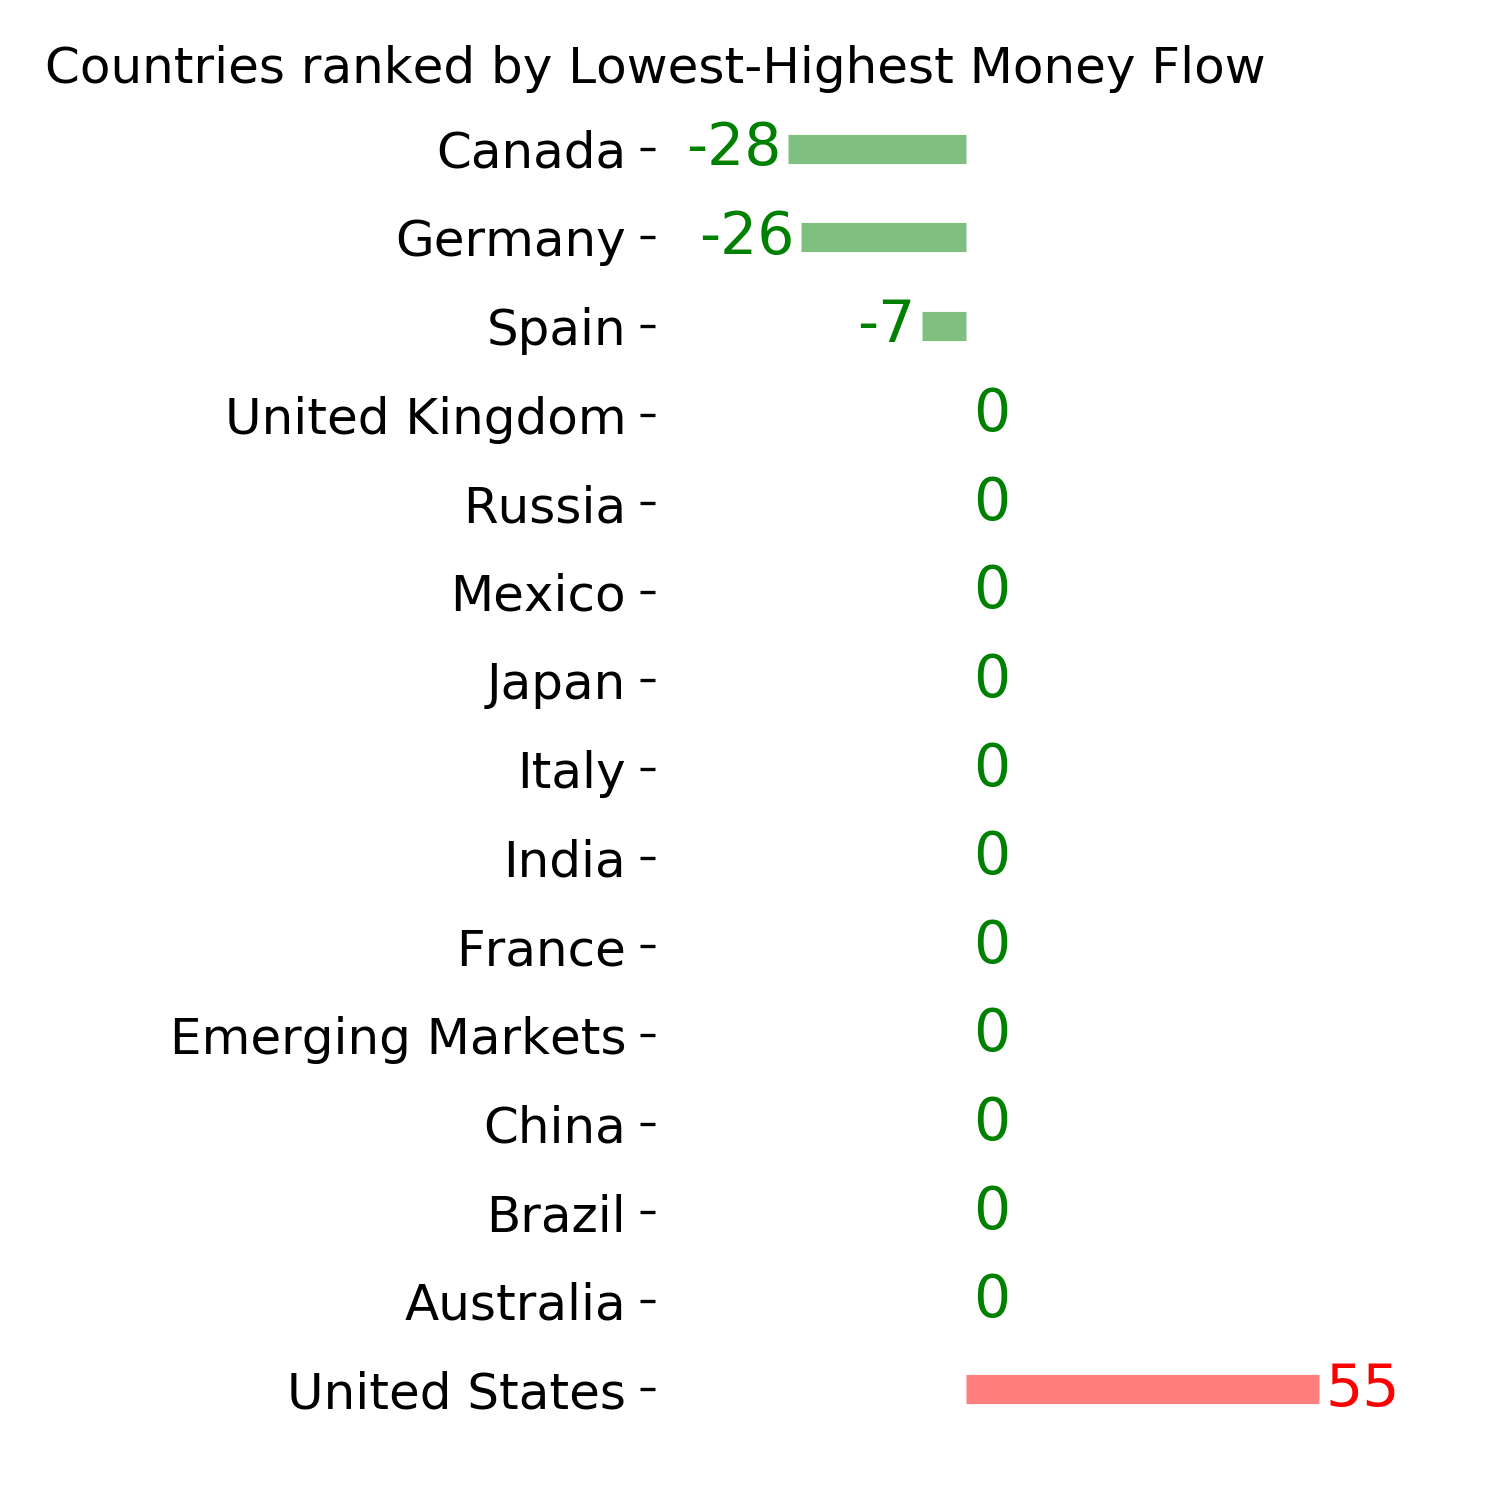
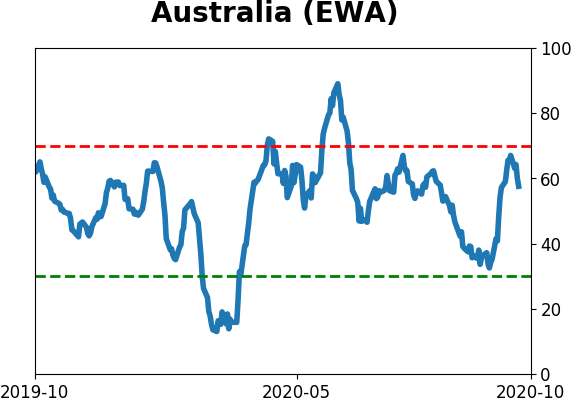
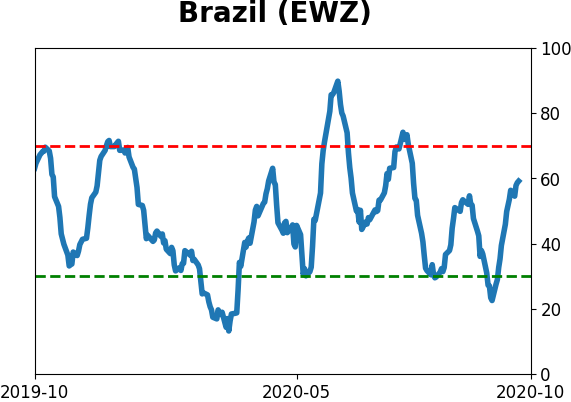
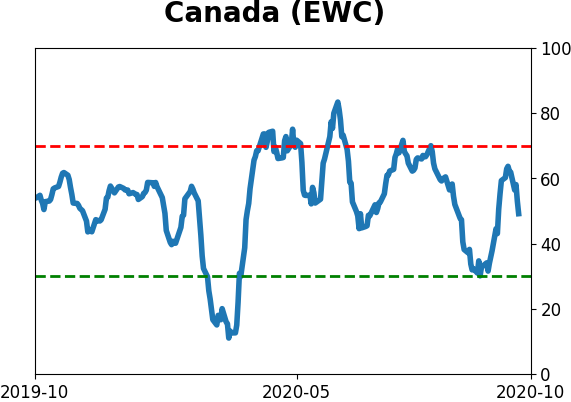
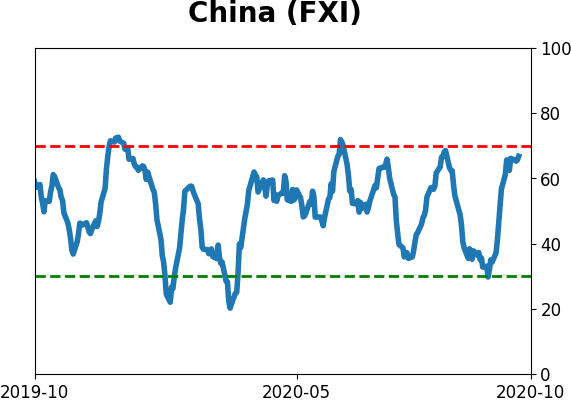
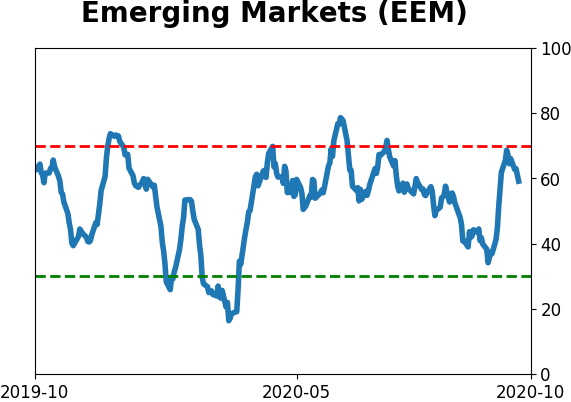
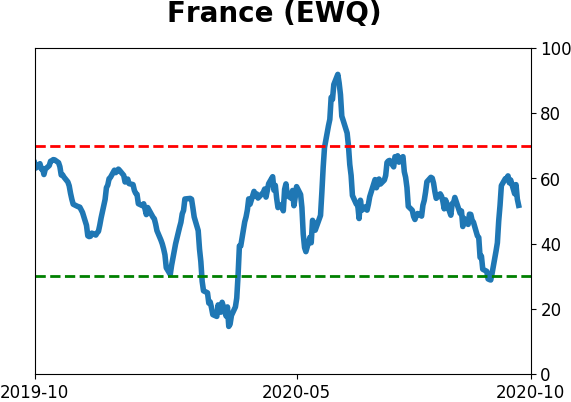
Country ETF's - 10-Day Moving Average
|
|
|
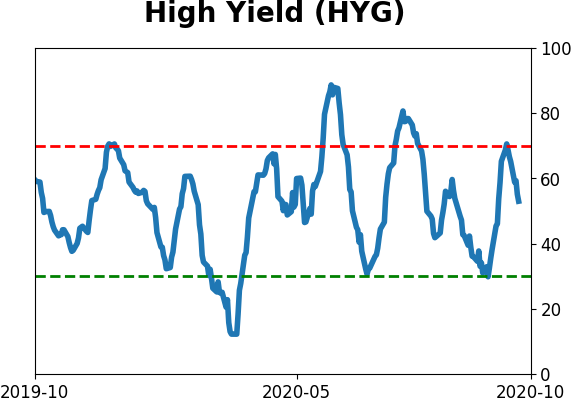
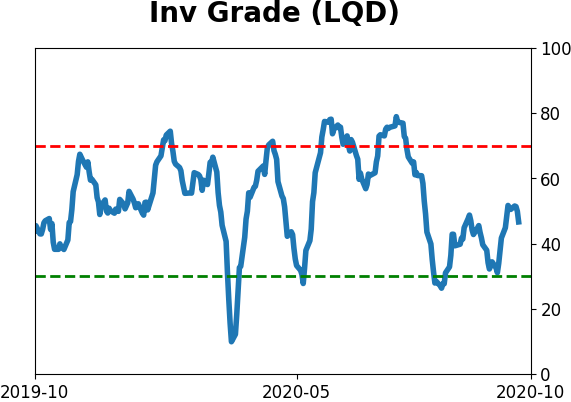
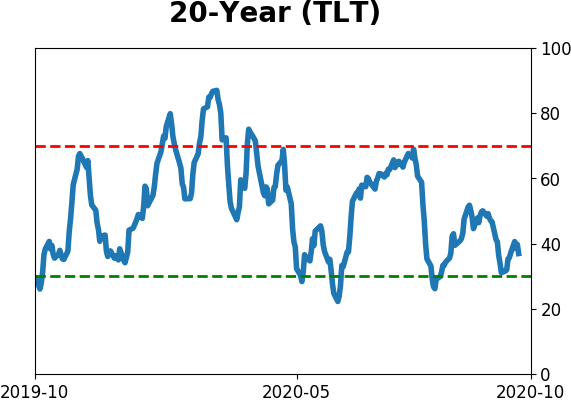
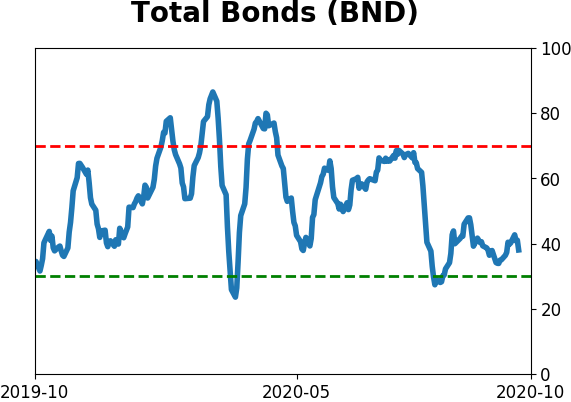
Bond ETF's - 10-Day Moving Average
|
|
|
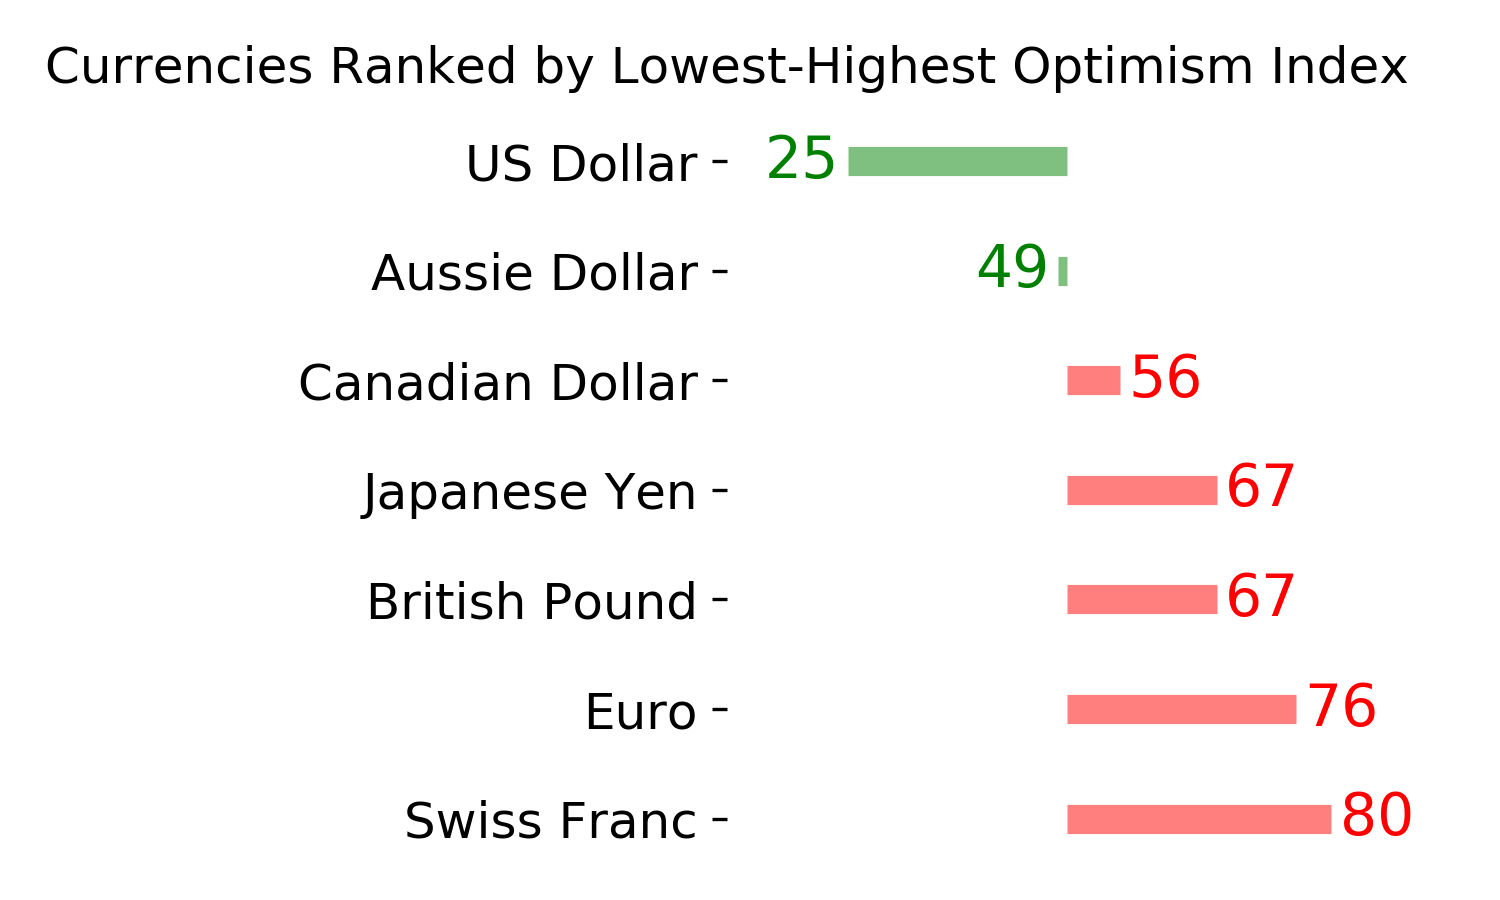
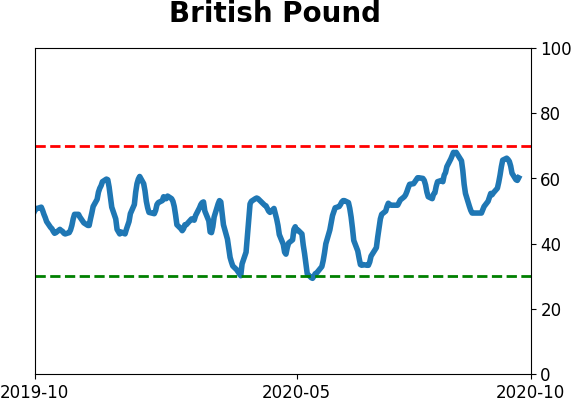
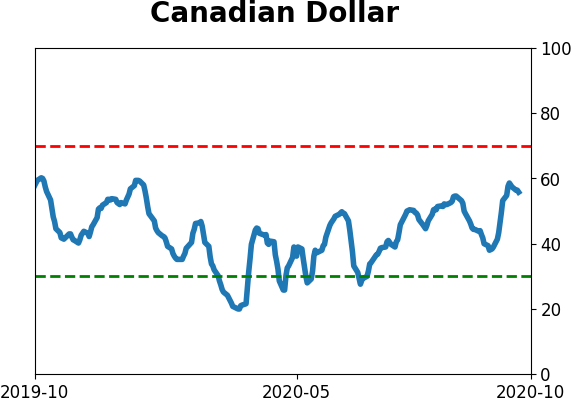
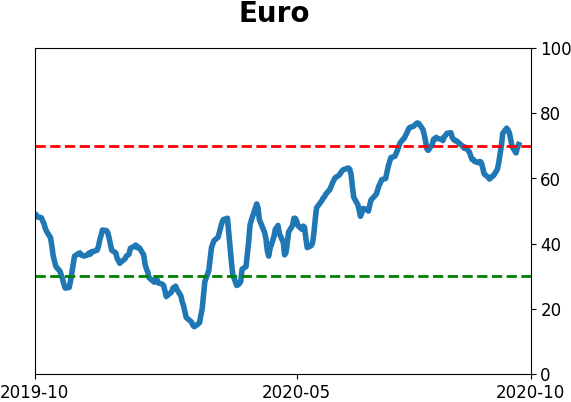
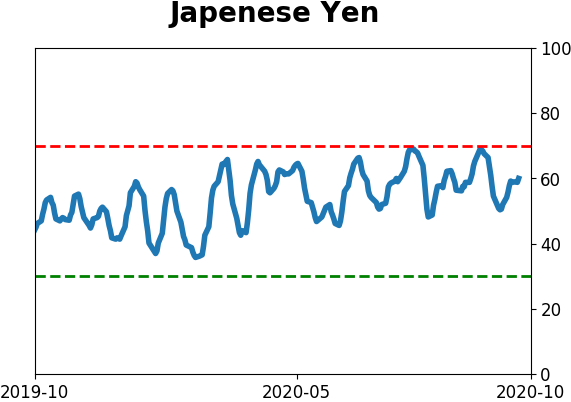
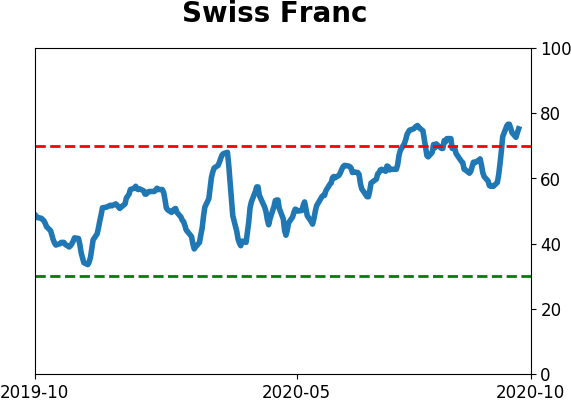
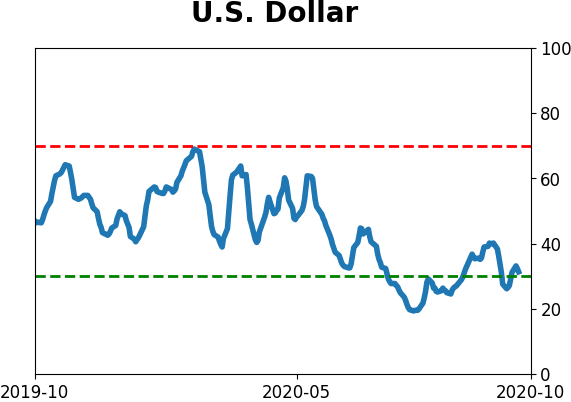
Currency ETF's - 5-Day Moving Average
|
|
|
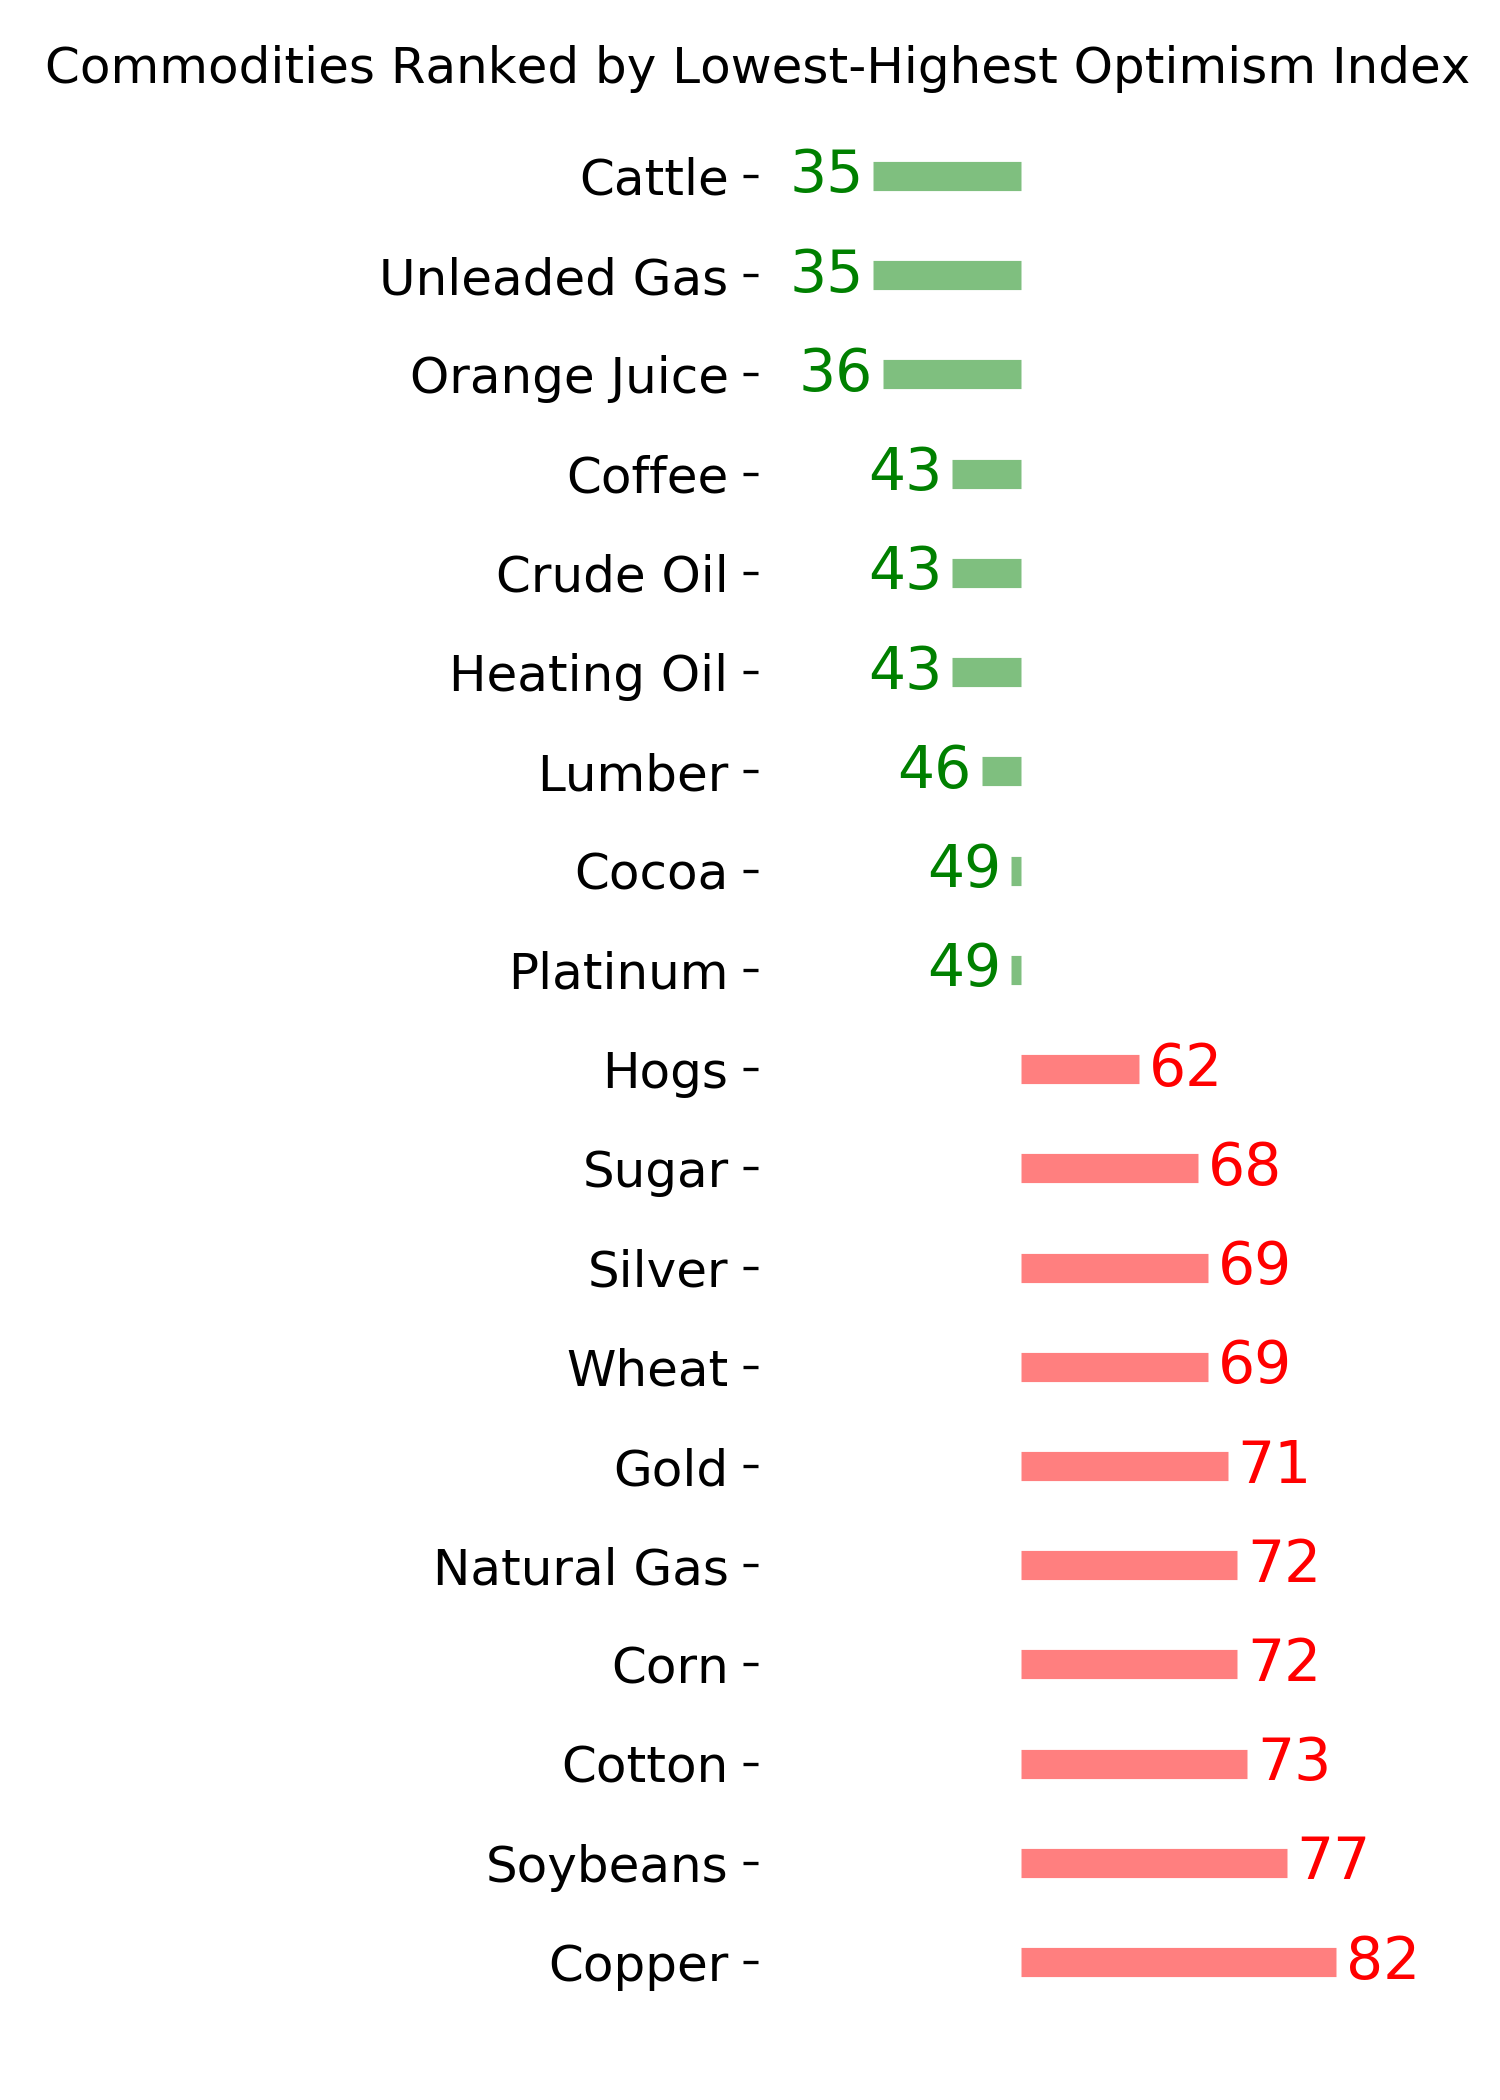
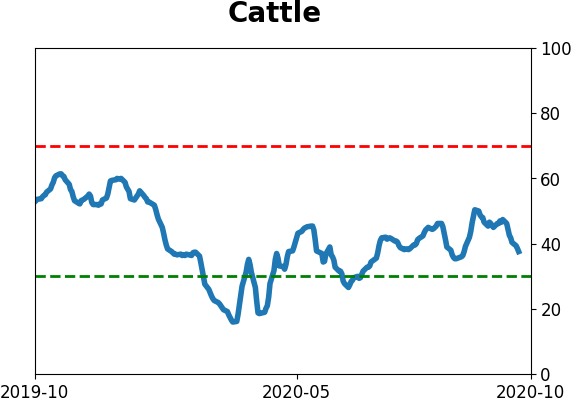
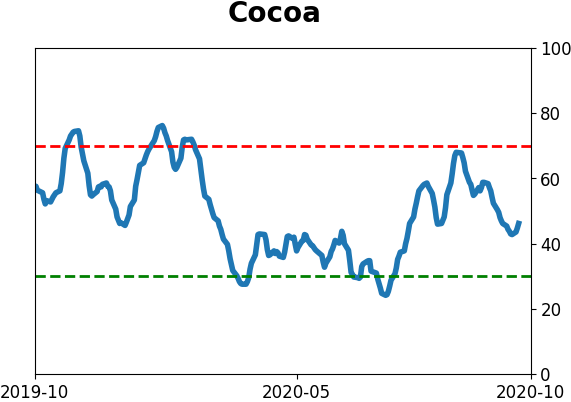
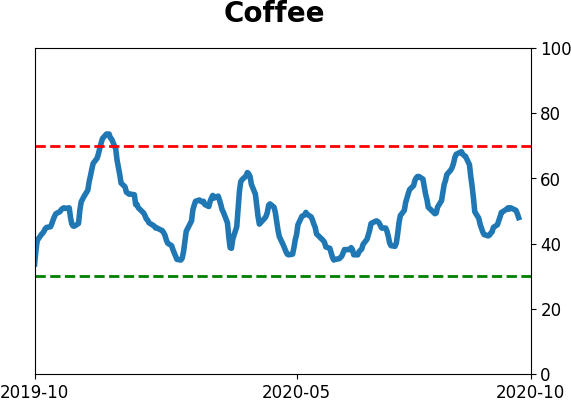
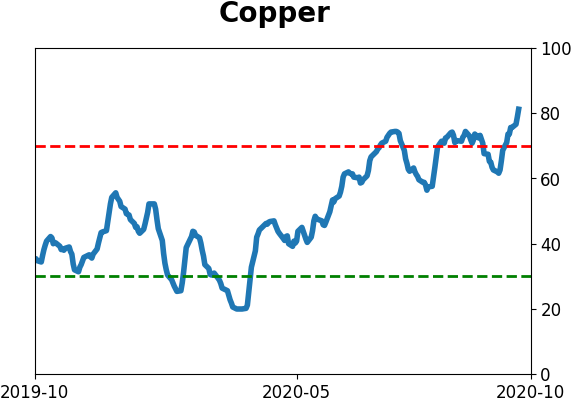
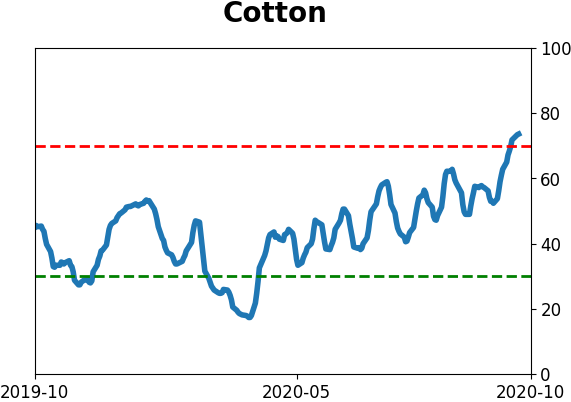
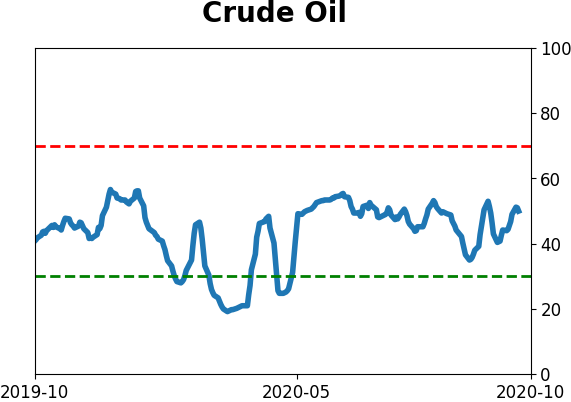
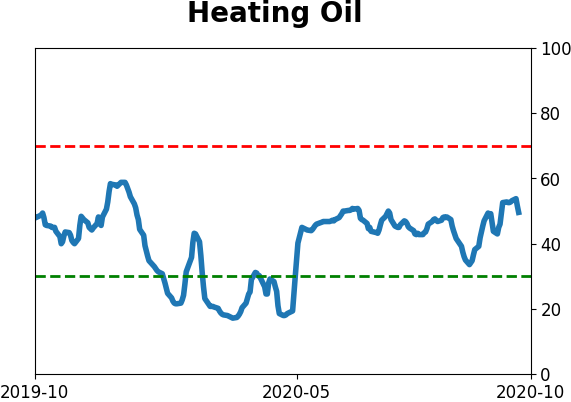
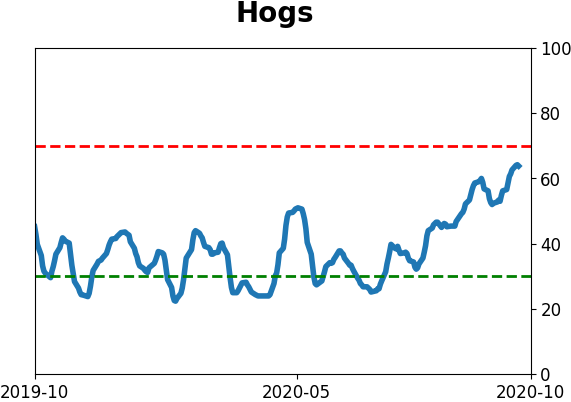
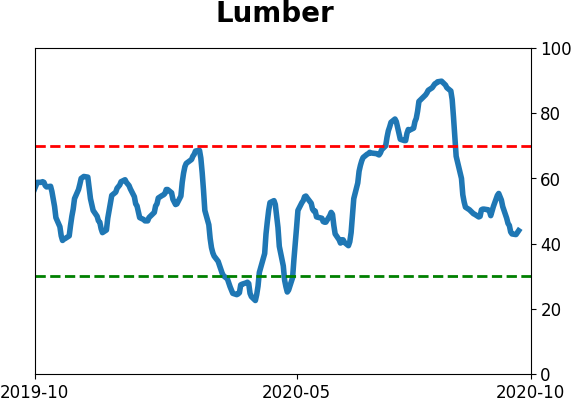
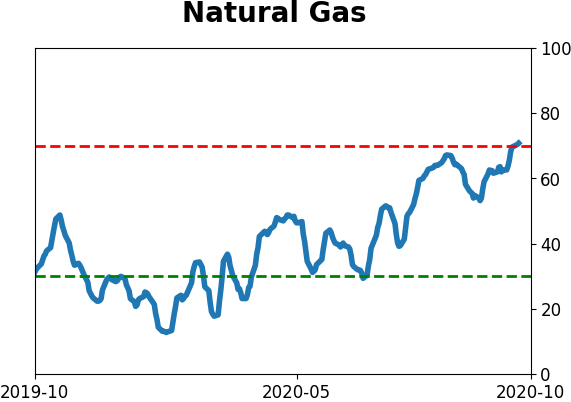
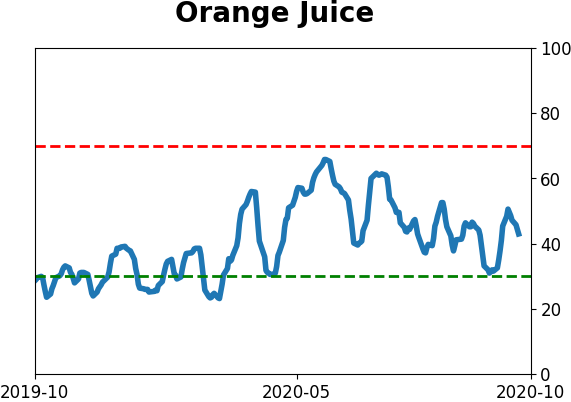
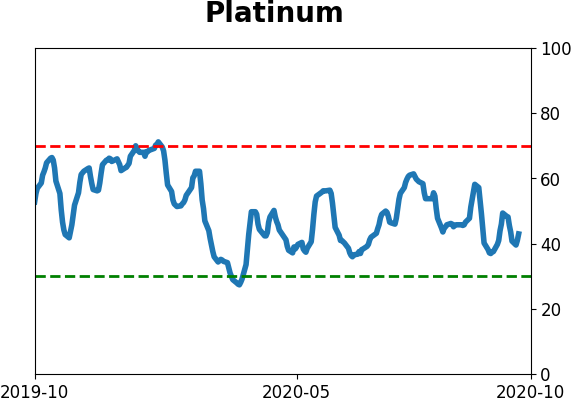
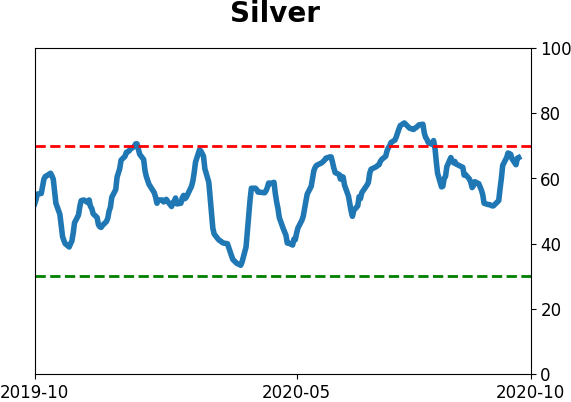
Commodity ETF's - 5-Day Moving Average
|
|