Headlines
|
|
Crude Oil Moving Average Trend Persistency:
Crude oil has now traded above its 10-day moving average for 21 consecutive days. Let's conduct a study to assess the forward return outlook for the commodity.
Bottom Line:
STOCKS: Weak buy
The speculative frenzy in February is wrung out. There are some signs of pessimism, but the most compelling data show that buyers consistently tend to return once the first signs of extreme momentum end, especially as we head into a seasonally positive time of year. See the Outlook & Allocations page for more. BONDS: Hold
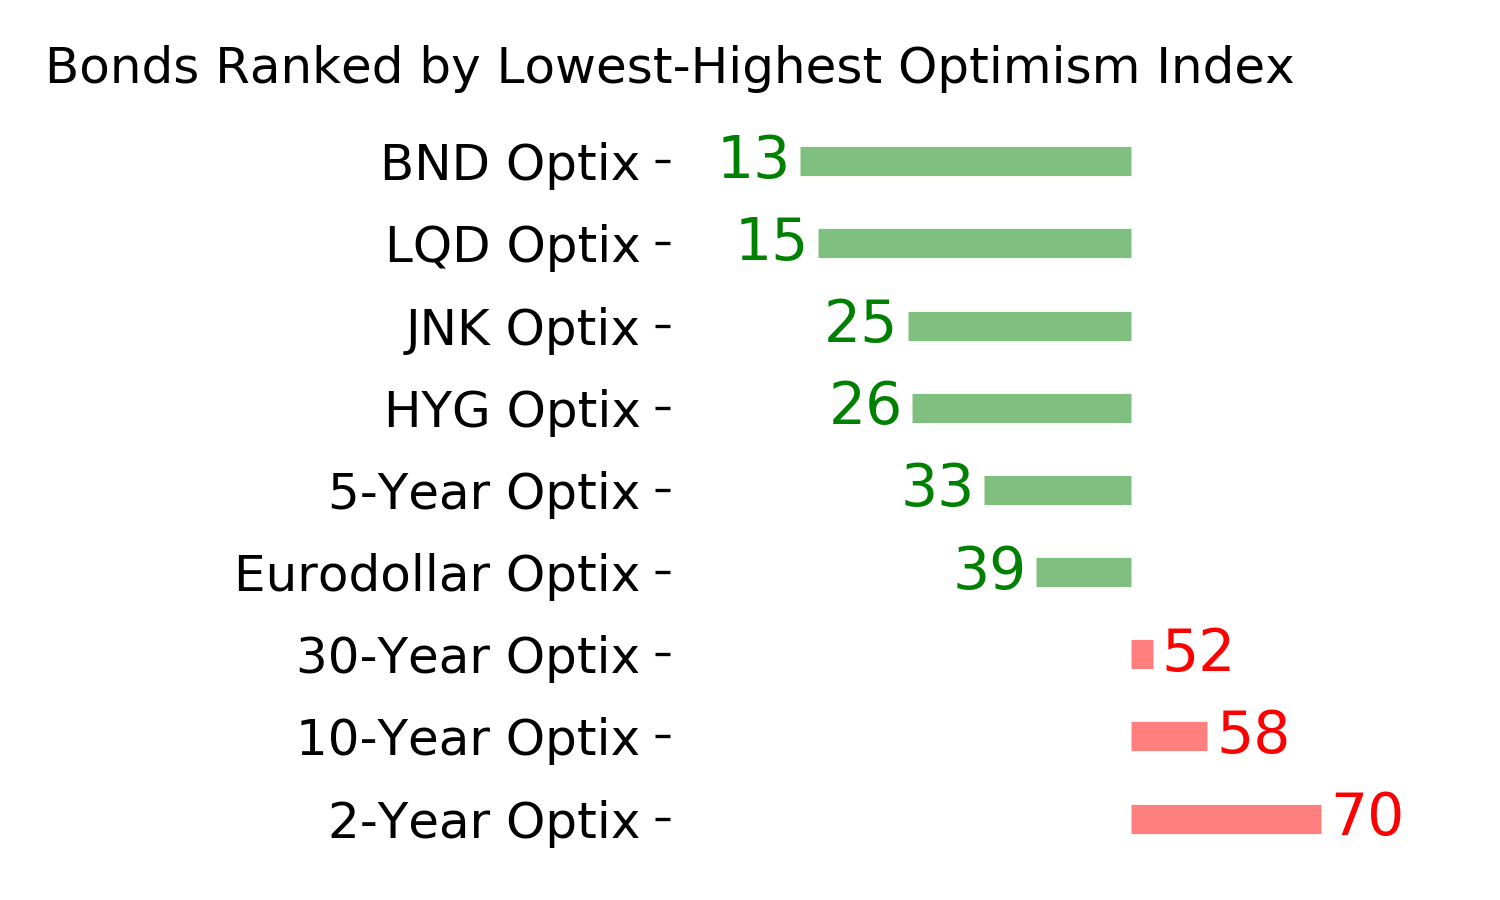
Various parts of the market got hit in March, with the lowest Bond Optimism Index we usually see during healthy environments. Bond prices have modest recovered and there is no edge among the data we follow. GOLD: Hold
Gold and miners were rejected after trying to recover above their 200-day averages in May. Lately, some medium-term (not long-term) oversold extremes in breadth measures among miners have triggered.
|
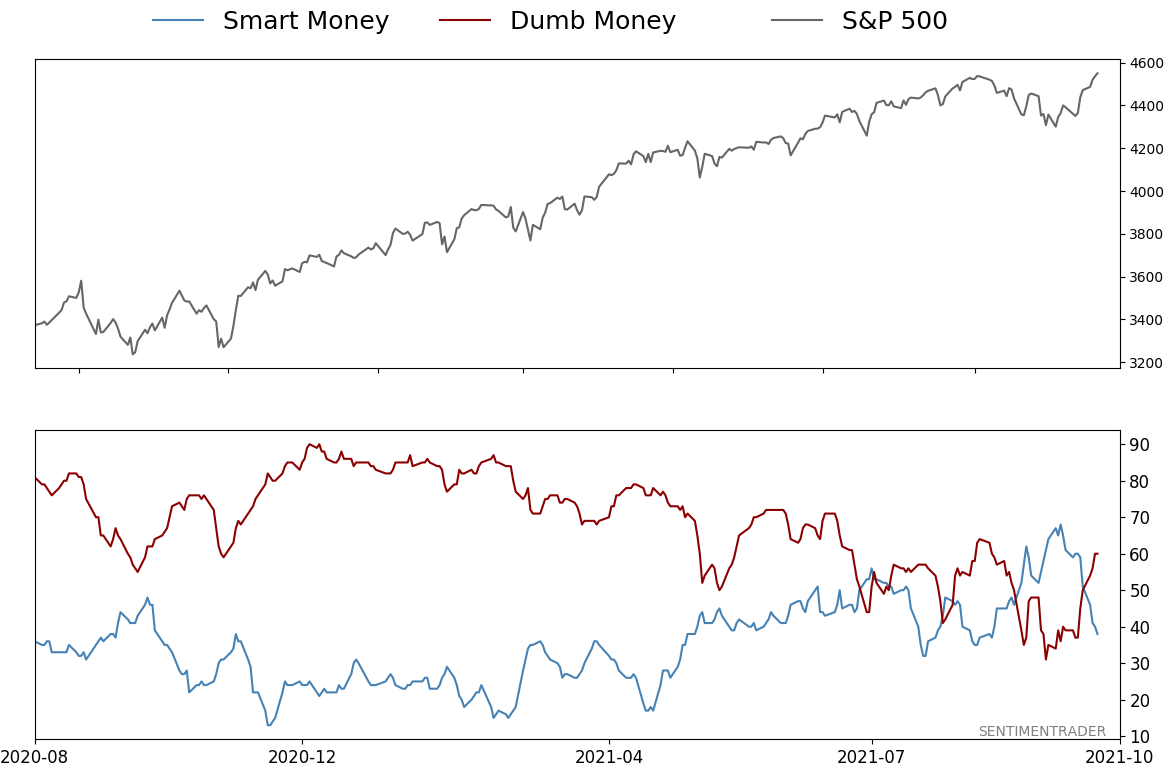
Smart / Dumb Money Confidence
|
Smart Money Confidence: 38%
Dumb Money Confidence: 60%
|
|
Risk Levels
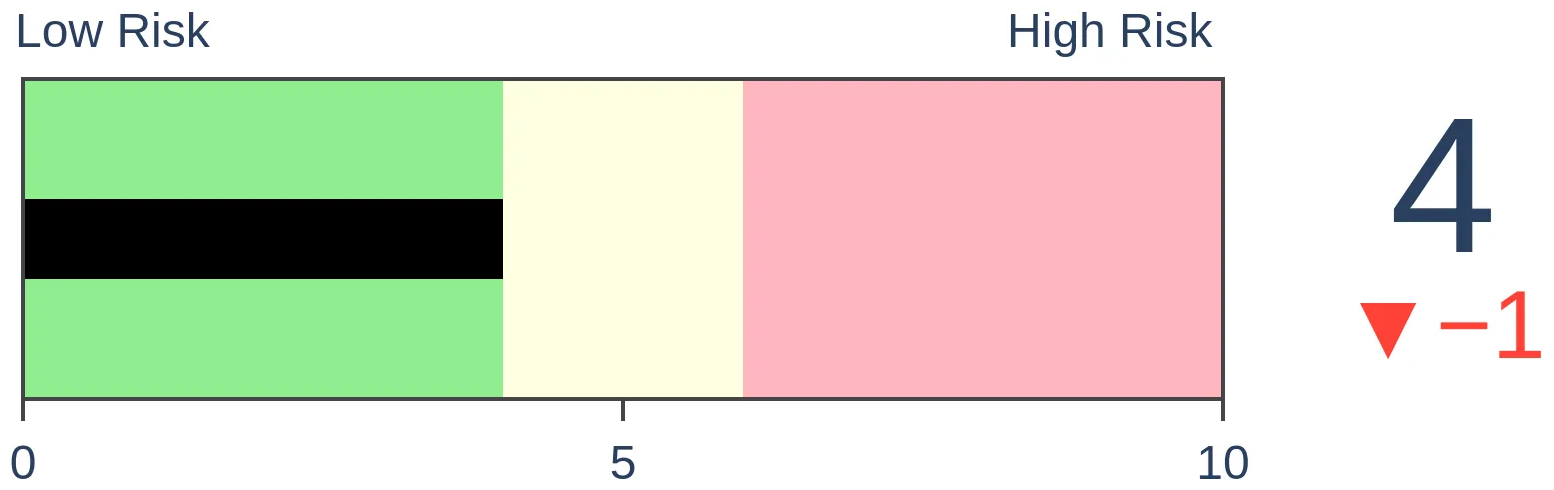
Stocks Short-Term
|
Stocks Medium-Term
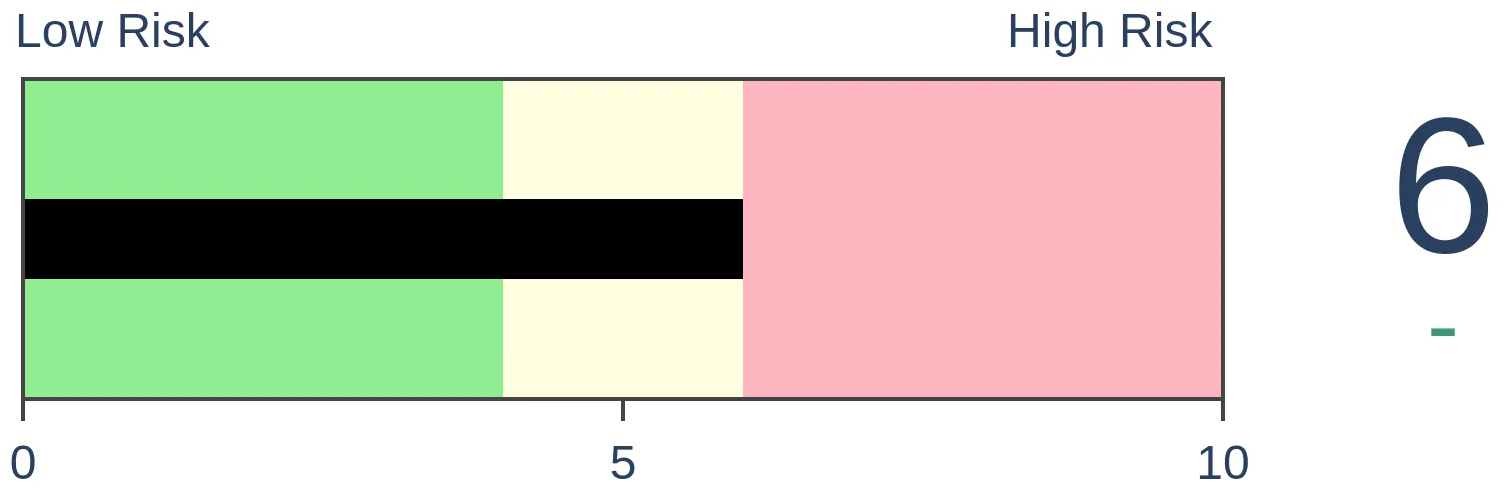
|
|
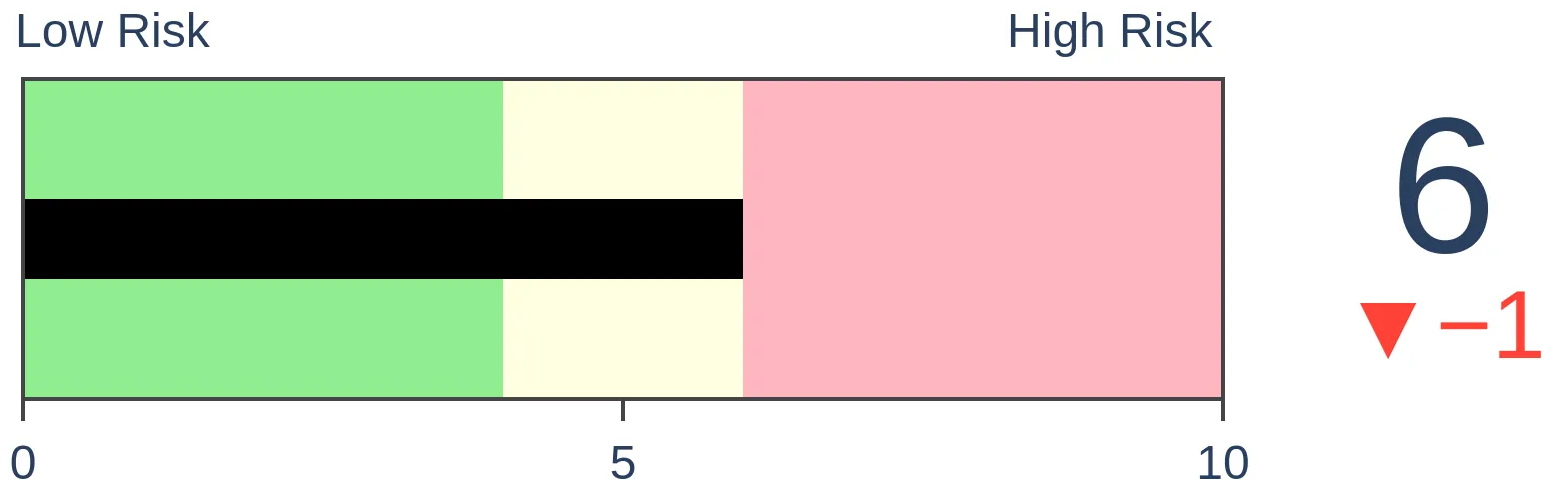
Bonds
|
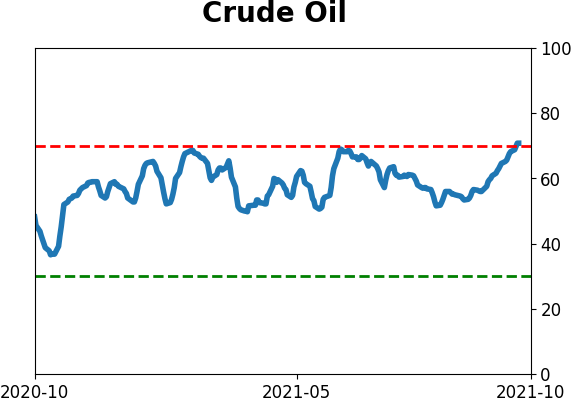
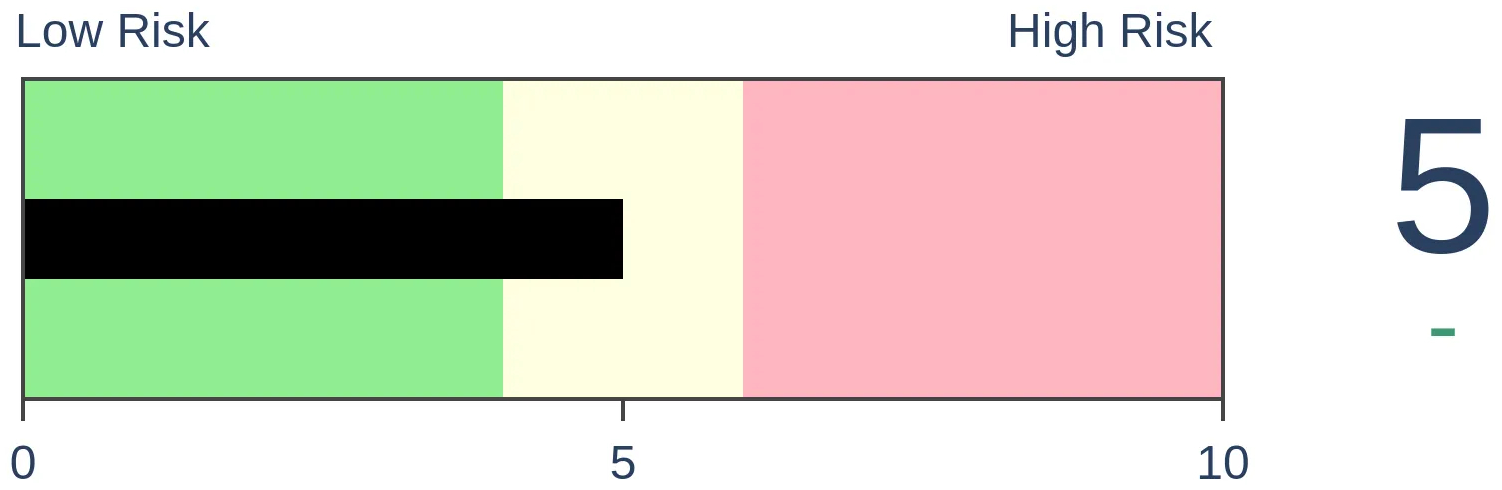
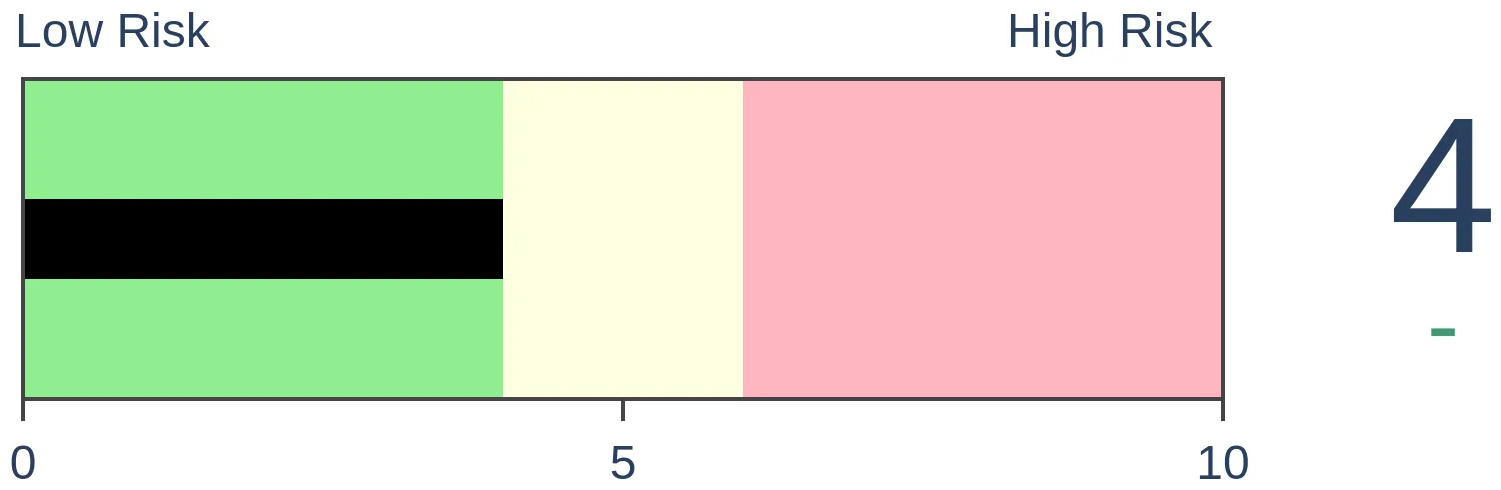
Crude Oil
|
|
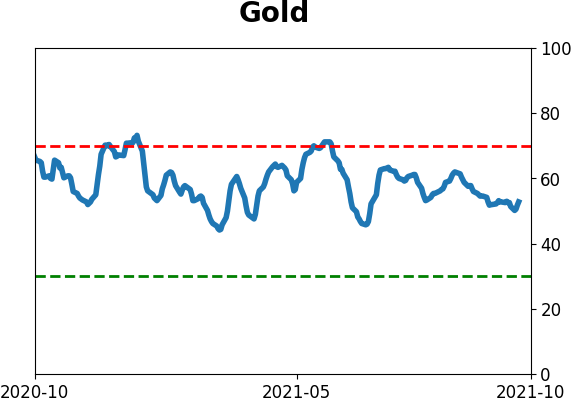
Gold
|
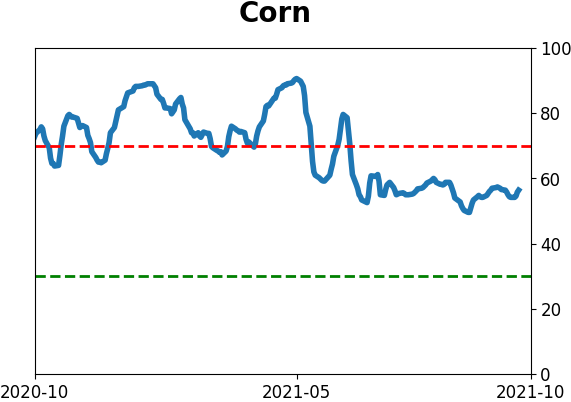
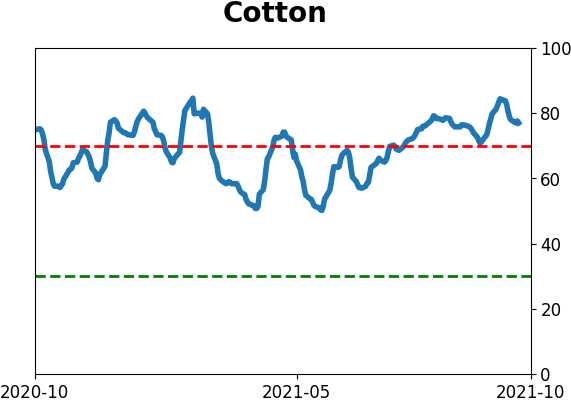
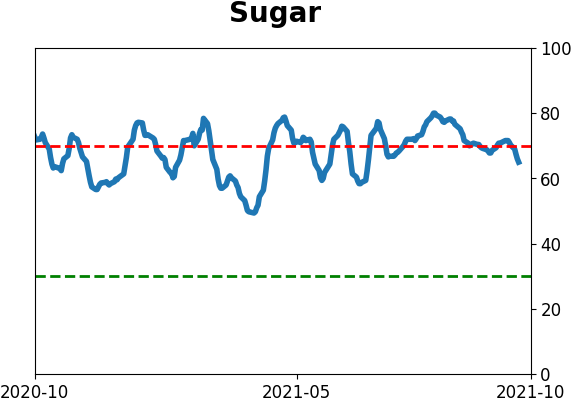
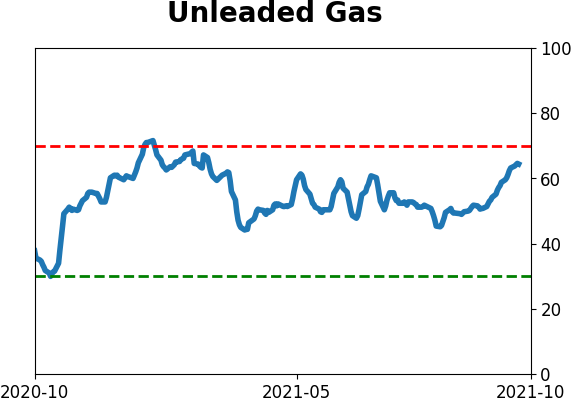
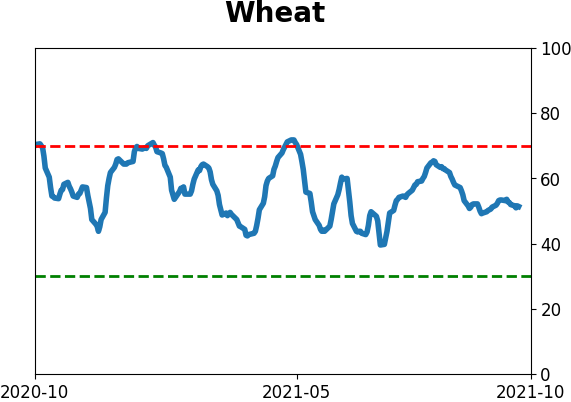
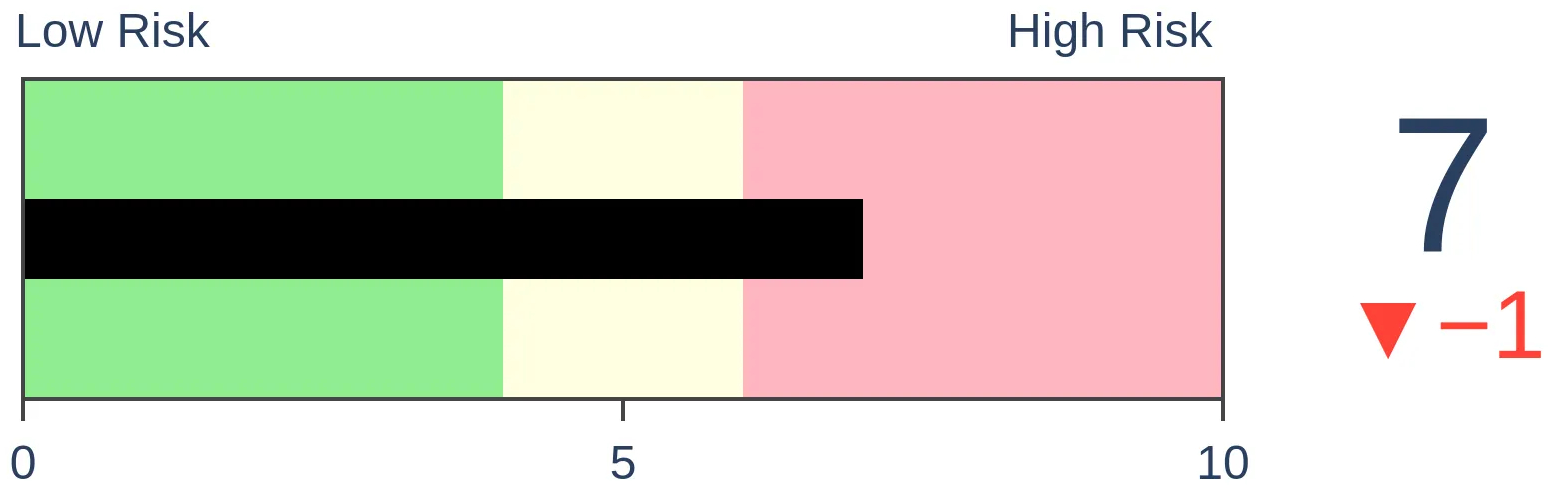
Agriculture
|
|
Research
By Dean Christians
BOTTOM LINE
Crude oil has now traded above its 10-day moving average for 21 consecutive days. Let's conduct a study to assess the forward return outlook for the commodity.
FORECAST / TIMEFRAME
None
|
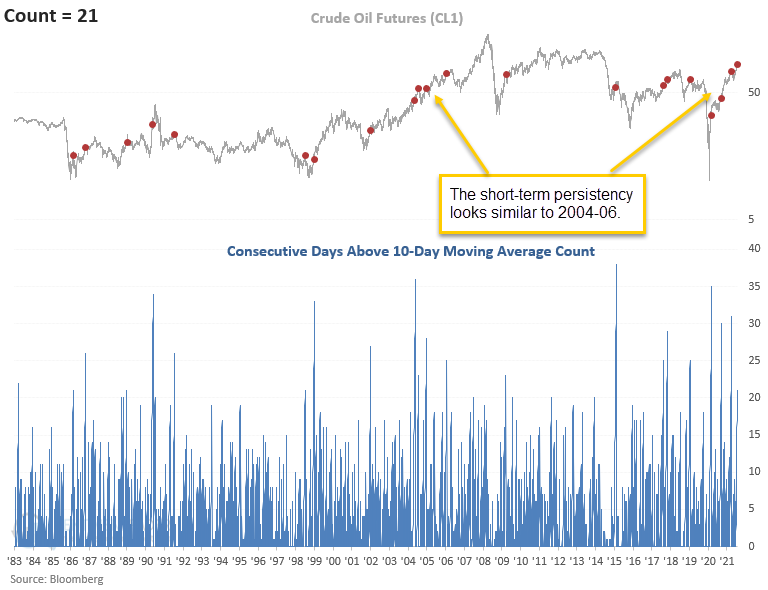
Crude oil has now closed above its respective 10-day moving average for 21 consecutive days as of the close on 10/20/21. If we glance at the chart below, you will notice that the count has now surpassed 21 days, a total of four times since May 2020. The commodity's ability to sustain above its short-term moving average looks similar to the period between 2004-06, the last secular bull.
Let's conduct a study to assess the forward return outlook for crude oil when the commodity trades above its 10-day moving average for 21 consecutive days.
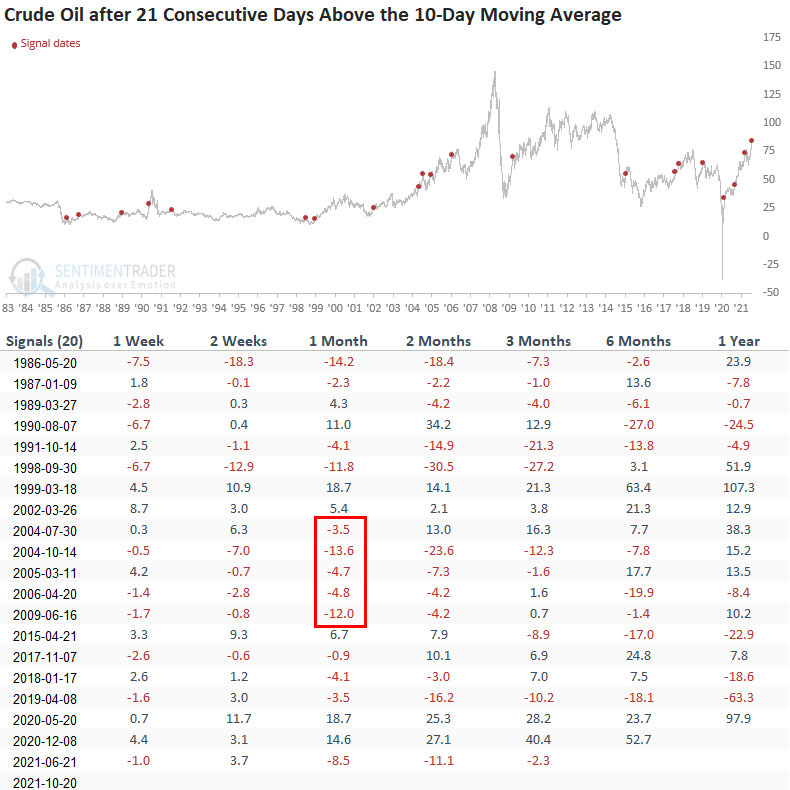
HISTORICAL CHART
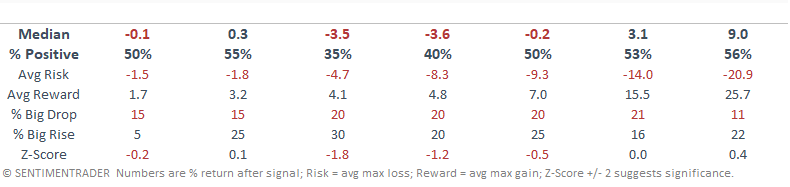
HOW THE SIGNALS PERFORMED
The short to intermediate-term results look weak when compared to historical averages. I would note that the risk/reward profile for the 1-month time frame looks unfavorable, and the negative instances in that window between 2004-06, a secular bull period. Remember, corrections in bull markets should be expected.
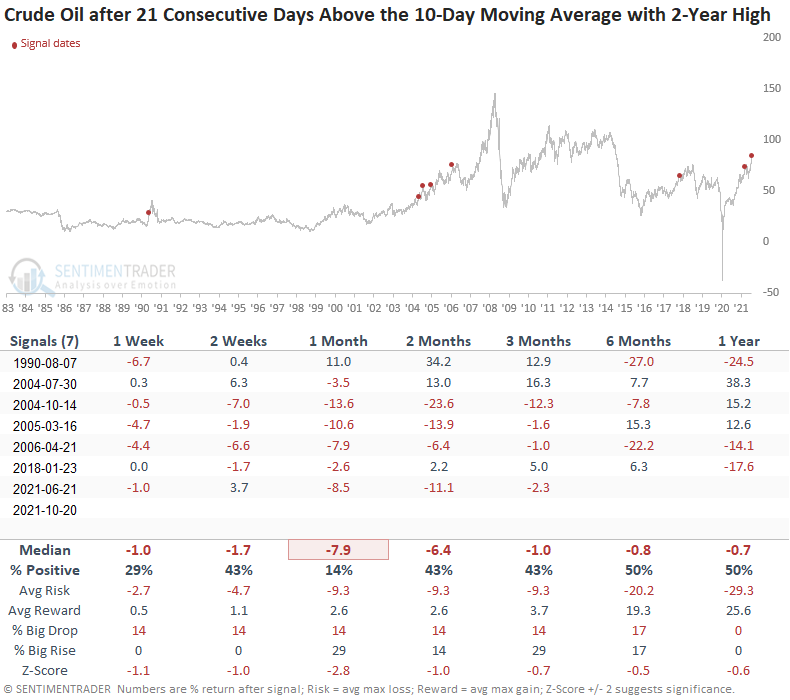
Let's add some context to the study. I will now isolate historical instances when the count reached 21 consecutive days above the 10-day moving average, and crude oil closed at a 2-year high. The new condition will identify cases similar to the most recent signal.
HOW THE SIGNALS PERFORMED
While the sample size is small, results look weak across all time frames, especially the 1-month window. And, I would call your attention to the performance of the previous signal on 6/21/21.
Suppose we modify the moving average duration for the study from 10 days to 200 days. In that case, we see that the count has now reached 248 consecutive days above the average. Historically, a count of this magnitude is associated with cyclical and secular bull markets for the commodity.
Let's conduct a study to assess the outlook for crude oil prices when the commodity closes above its respective 200-day moving average for 240 days. I lowered the threshold to 240 days to include the 2010 instance.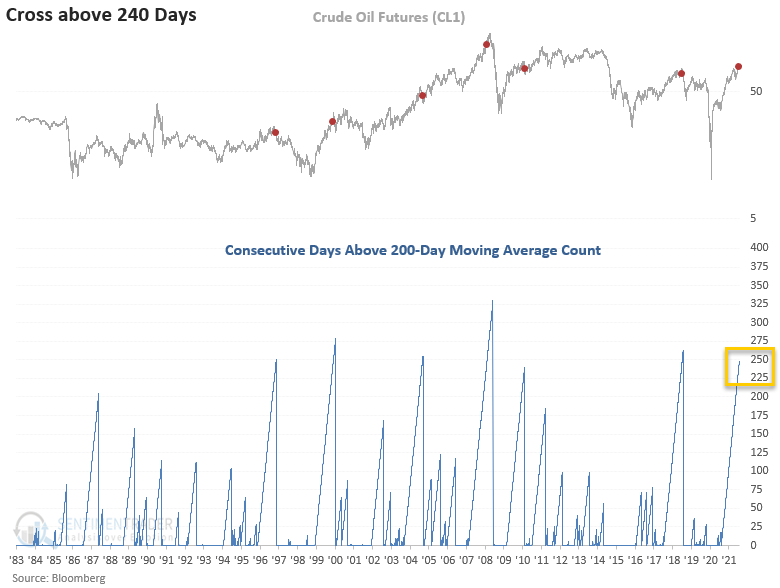
HOW THE SIGNALS PERFORMED
The study suggests that crude oil could continue higher in the short term. However, the one and two-month time frames indicate a correction could be on the horizon.
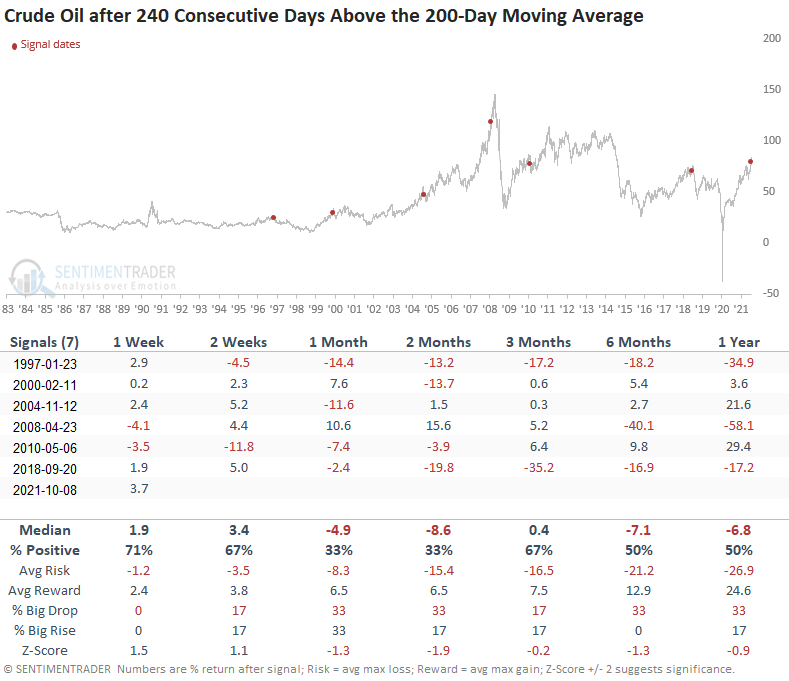
With crude oil price trends extended on a short and long-term basis, we should be on alert for a potential correction within an ongoing bull market.
Active Studies
| Time Frame | Bullish | Bearish | | Short-Term | 1 | 0 | | Medium-Term | 7 | 0 | | Long-Term | 11 | 5 |
|
Indicators at Extremes
Portfolio
| Position | Description | Weight % | Added / Reduced | Date | | Stocks | RSP | 10.5 | Added 6.4% | 2021-10-01 | | Bonds | 23.9% BND, 6.9% SCHP | 31.5 | Reduced 7.1% | 2021-05-19 | | Commodities | GCC | 2.6 | Reduced 2.1%
| 2020-09-04 | | Precious Metals | GDX | 4.2 | Reduced 4.2% | 2021-05-19 | | Special Situations | 9.8% KWEB, 4.7% XLE, 2.9% PSCE | 17.3 | Added 9.78% | 2021-10-01 | | Cash | | 34.0 | | |
|
Updates (Changes made today are underlined)
Much of our momentum and trend work has remained positive for several months, with some scattered exceptions. Almost all sentiment-related work has shown a poor risk/reward ratio for stocks, especially as speculation drove to record highs in exuberance in February. Much of that has worn off, and most of our models are back toward neutral levels. There isn't much to be excited about here. The same goes for bonds and even gold. Gold has been performing well lately and is back above long-term trend lines. The issue is that it has a poor record of holding onto gains when attempting a long-term trend change like this, so we'll take a wait-and-see approach. Momentum has ebbed quickly in recent weeks, and nearing oversold levels in some indicators. This can be a dangerous area, with a lot of short-term volatility, but we'd be more inclined to add medium- to long-term exposure rather than sell on much more of a decline, thanks to already rock-bottom exposure. Other areas look more attractive, including some overseas markets. RETURN YTD: 11.8% 2020: 8.1%, 2019: 12.6%, 2018: 0.6%, 2017: 3.8%, 2016: 17.1%, 2015: 9.2%, 2014: 14.5%, 2013: 2.2%, 2012: 10.8%, 2011: 16.5%, 2010: 15.3%, 2009: 23.9%, 2008: 16.2%, 2007: 7.8%
|
|
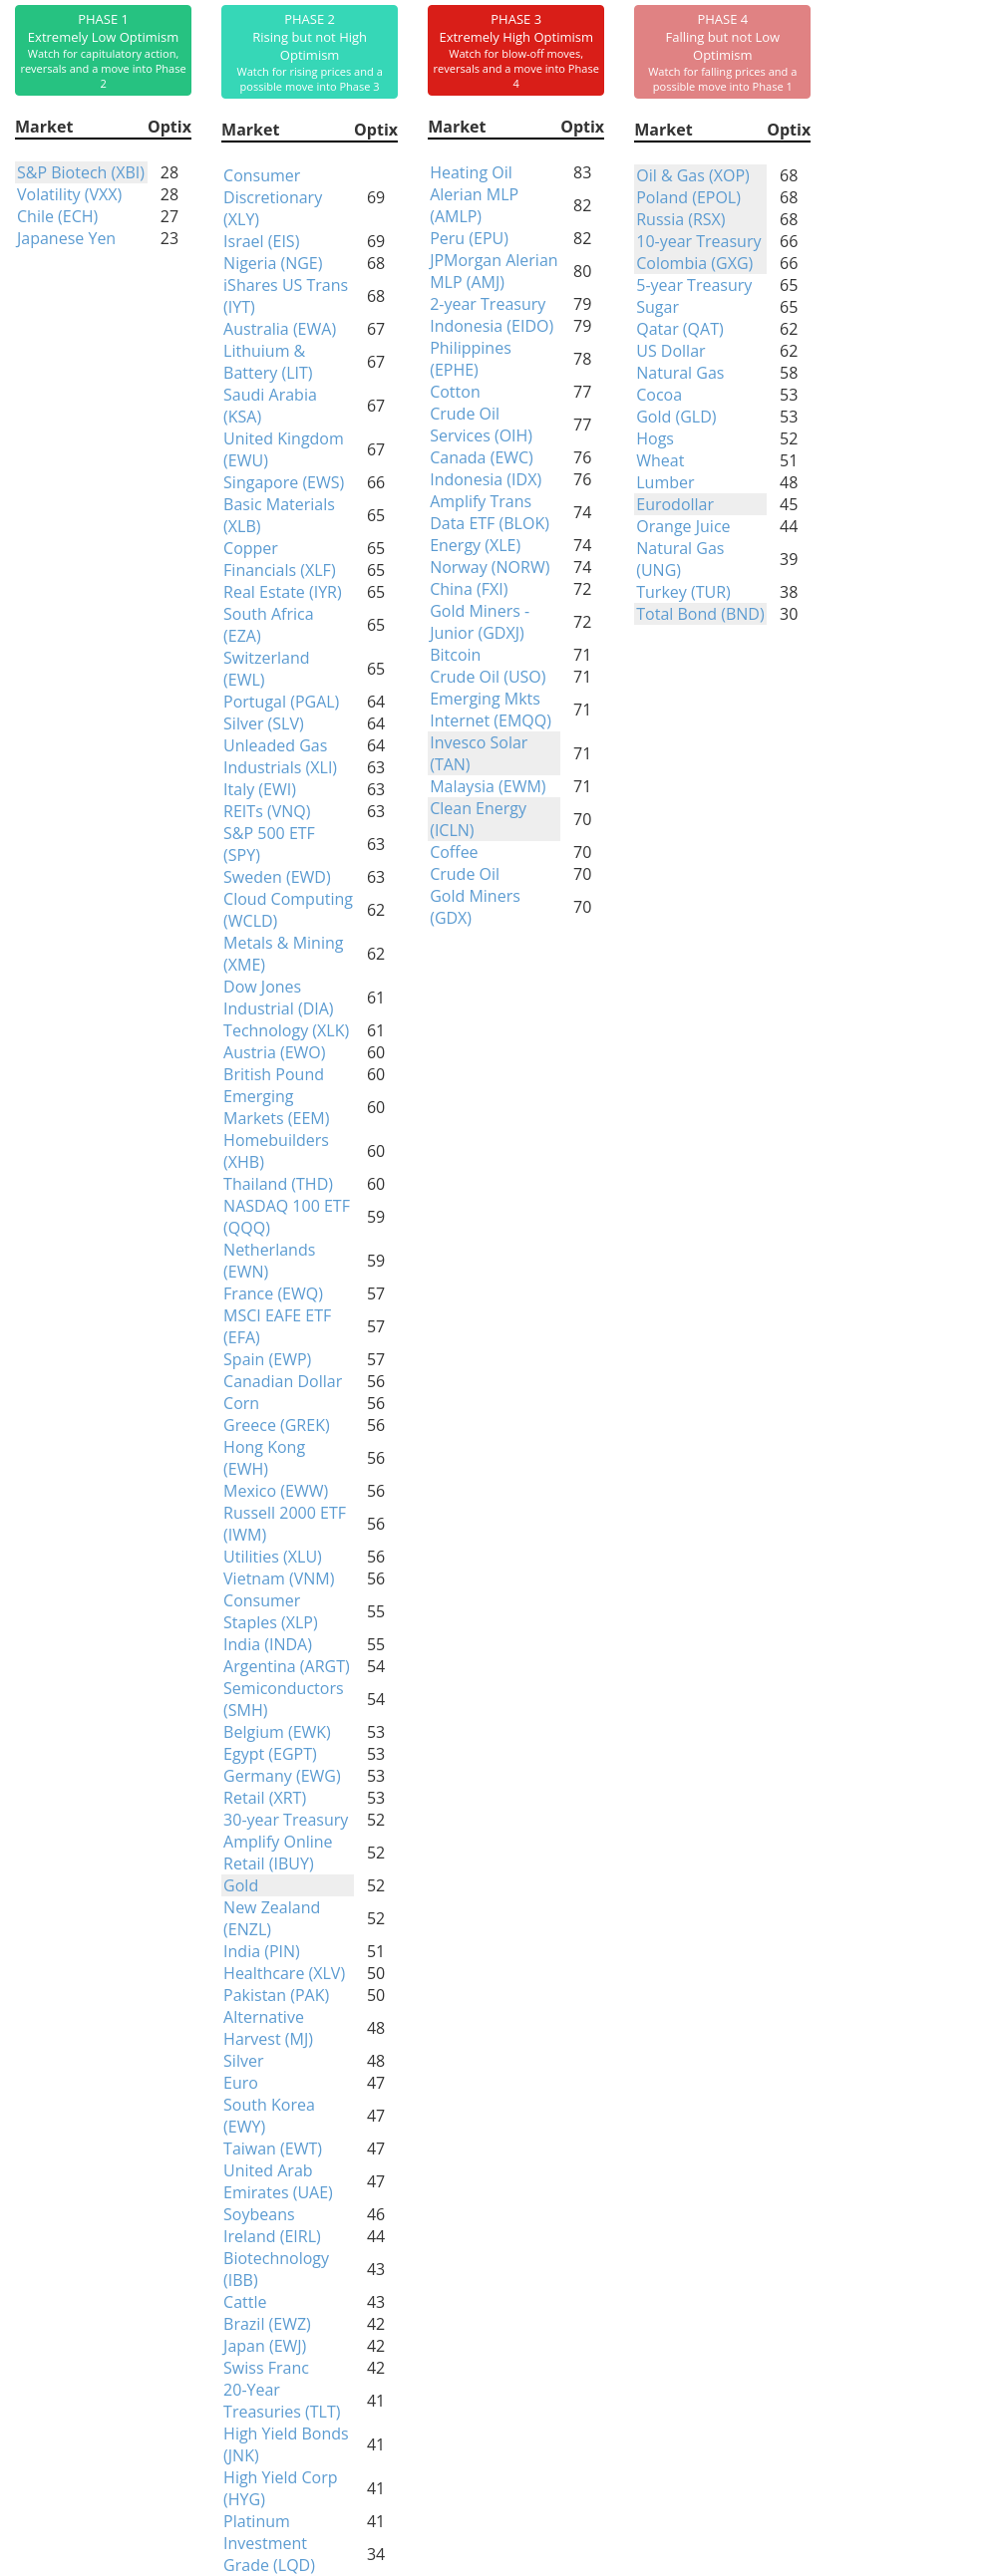
Phase Table
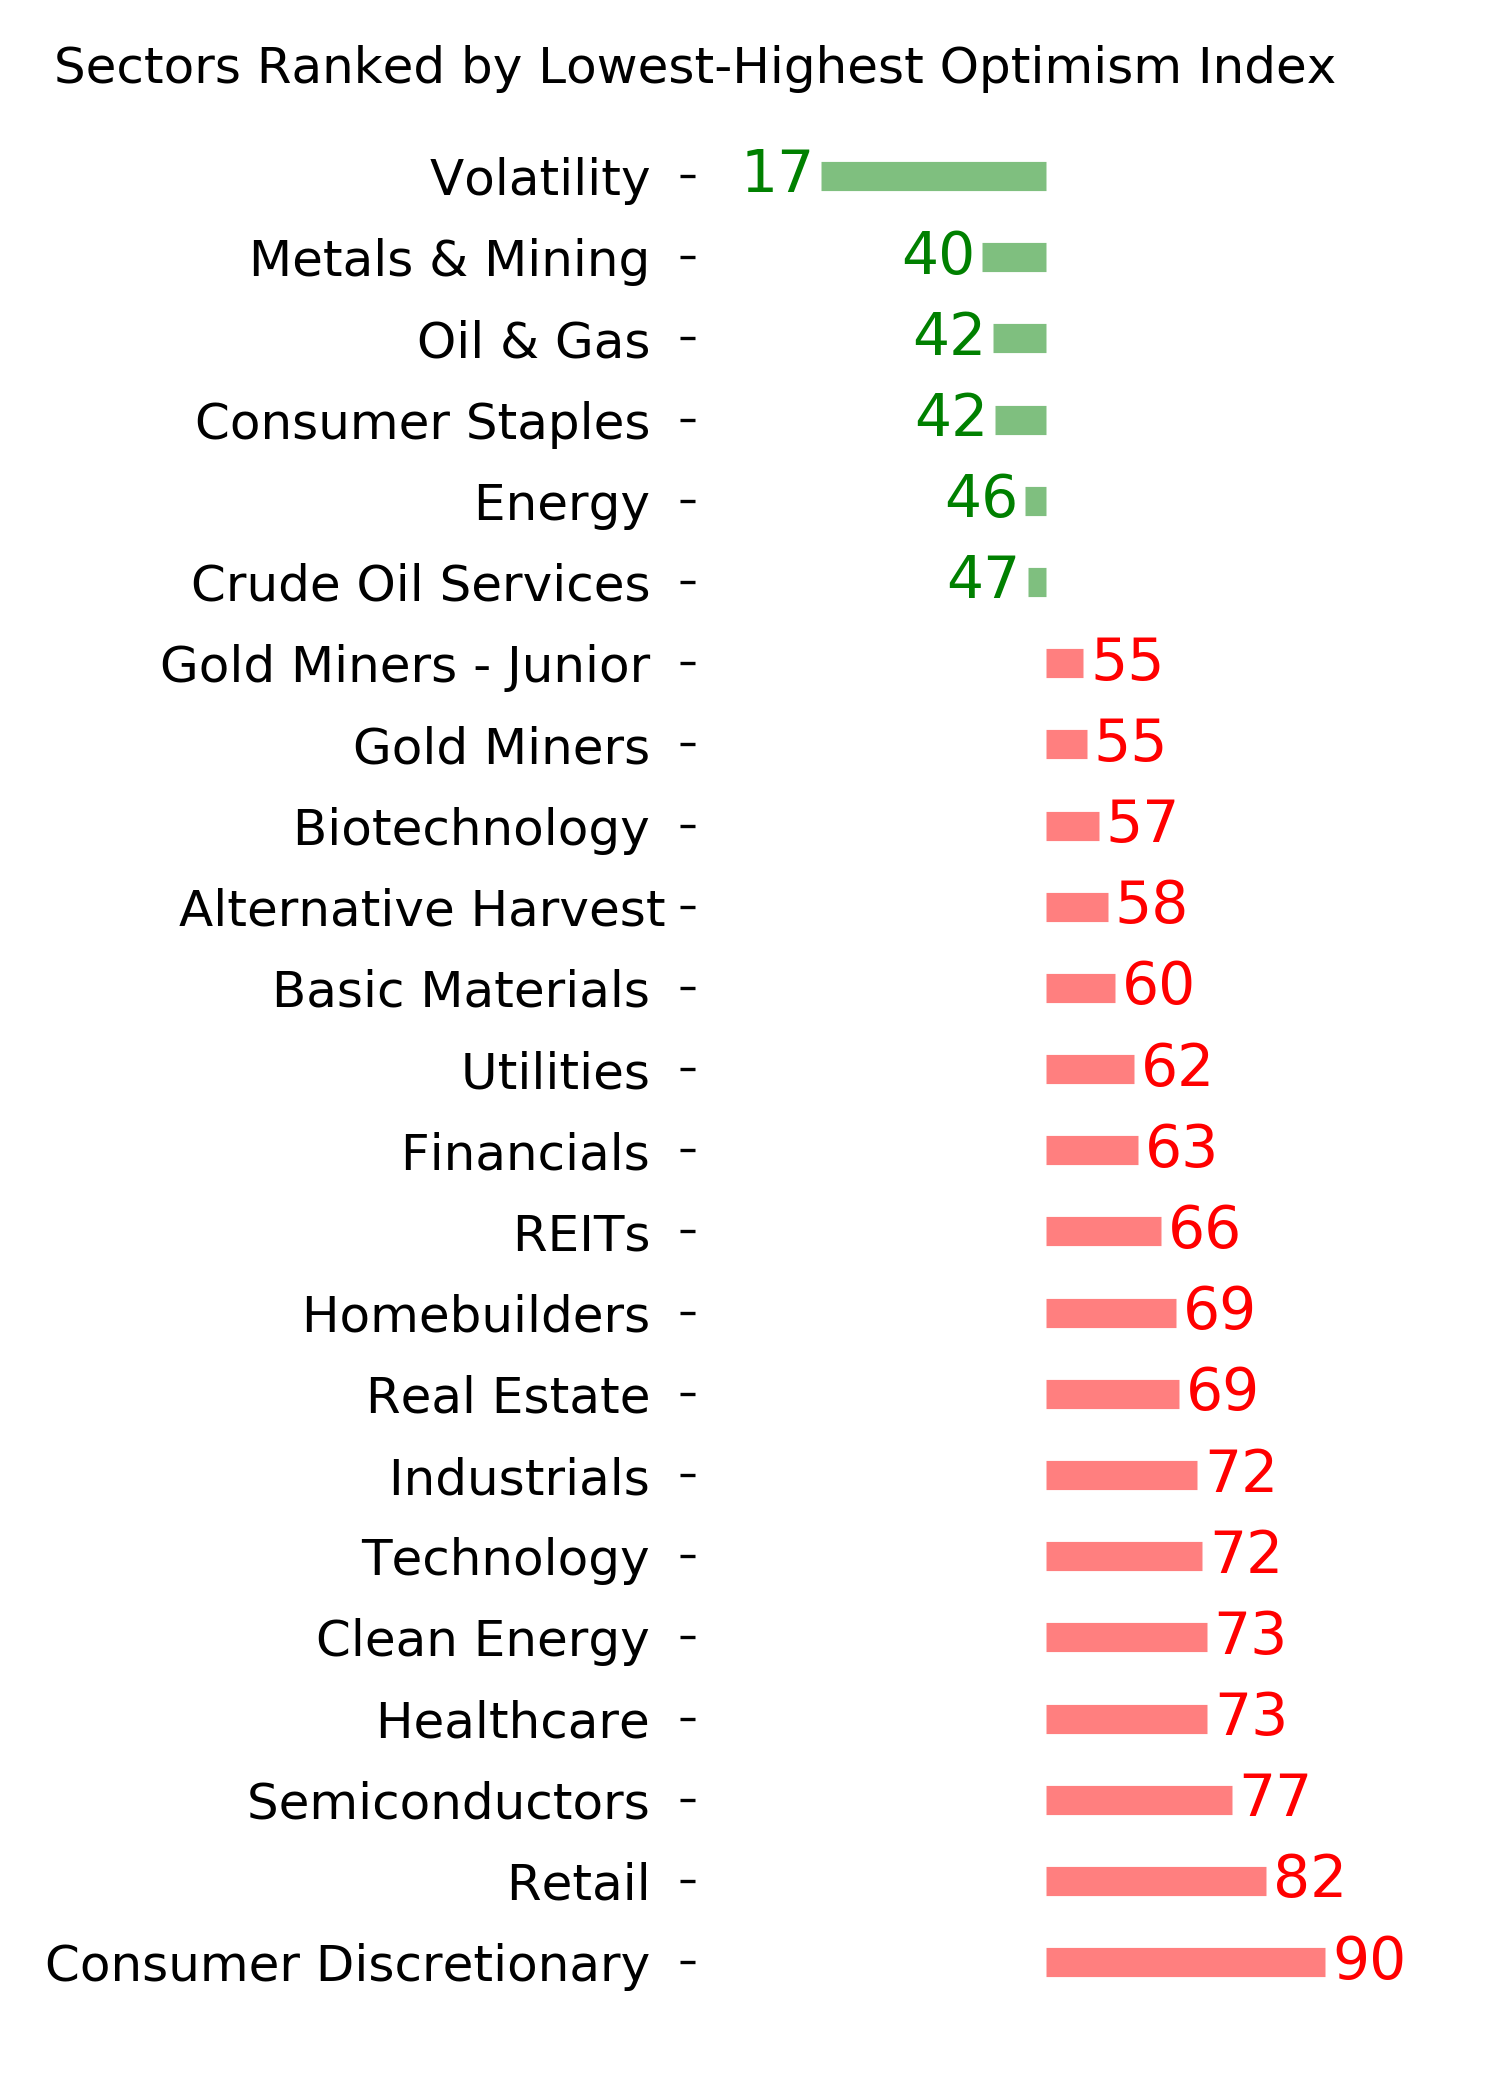
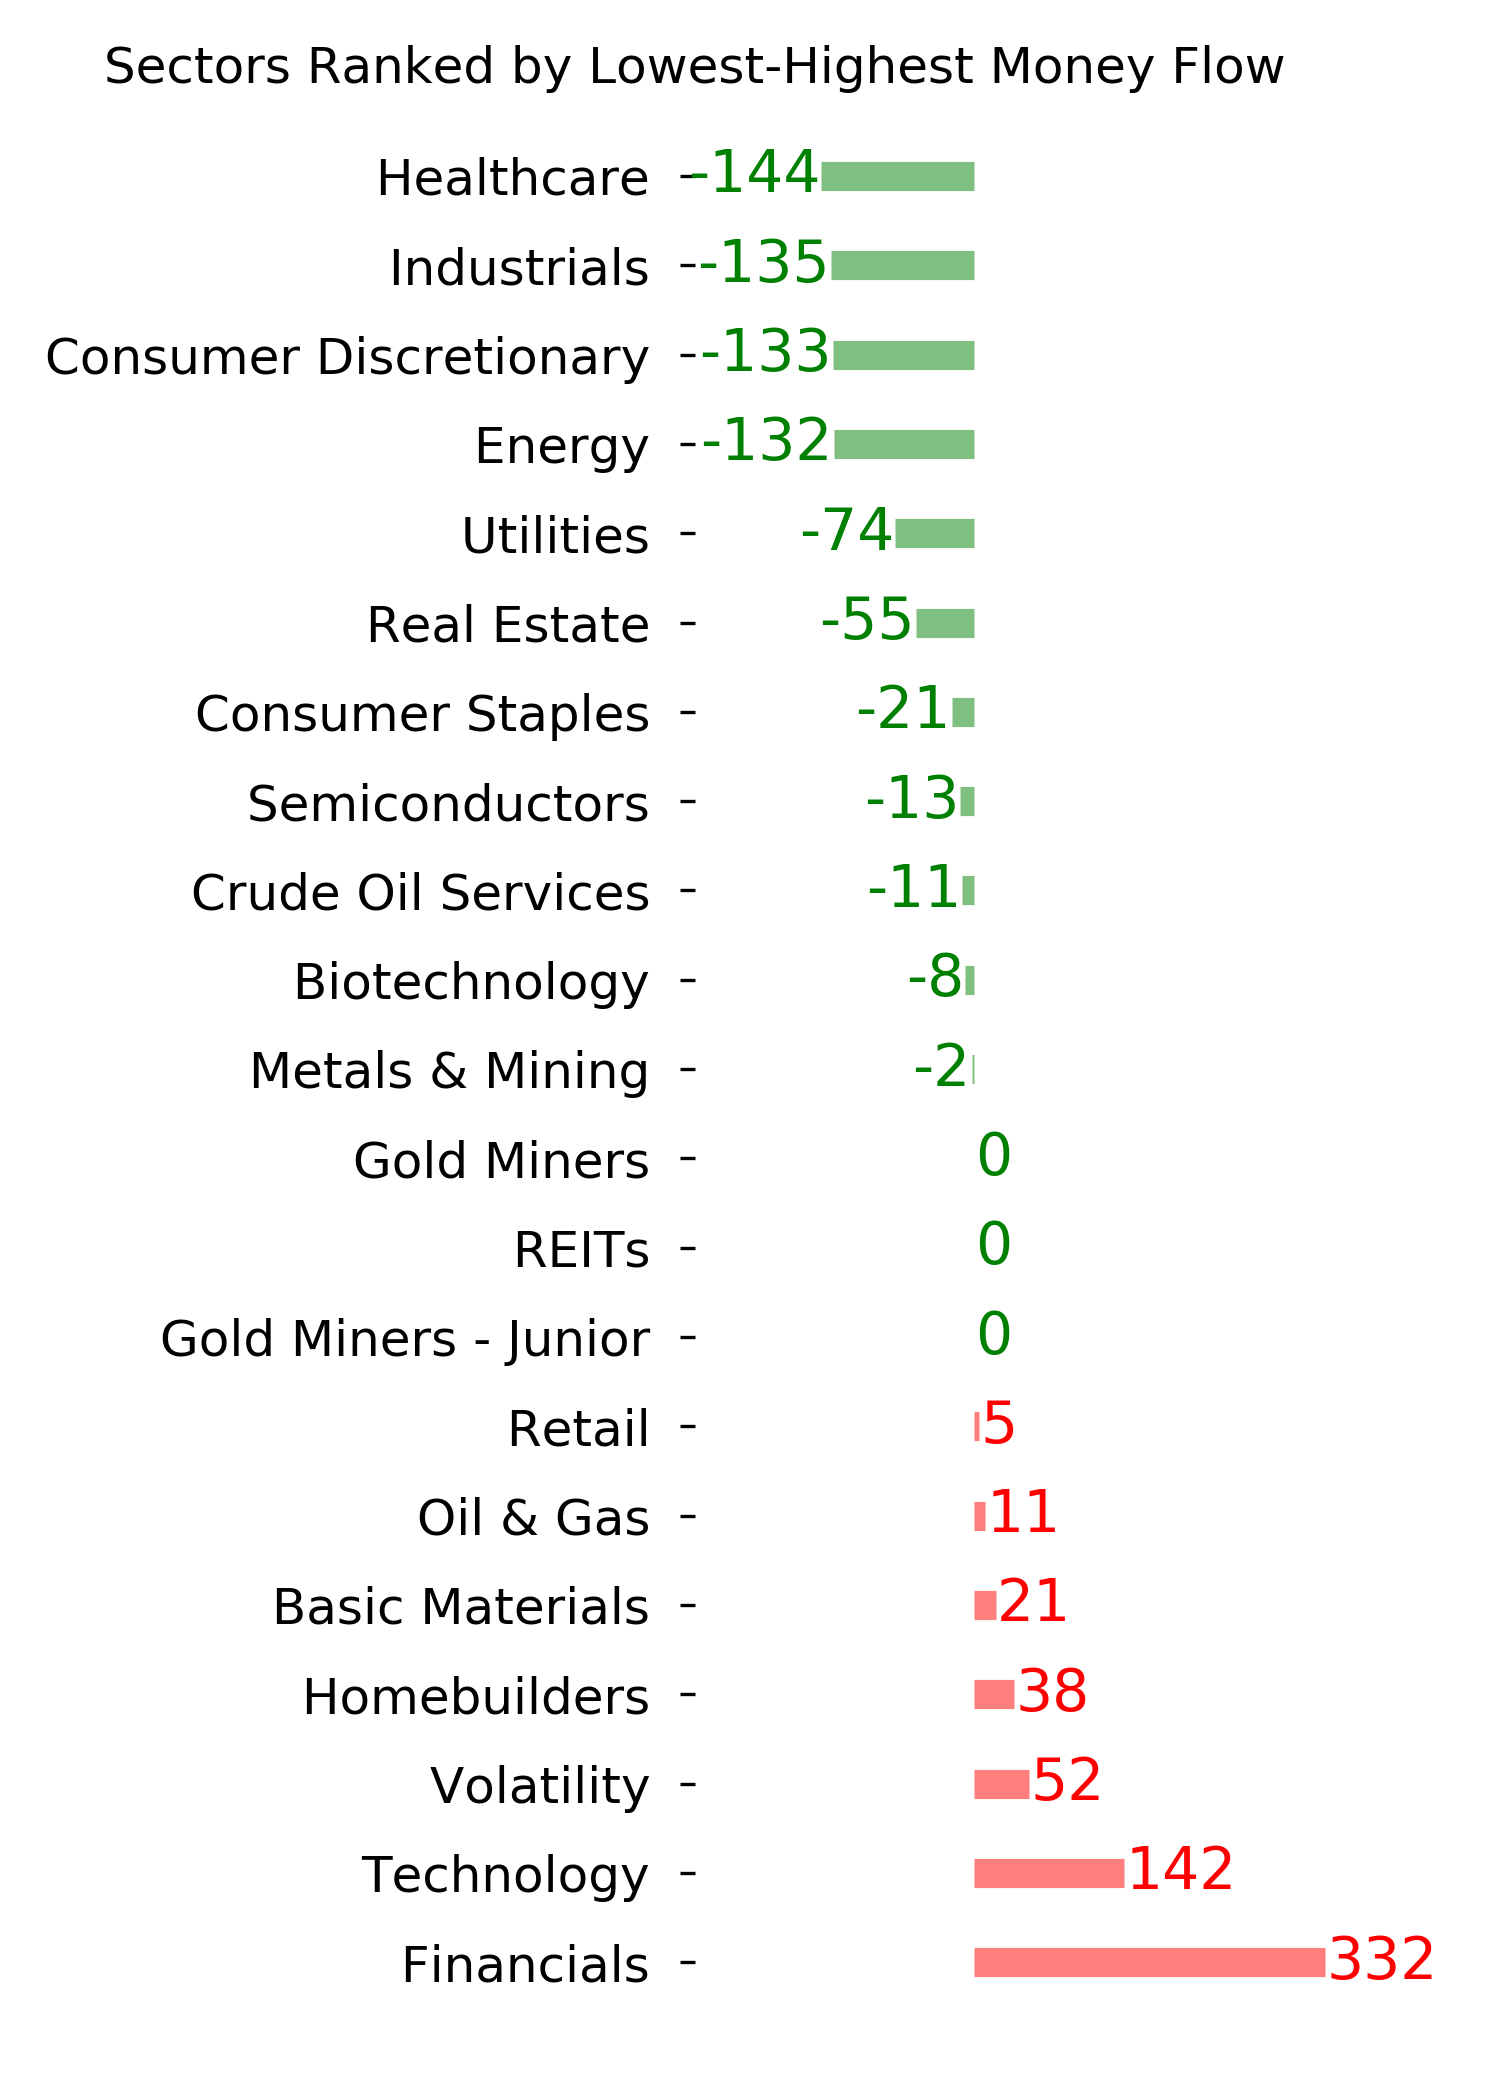
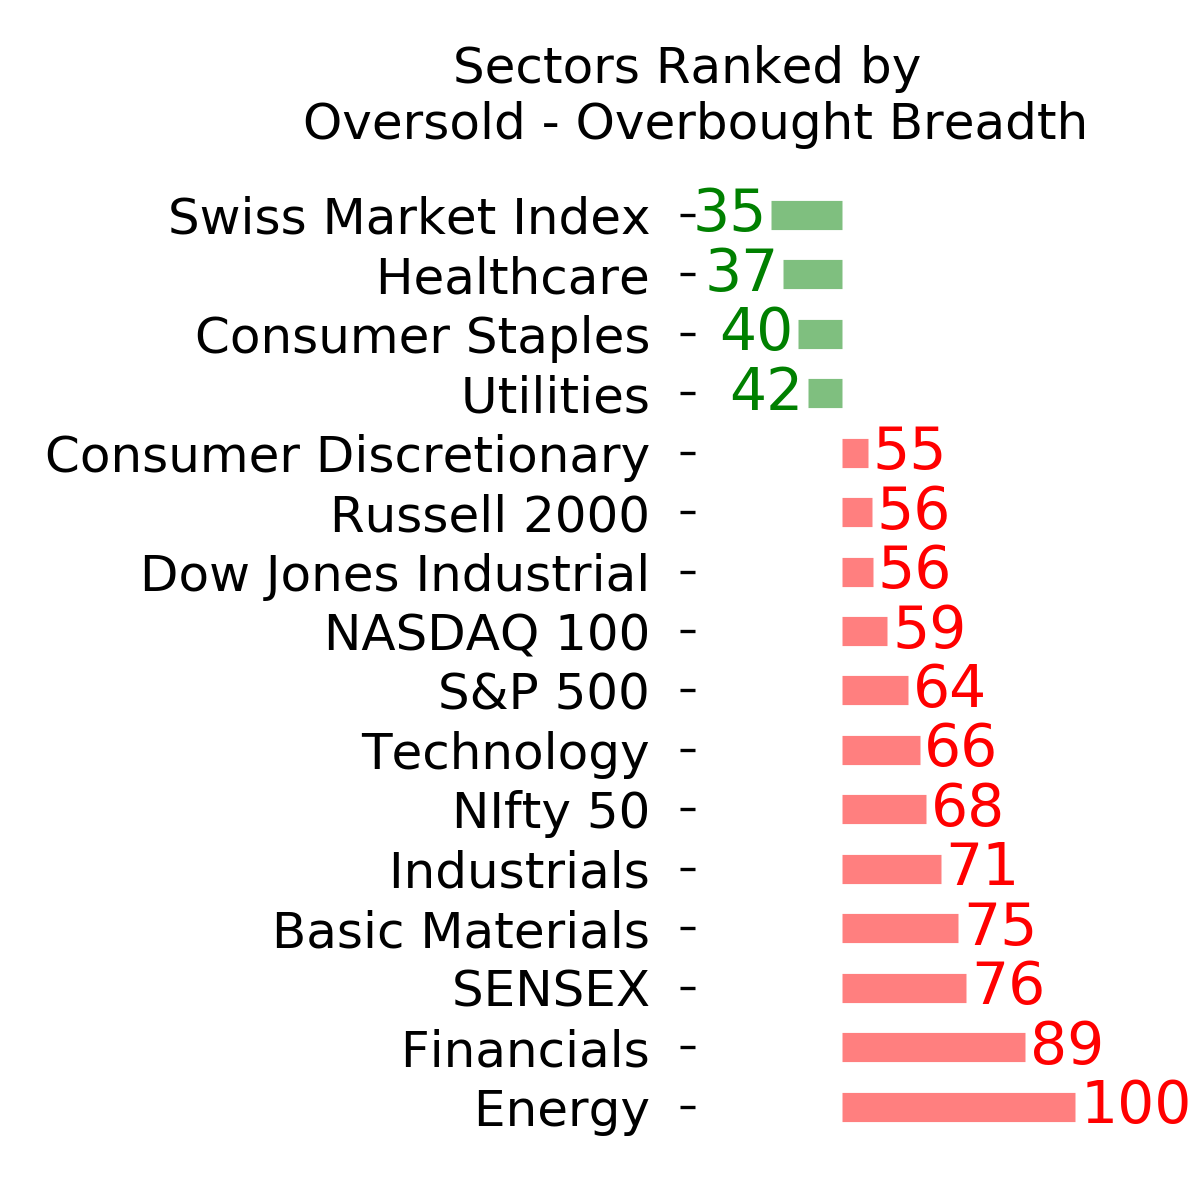
Ranks
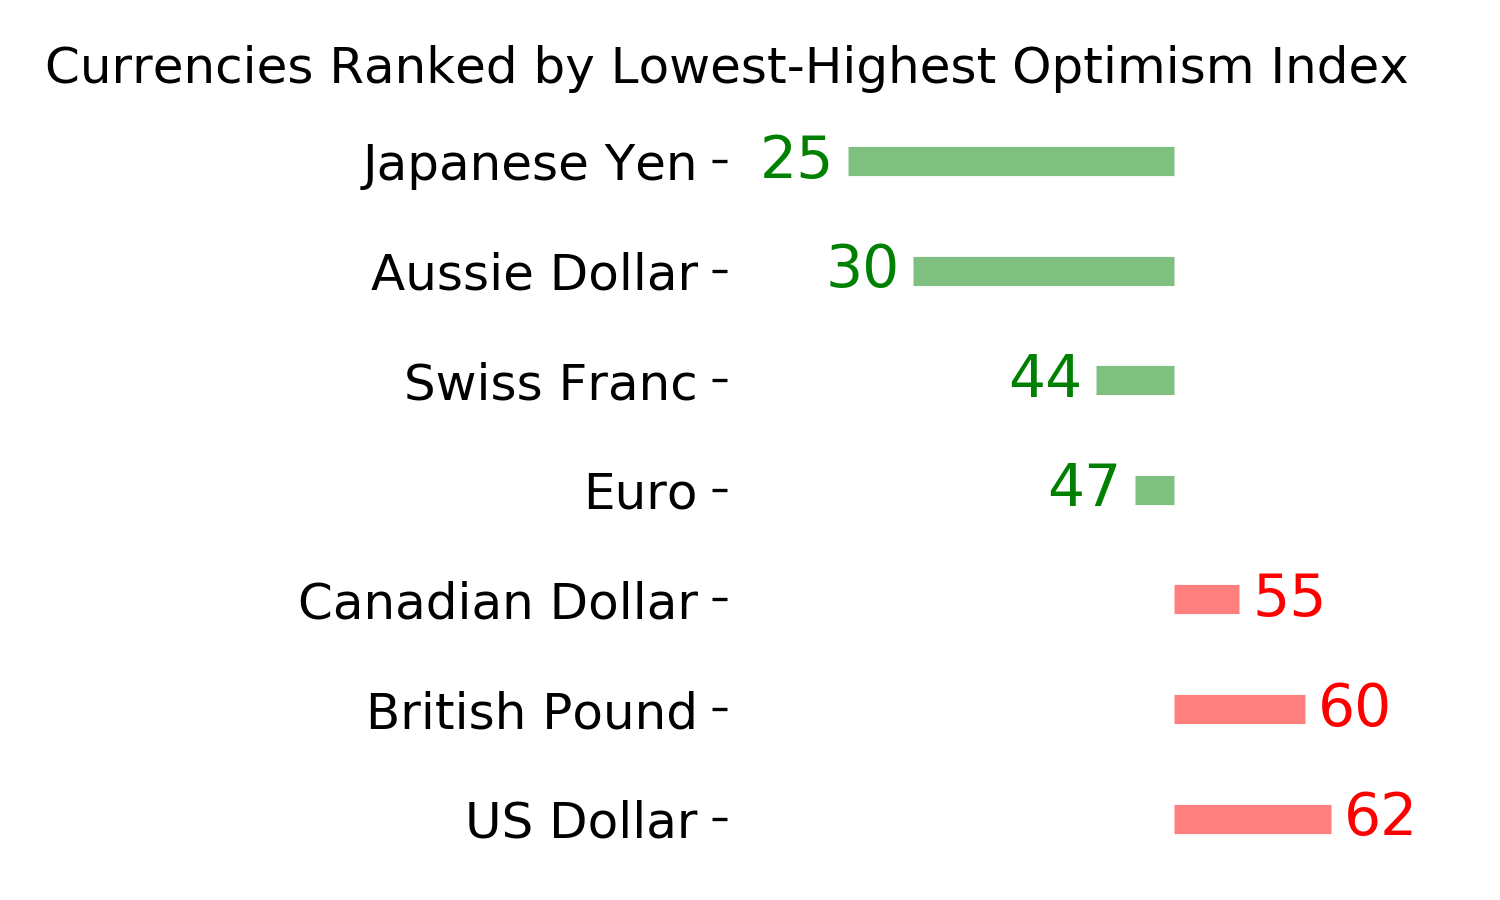
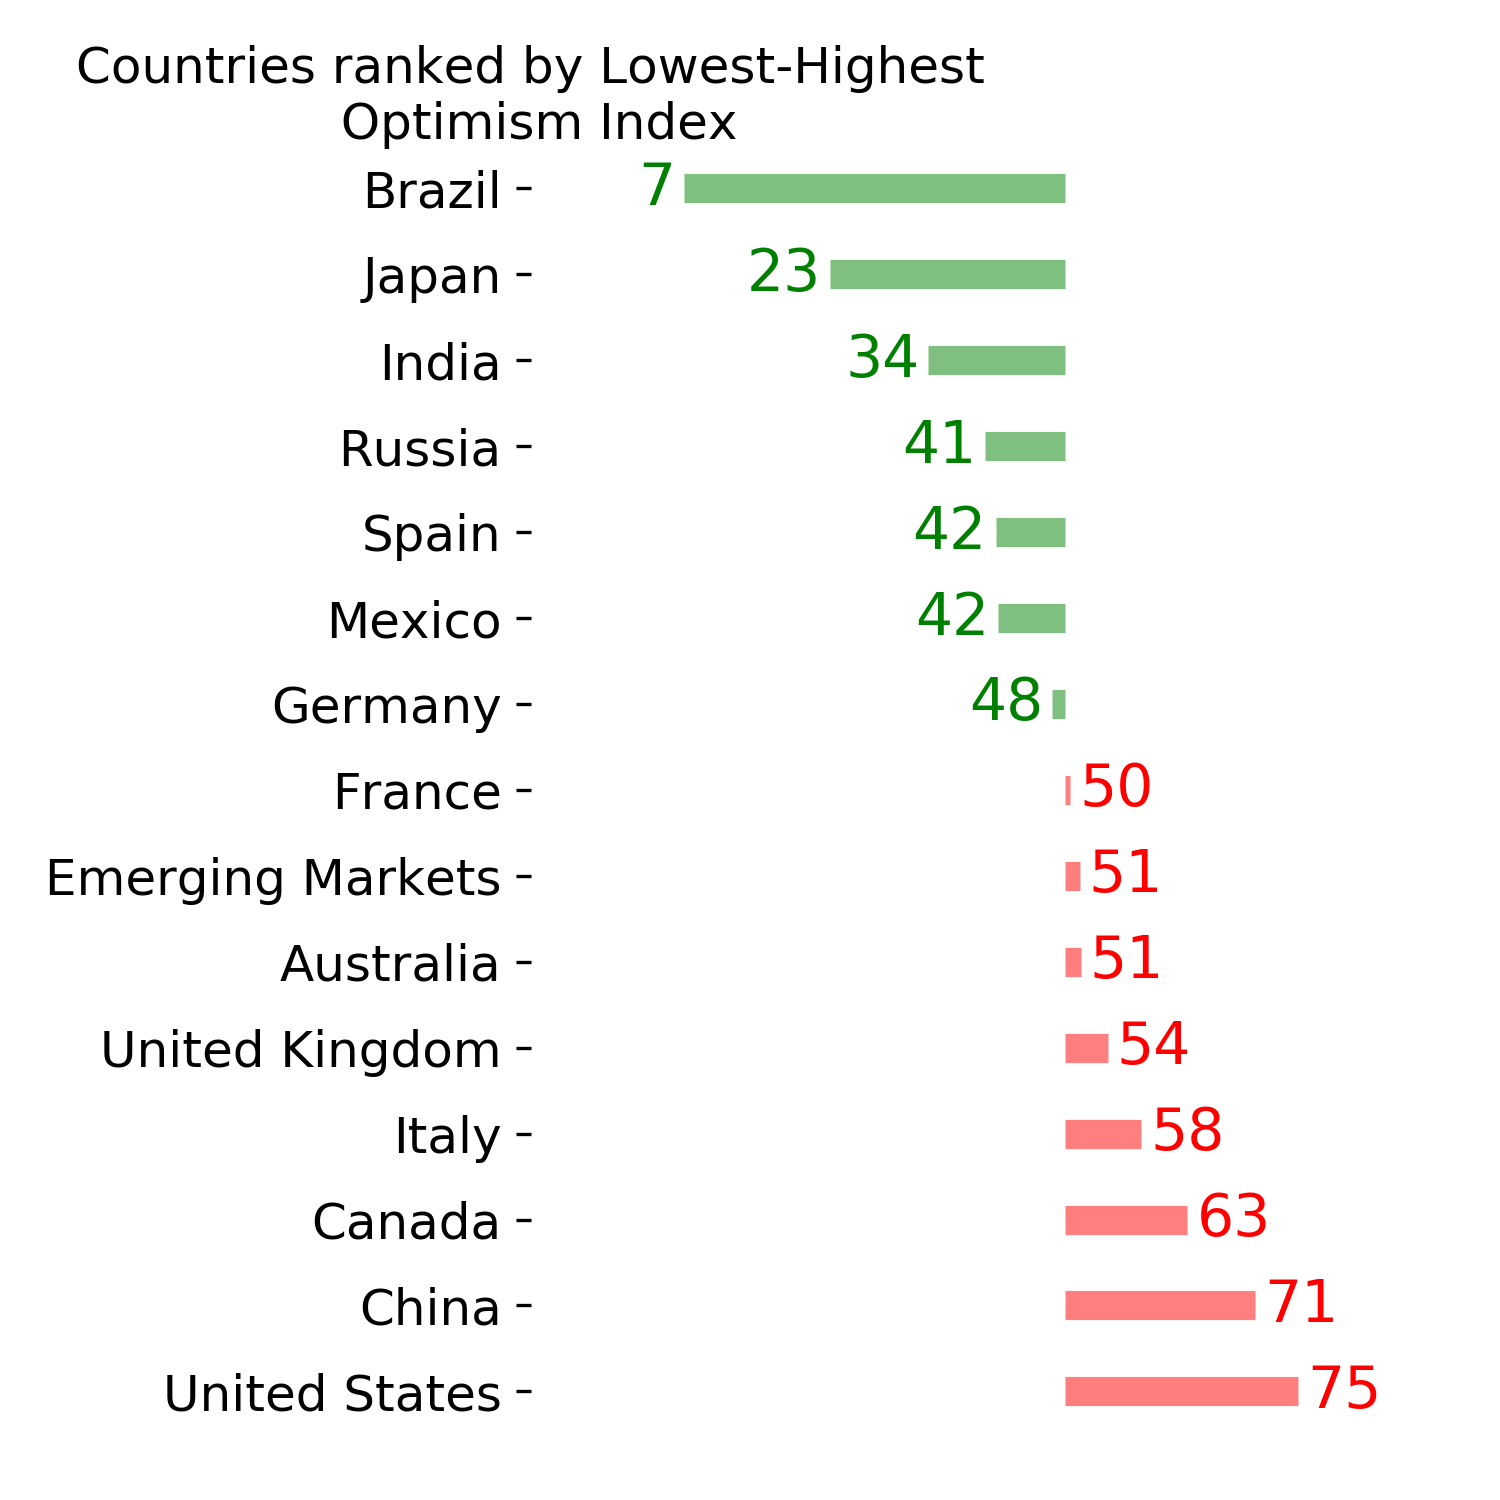
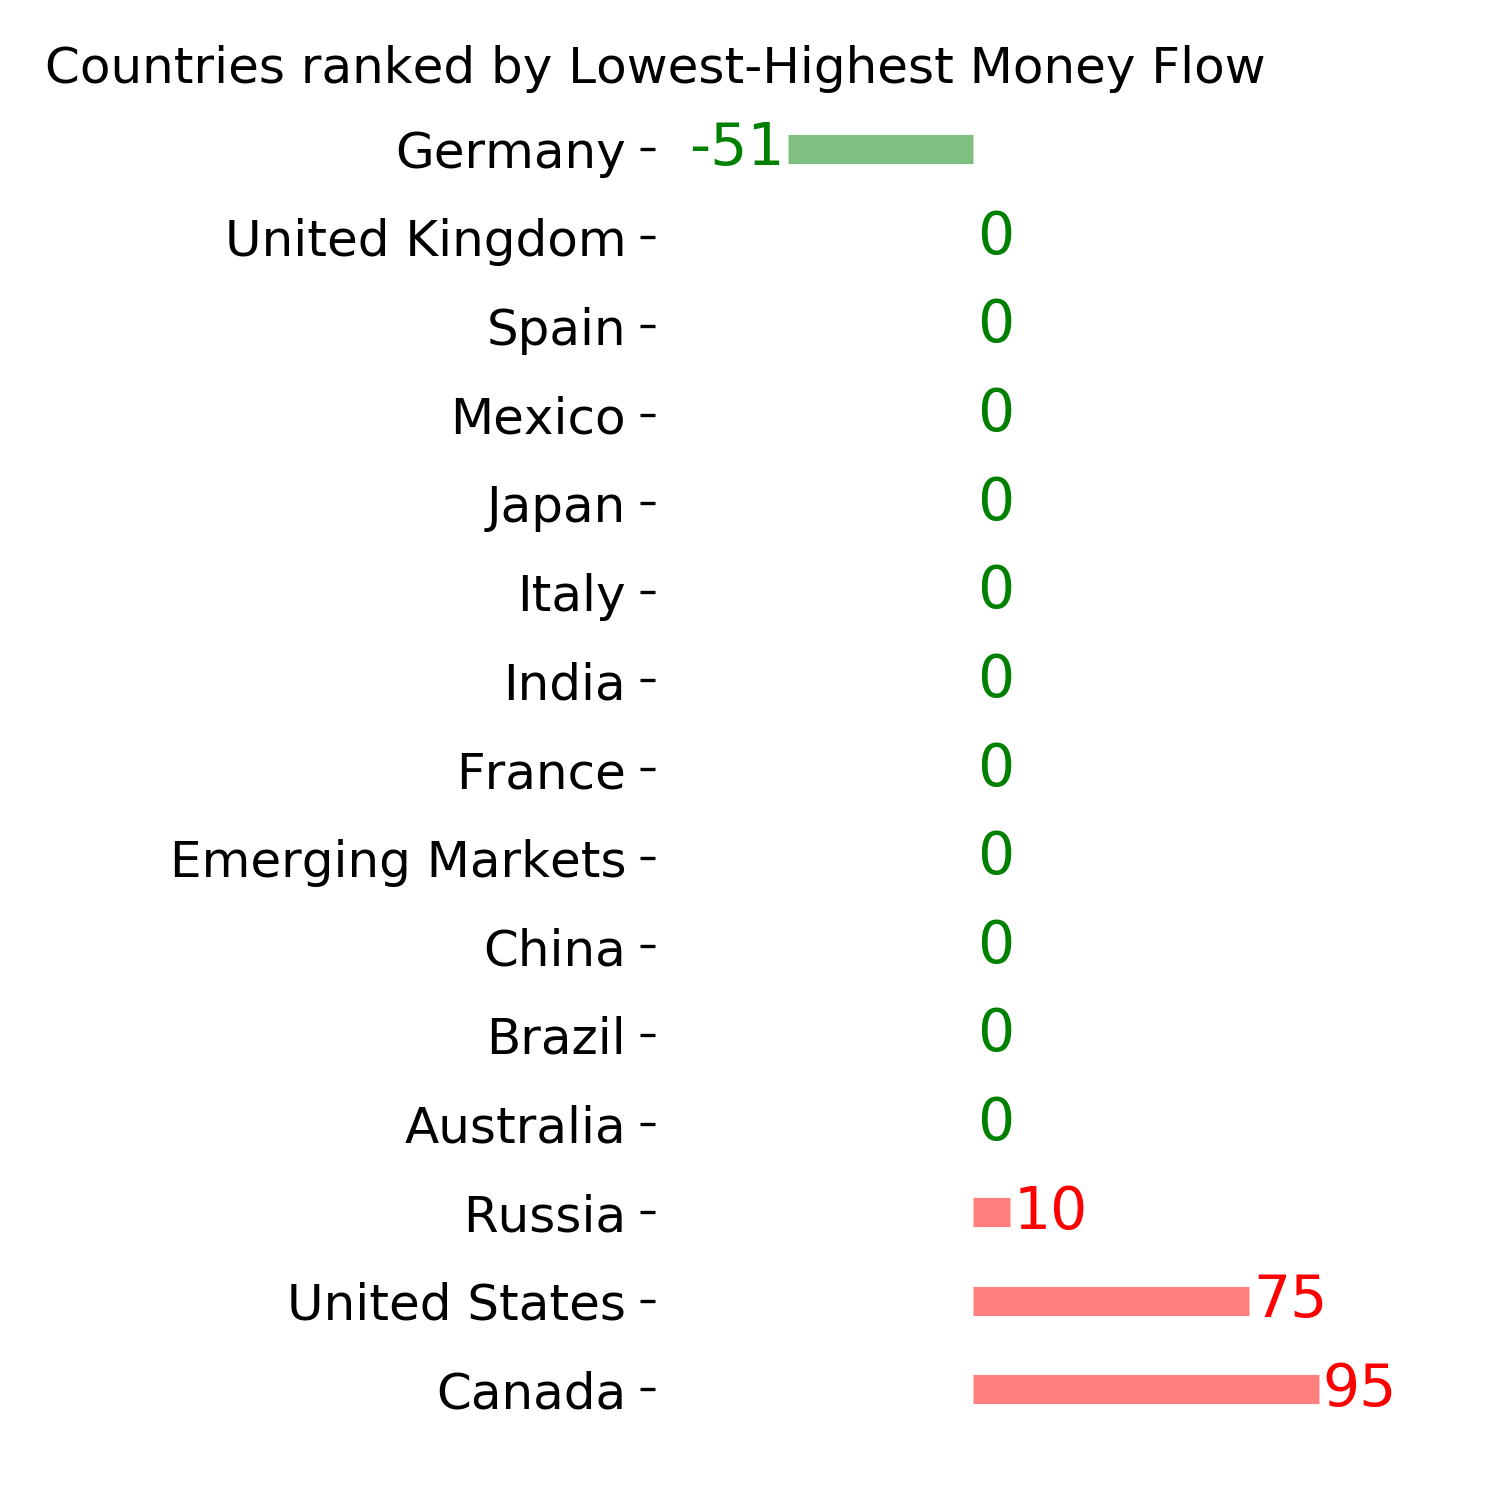
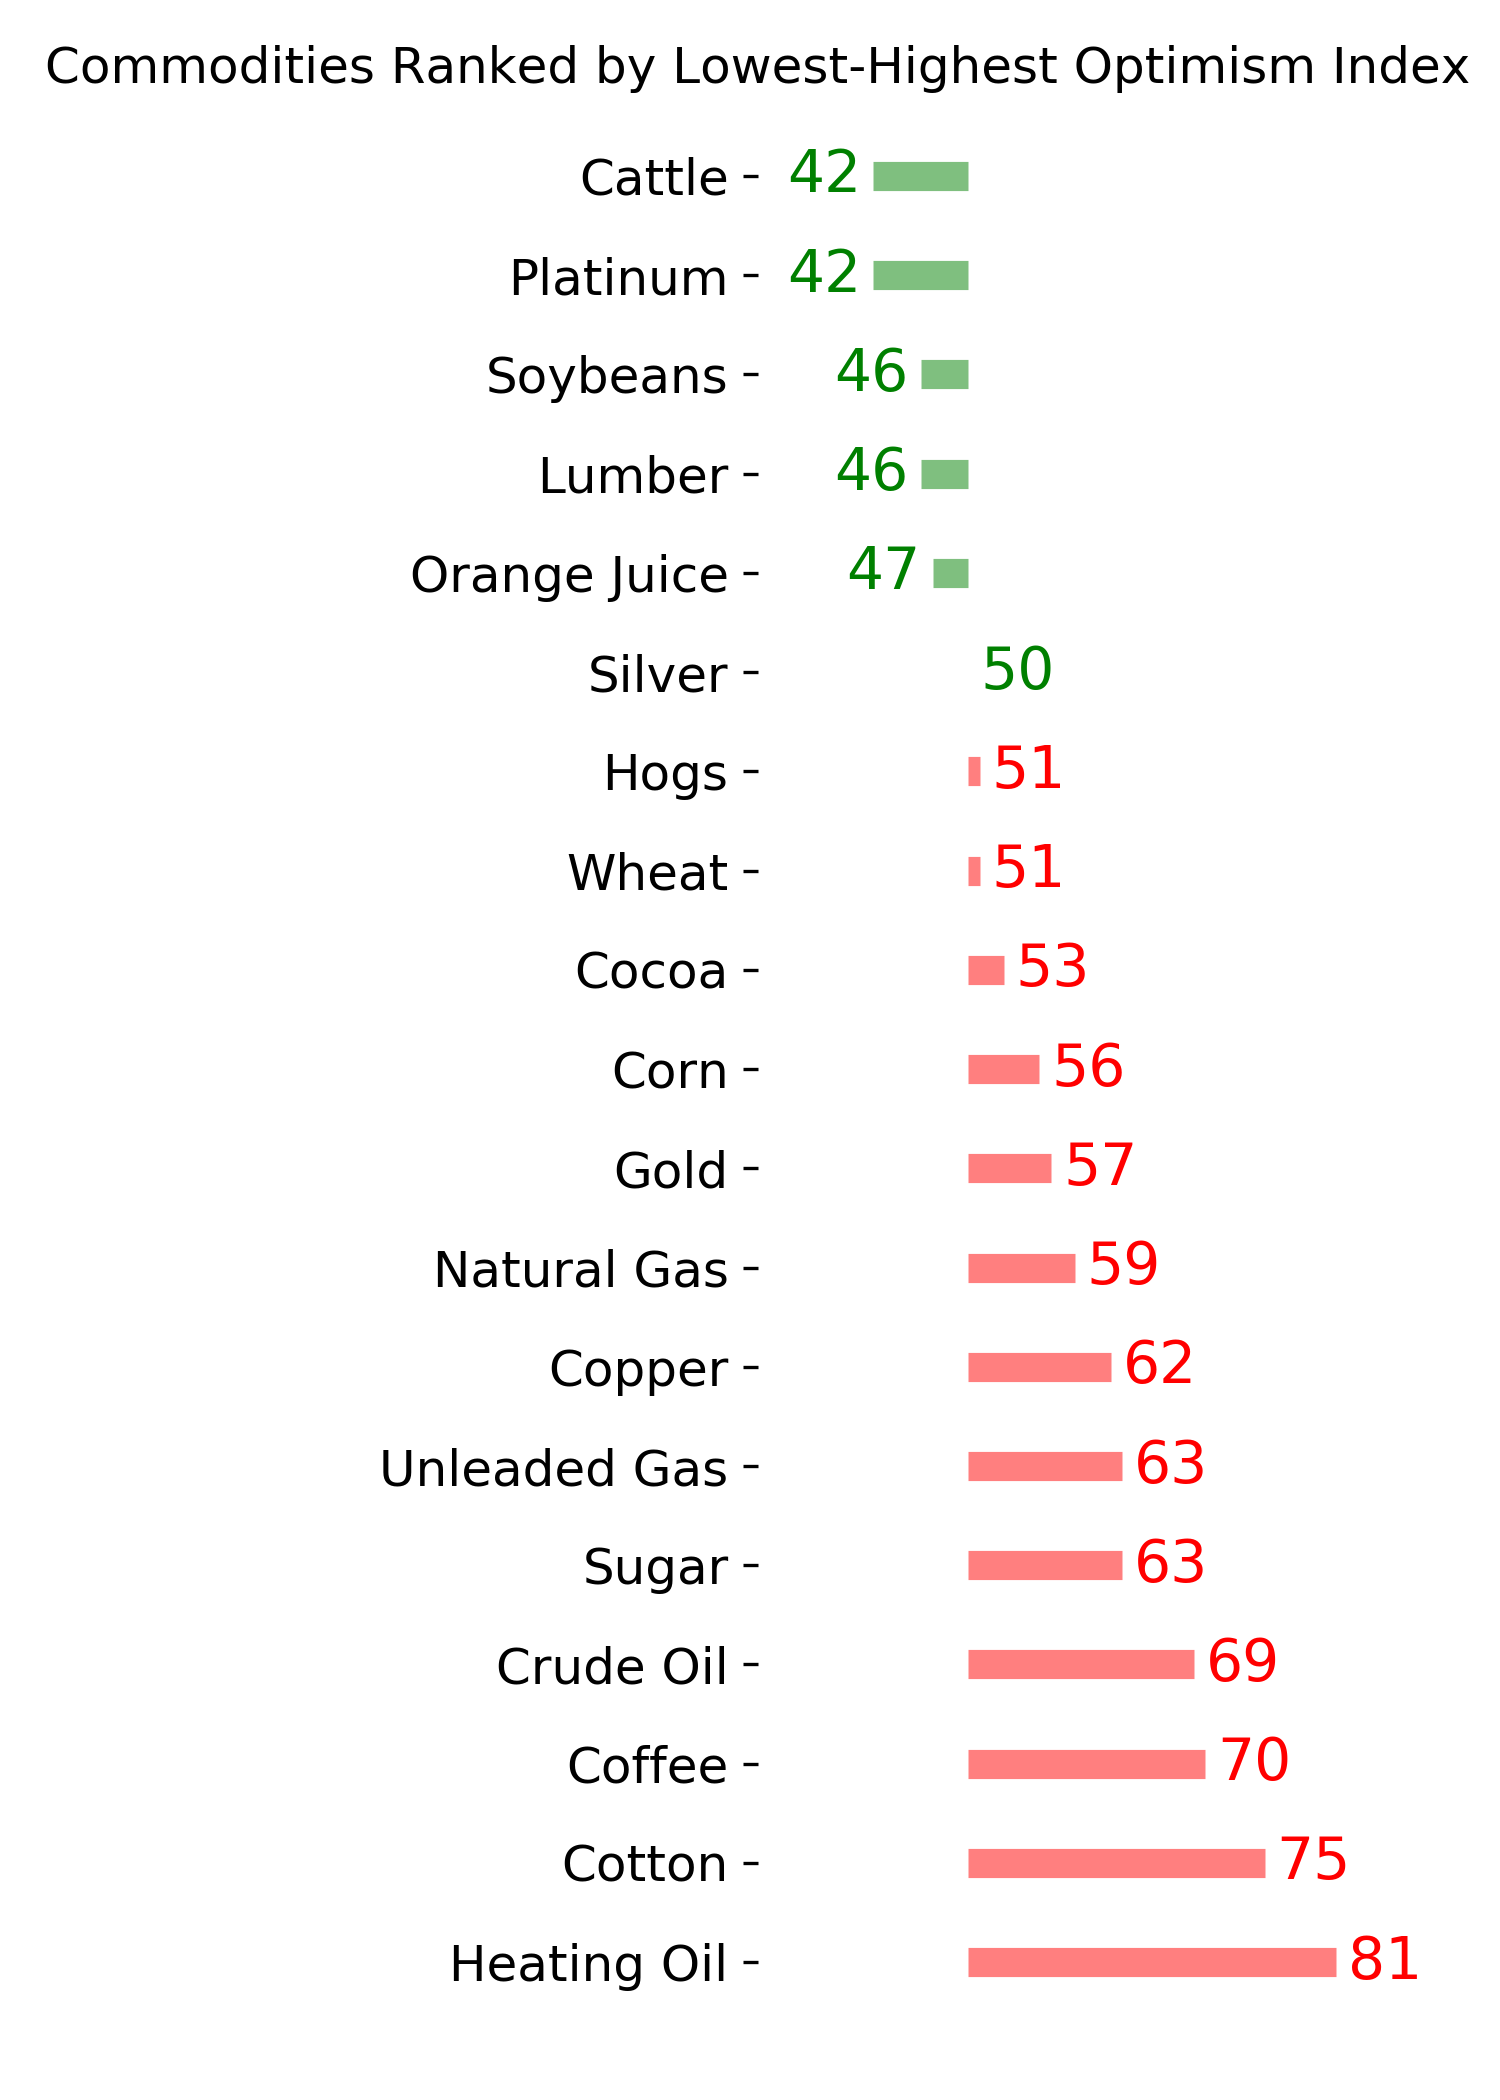
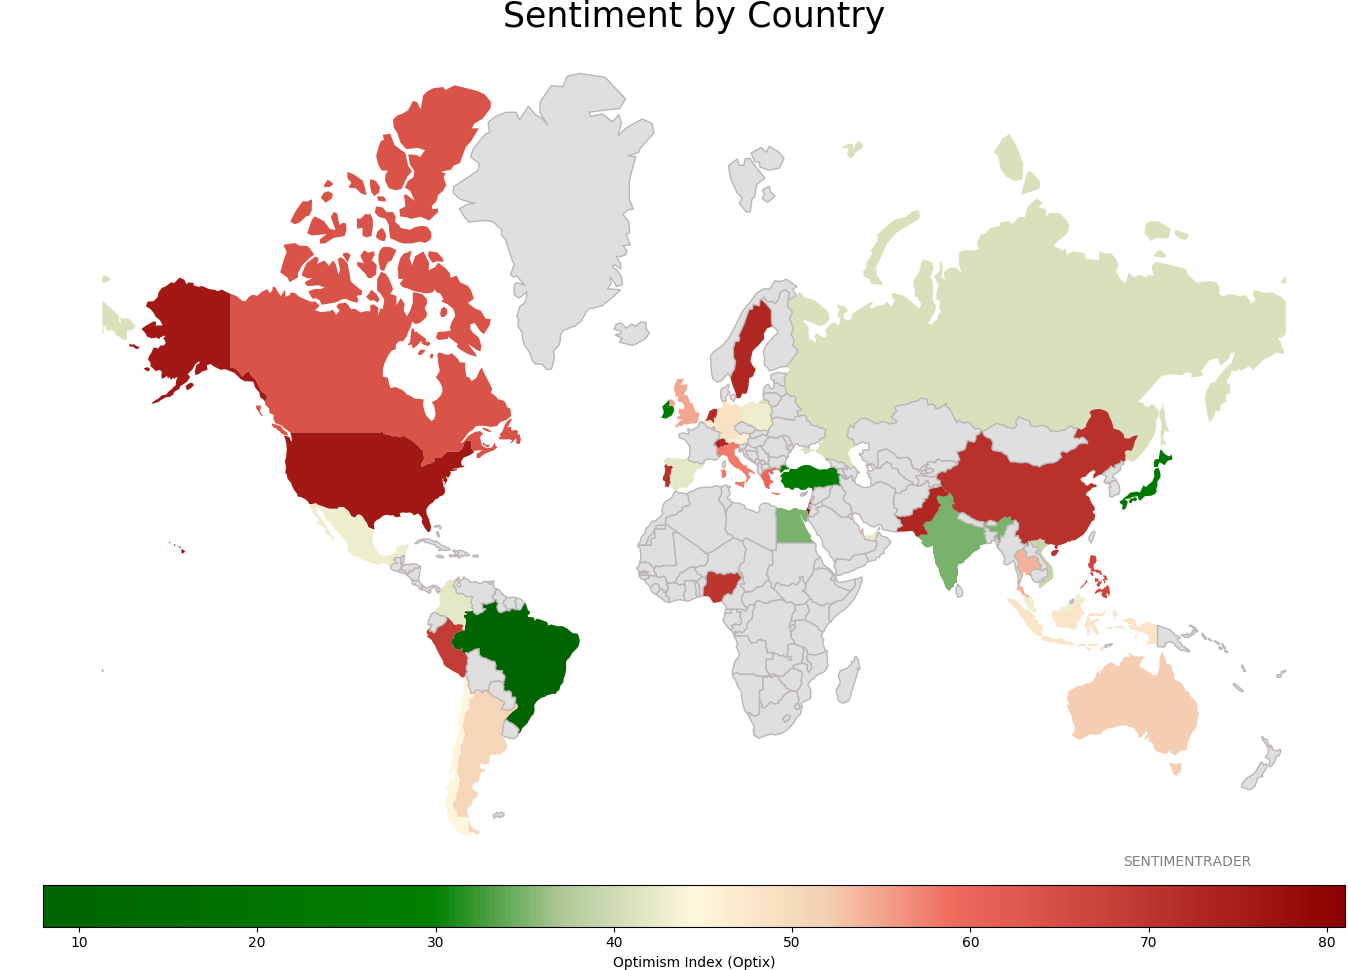
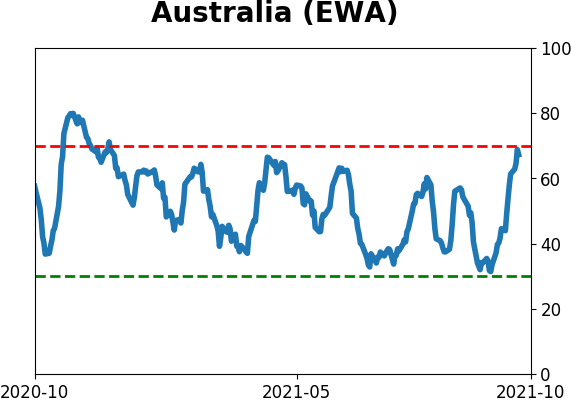
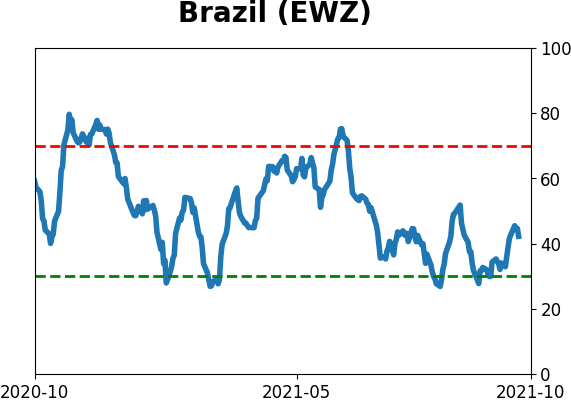
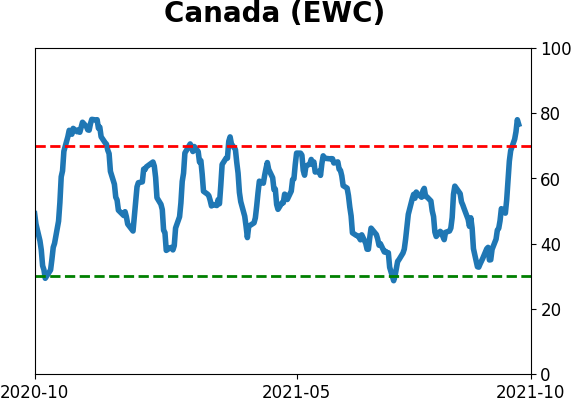
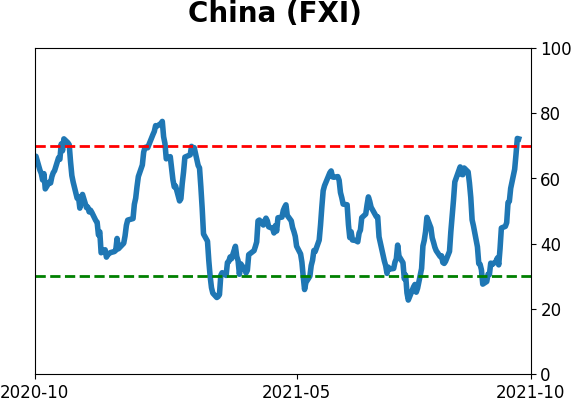
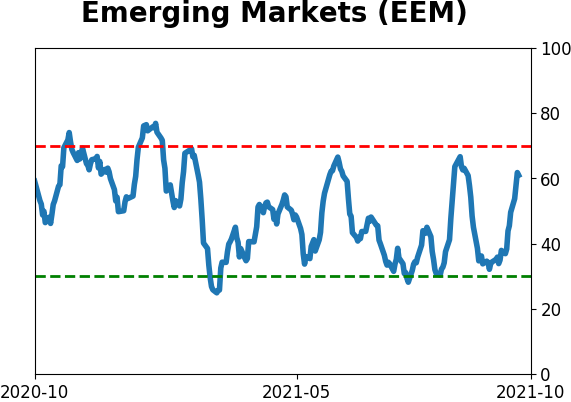
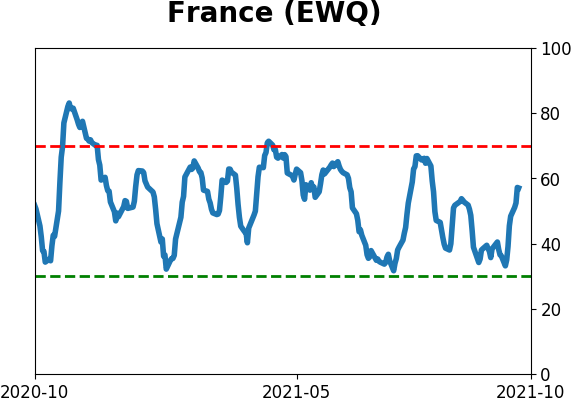
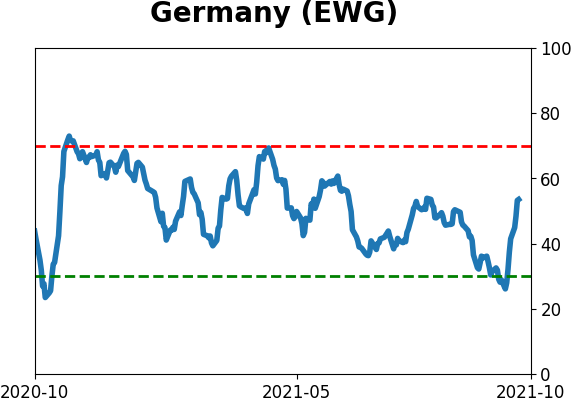
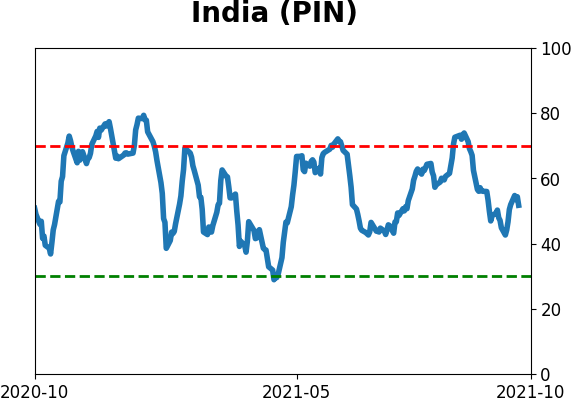
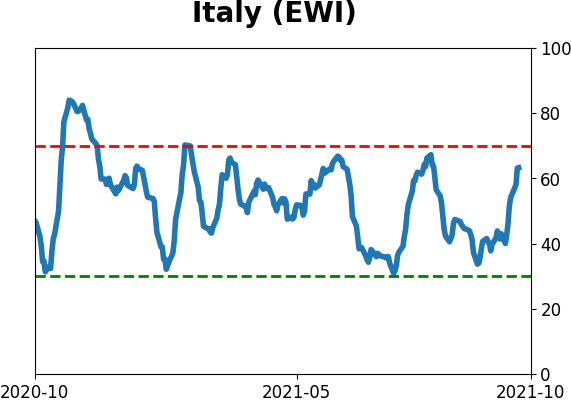
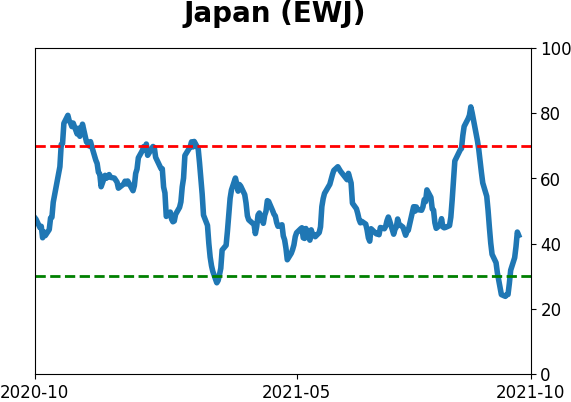
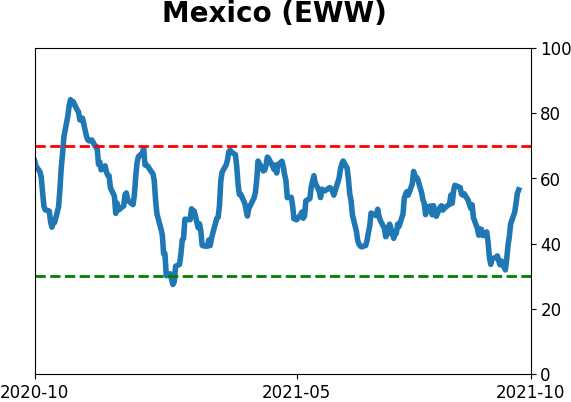
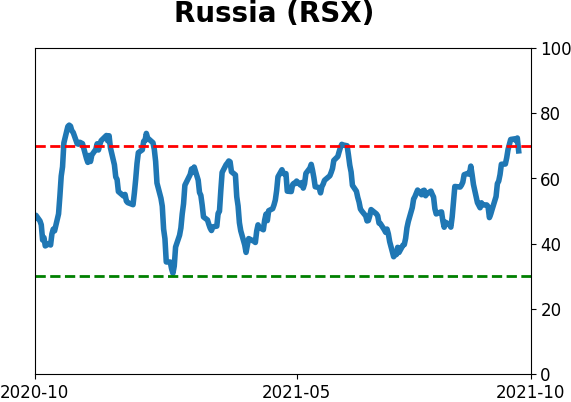
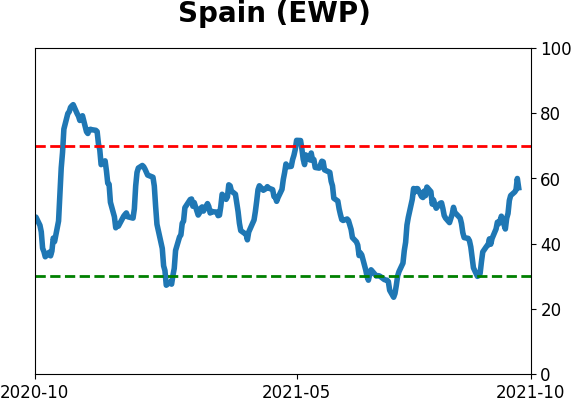
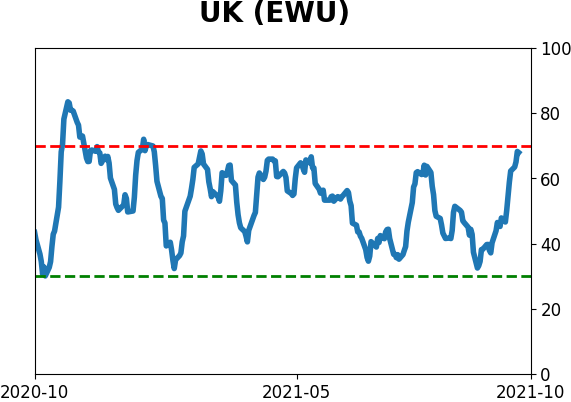
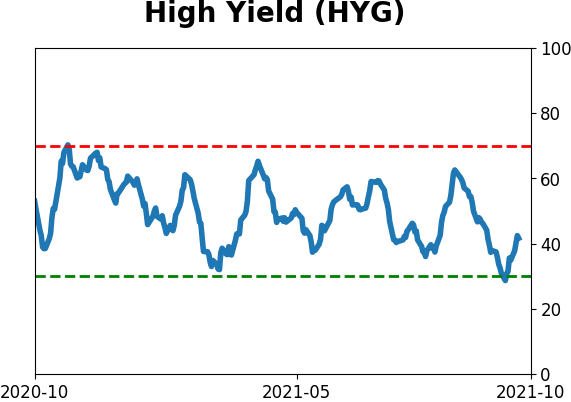
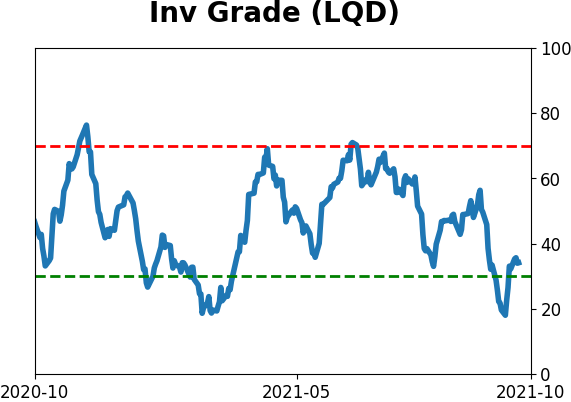
Sentiment Around The World
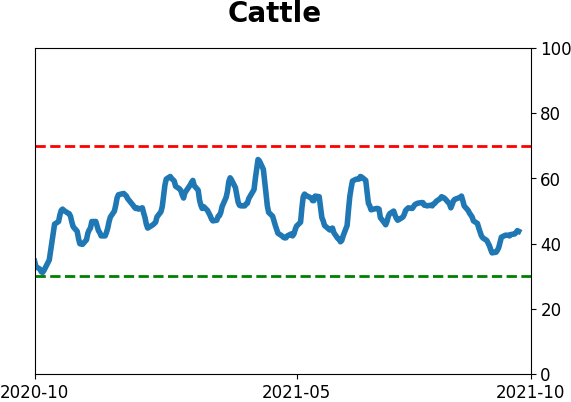
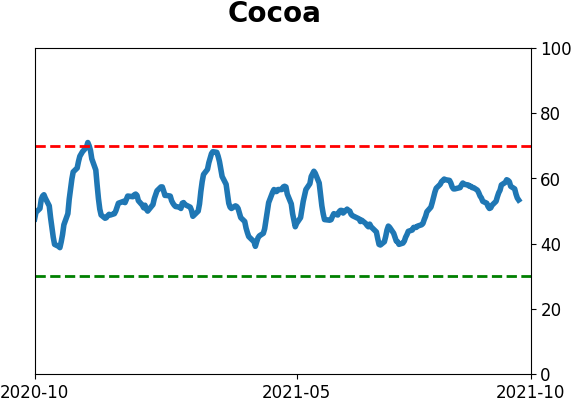
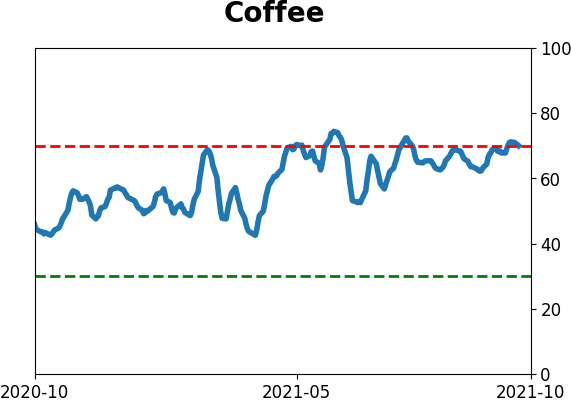
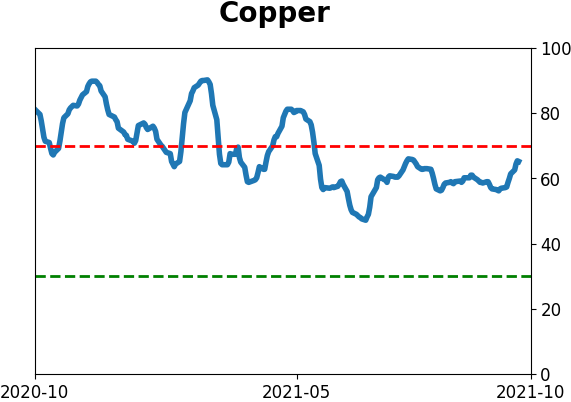
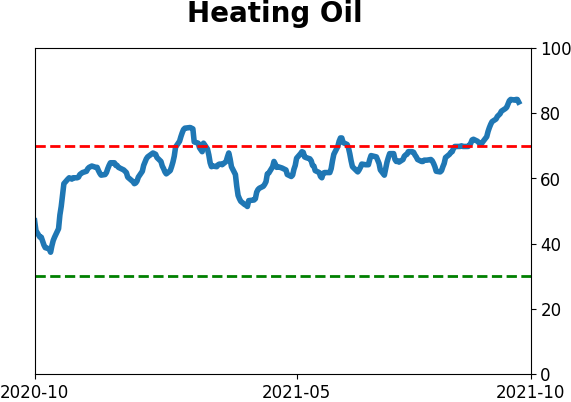
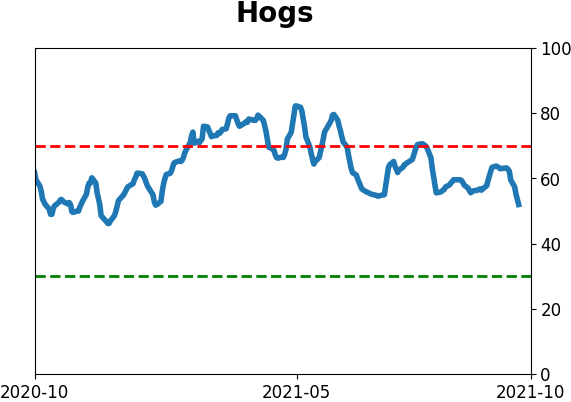
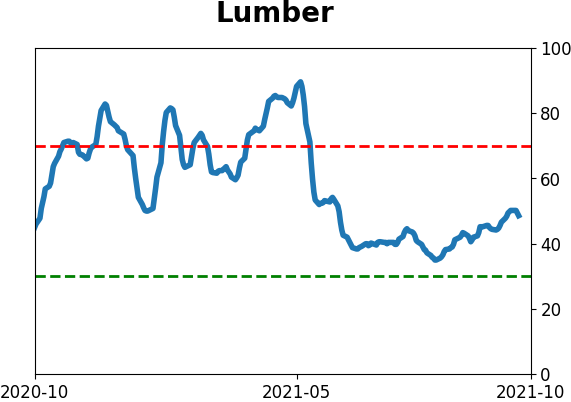
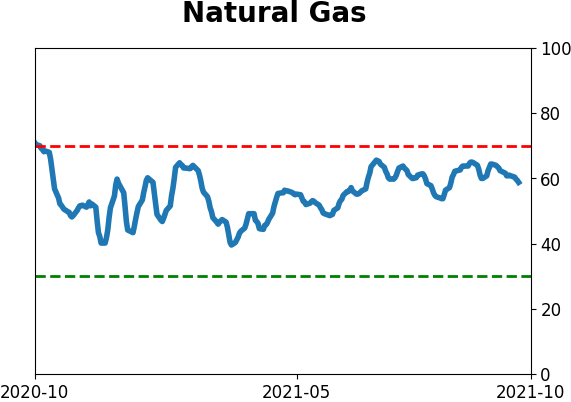
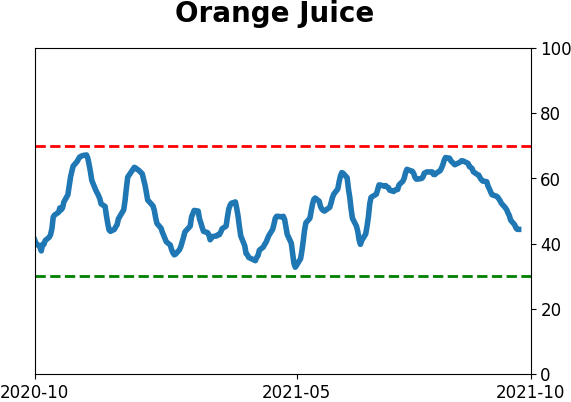
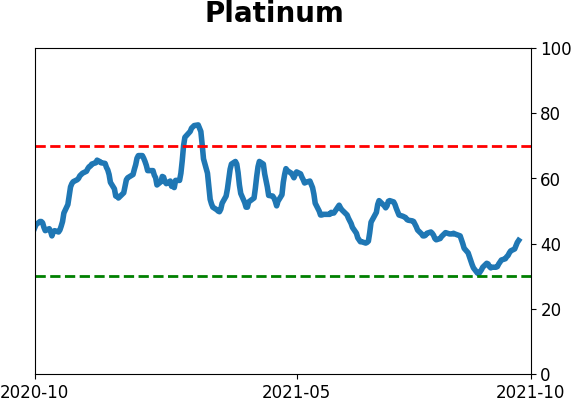
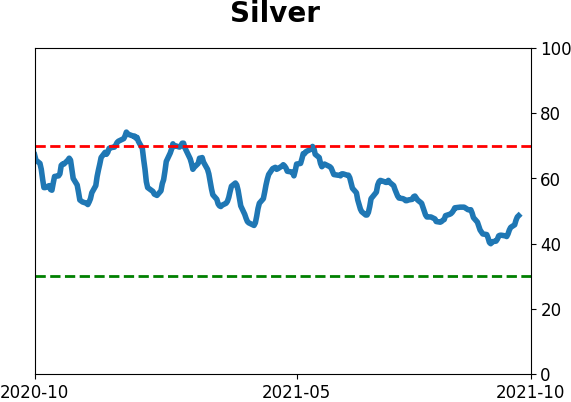
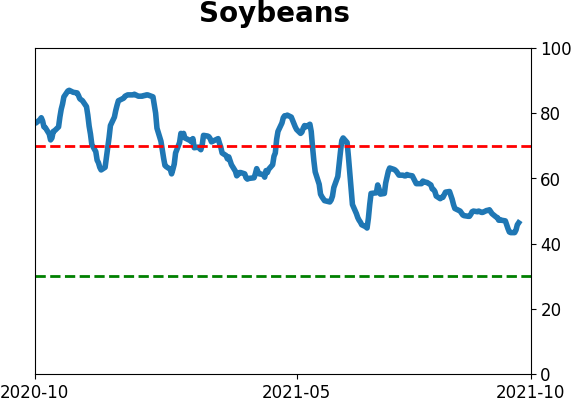
Optimism Index Thumbnails
|
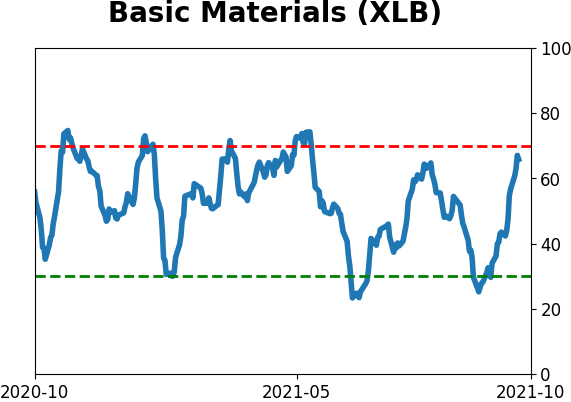
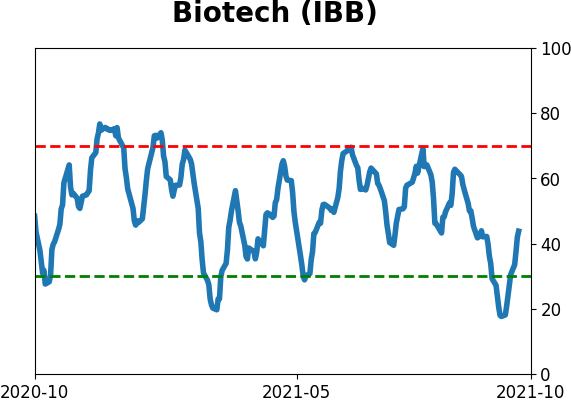
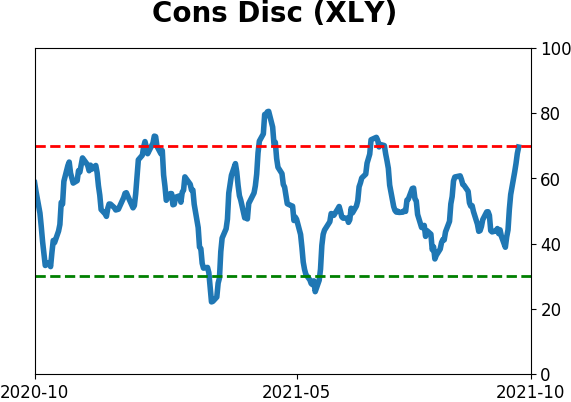
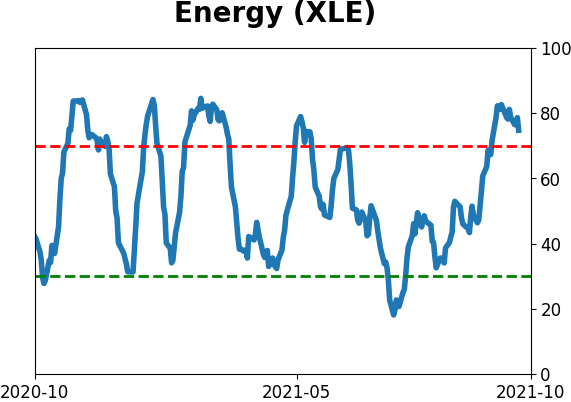
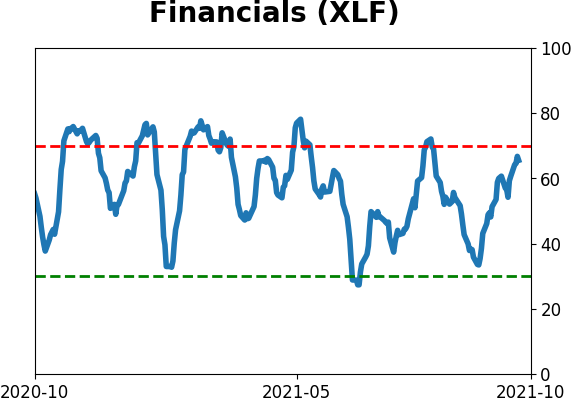
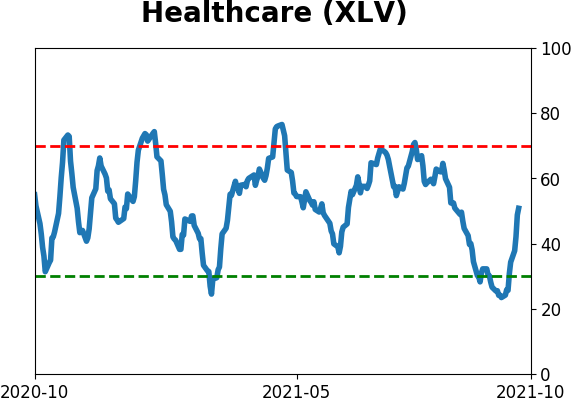
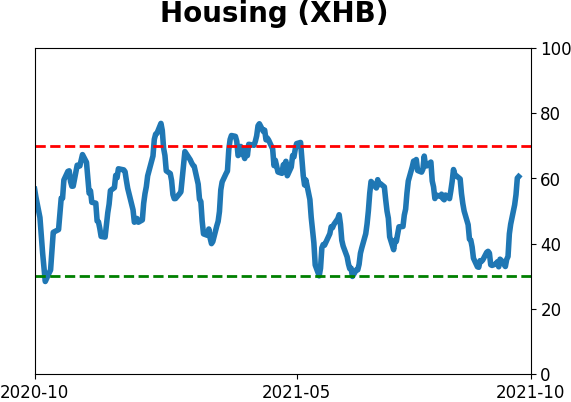
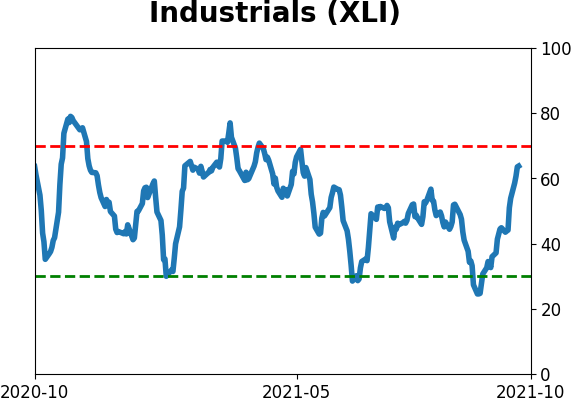
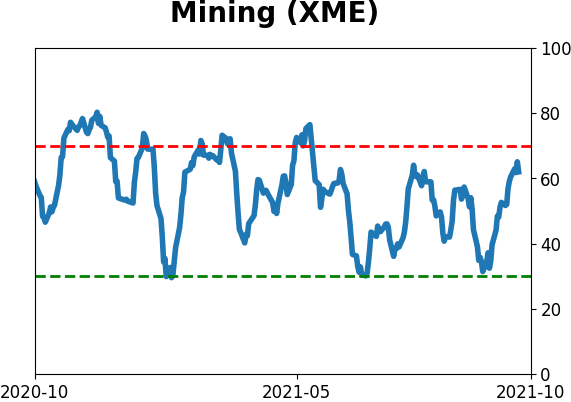
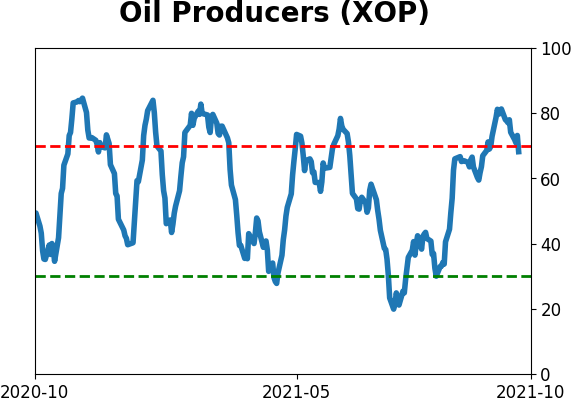
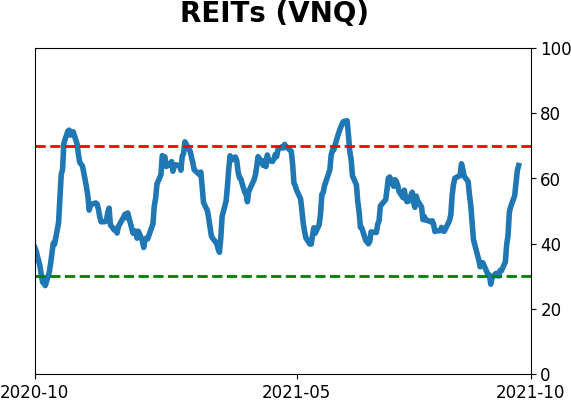
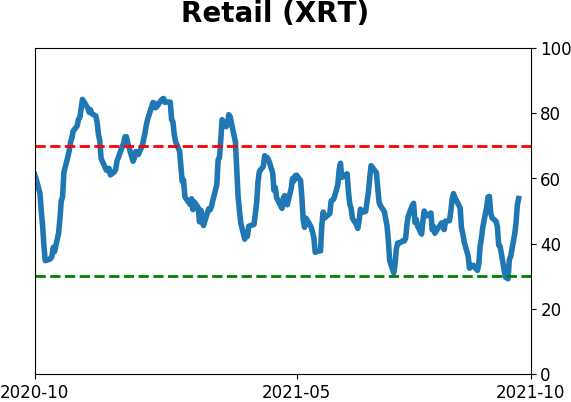
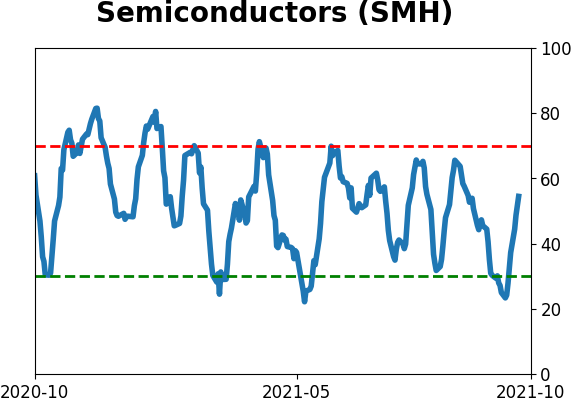
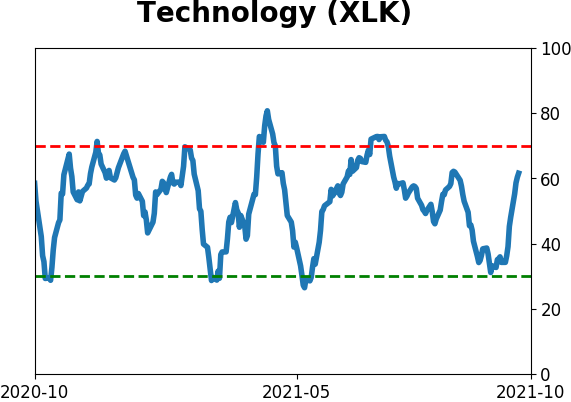
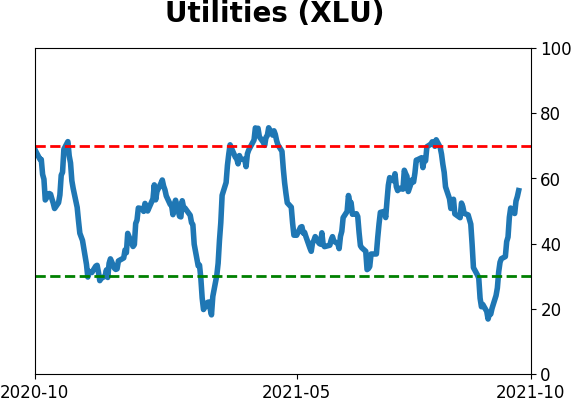
Sector ETF's - 10-Day Moving Average
|
|
|
Country ETF's - 10-Day Moving Average
|
|
|
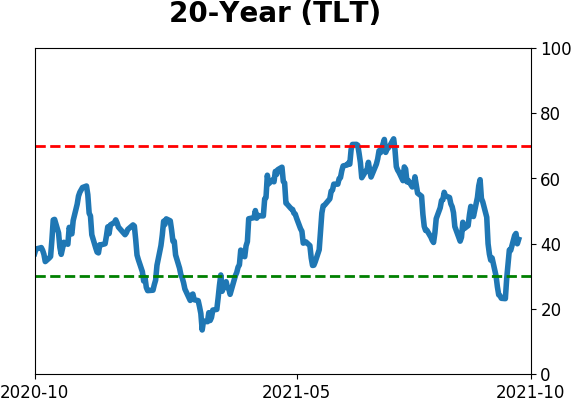
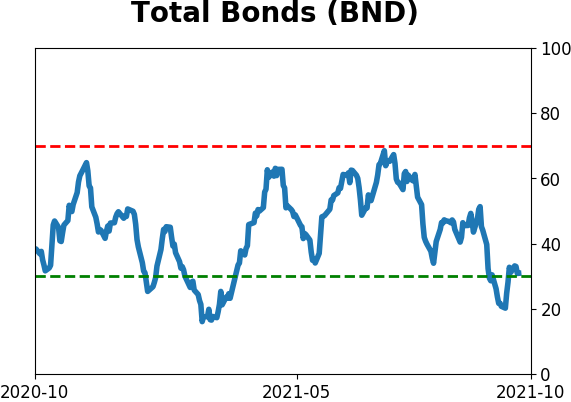
Bond ETF's - 10-Day Moving Average
|
|
|
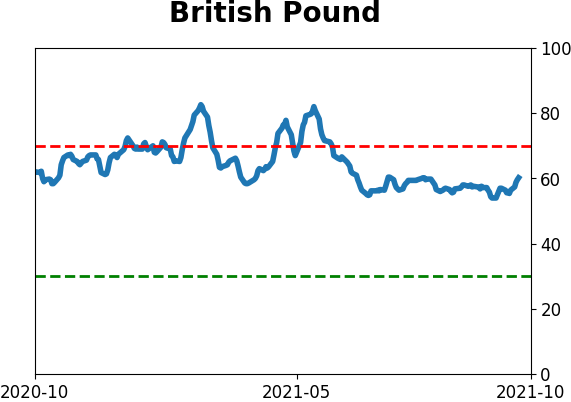
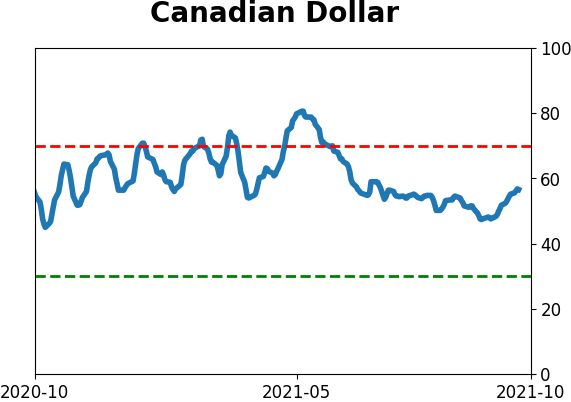
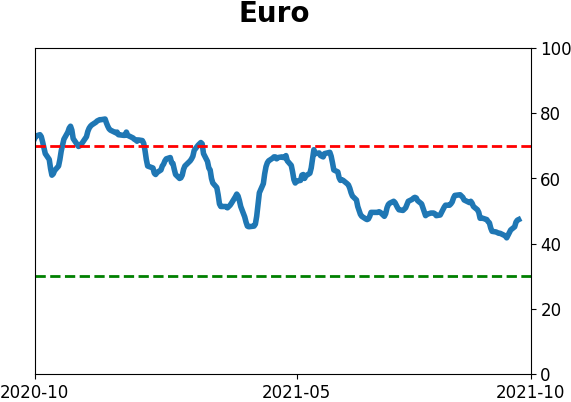
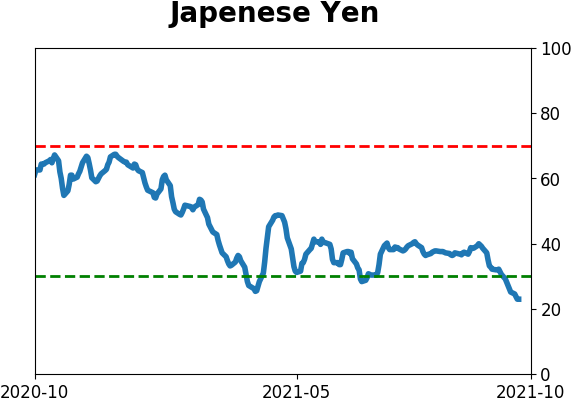
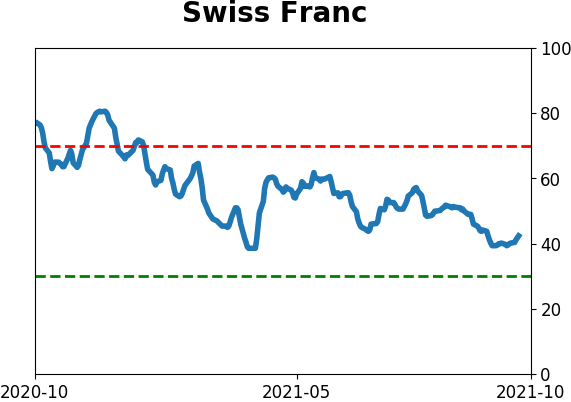
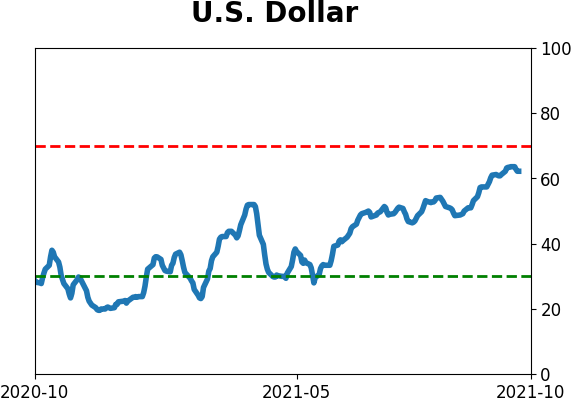
Currency ETF's - 5-Day Moving Average
|
|
|
Commodity ETF's - 5-Day Moving Average
|
|