Headlines
|
|
The Big Money Is (Kind of) Bullish:
The latest Big Money poll from Barron's shows that smart money investors have tempered their optimistic outlook significantly from where they were in April. That's a mild negative for the next six months for stocks.
Bottom Line:
STOCKS: Weak buy
The speculative frenzy in February is wrung out. There are some signs of pessimism, but the most compelling data show that buyers consistently tend to return once the first signs of extreme momentum end, especially as we head into a seasonally positive time of year. See the Outlook & Allocations page for more. BONDS: Hold
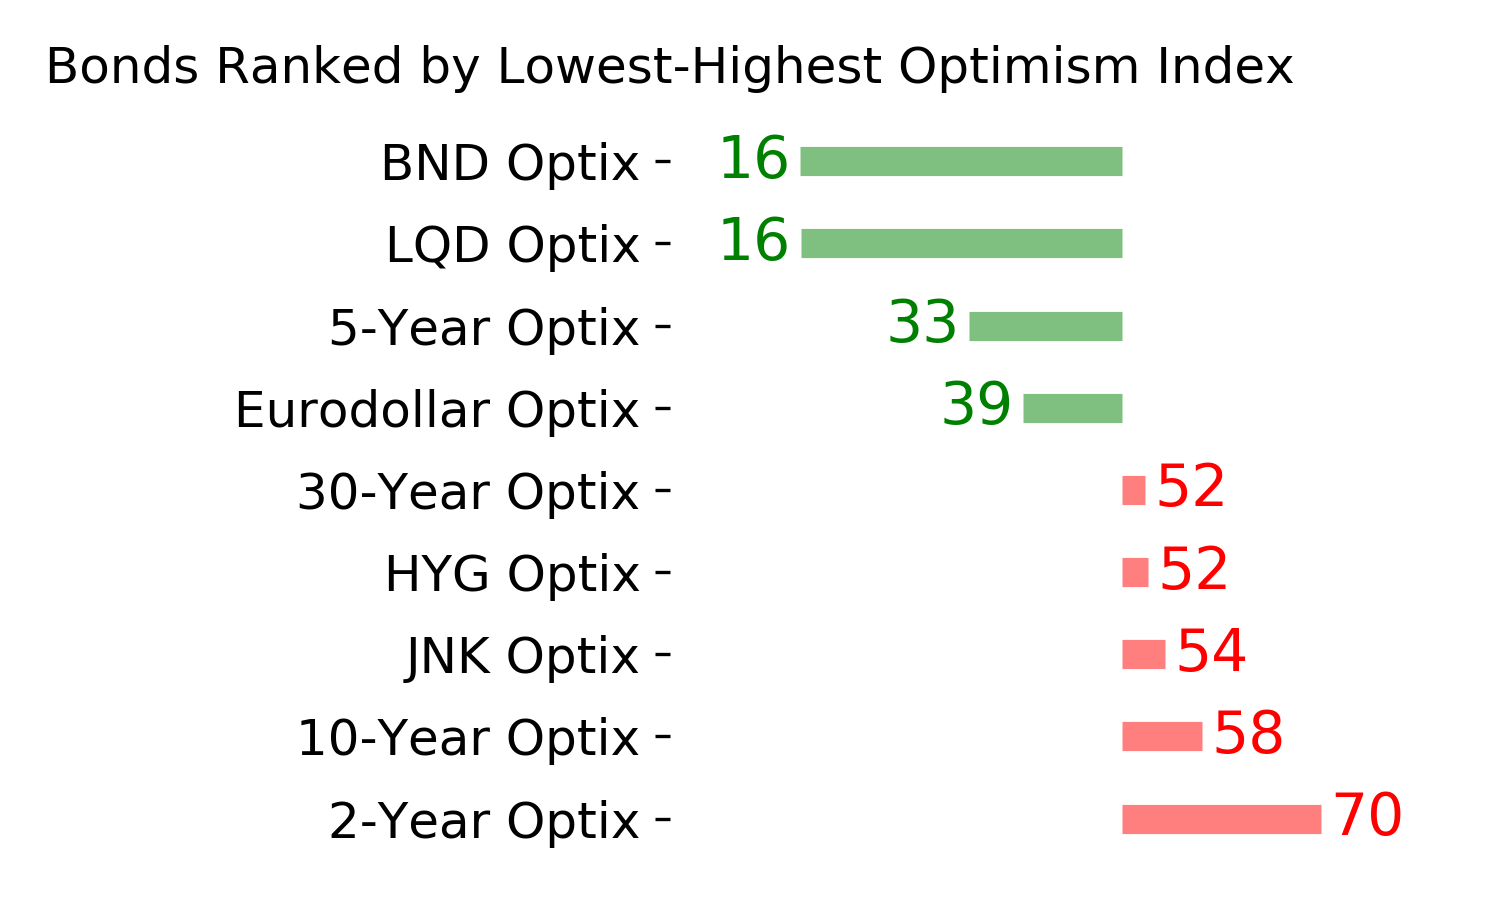
Various parts of the market got hit in March, with the lowest Bond Optimism Index we usually see during healthy environments. Bond prices have modest recovered and there is no edge among the data we follow. GOLD: Hold
Gold and miners were rejected after trying to recover above their 200-day averages in May. Lately, some medium-term (not long-term) oversold extremes in breadth measures among miners have triggered.
|
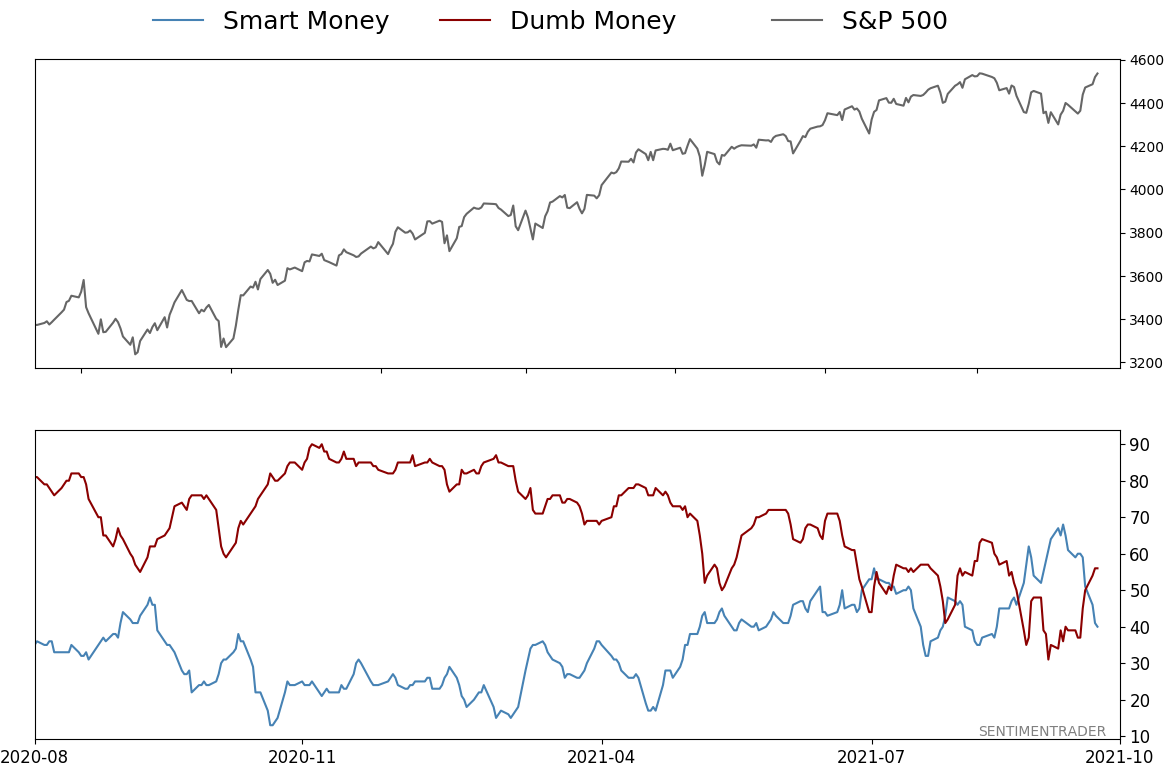
Smart / Dumb Money Confidence
|
Smart Money Confidence: 40%
Dumb Money Confidence: 56%
|
|
Risk Levels
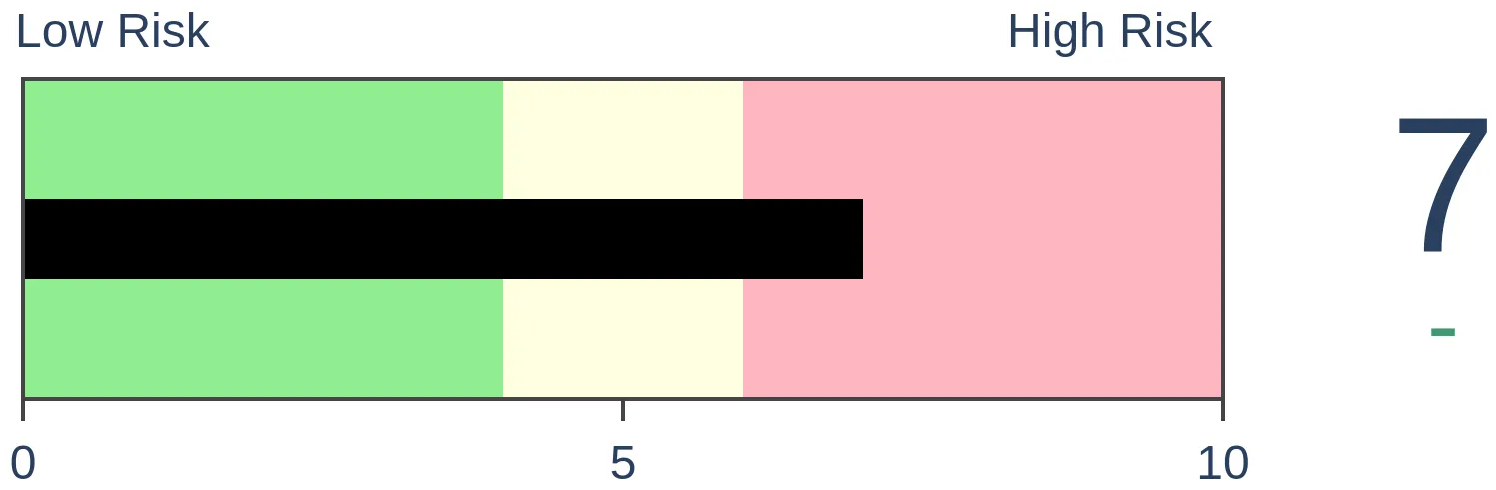
Stocks Short-Term
|
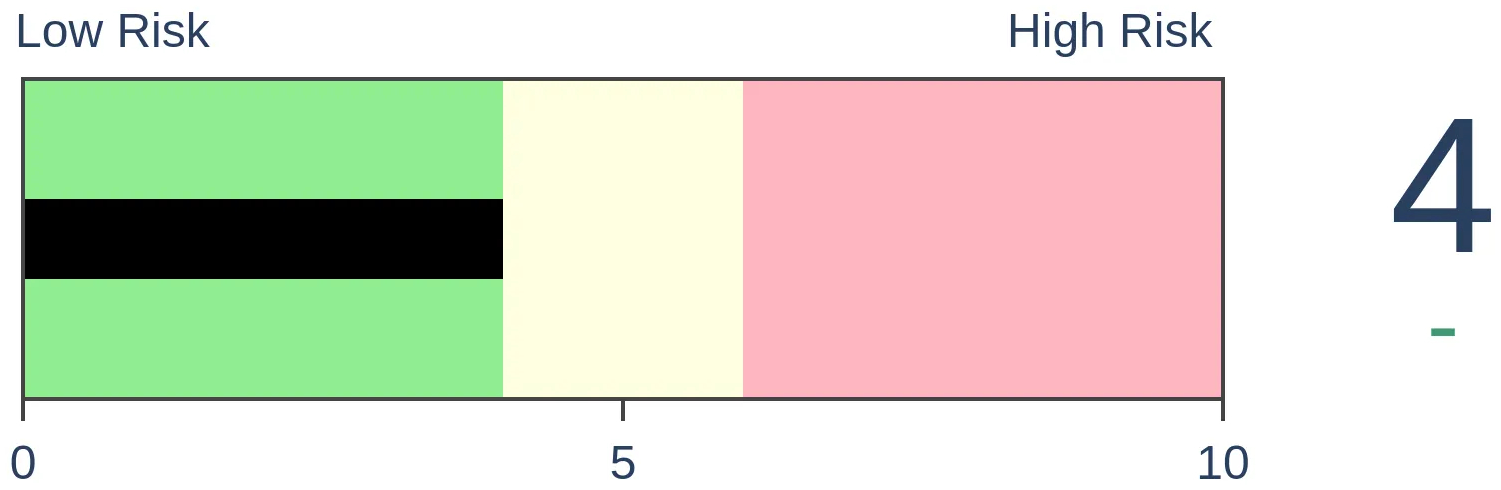
Stocks Medium-Term
|
|
Bonds

|
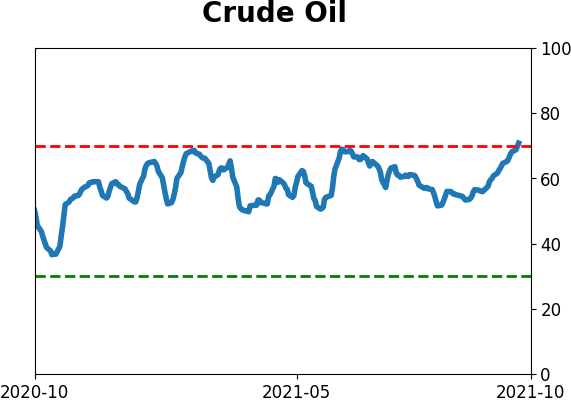
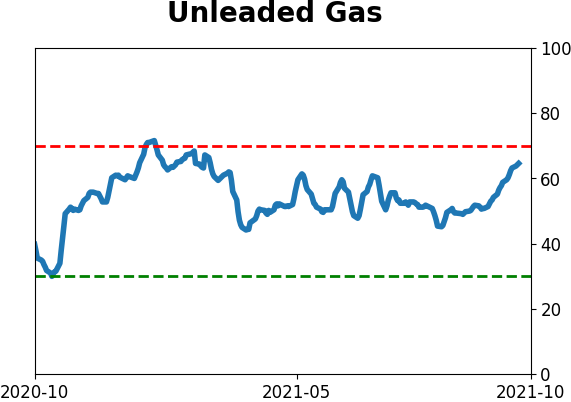
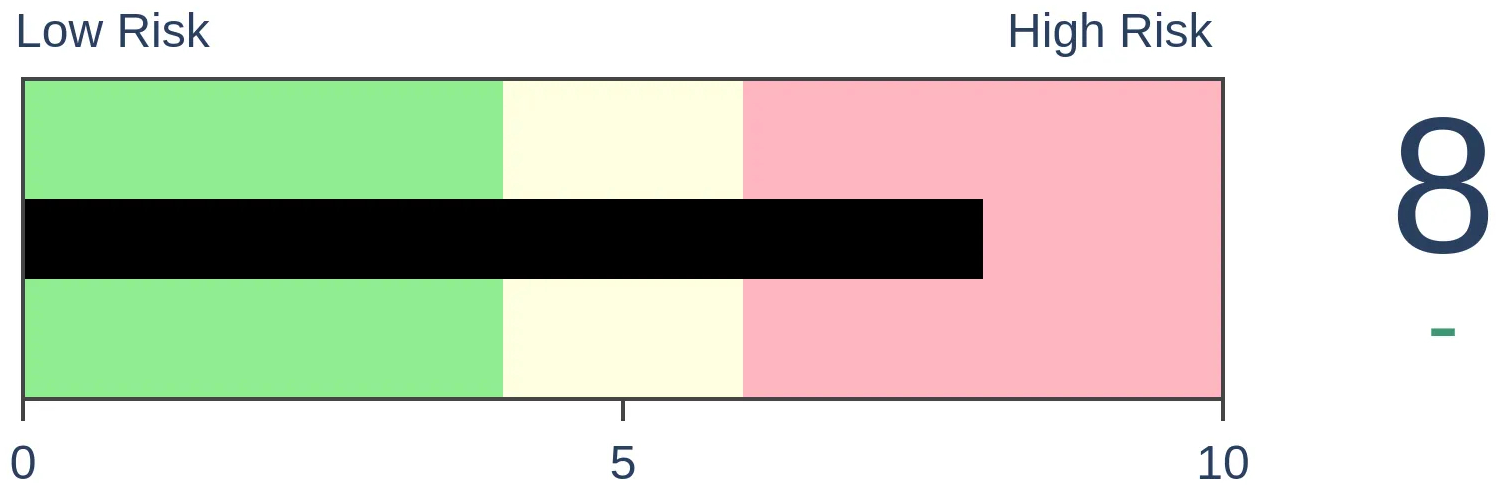
Crude Oil
|
|
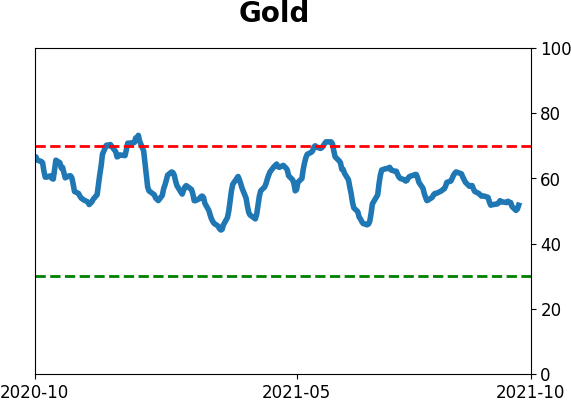
Gold

|
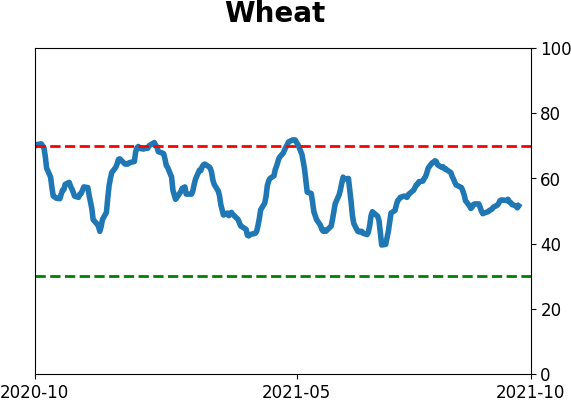
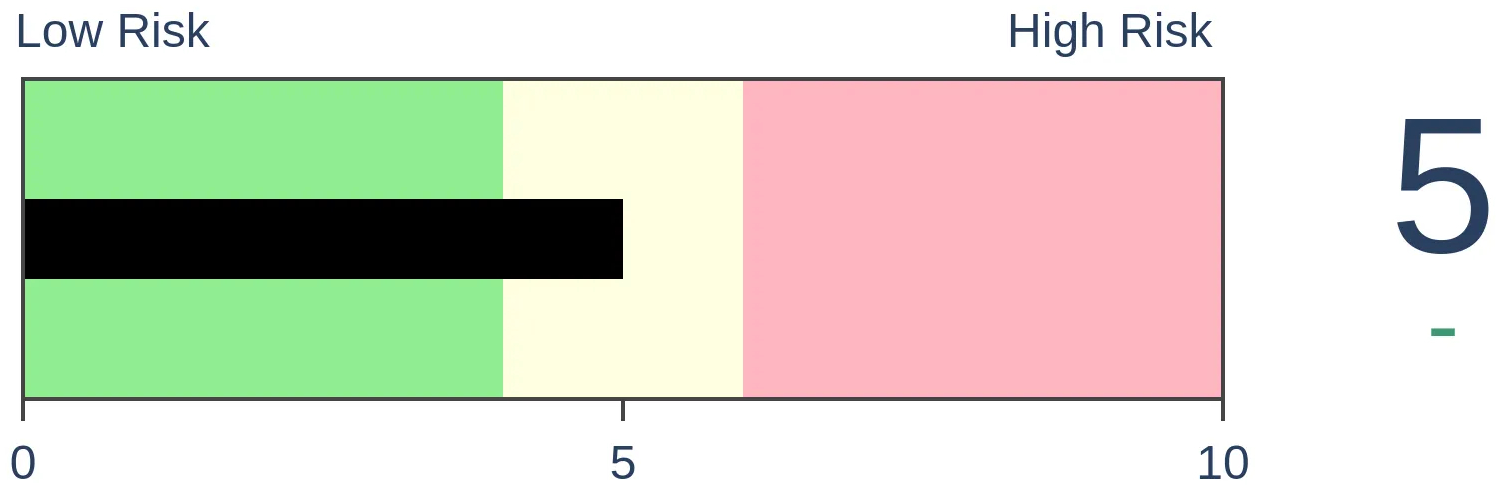
Agriculture
|
|
Research
By Jason Goepfert
BOTTOM LINE
The latest Big Money poll from Barron's shows that smart money investors have tempered their optimistic outlook significantly from where they were in April. That's a mild negative for the next six months for stocks.
FORECAST / TIMEFRAME
None
|
According to some of the largest and most sophisticated investors in the world, stocks are a good place to be. But we may have to suffer some trouble first.
The latest issue of Barron's notes:
America's money managers are optimistic about the long-term outlook for the economy, the financial markets, and the recovery from the Covid pandemic. It's the short-term prognosis that concerns them.
Monetary and fiscal policies are in flux. Supply-chain bottlenecks and labor shortages are igniting inflation and threatening corporate profit margins, and the economic recovery from 2020's recession-so robust until now-is decelerating. Add pricey stock valuations and rising bond yields, and the immediate future suddenly looks more challenging than the recent past.
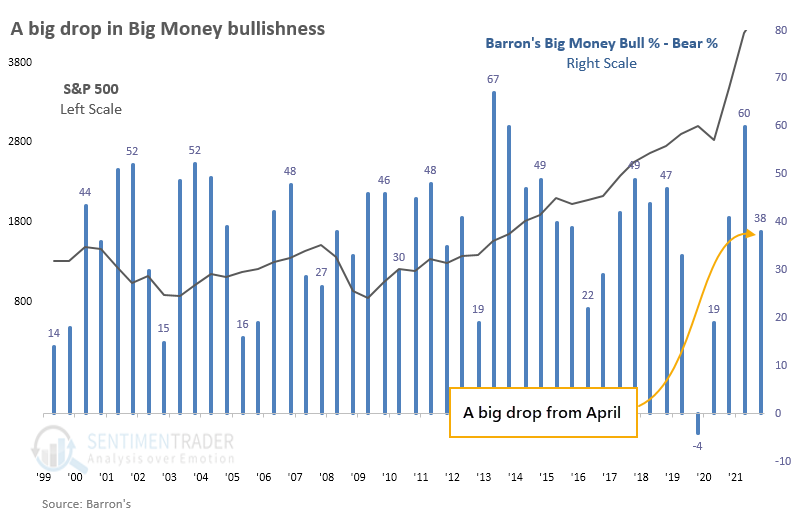
A BIG DROP IN OPTIMISM
In the survey that went out about a month ago, more managers became concerned about stocks. The Bull Ratio fell from 60% in the April survey to 38% now.
The scatter plot below shows returns in the S&P 500 from one survey to the next vs. the Big Money Bull Ratio. The trendline slopes up and to the right, suggesting that the more bullish the Big Money is, the better the S&P's future returns were. A true contrary indicator would show a trendline that slopes down and to the right. There is a lot of variability among the data points, though.
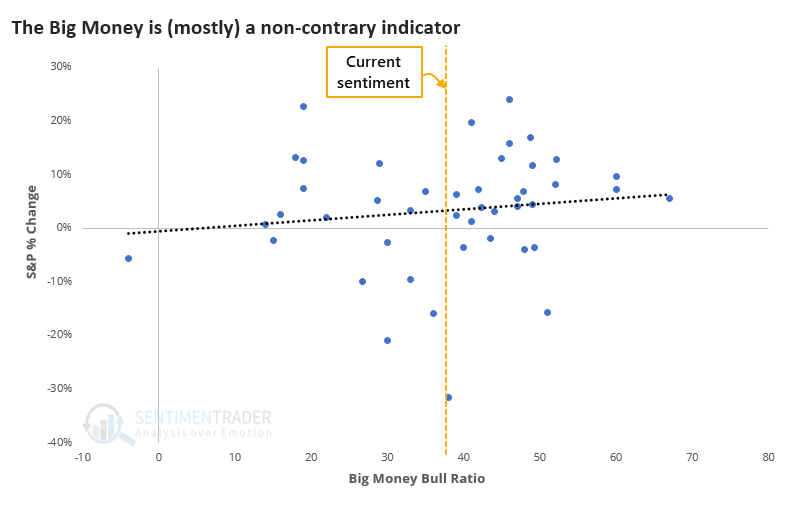
When we look at each issue and the Big Money Bull Ratio versus the S&P 500's returns until the next survey (about six months), we can see this more specifically.
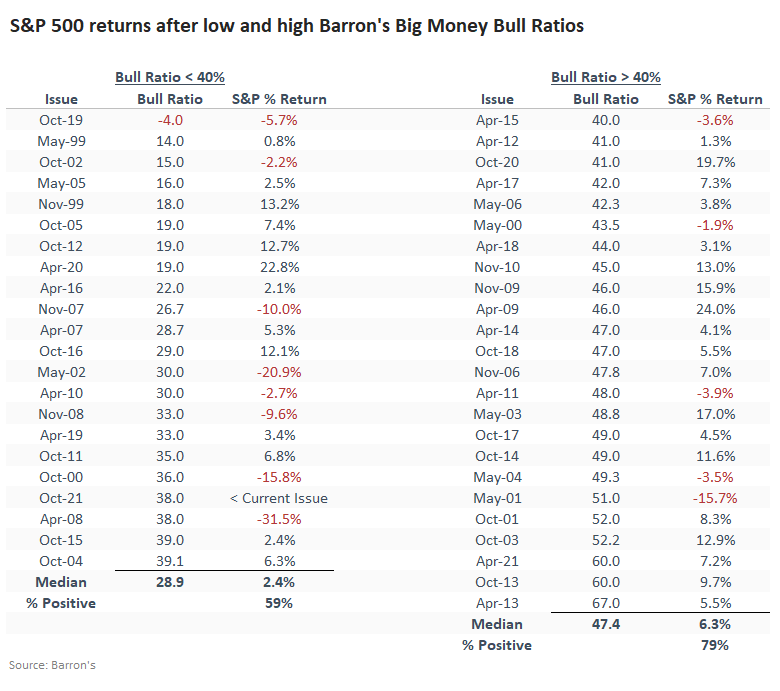
When the Bull Ratio was below 40%, as it is now, the S&P returned a median 2.4% until the next survey. It sported a positive return 59% of the time. But when the Bull Ratio was above 40%, then the S&P returned a much healthier 6.3% over the next (approximately) six months, and was positive after 79% of the surveys.
So, it was a better sign for stocks when managers were more bullish as opposed to less bullish.
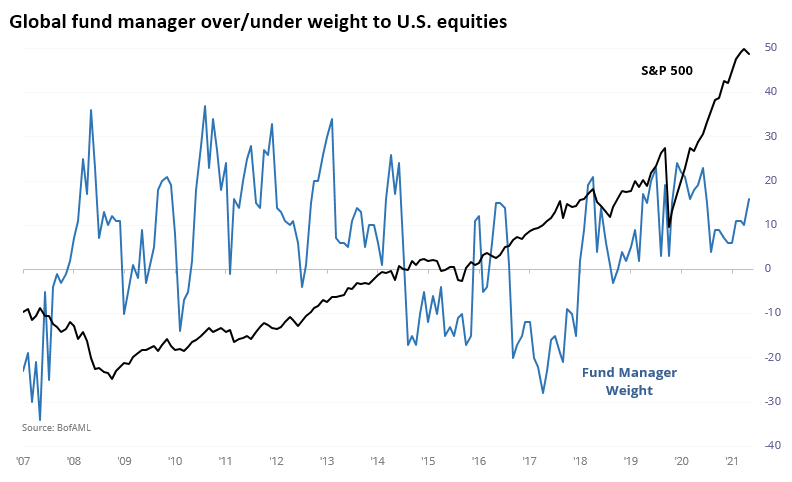
OTHER MONEY MANAGERS ARE ALSO MODESTLY OPTIMISTIC
Another "smart money" survey, from Bank of America Merrill Lynch, shows that fund managers are a net 16% overweight U.S. stocks, a middling amount relative to their history.
These folks have an even more mixed record at being over/underweight stocks at the right times. The regression line is about flat, suggesting there is very little relationship between how bullish the managers are positioned and the S&P 500's return over the next six months.
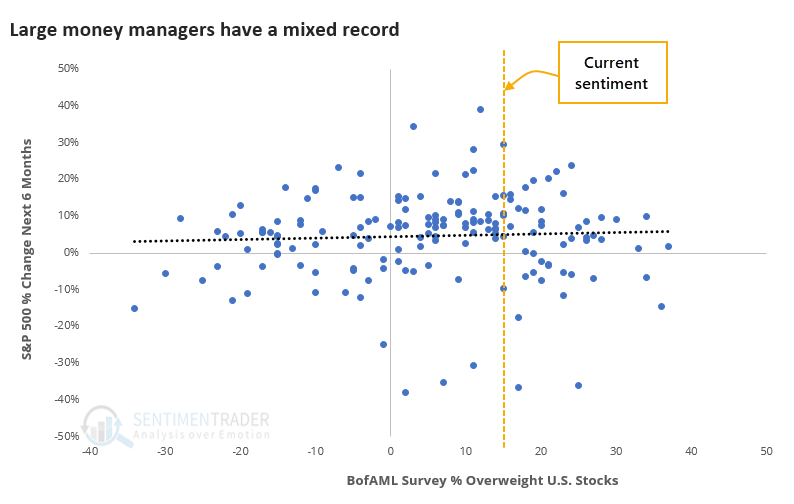
When these managers were modestly overweight, like between 10% - 20%, then the S&P did tend to rise, with a positive return 79% of the time. That's just slightly better than any random 6-month stretch over the study period, so it doesn't tell us much. Except maybe don't read too much into any headlines about how the managers might be positioned at the moment.
We've looked at these surveys every which way over the past 20 years, with the conclusion that they're mostly just interesting. They generate headlines because everyone wants to believe that large money managers have a crystal ball, and they don't.
These are some very smart and savvy folks but they suffer from groupthink like all of us. When they become extremely bullish or bearish, there may be a very slight contrary nature to their behavior, but overall it's better to be bullish when they are. The two surveys are giving off slightly different vibes, with the overall takeaway being a wash. It's not enough for us to be concerned about the prospects for stocks, and also not enough to generate a lot of excitement. Maybe a very slight edge to the "stocks should go up" crowd.
Active Studies
| Time Frame | Bullish | Bearish | | Short-Term | 1 | 0 | | Medium-Term | 7 | 0 | | Long-Term | 11 | 5 |
|
Indicators at Extremes
Portfolio
| Position | Description | Weight % | Added / Reduced | Date | | Stocks | RSP | 10.5 | Added 6.4% | 2021-10-01 | | Bonds | 23.9% BND, 6.9% SCHP | 31.5 | Reduced 7.1% | 2021-05-19 | | Commodities | GCC | 2.6 | Reduced 2.1%
| 2020-09-04 | | Precious Metals | GDX | 4.2 | Reduced 4.2% | 2021-05-19 | | Special Situations | 9.8% KWEB, 4.7% XLE, 2.9% PSCE | 17.3 | Added 9.78% | 2021-10-01 | | Cash | | 34.0 | | |
|
Updates (Changes made today are underlined)
Much of our momentum and trend work has remained positive for several months, with some scattered exceptions. Almost all sentiment-related work has shown a poor risk/reward ratio for stocks, especially as speculation drove to record highs in exuberance in February. Much of that has worn off, and most of our models are back toward neutral levels. There isn't much to be excited about here. The same goes for bonds and even gold. Gold has been performing well lately and is back above long-term trend lines. The issue is that it has a poor record of holding onto gains when attempting a long-term trend change like this, so we'll take a wait-and-see approach. Momentum has ebbed quickly in recent weeks, and nearing oversold levels in some indicators. This can be a dangerous area, with a lot of short-term volatility, but we'd be more inclined to add medium- to long-term exposure rather than sell on much more of a decline, thanks to already rock-bottom exposure. Other areas look more attractive, including some overseas markets. RETURN YTD: 11.8% 2020: 8.1%, 2019: 12.6%, 2018: 0.6%, 2017: 3.8%, 2016: 17.1%, 2015: 9.2%, 2014: 14.5%, 2013: 2.2%, 2012: 10.8%, 2011: 16.5%, 2010: 15.3%, 2009: 23.9%, 2008: 16.2%, 2007: 7.8%
|
|
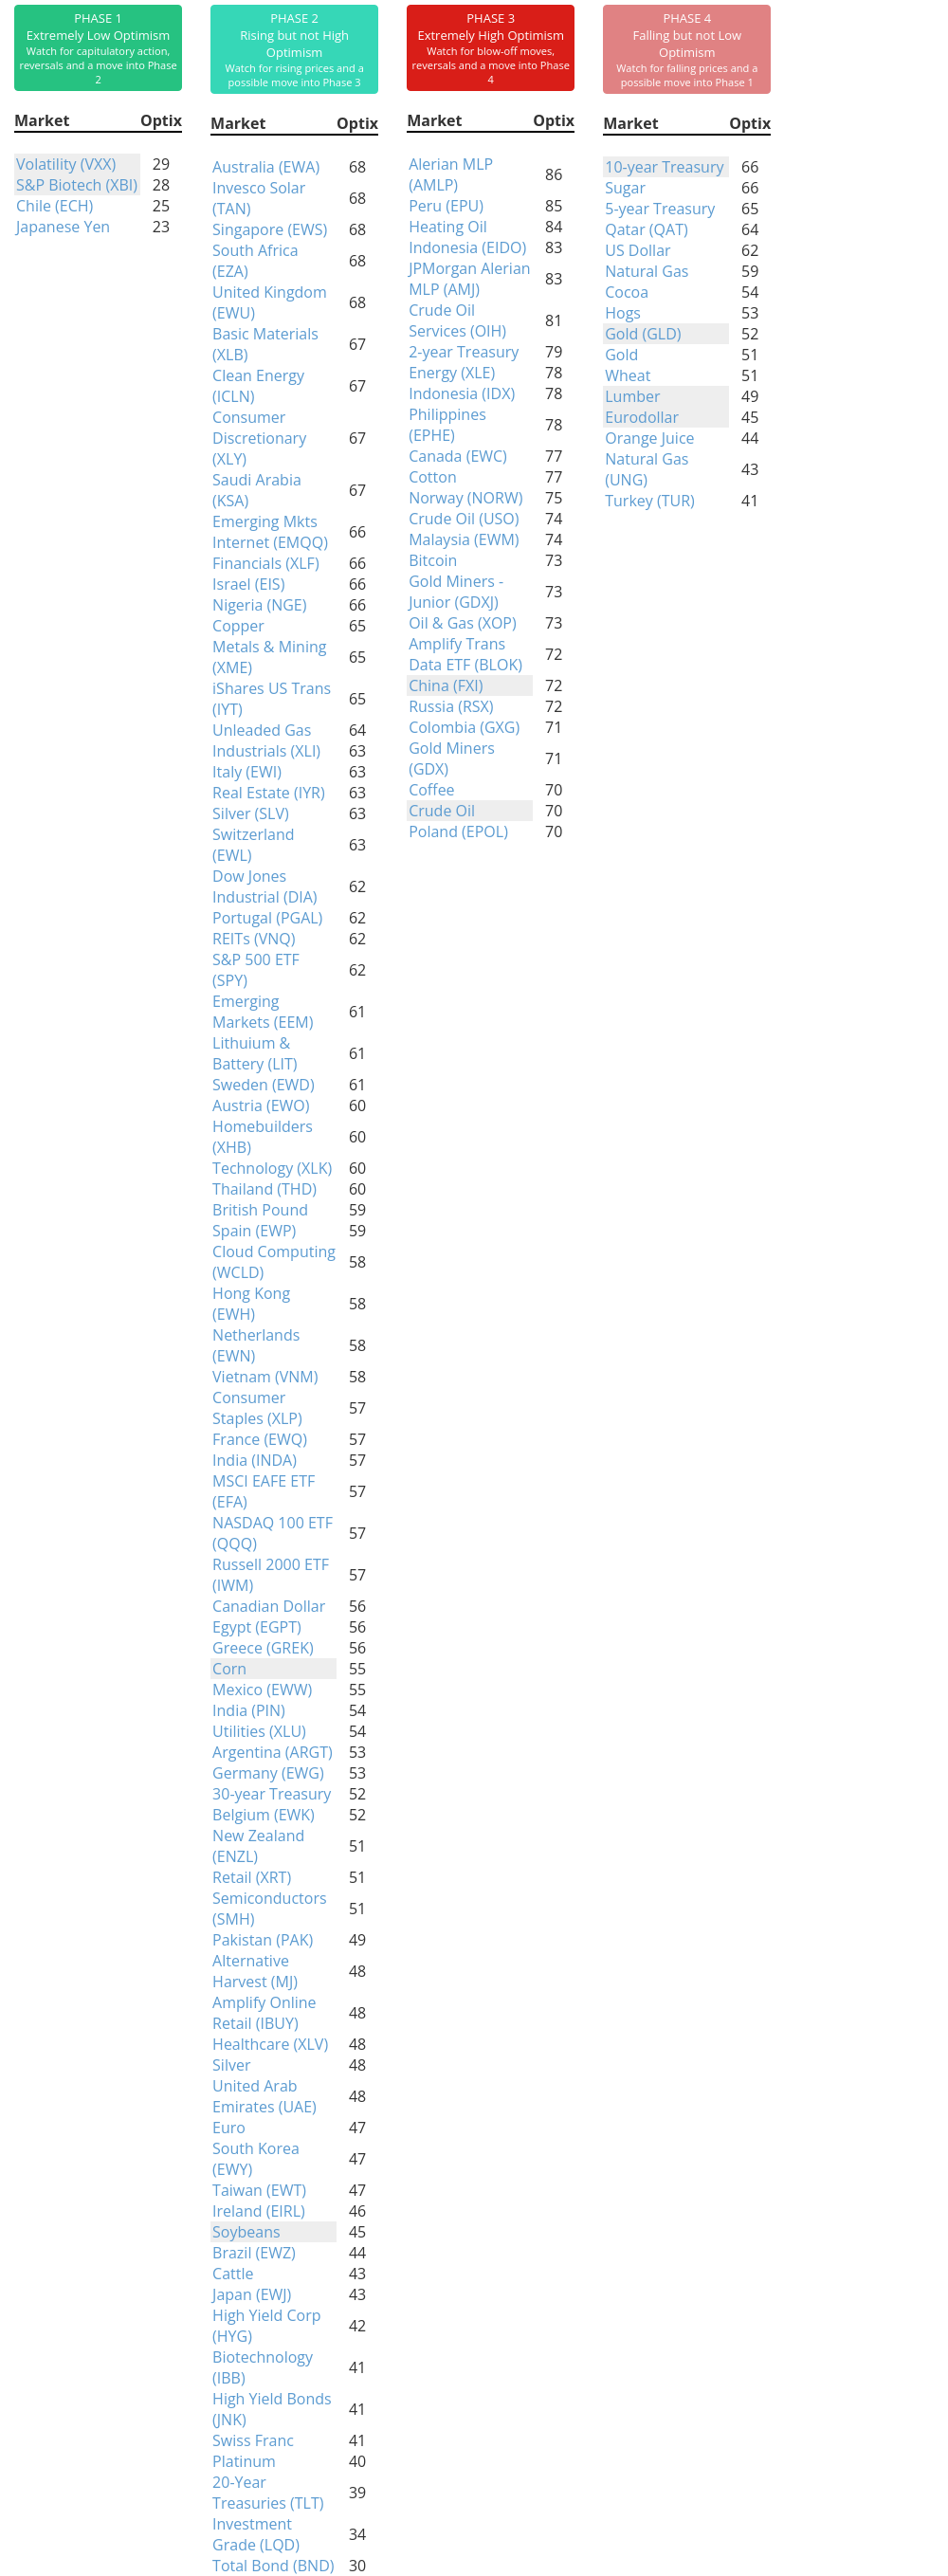
Phase Table
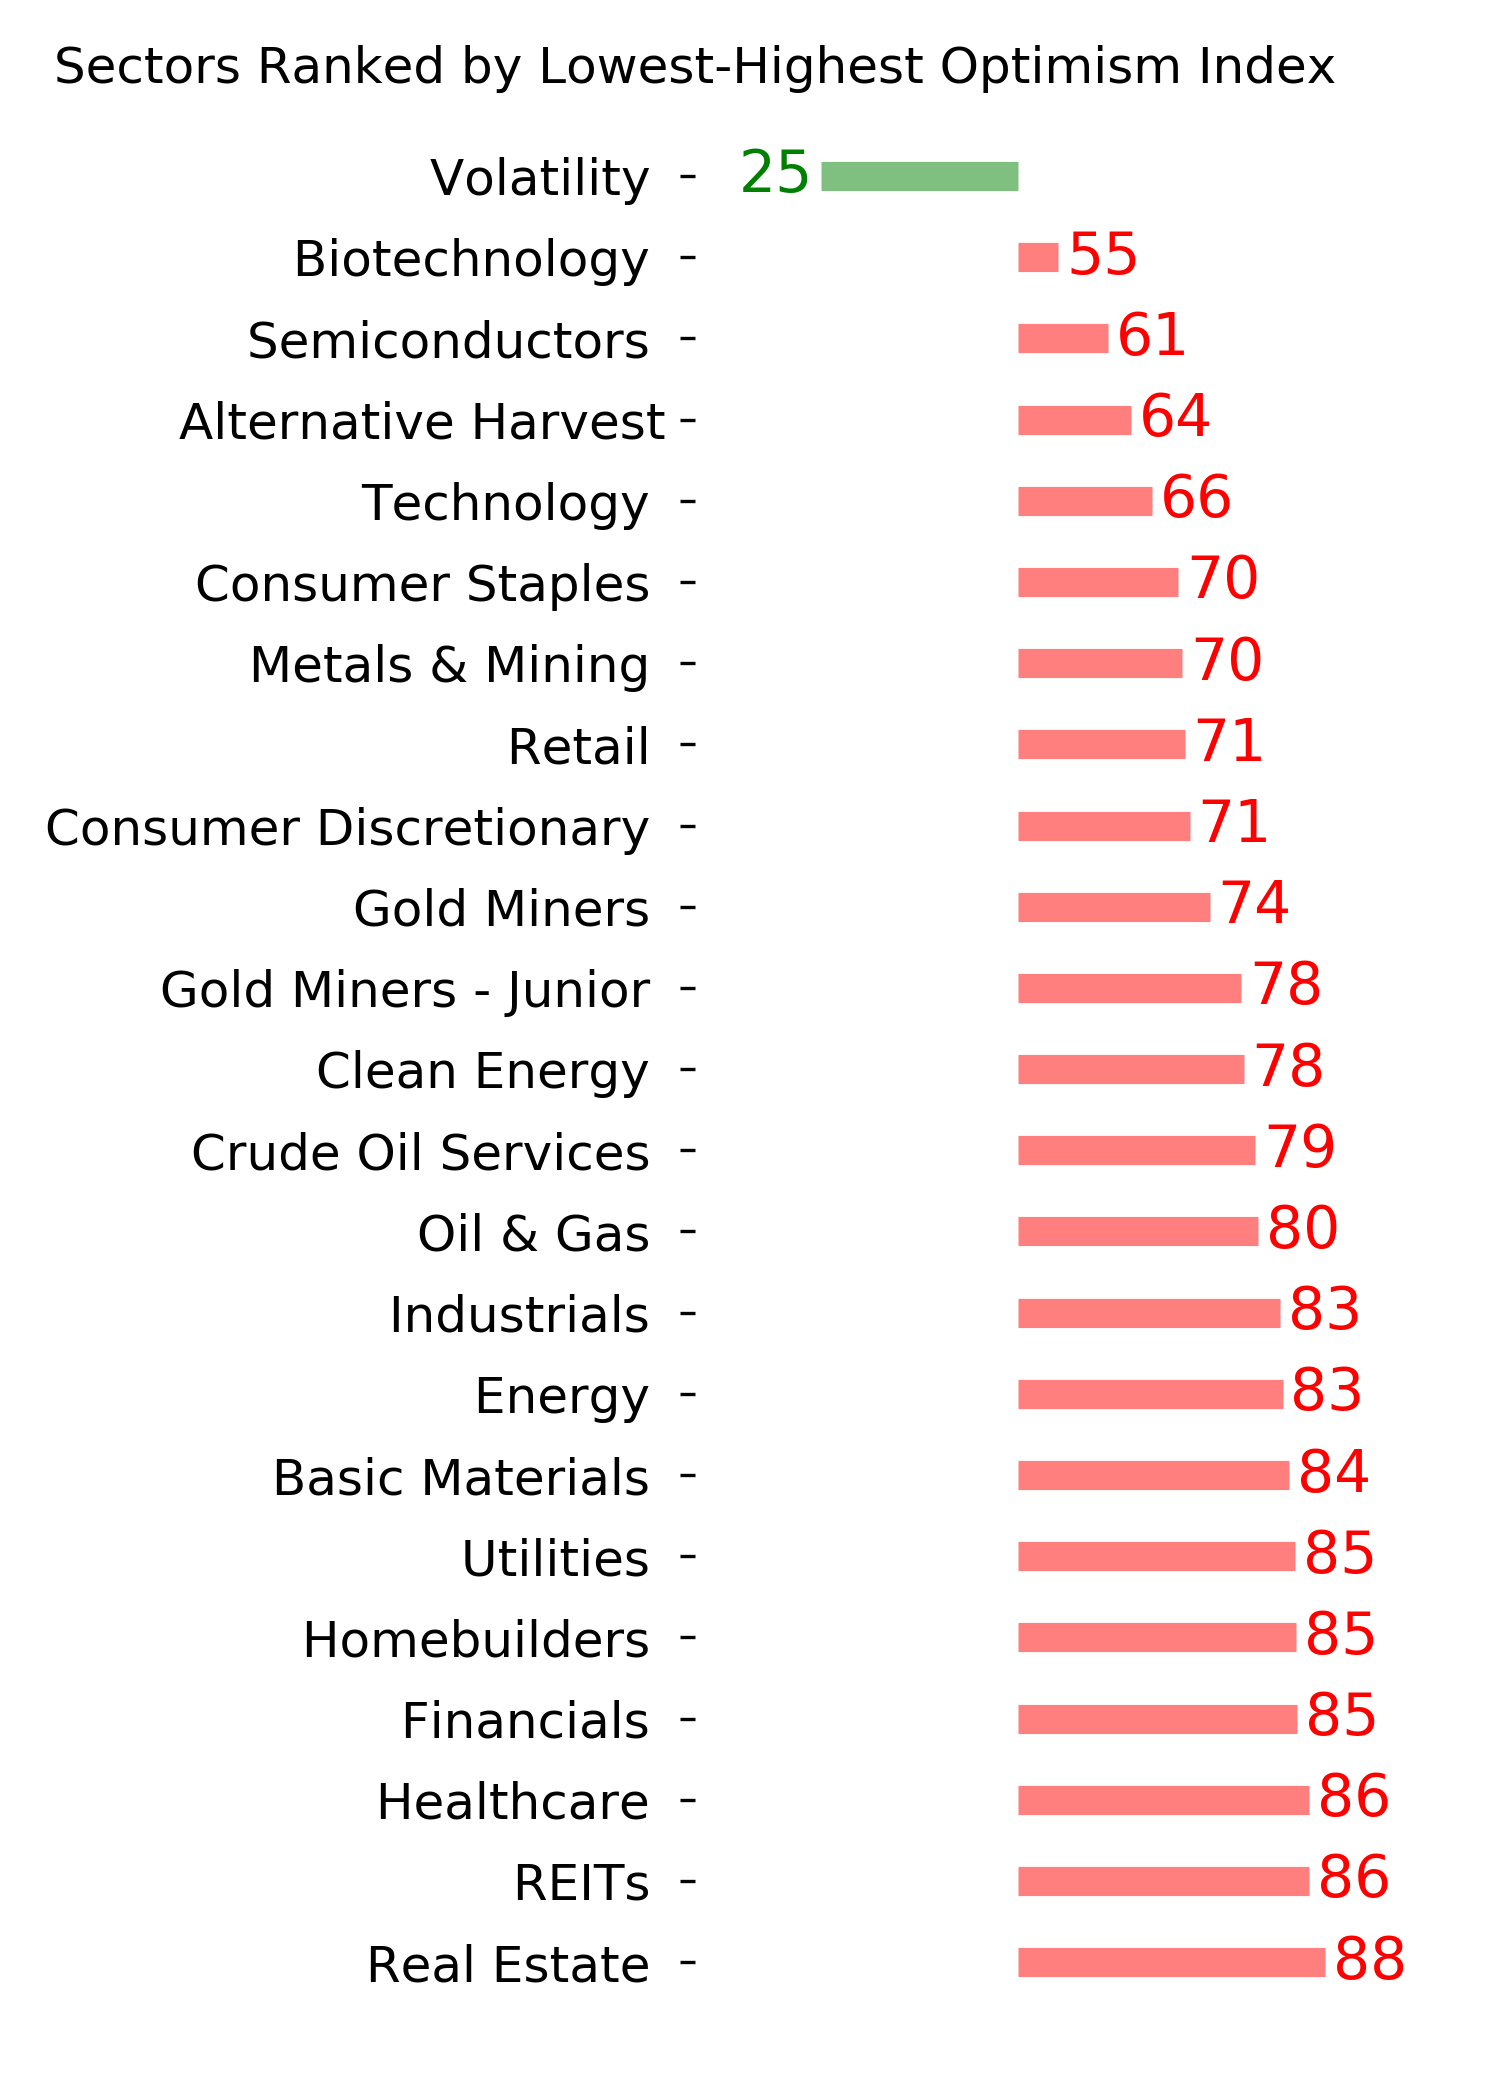
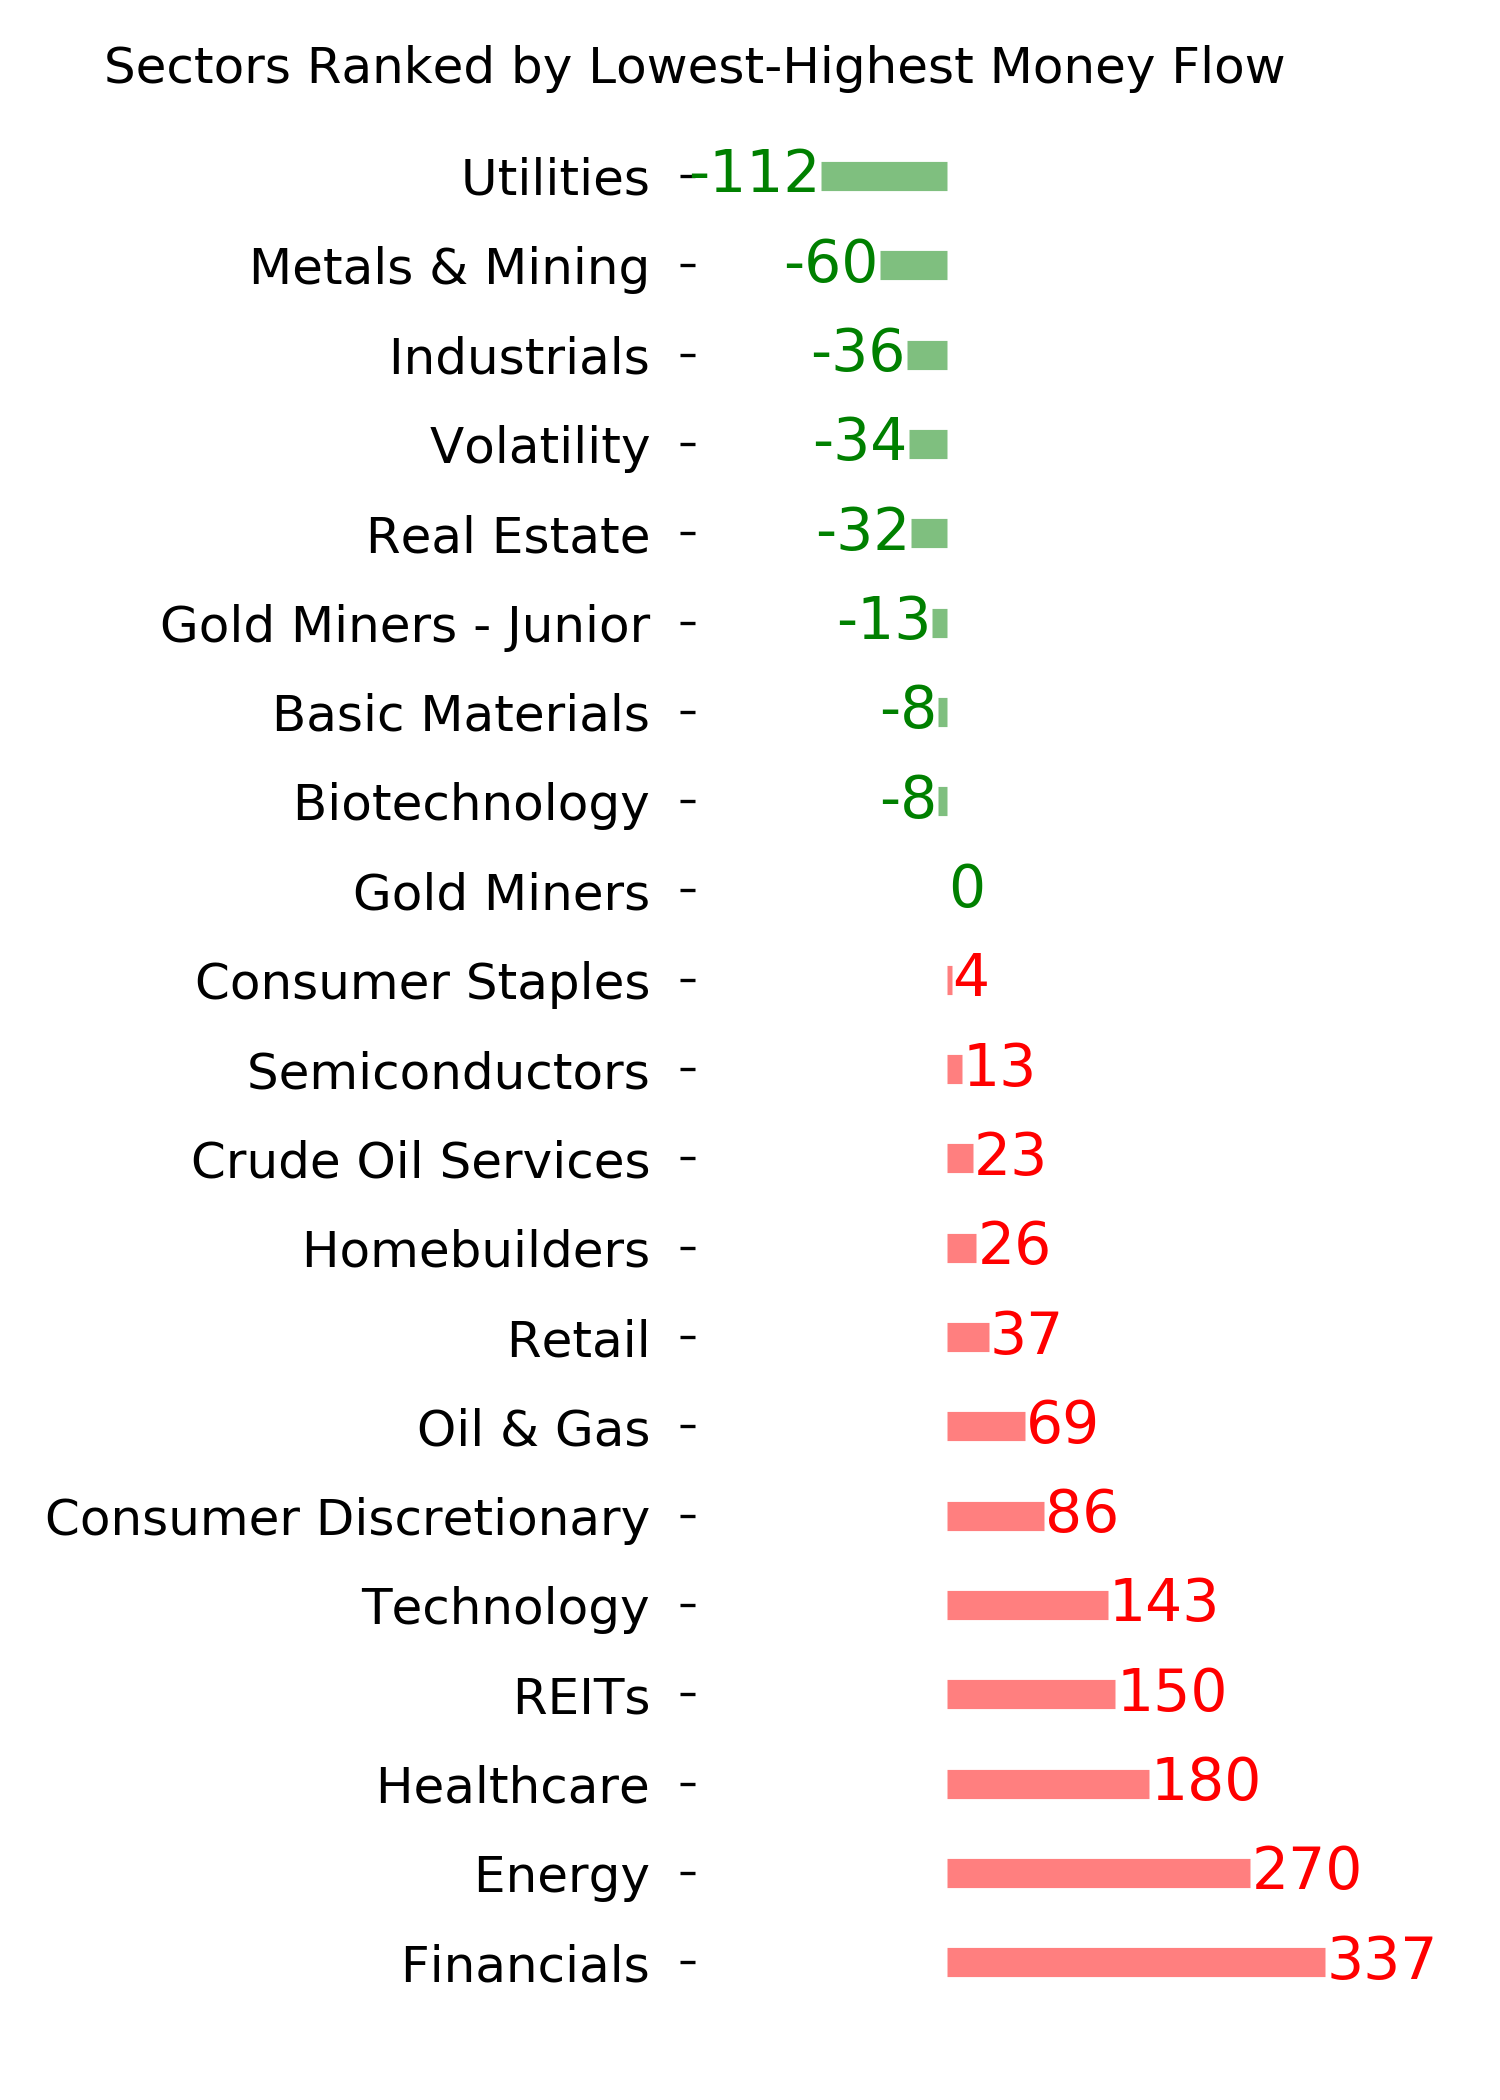
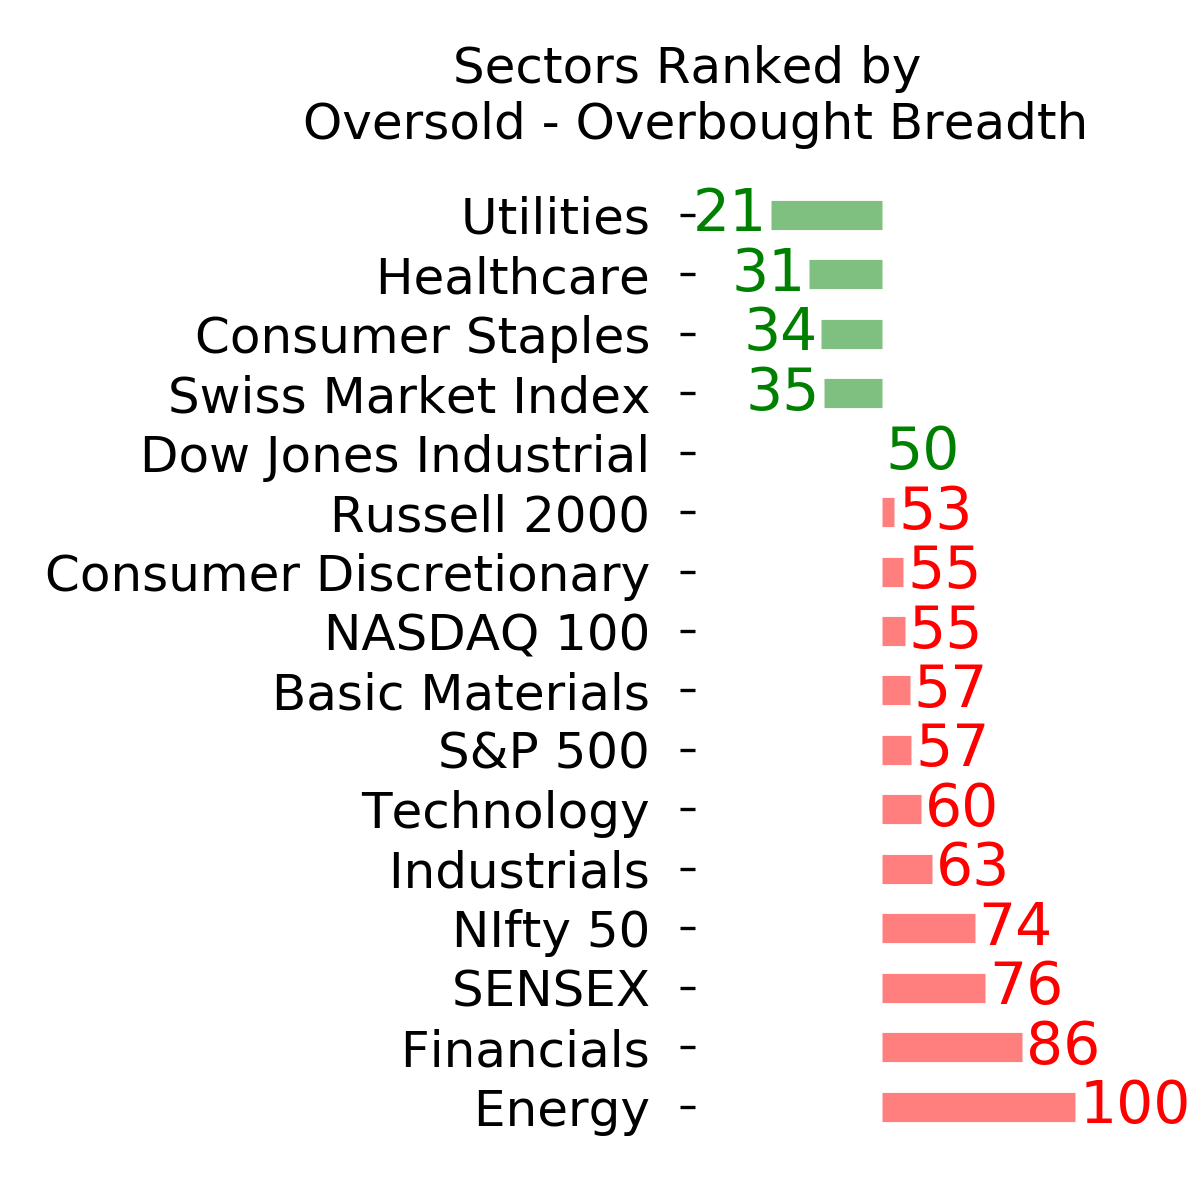
Ranks
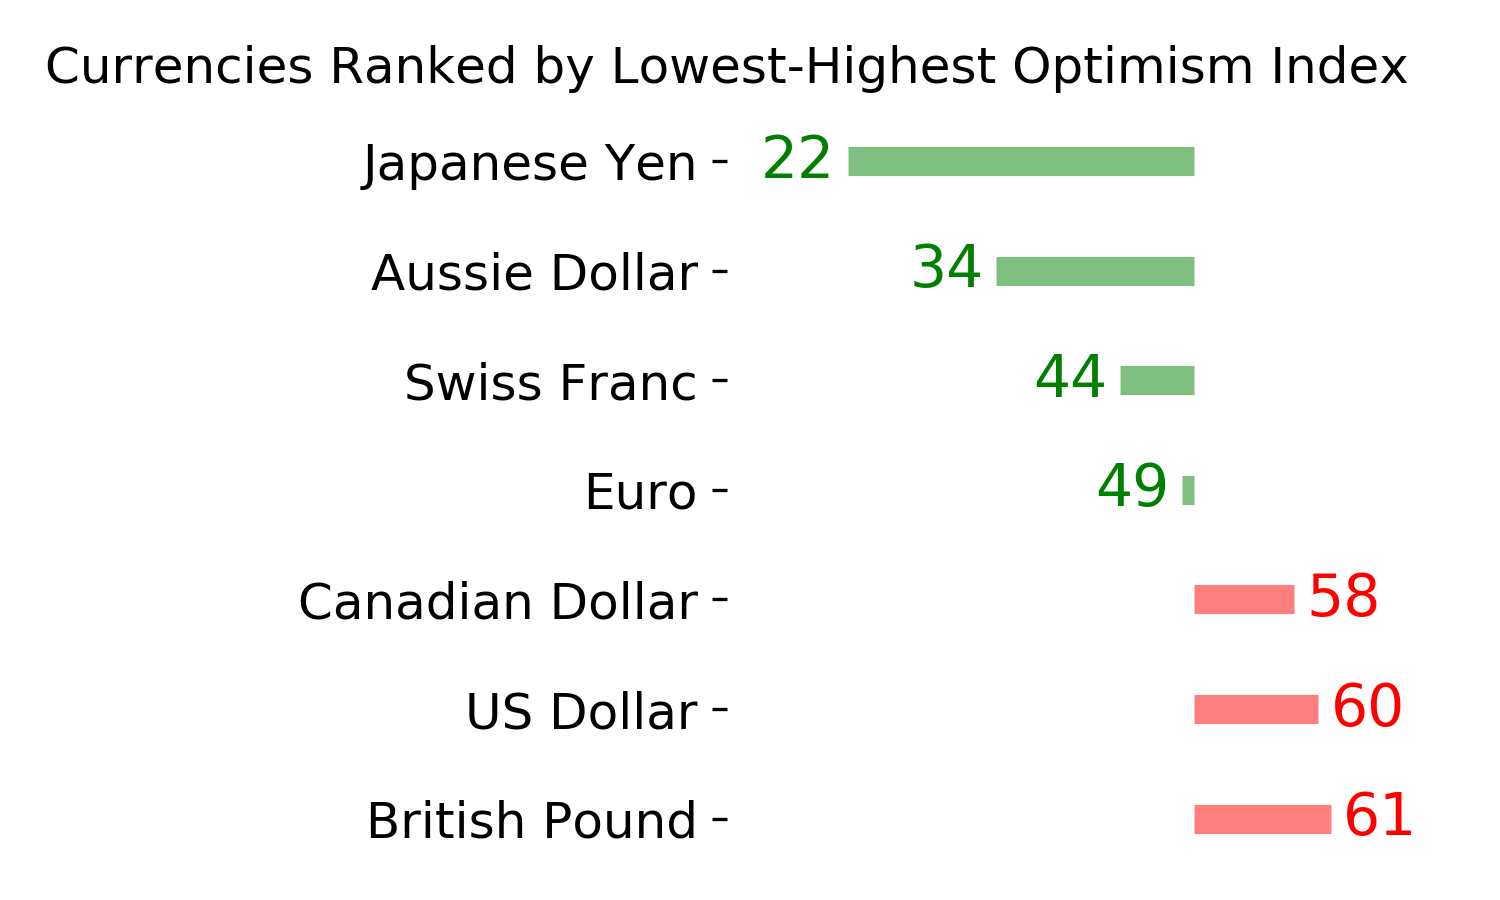
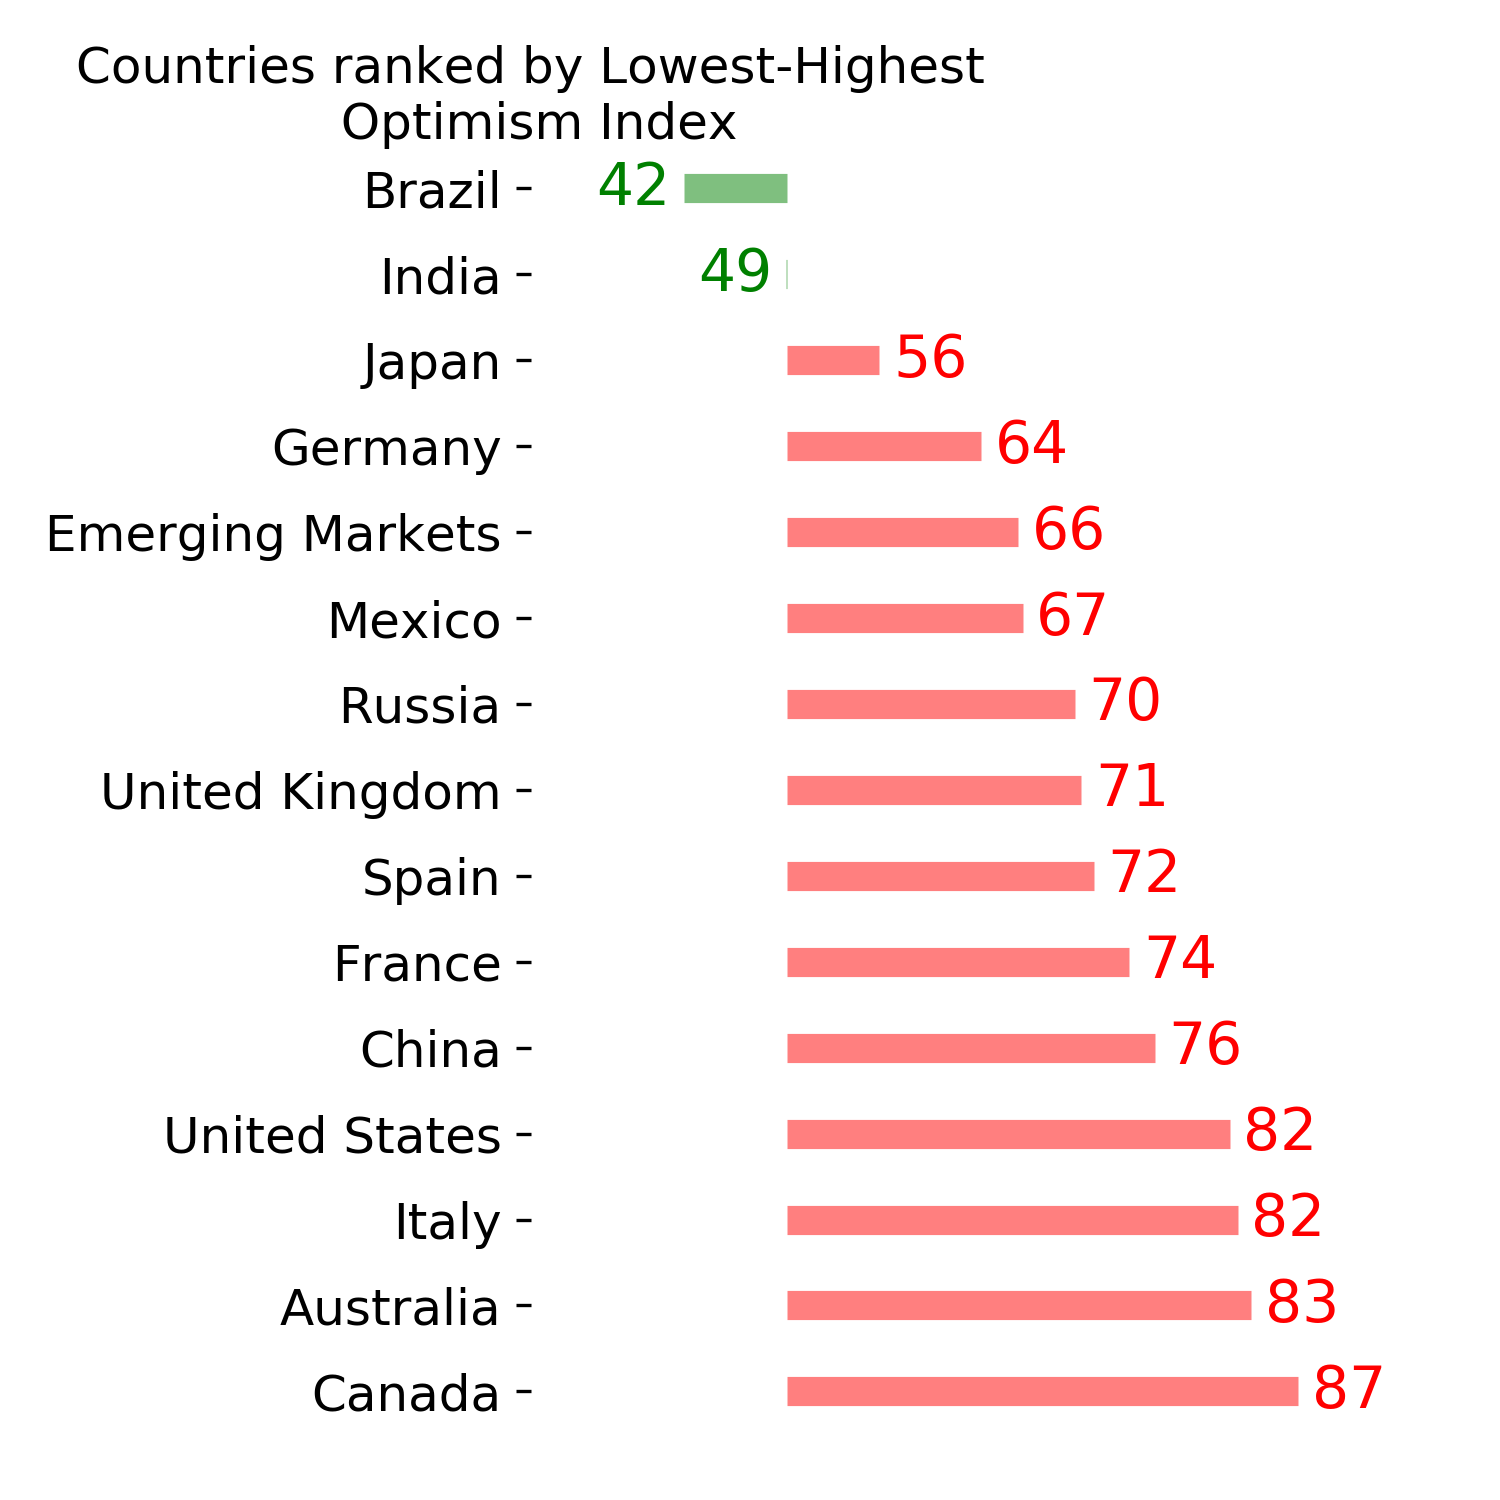
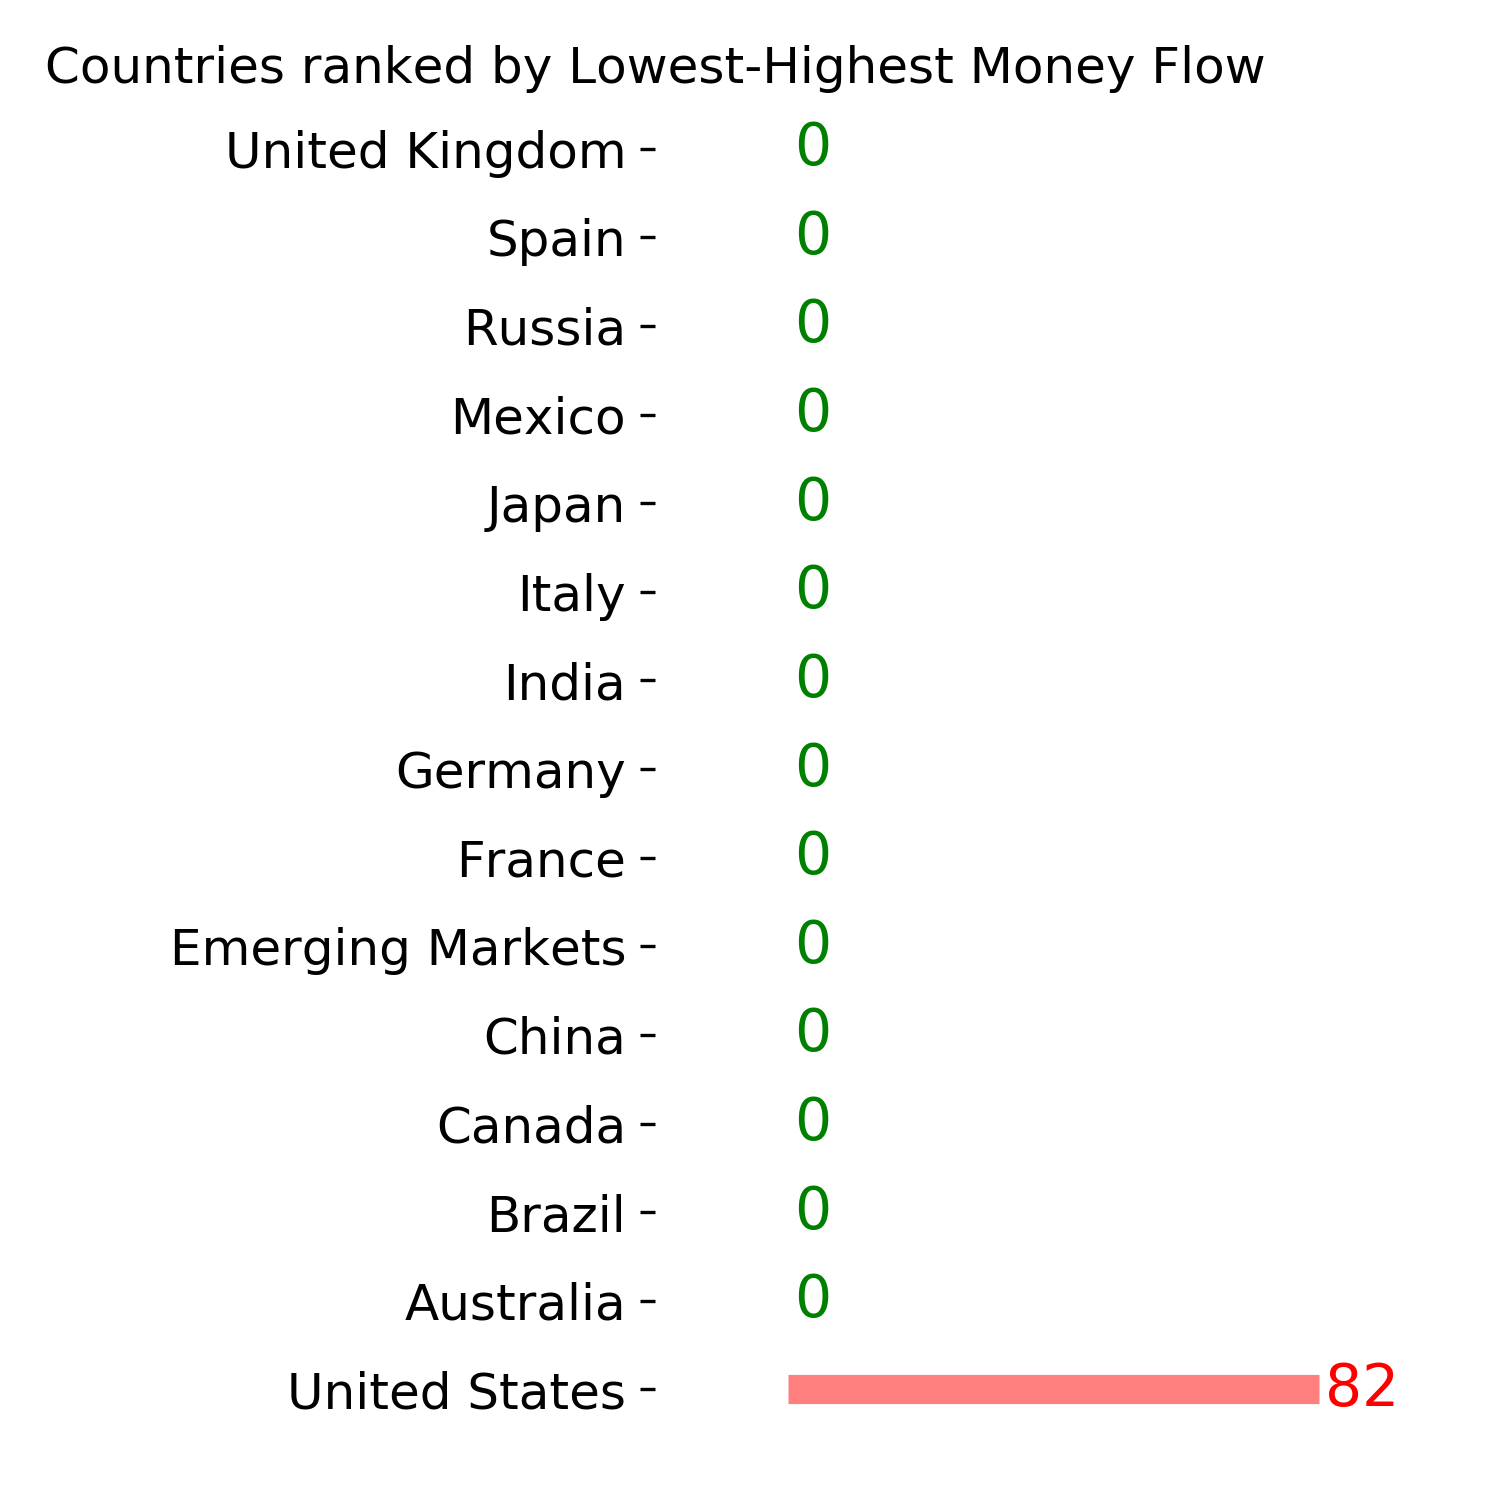
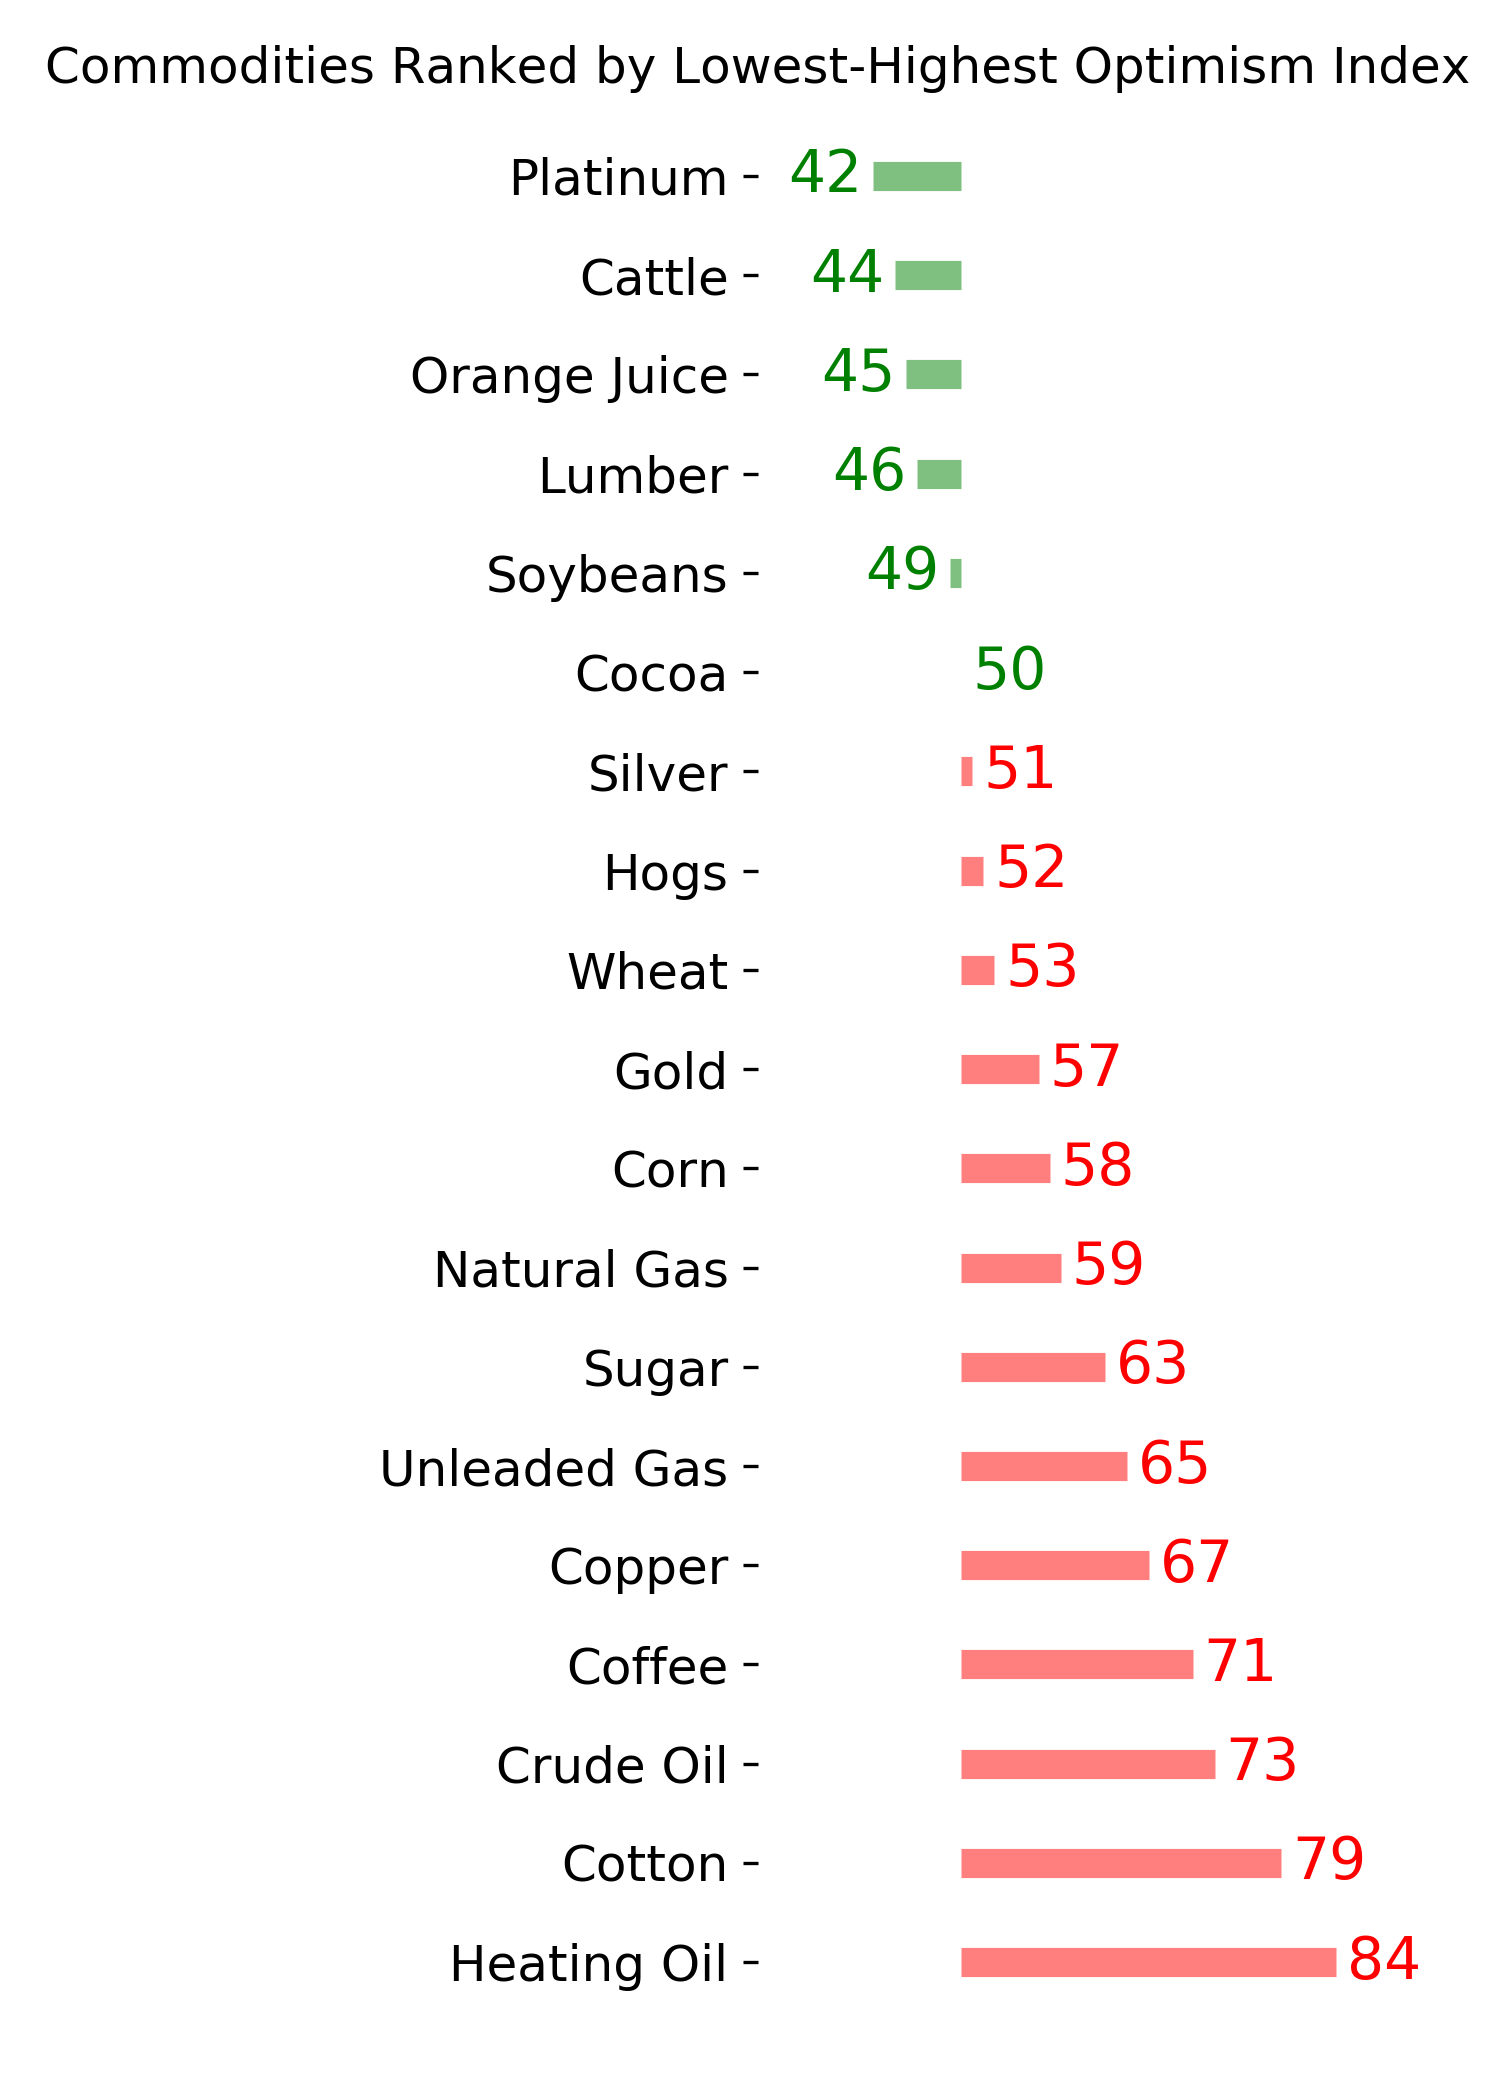
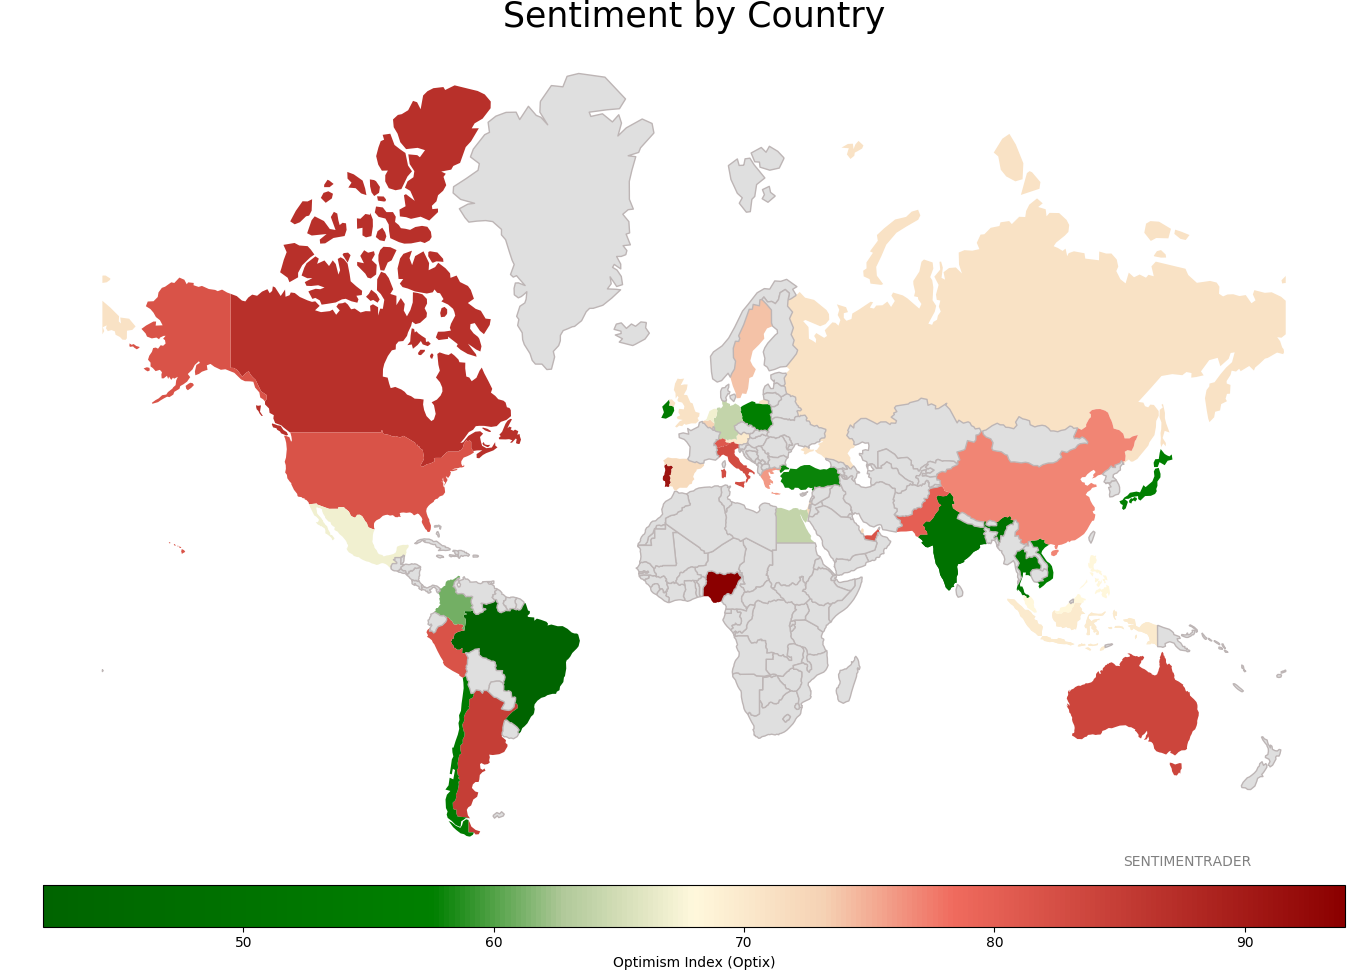
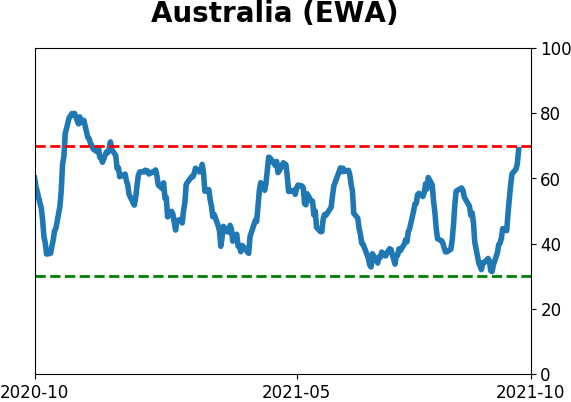
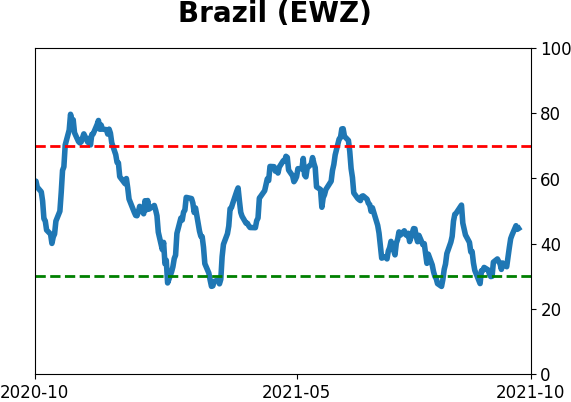
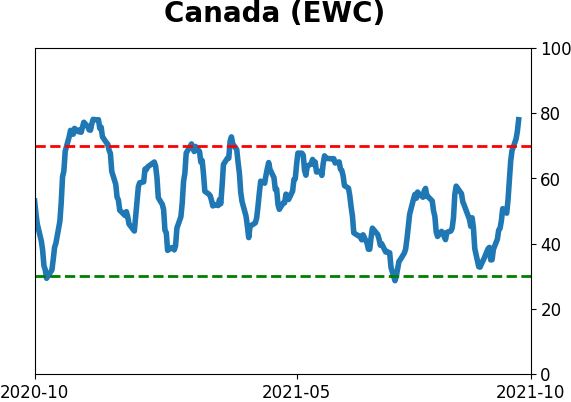
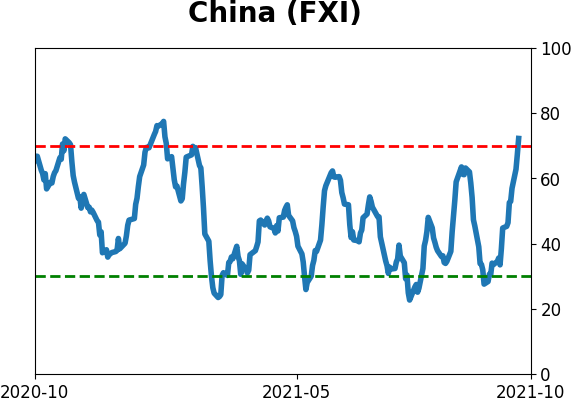
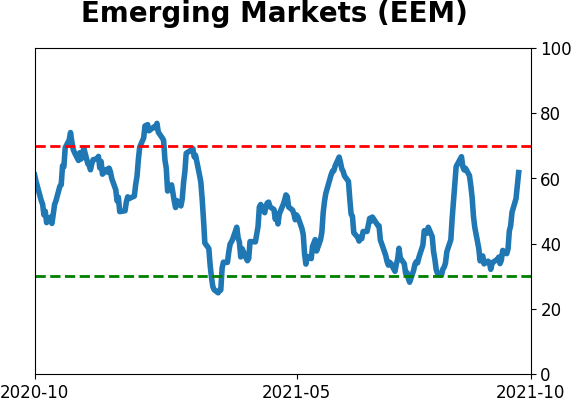
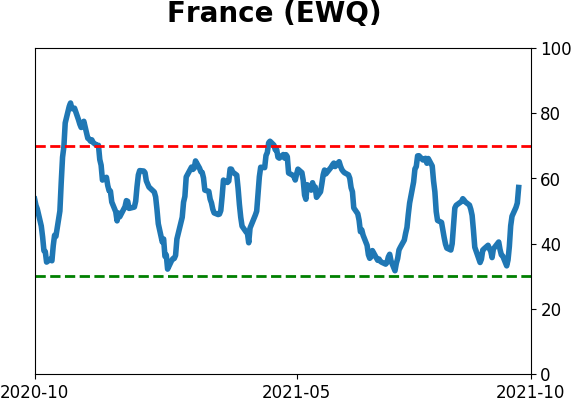
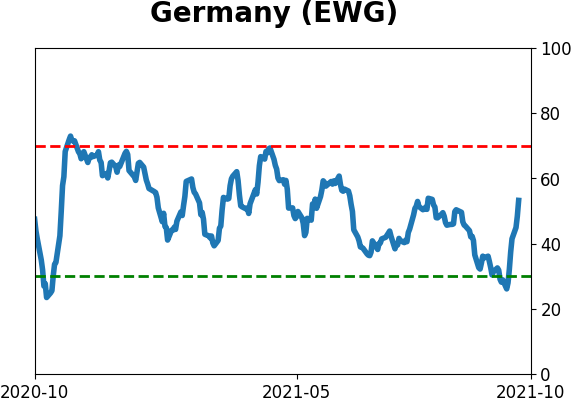
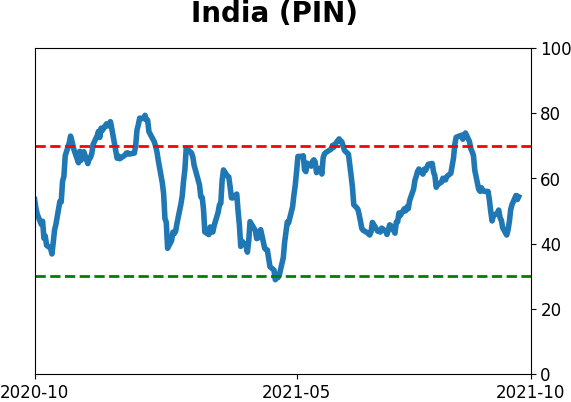
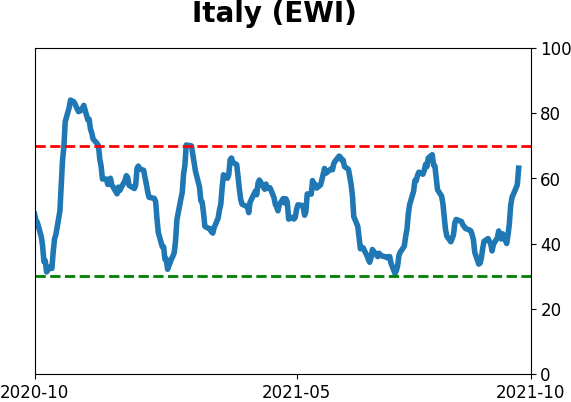
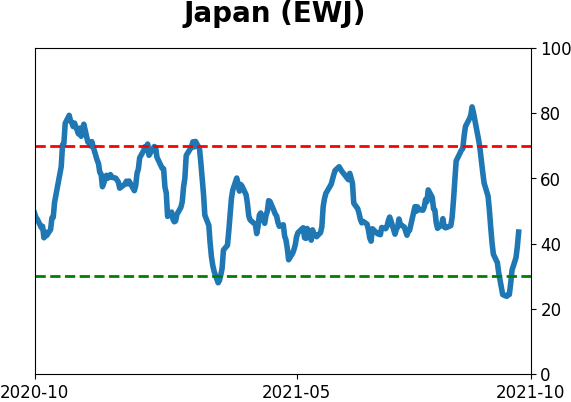
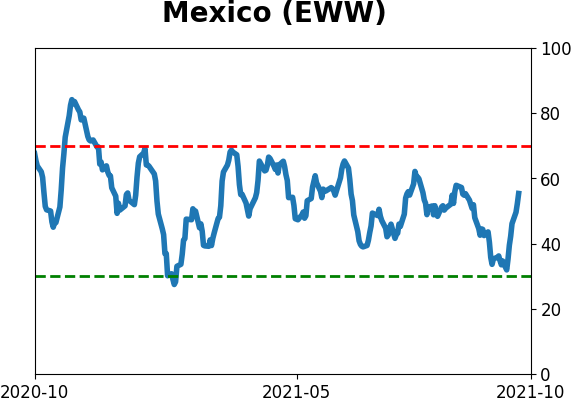
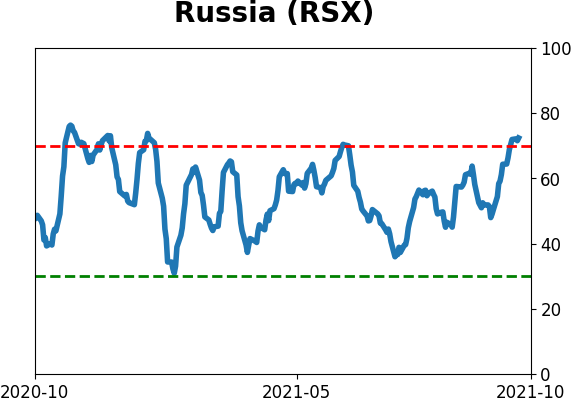
Sentiment Around The World
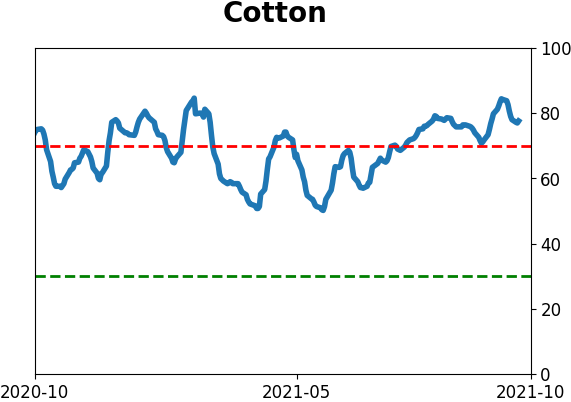
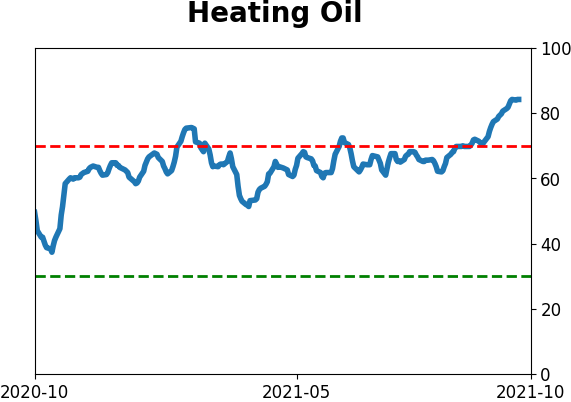
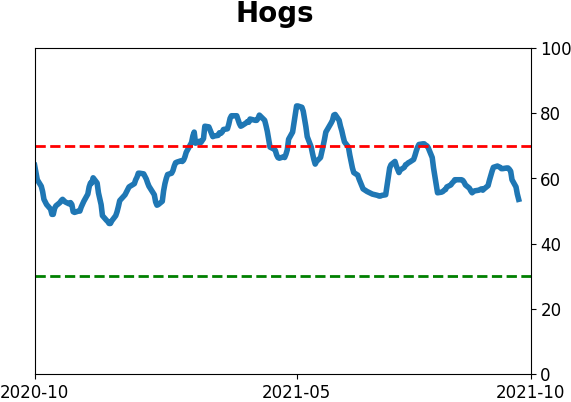
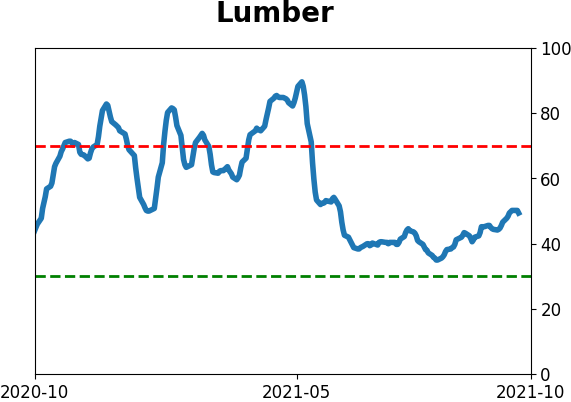
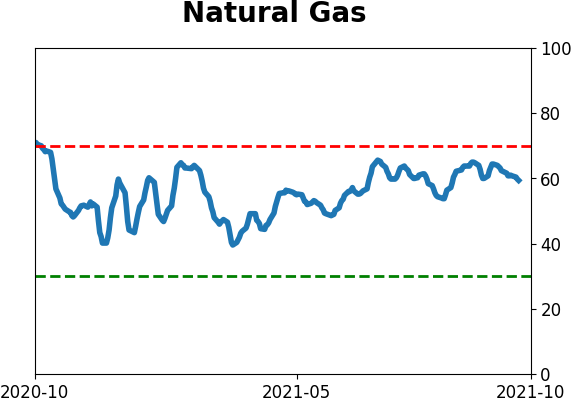
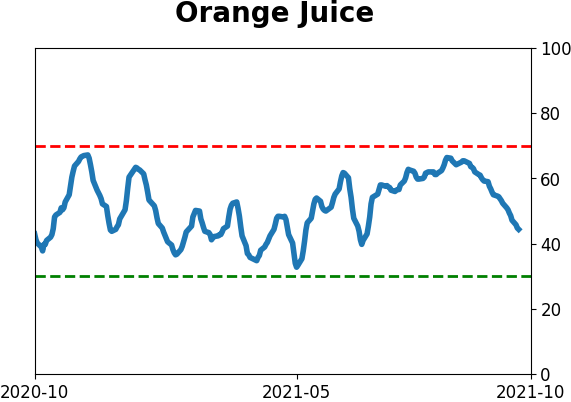
Optimism Index Thumbnails
|
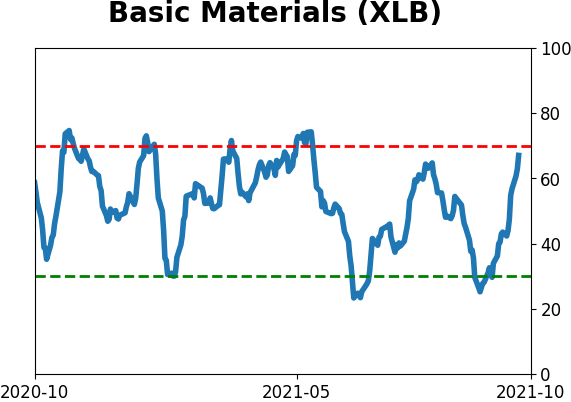
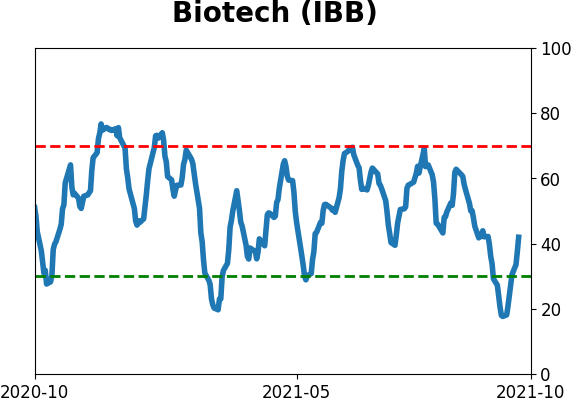
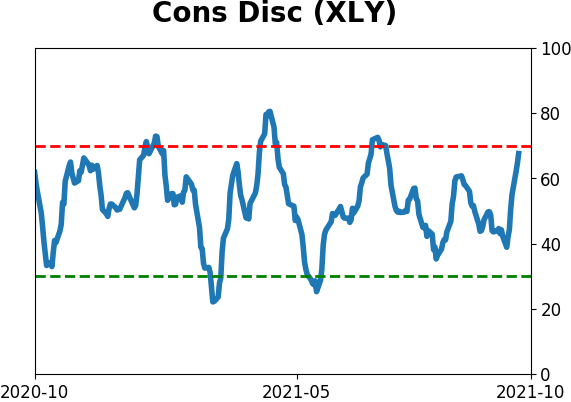
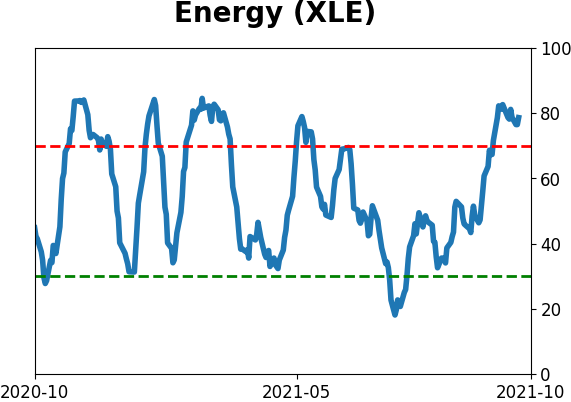
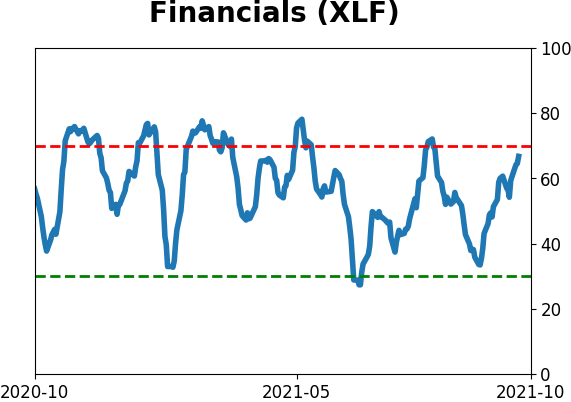
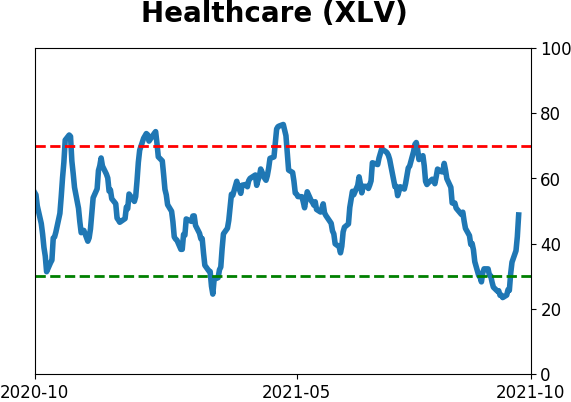
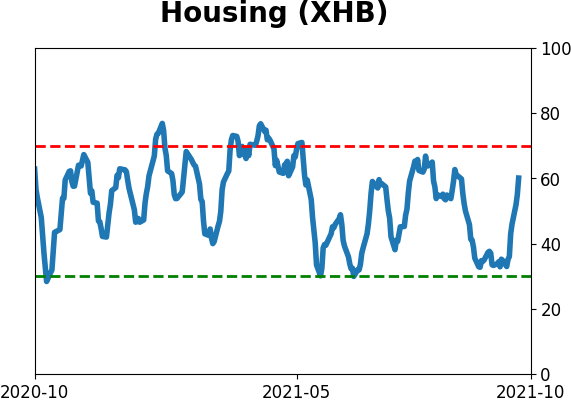
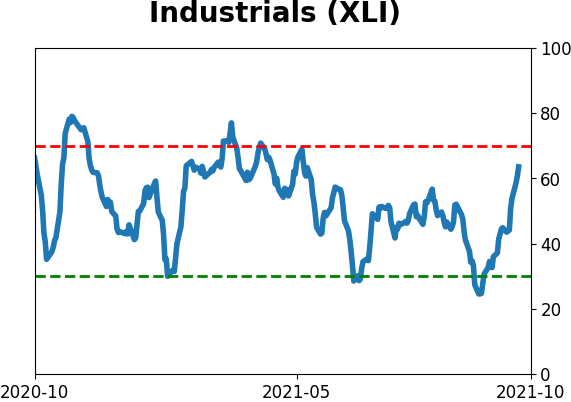
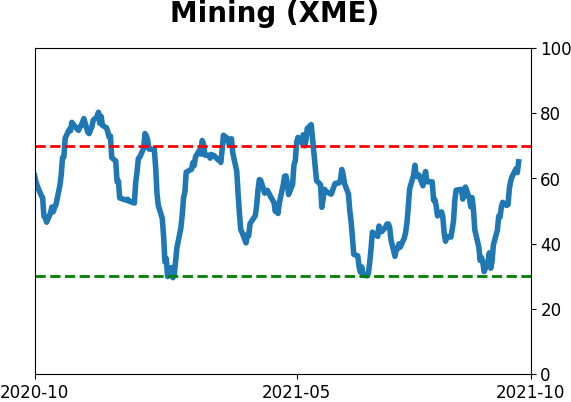
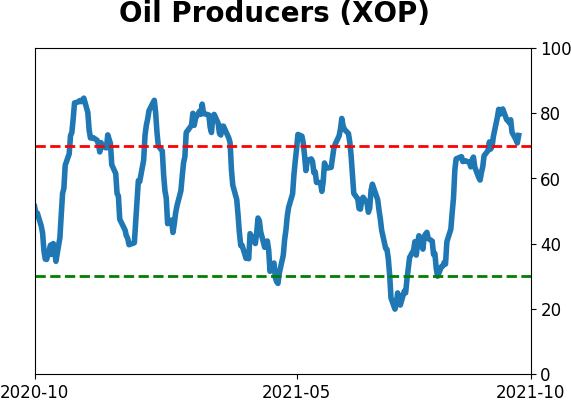
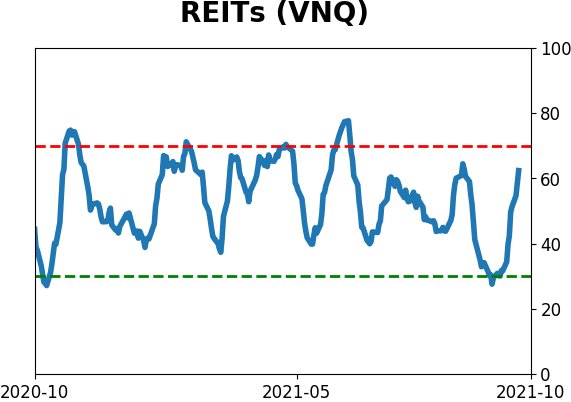
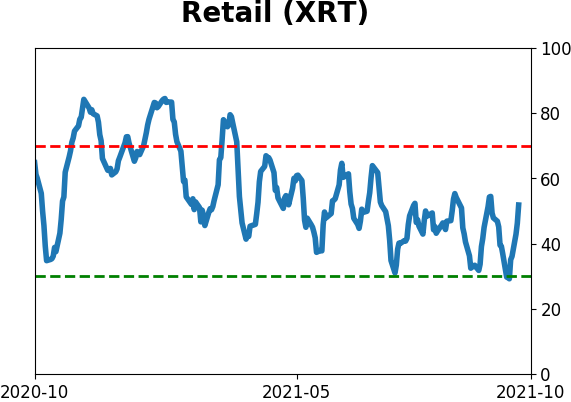
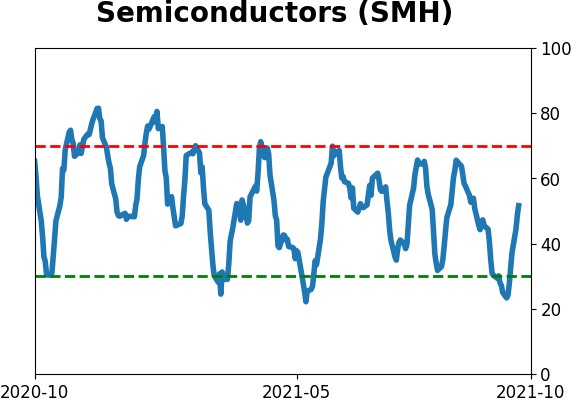
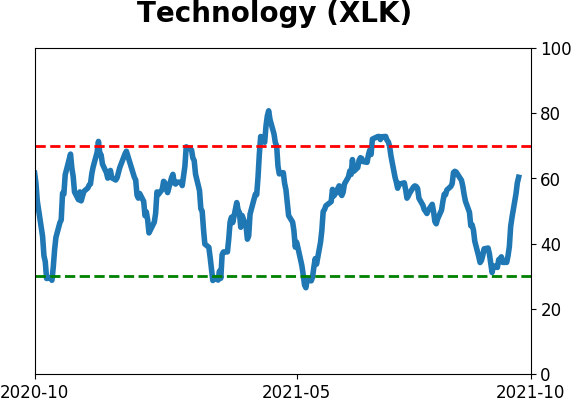
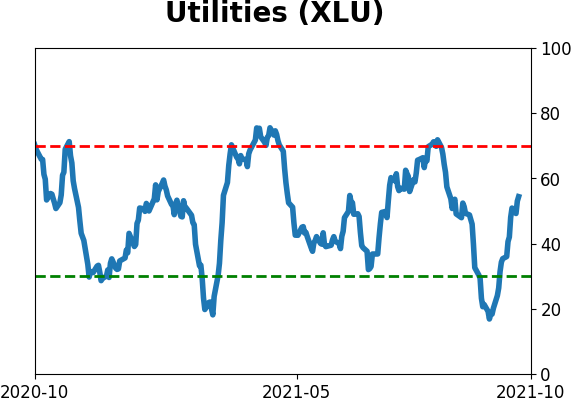
Sector ETF's - 10-Day Moving Average
|
|
|
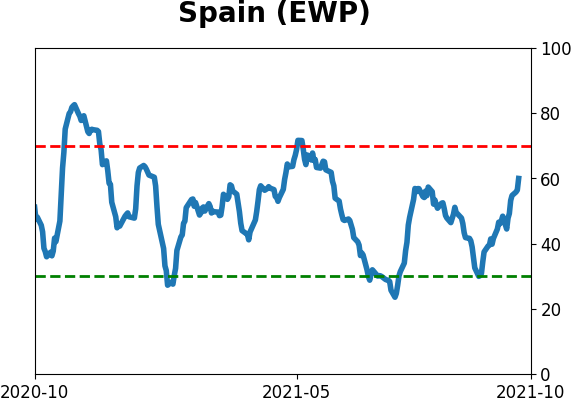
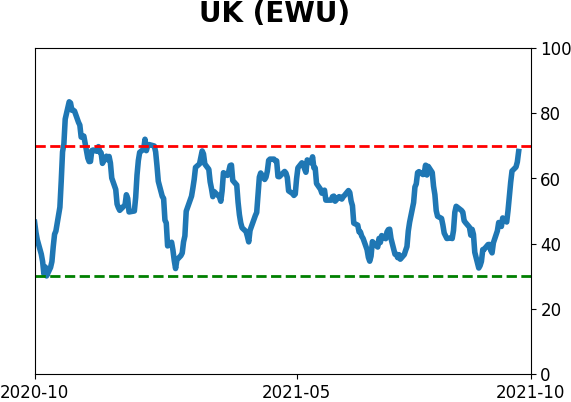
Country ETF's - 10-Day Moving Average
|
|
|
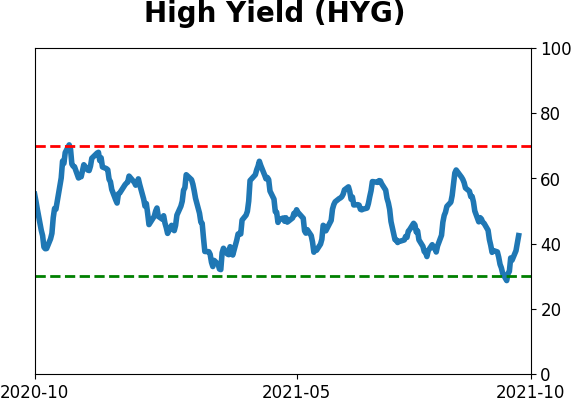
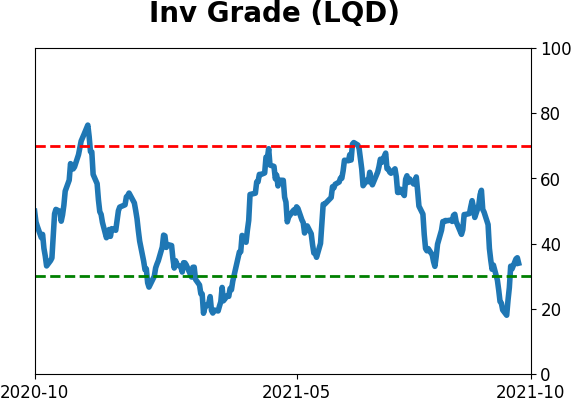
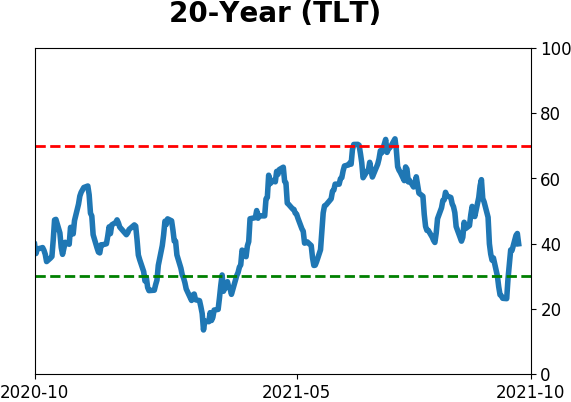
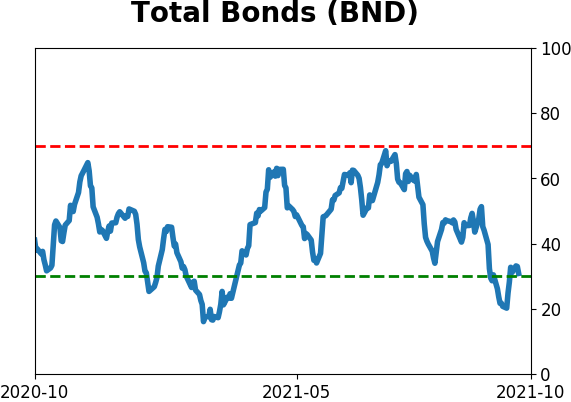
Bond ETF's - 10-Day Moving Average
|
|
|
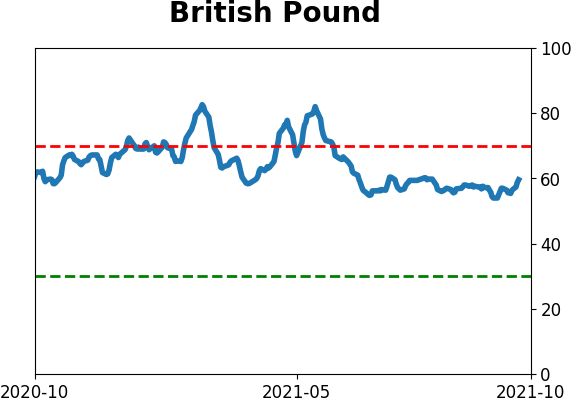
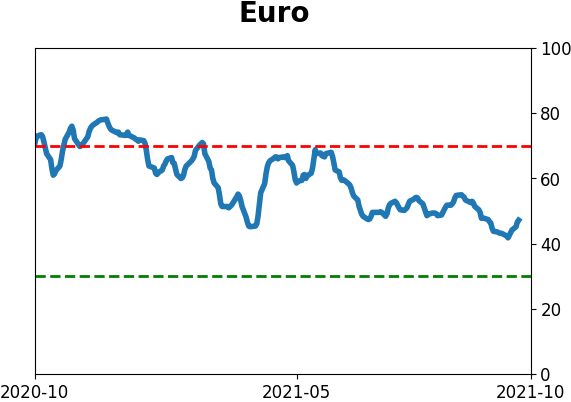
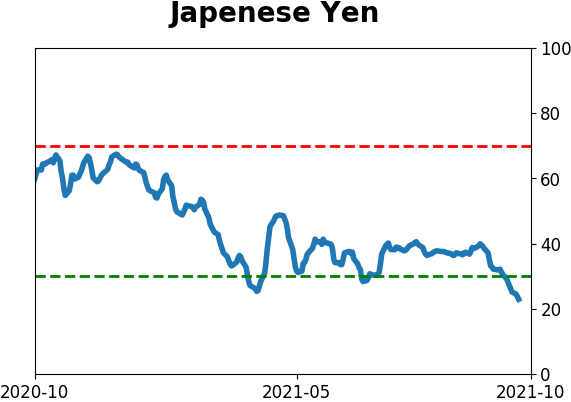
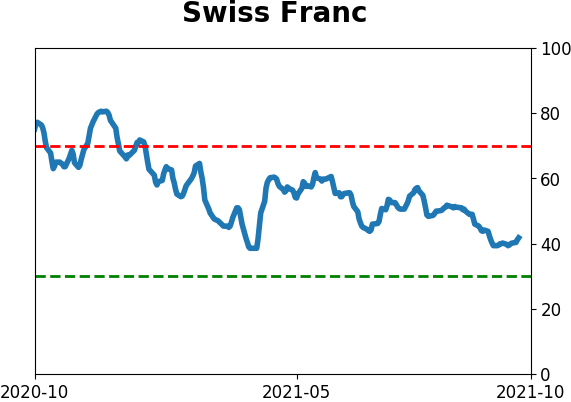
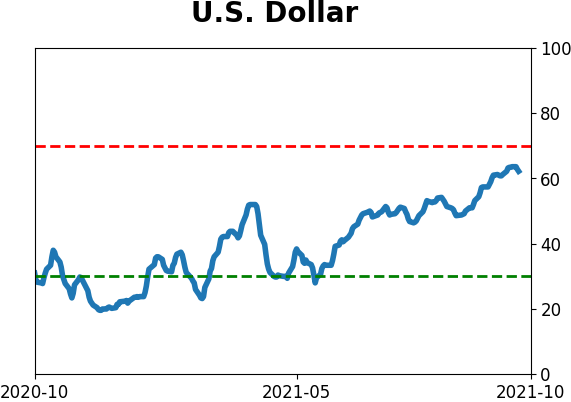
Currency ETF's - 5-Day Moving Average
|
|
|
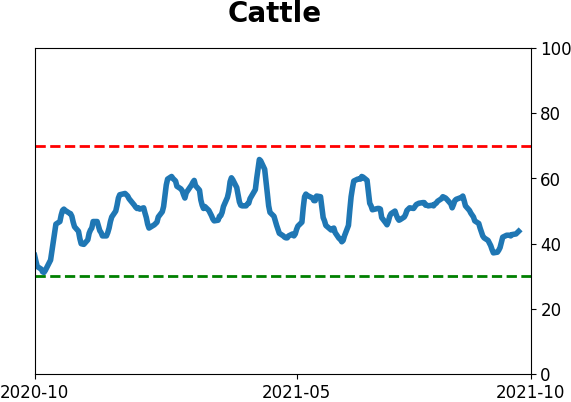
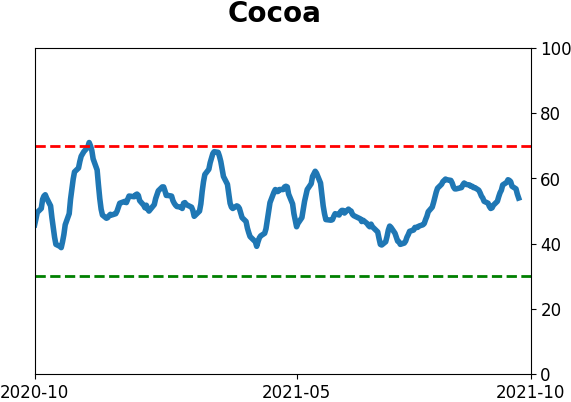
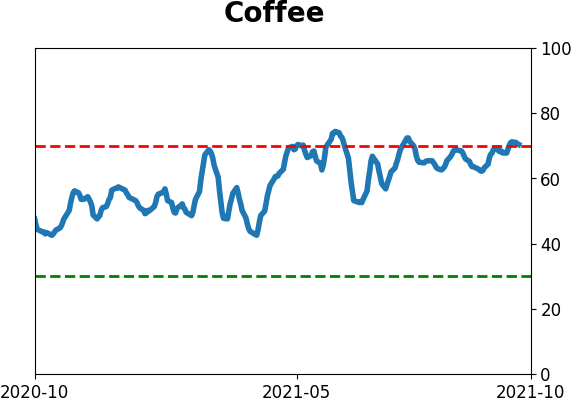
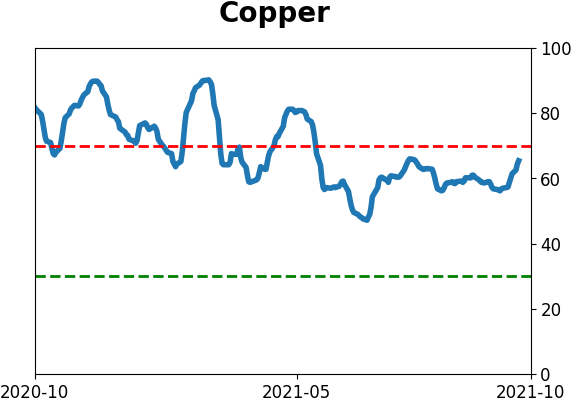
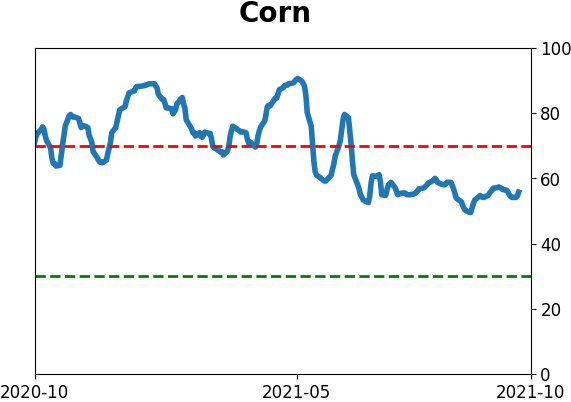
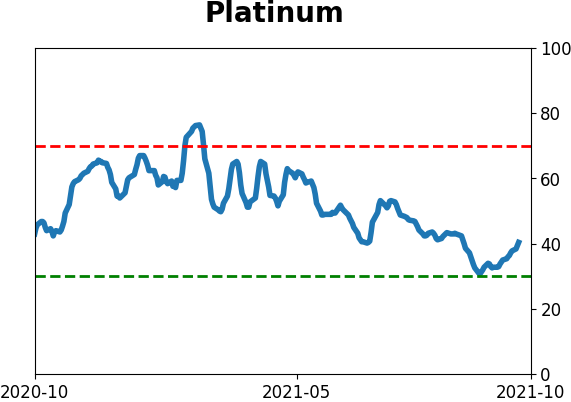
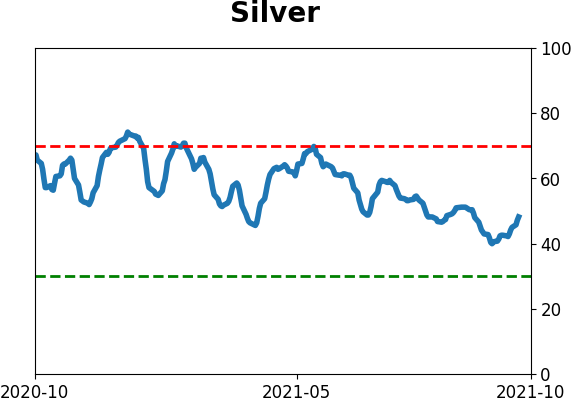
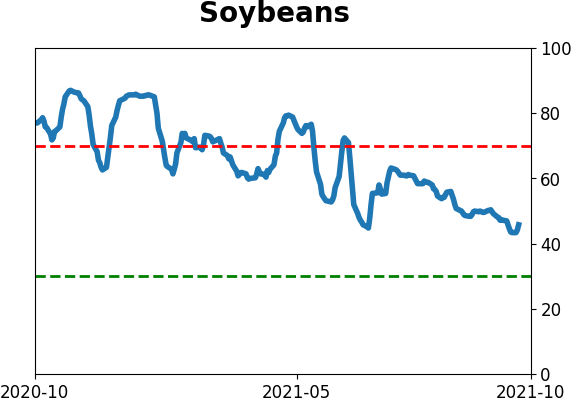
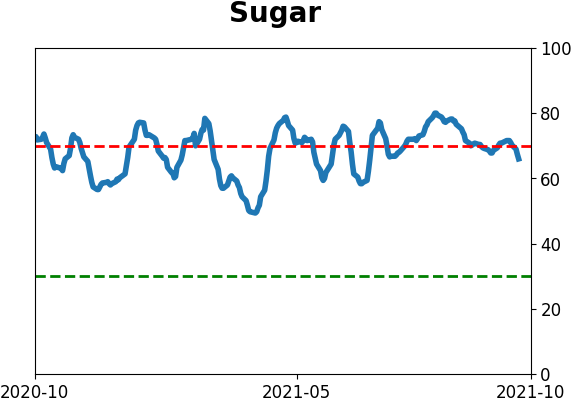
Commodity ETF's - 5-Day Moving Average
|
|