Headlines
|
|
The Smart Money/Dumb Money Confidence Spread - Part II:
In Part II, we look at another way to apply the Smart Money/Dumb Money Confidence Spread to highlight important inflection points in investor sentiment. We also detail how to save these scans for future use and how to set up your account to monitor these signals for you.
Stocks in the S&P 500 Are Now Showing a Breadth Thrust:
Less than a month ago, fewer than 10% of S&P 500 stocks were trading above their 10-day moving averages. Now, more than 80% of them are, triggering a thrust with a good record at preceding more gains.
Bottom Line:
STOCKS: Weak buy
The speculative frenzy in February is wrung out. There are some signs of pessimism, but the most compelling data show that buyers consistently tend to return once the first signs of extreme momentum end, especially as we head into a seasonally positive time of year. See the Outlook & Allocations page for more. BONDS: Hold
Various parts of the market got hit in March, with the lowest Bond Optimism Index we usually see during healthy environments. Bond prices have modest recovered and there is no edge among the data we follow. GOLD: Hold
Gold and miners were rejected after trying to recover above their 200-day averages in May. Lately, some medium-term (not long-term) oversold extremes in breadth measures among miners have triggered.
|
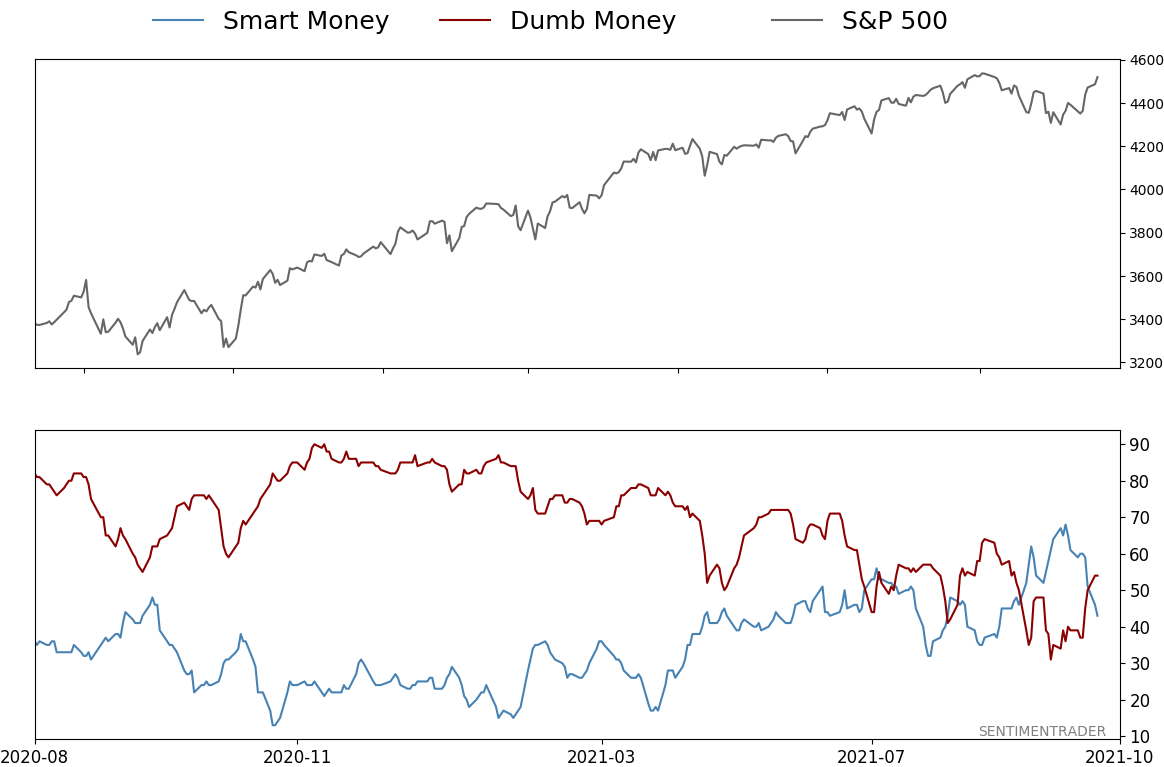
Smart / Dumb Money Confidence
|
Smart Money Confidence: 43%
Dumb Money Confidence: 54%
|
|
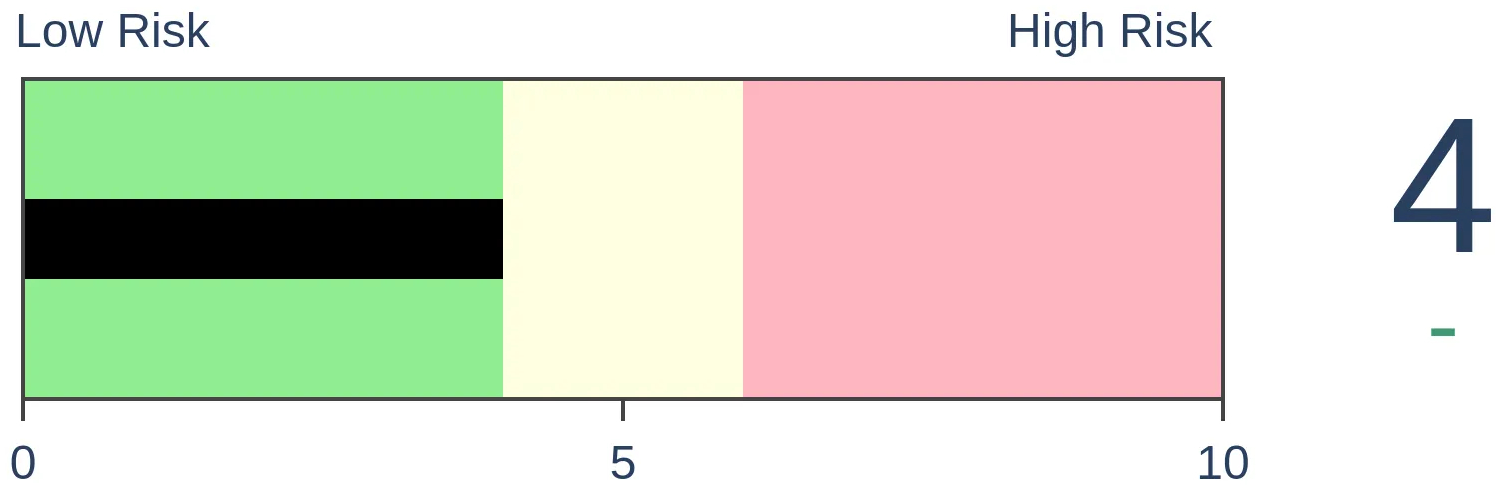
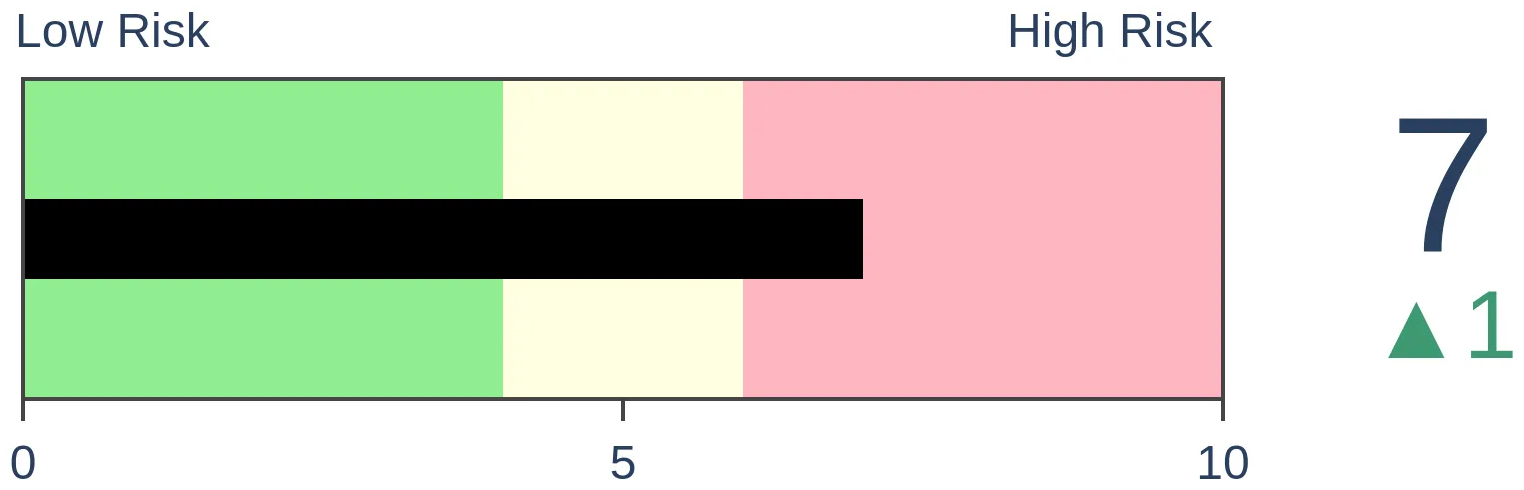
Risk Levels
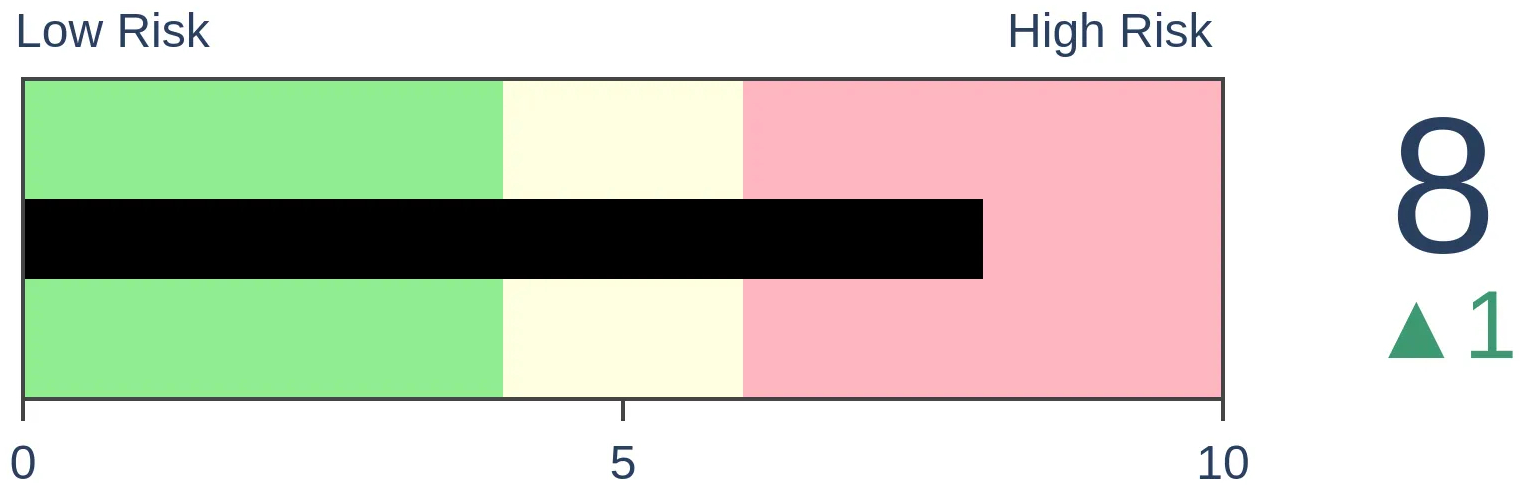
Stocks Short-Term
|
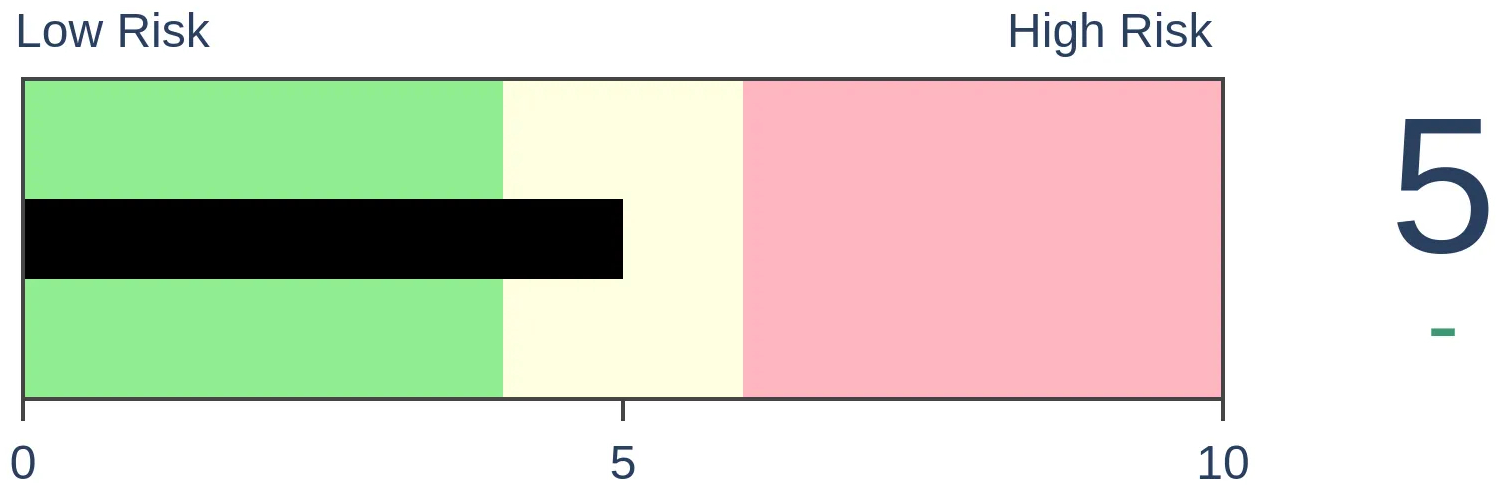
Stocks Medium-Term
|
|
Bonds
|
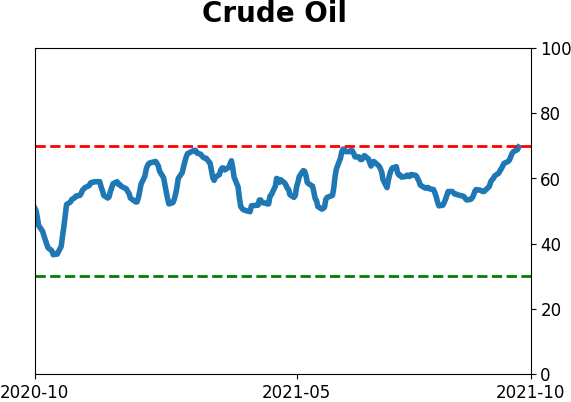
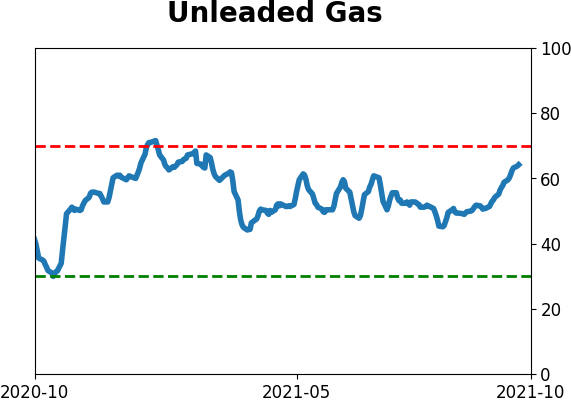
Crude Oil
|
|
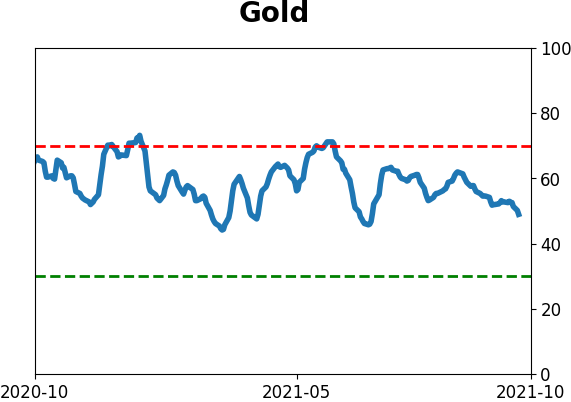
Gold

|
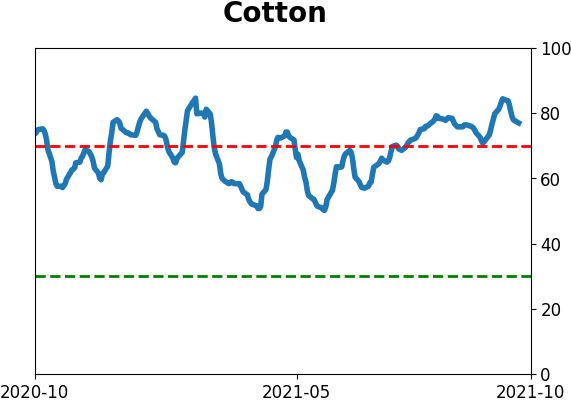
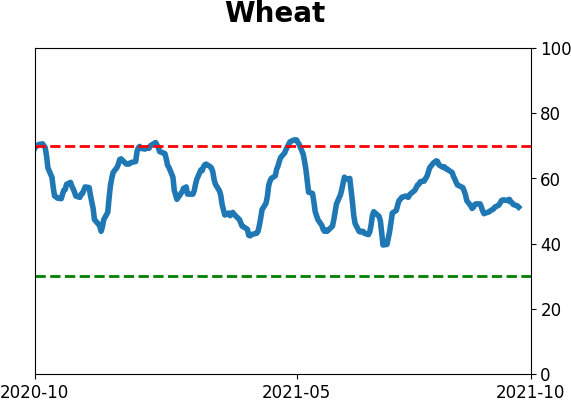
Agriculture

|
|
Research
By Jay Kaeppel
BOTTOM LINE
In Part II, we look at another way to apply the Smart Money/Dumb Money Confidence Spread to highlight important inflection points in investor sentiment. We also detail how to save these scans for future use and how to set up your account to monitor these signals for you.
FORECAST / TIMEFRAME
None
|
Please note that these scans are not necessarily presented on a "timely" basis. The goal is two-fold:
- To help you learn more about the Backtest Engine and its potentially powerful uses
- To help you build an arsenal of scans that may ultimately prove to be very useful at just the right time
This piece offers a slightly different take on the method detailed in Part I here.
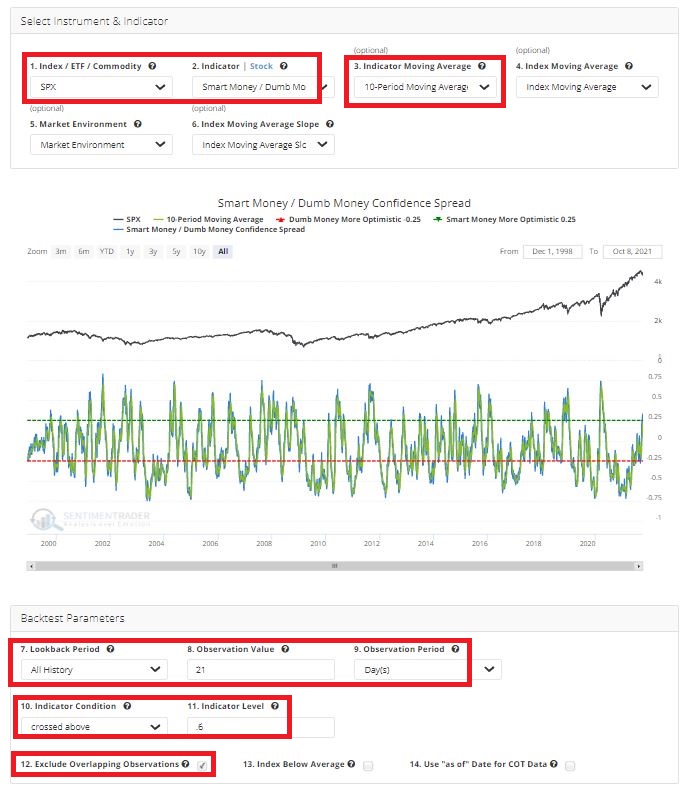
SMART MONEY / DUMB MONEY CONFIDENCE SPREAD - PART II
As the name implies, this indicator measures the daily difference between our "Smart Money" indicator value and our "Dumb Money" indicator value.
For this article:
A = (Smart Money value - Dumb Money value)
B = 10-day moving average of A
For our test, we will identify those days when:
- Variable B crosses above 0.60
- For the first time in 21 days
The screenshot below displays the input screen for this test (after you follow the steps below to Save this scan, anytime you recall it, the inputs will fill in automatically).
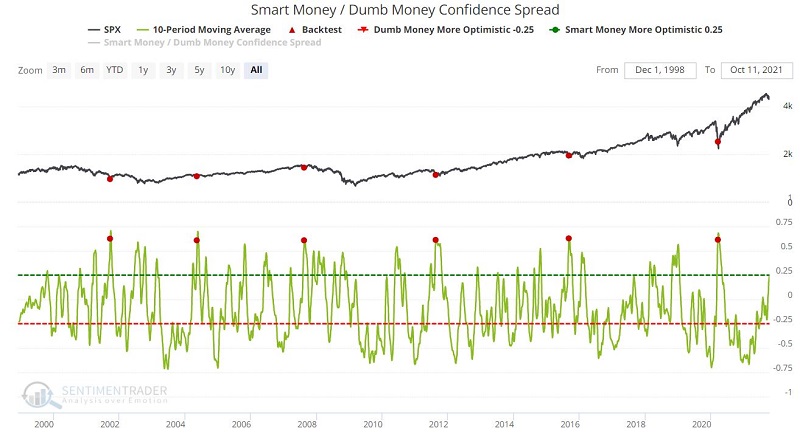
 The chart below displays the signals generated by this test. As you can see, this scenario occurs even less frequently than the scan we covered in Part I. With only 6 signals in 20 years, it certainly borders on encompassing too small of a sample size from which to draw any conclusions.
So, let's not draw any conclusions. Let's merely highlight the performance of the S&P 500 Index following previous signals, and each trader can decide for themselves whether or not adding this test to their list of saved Backtest Engine scans is worth saving or not.
The screenshot below displays the handful of signals generated by this particular test over the years.
 The screenshot below displays the summary of results as well as the output for each signal. The key thing to note is the 100% Win Rate for 2 weeks to 2 months and the solid Median Returns during these time periods.
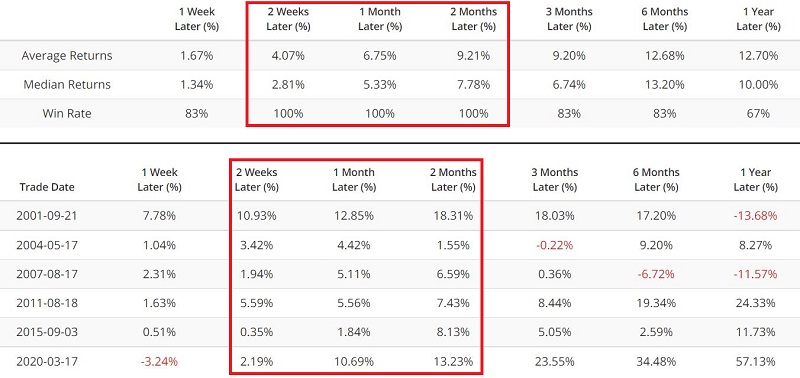
The bottom line:
- Signals from this particular scan are infrequent (and unfortunately, not close to triggering anytime soon)
- But when they do occur, short-term traders appear to have an outstanding opportunity to play the long side of the stock market
SAVING THE SCAN
To save this scan:
- Click "Add to Favorites"
- Typing "Smart/Dumb Confidence Spread 10-day MA crosses above 0.60" (or whatever description you would prefer)
- Then click "Save Favorite"
These steps will add this particular scan to your list of Favorites. Anytime you enter Backtest Engine, your Favorites will be listed at the bottom of the screen.
Finally, note that any Saved scan that is active is listed at the bottom of your Evening Digest email. You can go to My Website Preferences under My Account to ensure you get those (they are on by default).
SUMMARY
Waiting around for a signal from the indicators detailed in Part I and Part II is not really much of a strategy due to the infrequent nature of the signals. However, saving these scans and having any new signals that do occur pop up in your Evening Digest can allow you to be alerted to these potentially useful signals whenever they occur, without you having to monitor for new signals constantly.
By Jason Goepfert
BOTTOM LINE
Less than a month ago, fewer than 10% of S&P 500 stocks were trading above their 10-day moving averages. Now, more than 80% of them are, triggering a thrust with a good record at preceding more gains.
FORECAST / TIMEFRAME
None
|
At various points during the summer, there were odd stretches where indexes like the S&P 500 were pushing higher but with a troubling lack of participation.
Each time, the situations resolved by the indexes moving even higher. As they stumbled in September, though, there was a quick washout among stocks. By September 20, fewer than 10% of stocks in that index held above their 10-day moving averages.
Then buyers stepped in, and by the end of last week, more than 80% of members were trading above their averages, which is the largest amount in well over a month. This is a stark change in character.
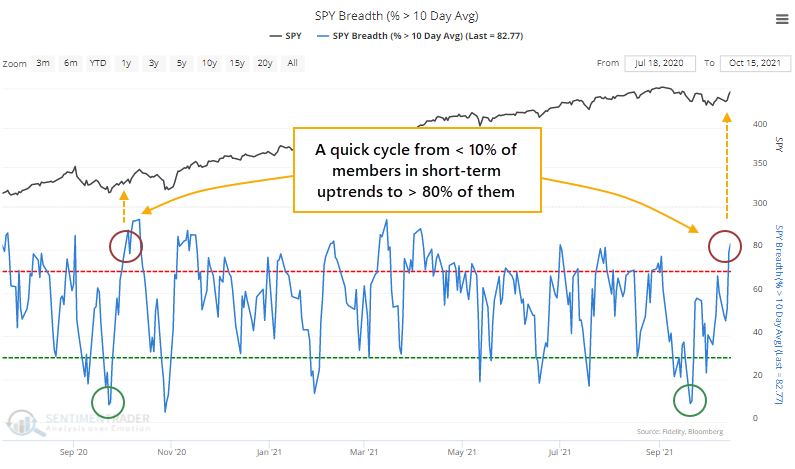
The only recent time we saw a similar move was almost exactly a year ago. That essentially marked the end of that corrective period.
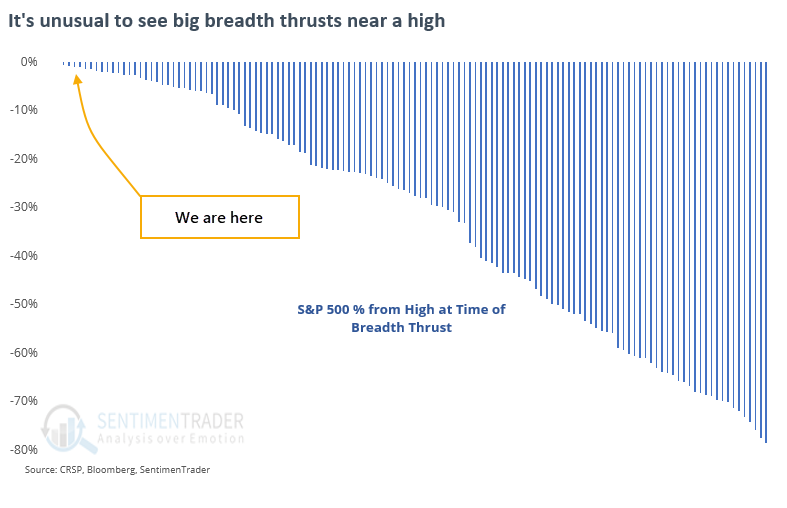
IT'S A RARE EVENT WHEN STOCKS ARE NEAR THEIR HIGHS
Typically, breadth swings like this during times of general market volatility. It's much rarer to see cycles from very low to very high figures within a few weeks of each other when stocks are trading near their highs.
When we go back to 1928 and look for times when fewer than 10% of S&P members were above their 10-day averages, then more than 80% of them were within a month, only a handful of signals triggered when the S&P was trading within 1.5% of a multi-year high. This is a highly unusual situation.
THRUSTS NEAR HIGHS LED TO MORE UPSIDE
Because it is so rare to see a thrust when the S&P was at or near a multi-year high, our sample size is limited if we look for the most comparable precedents.
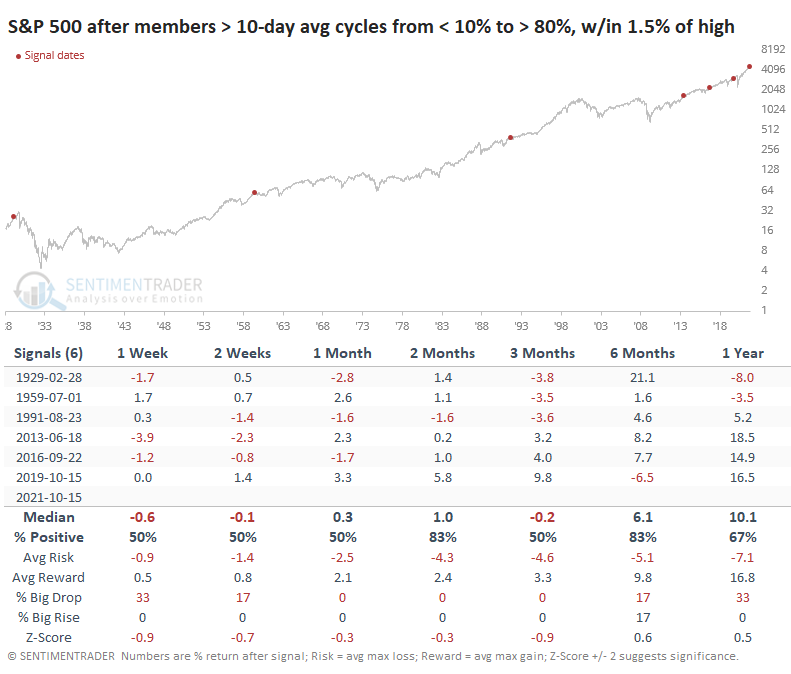
After the others, the S&P's returns mixed, oscillating around random. Perhaps most notably, none of them led to large sustained declines, at least for a long while. All of them showed a positive return either 3 or 6 months later.
The sample size almost triples if we look for times when the S&P was within 3% of its prior high (instead of 1.5%).
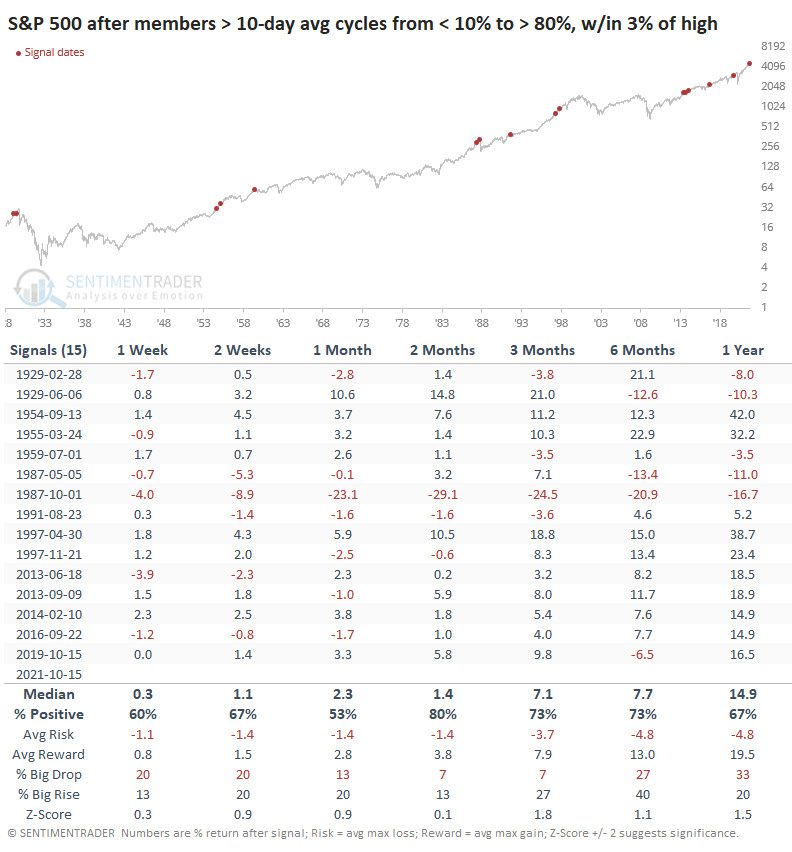
Here, the returns were better and still consistently positive over the medium term. There was a colossal failure when it signaled right before Black Monday in 1987, but that was the only time stocks saw more than a 1.6% loss over the next two months.
Returns after these signals were better than when they trigger coming out of a sustained decline, which was much more common. When the S&P was more than 20% from its peak, and we saw one of these thrusts, its future returns were okay but generally less than when the index was closer to a high.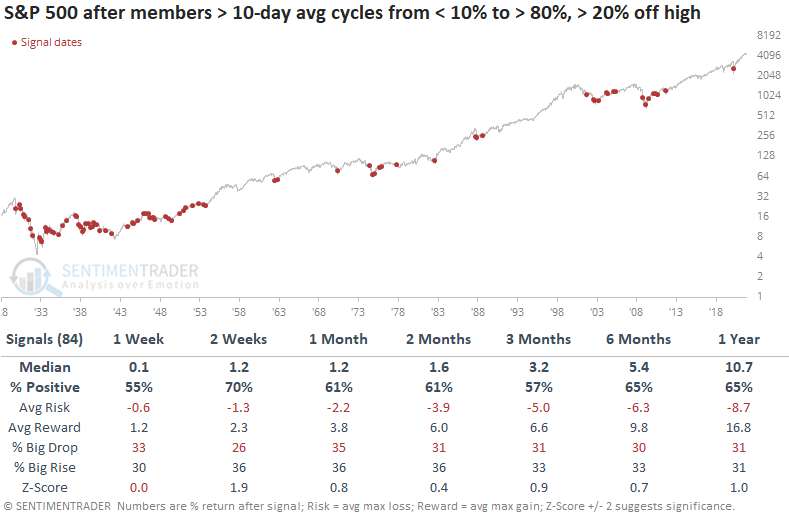
After suffering the most extended pullback in nearly a year, stocks have ended a long streak of positive price momentum. After it ended, that kind of momentum tended to bring in buyers, not sellers, and we see some signs of that lately. This thrust in short-term participation in the S&P and other indexes is a good sign as well.
Active Studies
| Time Frame | Bullish | Bearish | | Short-Term | 1 | 0 | | Medium-Term | 7 | 0 | | Long-Term | 11 | 5 |
|
Indicators at Extremes
Portfolio
| Position | Description | Weight % | Added / Reduced | Date | | Stocks | RSP | 10.5 | Added 6.4% | 2021-10-01 | | Bonds | 23.9% BND, 6.9% SCHP | 31.5 | Reduced 7.1% | 2021-05-19 | | Commodities | GCC | 2.6 | Reduced 2.1%
| 2020-09-04 | | Precious Metals | GDX | 4.2 | Reduced 4.2% | 2021-05-19 | | Special Situations | 9.8% KWEB, 4.7% XLE, 2.9% PSCE | 17.3 | Added 9.78% | 2021-10-01 | | Cash | | 34.0 | | |
|
Updates (Changes made today are underlined)
Much of our momentum and trend work has remained positive for several months, with some scattered exceptions. Almost all sentiment-related work has shown a poor risk/reward ratio for stocks, especially as speculation drove to record highs in exuberance in February. Much of that has worn off, and most of our models are back toward neutral levels. There isn't much to be excited about here. The same goes for bonds and even gold. Gold has been performing well lately and is back above long-term trend lines. The issue is that it has a poor record of holding onto gains when attempting a long-term trend change like this, so we'll take a wait-and-see approach. Momentum has ebbed quickly in recent weeks, and nearing oversold levels in some indicators. This can be a dangerous area, with a lot of short-term volatility, but we'd be more inclined to add medium- to long-term exposure rather than sell on much more of a decline, thanks to already rock-bottom exposure. Other areas look more attractive, including some overseas markets. RETURN YTD: 11.0% 2020: 8.1%, 2019: 12.6%, 2018: 0.6%, 2017: 3.8%, 2016: 17.1%, 2015: 9.2%, 2014: 14.5%, 2013: 2.2%, 2012: 10.8%, 2011: 16.5%, 2010: 15.3%, 2009: 23.9%, 2008: 16.2%, 2007: 7.8%
|
|
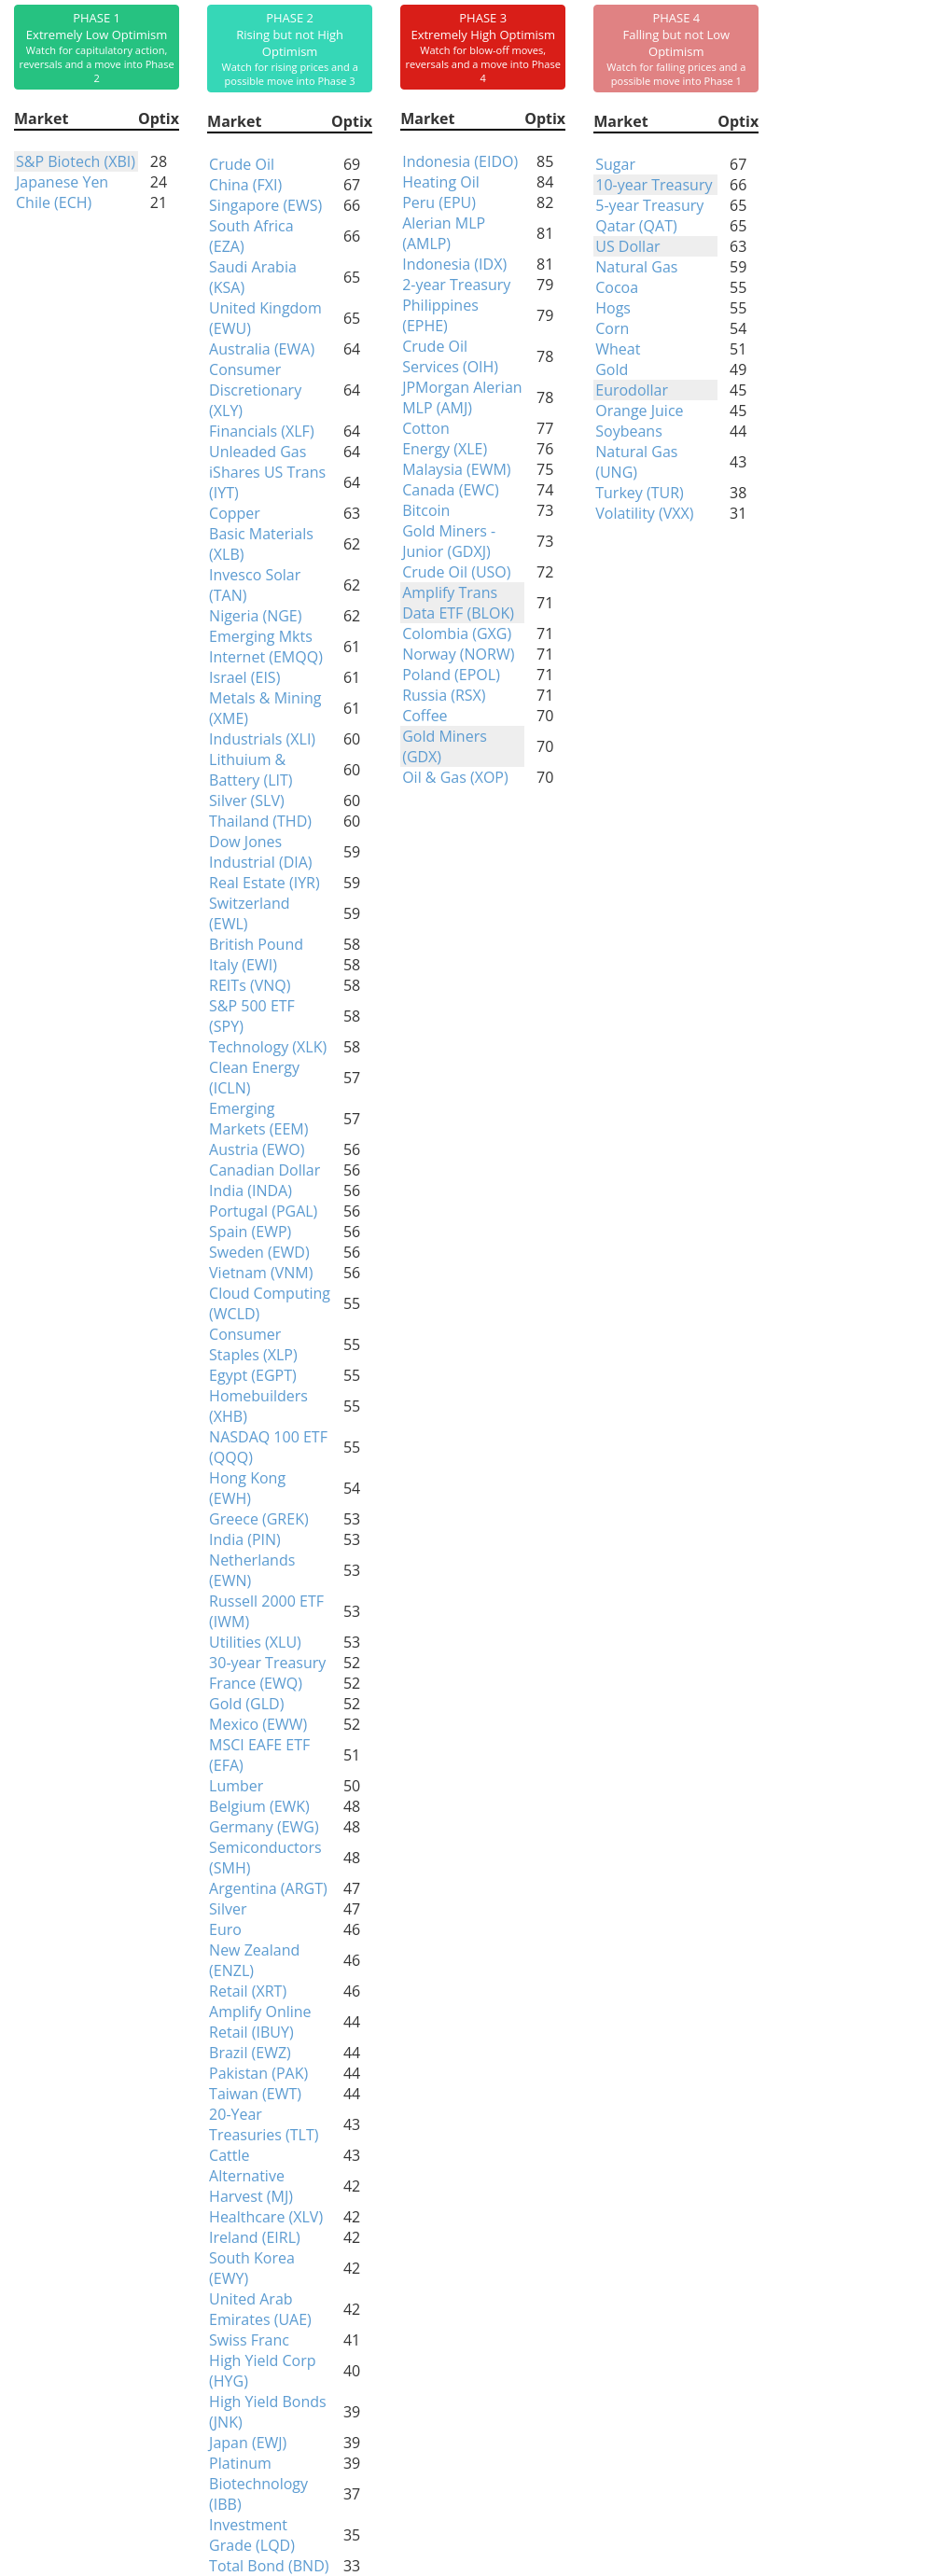
Phase Table
Ranks
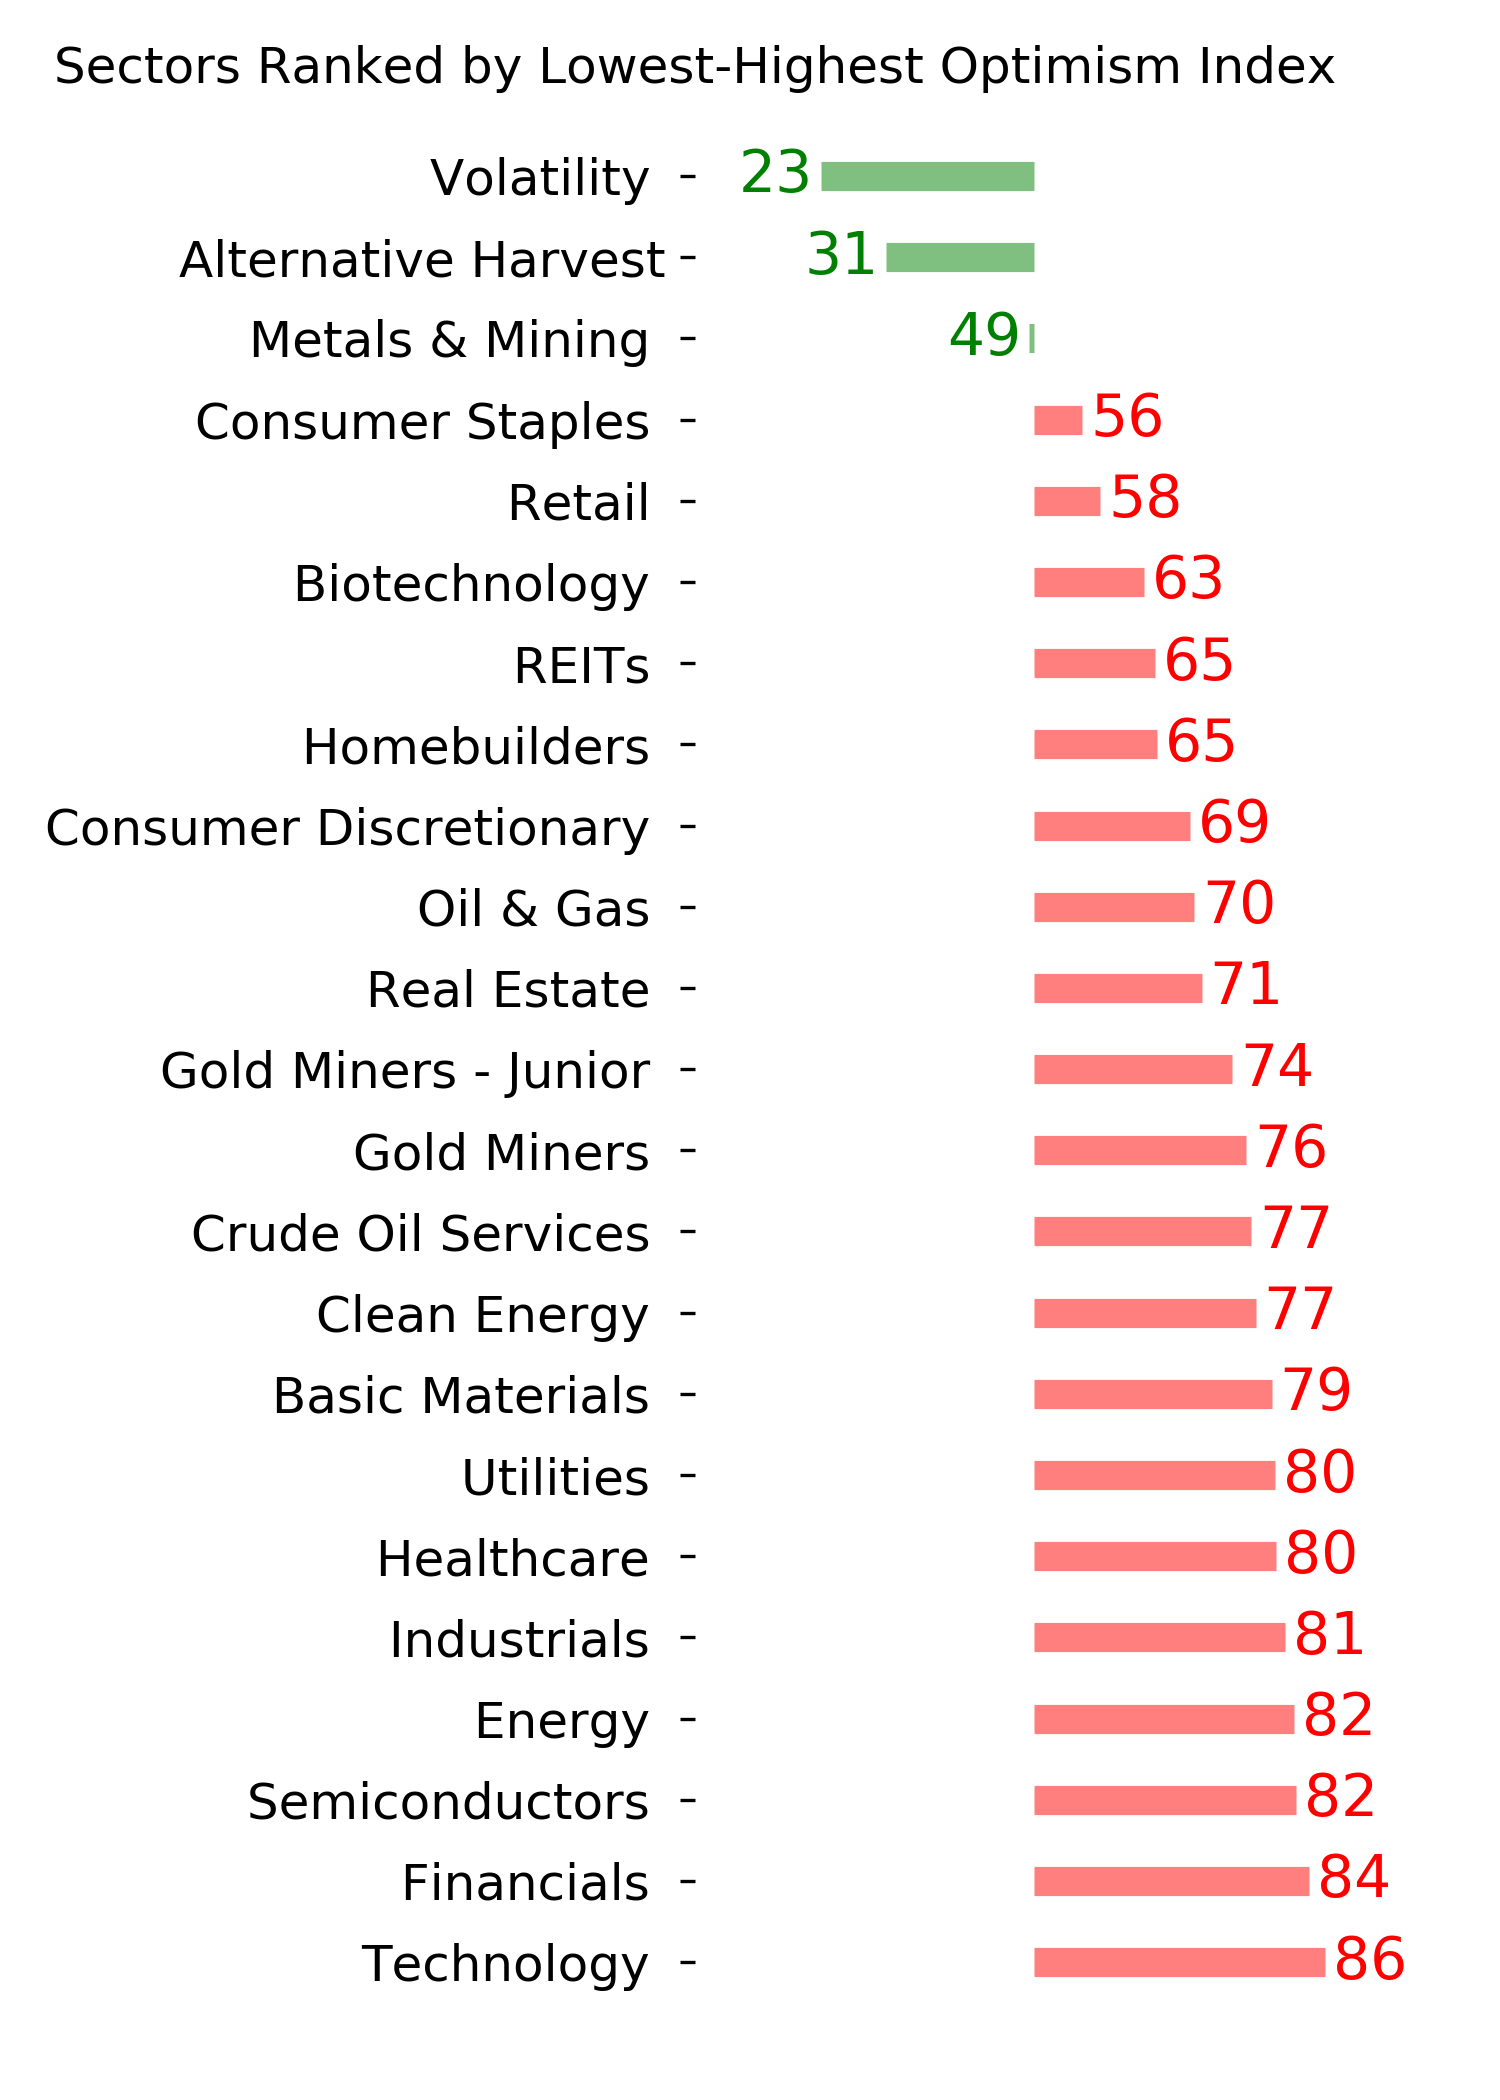
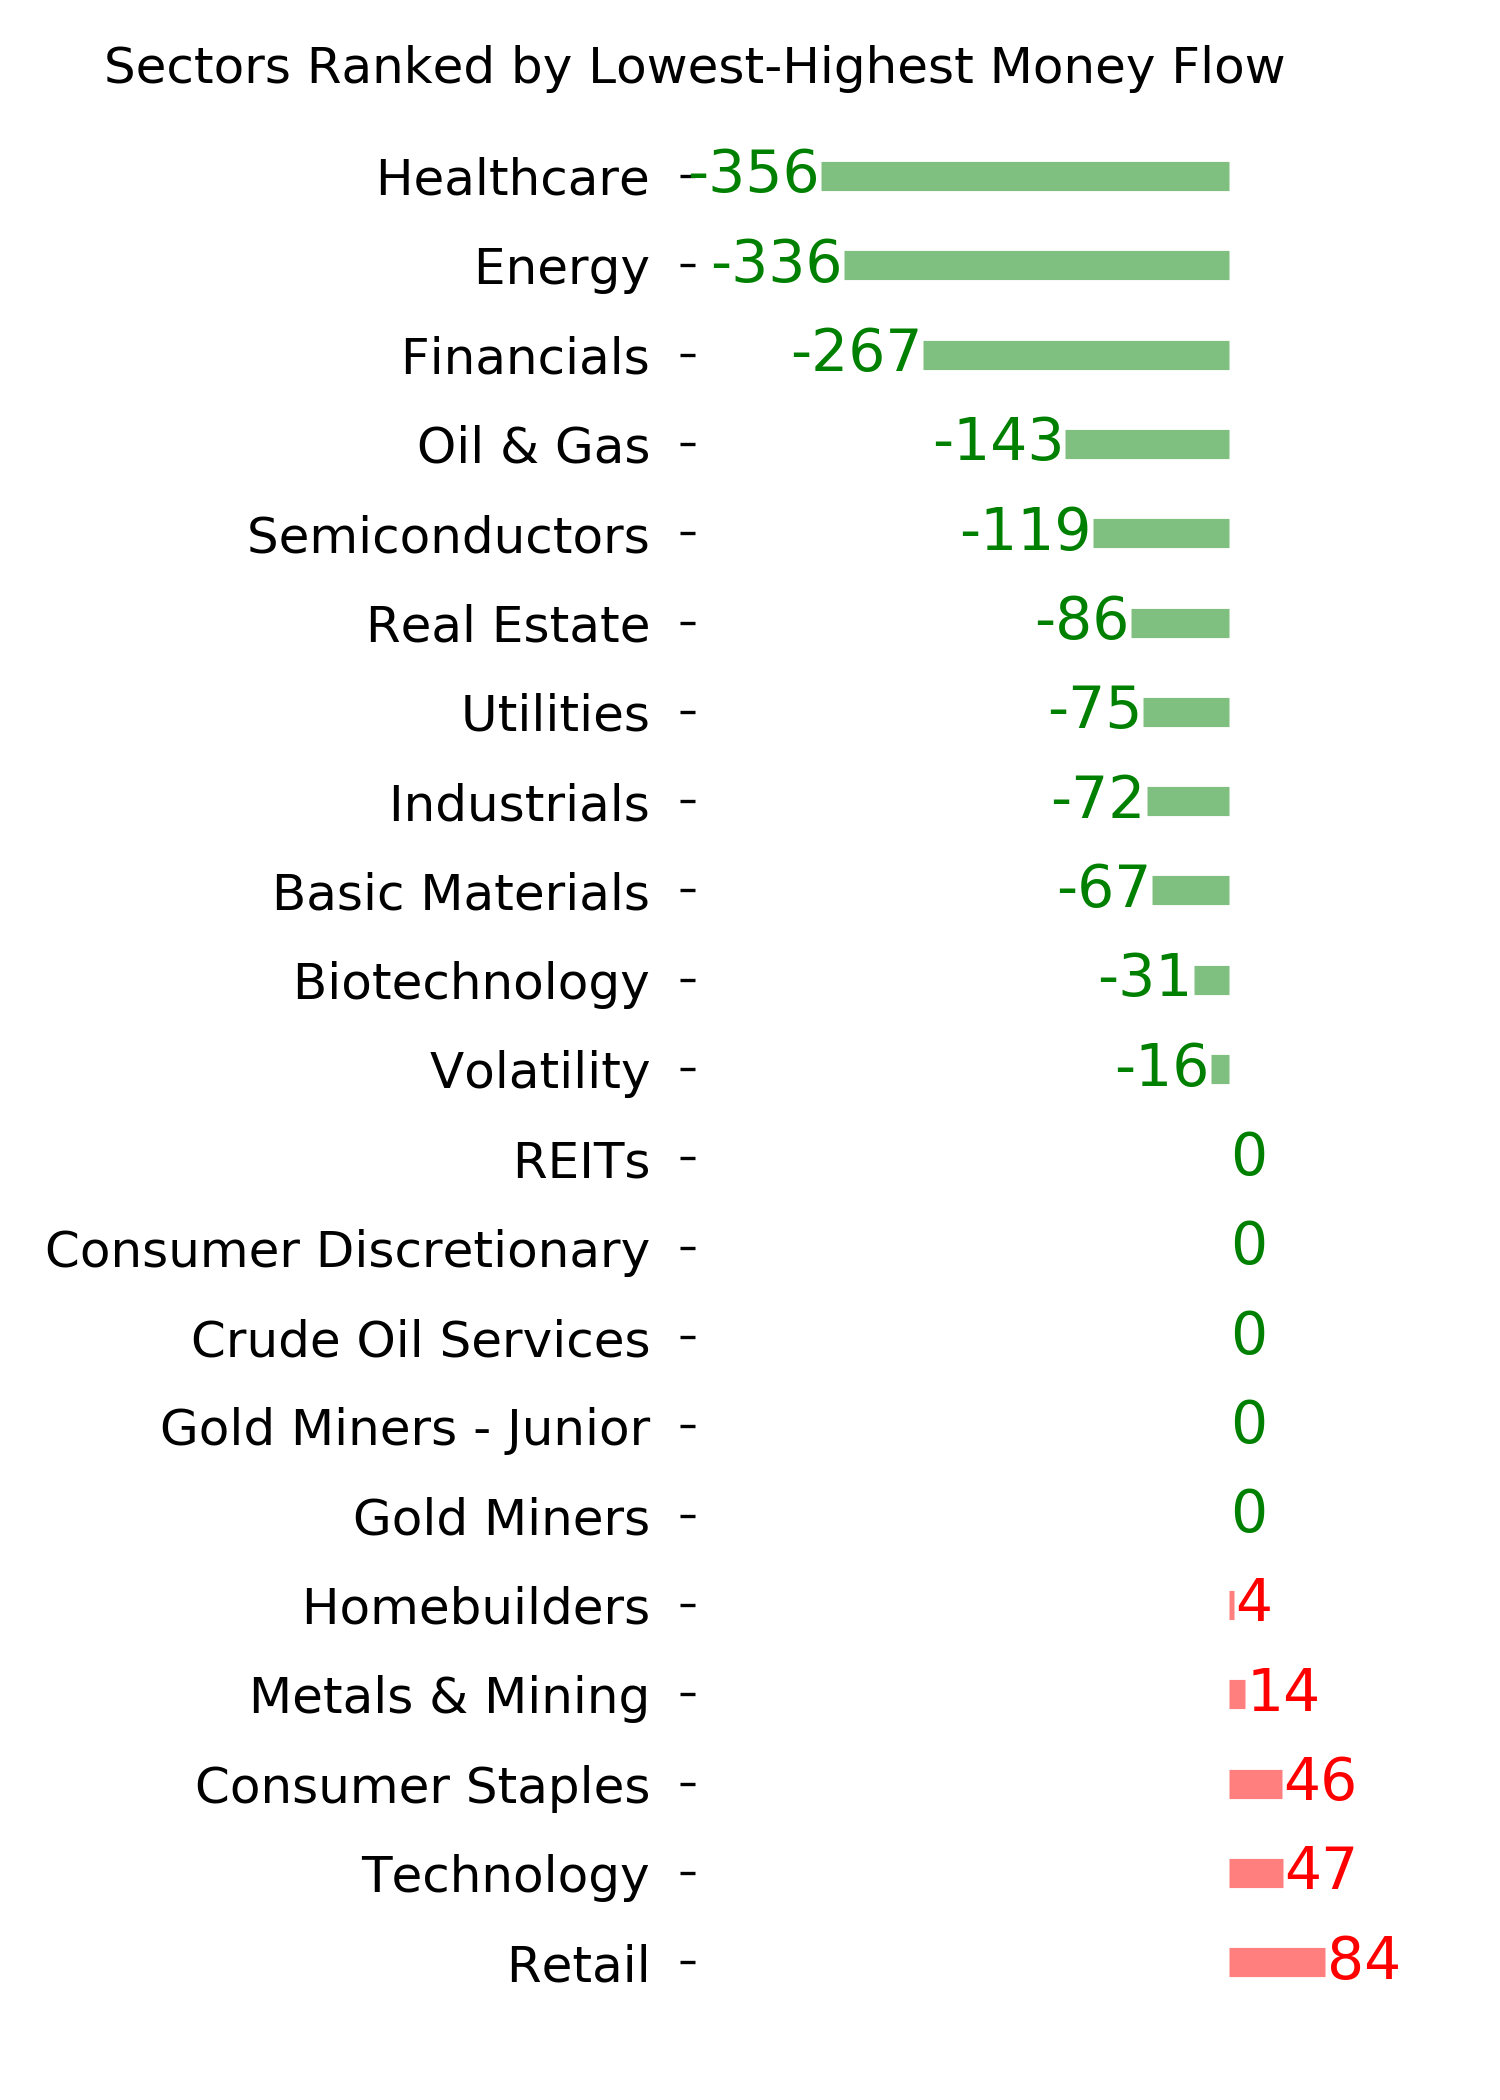
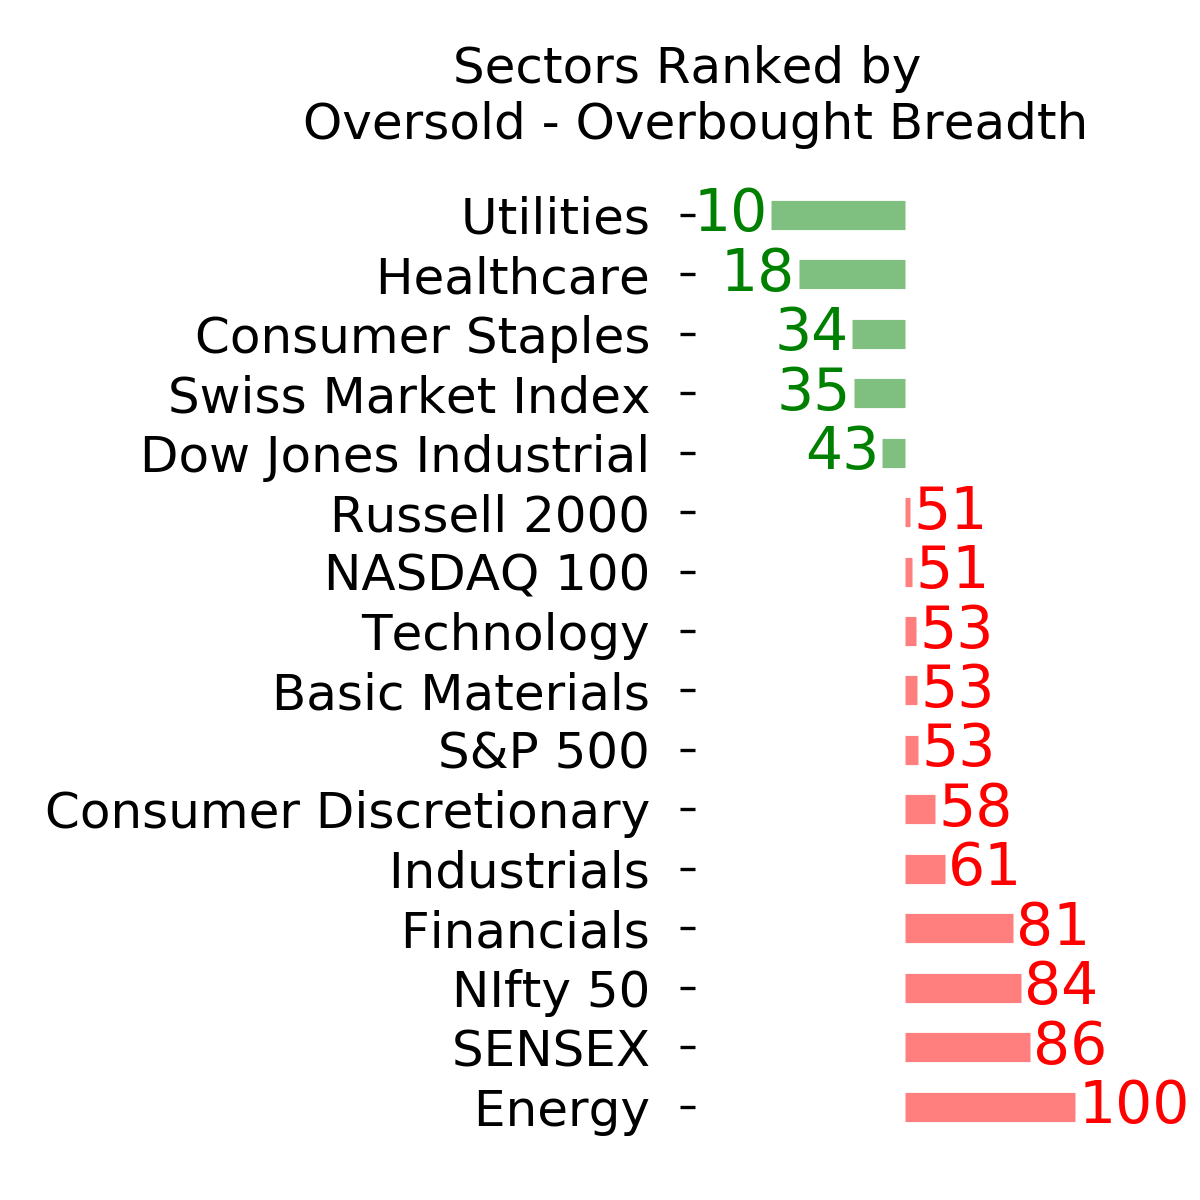
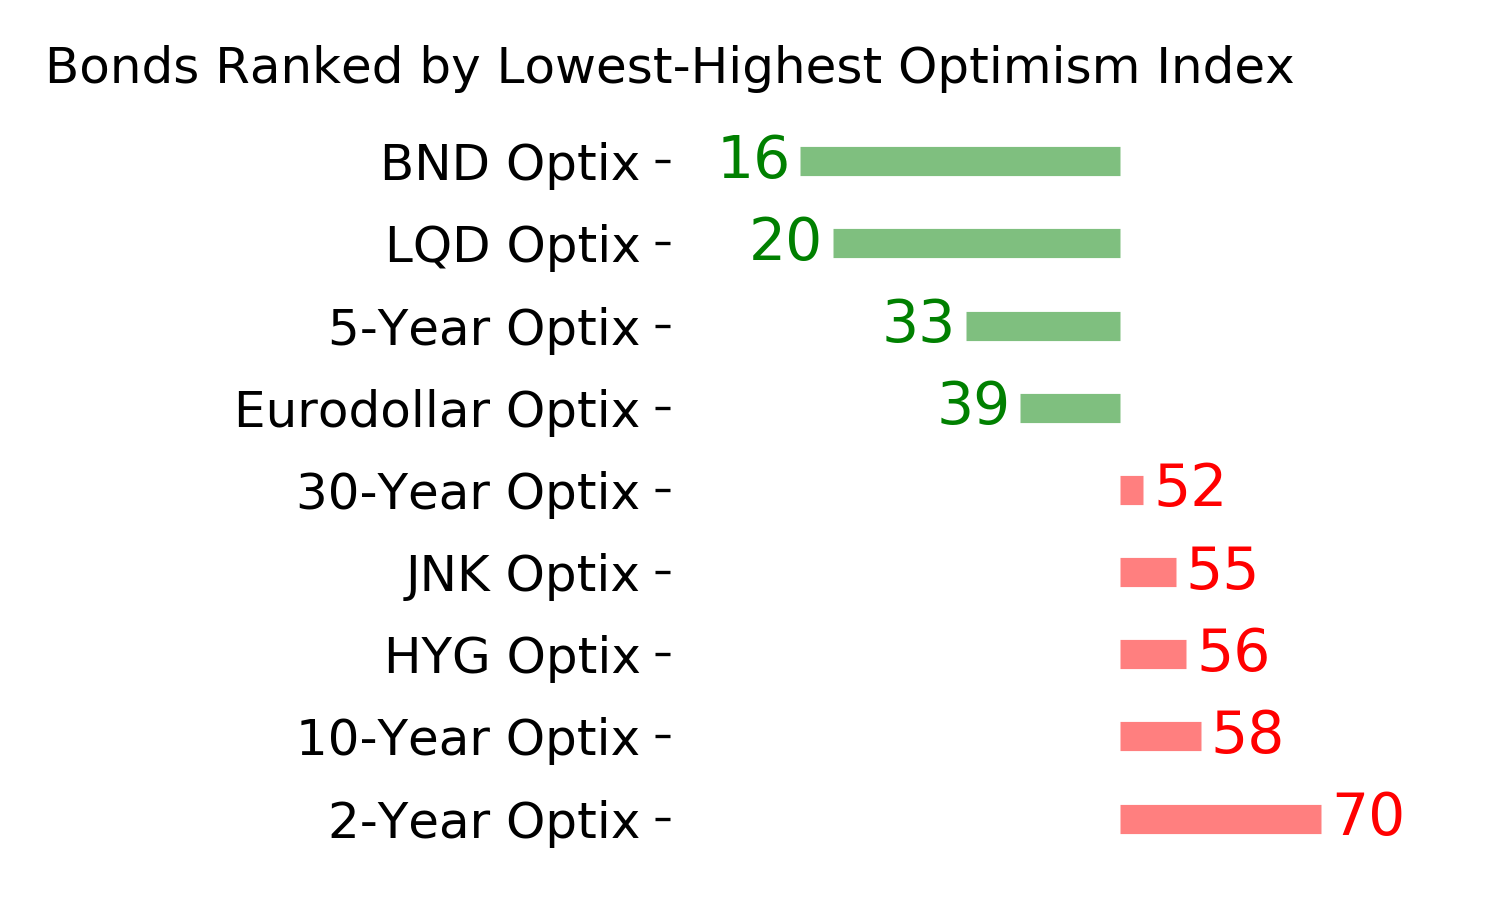
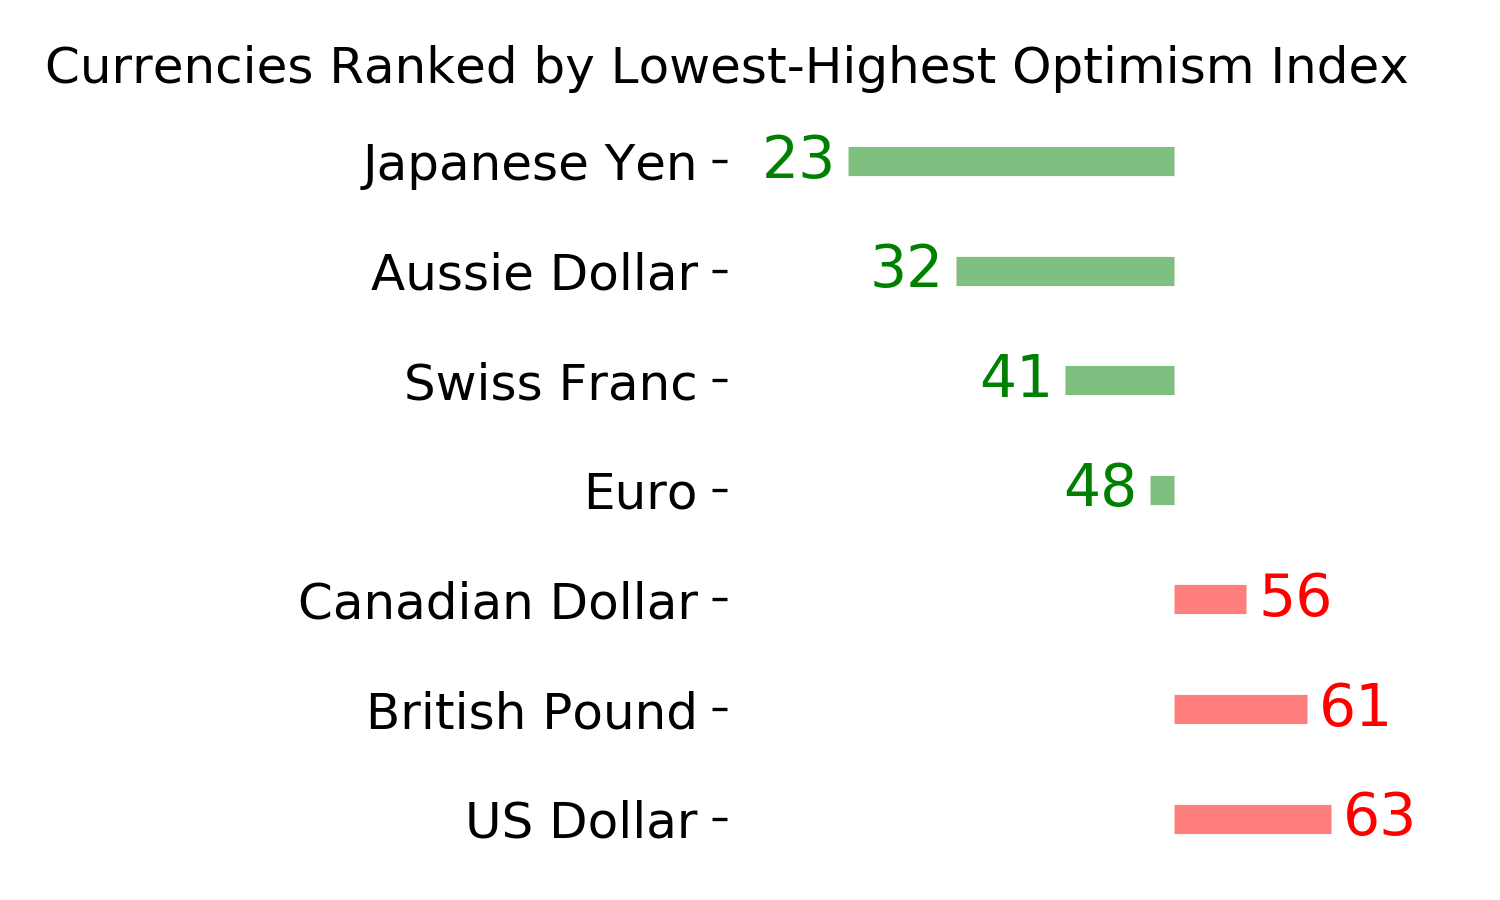
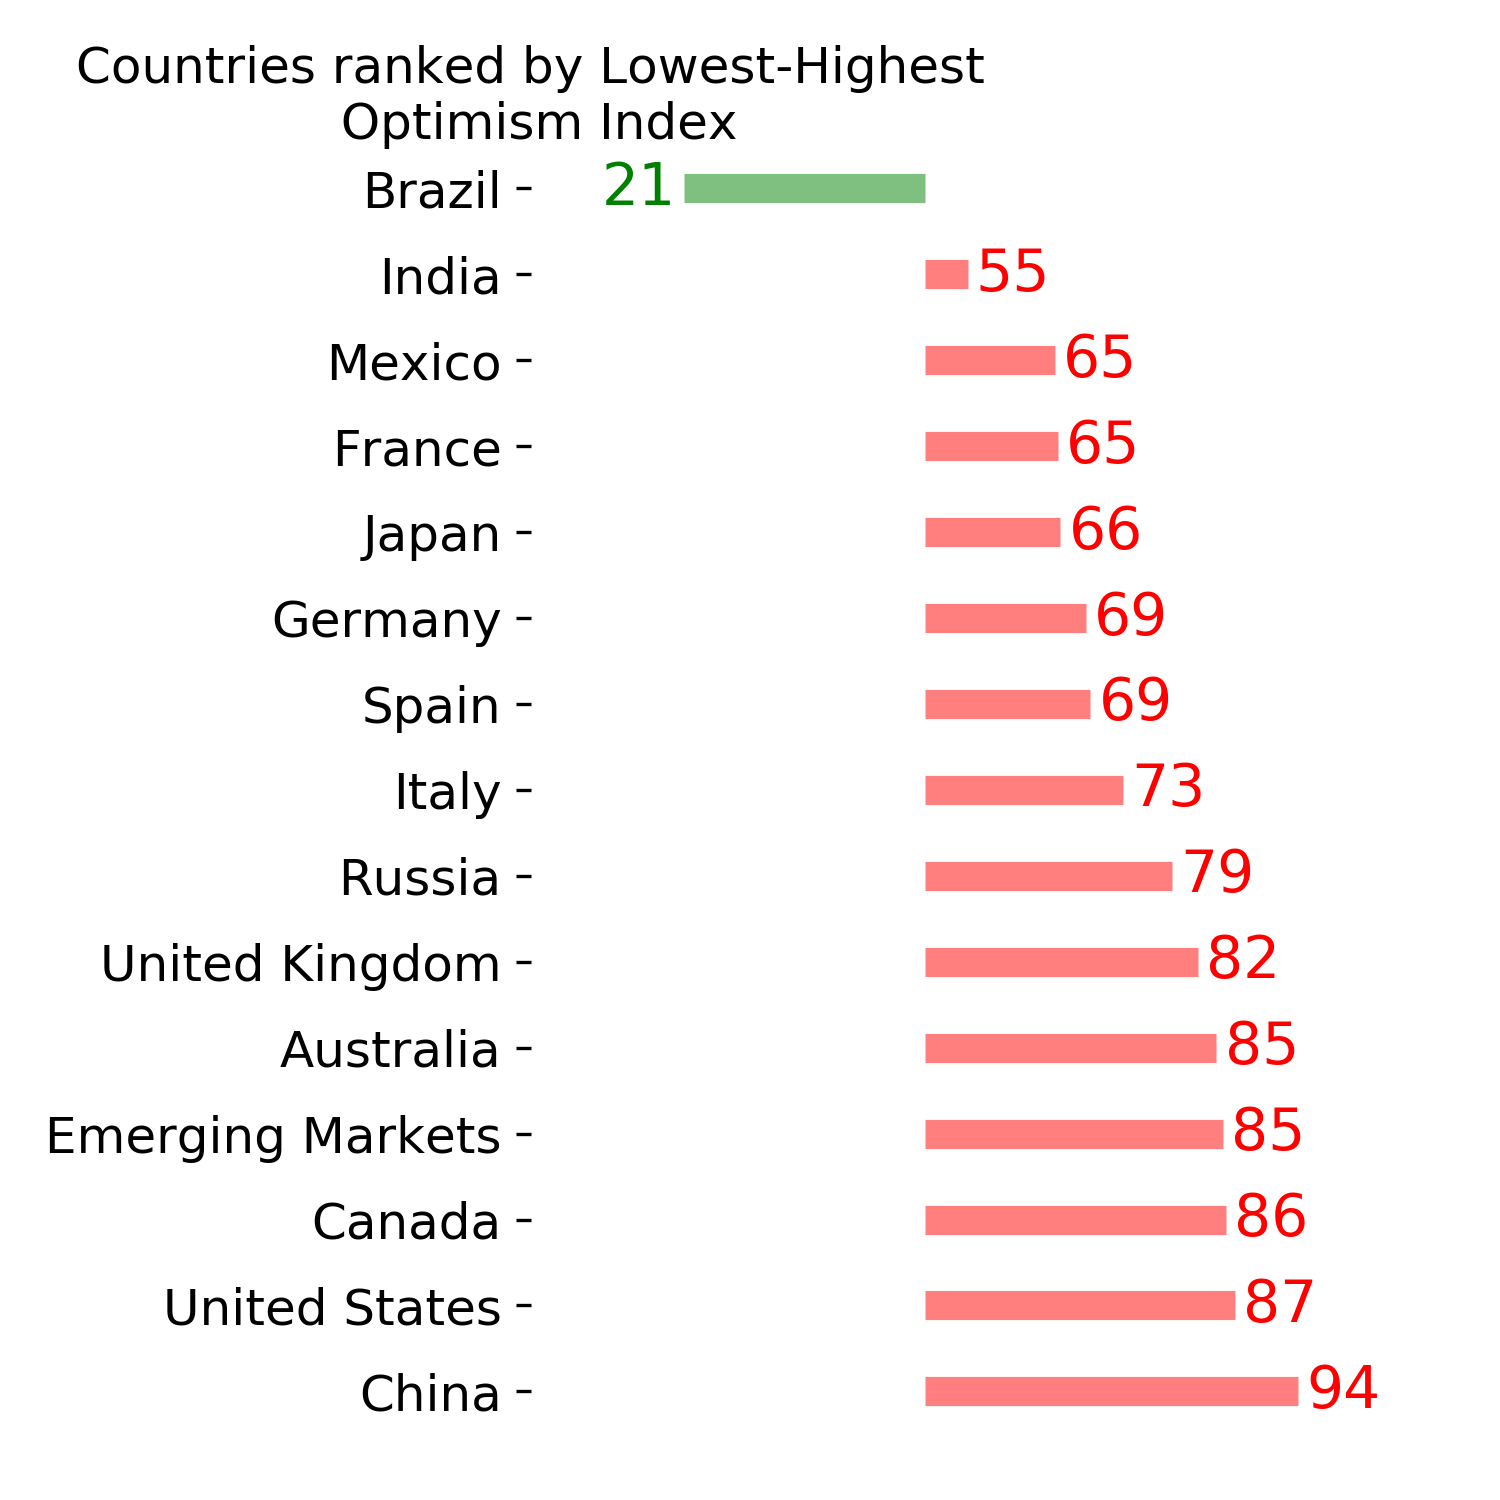
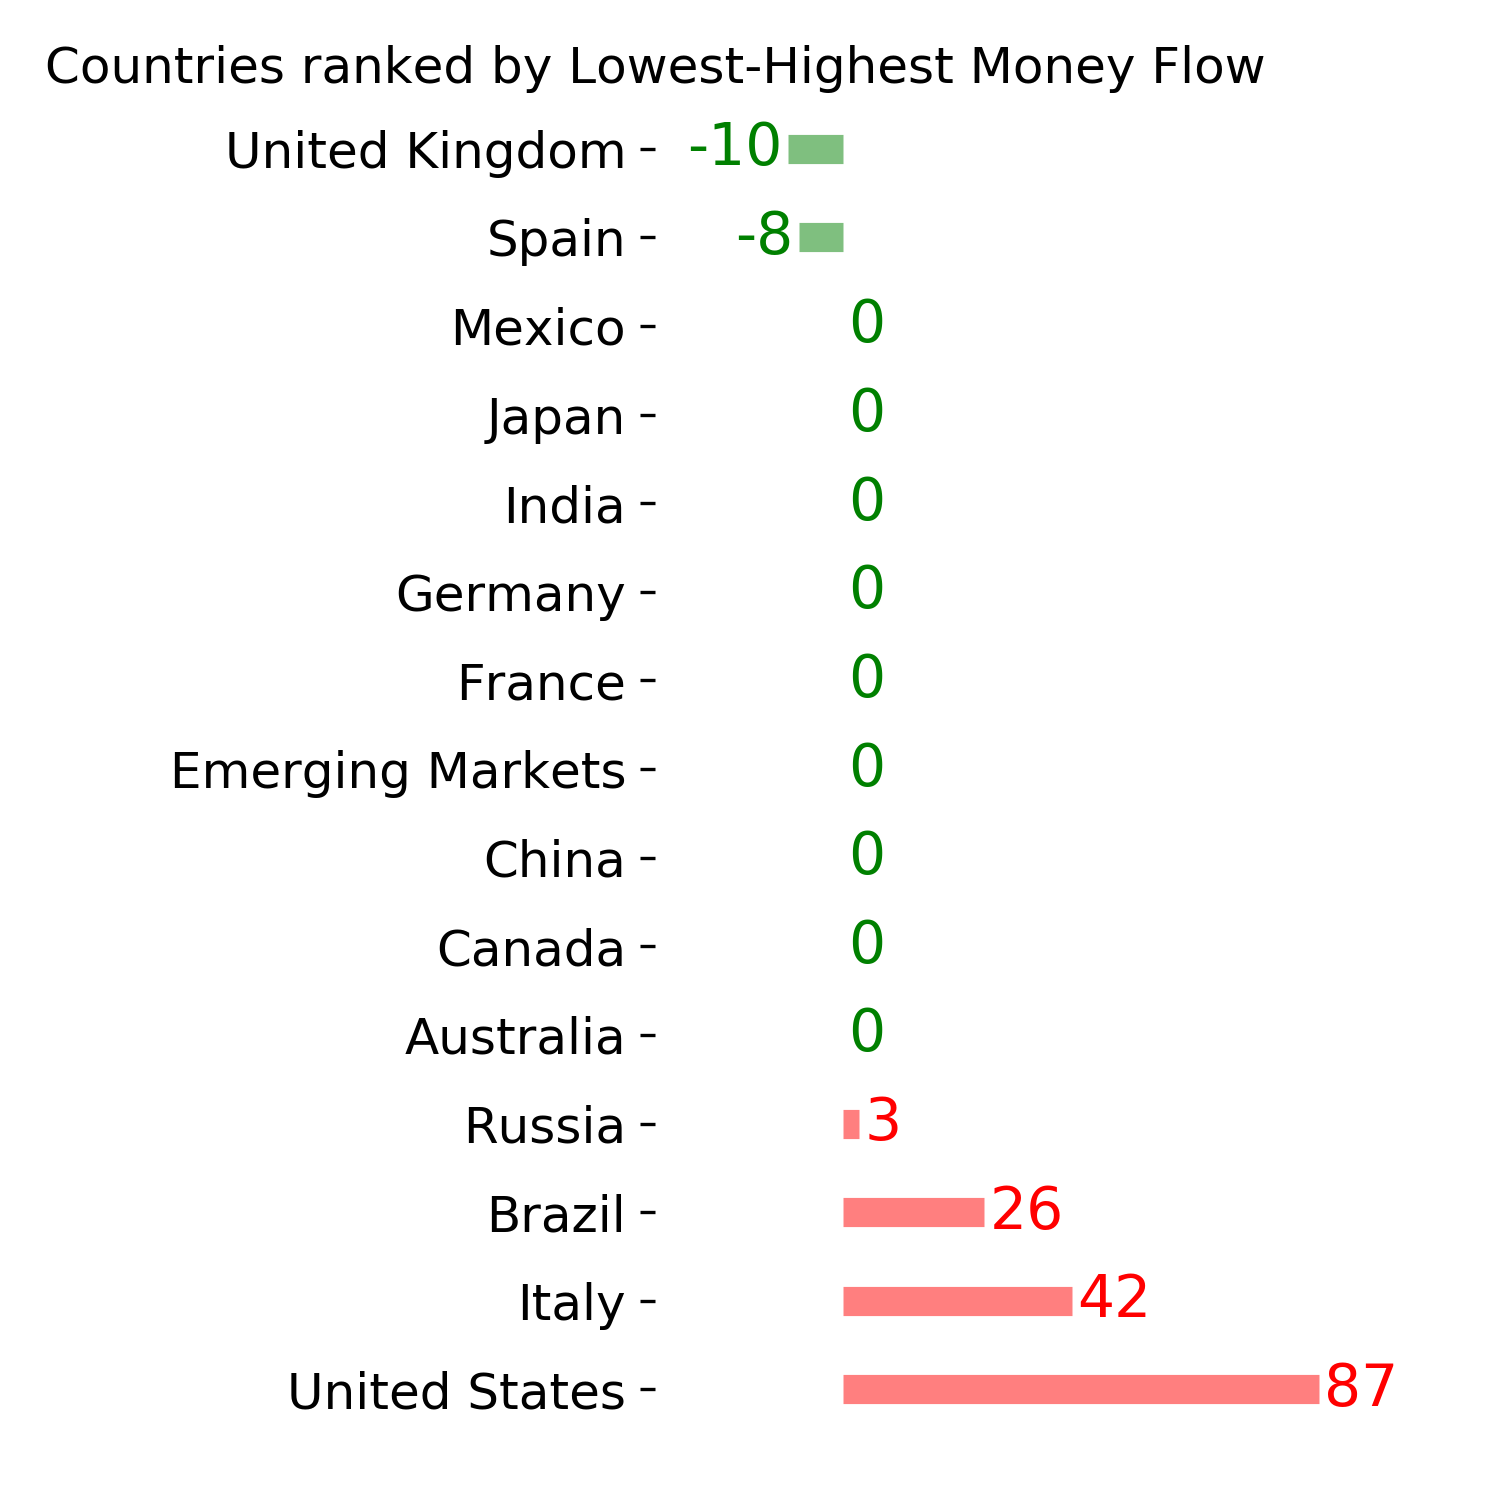
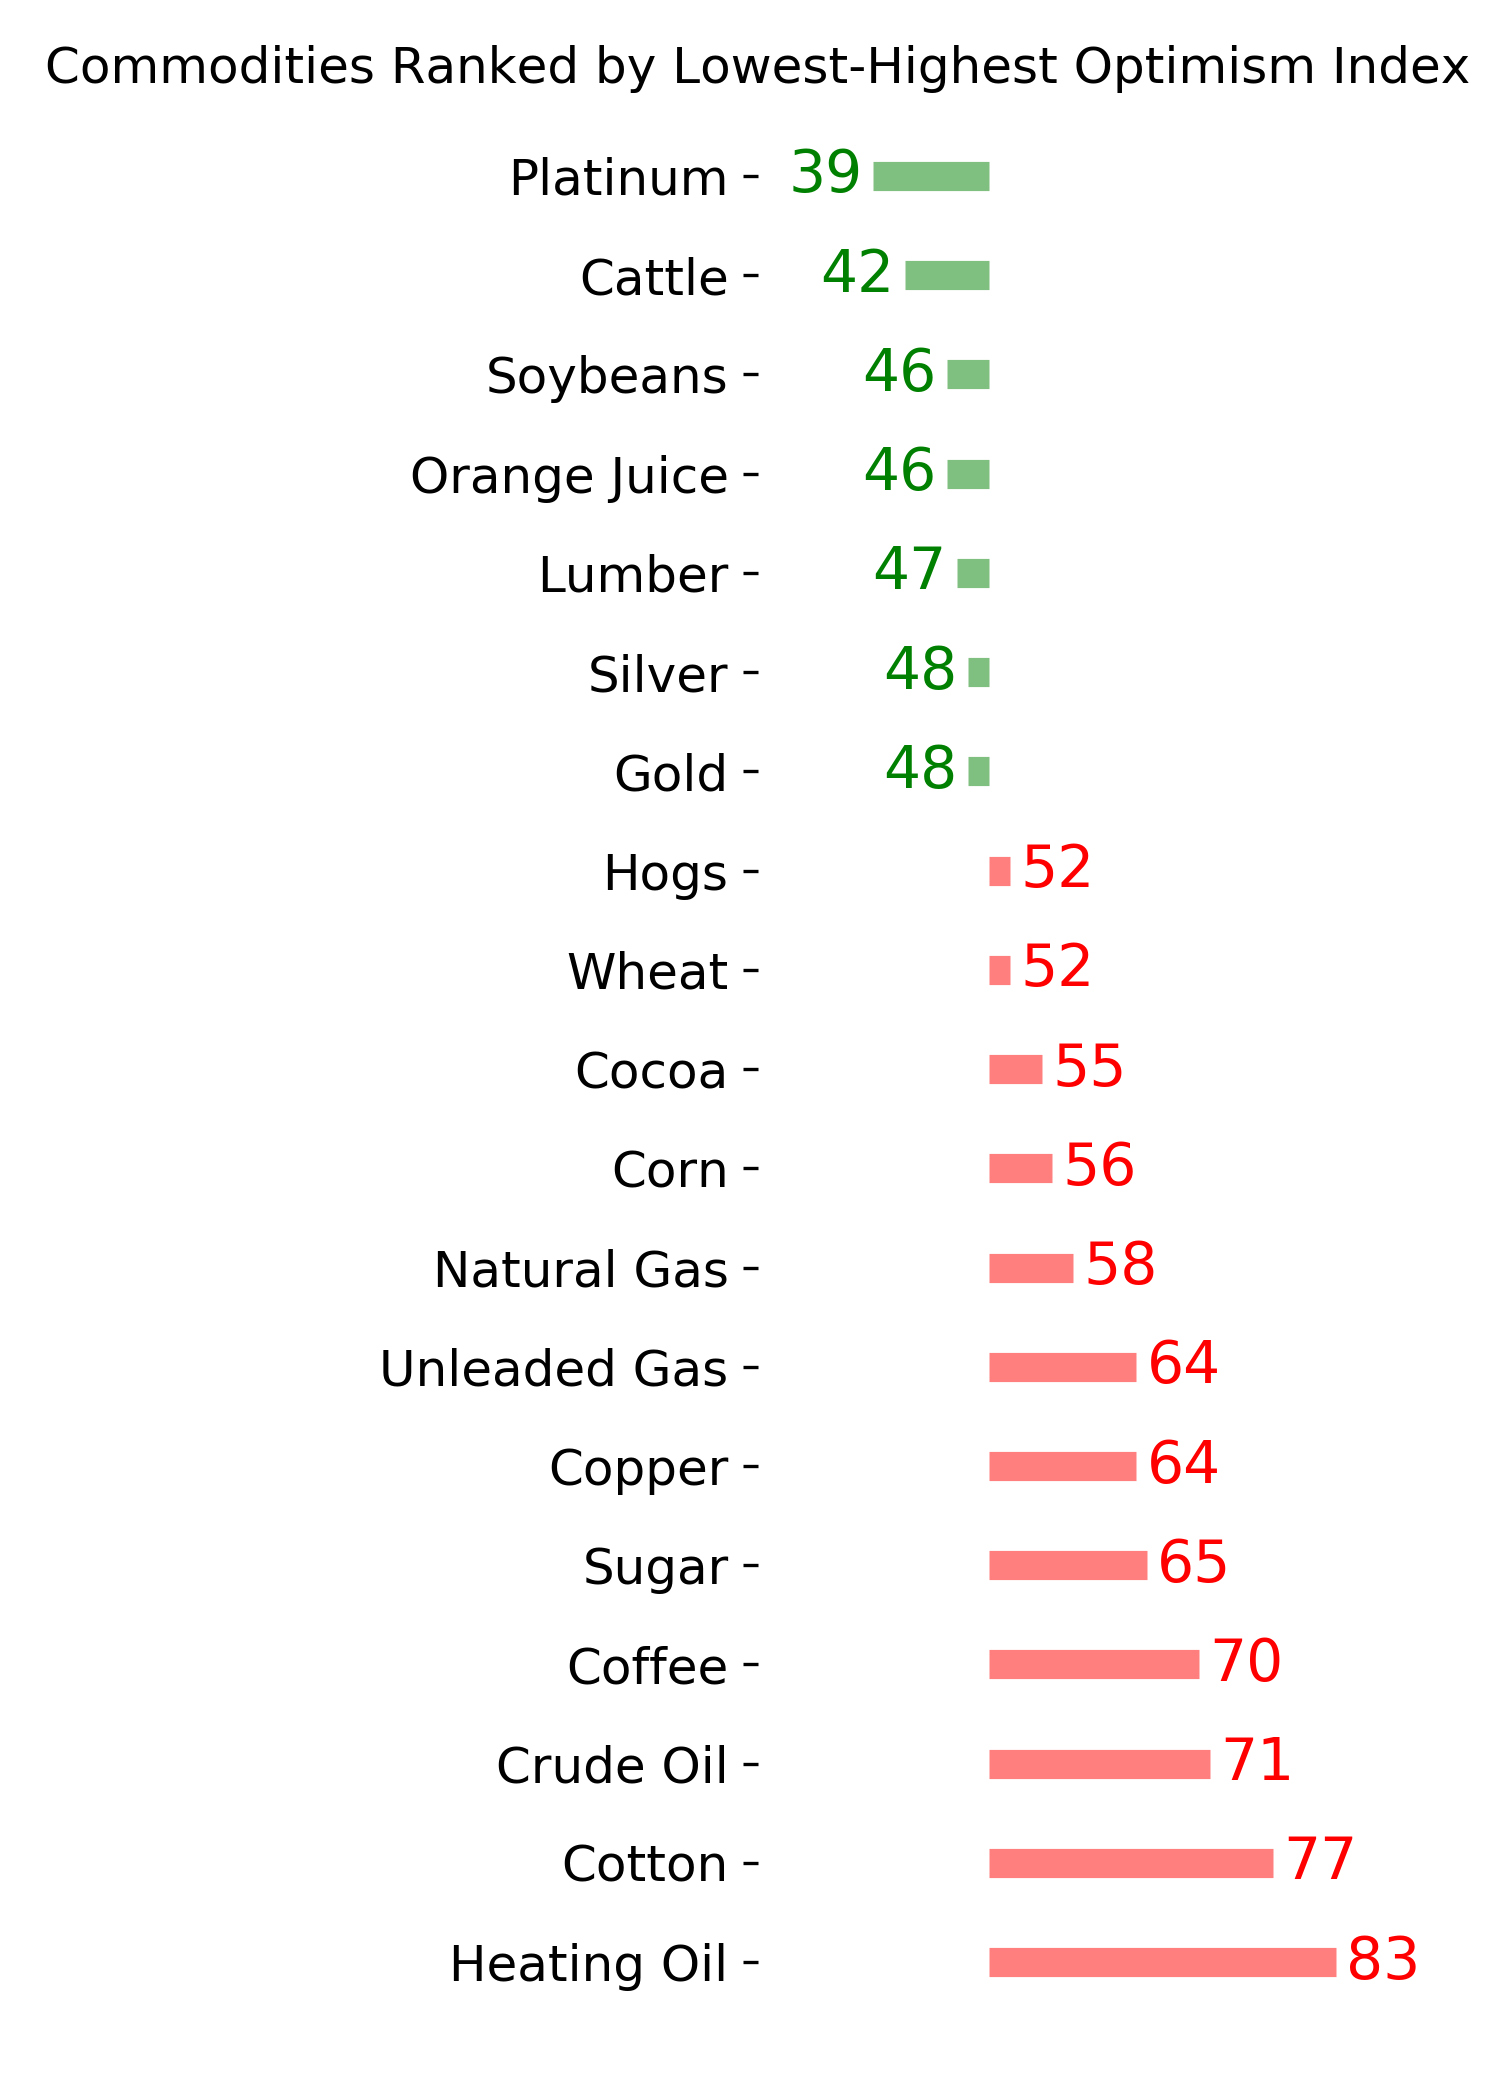
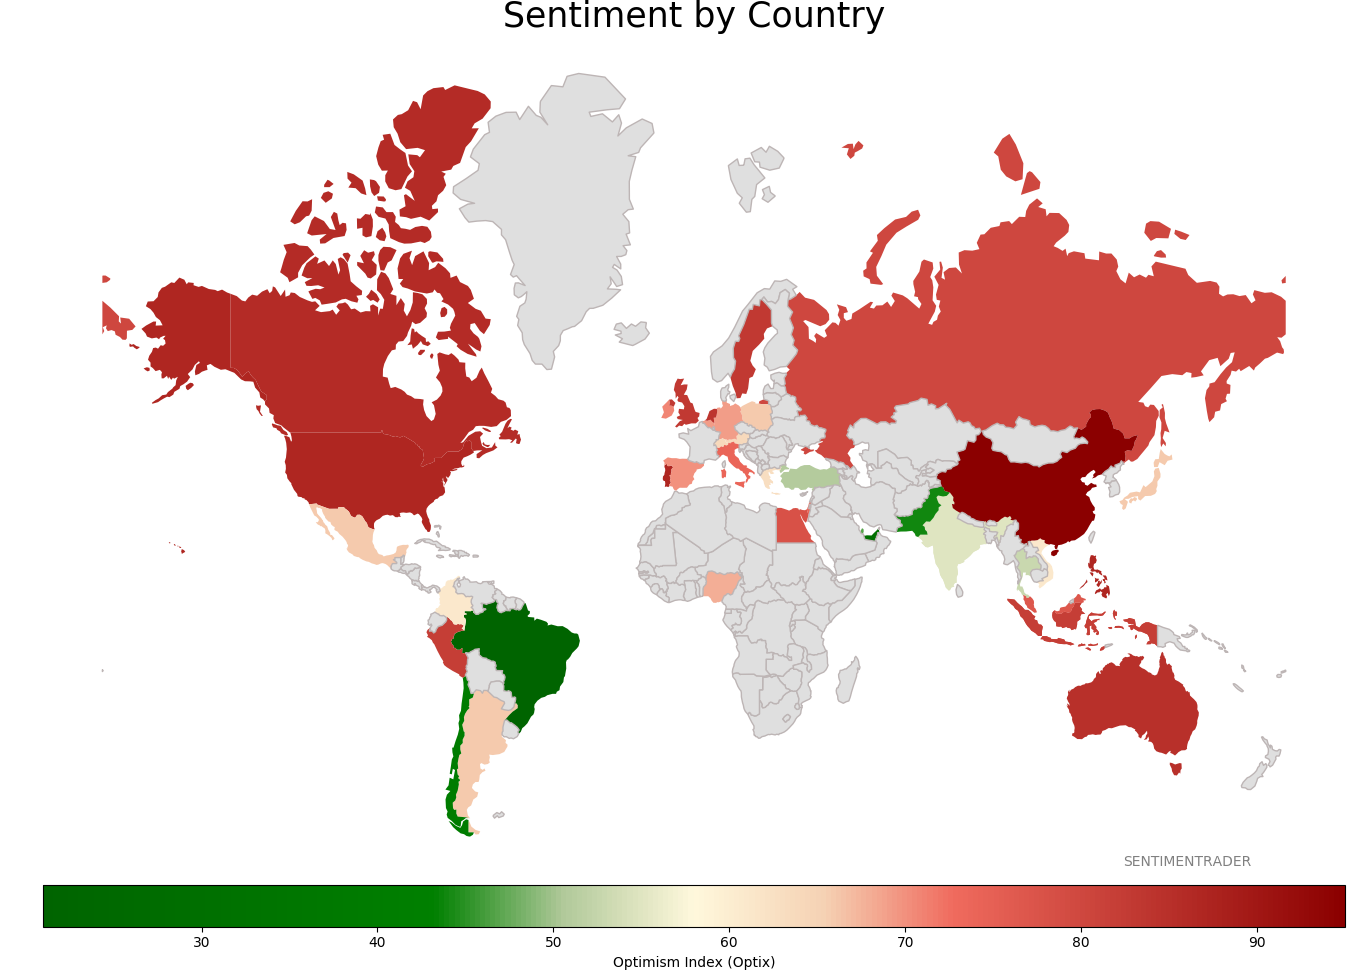
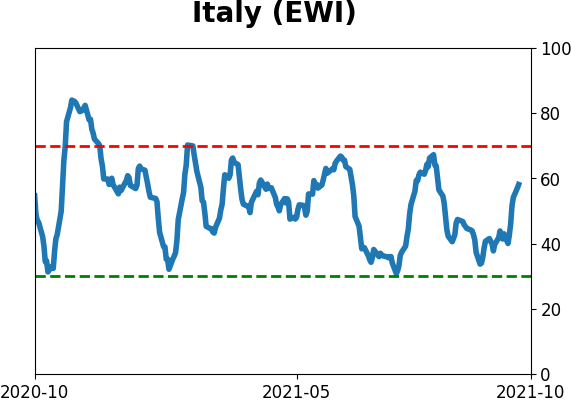
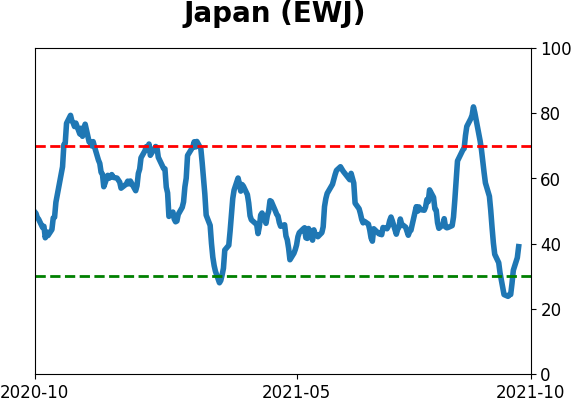
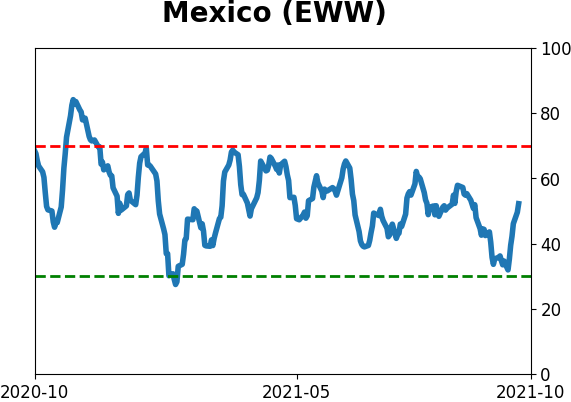
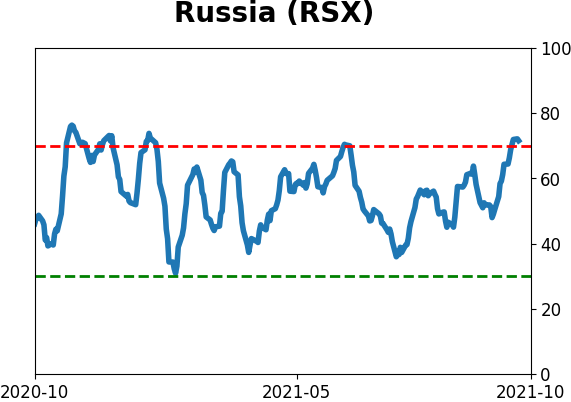
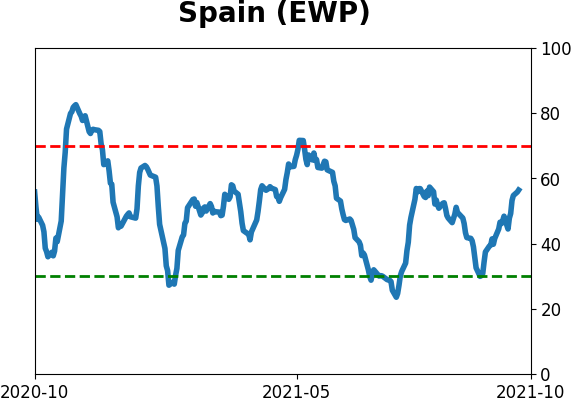
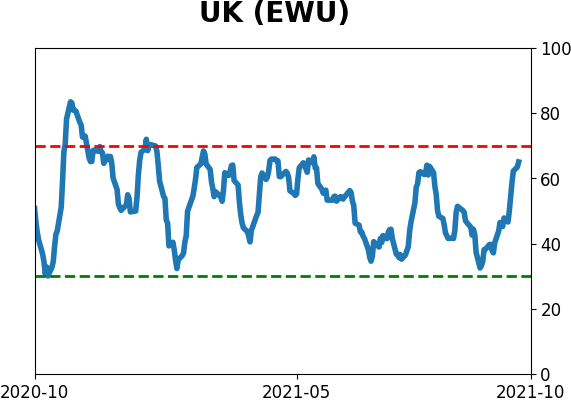
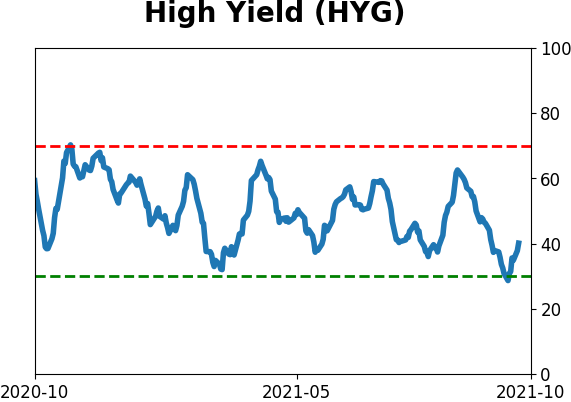
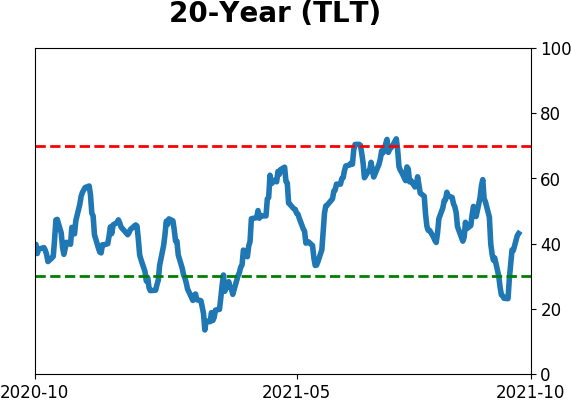
Sentiment Around The World
Optimism Index Thumbnails
|
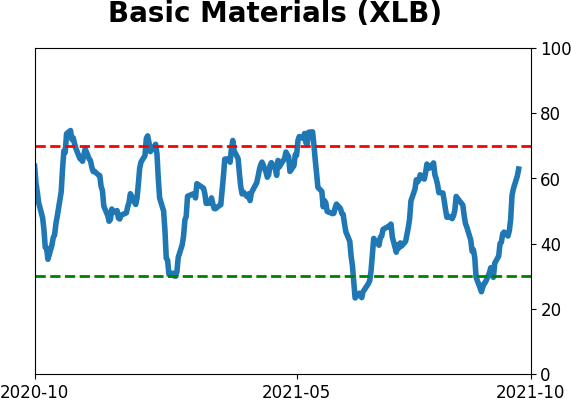
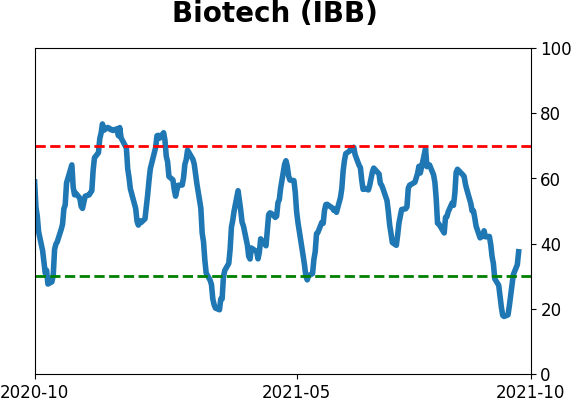
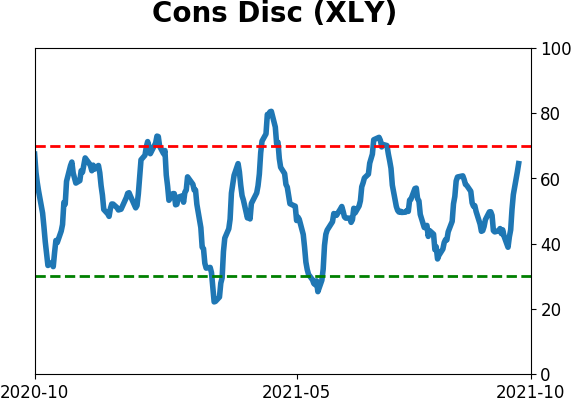
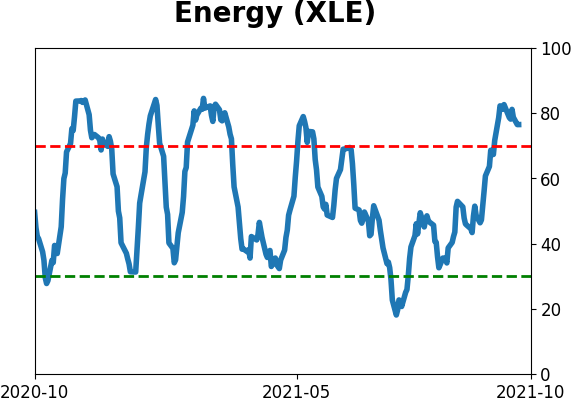
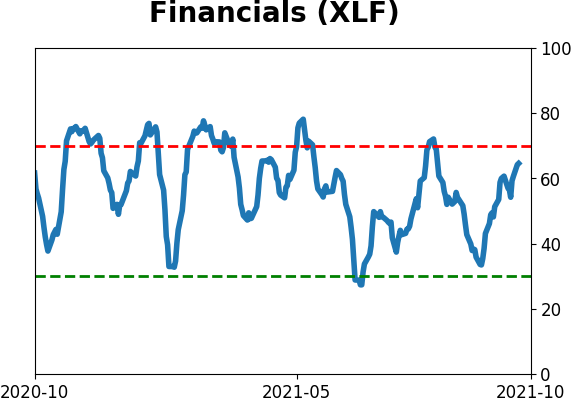
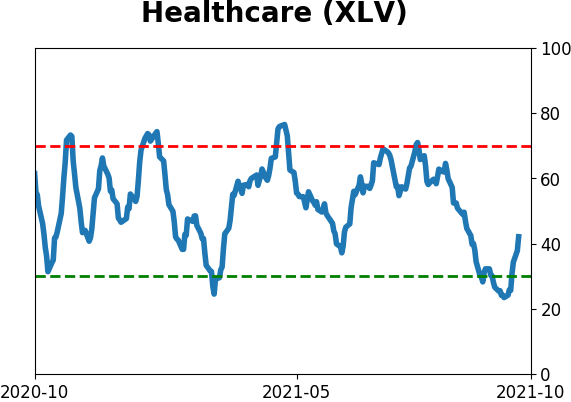
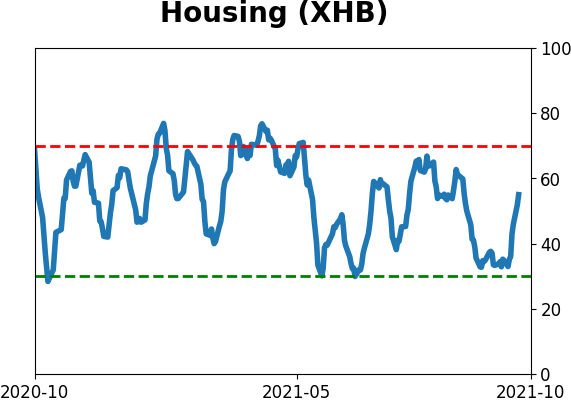
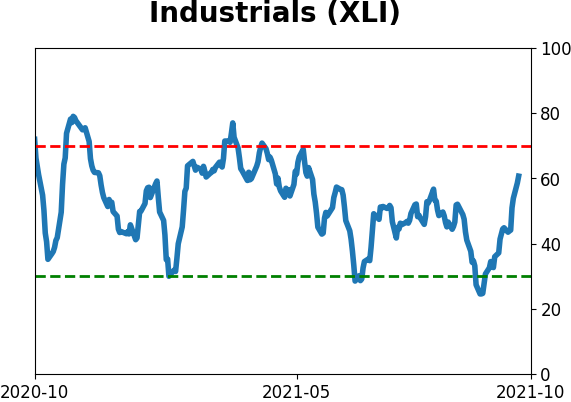
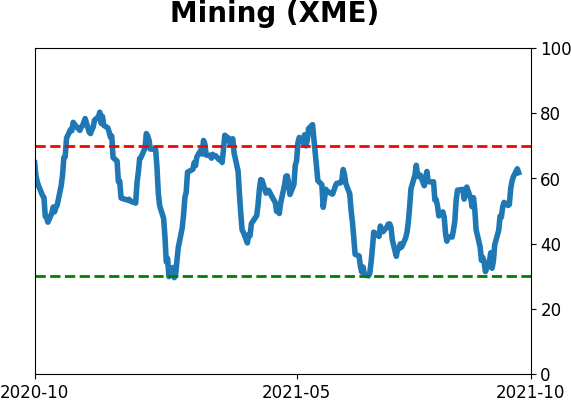
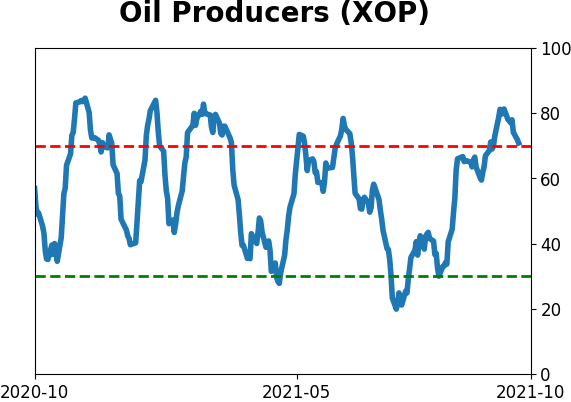
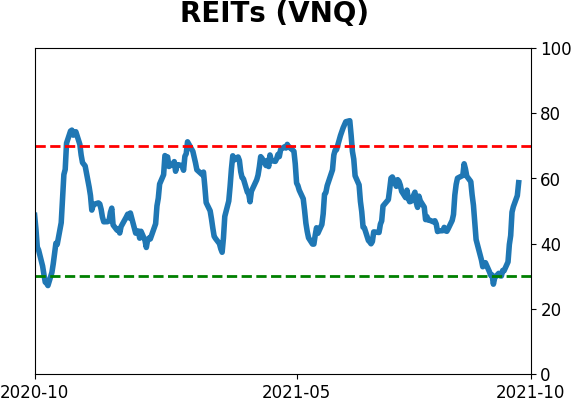
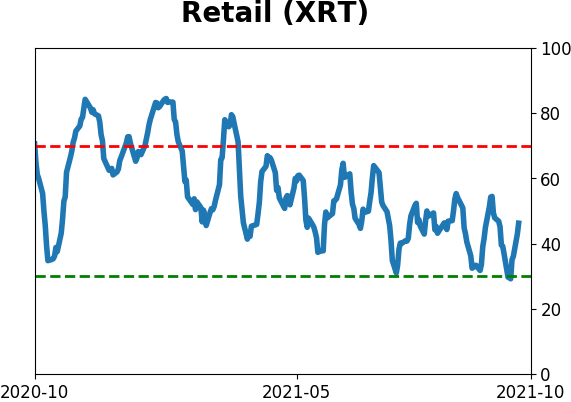
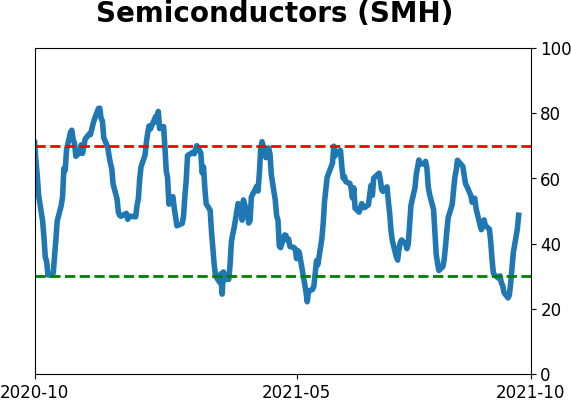
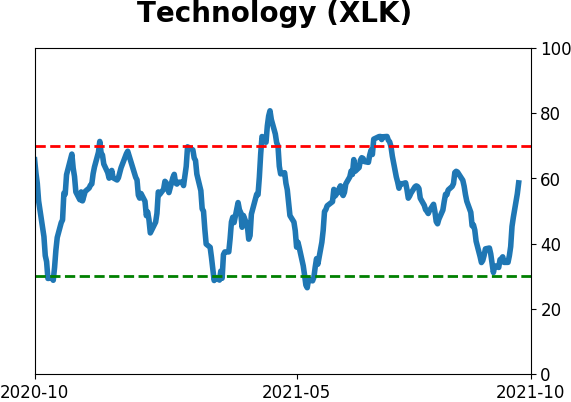
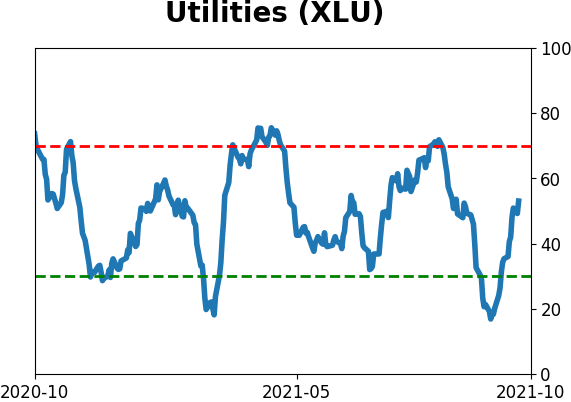
Sector ETF's - 10-Day Moving Average
|
|
|
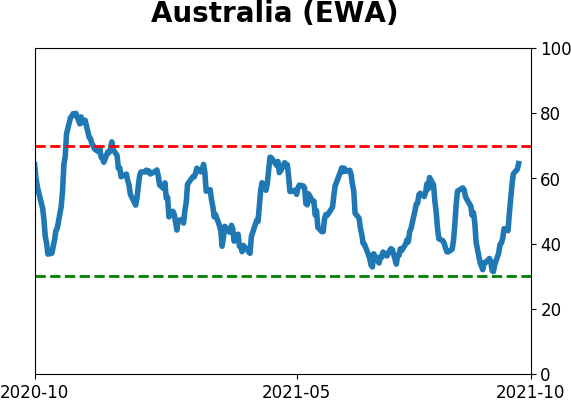
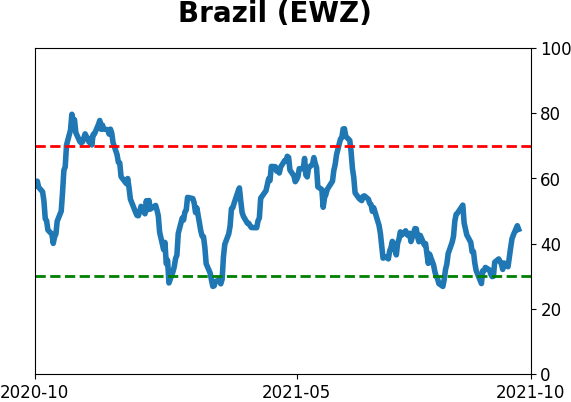
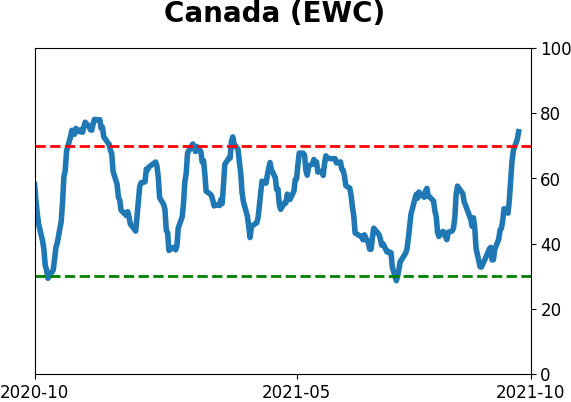
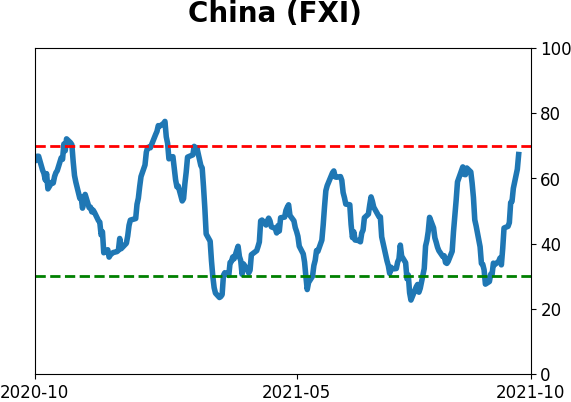
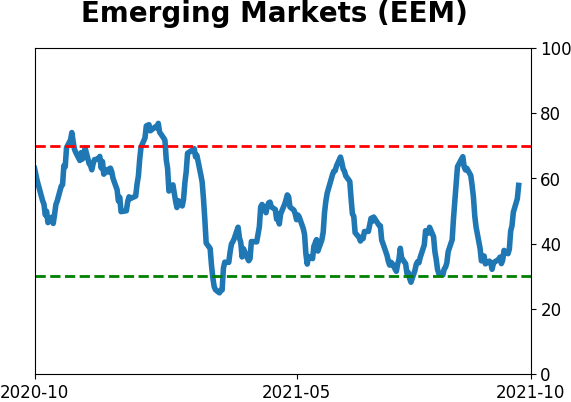
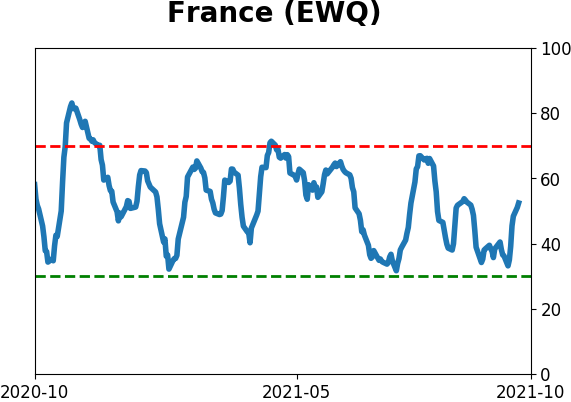
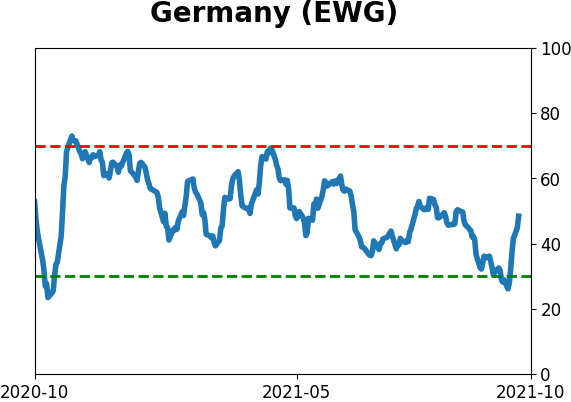
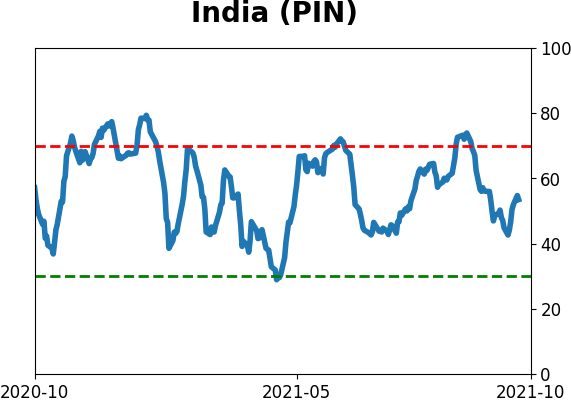
Country ETF's - 10-Day Moving Average
|
|
|
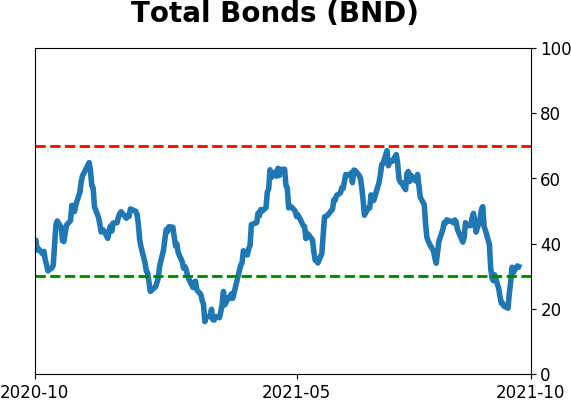
Bond ETF's - 10-Day Moving Average
|
|
|
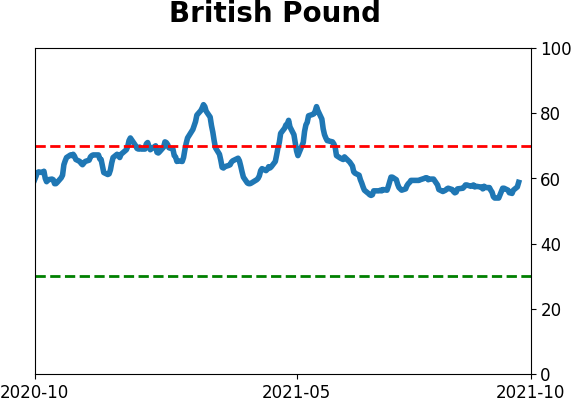
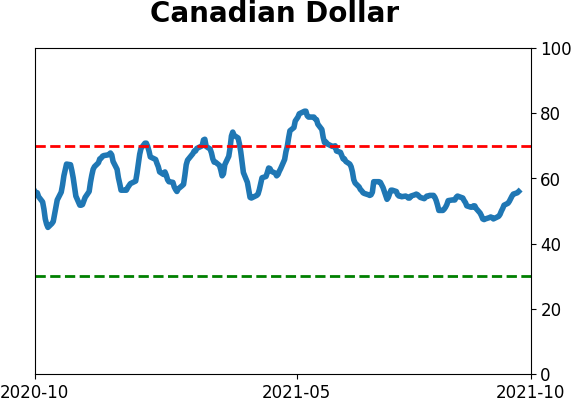
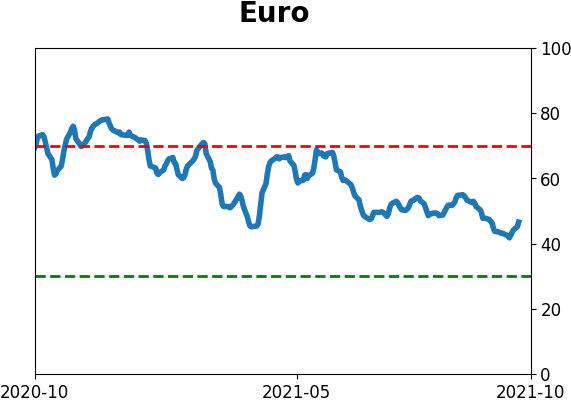
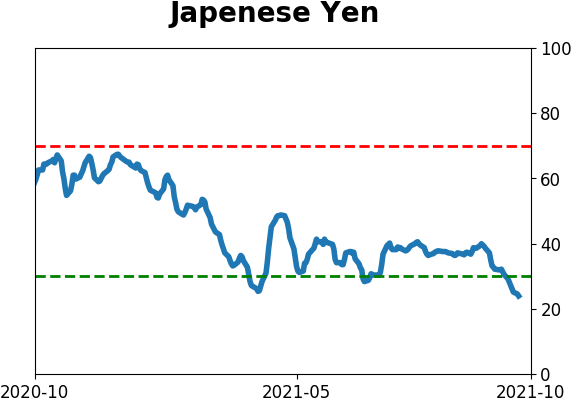
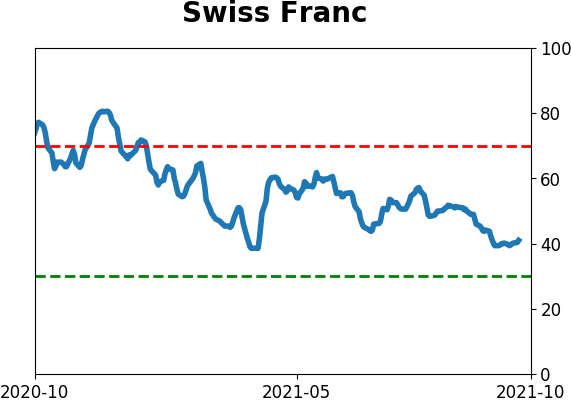
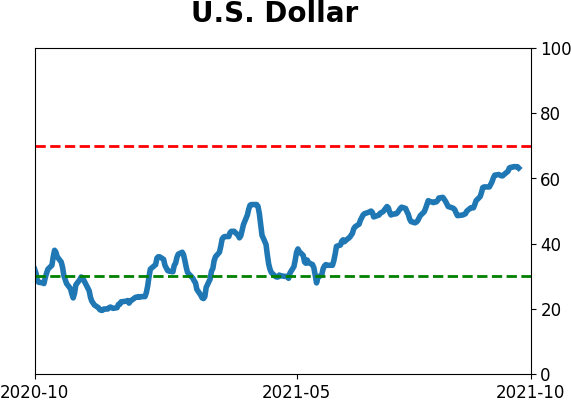
Currency ETF's - 5-Day Moving Average
|
|
|
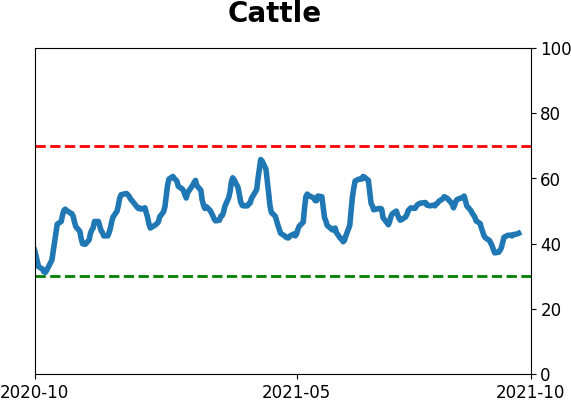
Commodity ETF's - 5-Day Moving Average
|
|