Headlines
|
|
What the Surge in Industrial Metals Means for Markets:
For only the 5th time in 40 years, industrial metals have doubled from a major low. Other doubles mostly preceded lower metals prices, higher stocks, and higher commodities.
Bottom Line:
STOCKS: Weak buy
The speculative frenzy in February is wrung out. There are some signs of pessimism, but the most compelling data show that buyers consistently tend to return once the first signs of extreme momentum end, especially as we head into a seasonally positive time of year. See the Outlook & Allocations page for more. BONDS: Hold
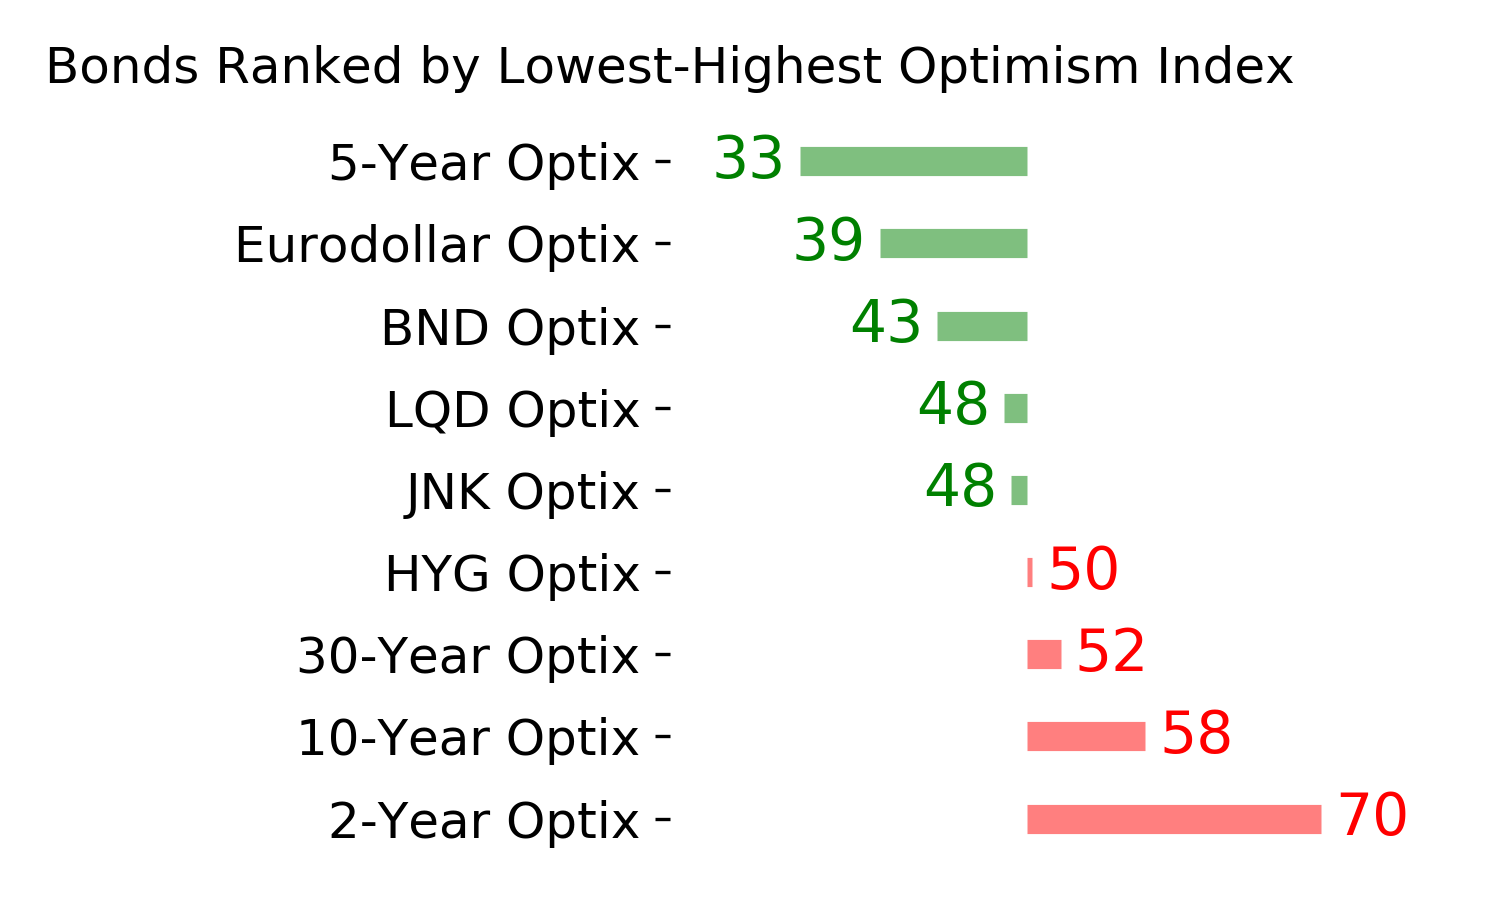
Various parts of the market got hit in March, with the lowest Bond Optimism Index we usually see during healthy environments. Bond prices have modest recovered and there is no edge among the data we follow. GOLD: Hold
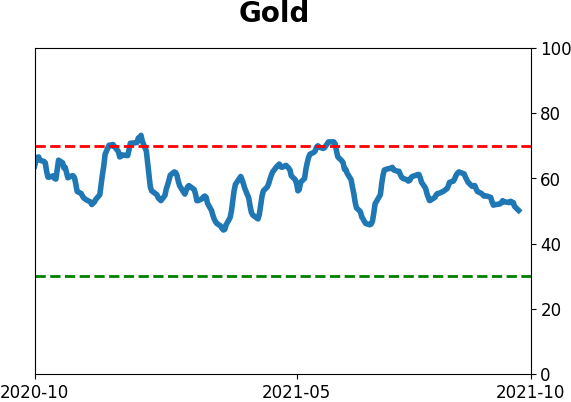
Gold and miners were rejected after trying to recover above their 200-day averages in May. Lately, some medium-term (not long-term) oversold extremes in breadth measures among miners have triggered.
|
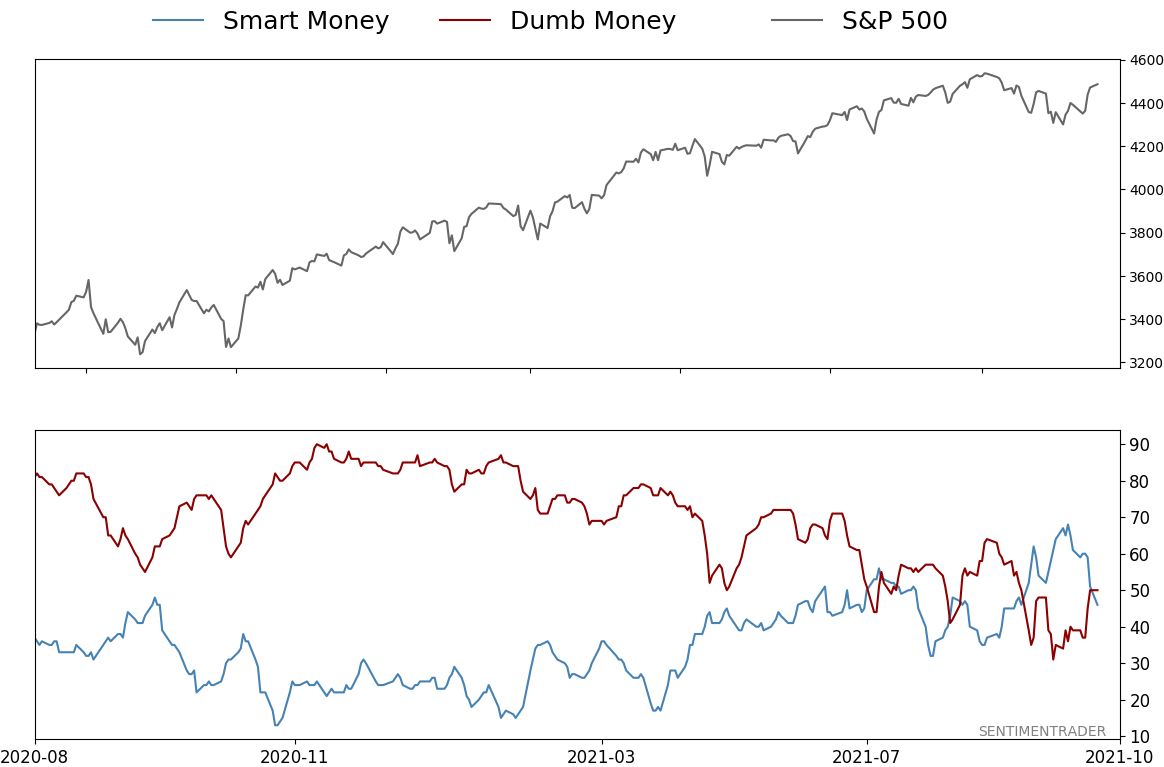
Smart / Dumb Money Confidence
|
Smart Money Confidence: 46%
Dumb Money Confidence: 50%
|
|
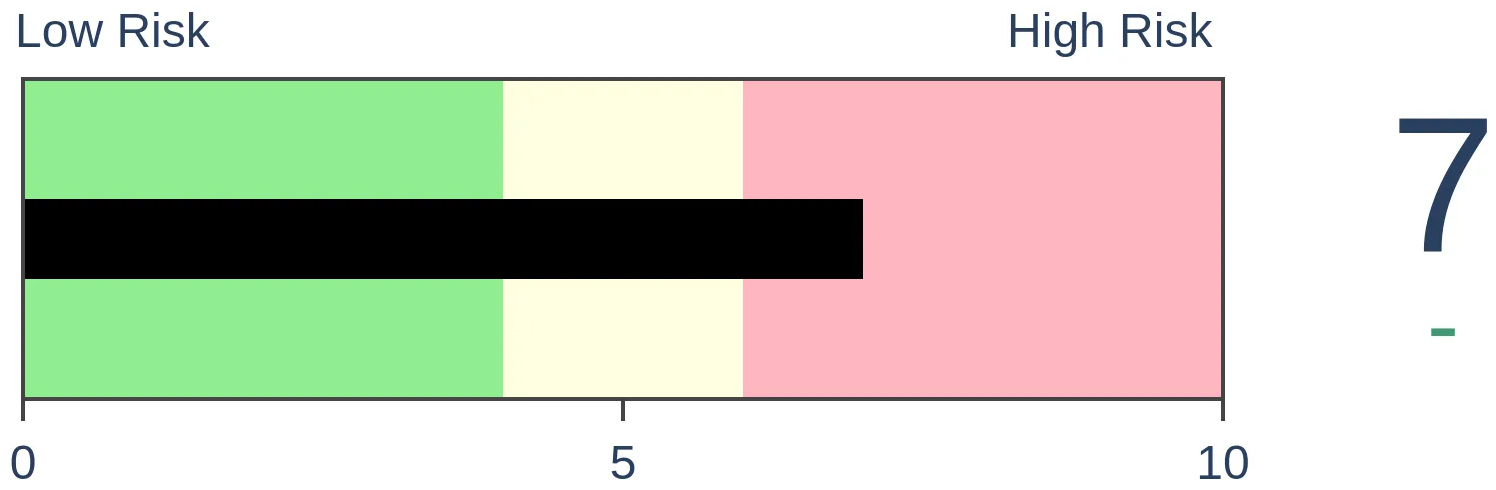
Risk Levels
Stocks Short-Term
|
Stocks Medium-Term
|
|
Bonds
|
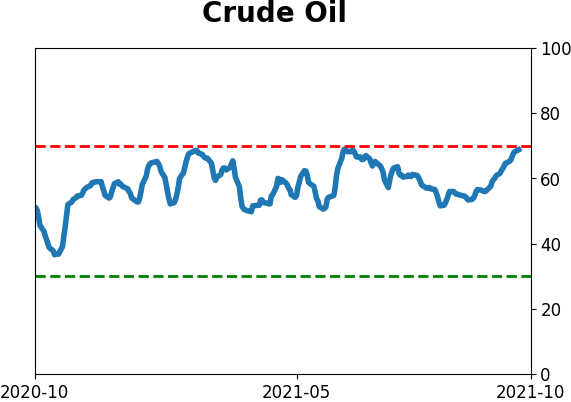
Crude Oil
|
|
Gold

|
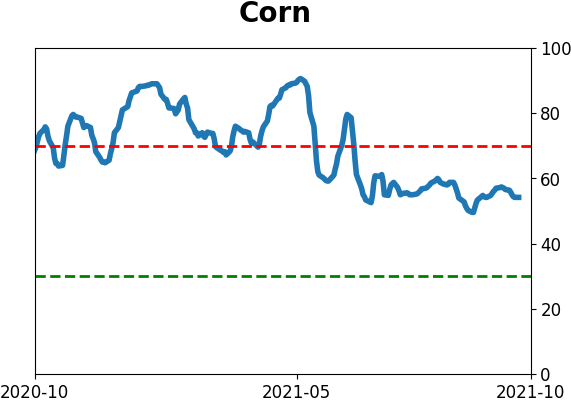
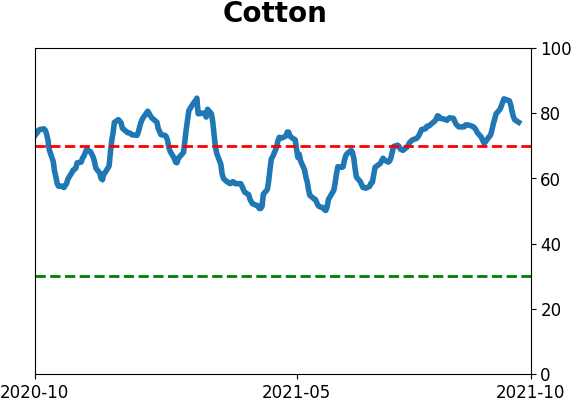
Agriculture

|
|
Research
By Jason Goepfert
BOTTOM LINE
For only the 5th time in 40 years, industrial metals have doubled from a major low. Other doubles mostly preceded lower metals prices, higher stocks, and higher commodities.
FORECAST / TIMEFRAME
None
|
When consumers are optimistic about the economy, they buy stuff. That stuff needs to be manufactured by somebody, and those somebodies need materials to make it.
So, manufacturers get busy, inputs are in demand, and industrial materials tend to rise. There's no doubt that's the case now.
Dean has shown how some metals like zinc and copper have skyrocketed. That has helped to drive the S&P GSCI Industrial Metals Index to a new high. Just as impressively, the index has doubled from its pandemic-panic low.
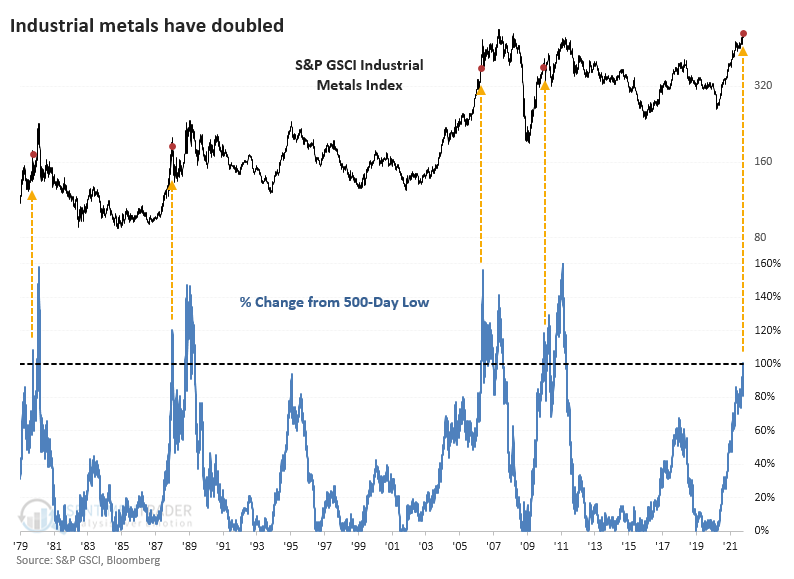
METAL PRICES DECLINED EVERY TIME
After prices in this market doubled from a low, the metals have typically been about to cool off. High prices tend to generate higher production, leading to lower prices through the magic of market forces. Massive moves like this don't often happen, so the usual caveats about small sample sizes apply.
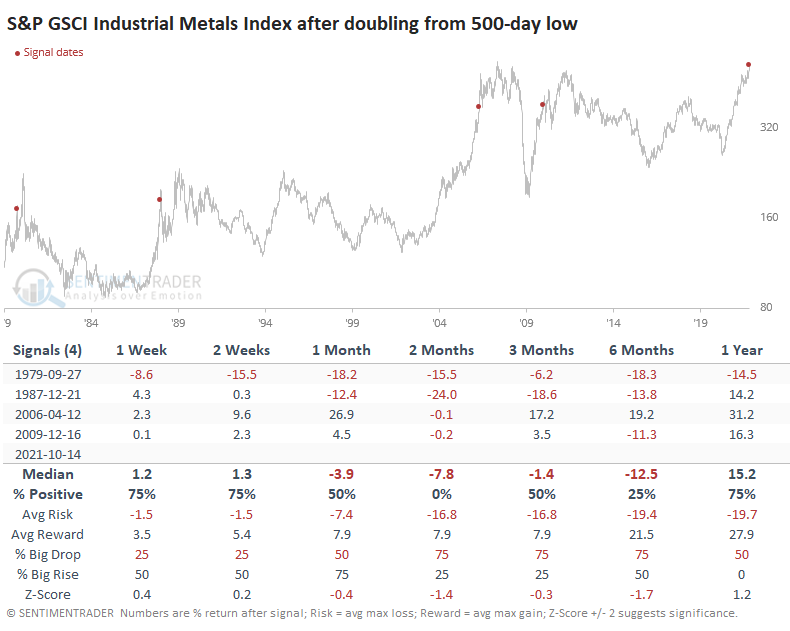
By the time these metals doubled, the upside was relatively limited and, over the next couple of months, cooled off every time. The 2006 spike preceded an incredibly volatile stretch (well, they all did), and metals prices were nearly 20% higher six months later, while the other three all saw double-digit declines.
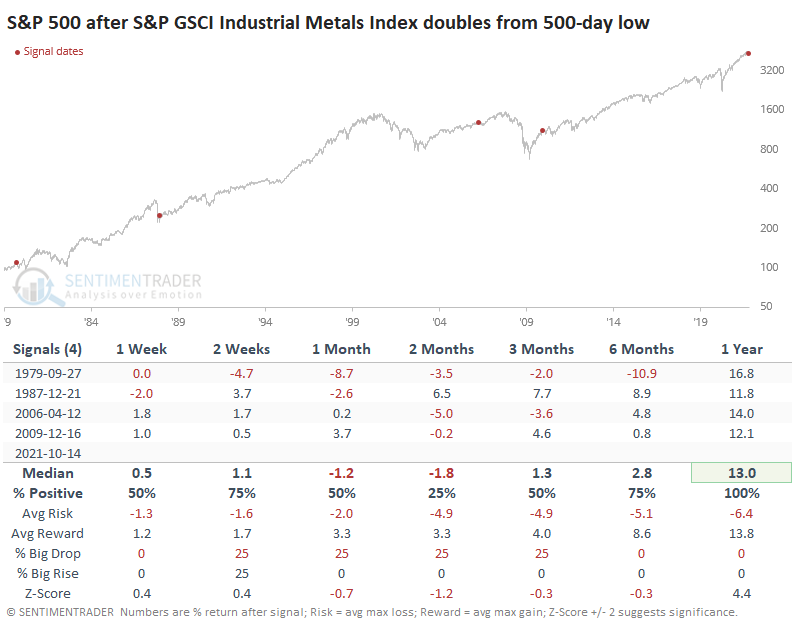
A GOOD SIGN FOR STOCKS
The doubling of industrial metals tended to be a good long-term sign for stocks. There is not a one-for-one relationship between the economy and the stock market. Still, we could assume that a rise in industrial metals meant good things about economic demand, and over the next year, the S&P 500 sported double-digit gains each time. There was also a 1-2 month soft spot each time, too, however.
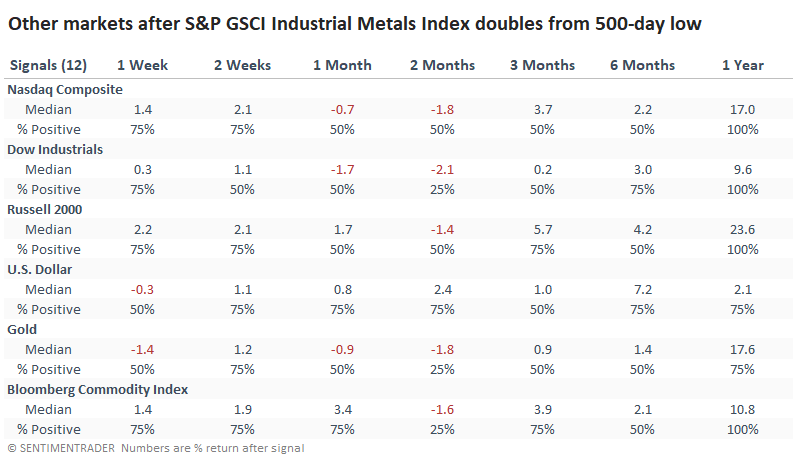
It was also a good sign for other stock indexes. Again, the indexes stumbled over the next 1-2 months, but the Nasdaq Composite, Dow Industrials, and (especially) Russell 2000 showed good long-term gains.
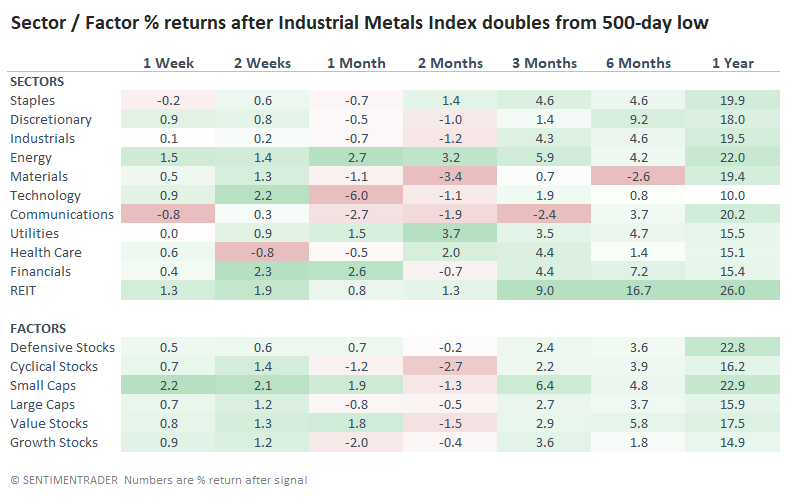
REITs were among the best performers across time frames among sectors and factors, while Materials struggled a bit. Small-caps and Value stocks tended to hold up well.
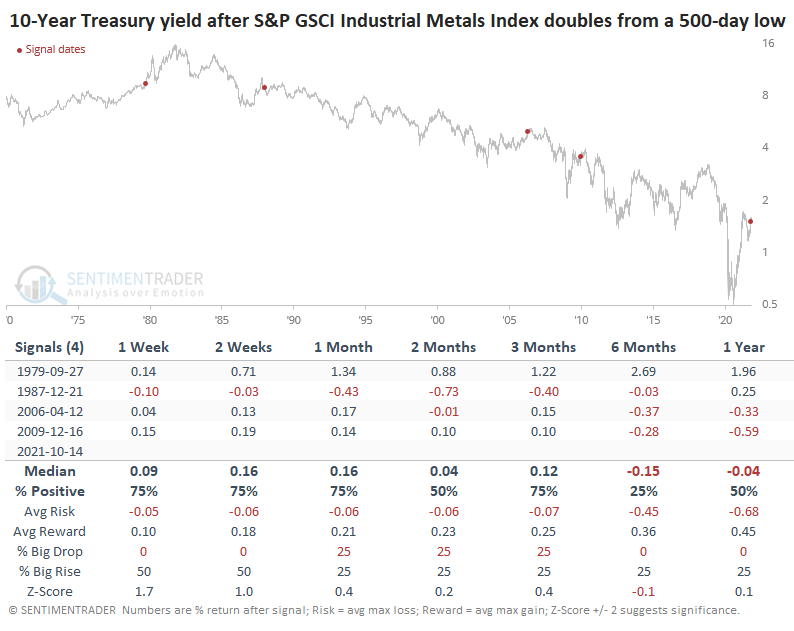
NOT A BOND KILLER
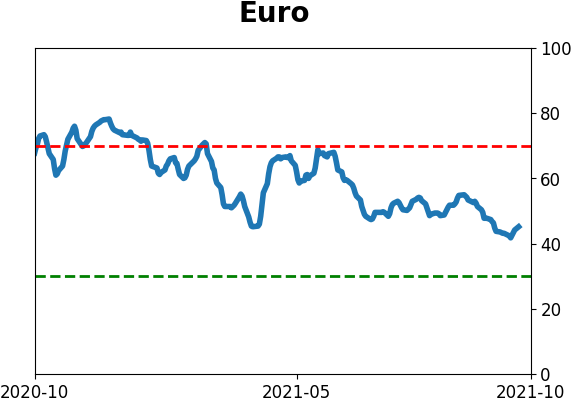
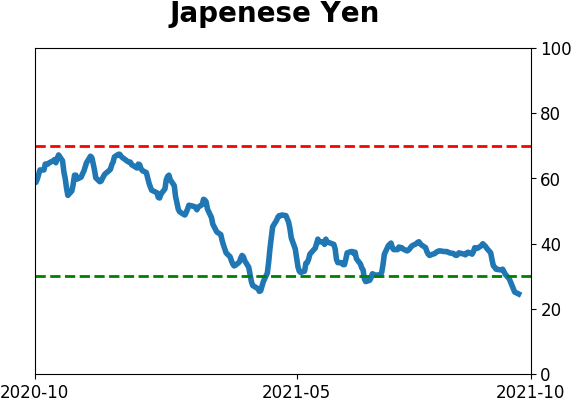
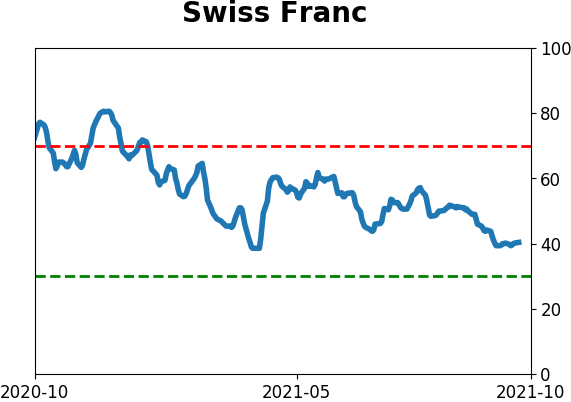
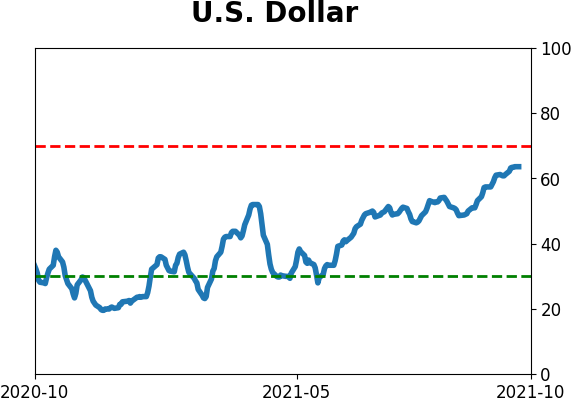
The U.S. dollar tended to rise over the medium-term, while gold and commodities fell, but a year later, the Bloomberg Commodity Index showed a gain each time.
While a doubling of metals prices might inflate inflationary fears, it wasn't a consistent stopper for the bond bull market. Yields on 10-year Treasuries dropped an average of 15 basis points over the next six months, but it did ignite a quick rise in the early 1980s.
Structural forces, instead of pure supply and demand, may be helping to inflame the surge in industrial metals prices. Still, ultimately consumer demand for goods is among the most critical drivers. And when we see that, producers have an incentive to increase production, so prices in the metals have consistently declined. It's been a good long-term sign for stocks, though, and adds to the idea that the recent dip in momentum may serve to bring in yet more buyers.
Active Studies
| Time Frame | Bullish | Bearish | | Short-Term | 0 | 0 | | Medium-Term | 7 | 0 | | Long-Term | 11 | 5 |
|
Indicators at Extremes
Portfolio
| Position | Description | Weight % | Added / Reduced | Date | | Stocks | RSP | 10.5 | Added 6.4% | 2021-10-01 | | Bonds | 23.9% BND, 6.9% SCHP | 31.5 | Reduced 7.1% | 2021-05-19 | | Commodities | GCC | 2.6 | Reduced 2.1%
| 2020-09-04 | | Precious Metals | GDX | 4.2 | Reduced 4.2% | 2021-05-19 | | Special Situations | 9.8% KWEB, 4.7% XLE, 2.9% PSCE | 17.3 | Added 9.78% | 2021-10-01 | | Cash | | 34.0 | | |
|
Updates (Changes made today are underlined)
Much of our momentum and trend work has remained positive for several months, with some scattered exceptions. Almost all sentiment-related work has shown a poor risk/reward ratio for stocks, especially as speculation drove to record highs in exuberance in February. Much of that has worn off, and most of our models are back toward neutral levels. There isn't much to be excited about here. The same goes for bonds and even gold. Gold has been performing well lately and is back above long-term trend lines. The issue is that it has a poor record of holding onto gains when attempting a long-term trend change like this, so we'll take a wait-and-see approach. Momentum has ebbed quickly in recent weeks, and nearing oversold levels in some indicators. This can be a dangerous area, with a lot of short-term volatility, but we'd be more inclined to add medium- to long-term exposure rather than sell on much more of a decline, thanks to already rock-bottom exposure. Other areas look more attractive, including some overseas markets. RETURN YTD: 11.0% 2020: 8.1%, 2019: 12.6%, 2018: 0.6%, 2017: 3.8%, 2016: 17.1%, 2015: 9.2%, 2014: 14.5%, 2013: 2.2%, 2012: 10.8%, 2011: 16.5%, 2010: 15.3%, 2009: 23.9%, 2008: 16.2%, 2007: 7.8%
|
|
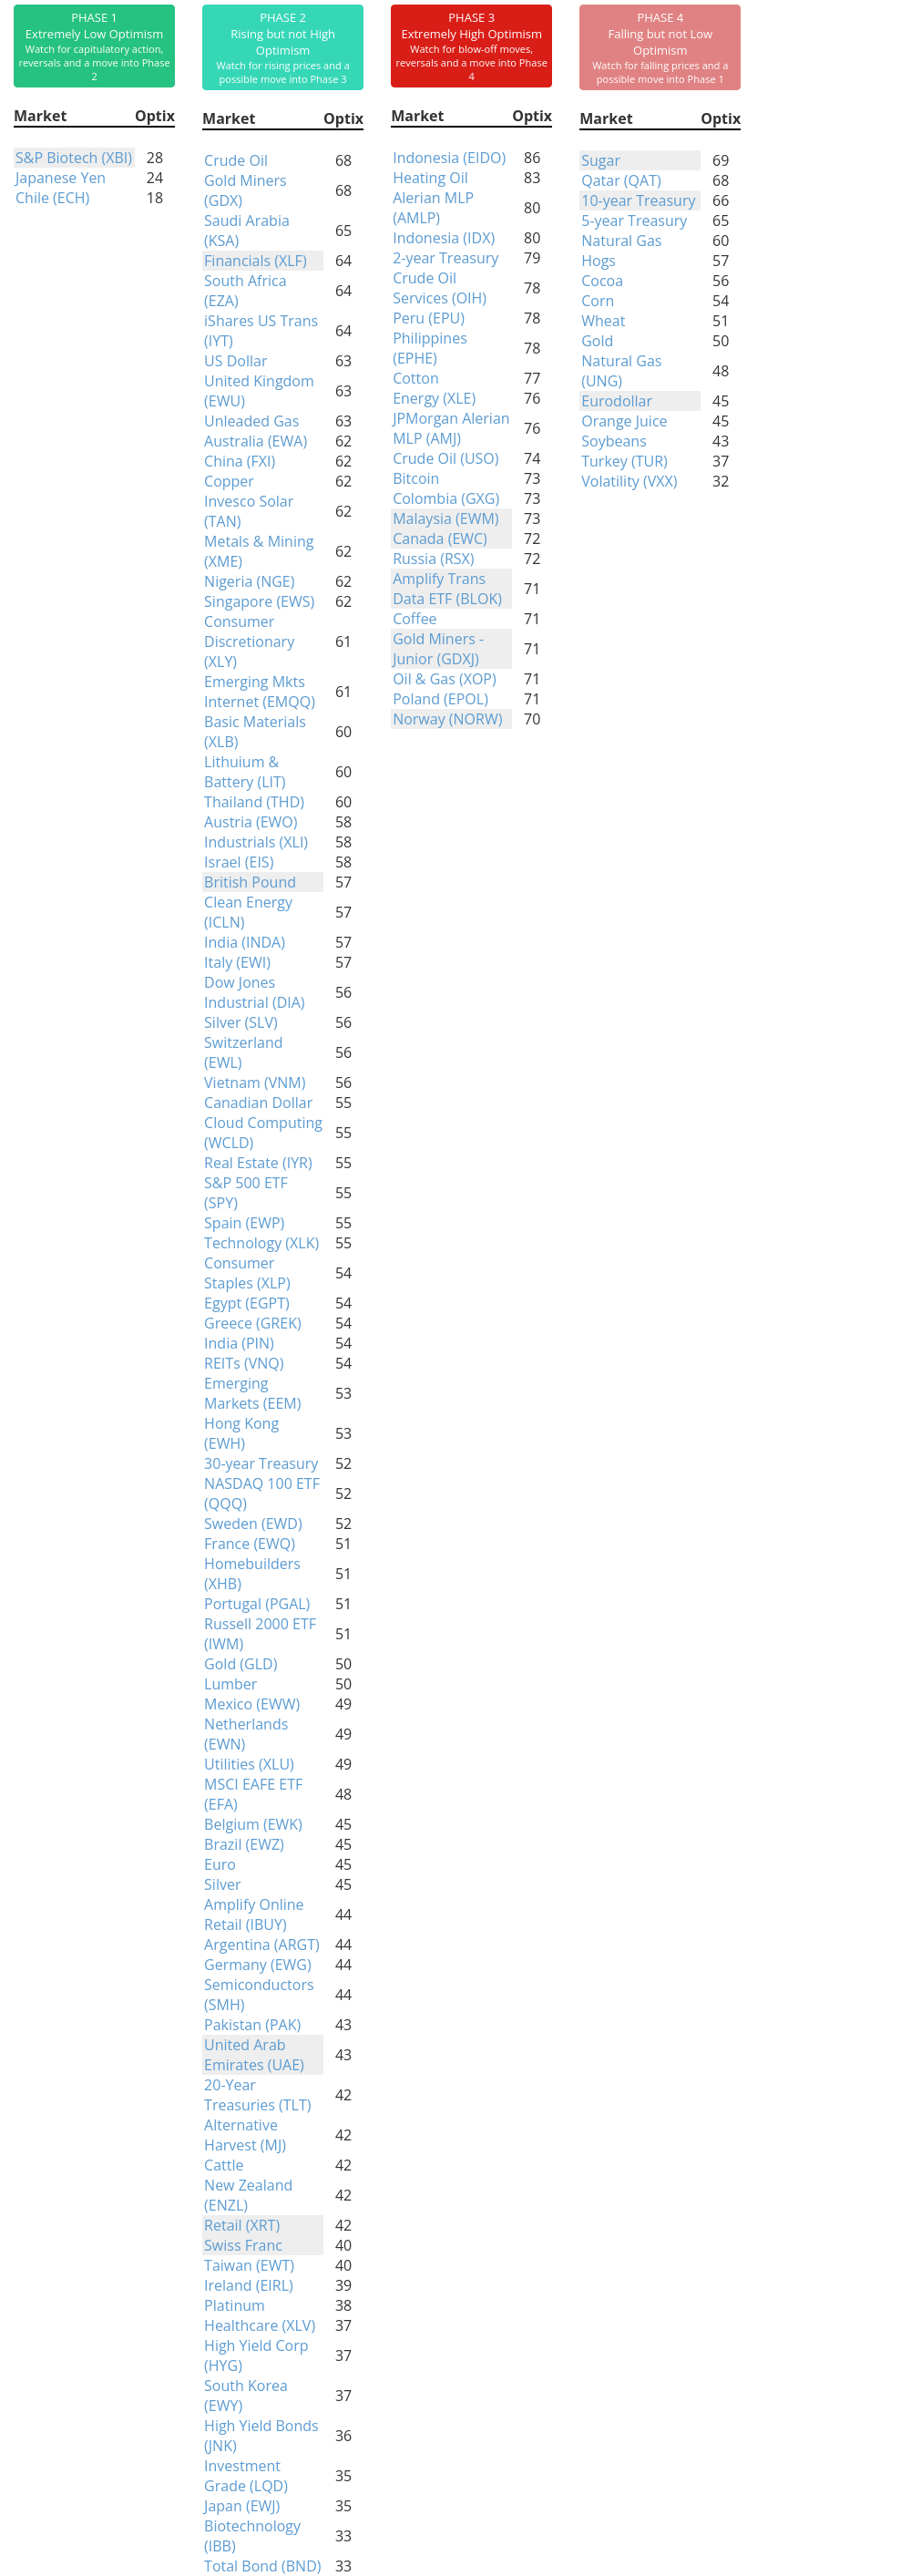
Phase Table
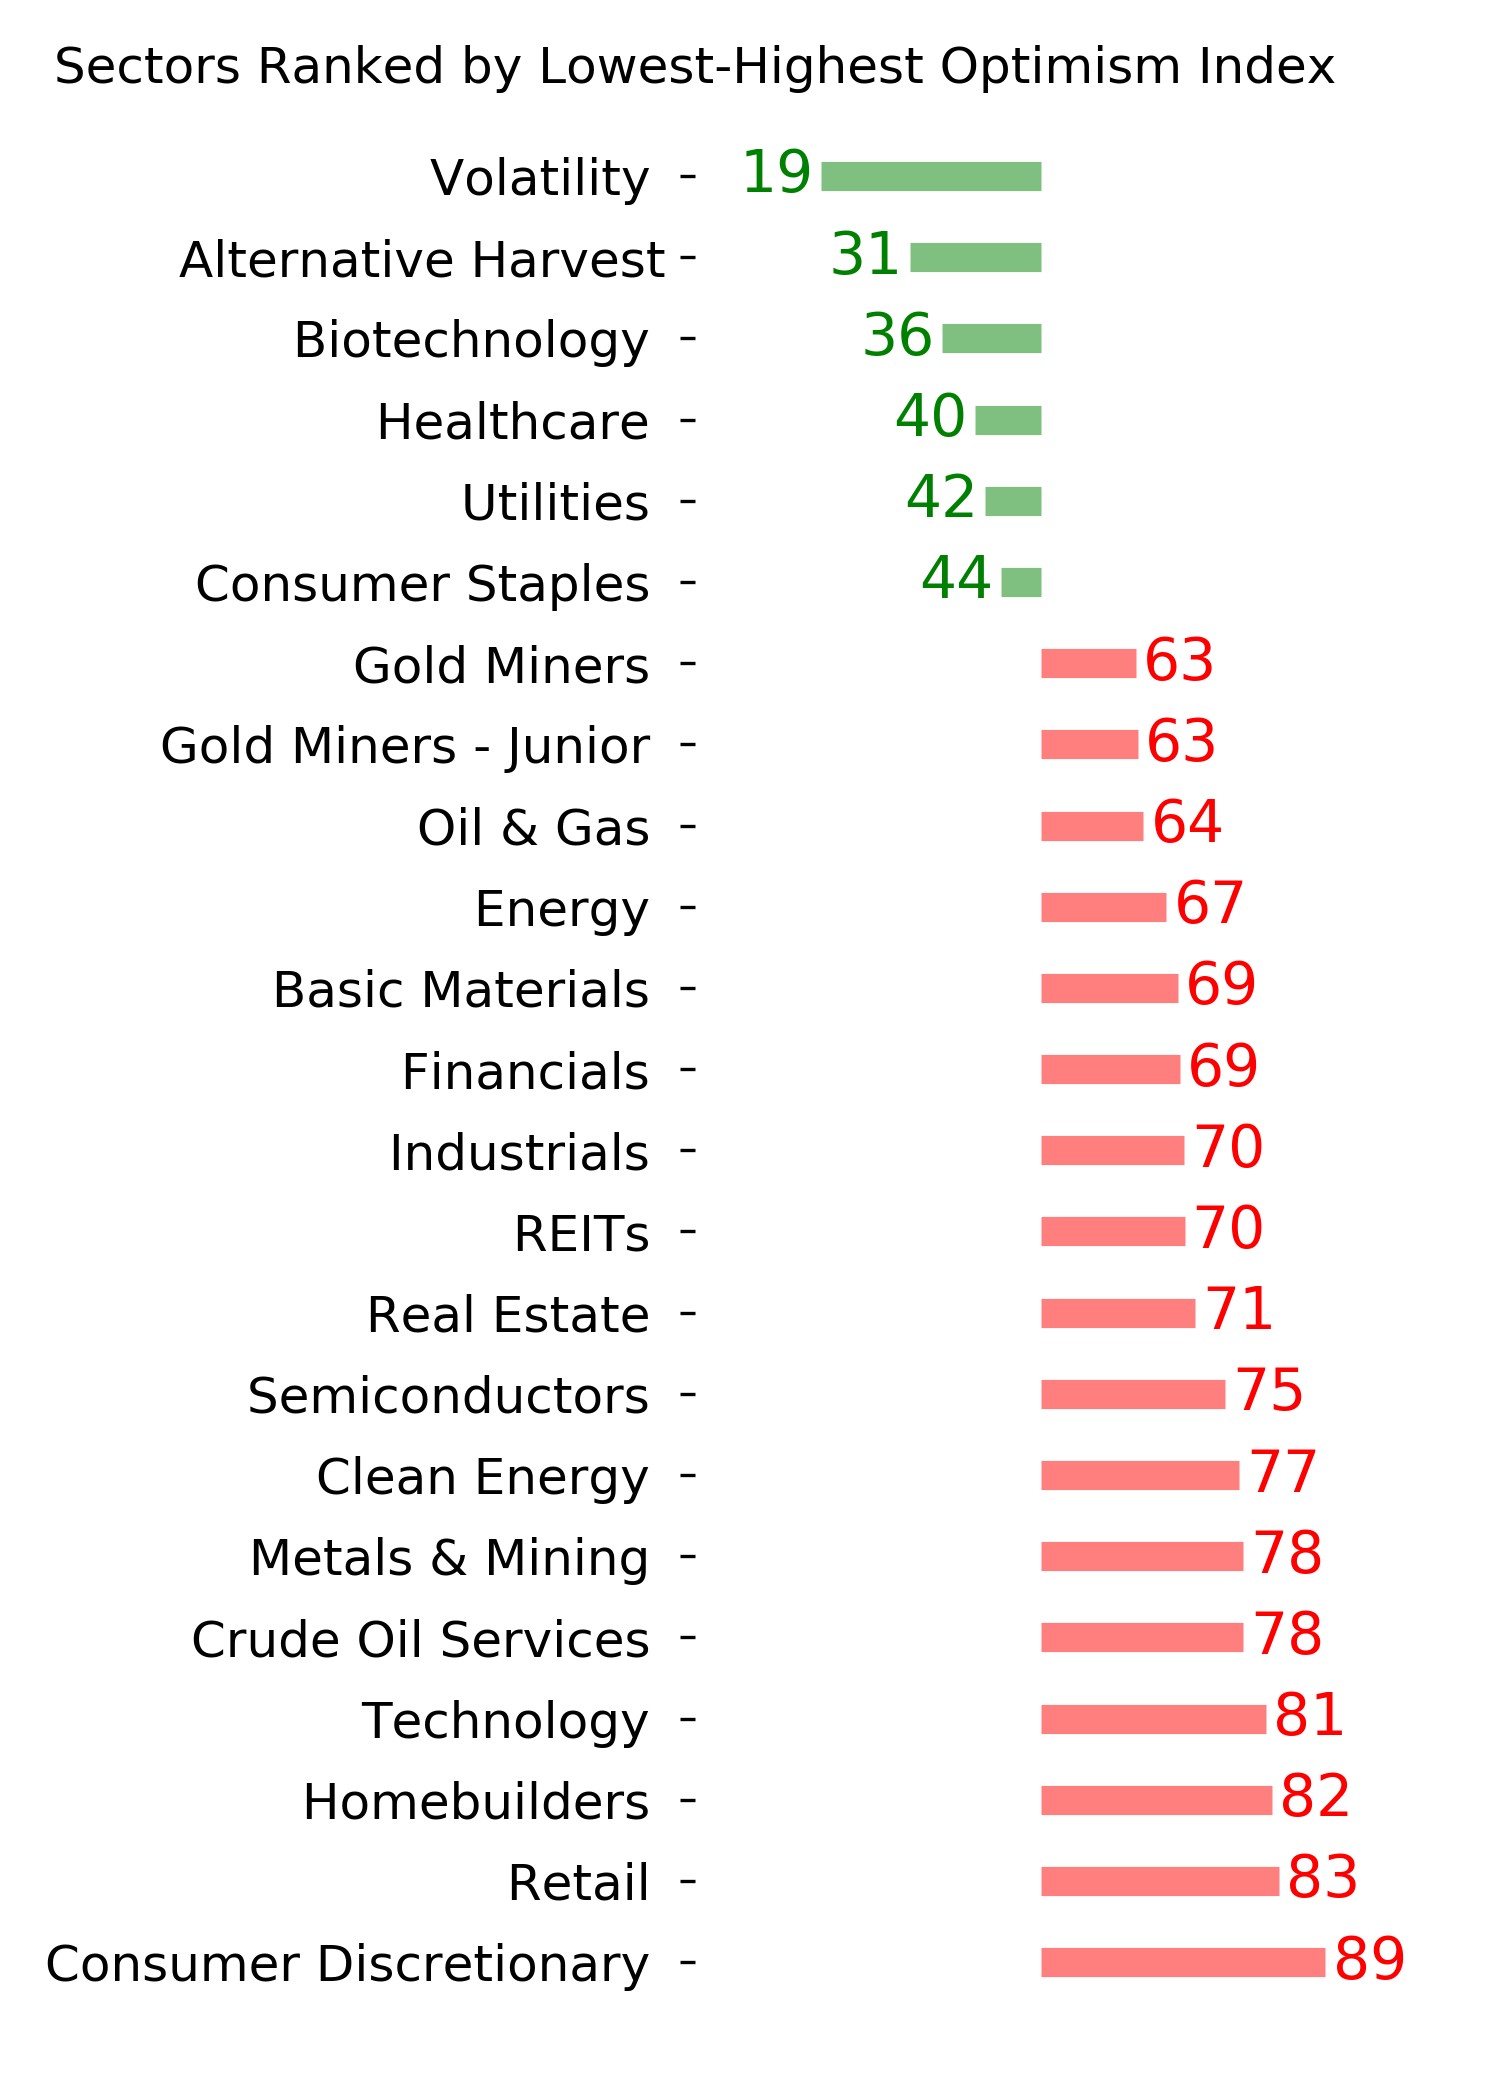
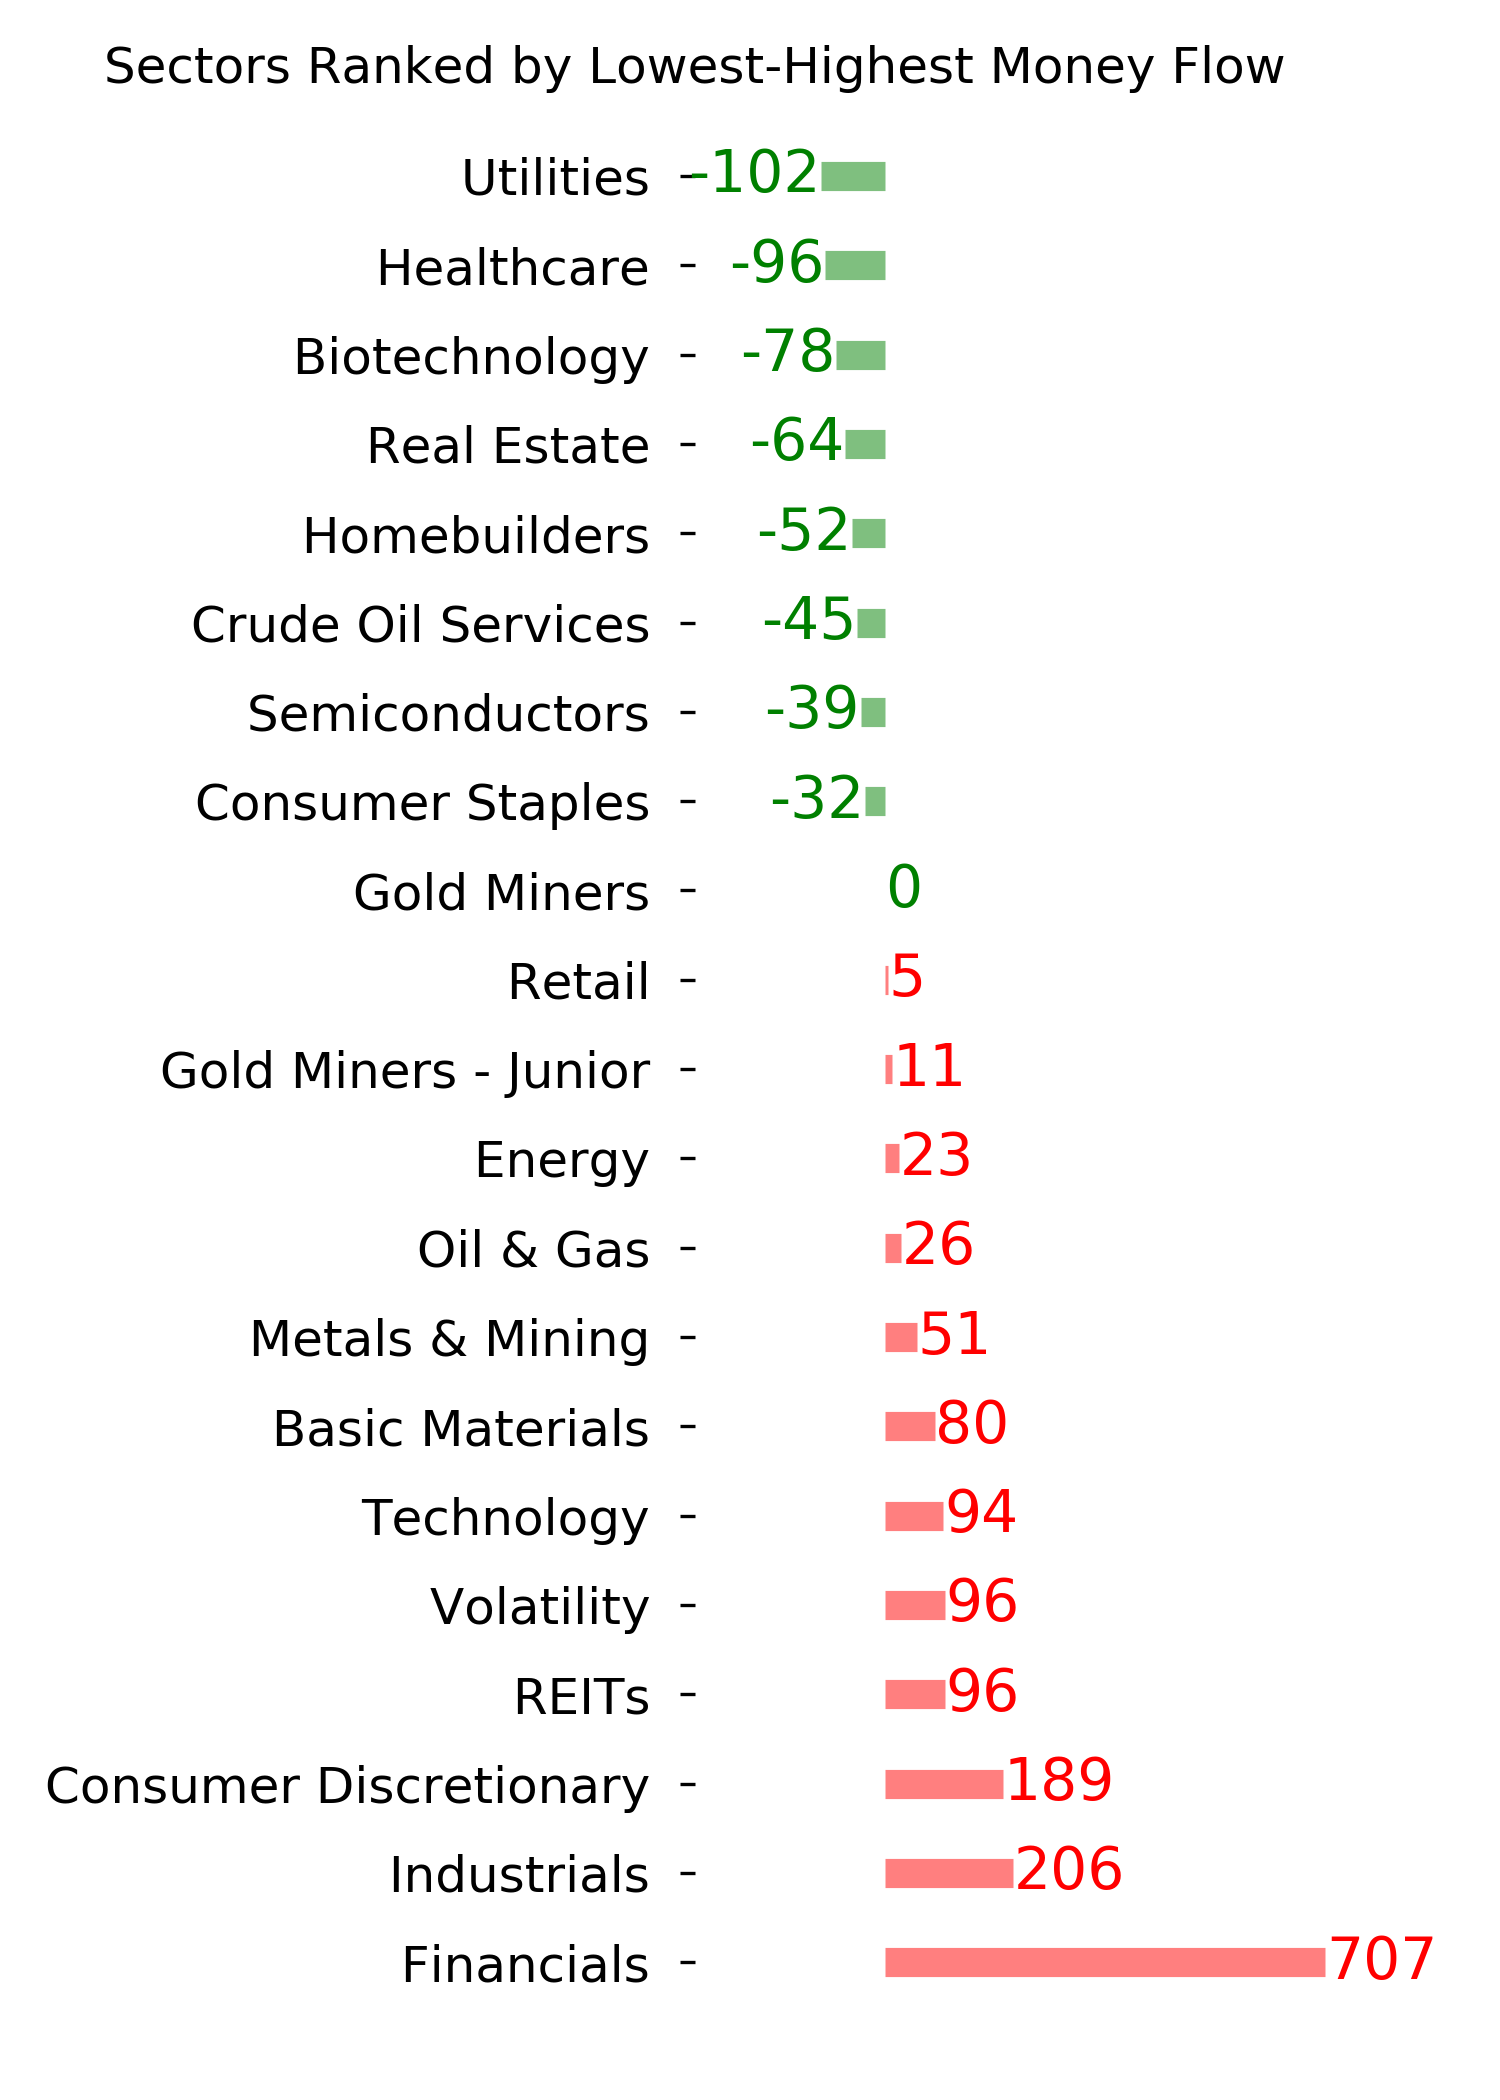
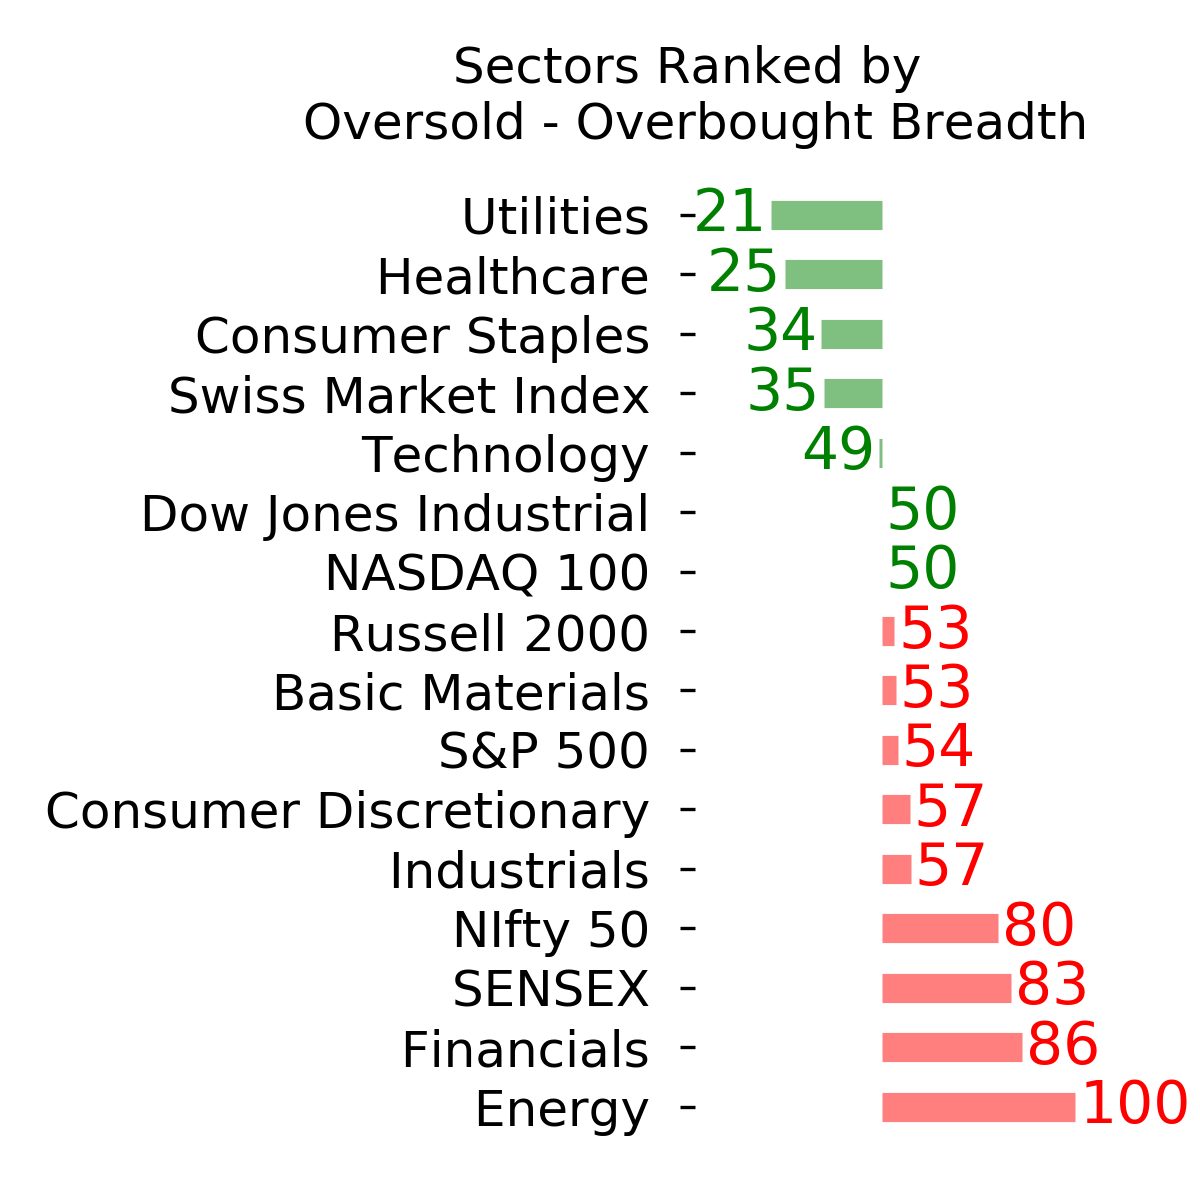
Ranks
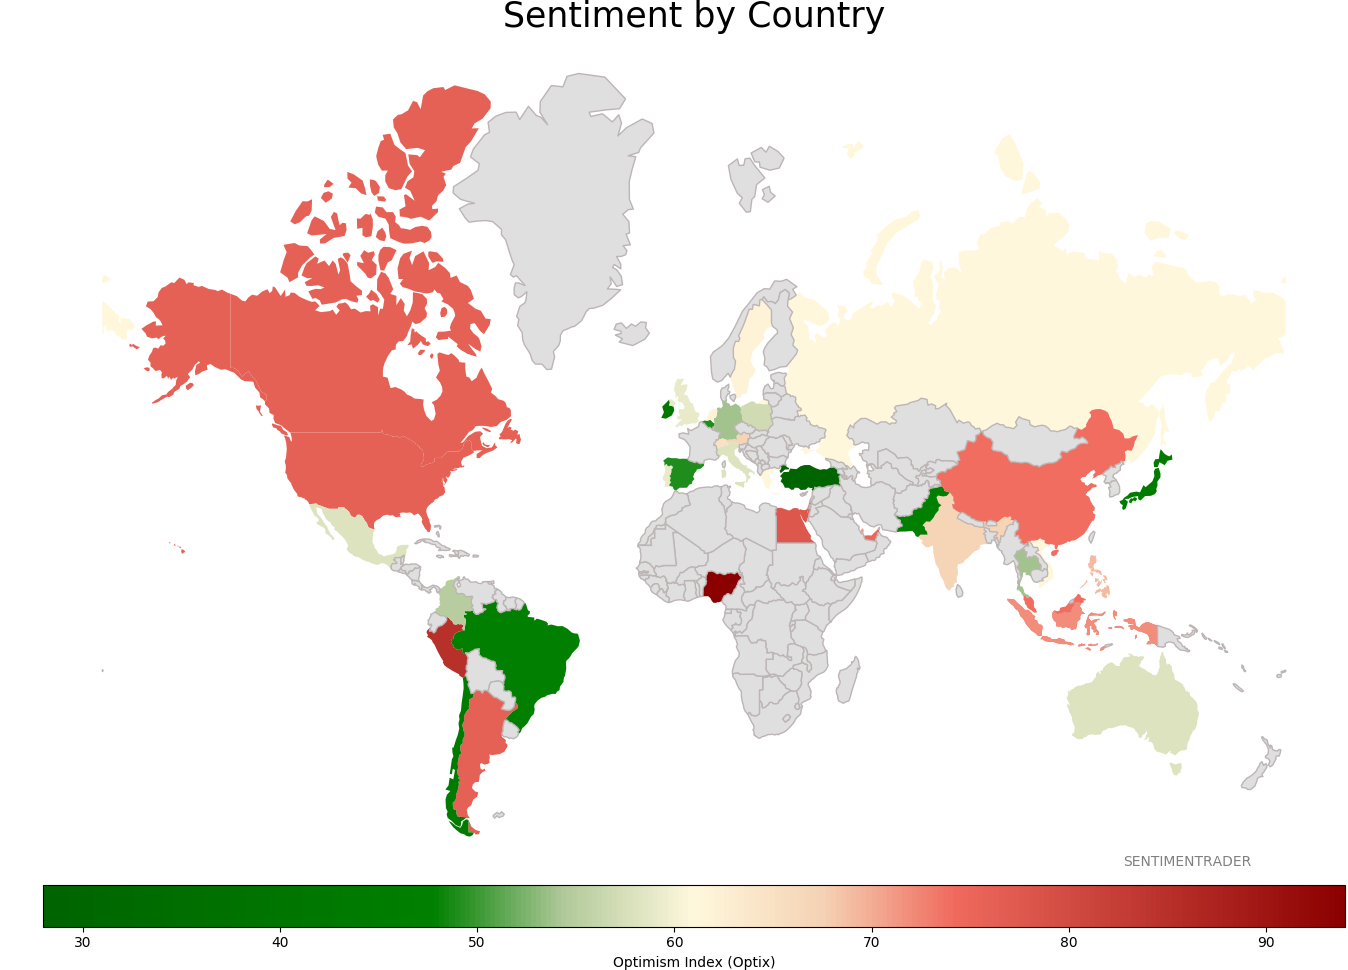
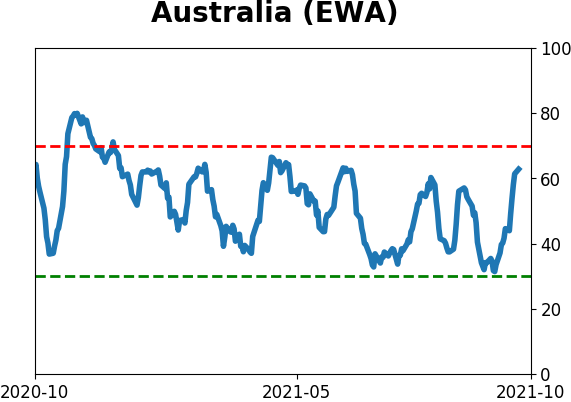
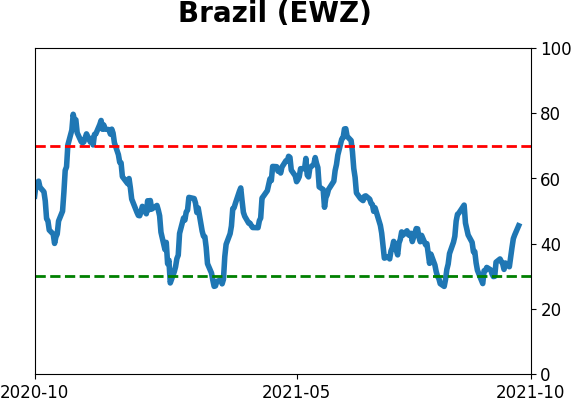
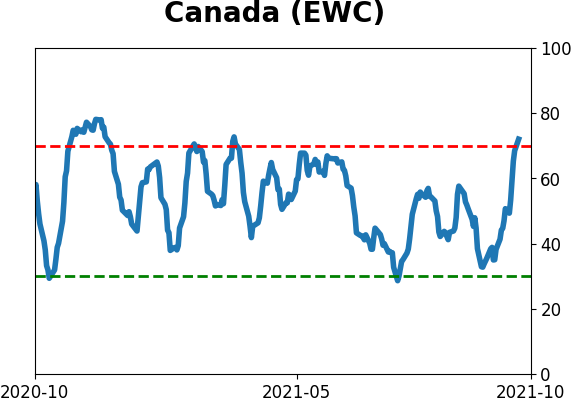
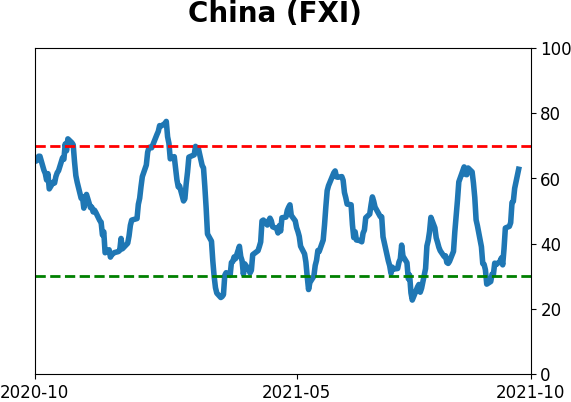
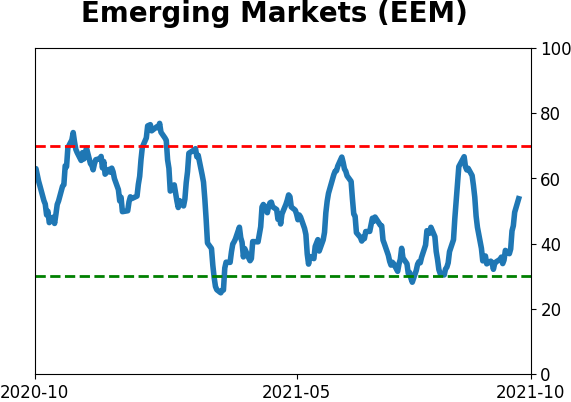
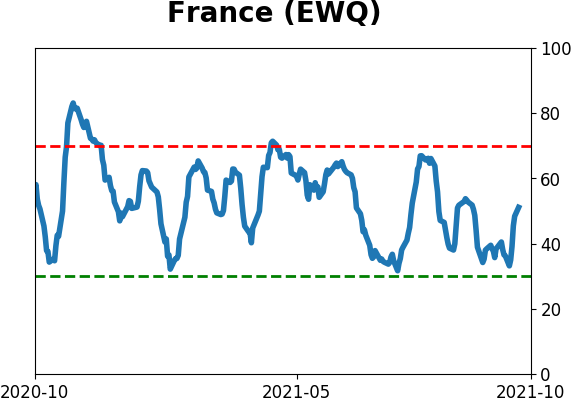
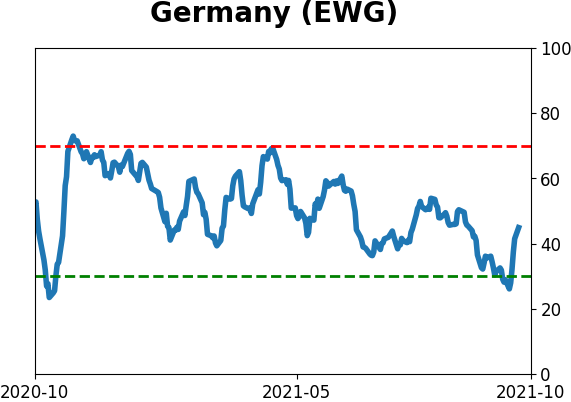
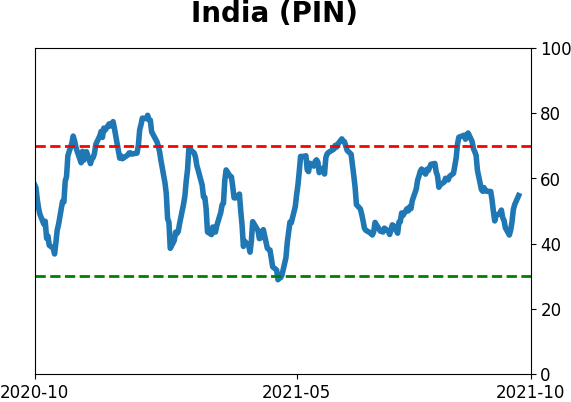
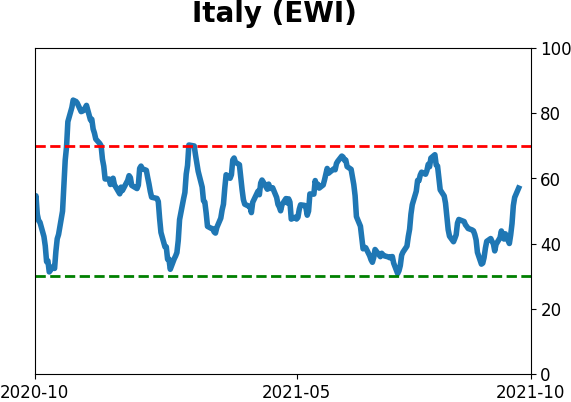
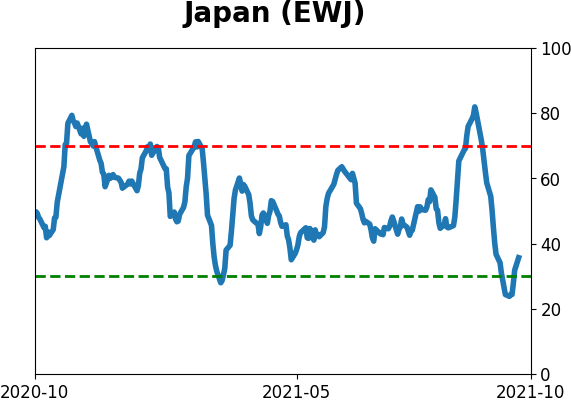
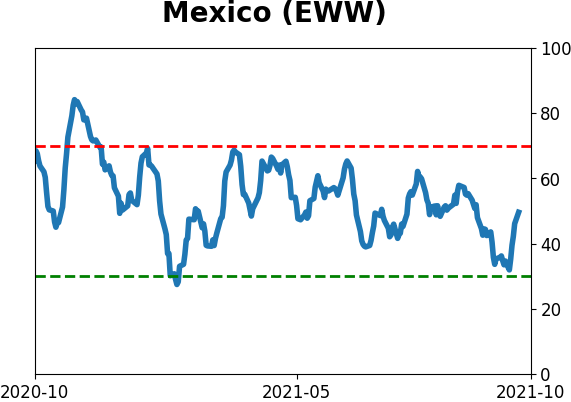
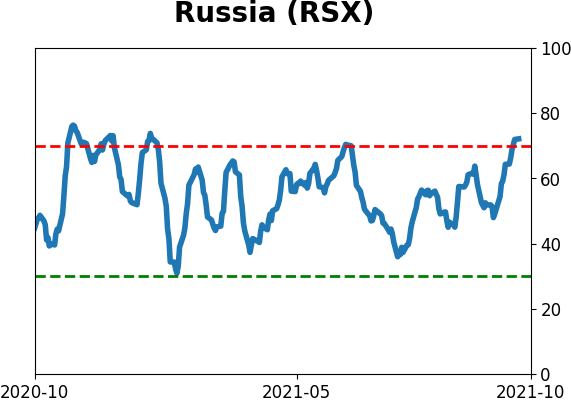
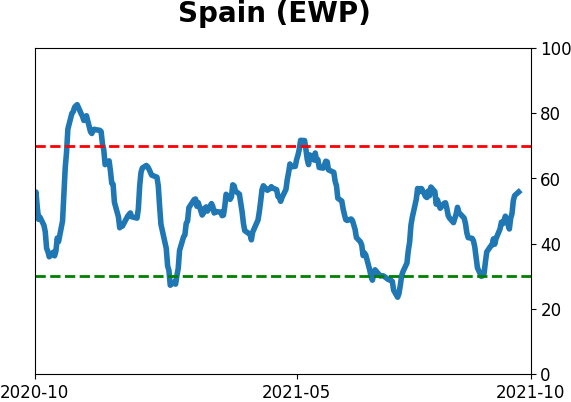
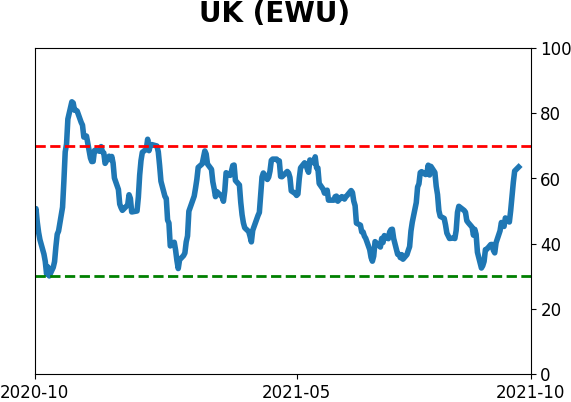
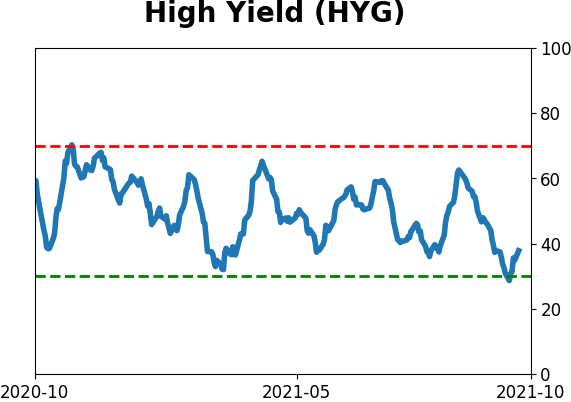
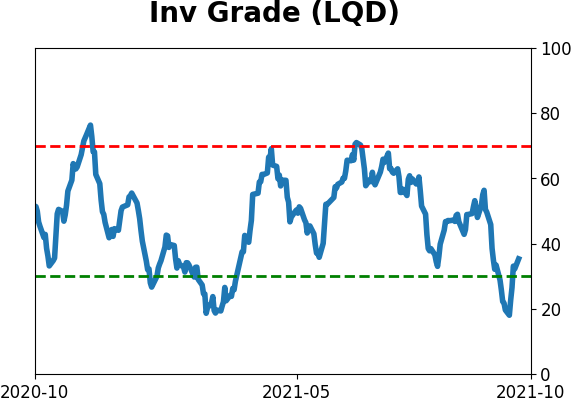
Sentiment Around The World
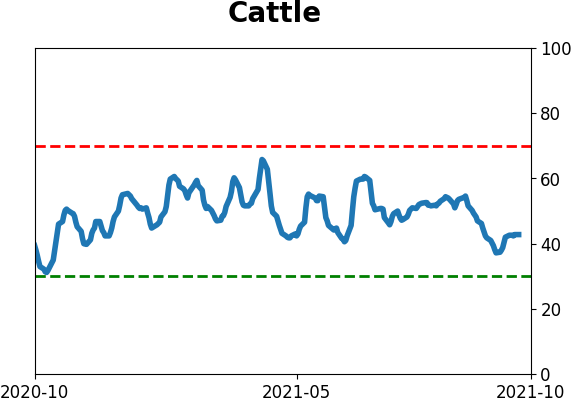
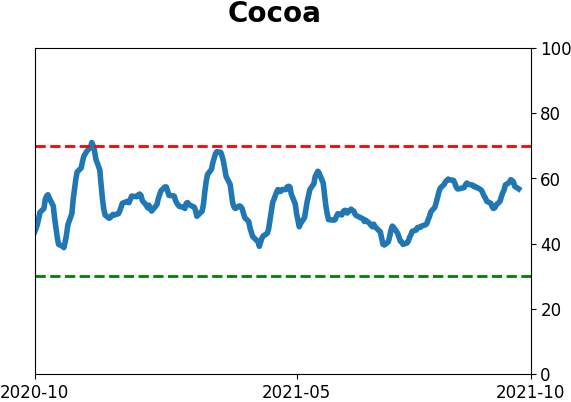
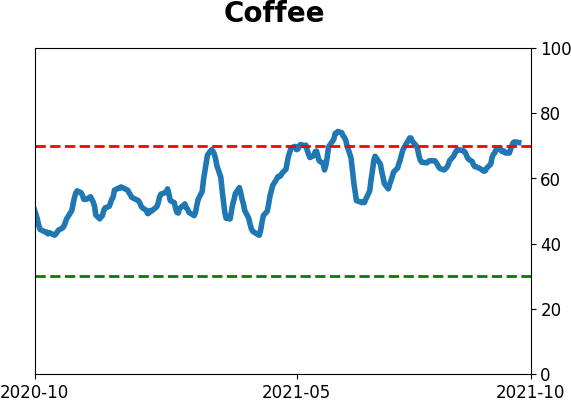
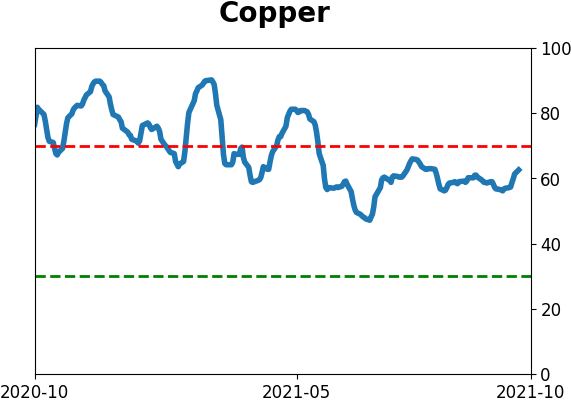
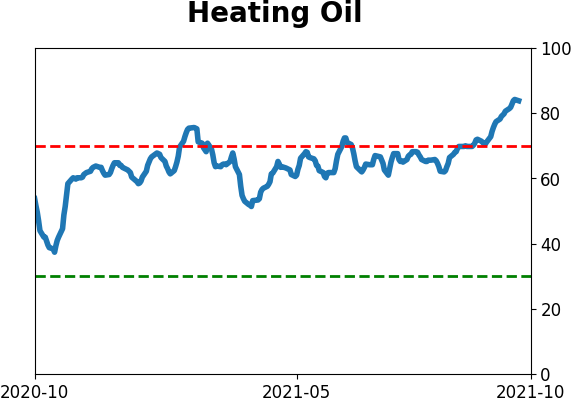
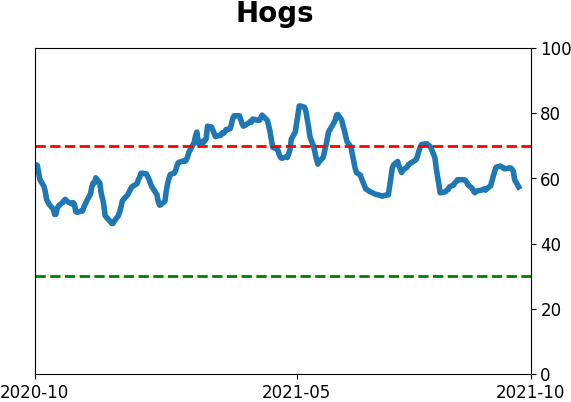
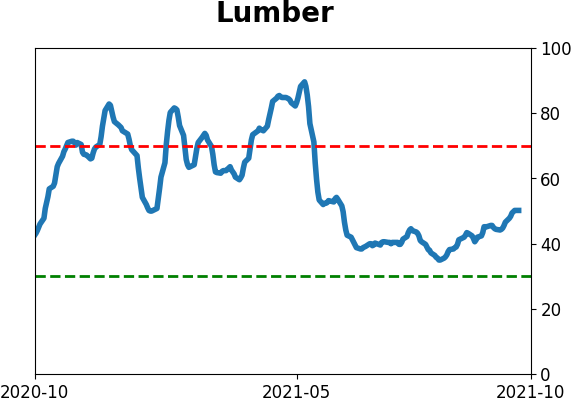
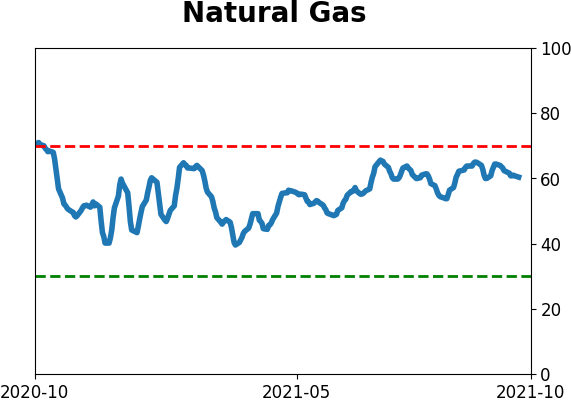
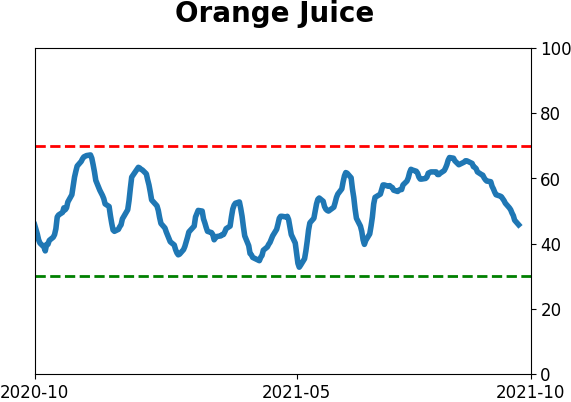
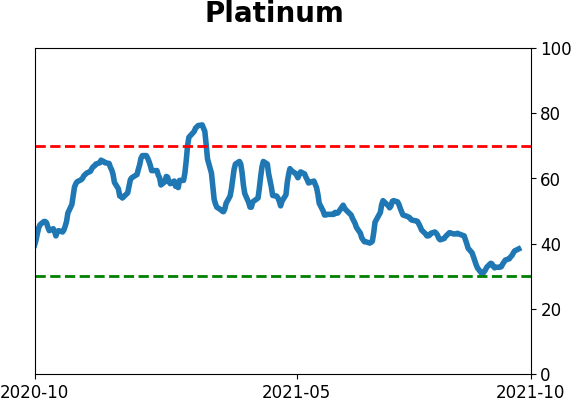
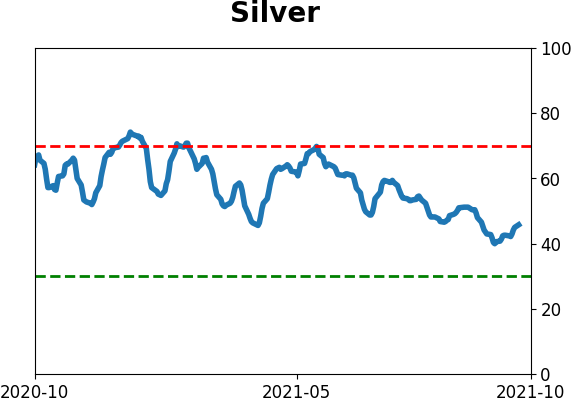
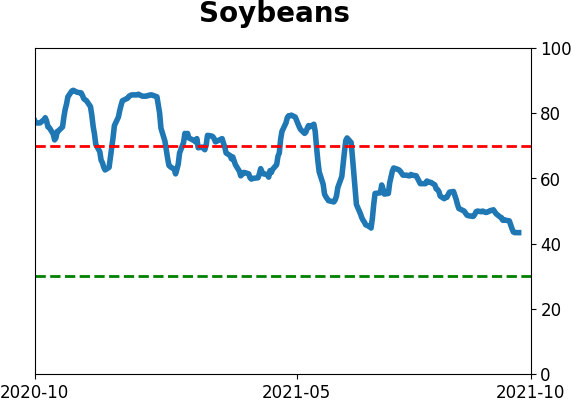
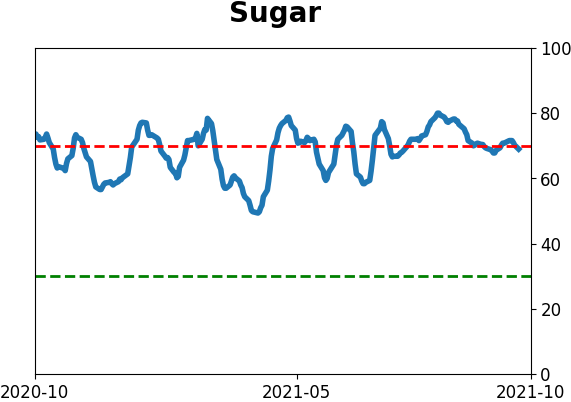
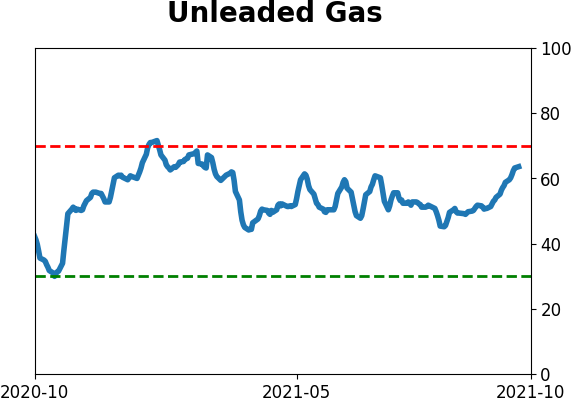
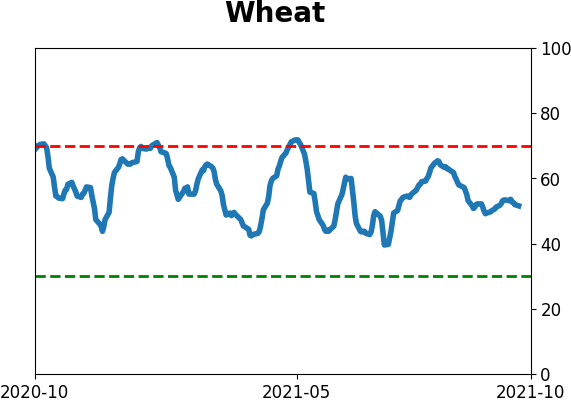
Optimism Index Thumbnails
|
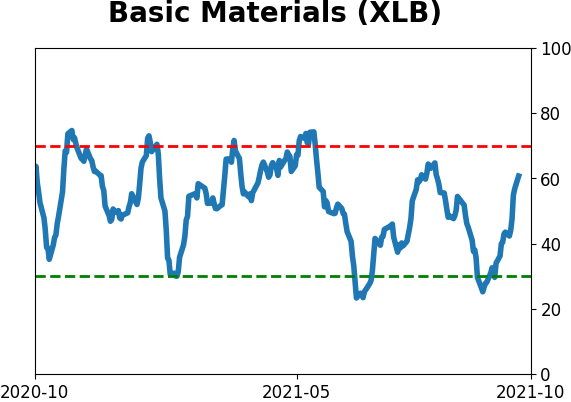
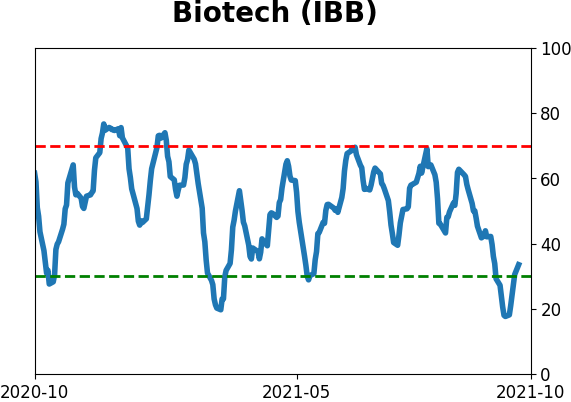
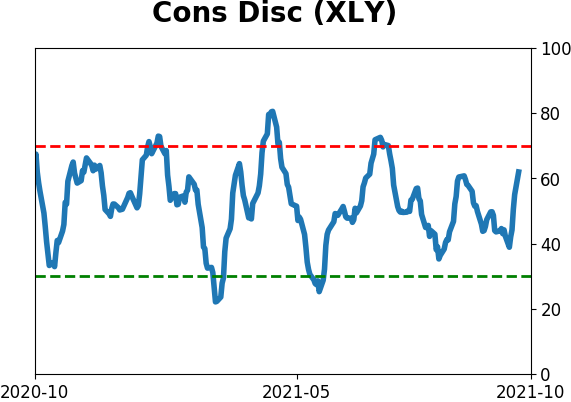
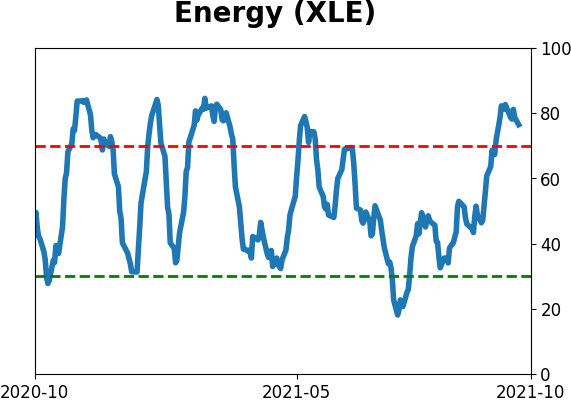
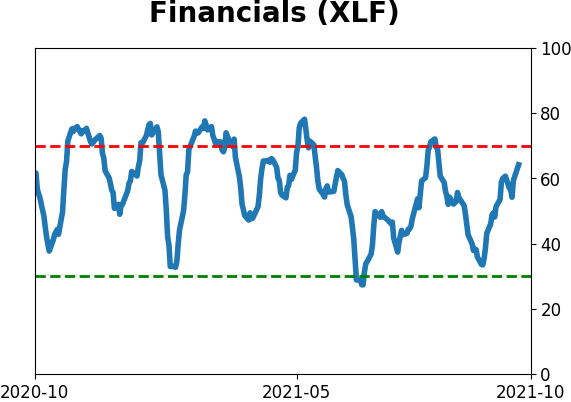
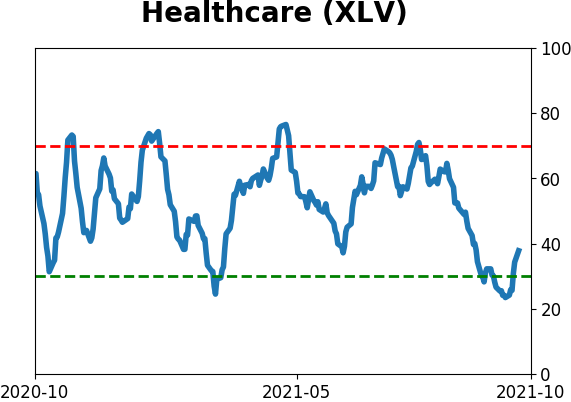
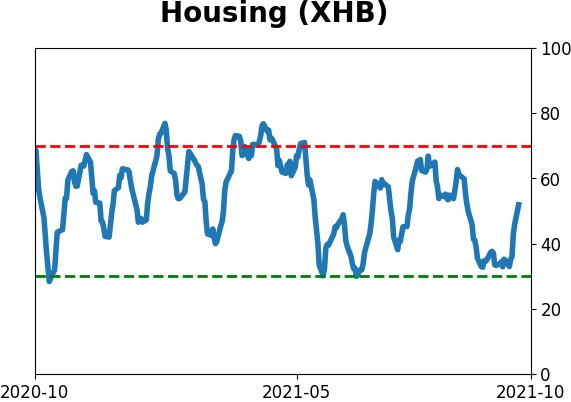
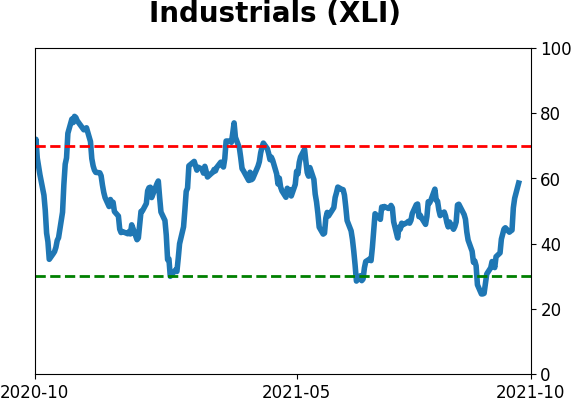
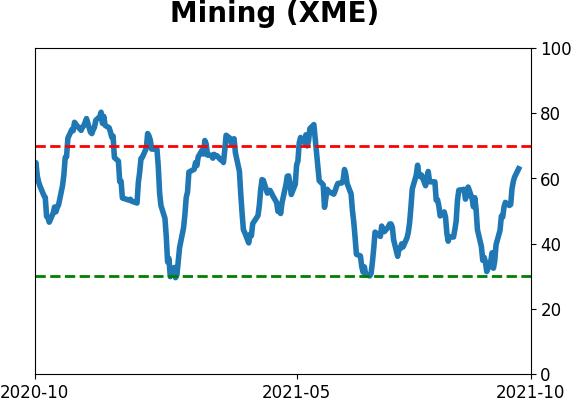
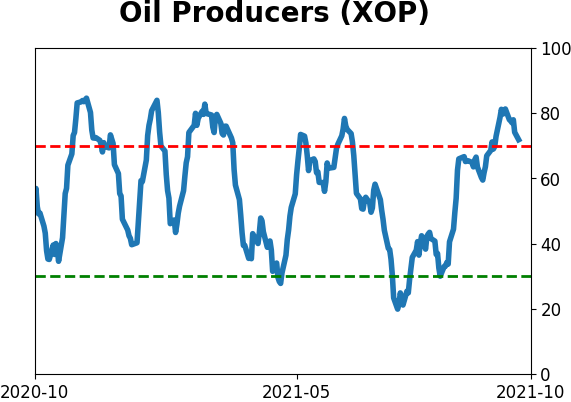
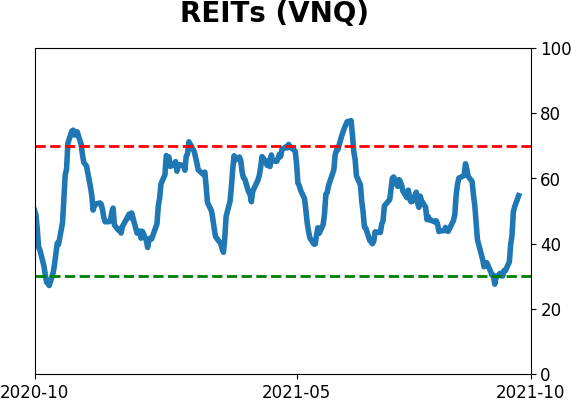
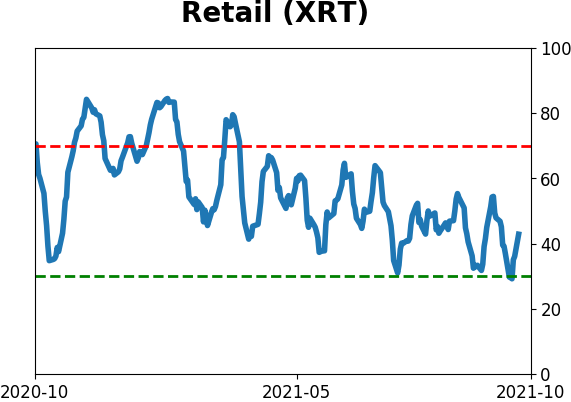
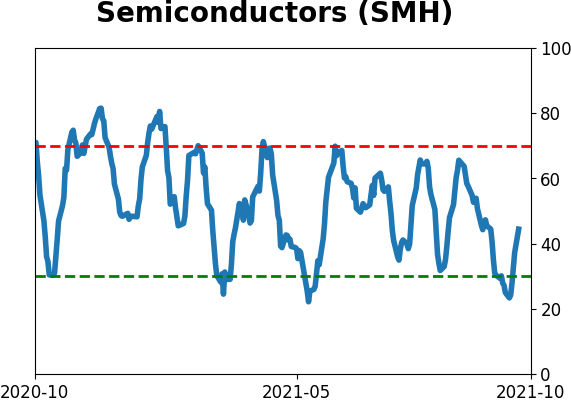
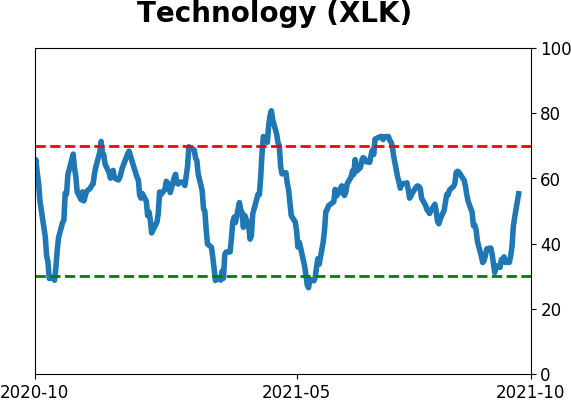
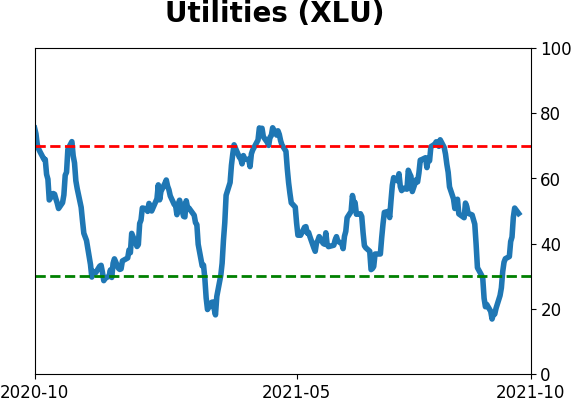
Sector ETF's - 10-Day Moving Average
|
|
|
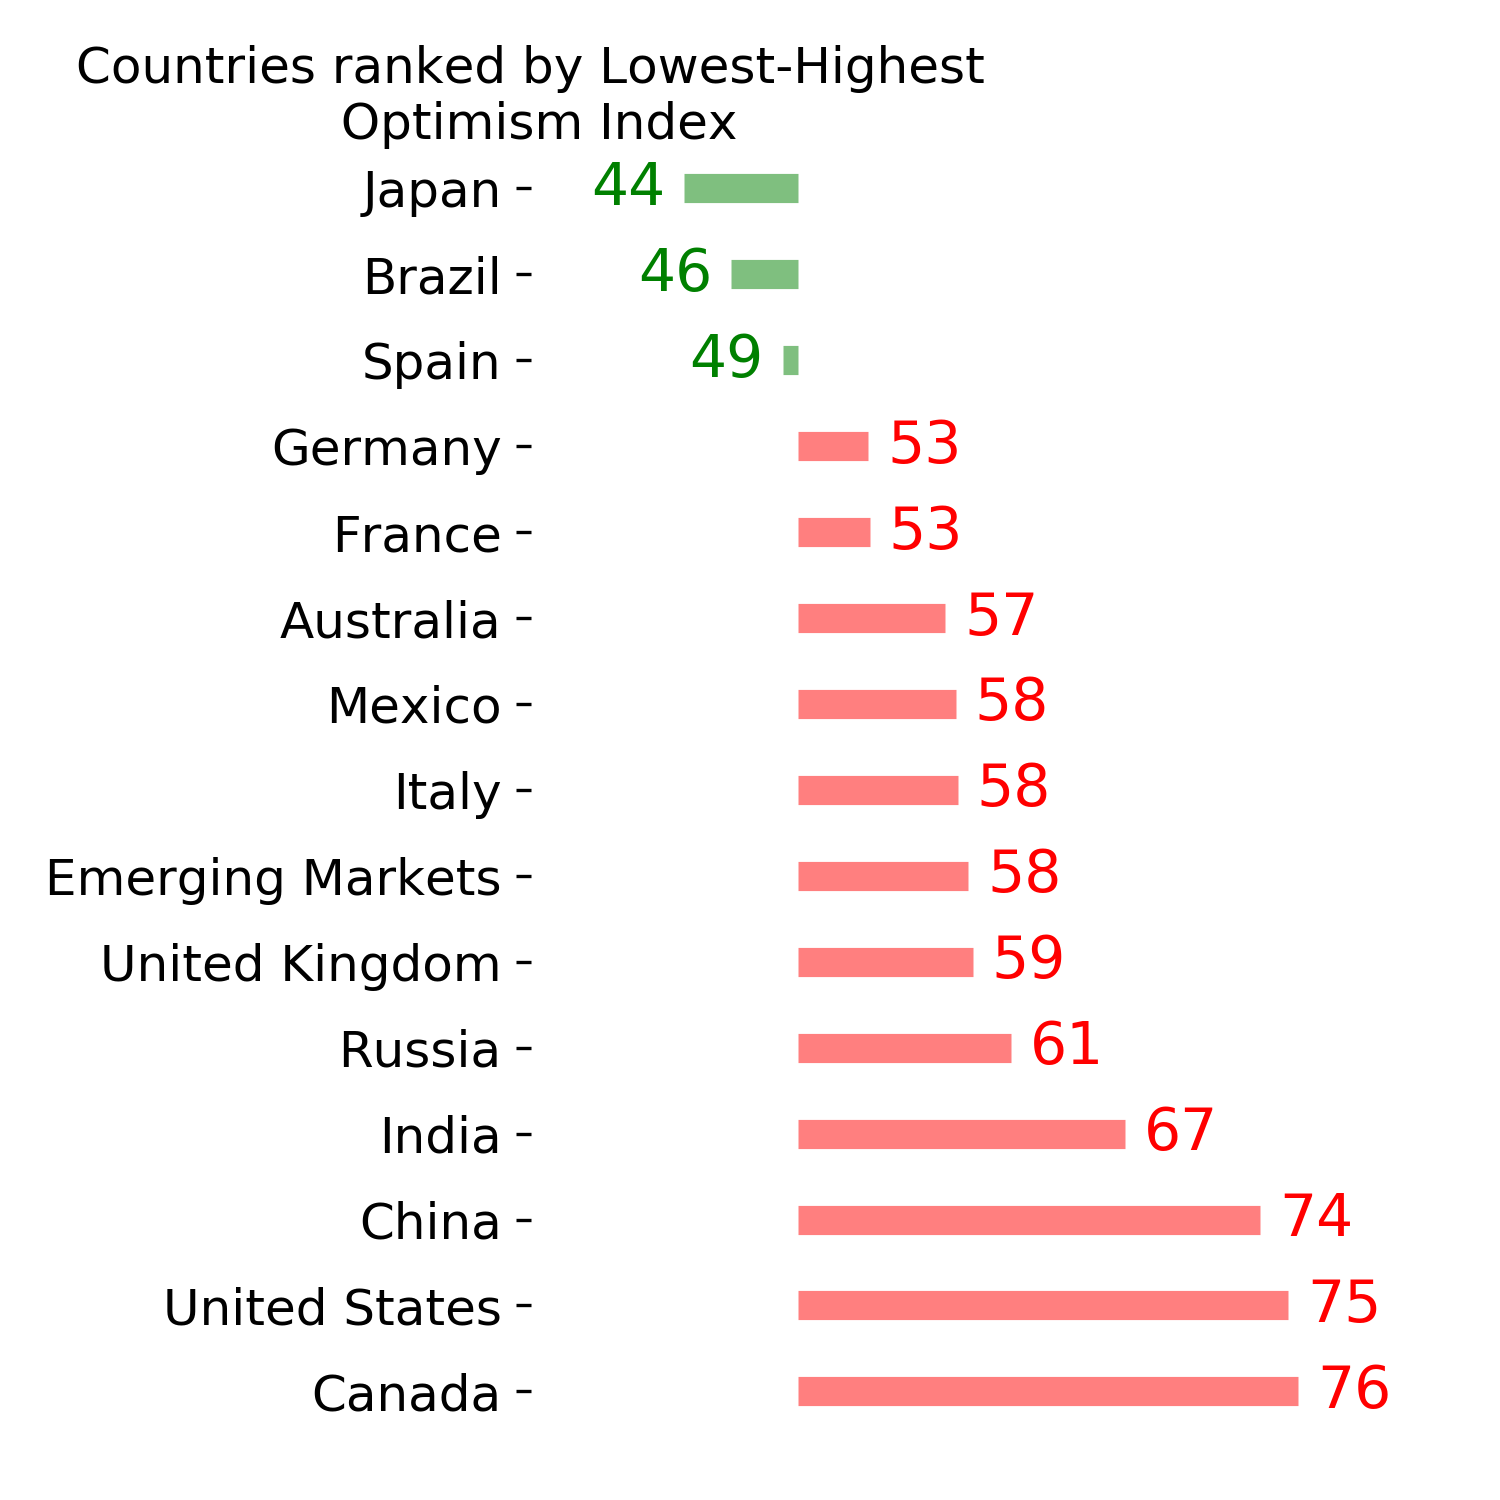
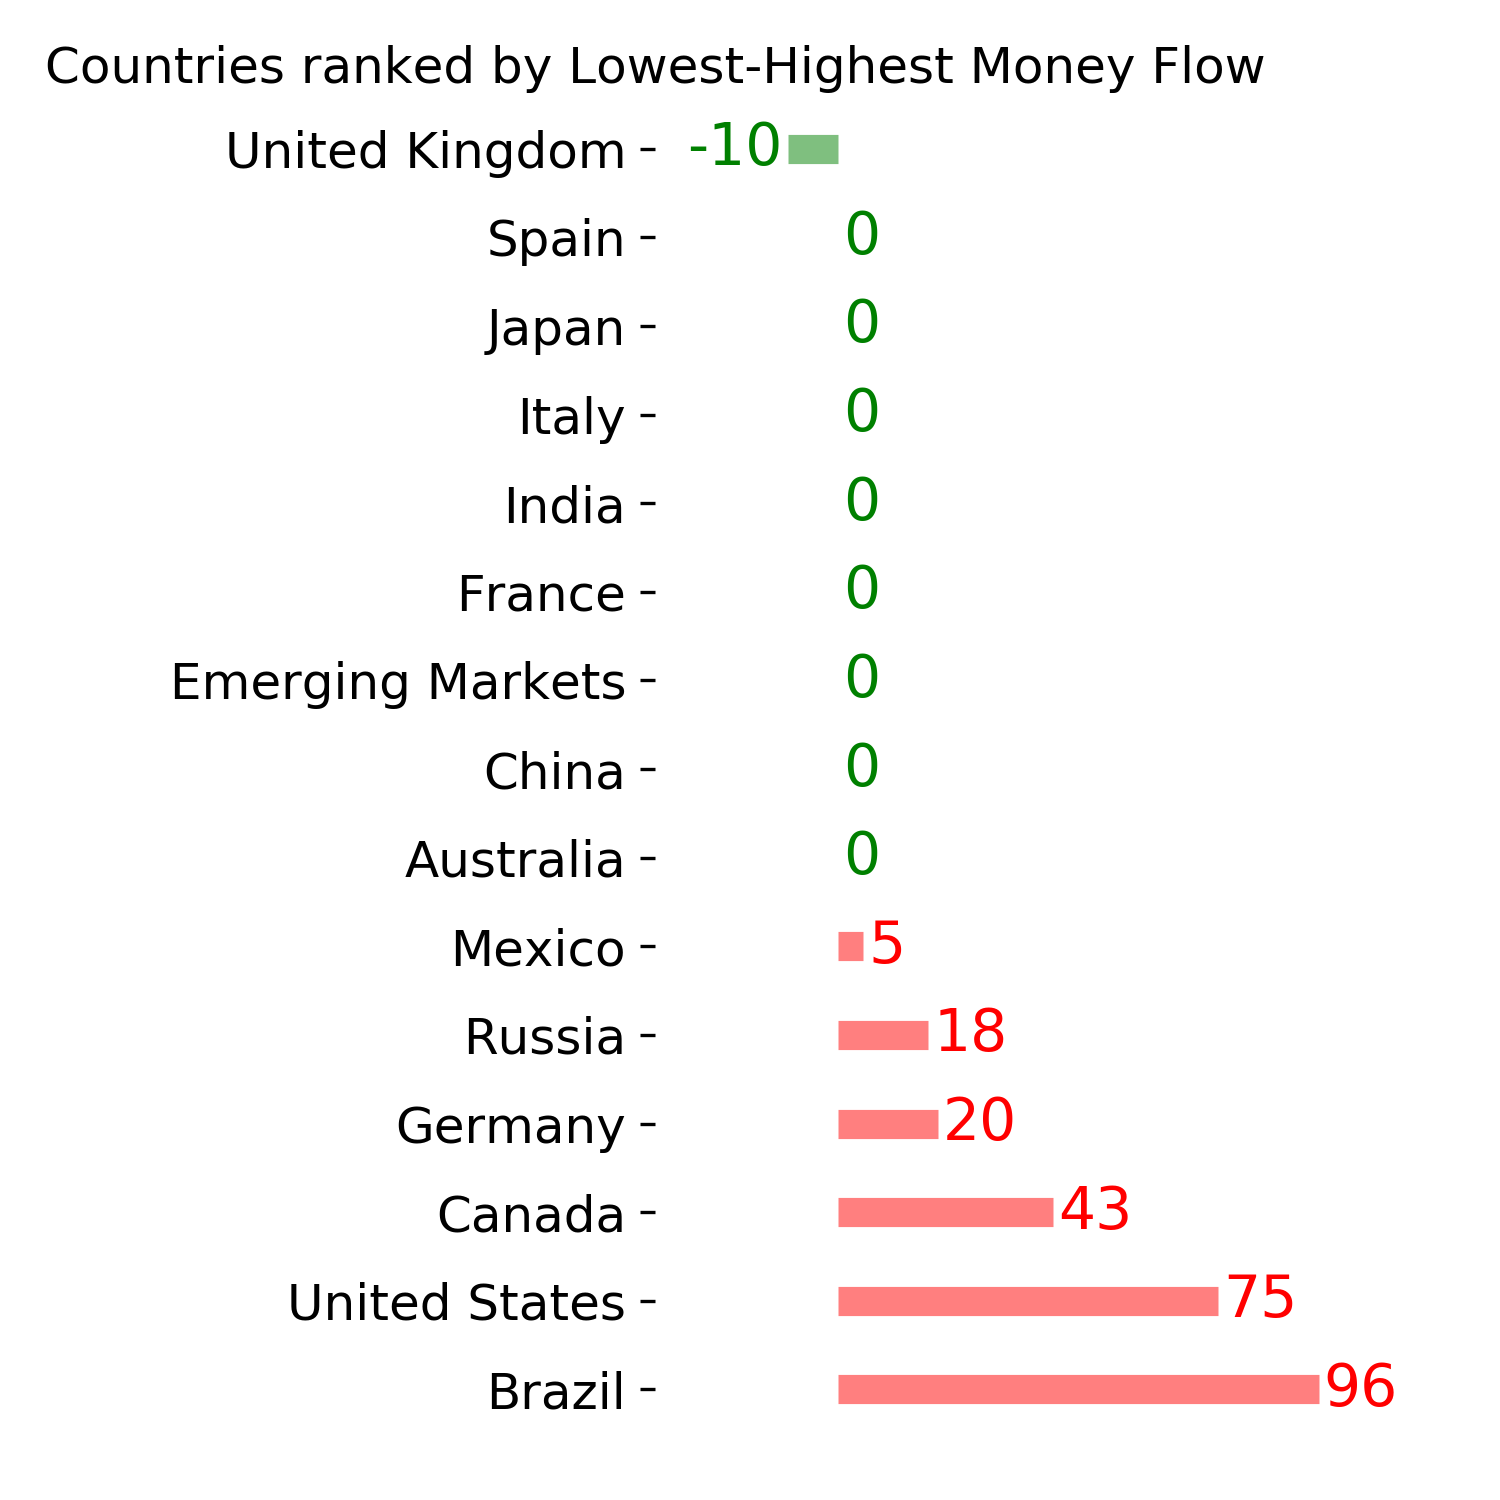
Country ETF's - 10-Day Moving Average
|
|
|
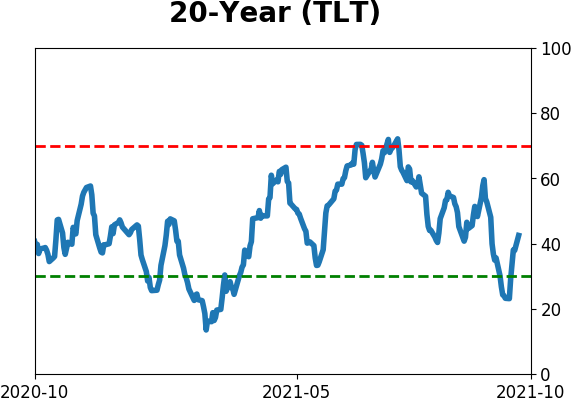
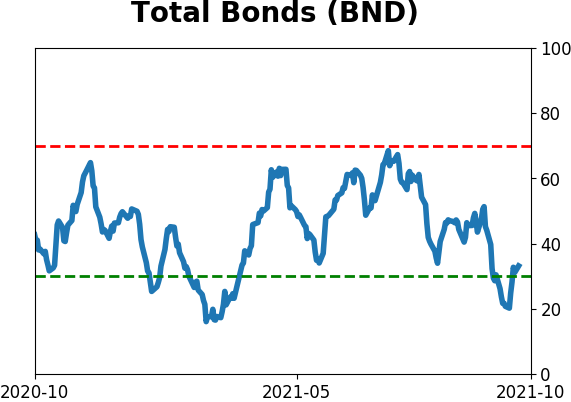
Bond ETF's - 10-Day Moving Average
|
|
|
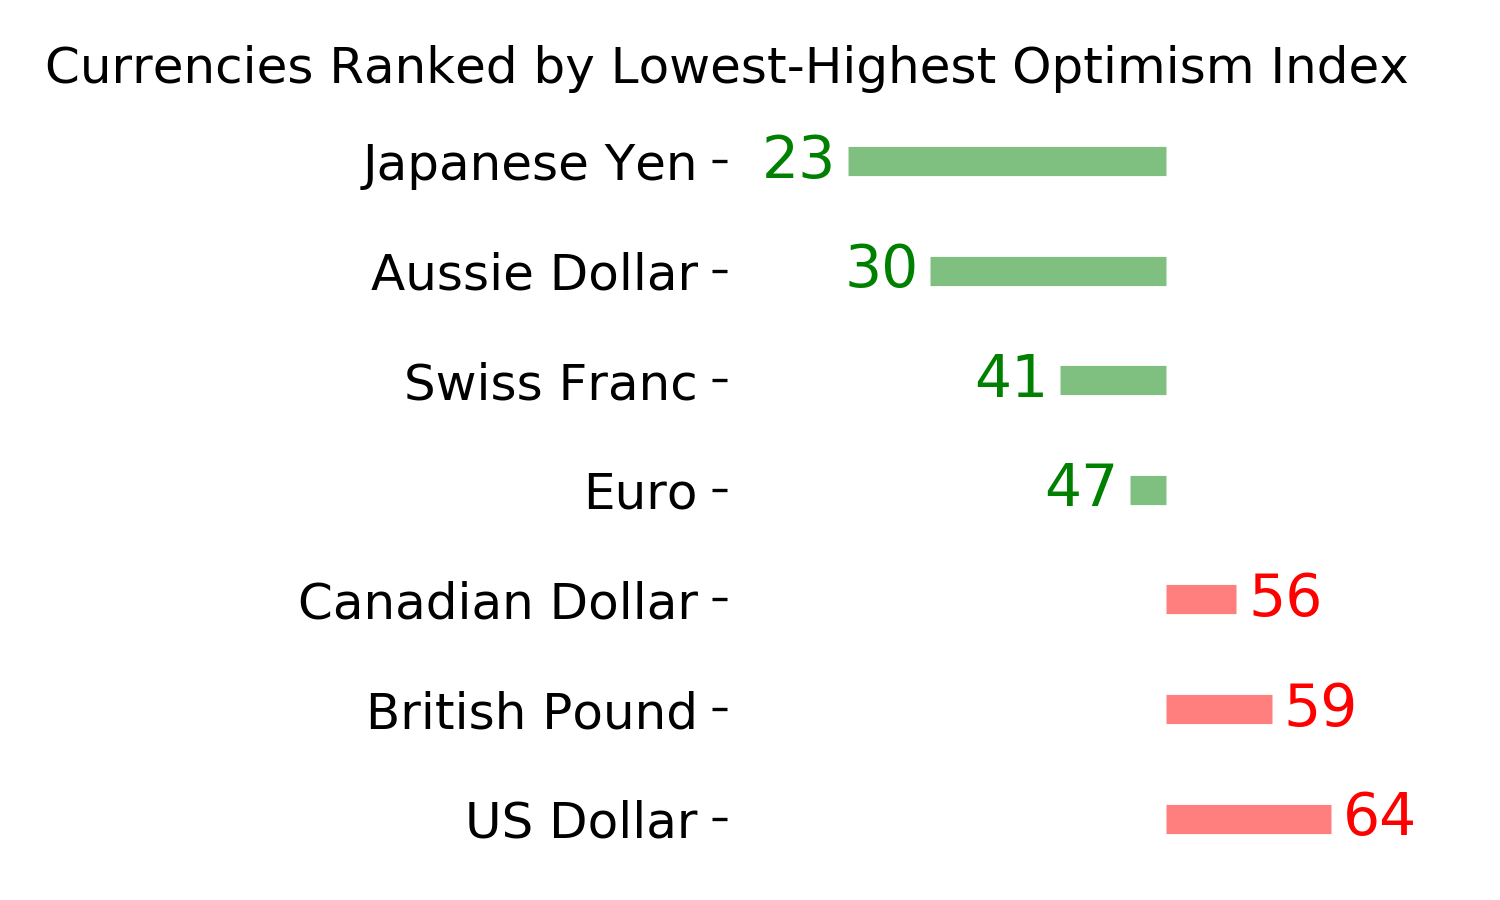
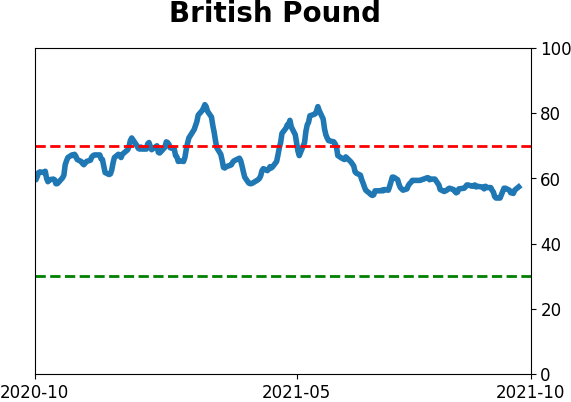
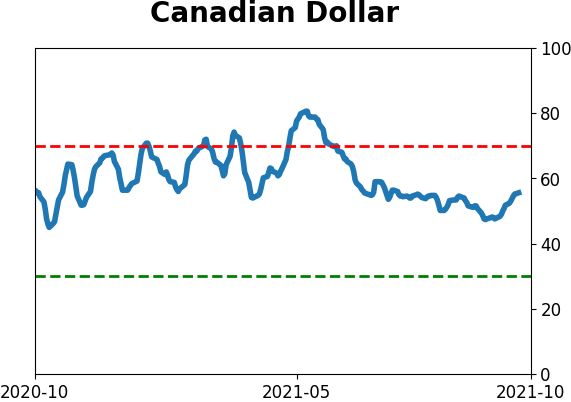
Currency ETF's - 5-Day Moving Average
|
|
|
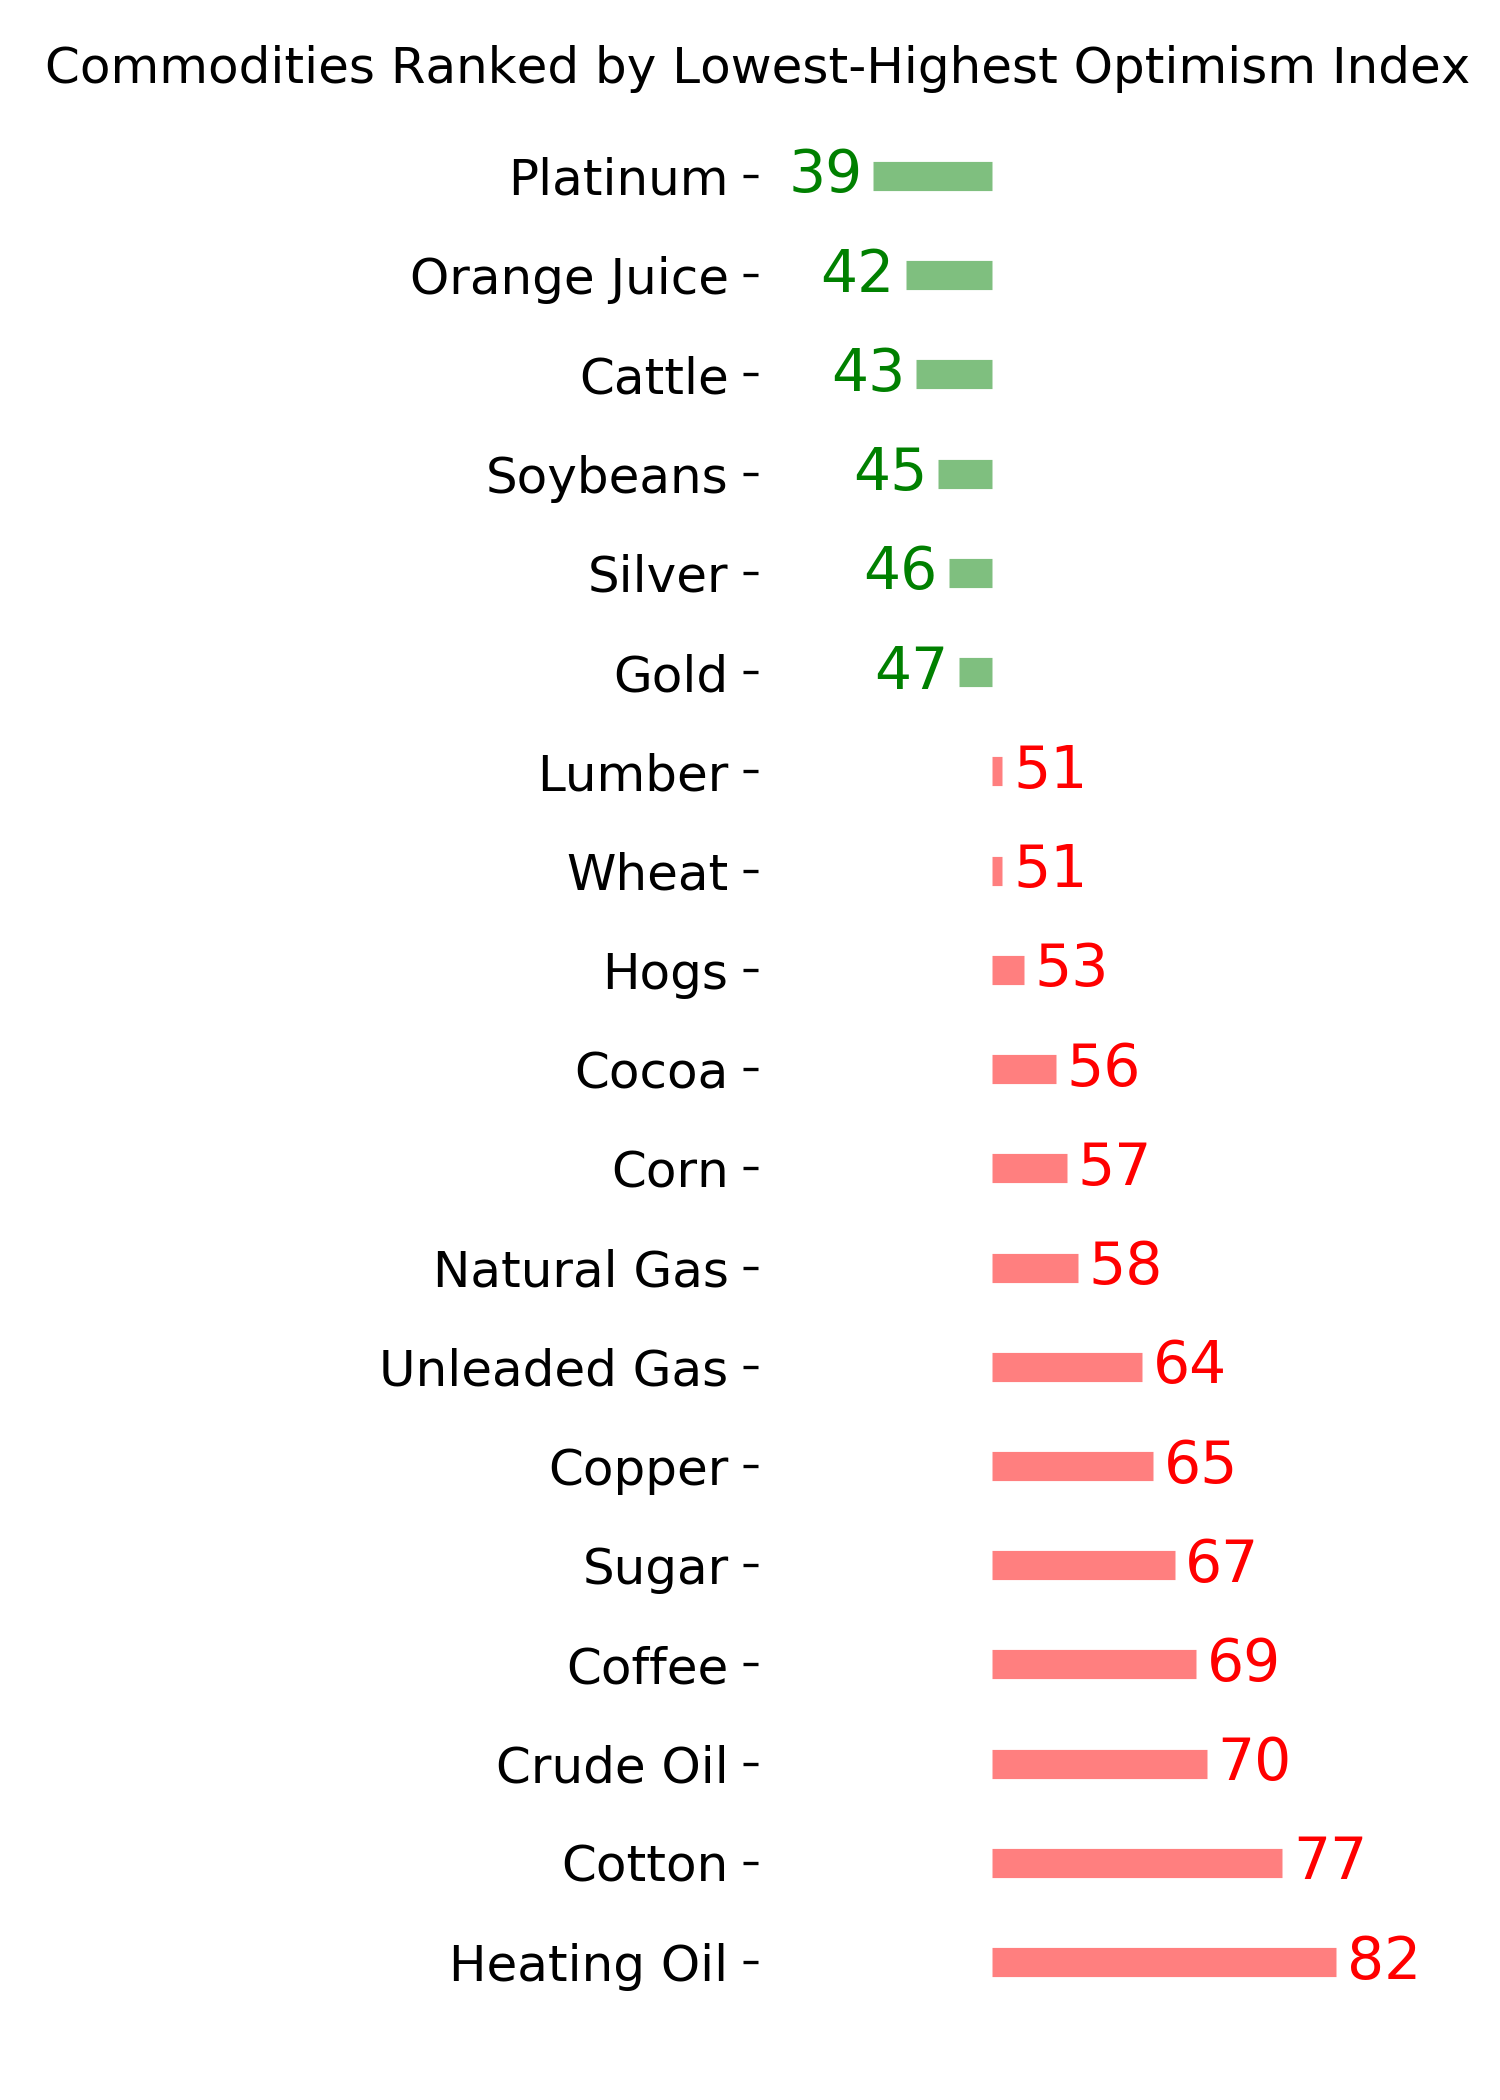
Commodity ETF's - 5-Day Moving Average
|
|