Headlines
|
|
Sentiment plunges to one of the worst levels on record:
Sentiment models have plunged in recent weeks. Three primary ones are now showing the investors are among the most pessimistic they've been in more than 20 years.
|
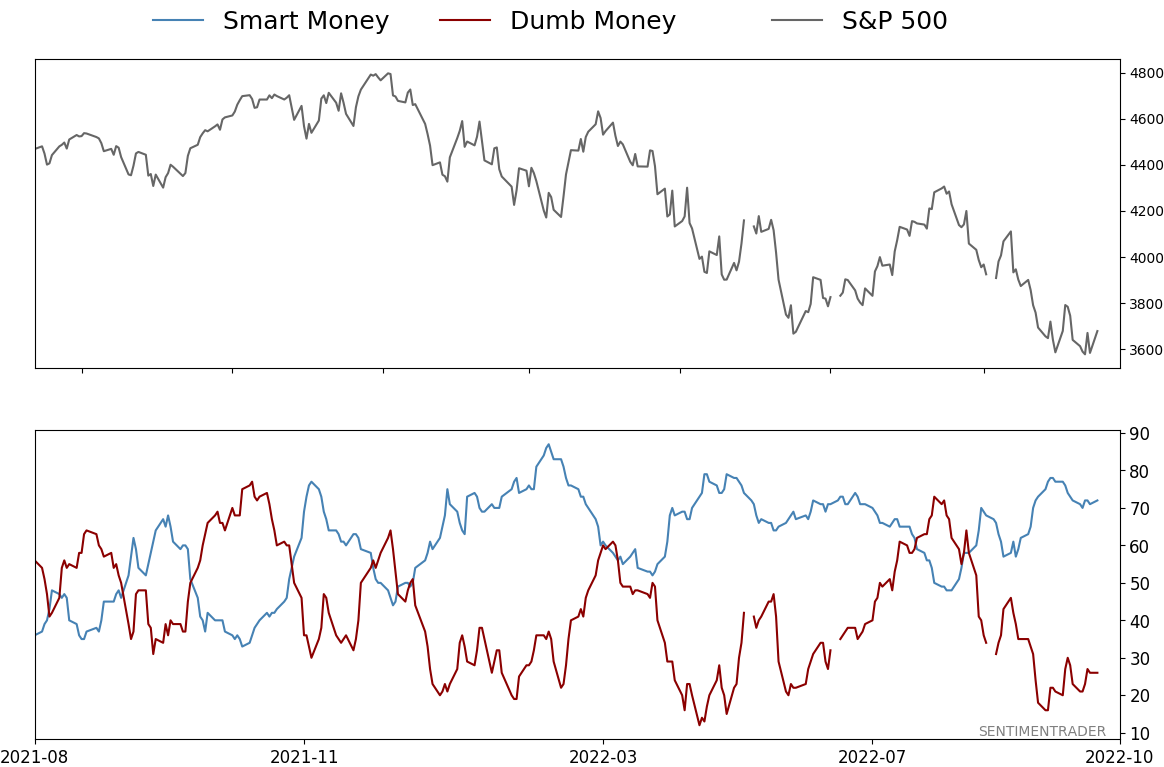
Smart / Dumb Money Confidence
|
Smart Money Confidence: 72%
Dumb Money Confidence: 26%
|
|
Risk Levels
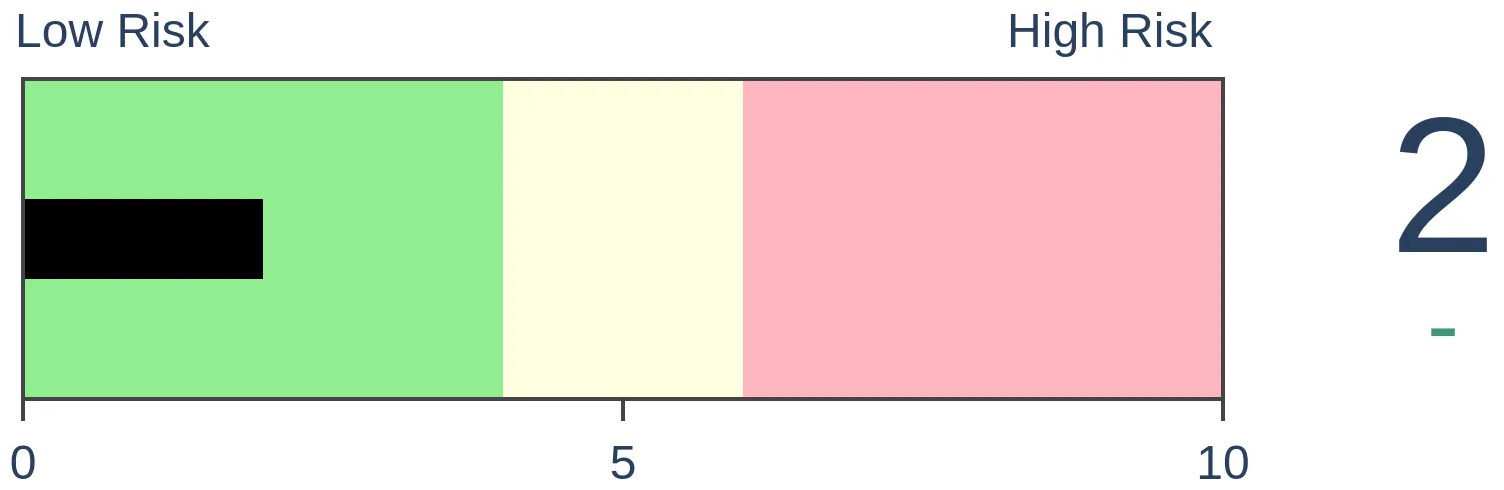
Stocks Short-Term
|
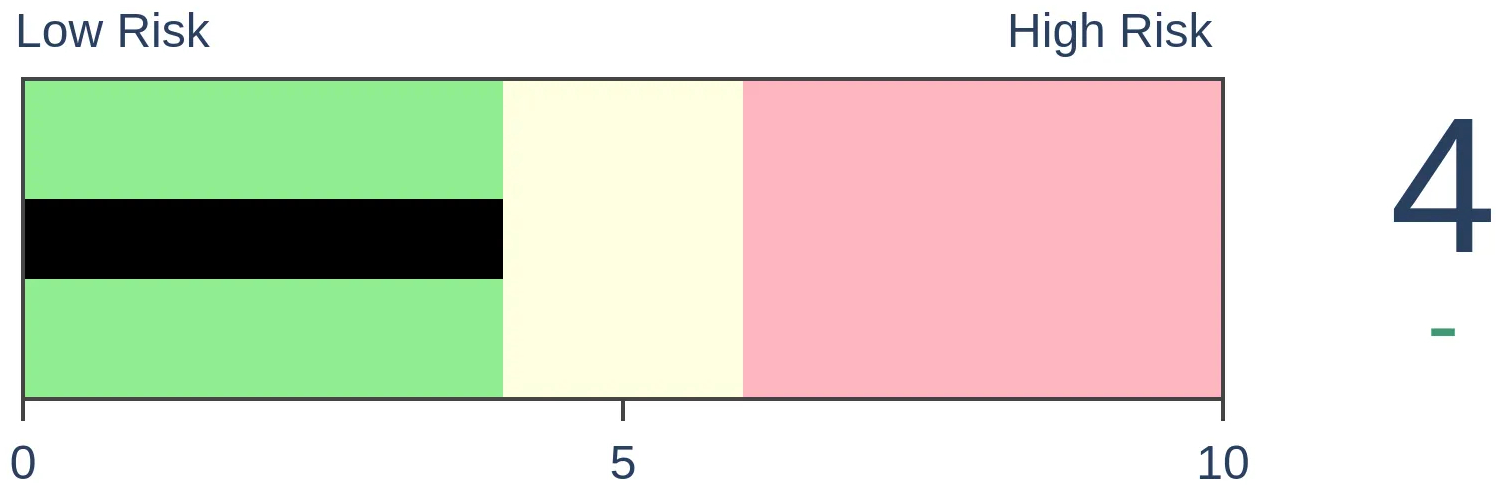
Stocks Medium-Term

|
|
Bonds
|
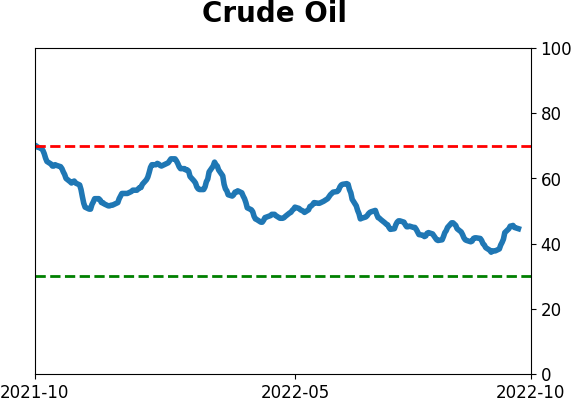
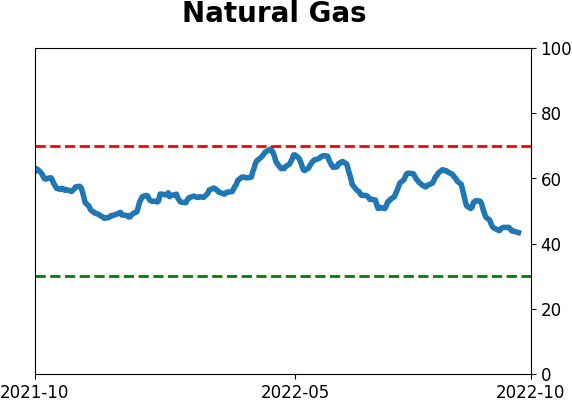
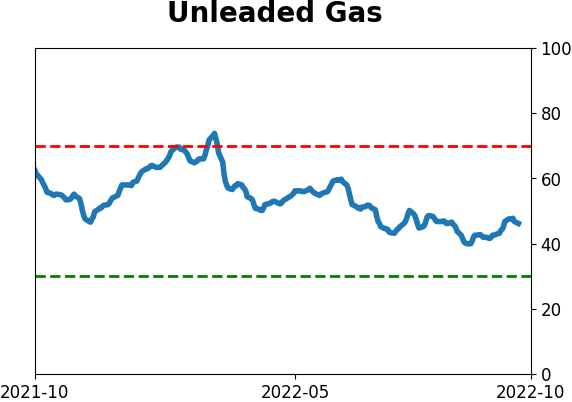
Crude Oil

|
|
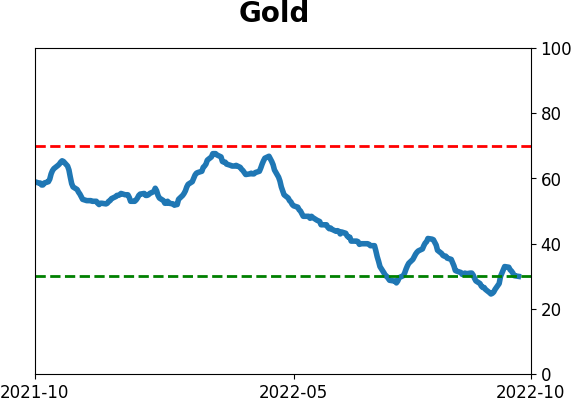
Gold
|
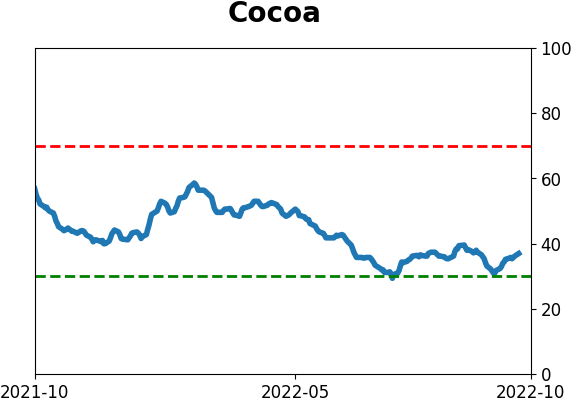
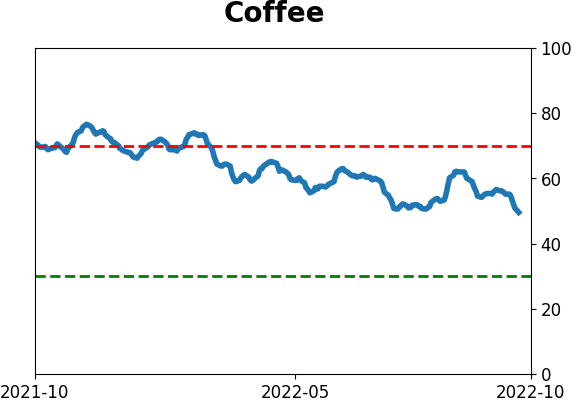
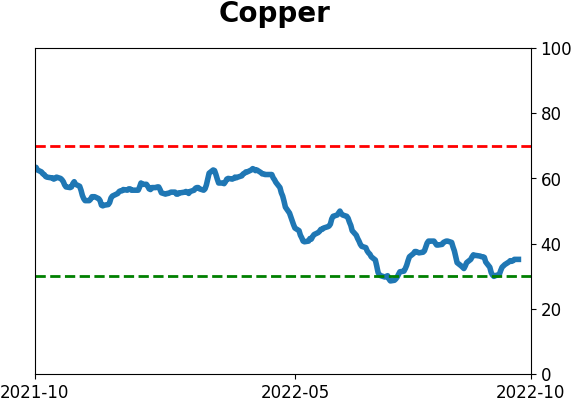
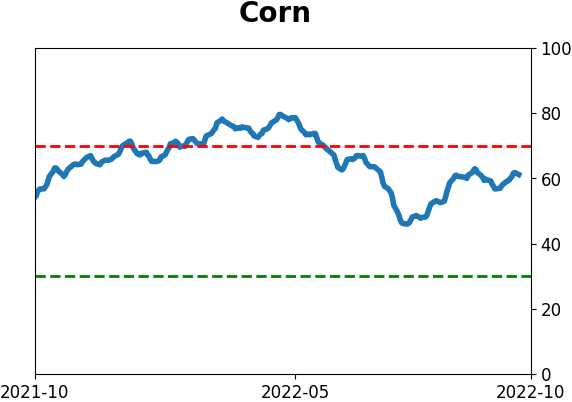
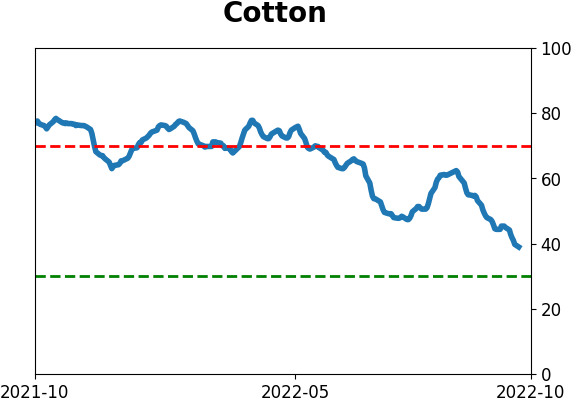
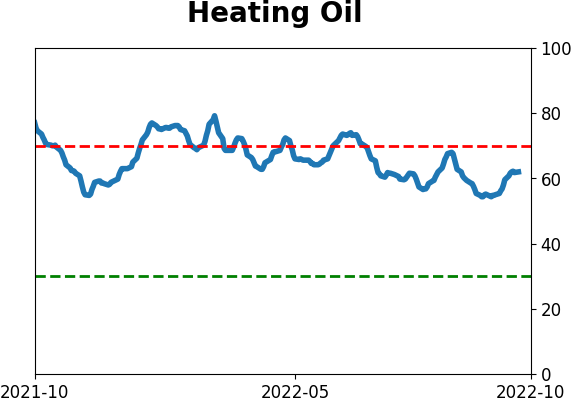
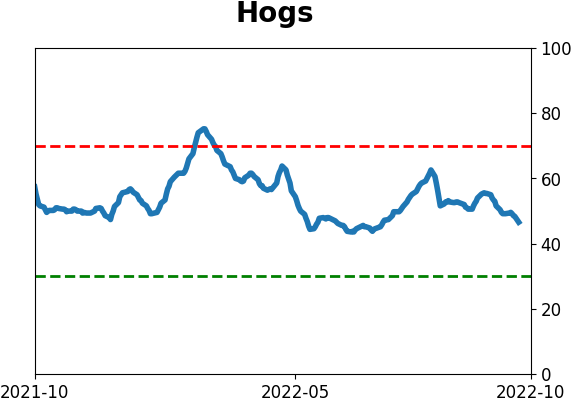
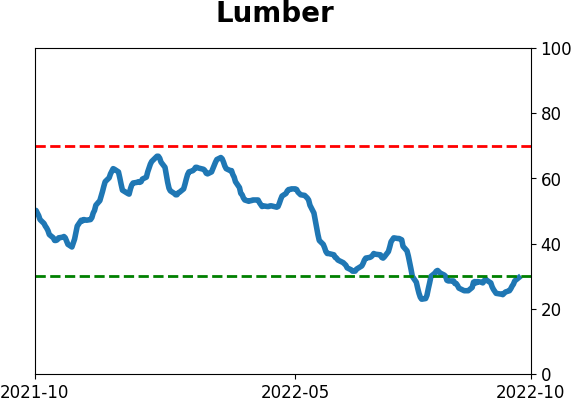
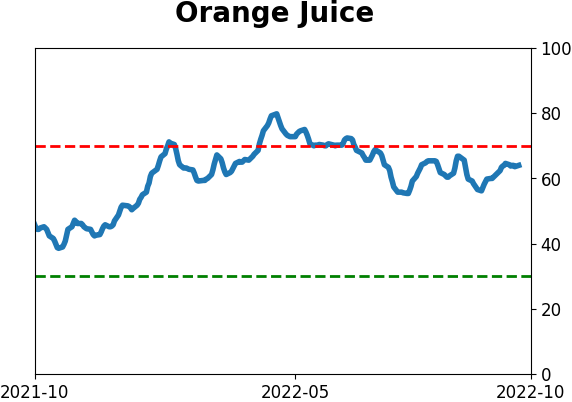
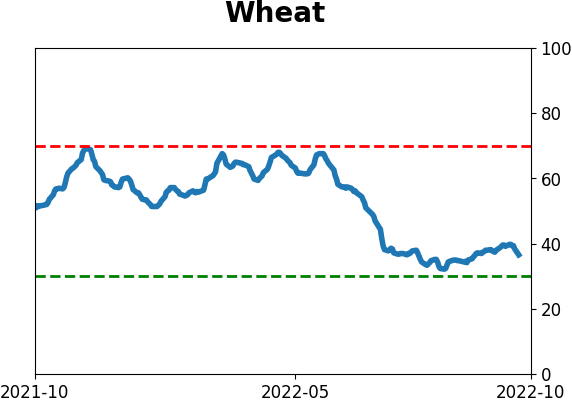
Agriculture
|
|
Research
By Jason Goepfert
BOTTOM LINE
Sentiment models have plunged in recent weeks. Three primary ones are now showing the investors are among the most pessimistic they've been in more than 20 years.
FORECAST / TIMEFRAME
None
|
Key points:
- Three primary sentiment models have plunged since September
- A composite of them has dropped into the bottom 2% of all days in 23 years
- Forward returns after such low readings have been high, with relatively low drawdowns
Sentiment has made a round trip
Last November, investors were riding high. On November 10, we looked at four sentiment models, all confirming extreme optimism.
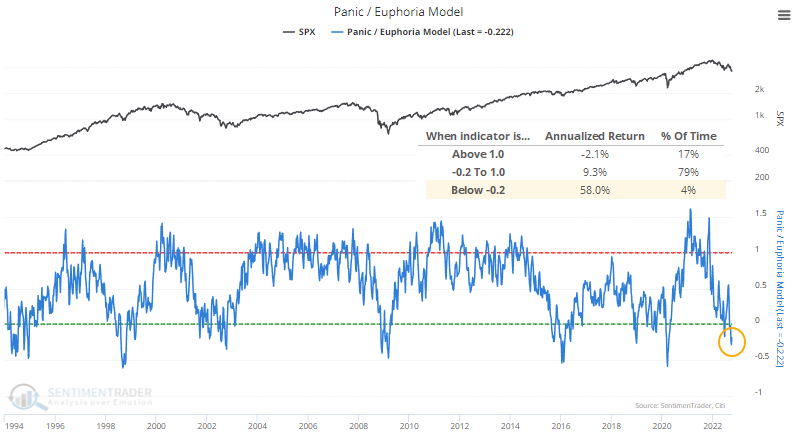
After the latest gut-wrenching week, we mostly see the opposite condition. We recently looked at the drop in Dumb Money Confidence, and more models are joining it. This week, the Panic/Euphoria Model declined to one of the lowest levels in nearly 30 years, firmly in Panic territory.
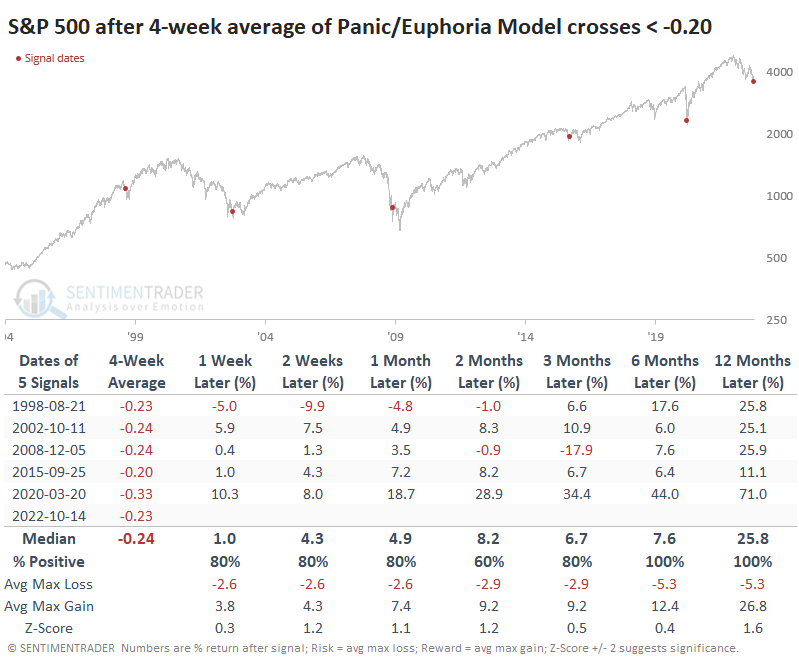
The four-week average dropped below 0.20 for the first time since the pandemic panic, joining only five other signals since 1994.
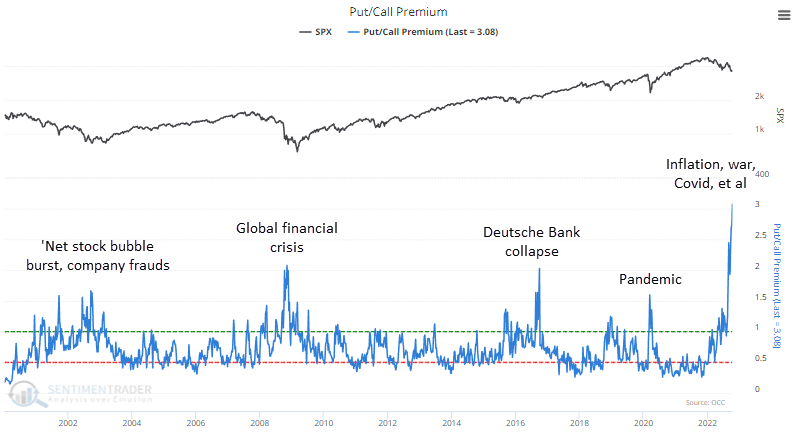
One of the primary drivers of extremes in these models is behavior among options traders. Last week, for the first time in recorded history, retail traders spent three times as much on buying puts to open as calls to open. Even during the worst crises of the past 22 years, the fear was never so great that traders spent twice as much on puts.
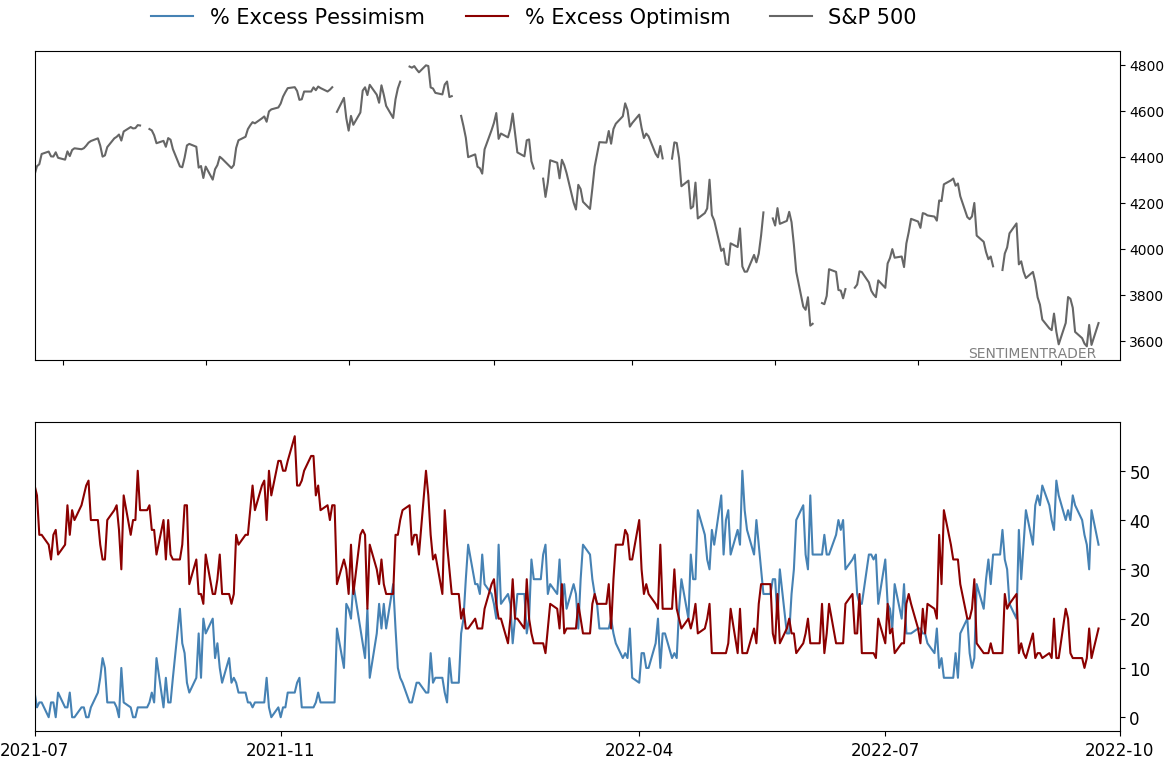
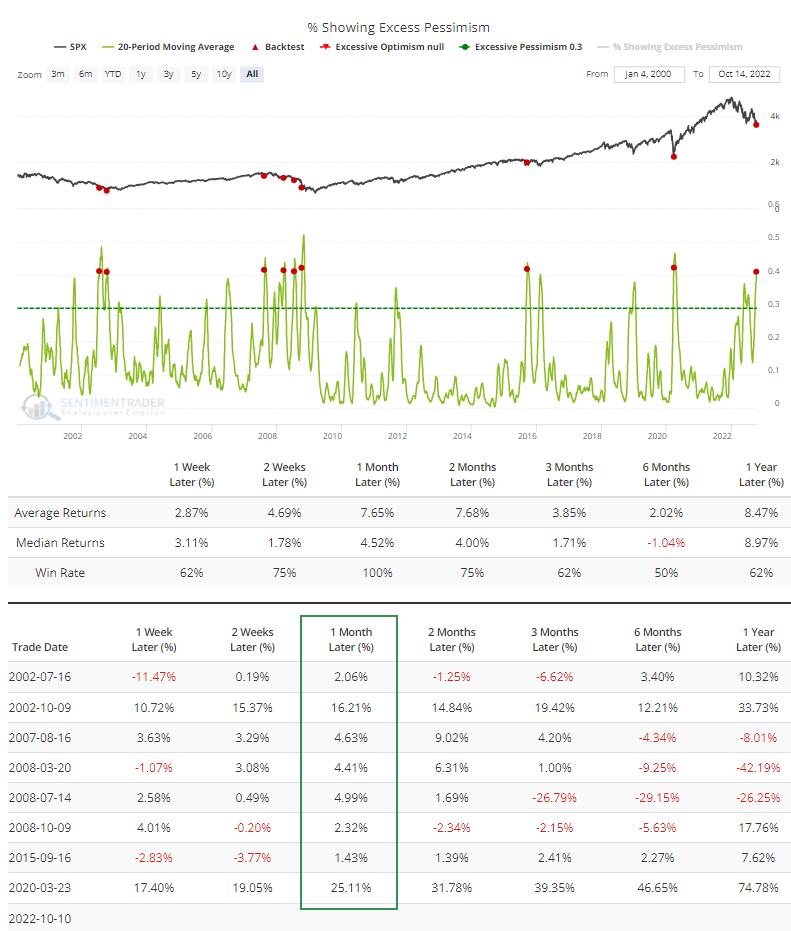
Extremes aren't just prevalent in the options market, however. For the past month, more than 40% of our indicators have been in excessive pessimism territory. The Backtest Engine shows that the S&P 500 rose in the month following similar behavior all eight times.
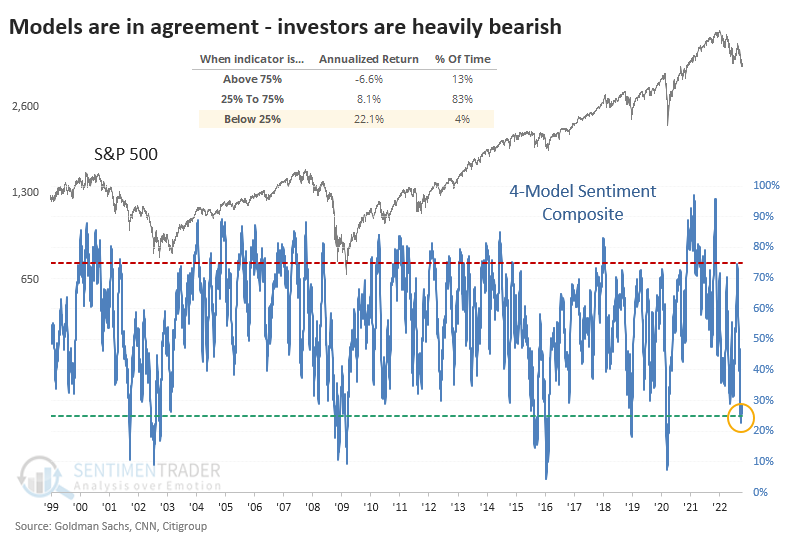
If we circle back to the models mentioned above, the four we looked at in November are updated below.
1. Dumb Money Confidence: 26% (pessimism)
2. Panic/Euphoria: 21% (panic)
3. Fear/Greed: 26% (fear)
4. Bear Market Probability: 81% (optimism)
At the end of last week, the composite of the four models slipped below 25%, in the bottom 4% of all days since 1999. When it was below 25%, the S&P 500 annualized return was+22.1%, versus -6.6% when the composite was at the opposite extreme.
Bear Market Probability is the least-appropriate model to include in the composite because it incorporates mostly fundamental and economic data, like the unemployment rate and yield curve, that are only tangentially related to investor sentiment. If we remove that model from the composite, Friday's reading was in the bottom 2% of all days since 1999.
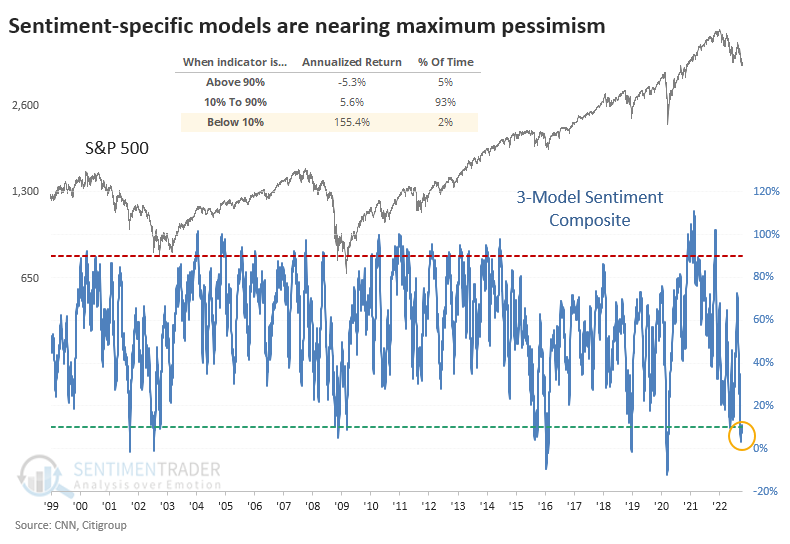
The 20-day average of the three-model composite has dropped below 11% for only the third time. The others were 2002-07-05, 2016-01-26, and 2020-03-19, after which the S&P gained at least +20% at some point within the next year, with no decline exceeding -7.4% after any of them.
What the research tells us...
The trouble with contrary analysis in a protracted bear market is precisely the same as its trouble during roaring bull markets. There is always a compelling reason to suspect the trend is ready to reverse, at least for a while, and the next day when things fall apart, it looks even more compelling.
By most measures we've looked at lately, particularly those dealing with the options market, we're in an environment somewhat similar to early October 2008. That wasn't the bear market's low by any stretch, but positioning had become so one-sided that a big relief rally and wild swings in both directions were imminent.
Indicators at Extremes
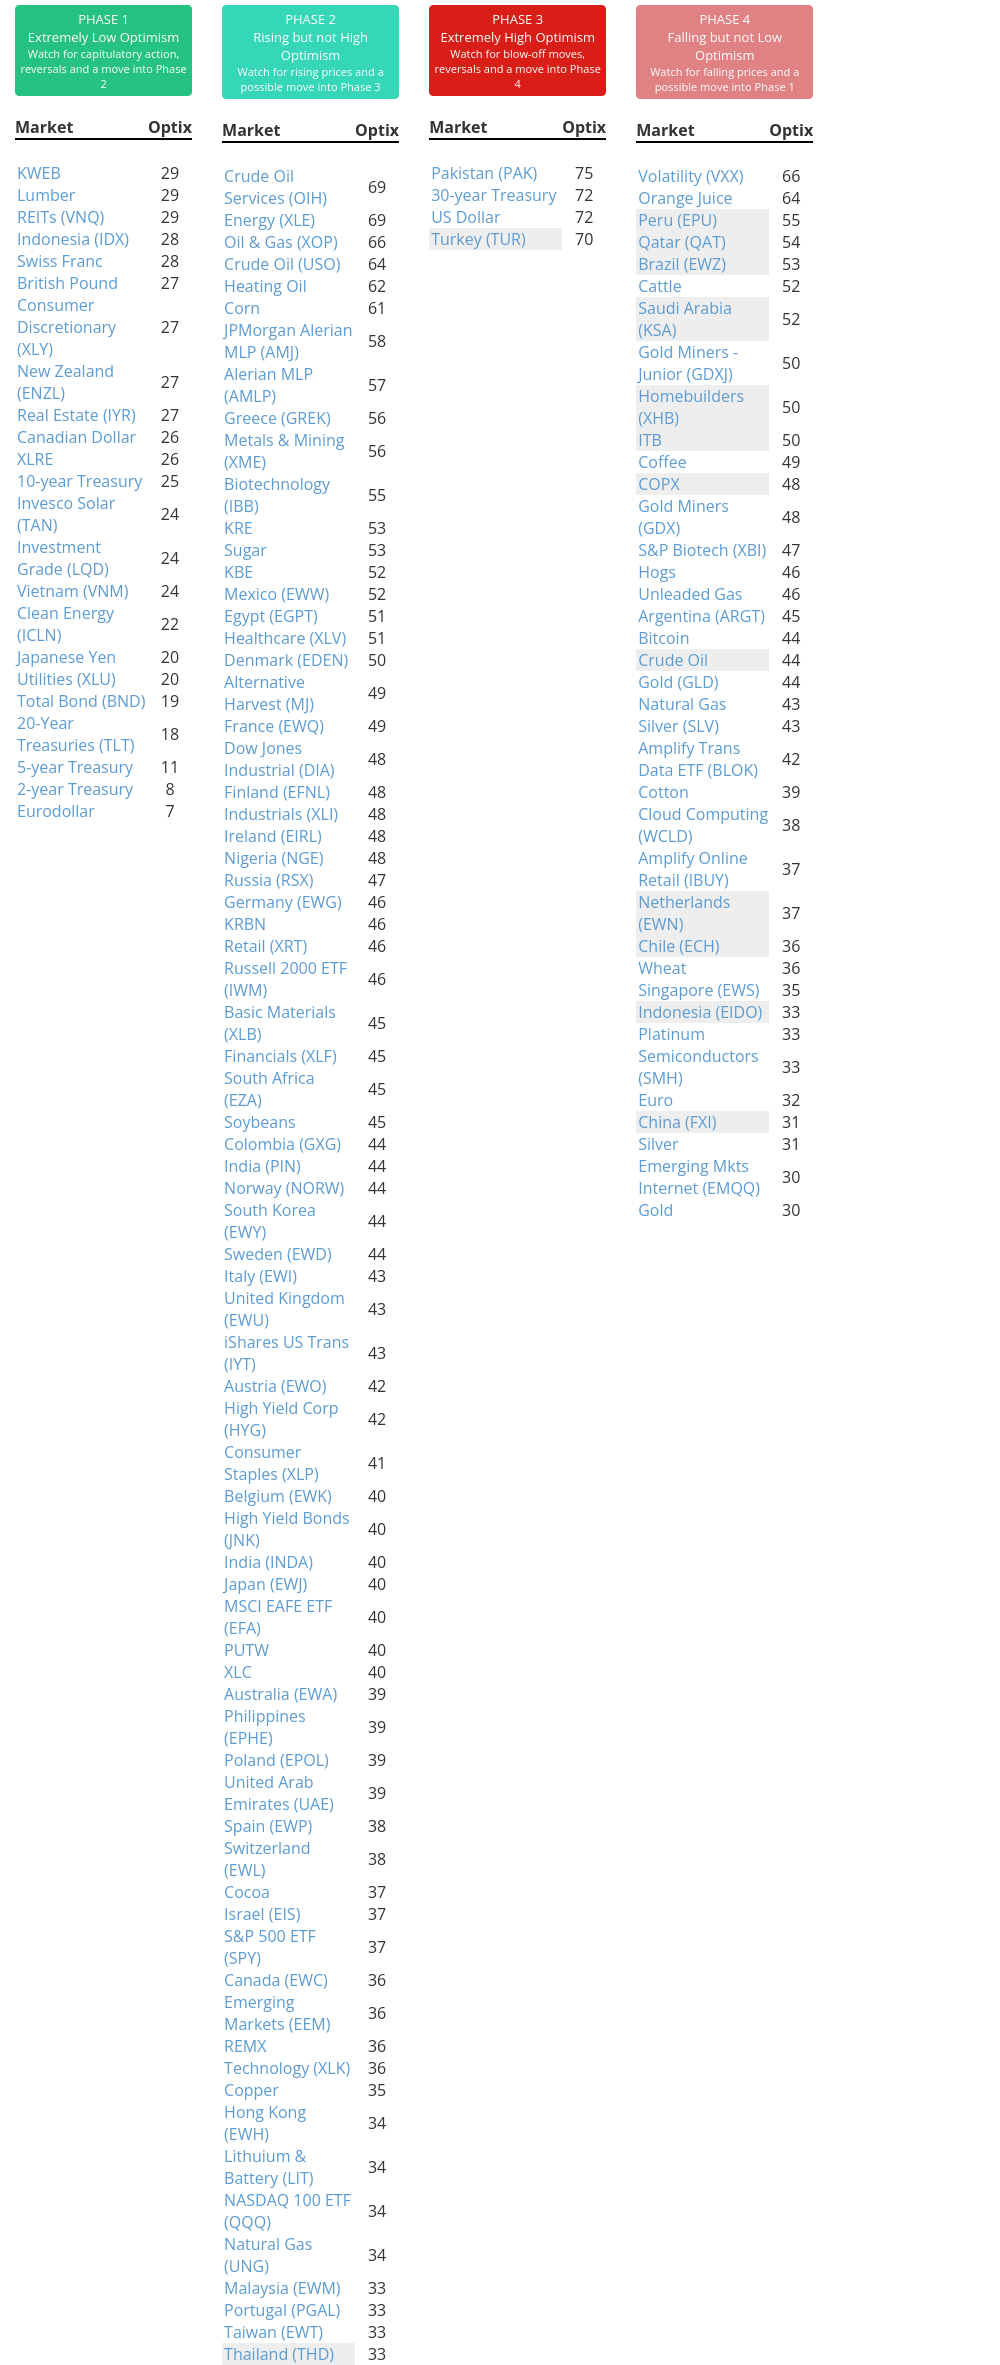
Phase Table
Ranks
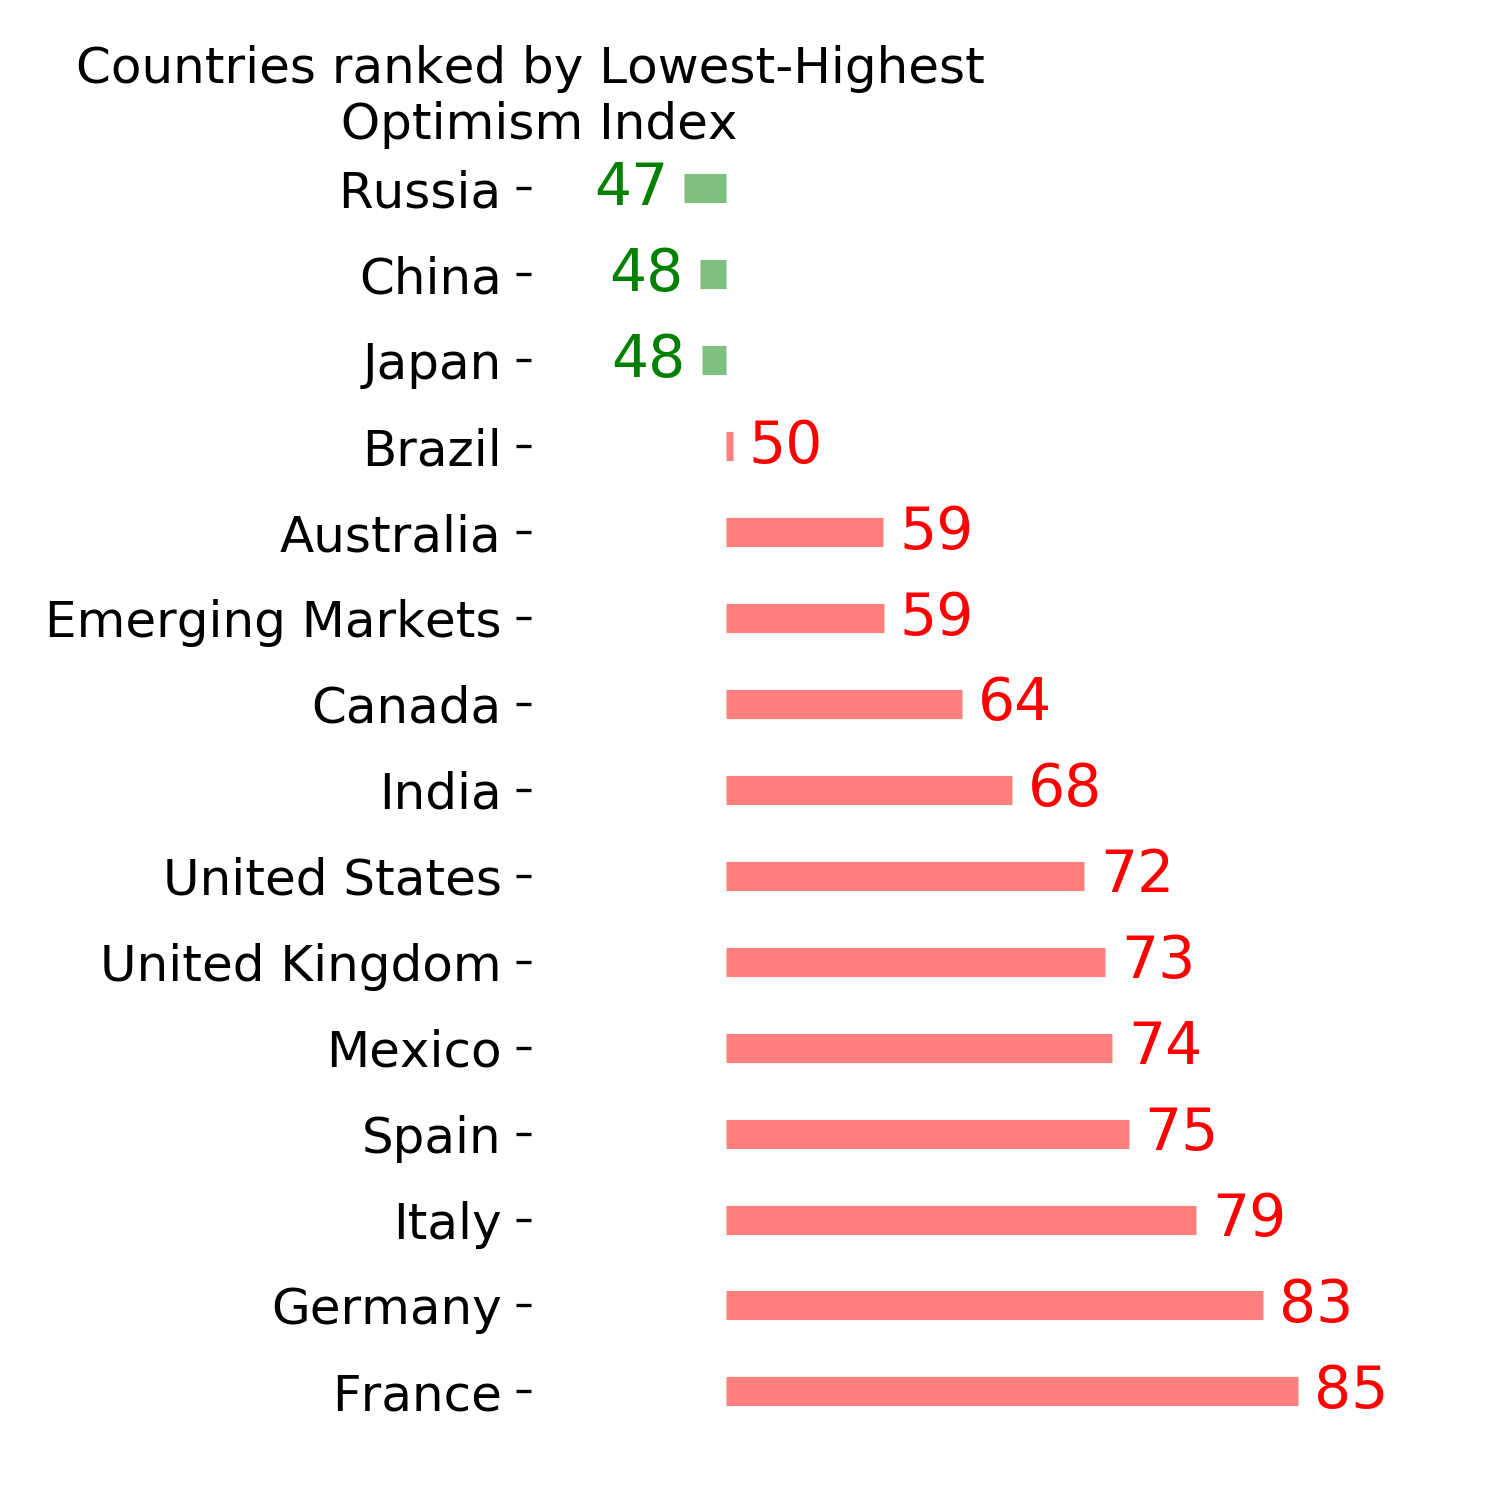
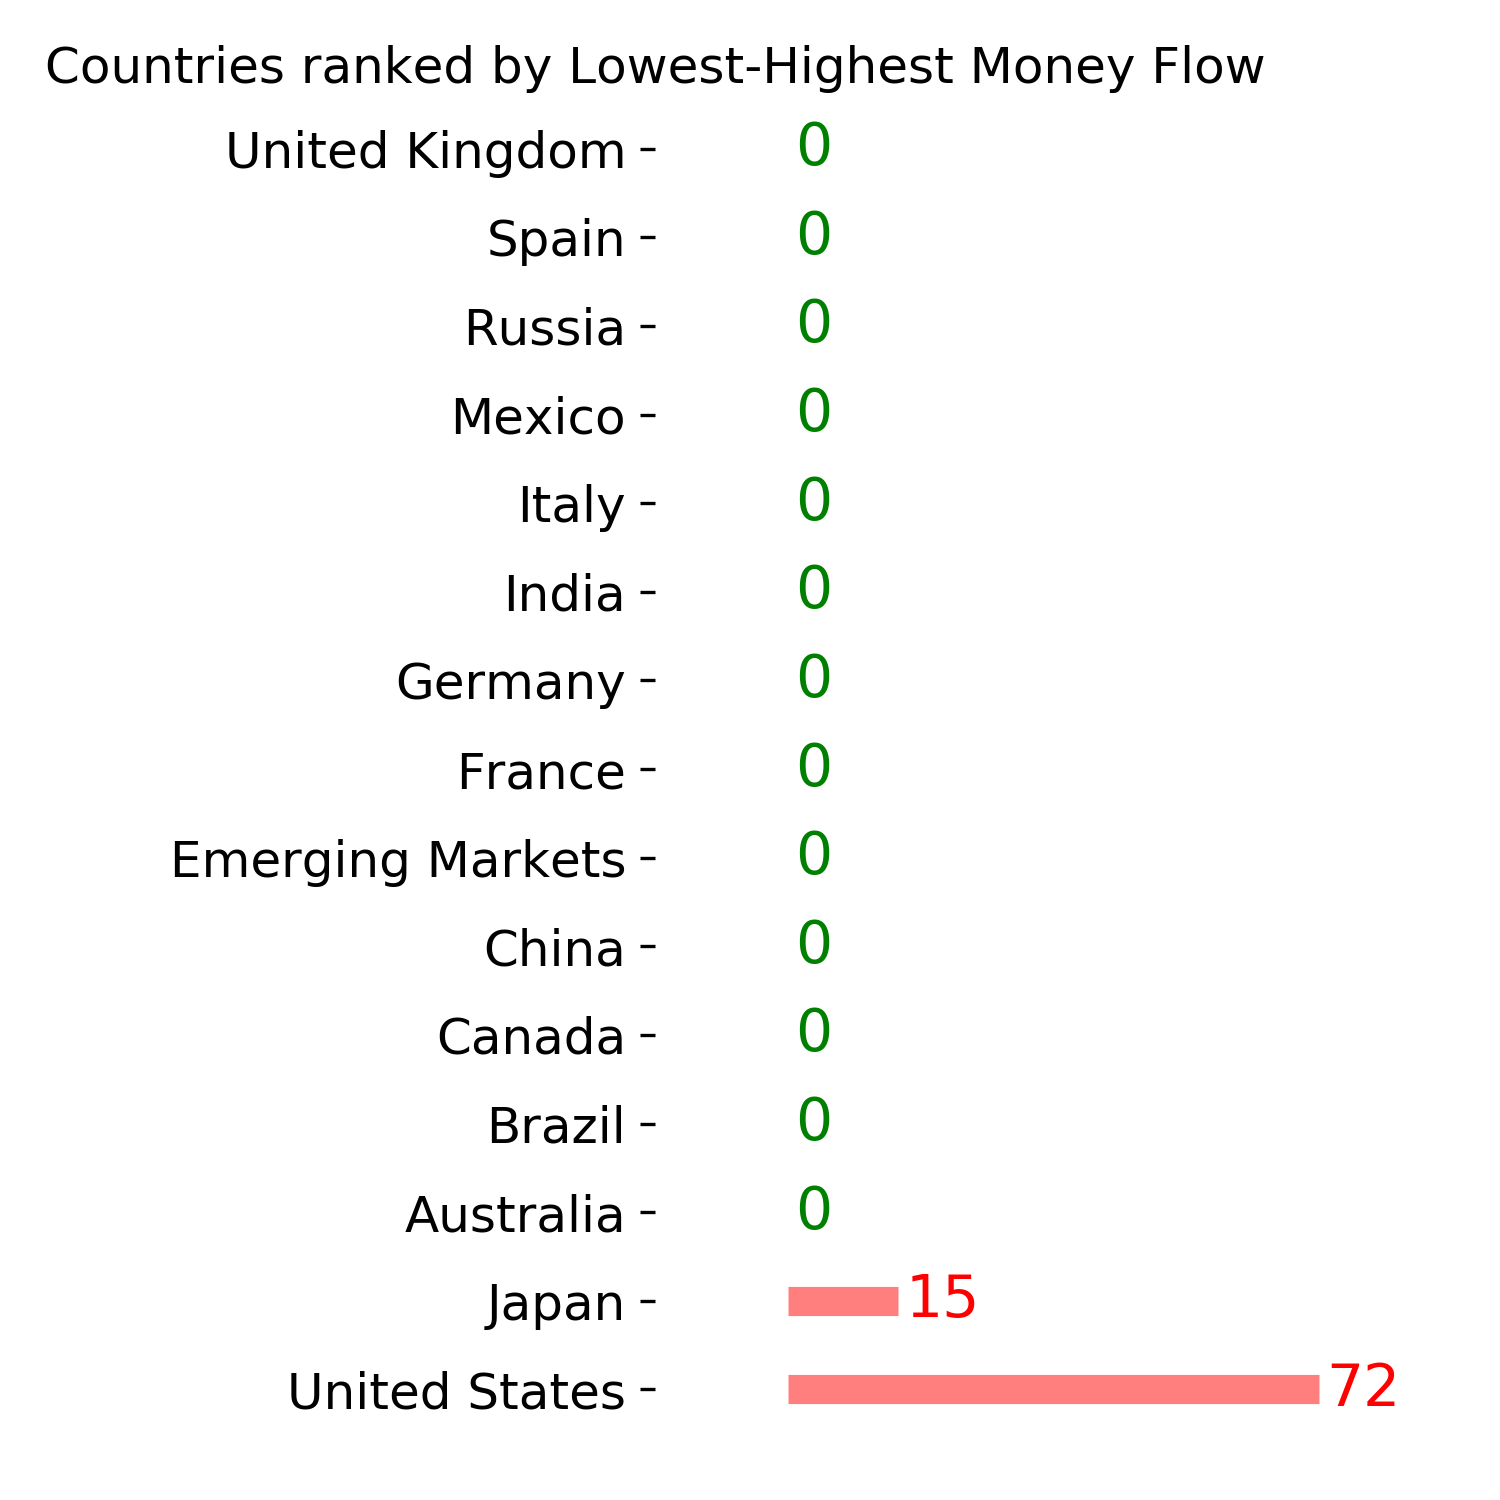
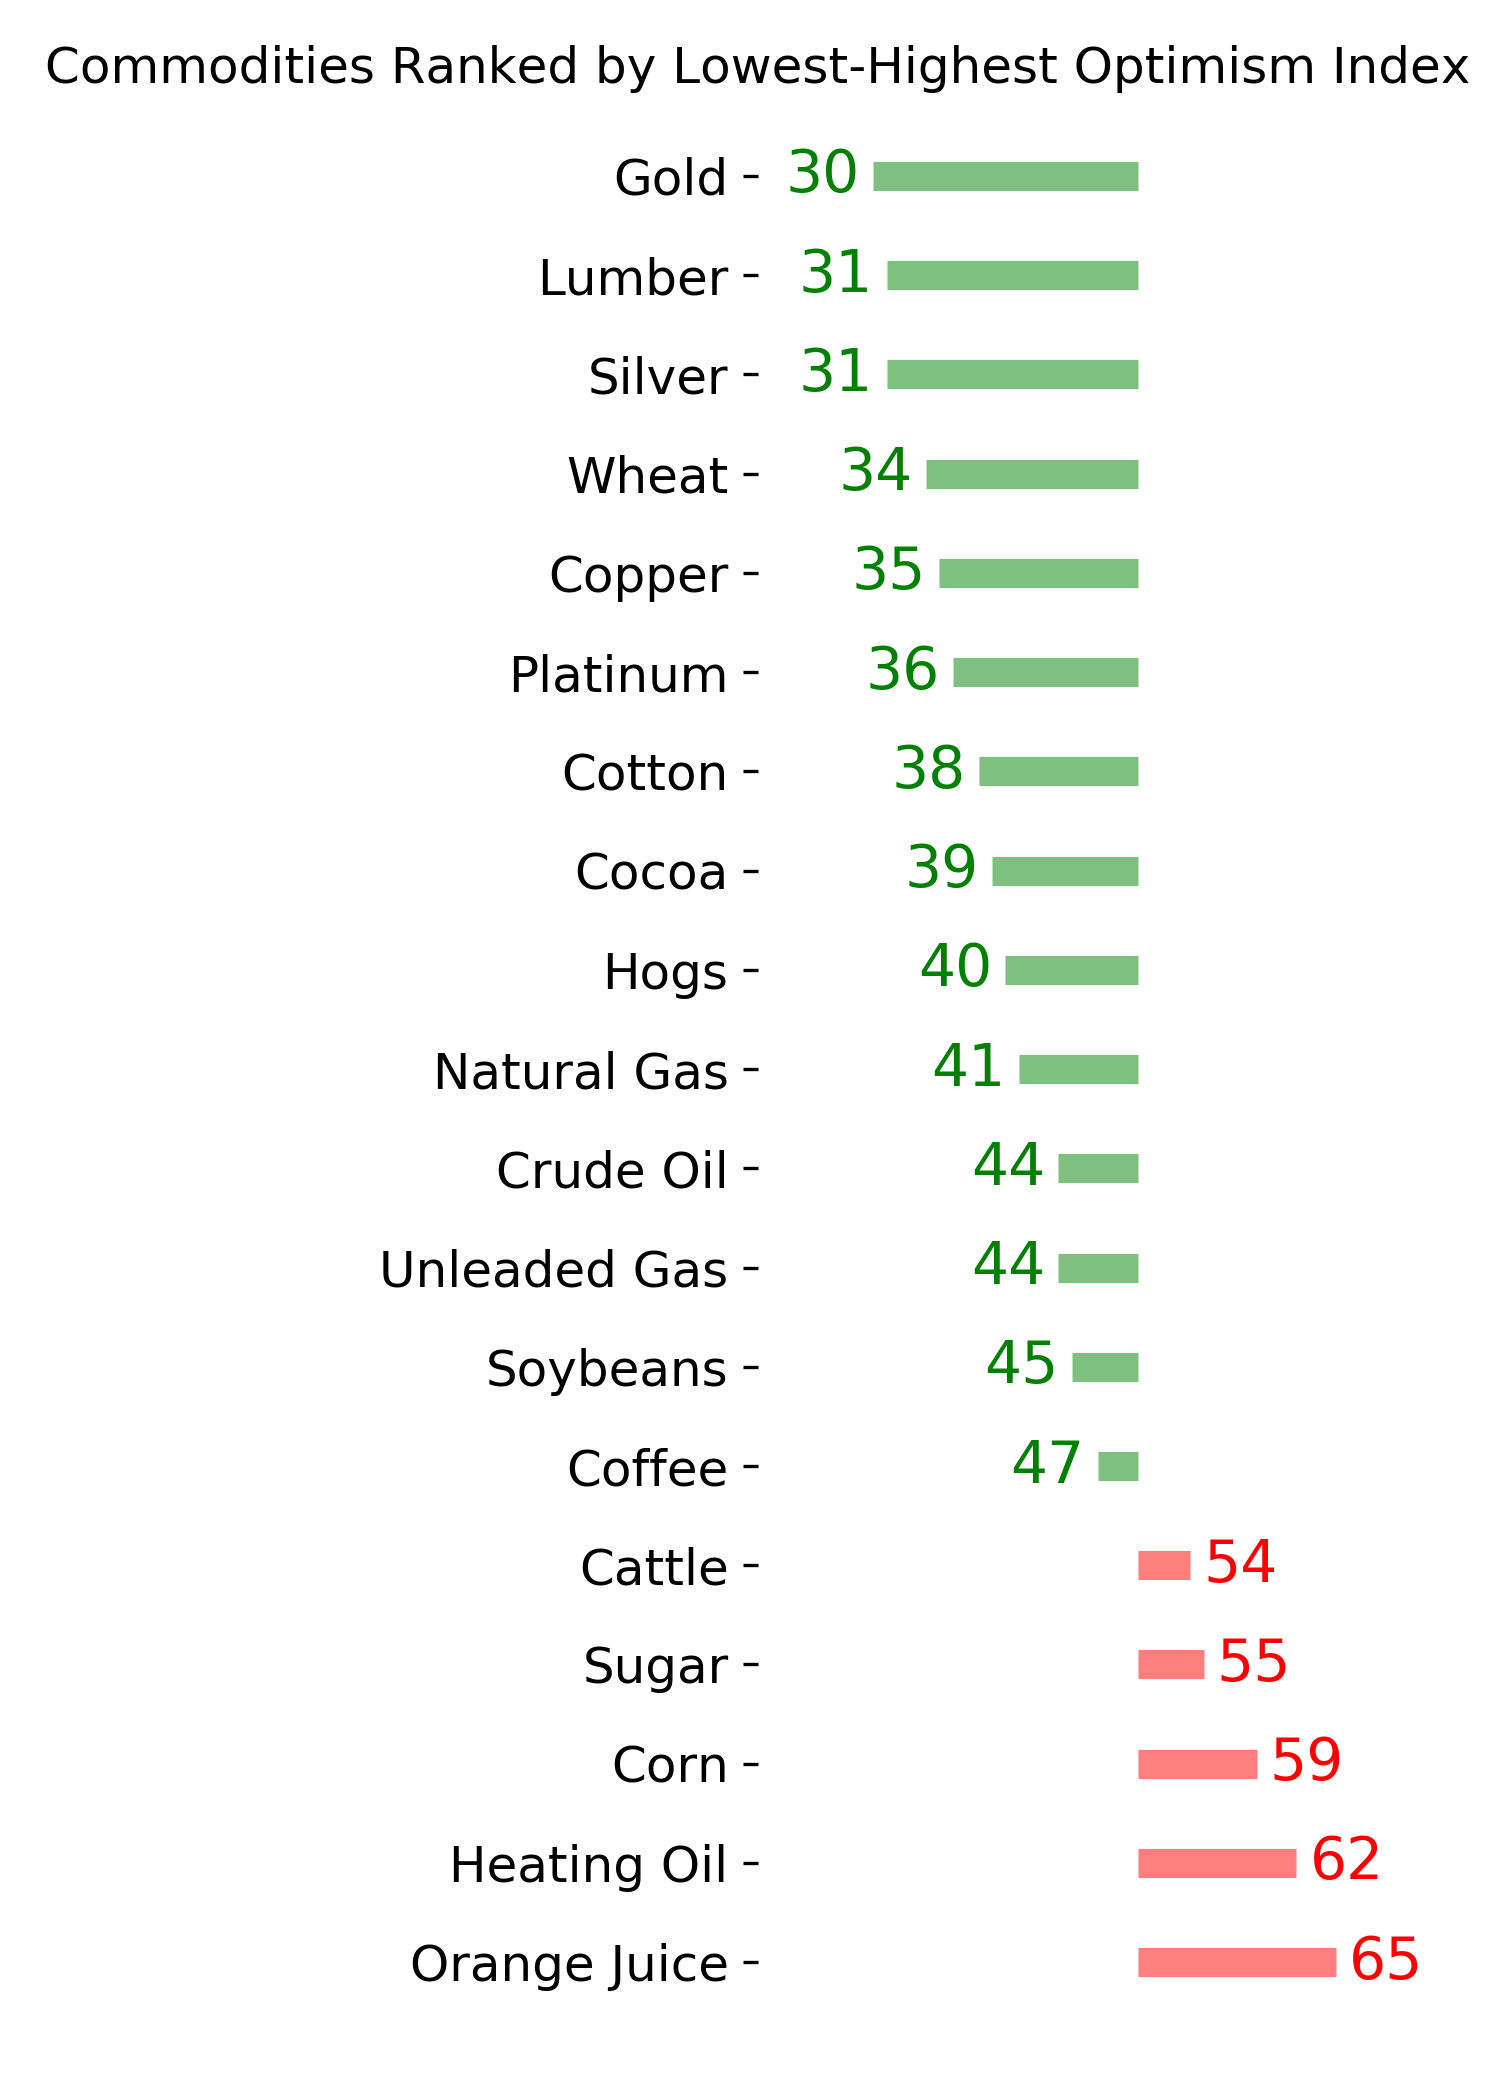
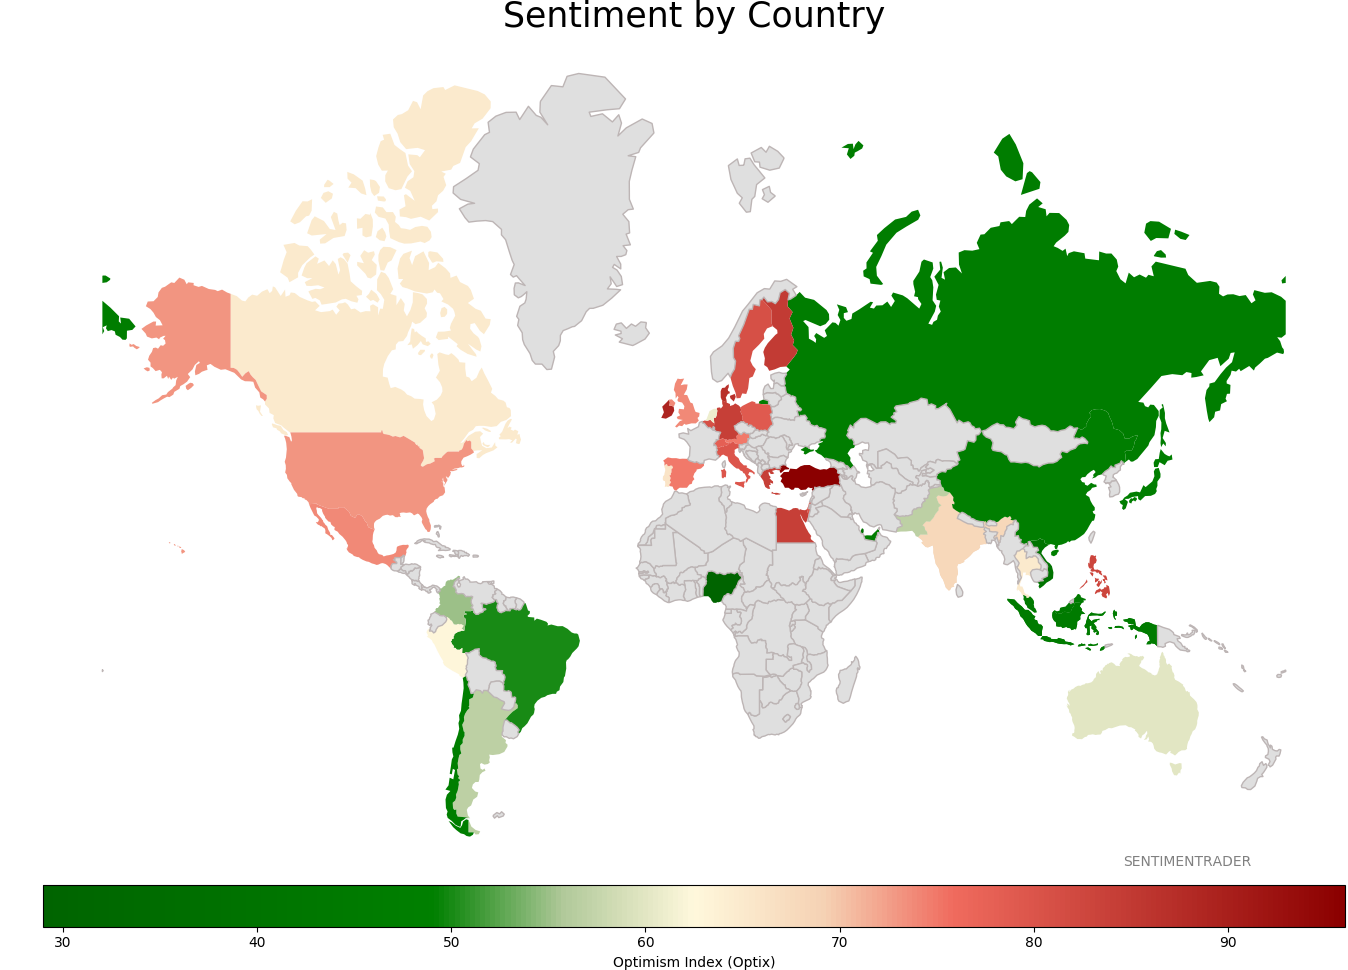
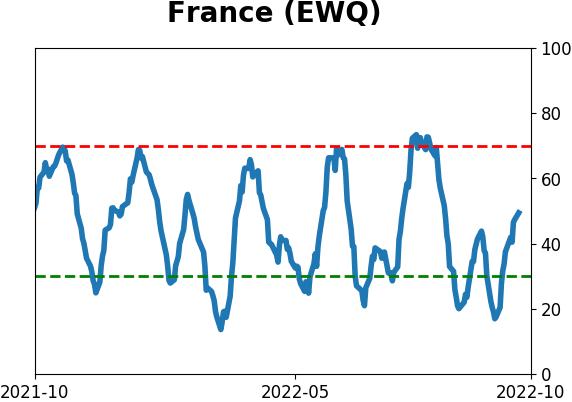
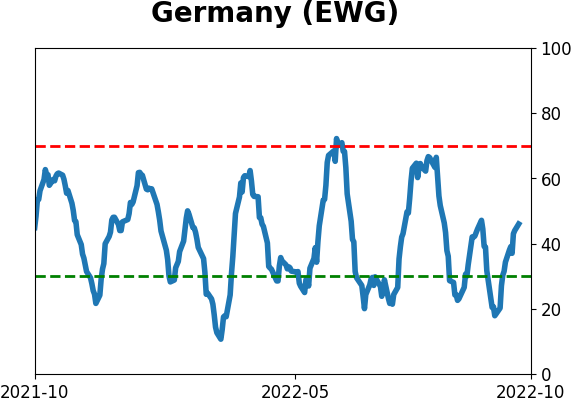
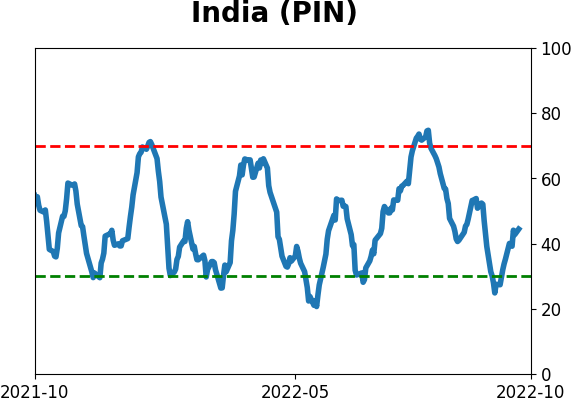
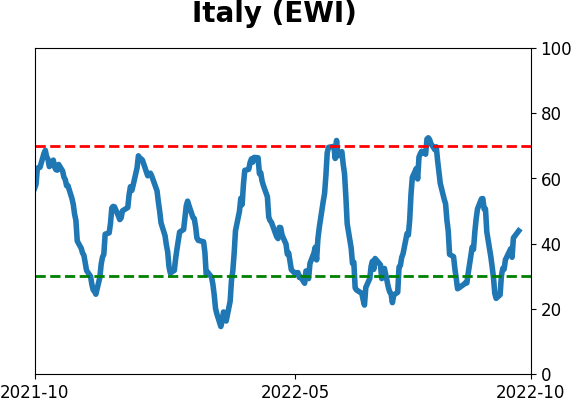
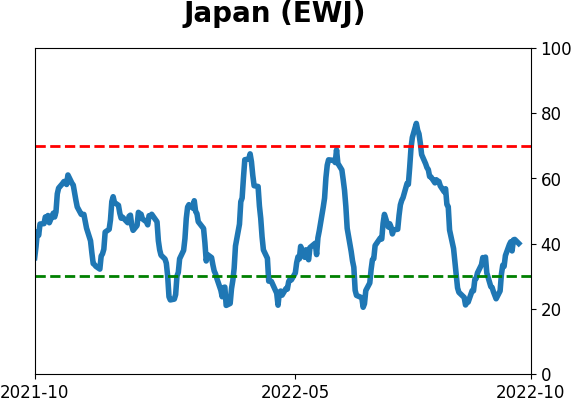
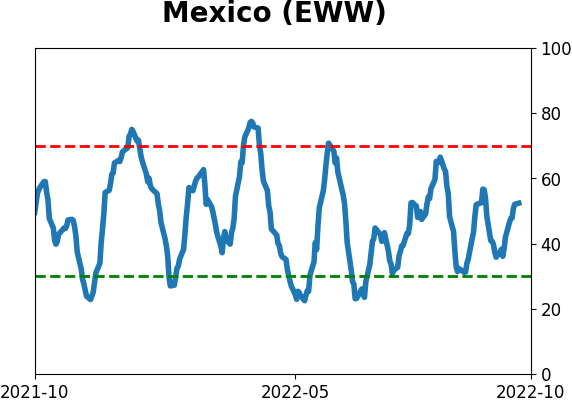
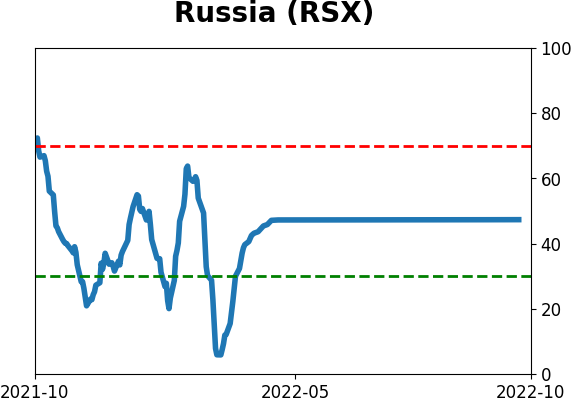
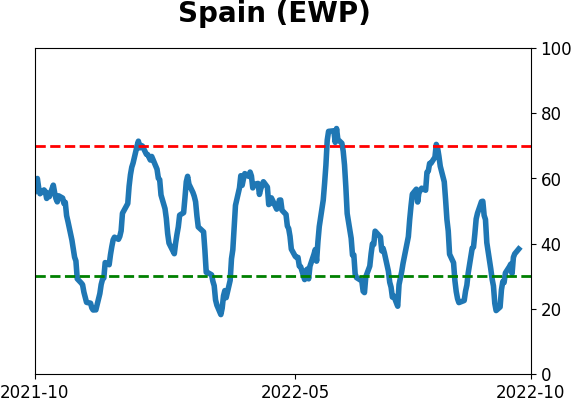
Sentiment Around The World
Optimism Index Thumbnails
|
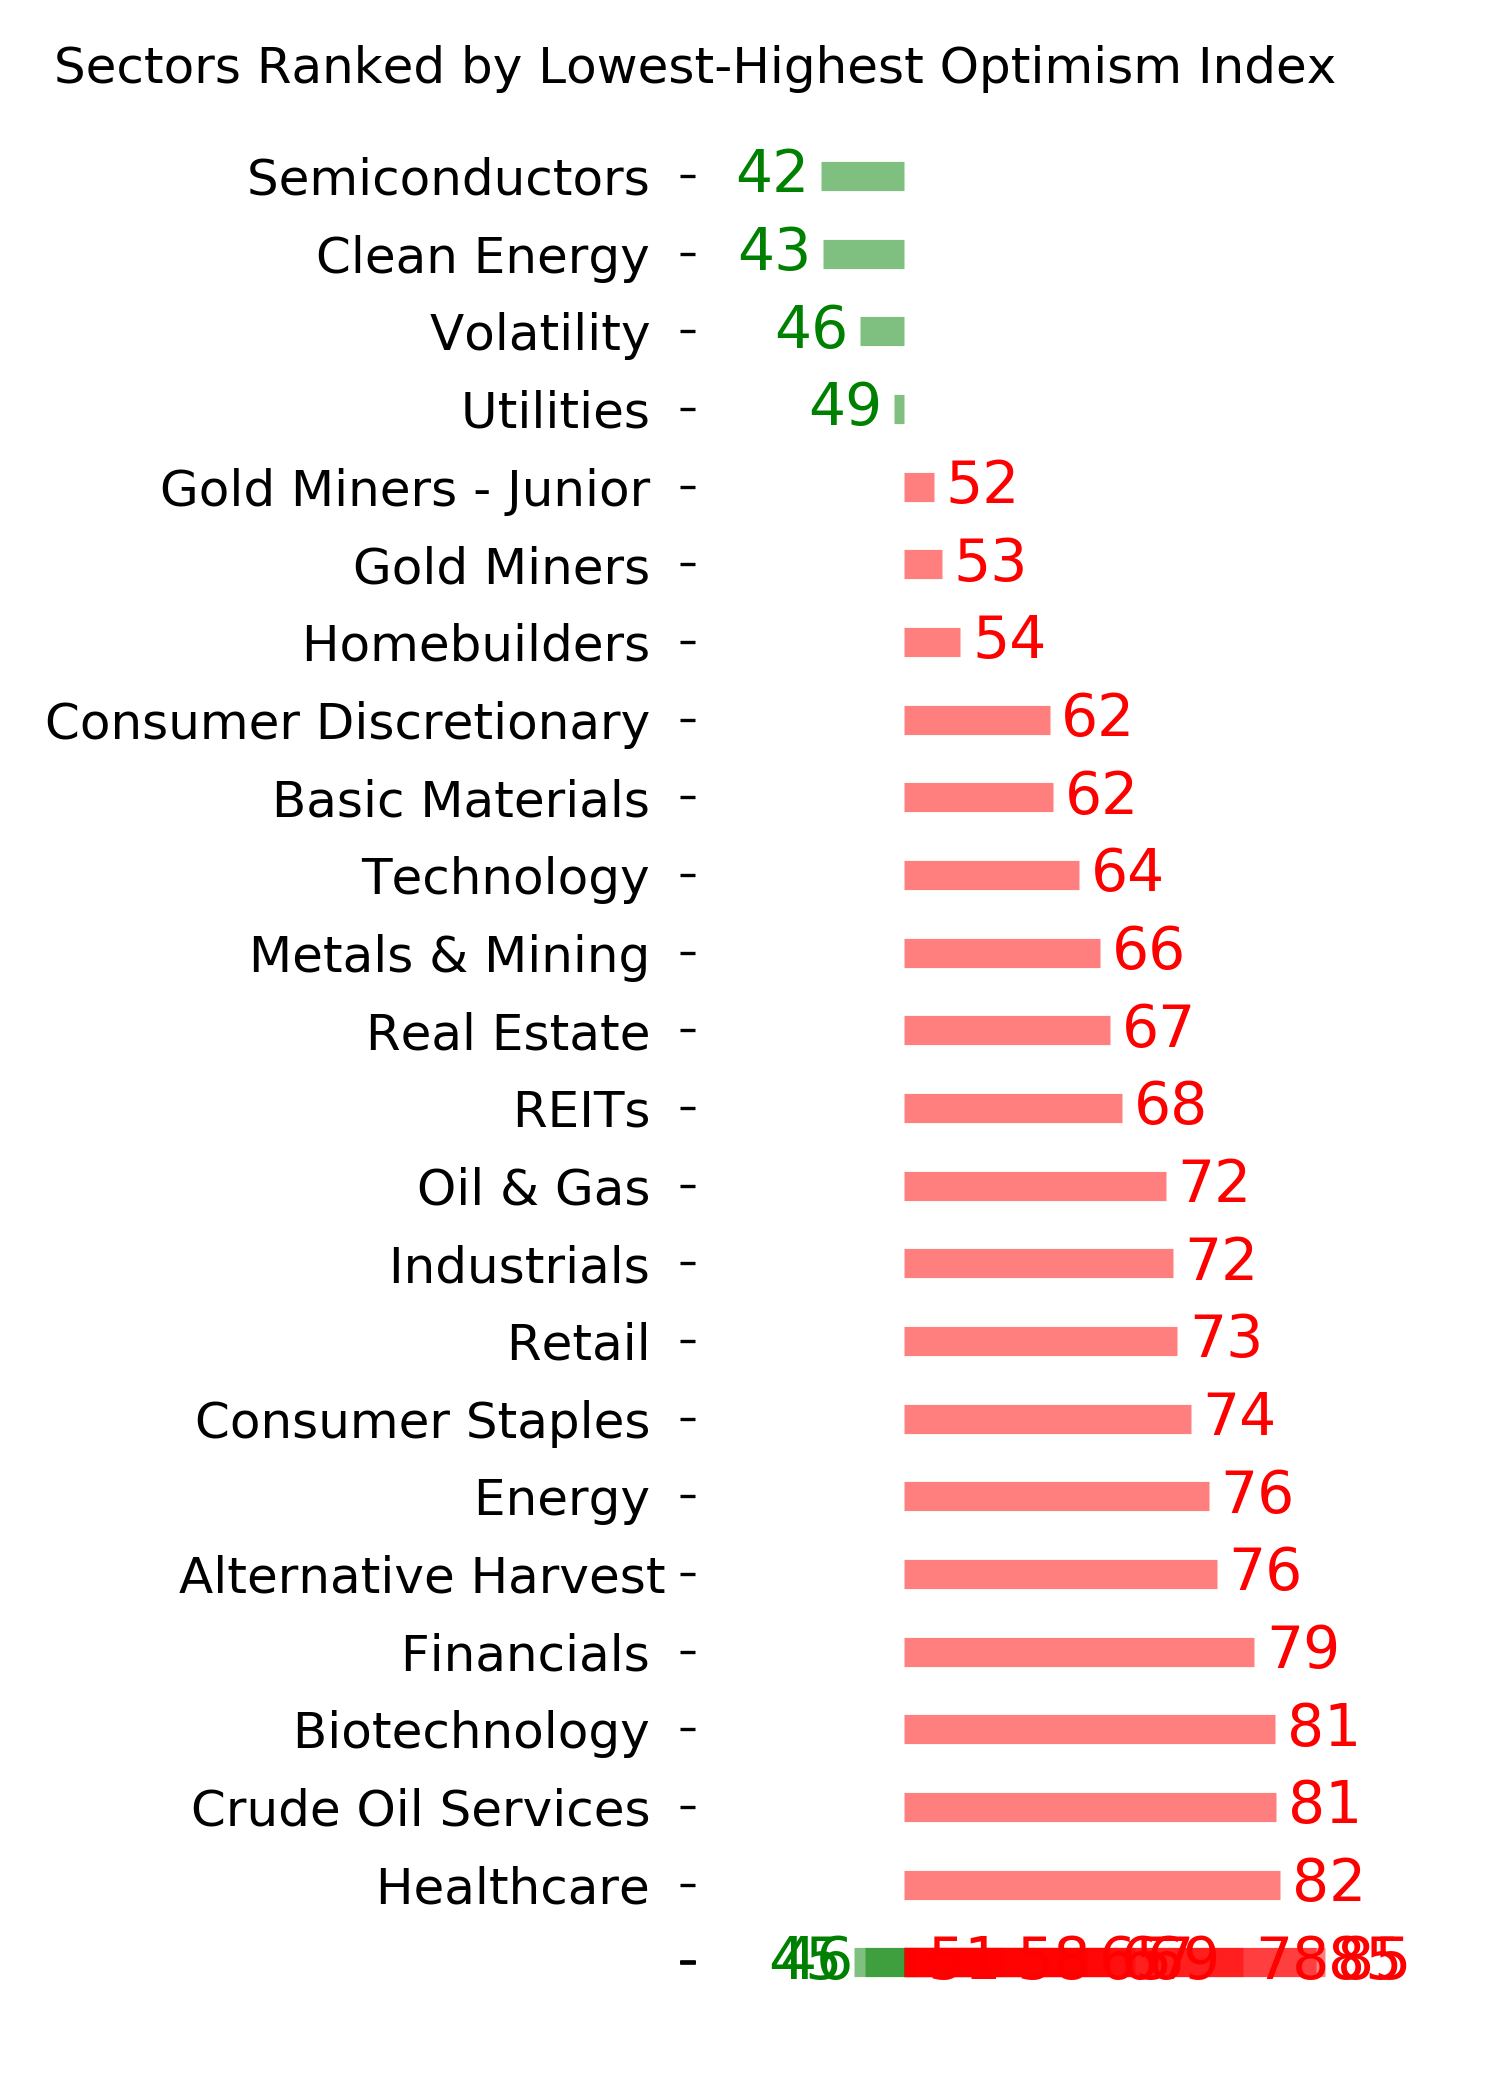
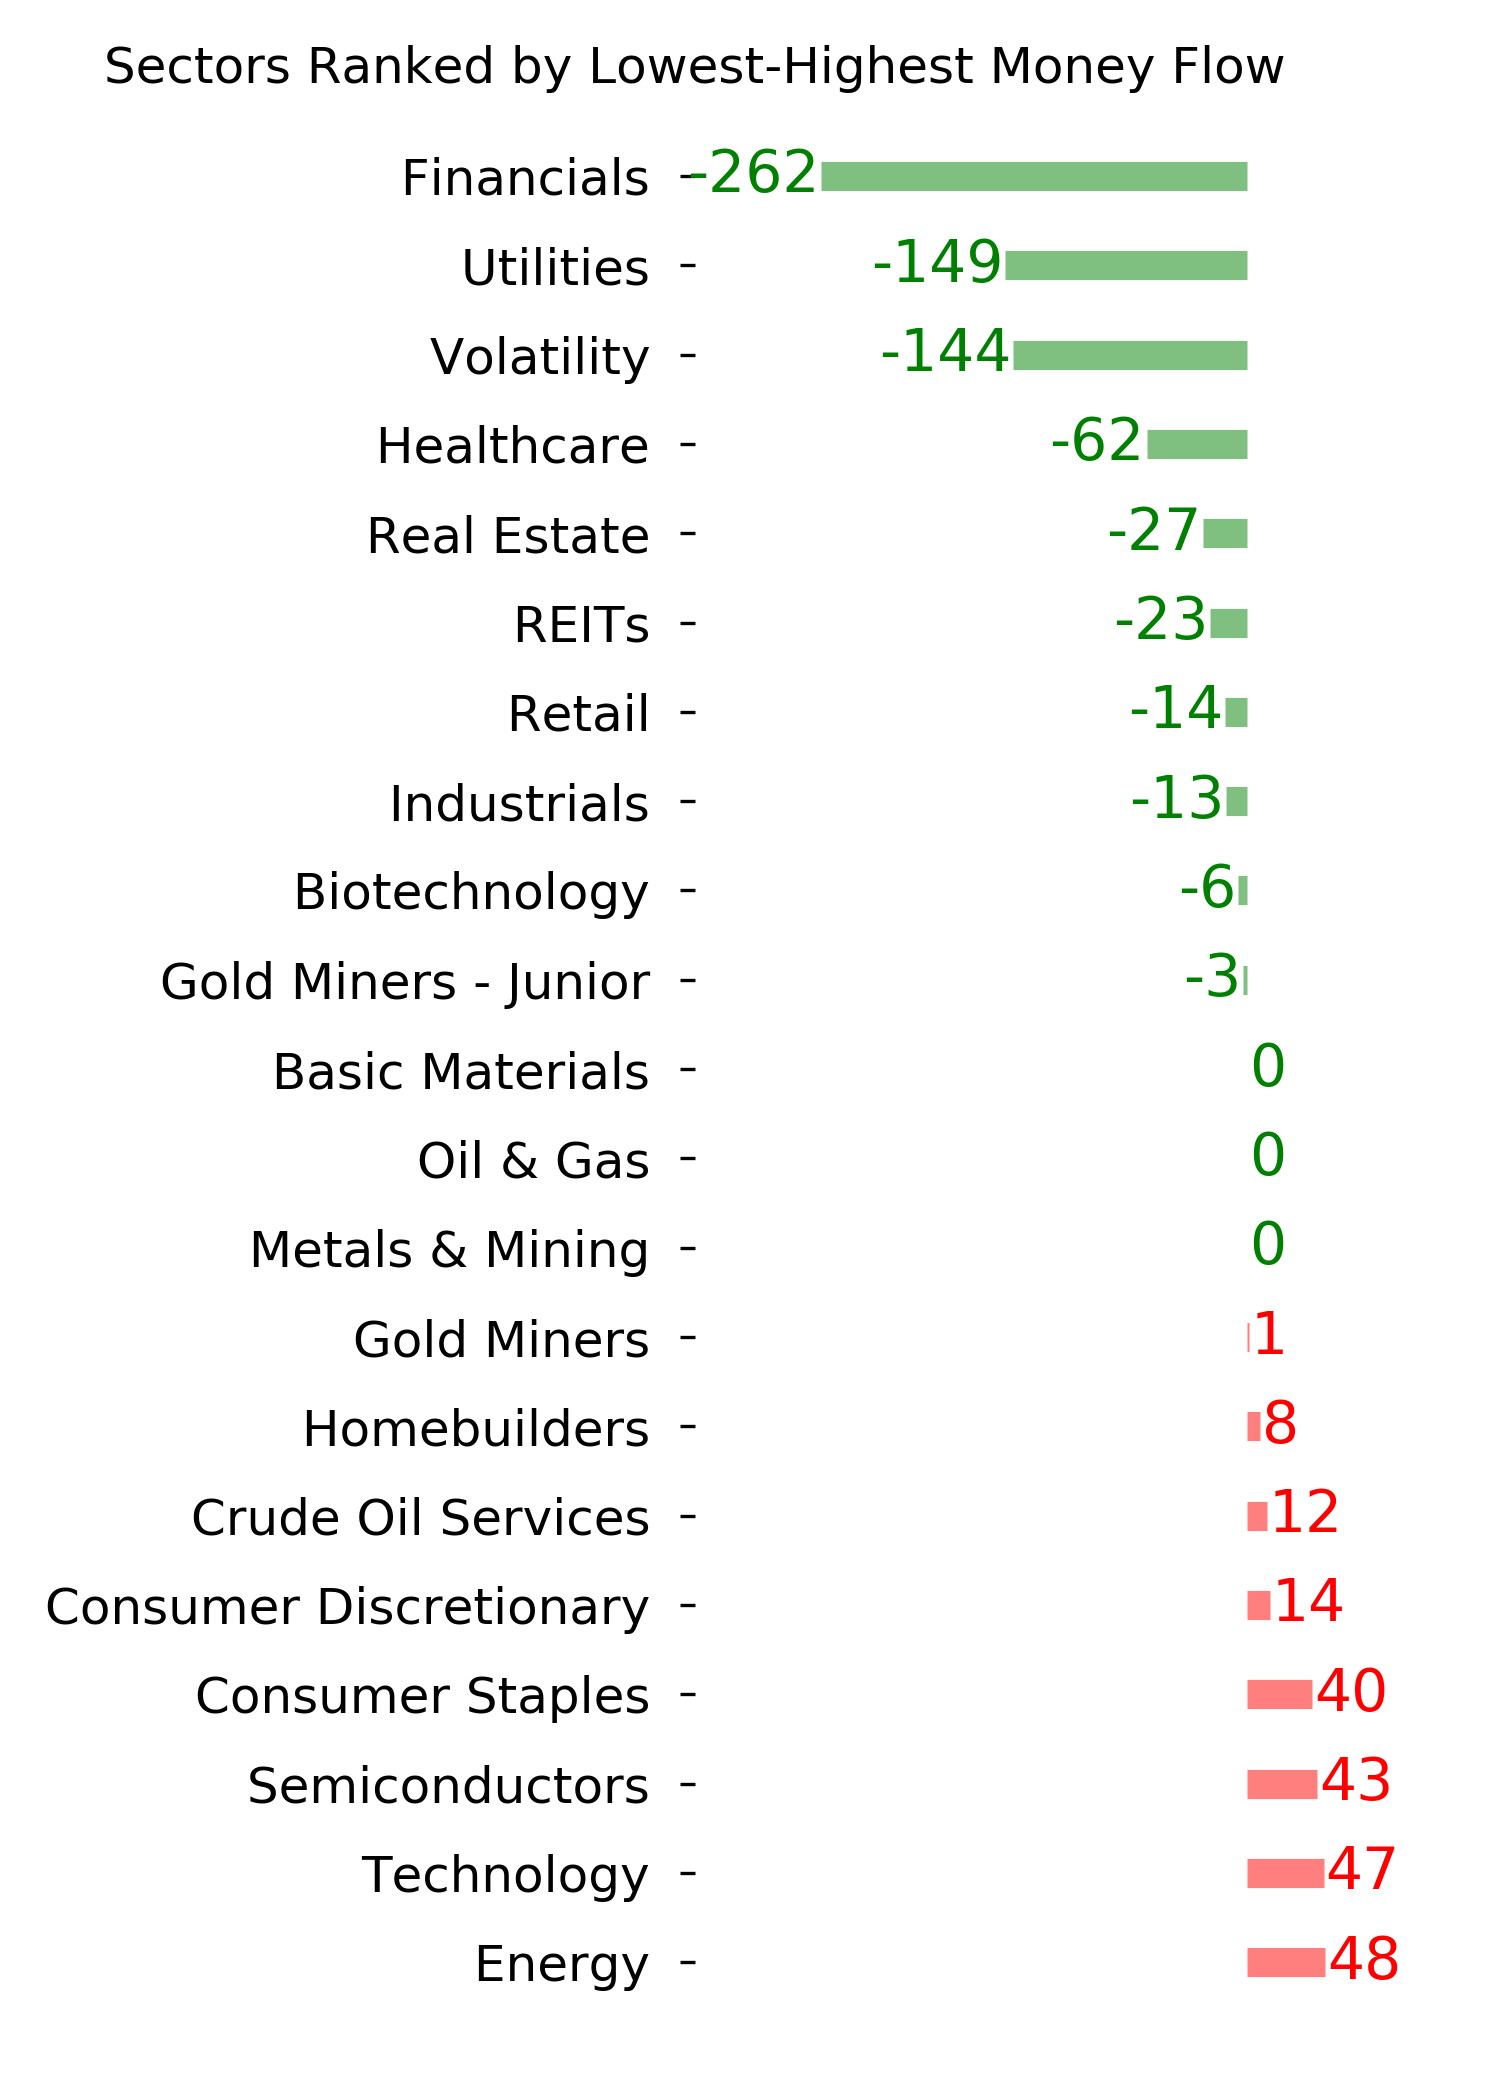
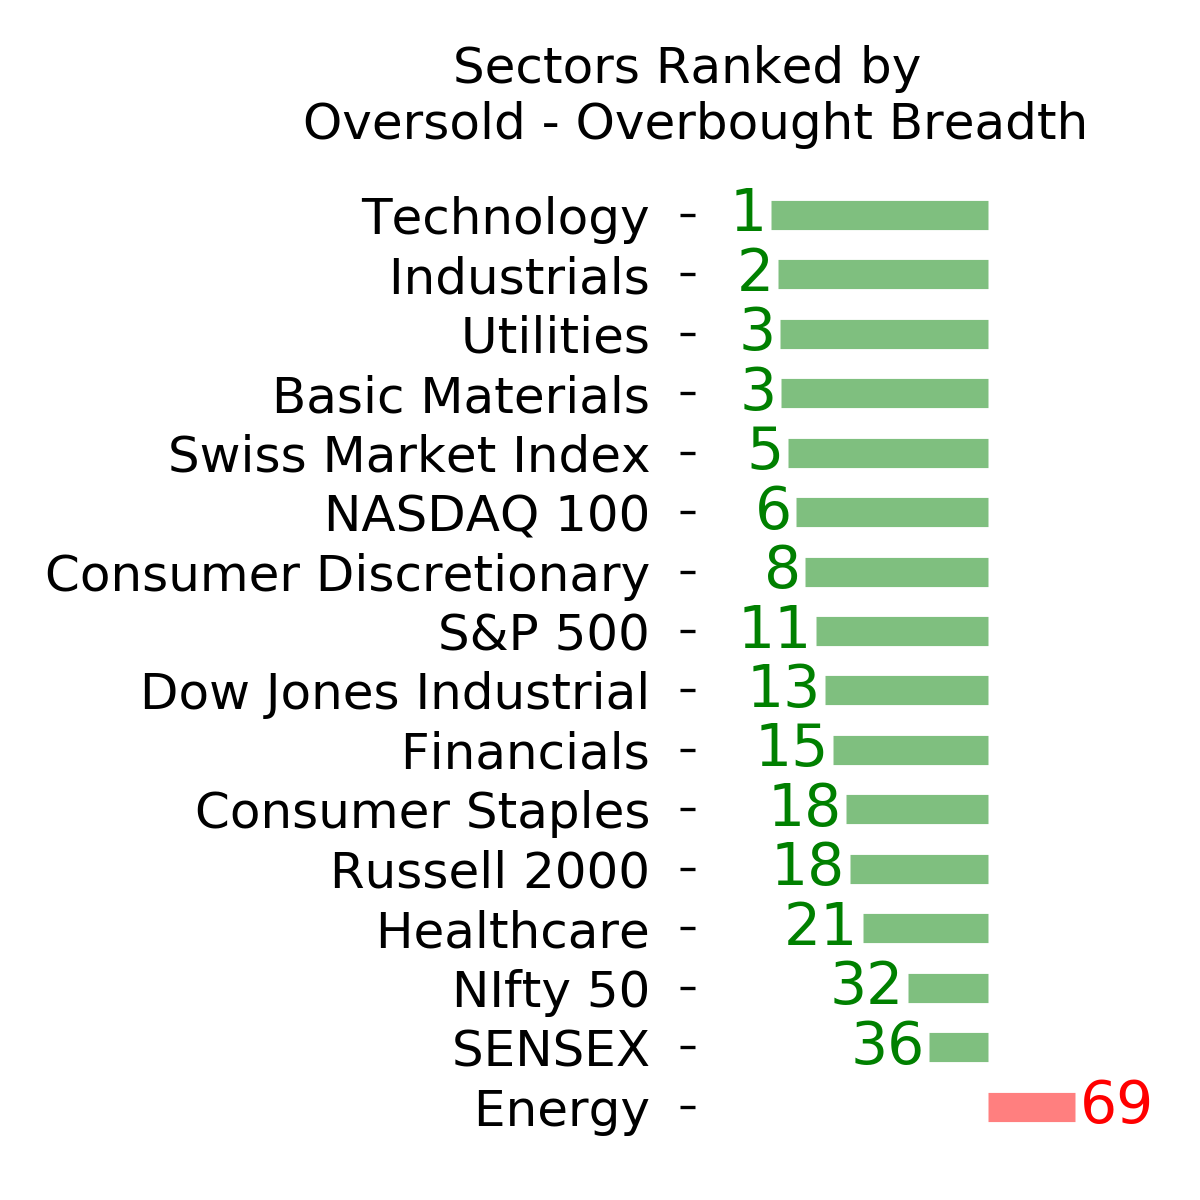
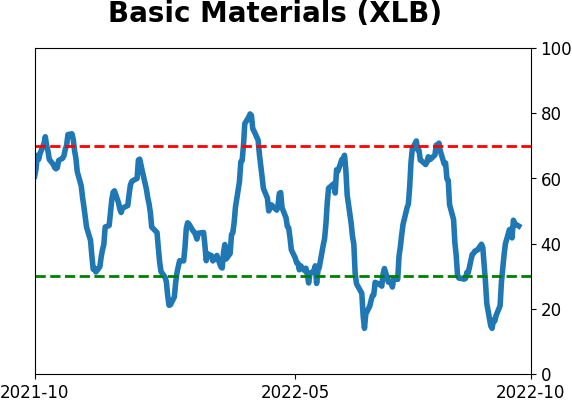
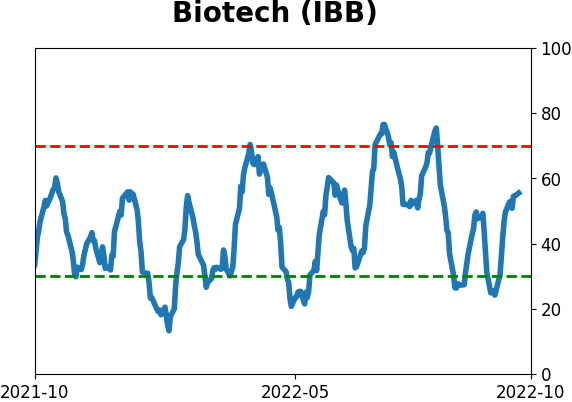
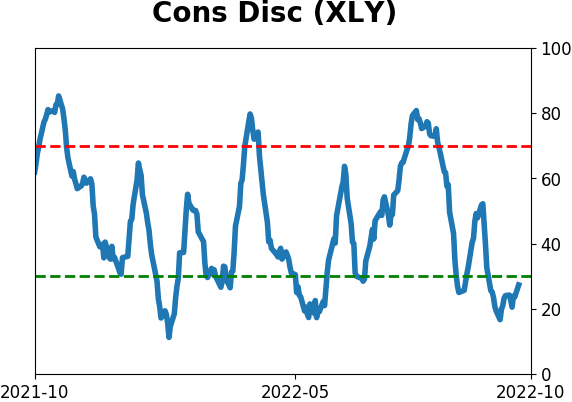
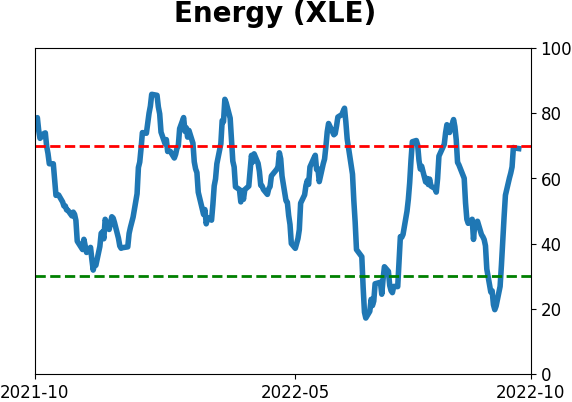
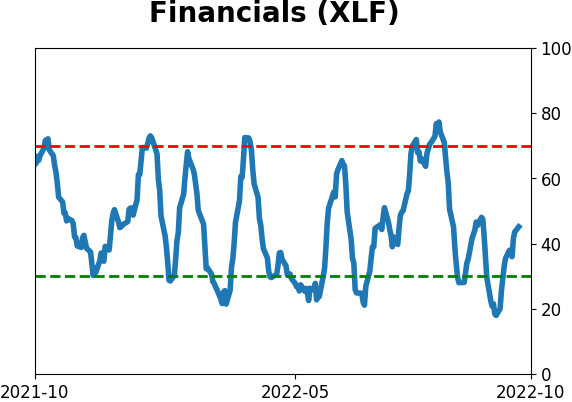
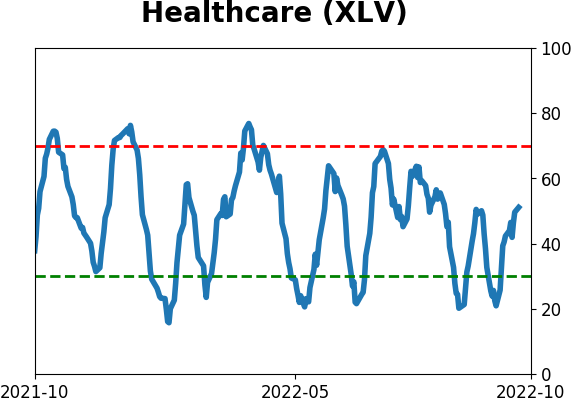
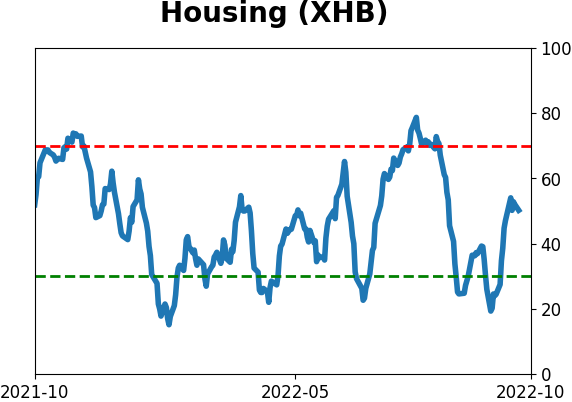
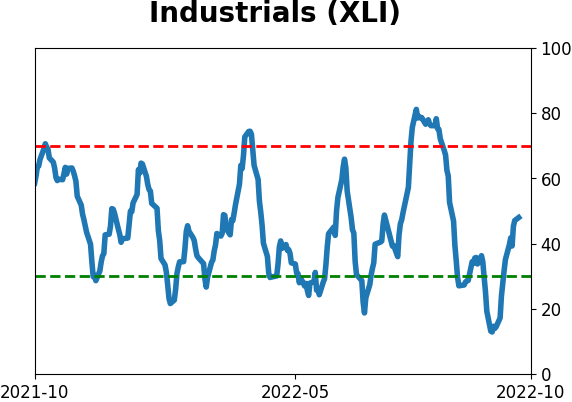
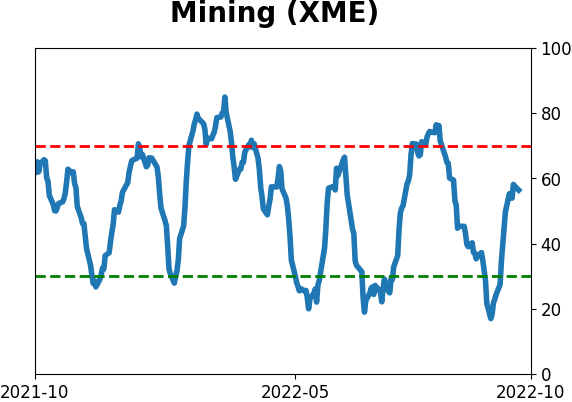
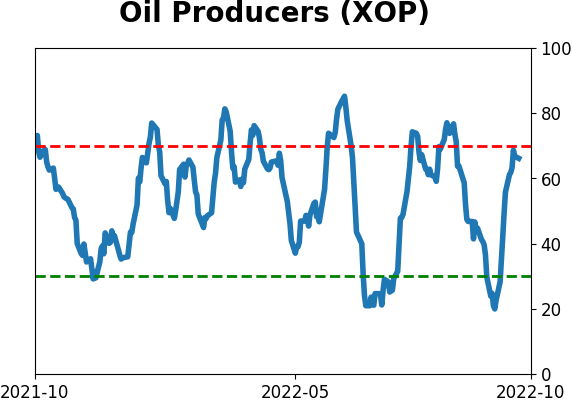
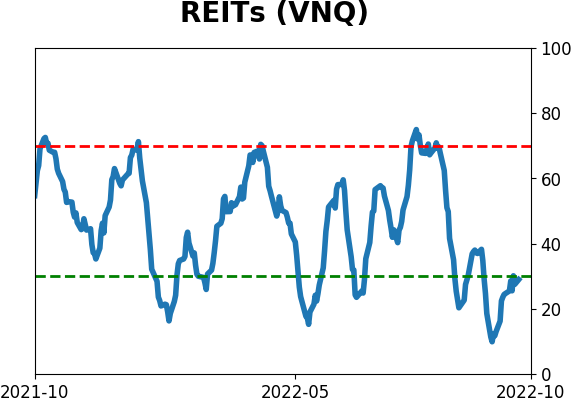
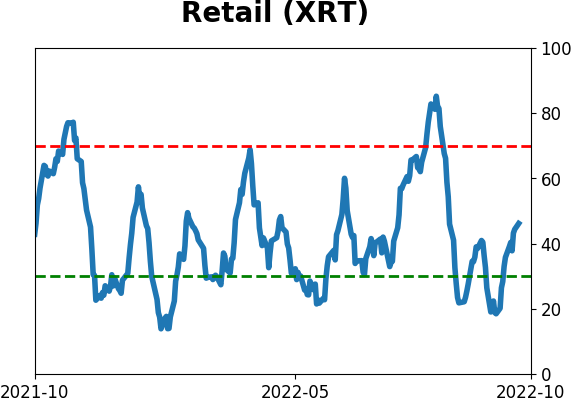
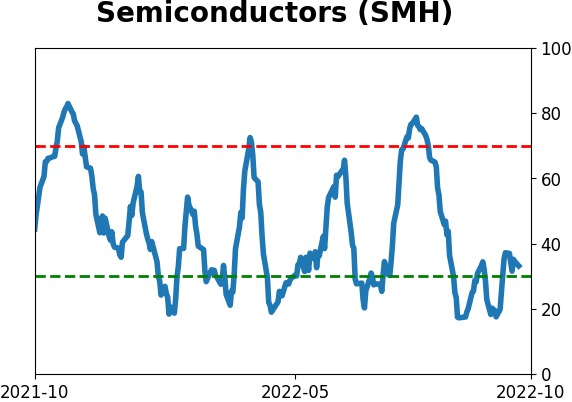
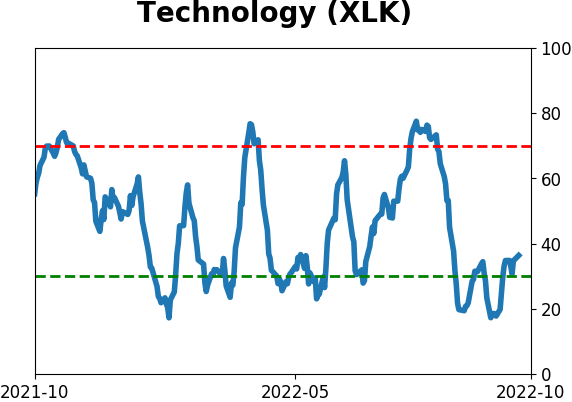
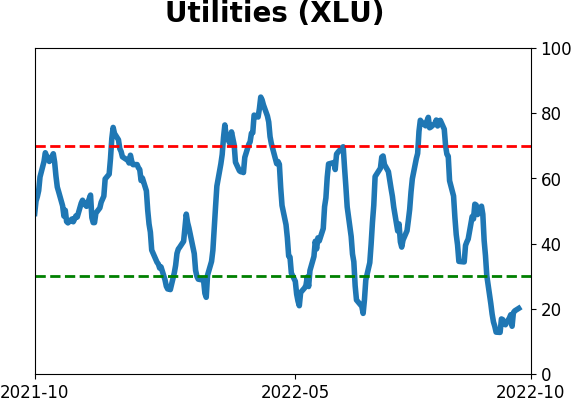
Sector ETF's - 10-Day Moving Average
|
|
|
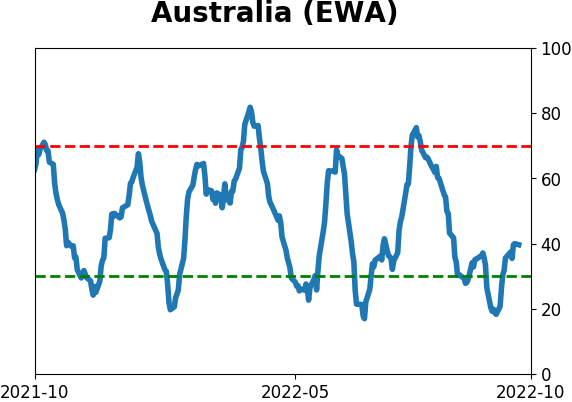
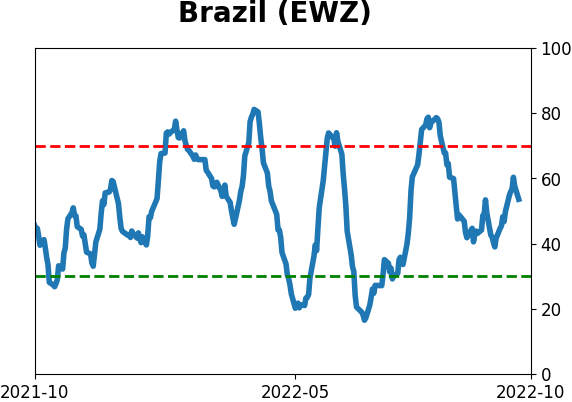
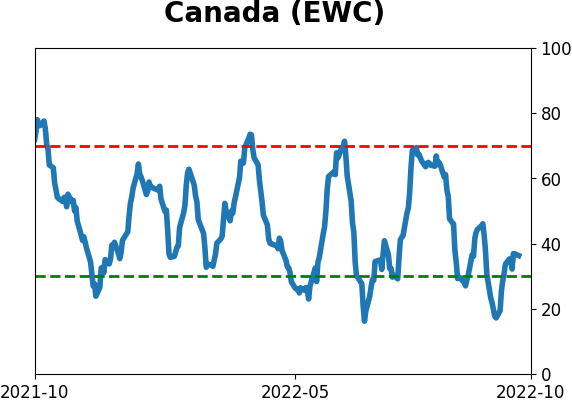
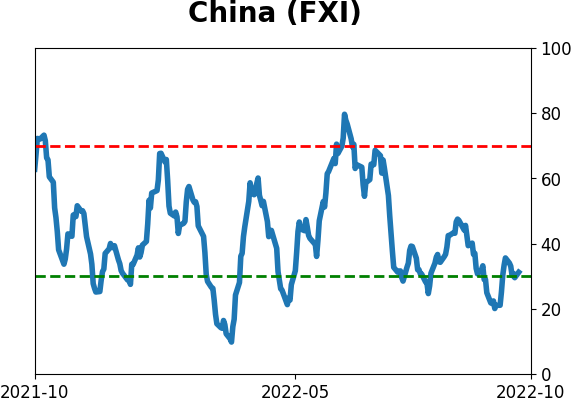
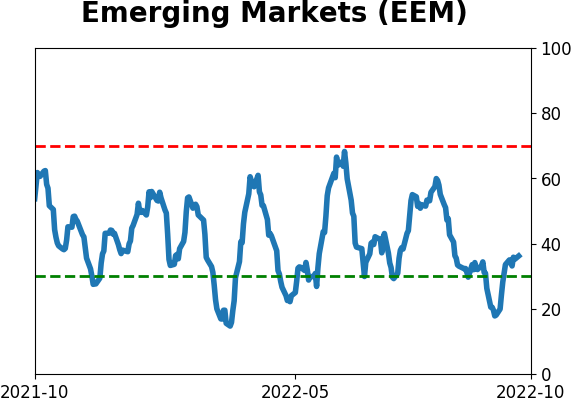
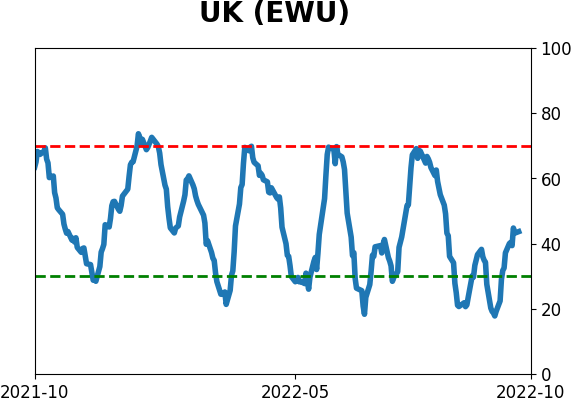
Country ETF's - 10-Day Moving Average
|
|
|
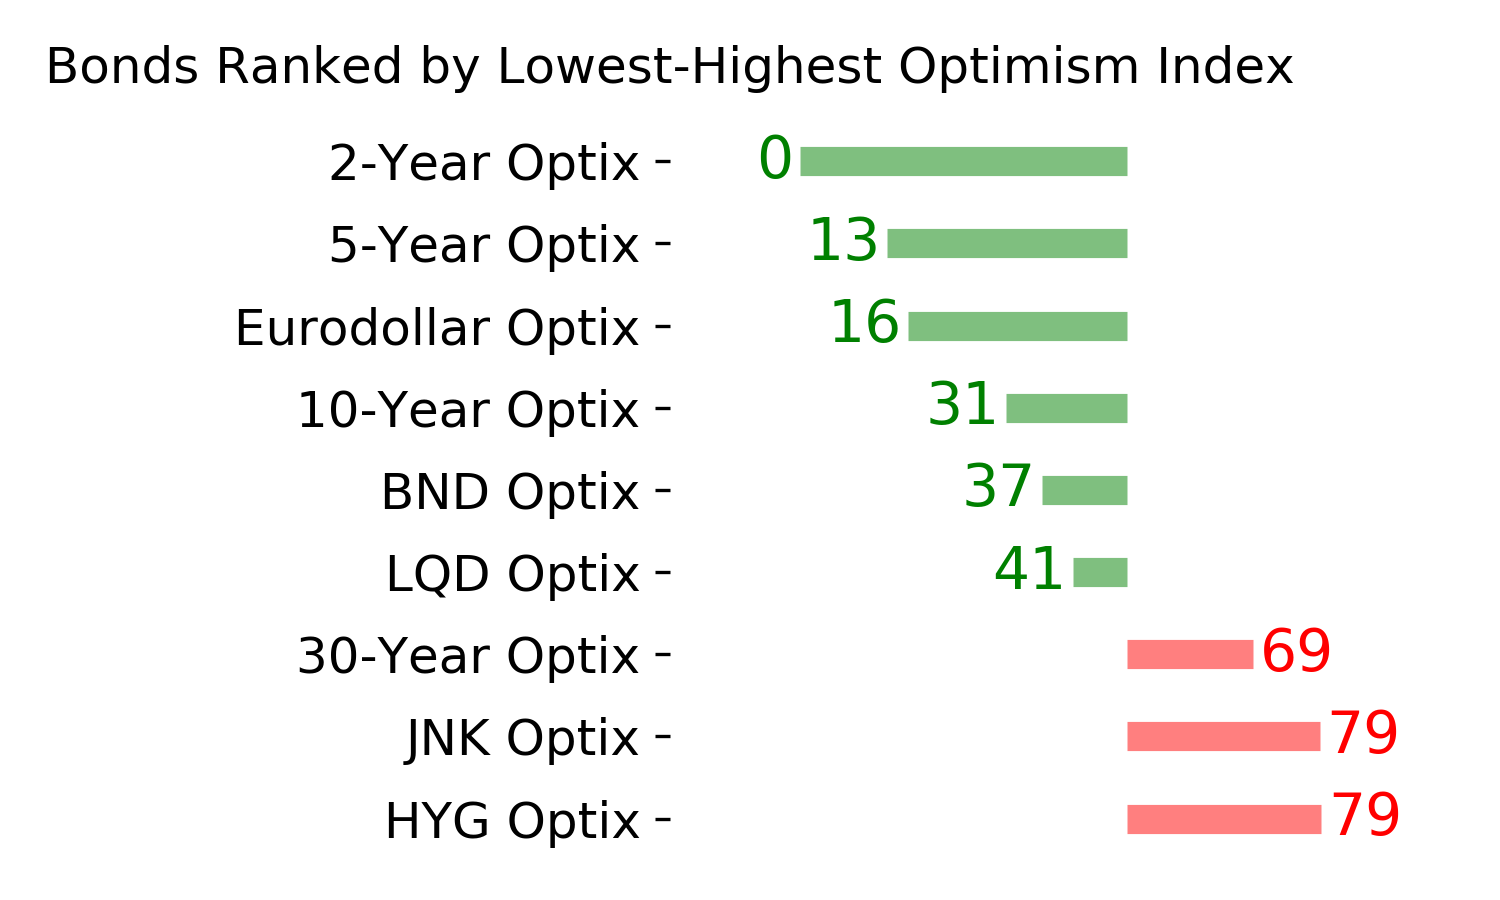
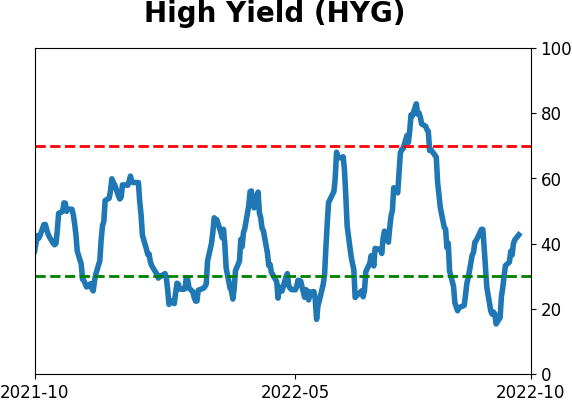
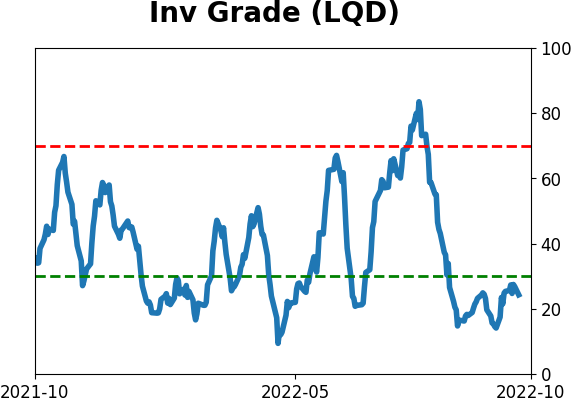
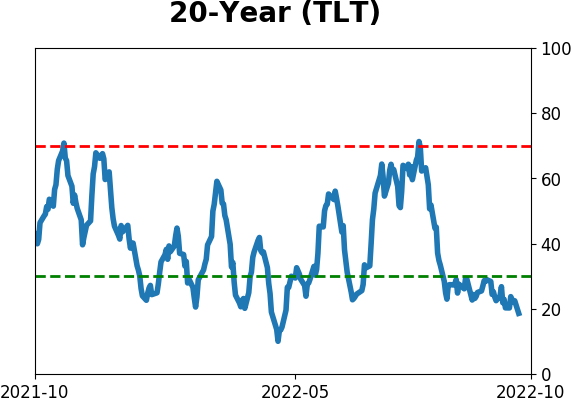
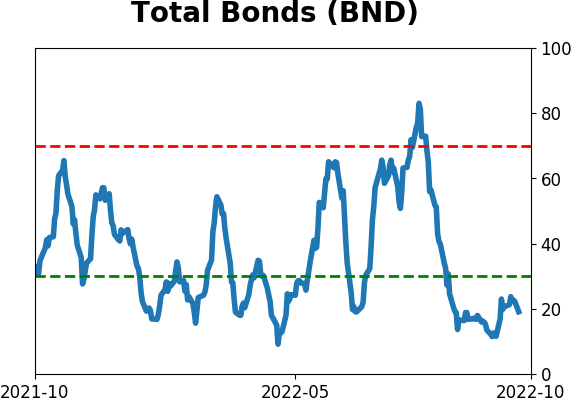
Bond ETF's - 10-Day Moving Average
|
|
|
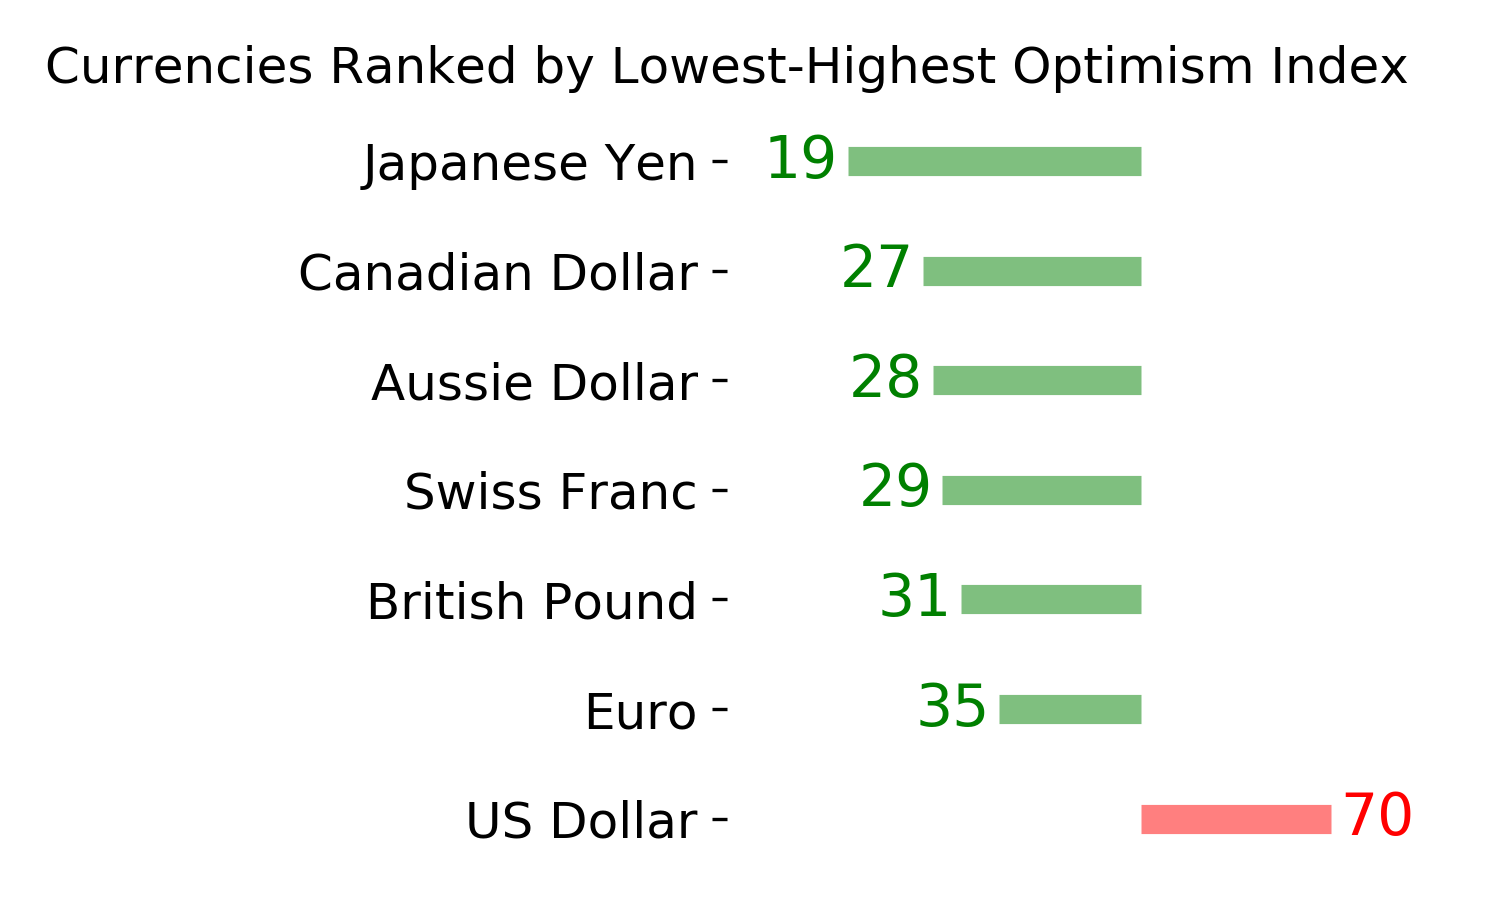
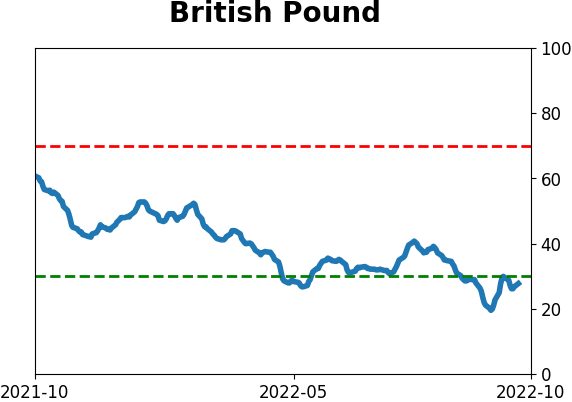
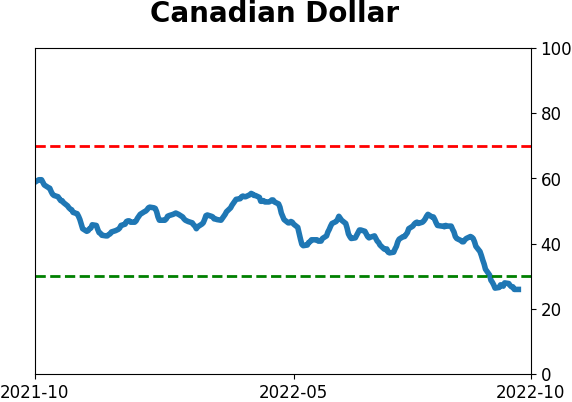
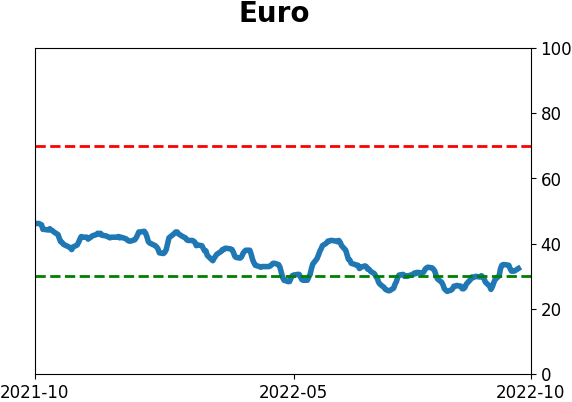
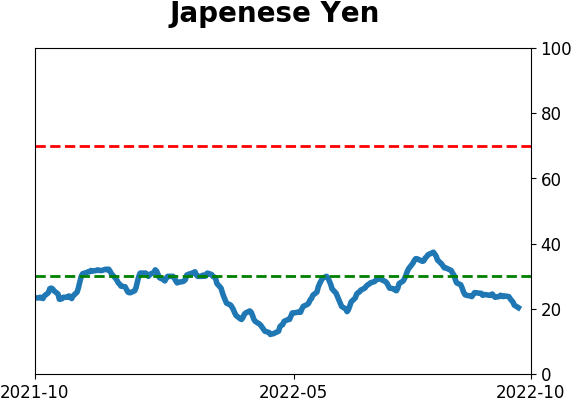
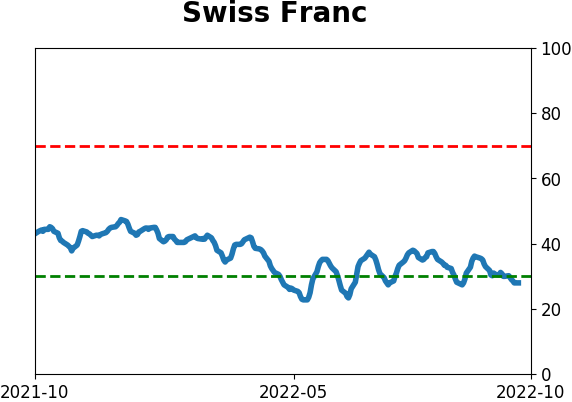
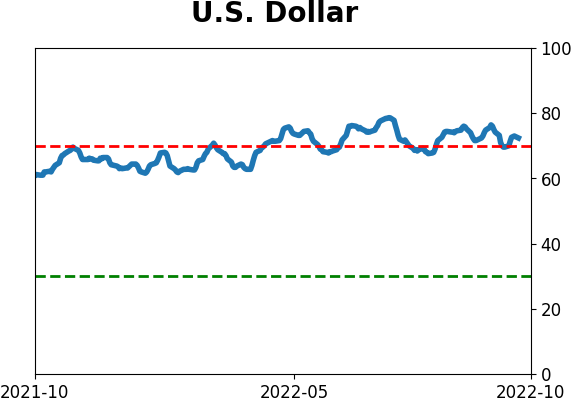
Currency ETF's - 5-Day Moving Average
|
|
|
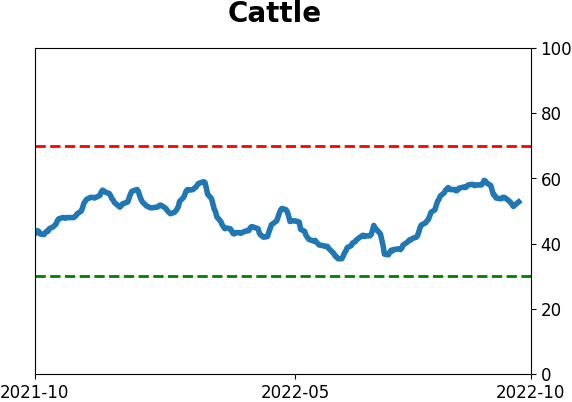
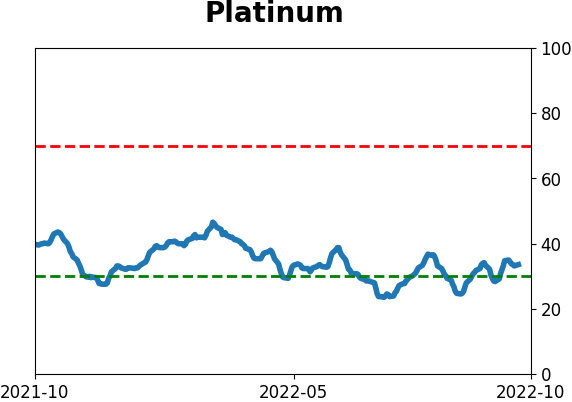
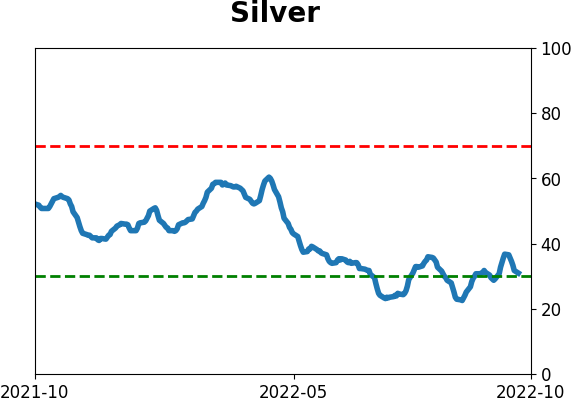
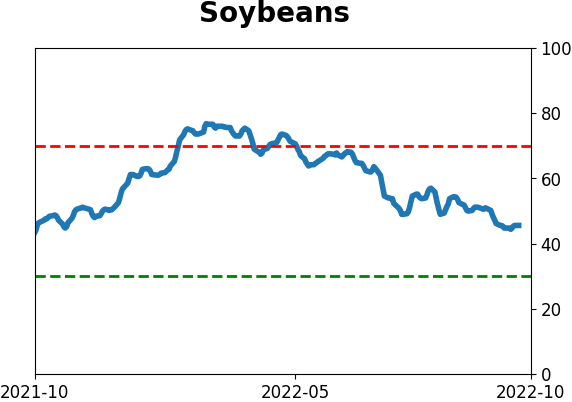
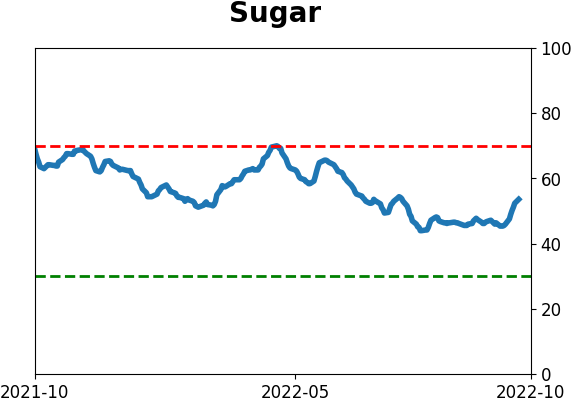
Commodity ETF's - 5-Day Moving Average
|
|