Headlines
|
|
Volatility Spikes as Stocks Gyrate Near Highs:
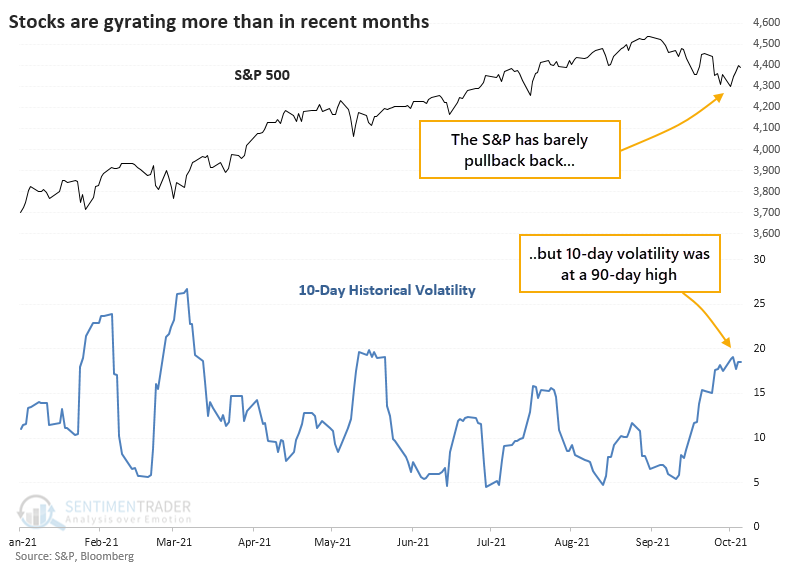
Even though the S&P 500 hasn't suffered much of a pullback, it's the longest one of the year. And the index's volatility over the past 10 days is the highest in 90 days, suggesting the possibility of a new, more volatile, environment.
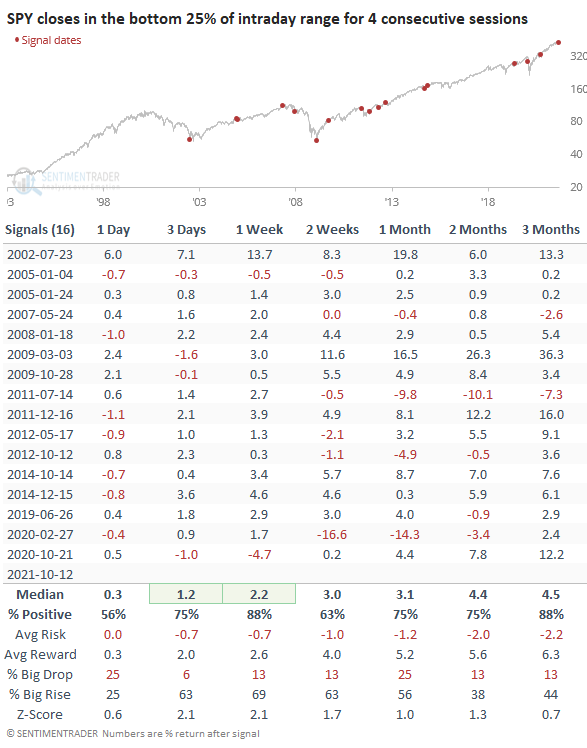
Weak closes: The largest ETF in the U.S., SPY, has closed poorly for the 4th straight day. A streak of 4 consecutive days with a close in the bottom 25% of the intraday range is rare and is tied for the 2nd-longest streak since the fund's inception. It's easy to assume that this is an automatic negative since buyers are obviously not interested and there is potential "smart money" selling into the close. That assumption has not proved out, as 14 out of the 16 signals preceded a bounce over the next week. Two of them did end up leading to large losses, but that was it.
Bottom Line:
STOCKS: Weak buy
The speculative frenzy in February is wrung out. There are some signs of pessimism, but the most compelling data show that buyers consistently tend to return once the first signs of extreme momentum end, especially as we head into a seasonally positive time of year. See the Outlook & Allocations page for more. BONDS: Hold
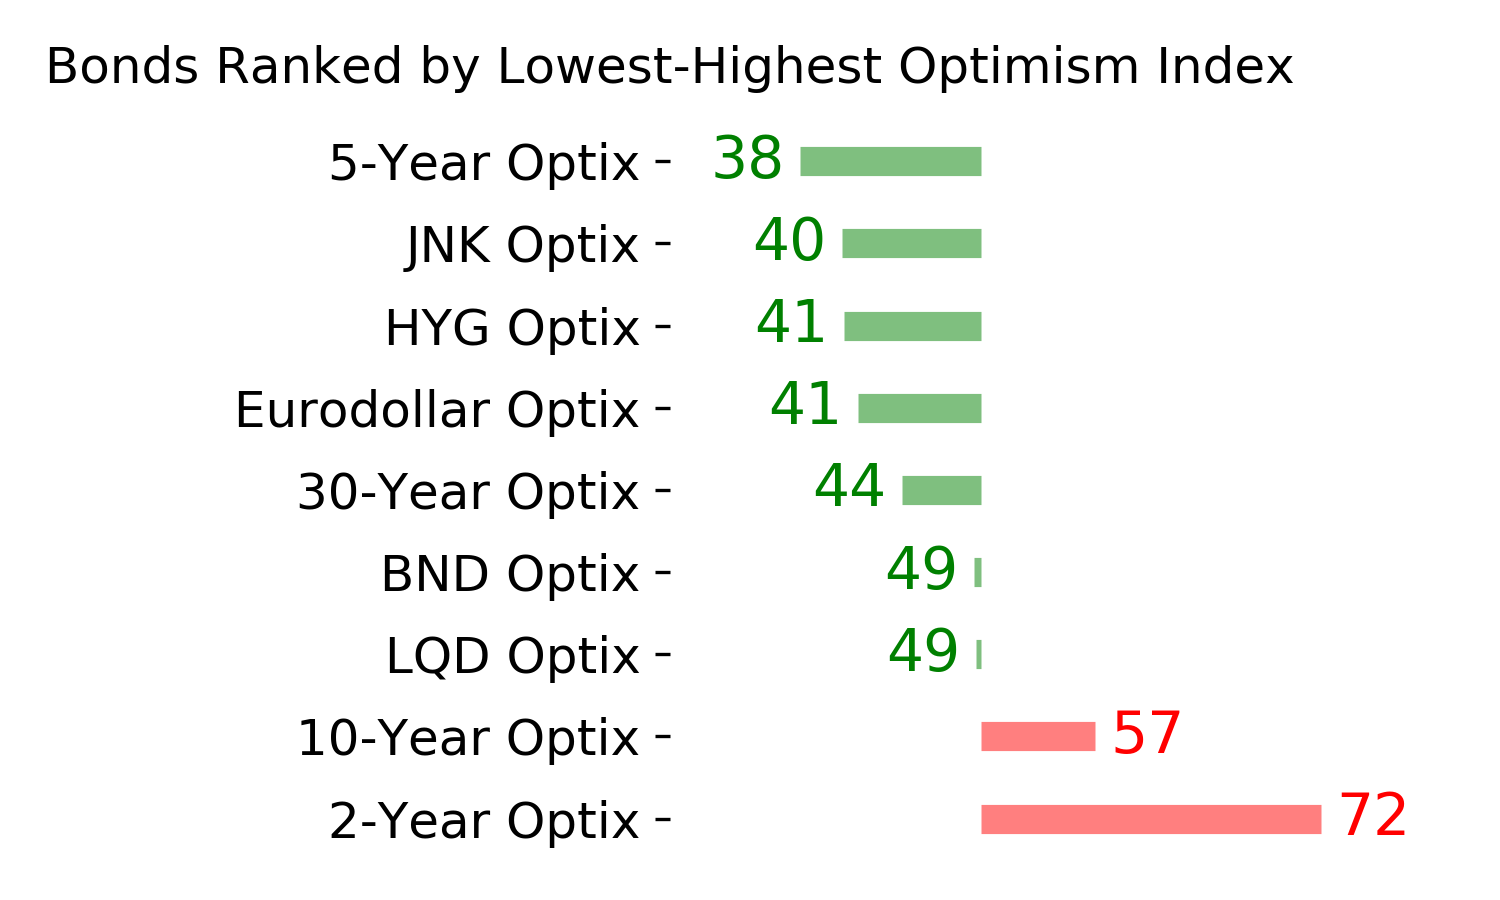
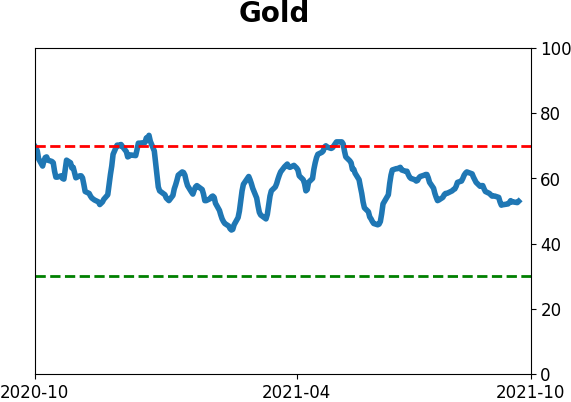
Various parts of the market got hit in March, with the lowest Bond Optimism Index we usually see during healthy environments. Bond prices have modest recovered and there is no edge among the data we follow. GOLD: Hold
Gold and miners were rejected after trying to recover above their 200-day averages in May. Lately, some medium-term (not long-term) oversold extremes in breadth measures among miners have triggered.
|
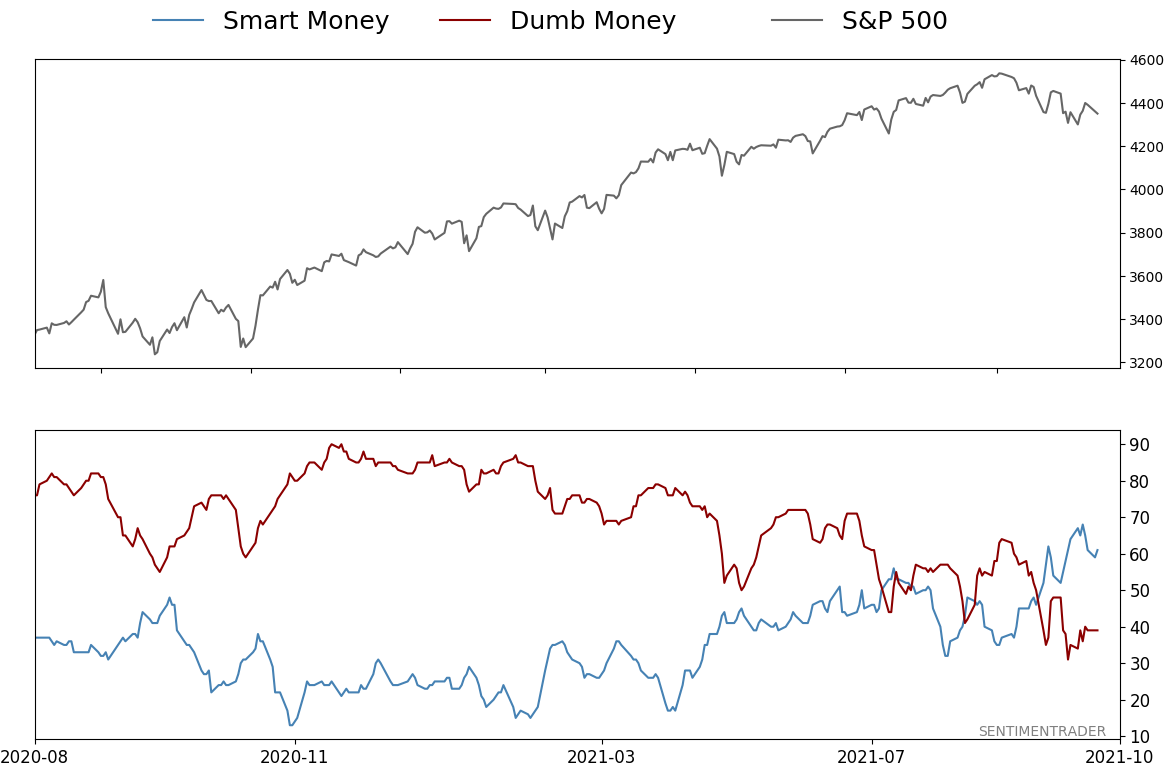
Smart / Dumb Money Confidence
|
Smart Money Confidence: 61%
Dumb Money Confidence: 39%
|
|
Risk Levels
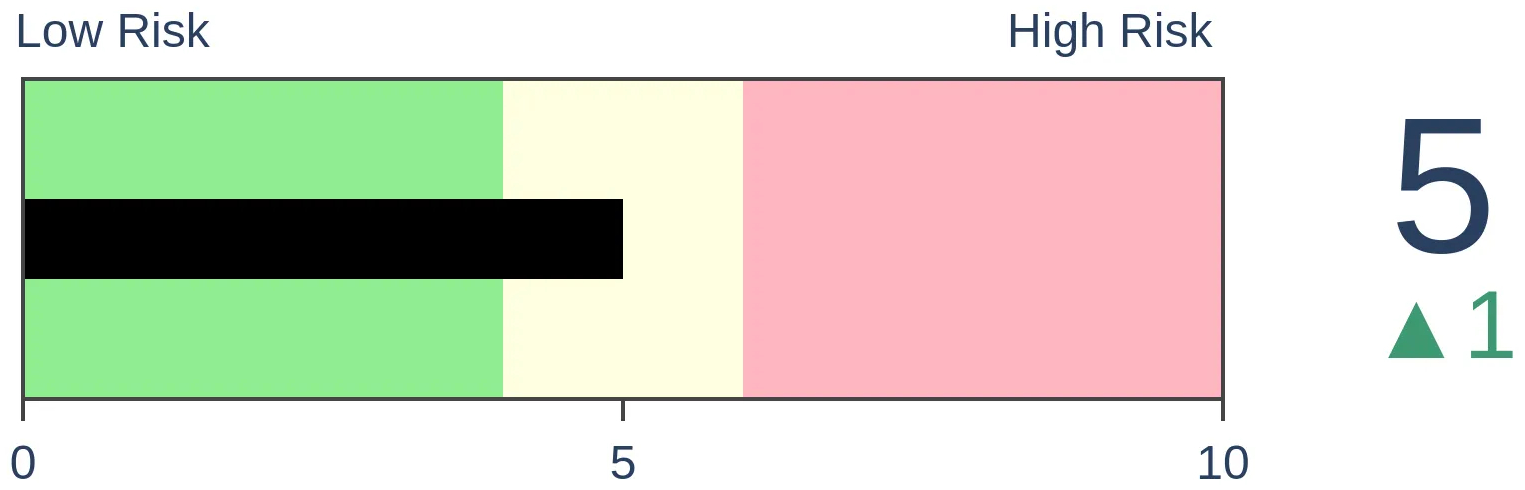
Stocks Short-Term
|
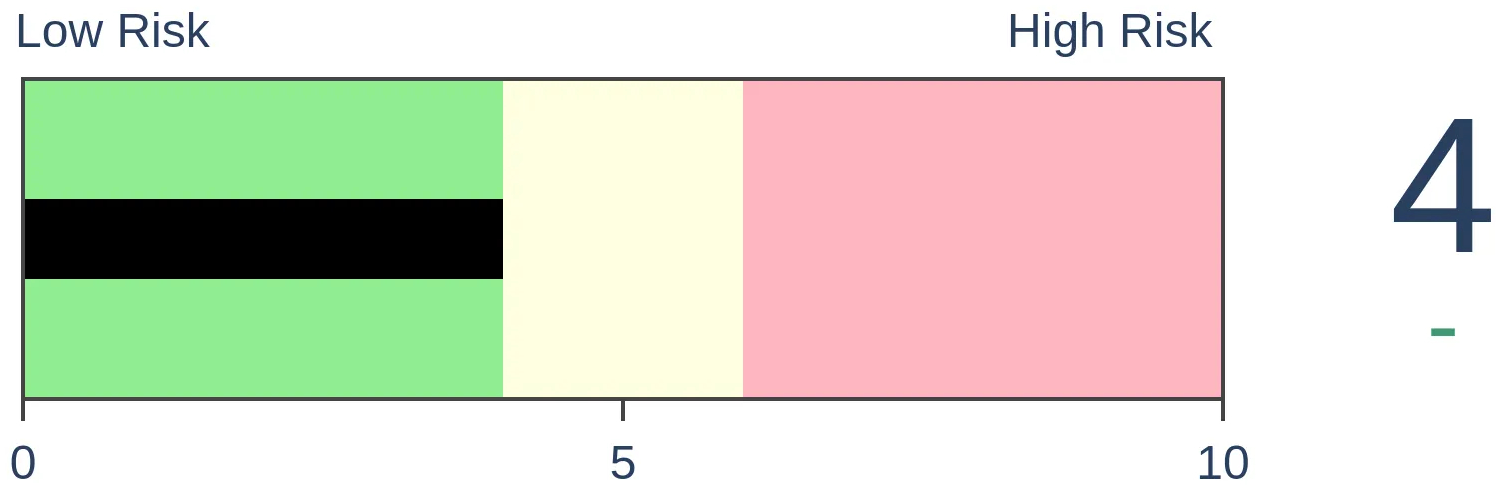
Stocks Medium-Term
|
|
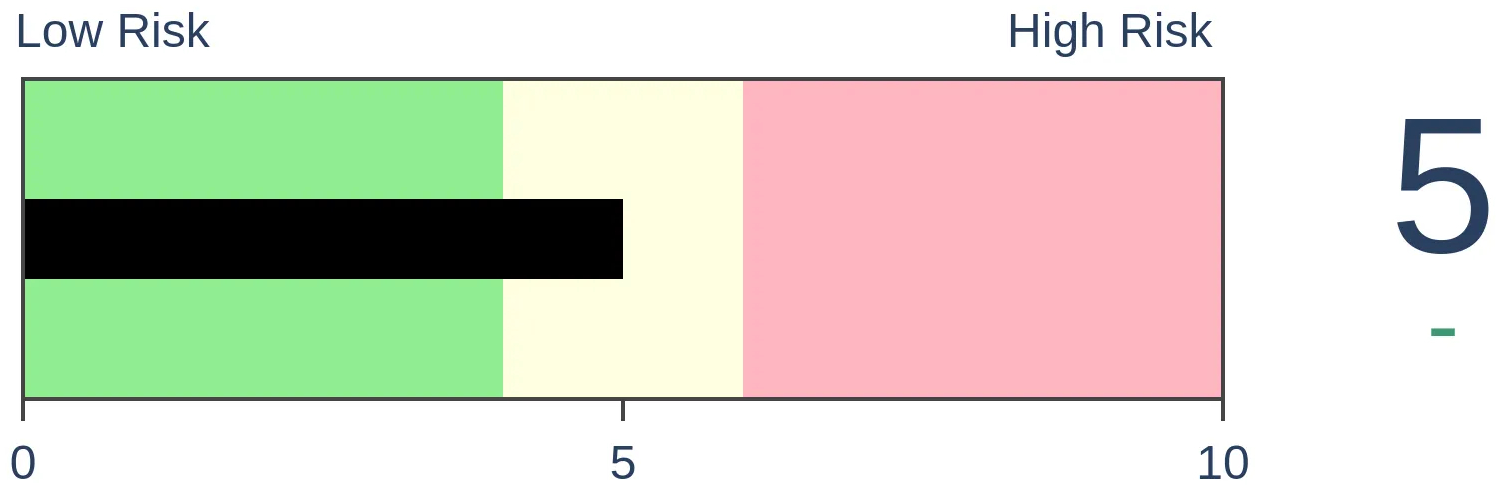
Bonds
|
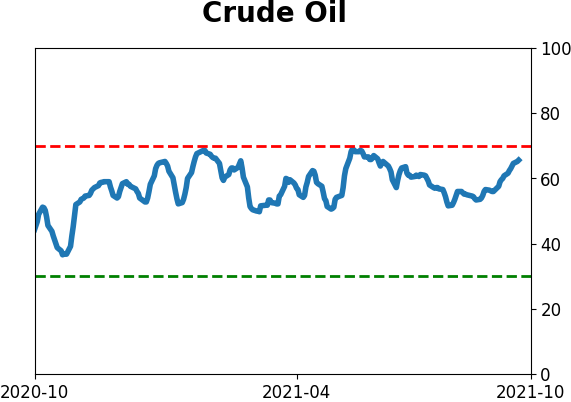
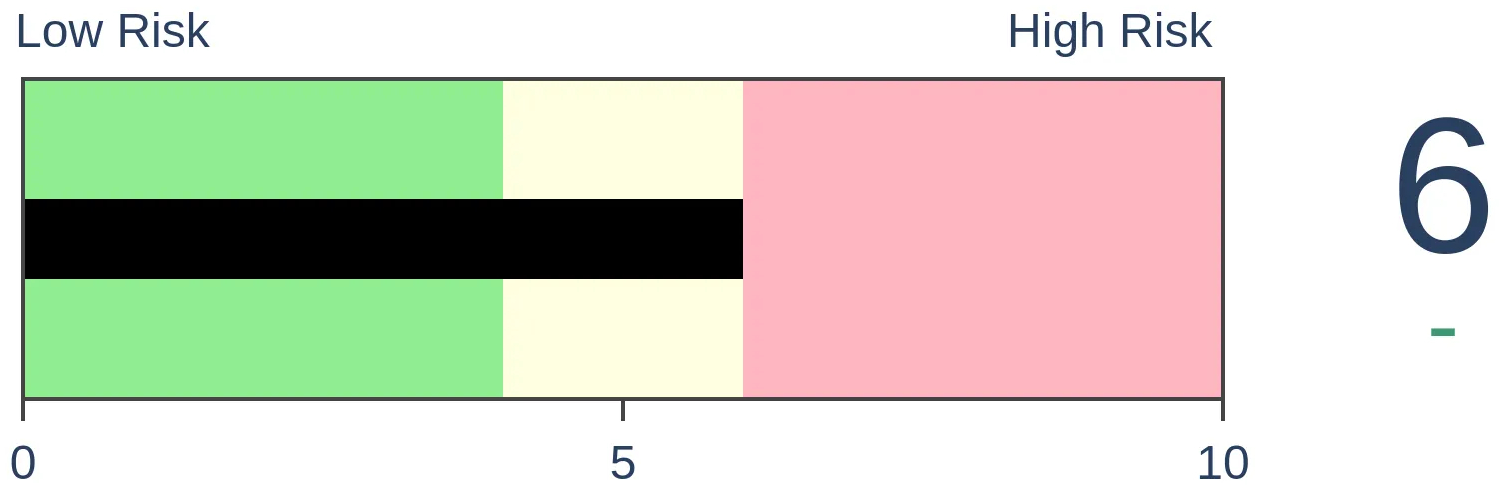
Crude Oil
|
|
Gold

|
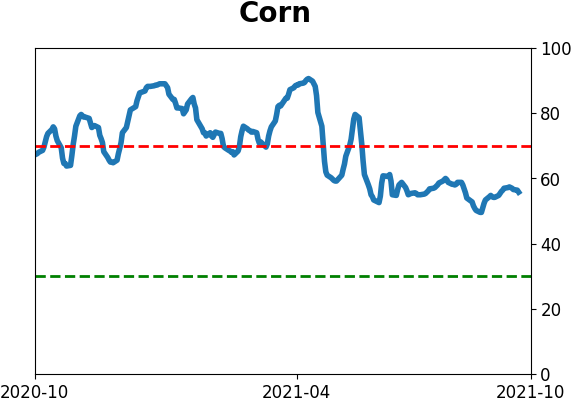
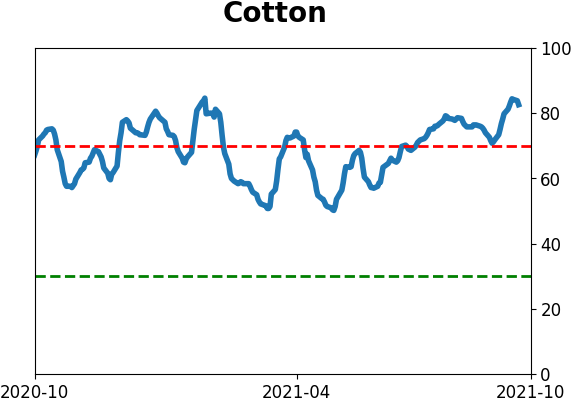
Agriculture

|
|
Research
By Jason Goepfert
BOTTOM LINE
Even though the S&P 500 hasn't suffered much of a pullback, it's the longest one of the year. And the index's volatility over the past 10 days is the highest in 90 days, suggesting the possibility of a new, more volatile, environment.
FORECAST / TIMEFRAME
None
|
For those who were indoctrinated on technical analysis textbooks, we were taught that when stocks turn volatile during a bull market, then trouble is brewing.
Unfortunately, much of what passes for knowledge in that community is based on pretty pictures, unfounded heuristics, and cherry-picked examples. Almost nothing in the entire canon is consistently predictive.
The idea that it's bearish to see volatility after stocks make a big run is yet another one of those incorrect assumptions.
It's an issue now because the S&P 500 is mired in its longest pullback in a year. Despite a relatively shallow pullback, though, the index has been gyrating wildly, with over a week of days with 1% daily moves. That has pushed the index's 10-day realized volatility to a 90-day high.
Instead of reading tea leaves, let's look at the evidence. The table below shows every time when the S&P was within 30 days of a multi-year high, no more than 5% from its peak, and yet its 10-day volatility rose to a 90-day high.
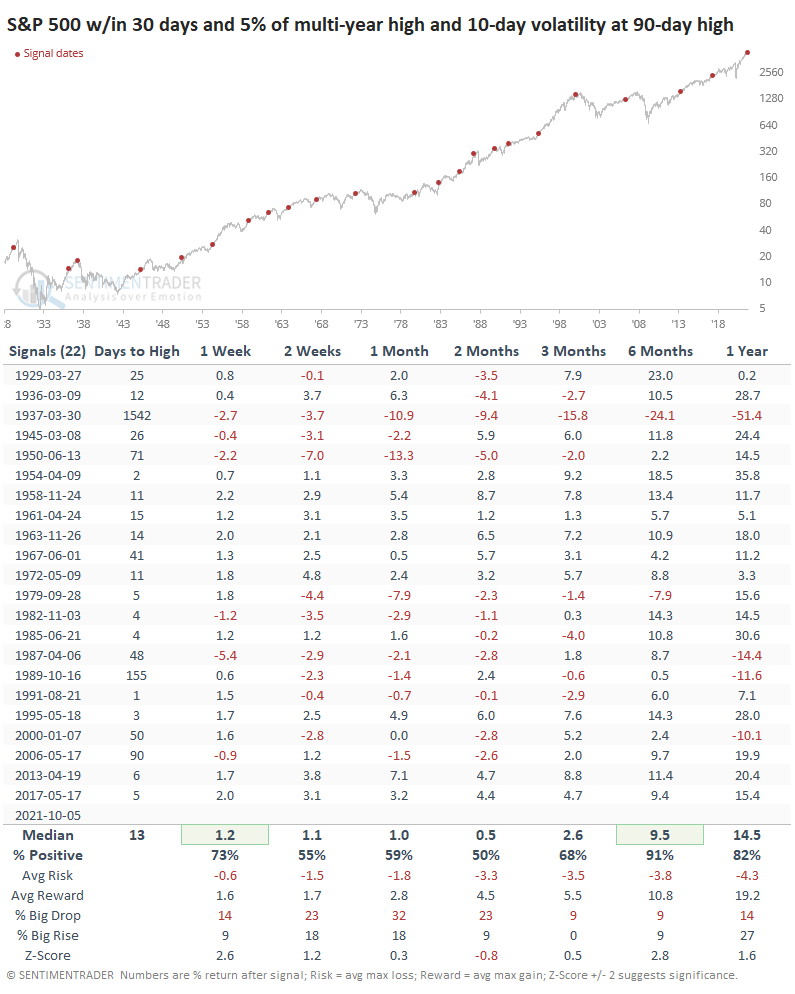
To be fair, the S&P's returns over the next two months were nothing special. It showed a positive return only half the time, with a median return well below random. But that was about it for the bearish side of things.
Over the next six months, the index rose after 20 out of 22 signals. More specifically, only one of the signals preceded an imminent bear market, which is what this heightened volatility was supposed to tip us off to. Granted, several of the other signals ultimately led to a protracted decline, but they were months if not years away.
On average, it took 13 trading days until the S&P recorded its next multi-year high. Out of the 22 signals, only 2 of them took longer than 90 days and 15 of them took fewer than 30 days.
As we head into earnings season, the uptick in volatility may be the tipping point before we finally suffer through an honest-to-goodness correction. We try hard to deal in probabilities instead of possibilities, though, and based solely on the rise in volatility, it's not a good reason in and of itself to batten the hatches just yet.
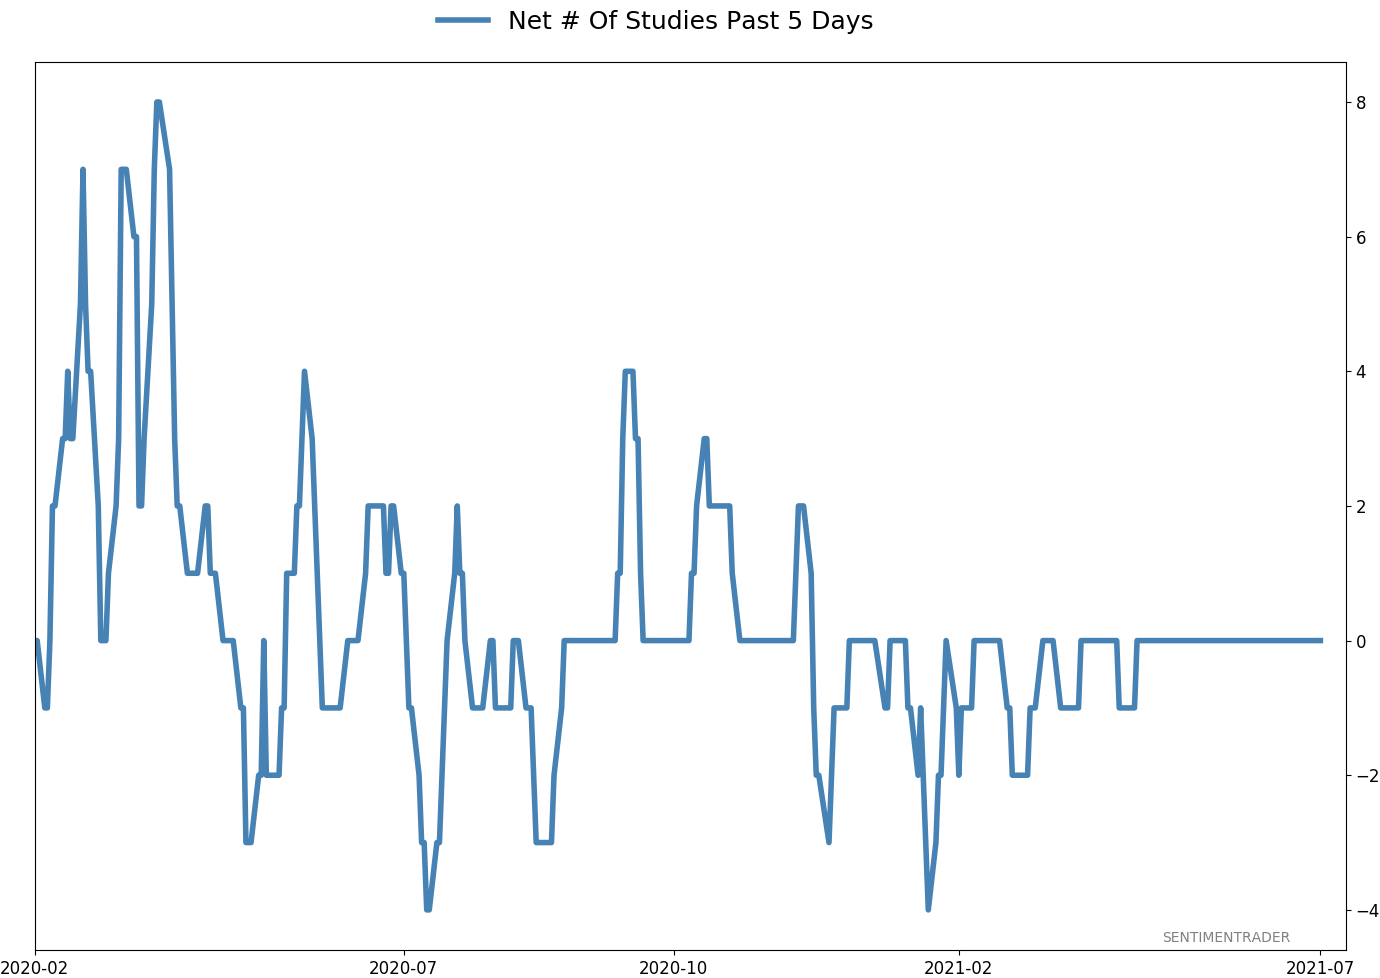
Active Studies
| Time Frame | Bullish | Bearish | | Short-Term | 0 | 0 | | Medium-Term | 7 | 0 | | Long-Term | 11 | 5 |
|
Indicators at Extremes
Portfolio
| Position | Description | Weight % | Added / Reduced | Date | | Stocks | RSP | 10.5 | Added 6.4% | 2021-10-01 | | Bonds | 23.9% BND, 6.9% SCHP | 31.5 | Reduced 7.1% | 2021-05-19 | | Commodities | GCC | 2.6 | Reduced 2.1%
| 2020-09-04 | | Precious Metals | GDX | 4.2 | Reduced 4.2% | 2021-05-19 | | Special Situations | 9.8% KWEB, 4.7% XLE, 2.9% PSCE | 17.3 | Added 9.78% | 2021-10-01 | | Cash | | 34.0 | | |
|
Updates (Changes made today are underlined)
Much of our momentum and trend work has remained positive for several months, with some scattered exceptions. Almost all sentiment-related work has shown a poor risk/reward ratio for stocks, especially as speculation drove to record highs in exuberance in February. Much of that has worn off, and most of our models are back toward neutral levels. There isn't much to be excited about here. The same goes for bonds and even gold. Gold has been performing well lately and is back above long-term trend lines. The issue is that it has a poor record of holding onto gains when attempting a long-term trend change like this, so we'll take a wait-and-see approach. Momentum has ebbed quickly in recent weeks, and nearing oversold levels in some indicators. This can be a dangerous area, with a lot of short-term volatility, but we'd be more inclined to add medium- to long-term exposure rather than sell on much more of a decline, thanks to already rock-bottom exposure. Other areas look more attractive, including some overseas markets. RETURN YTD: 9.9% 2020: 8.1%, 2019: 12.6%, 2018: 0.6%, 2017: 3.8%, 2016: 17.1%, 2015: 9.2%, 2014: 14.5%, 2013: 2.2%, 2012: 10.8%, 2011: 16.5%, 2010: 15.3%, 2009: 23.9%, 2008: 16.2%, 2007: 7.8%
|
|
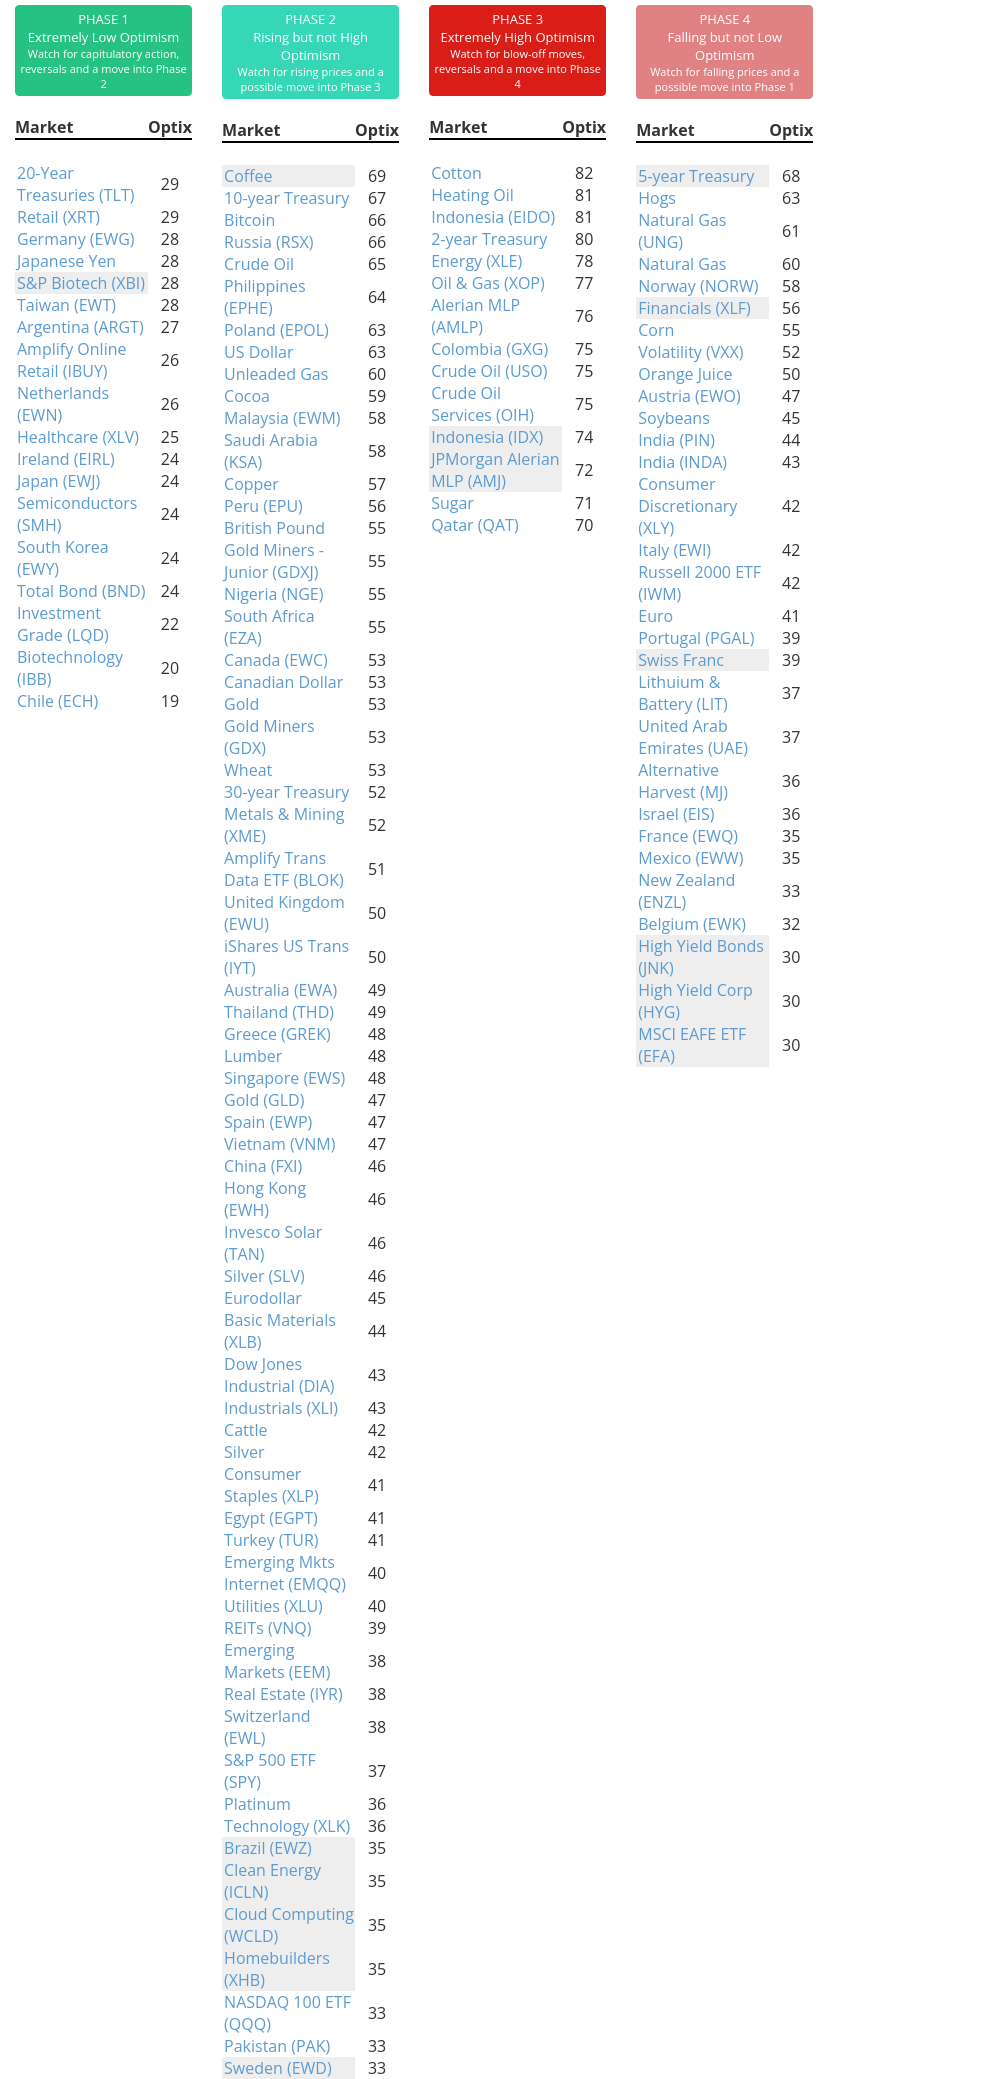
Phase Table
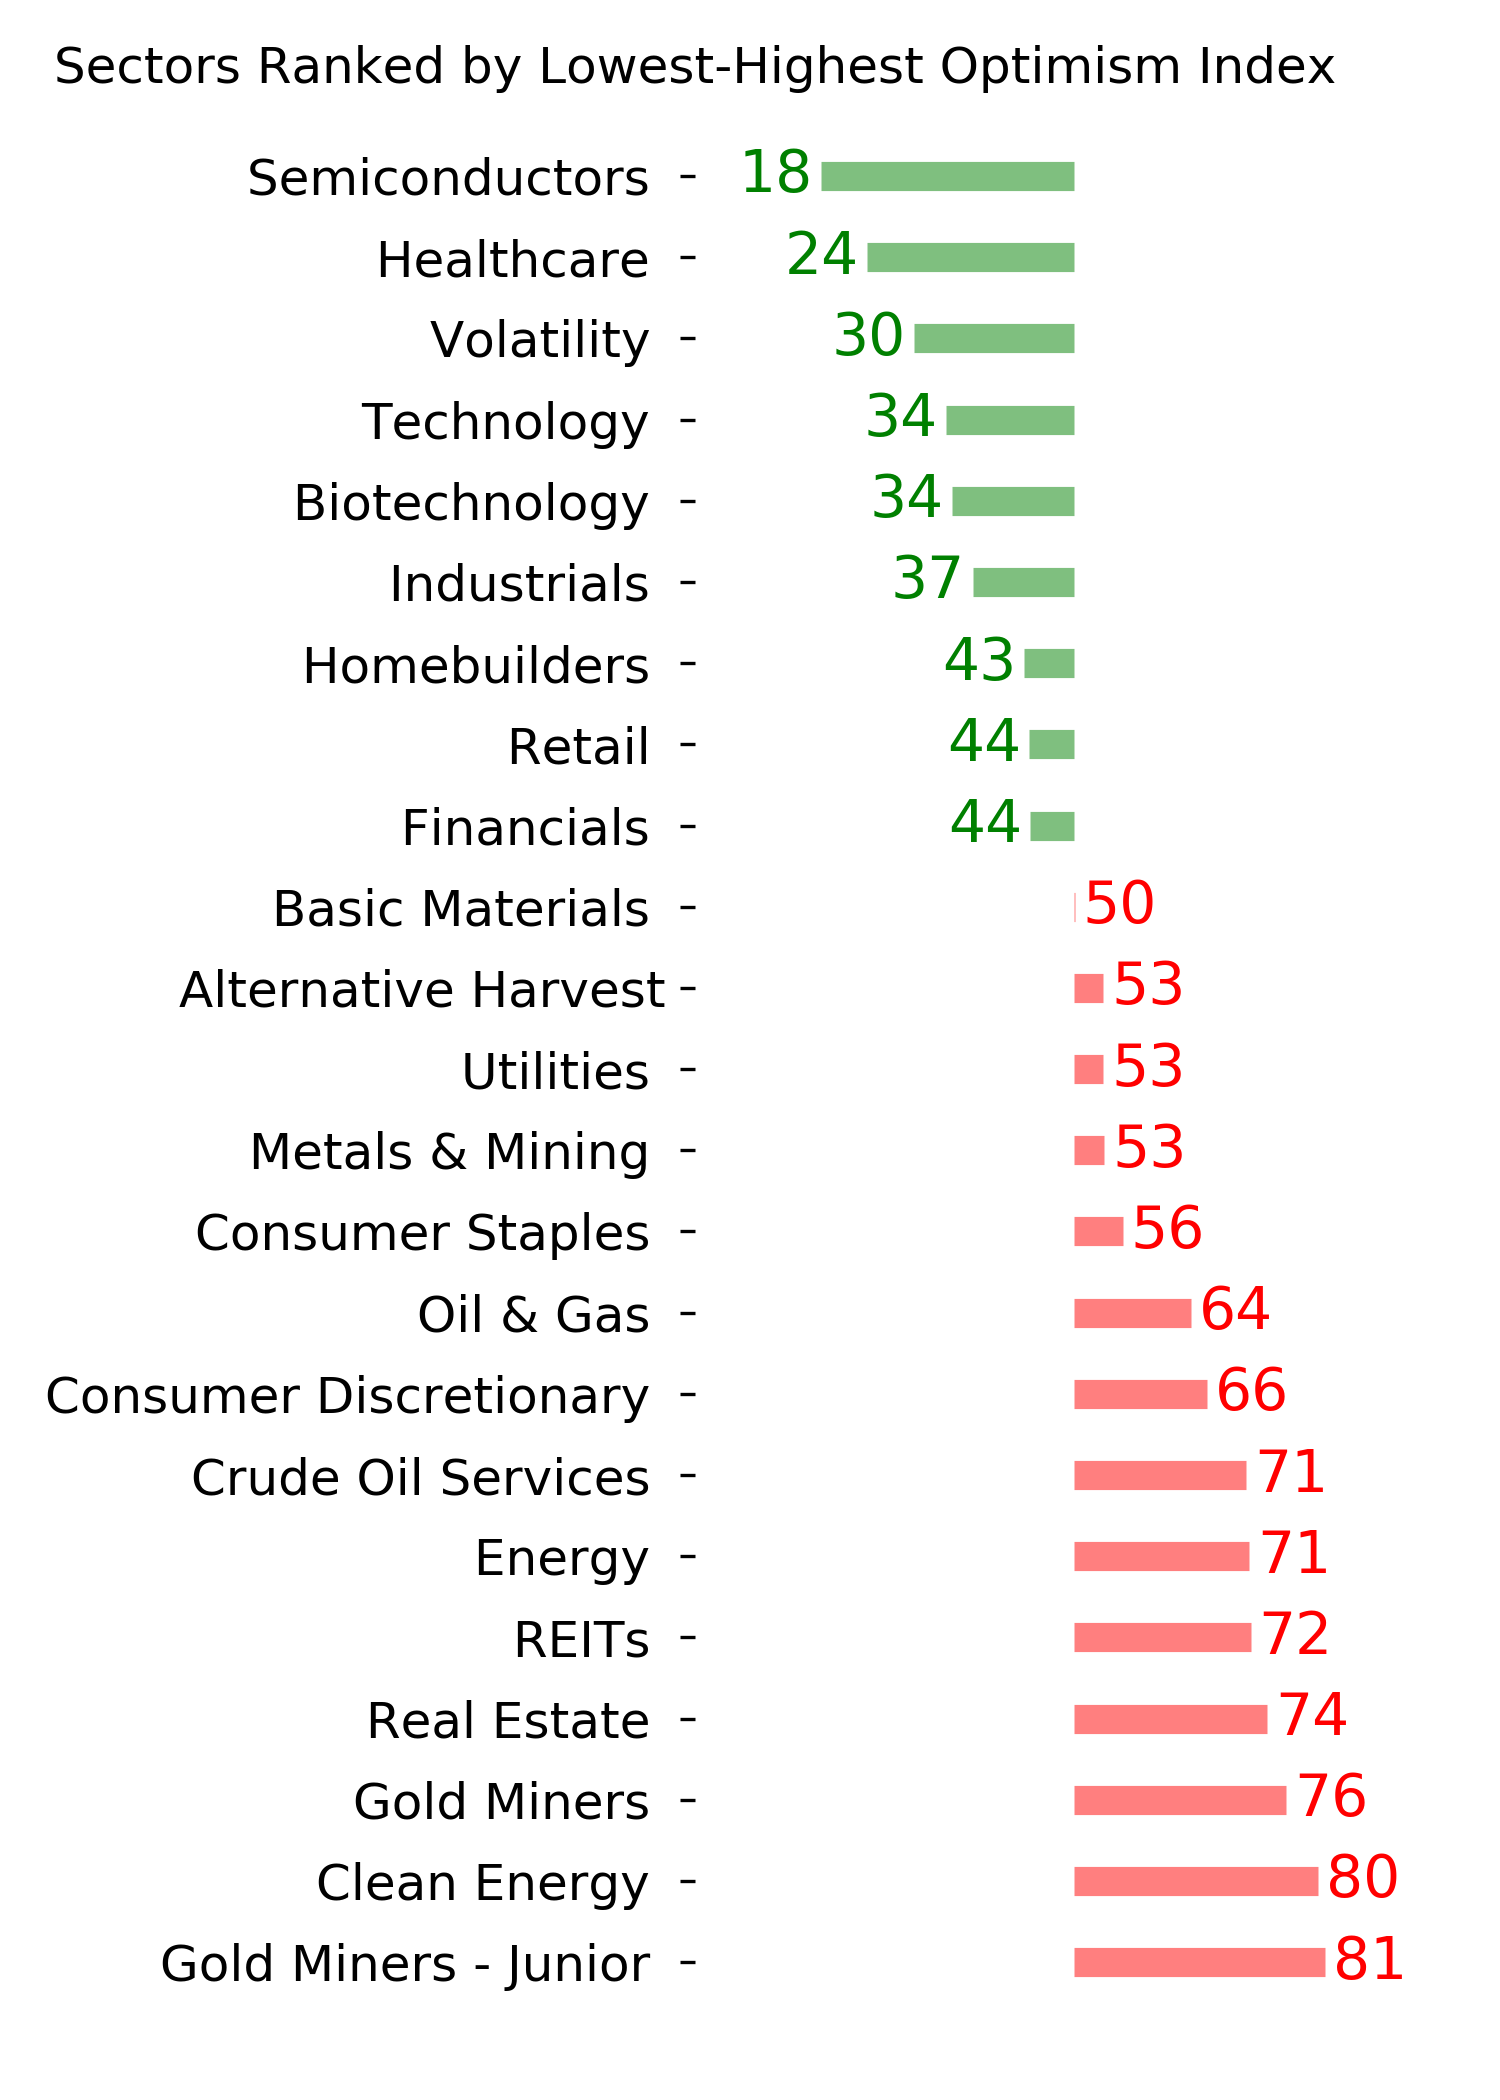
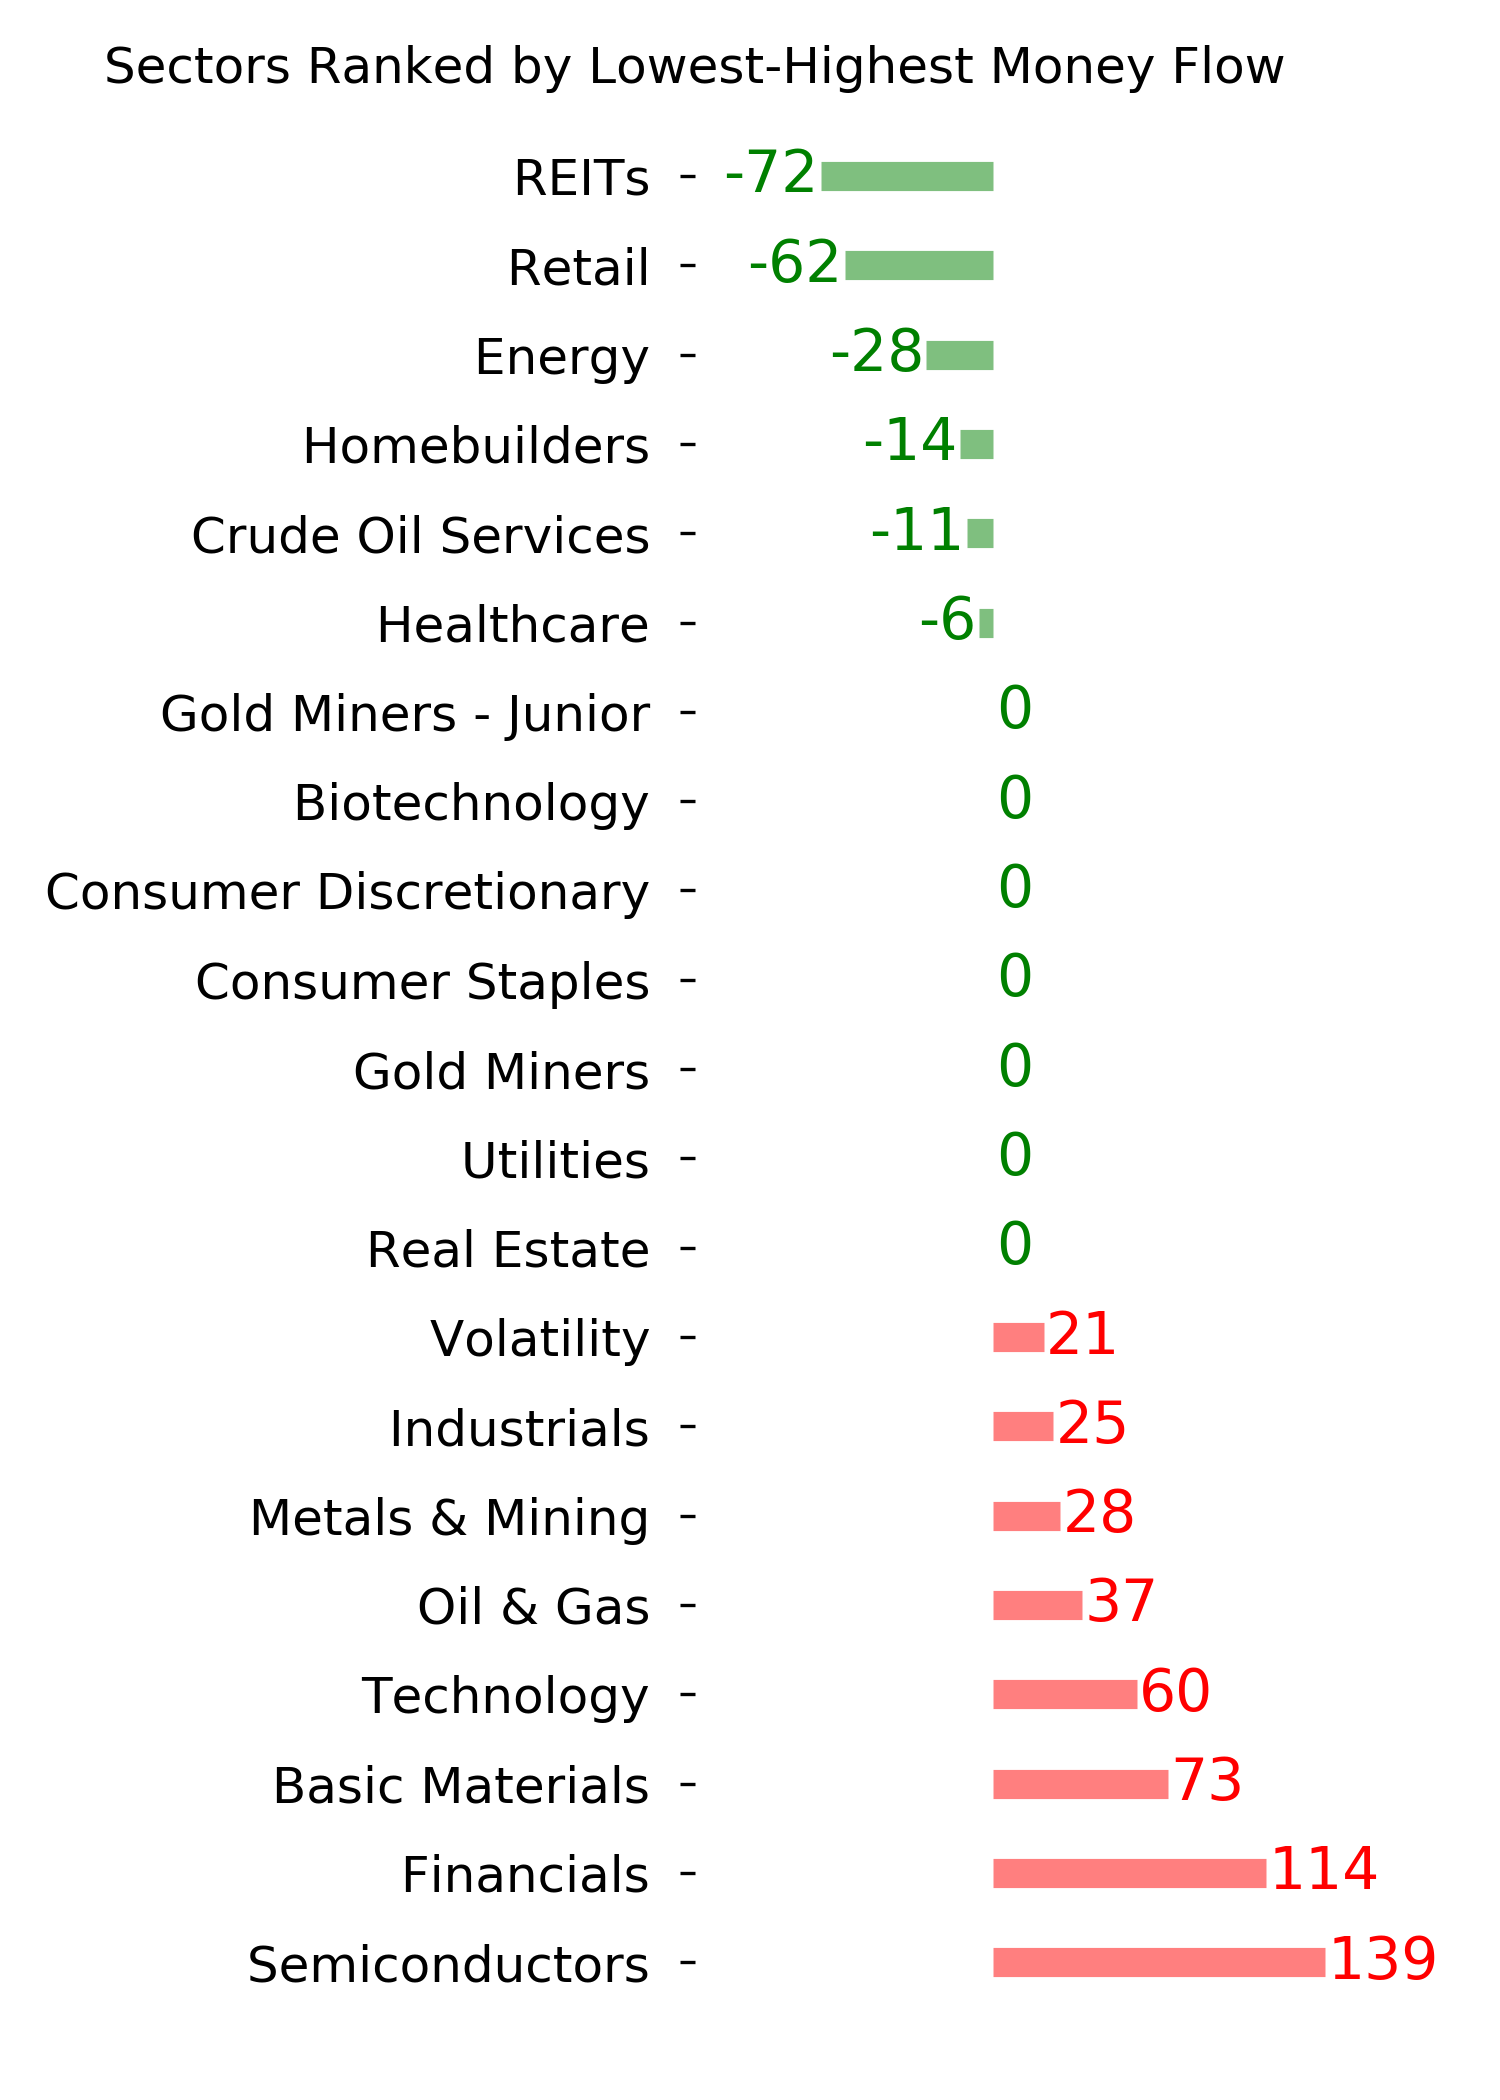
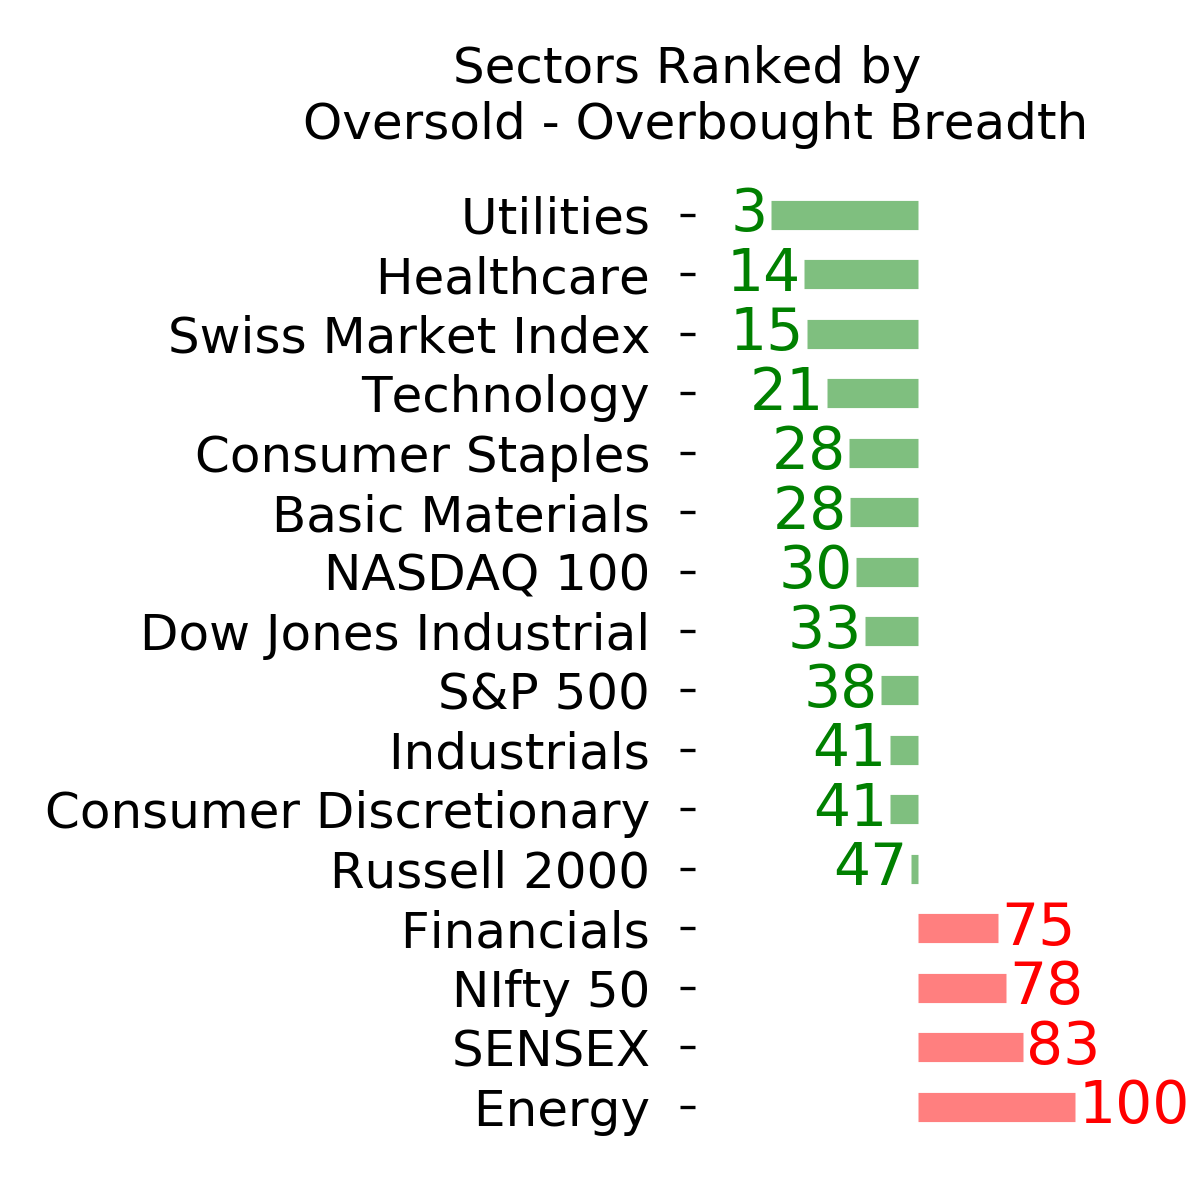
Ranks
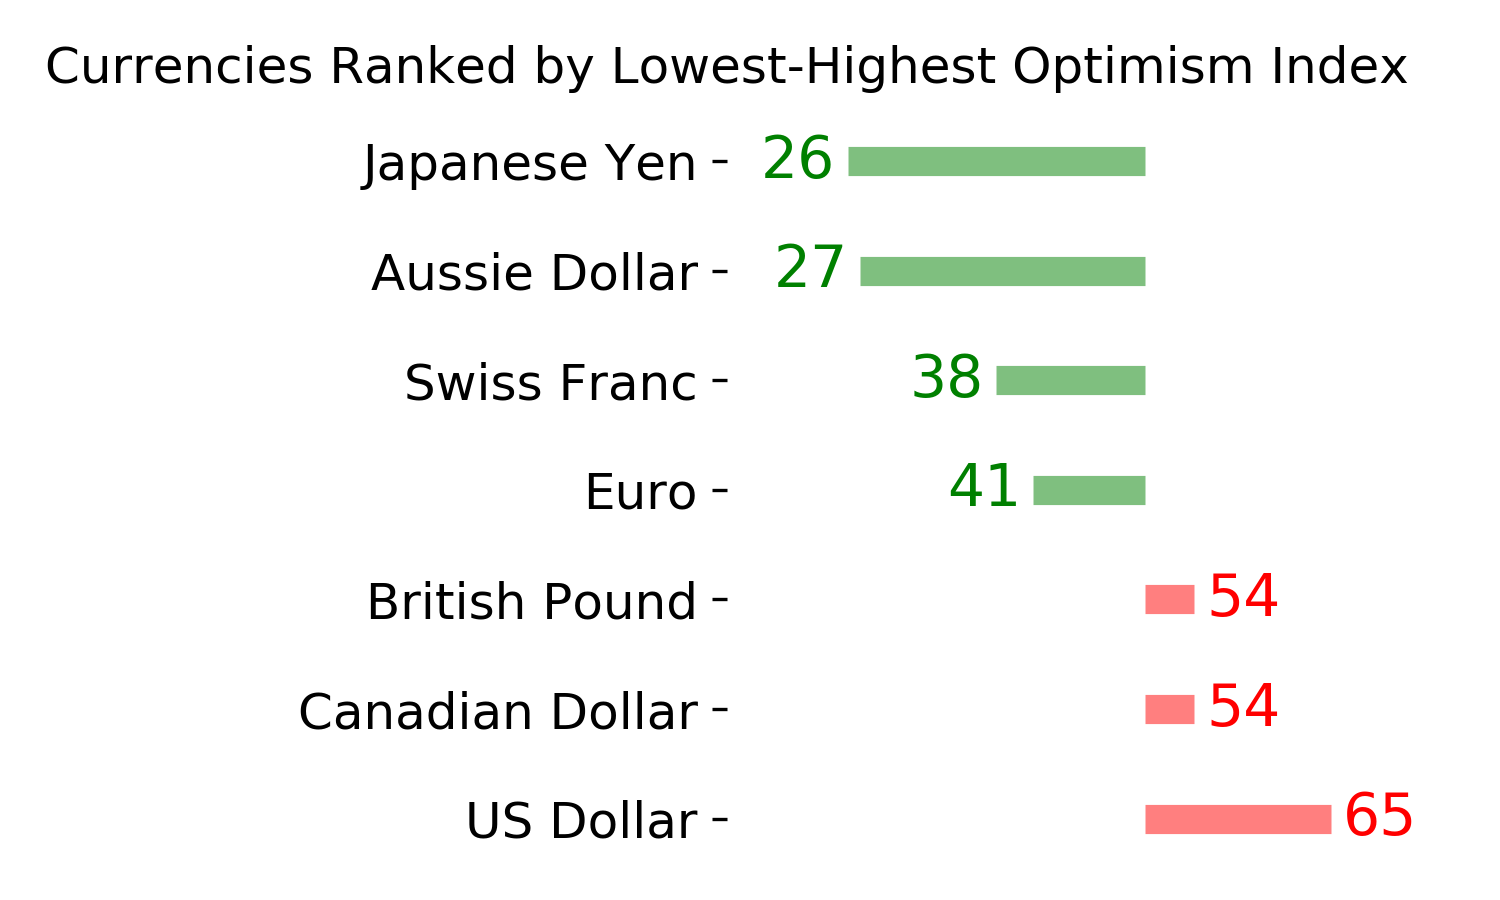
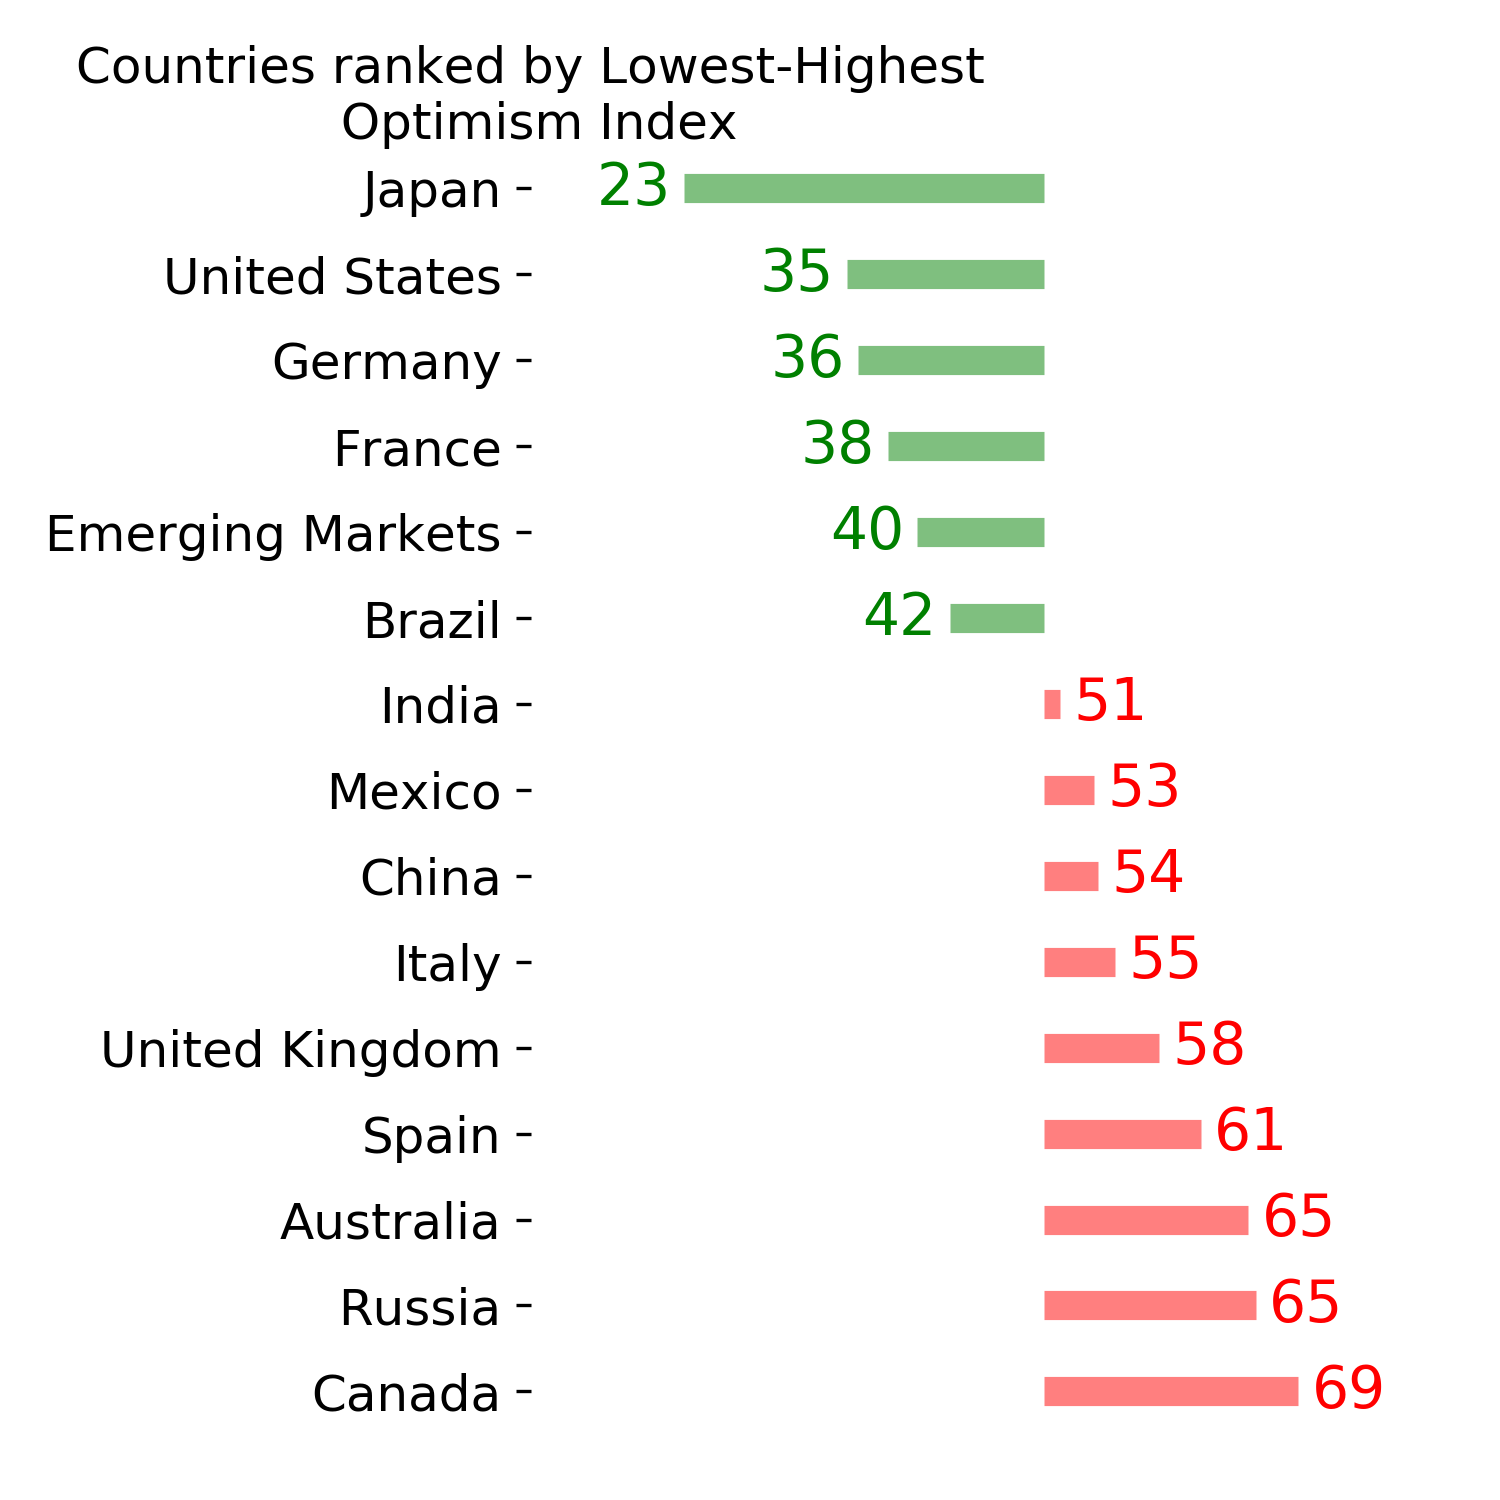
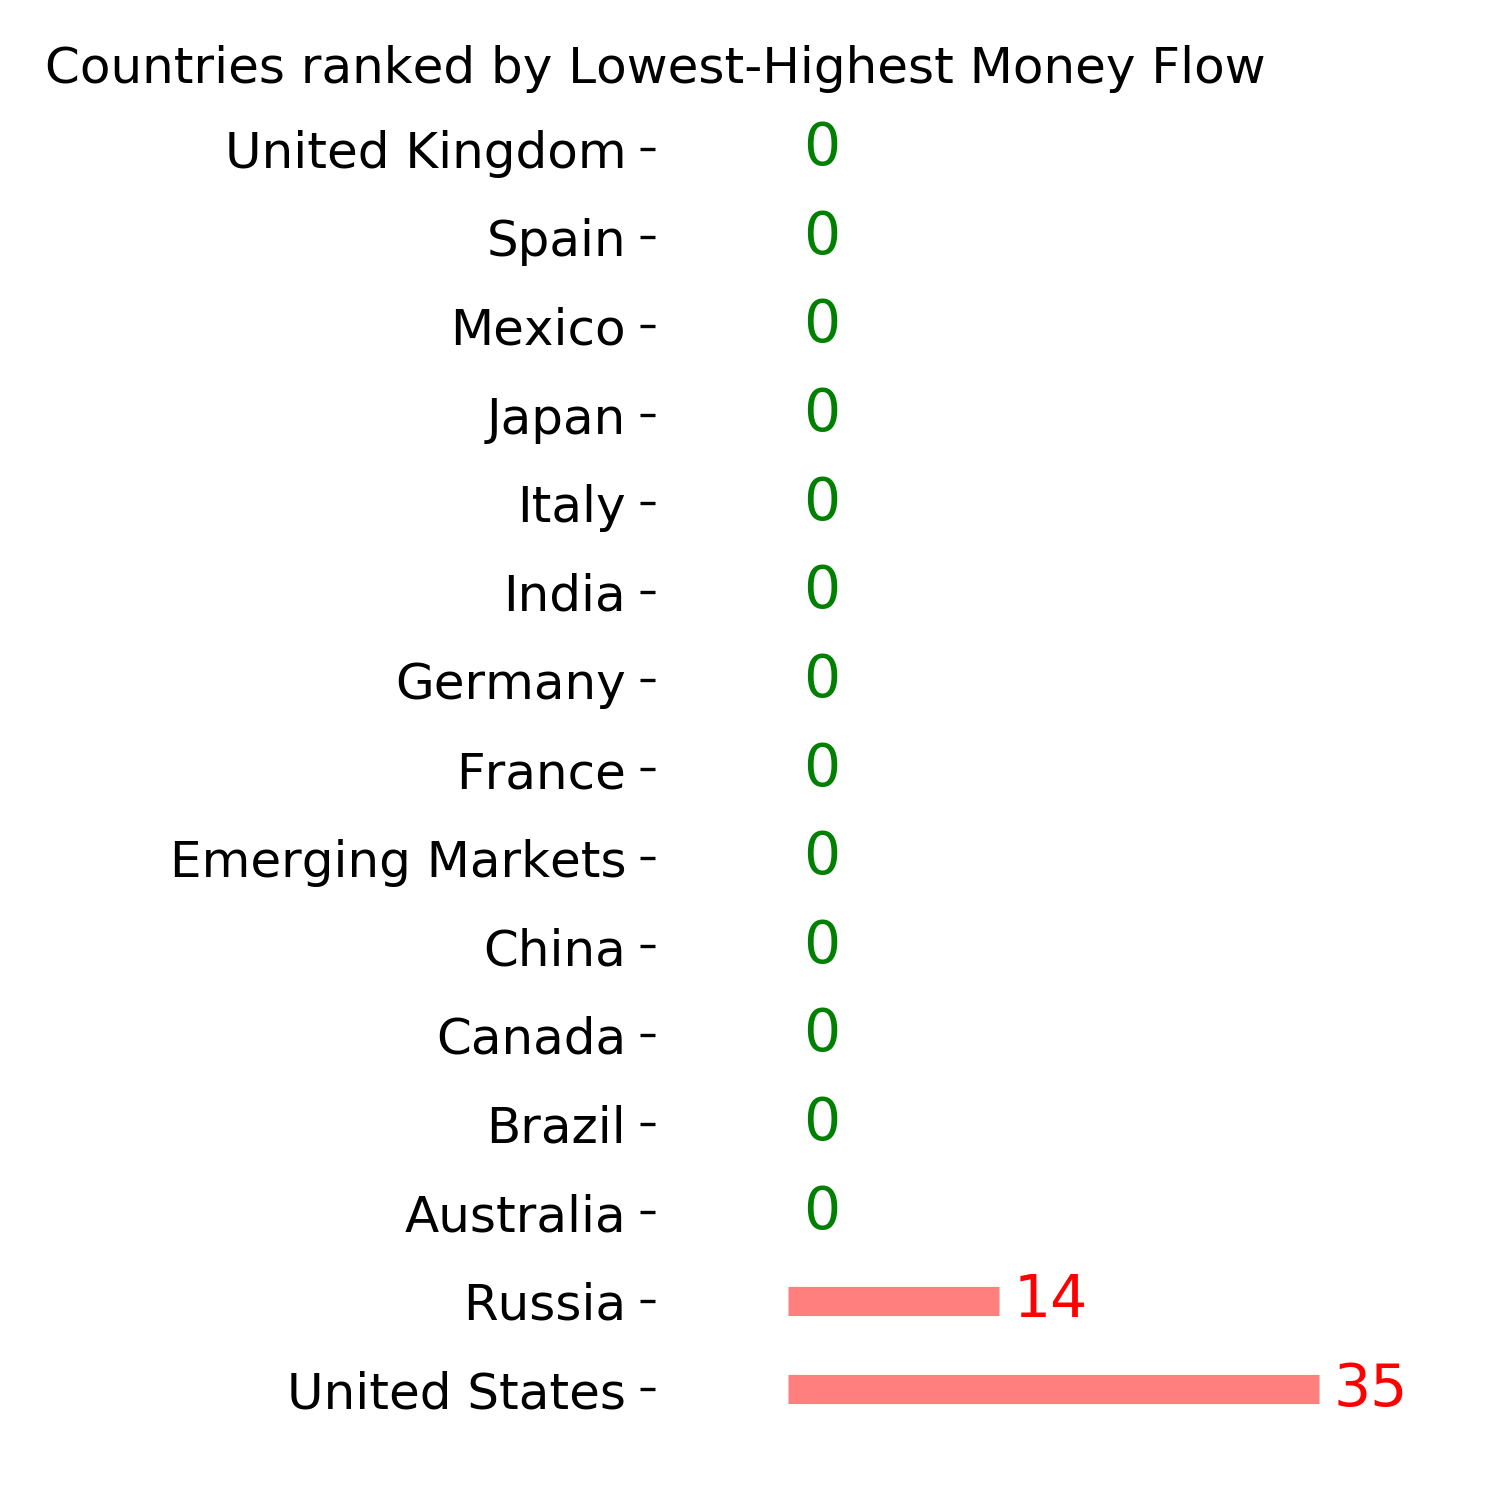
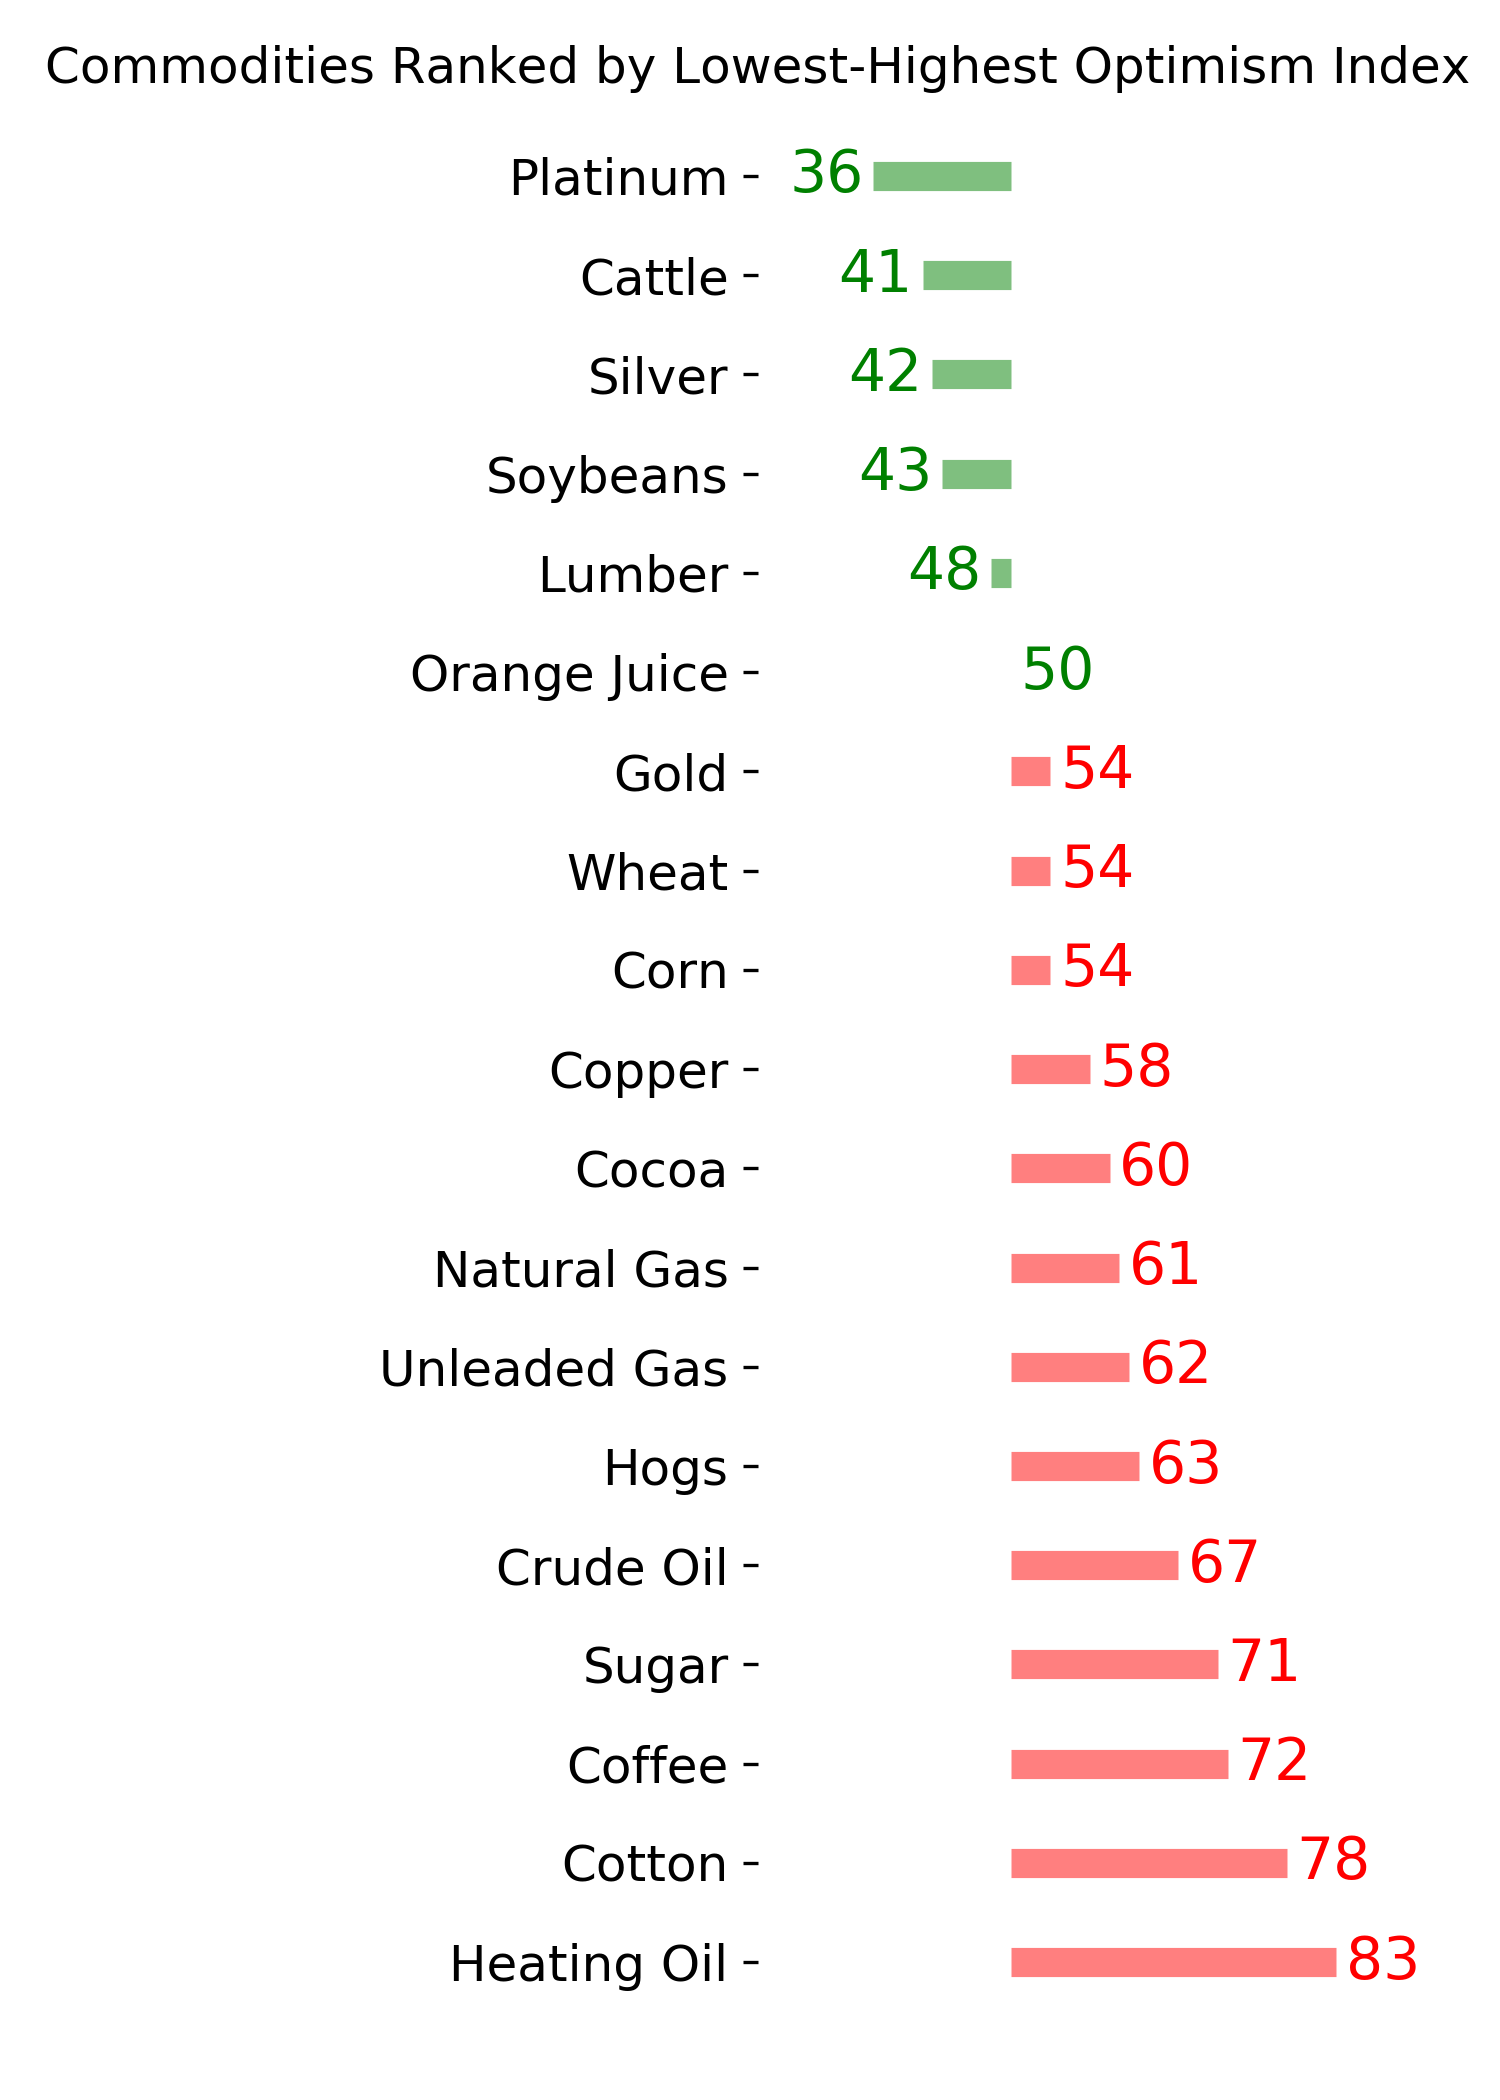
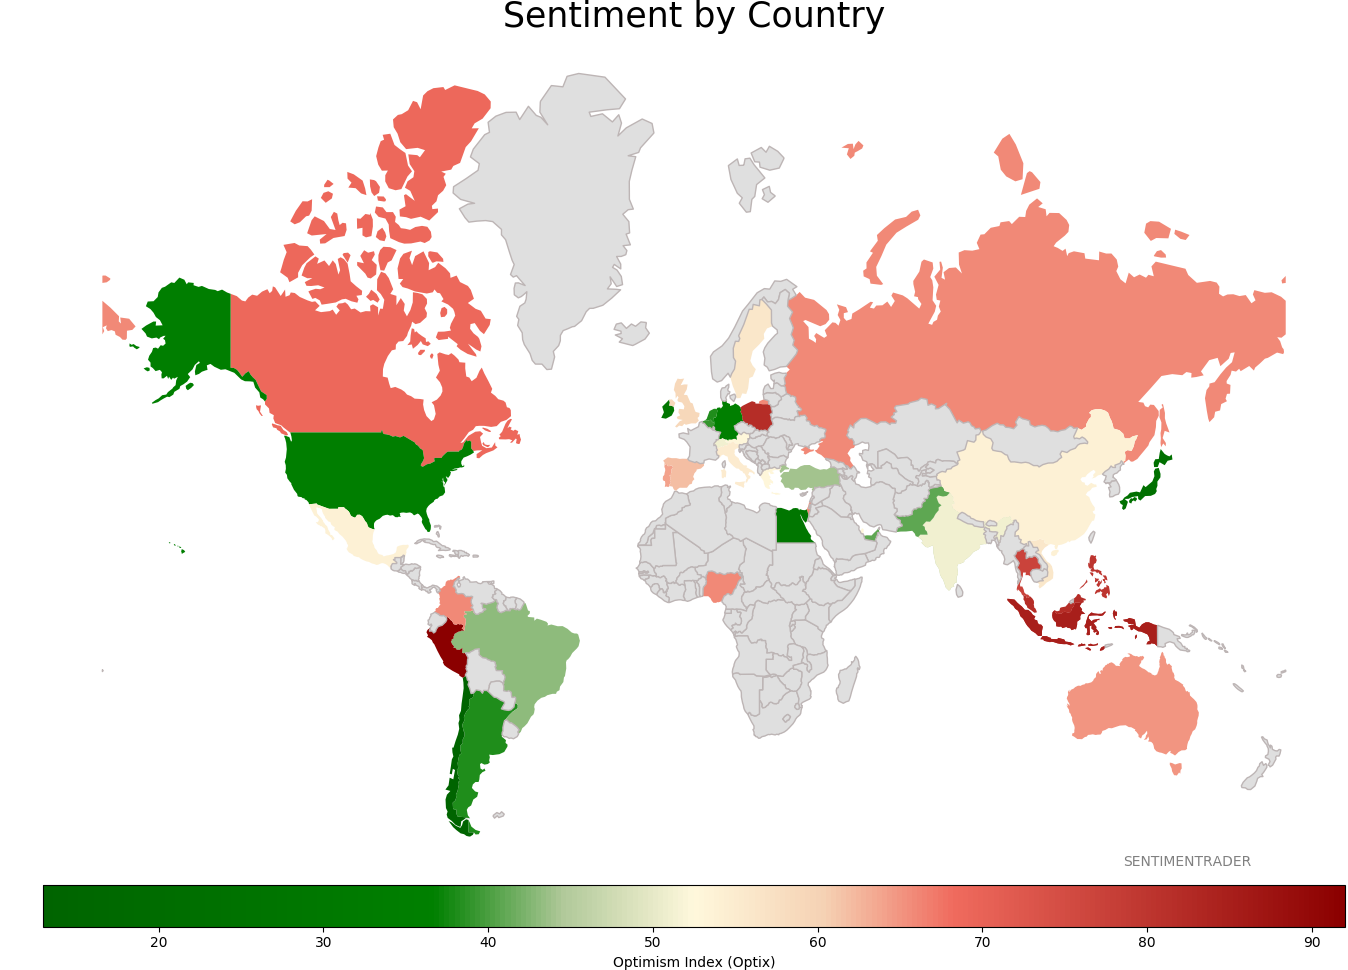
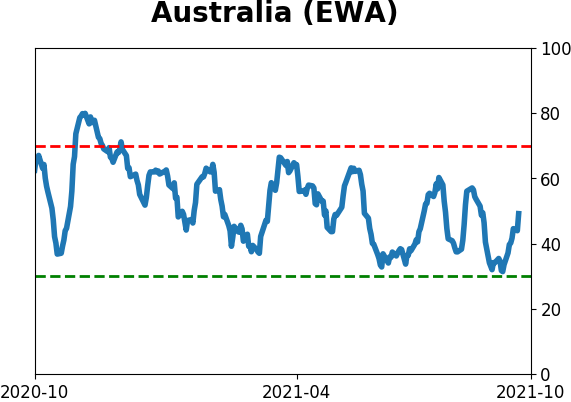
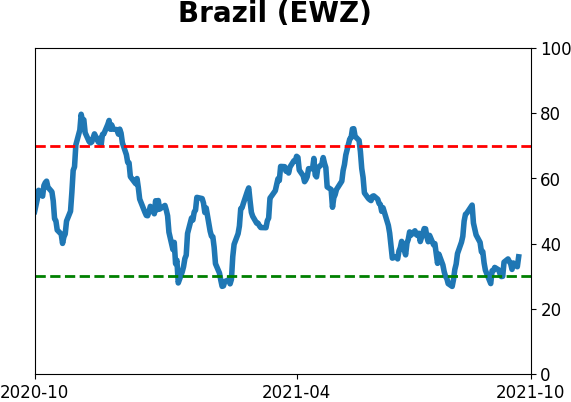
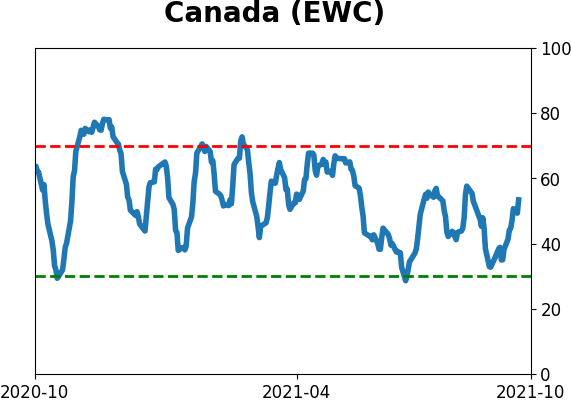
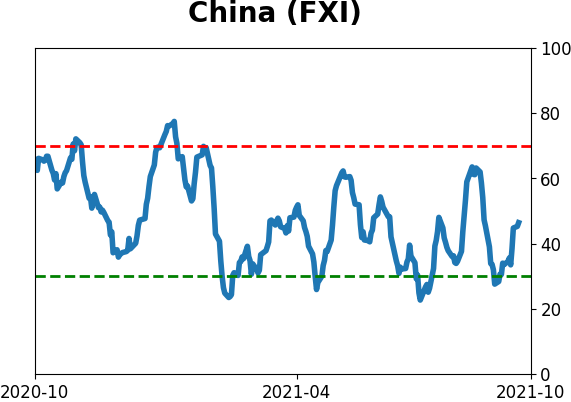
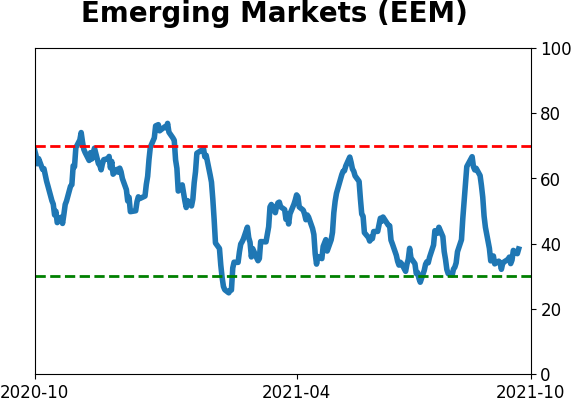
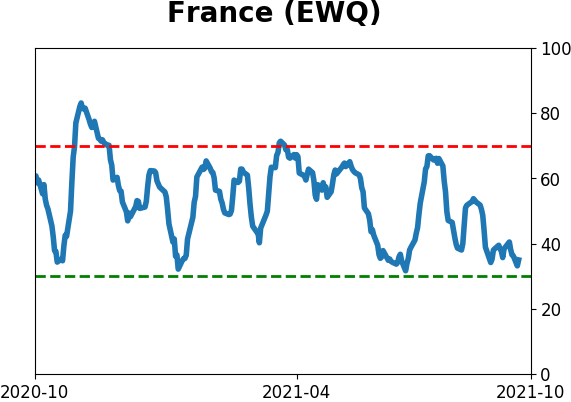
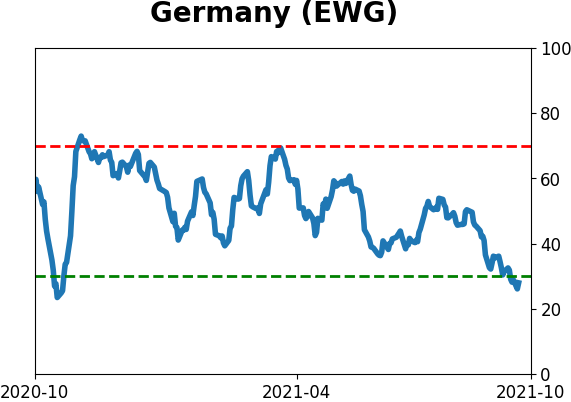
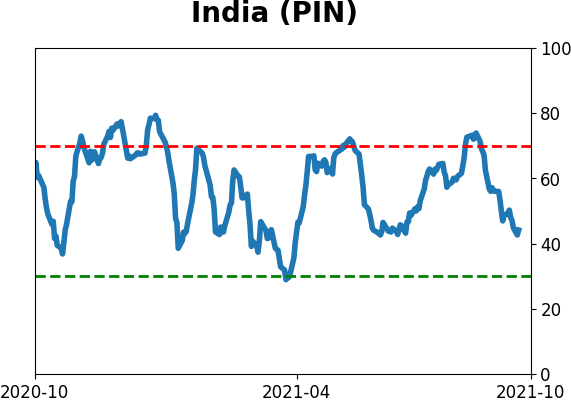
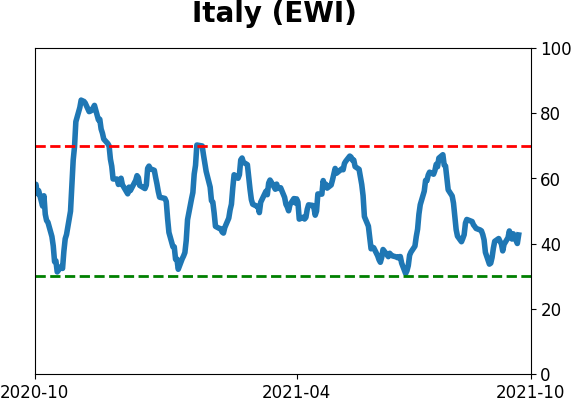
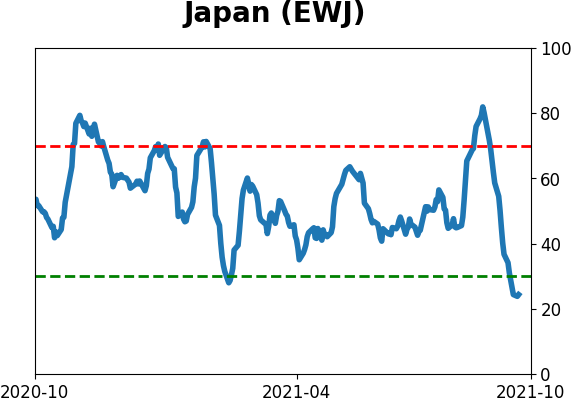
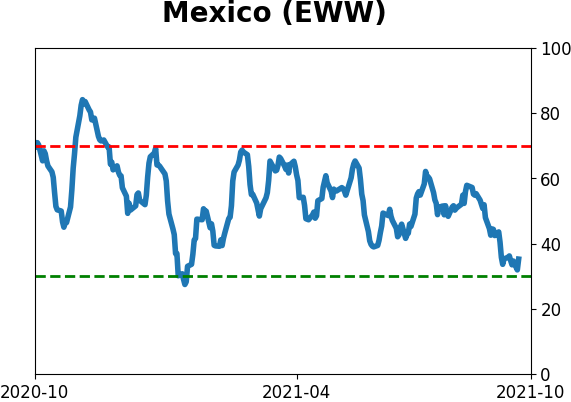
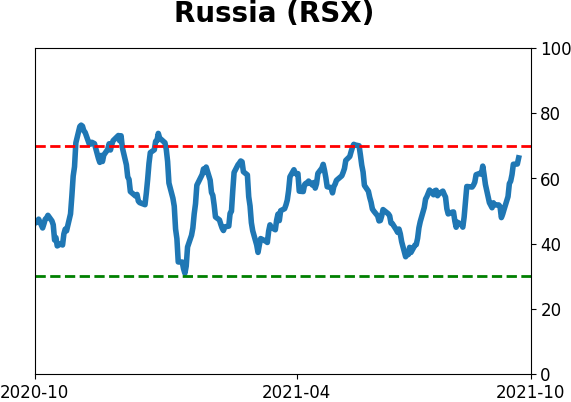
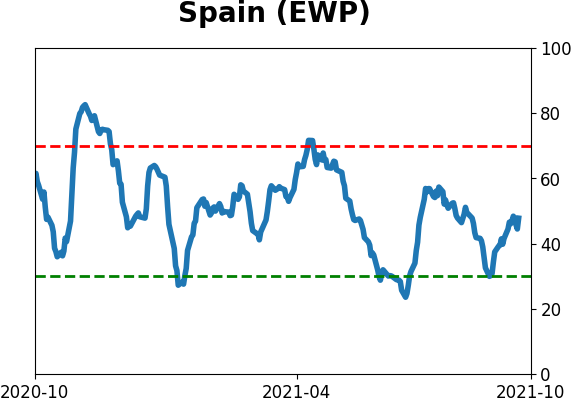
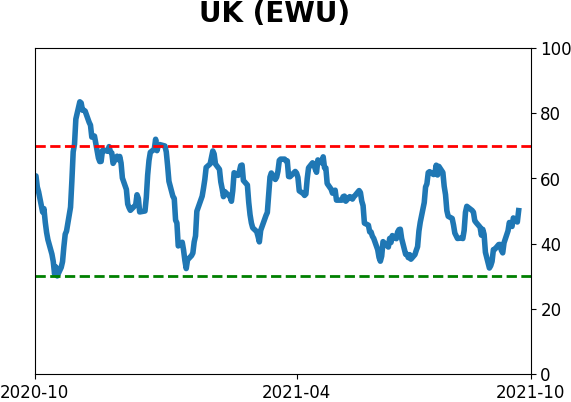
Sentiment Around The World
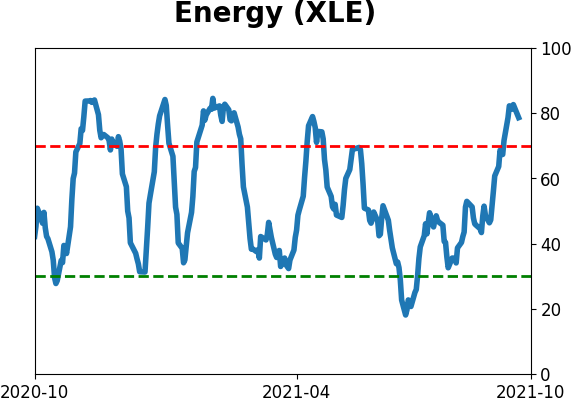
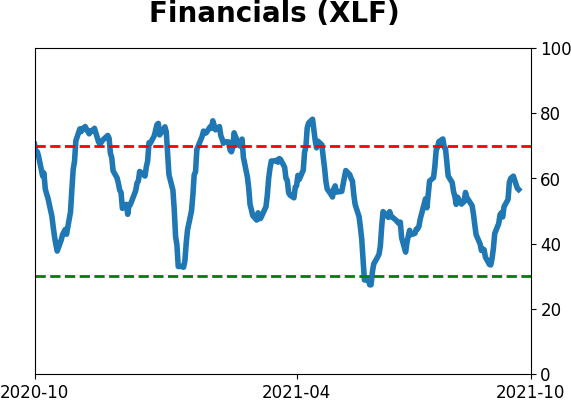
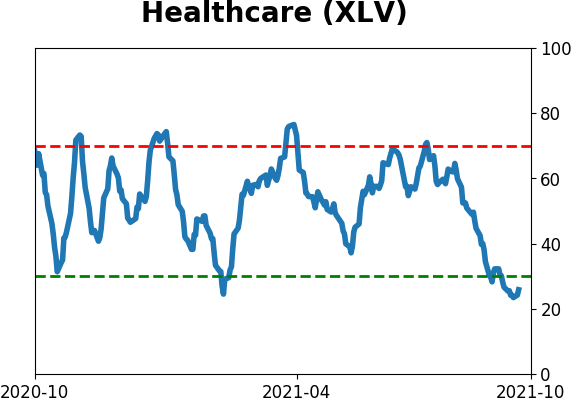
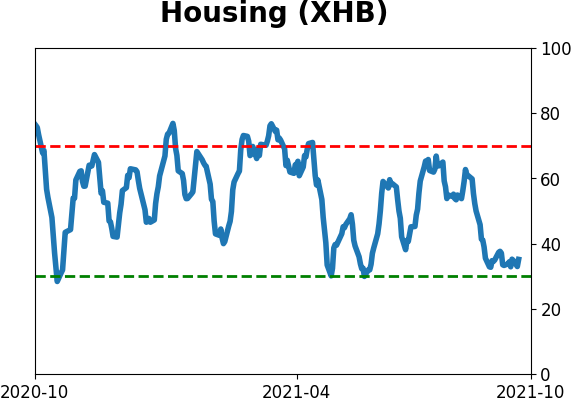
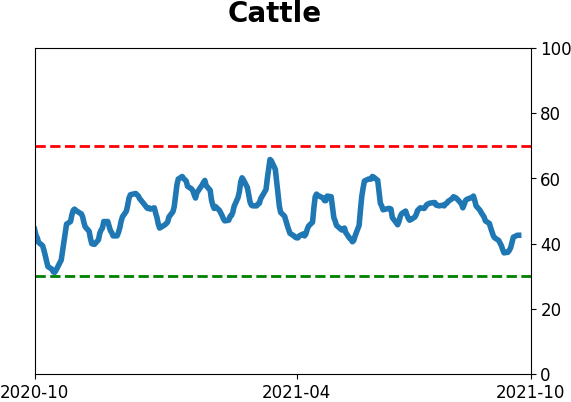
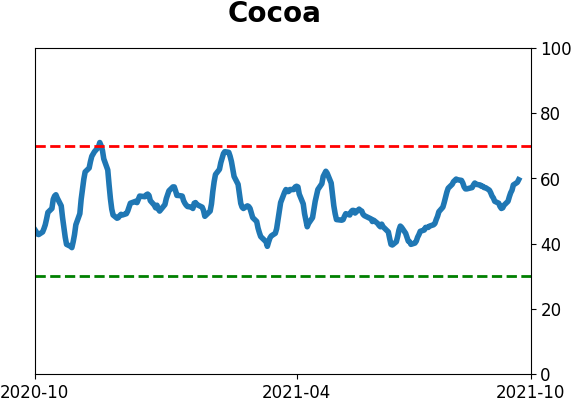
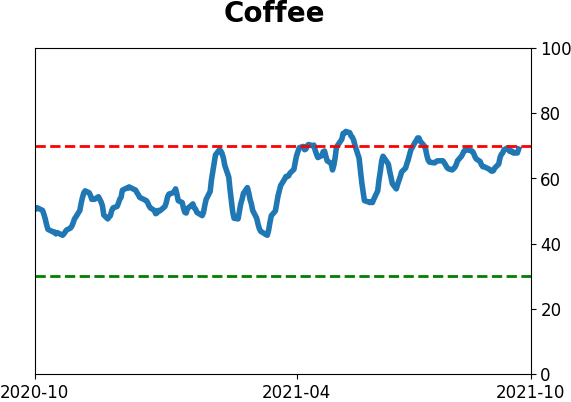
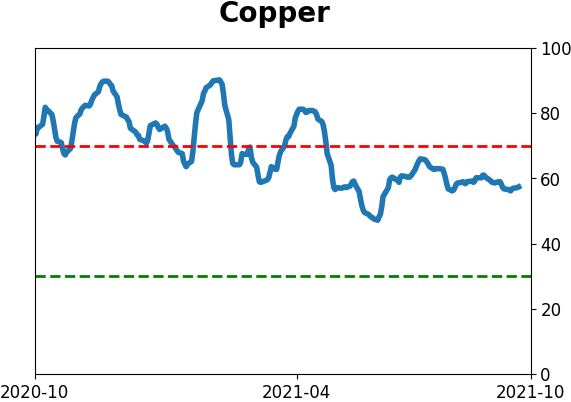
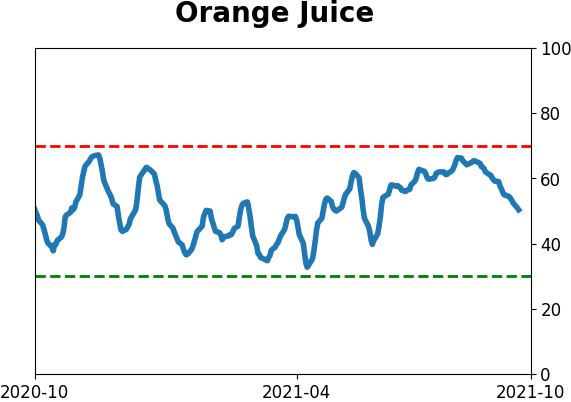
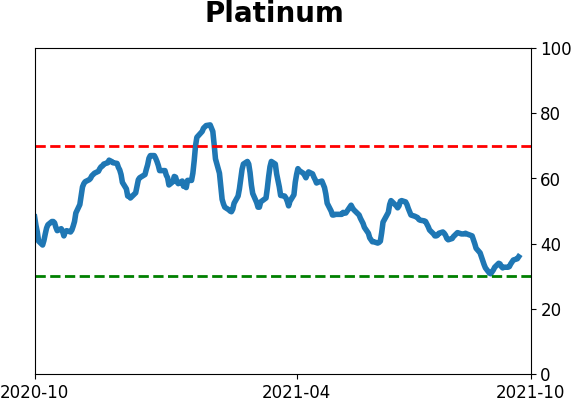
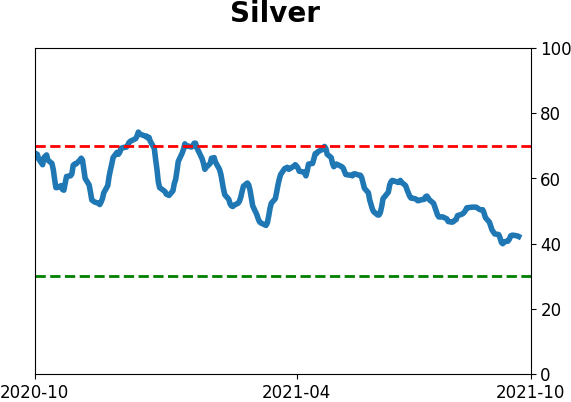
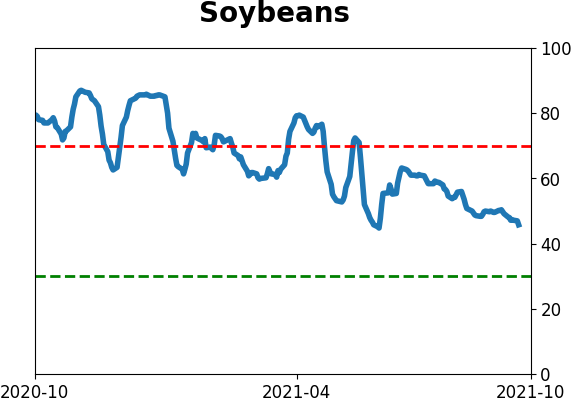
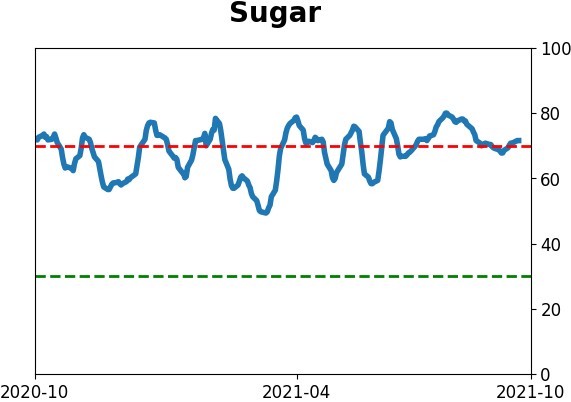
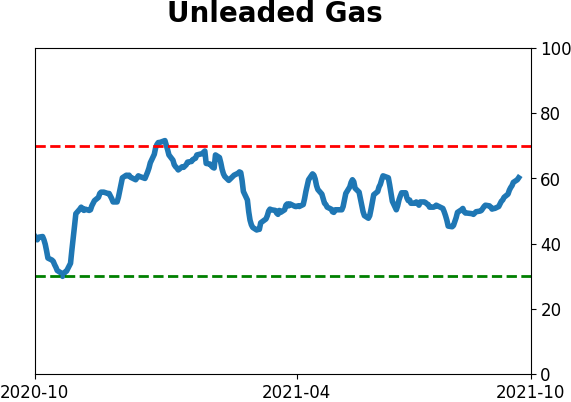
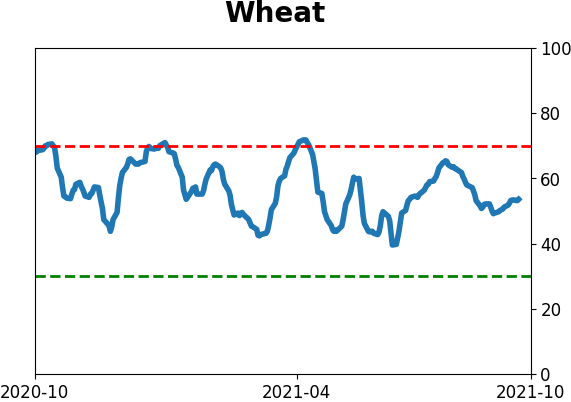
Optimism Index Thumbnails
|
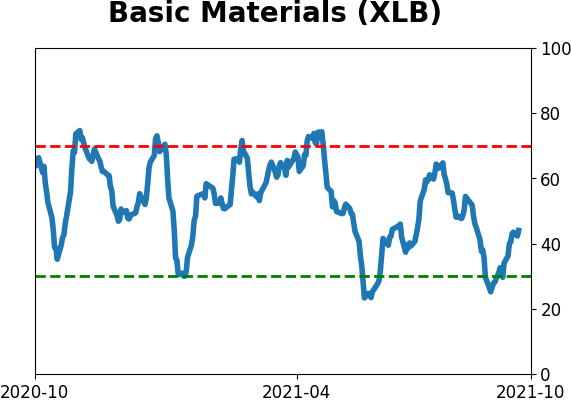
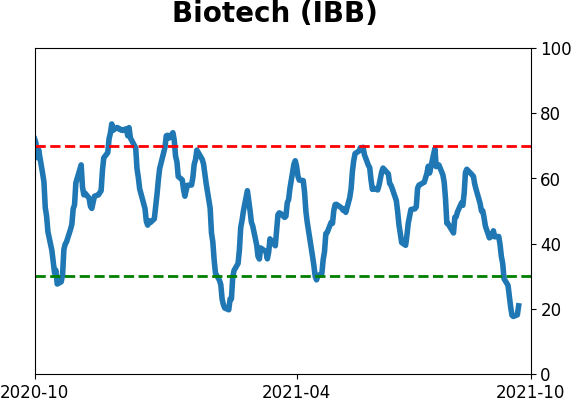
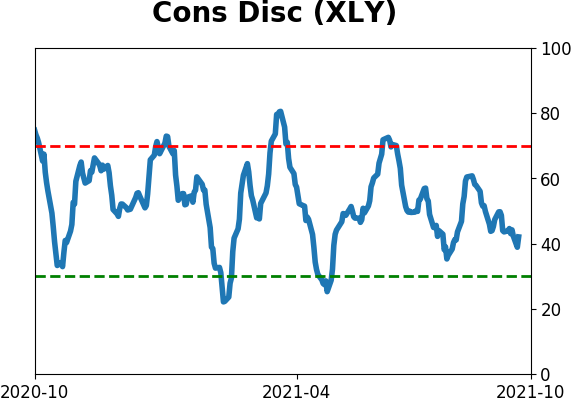
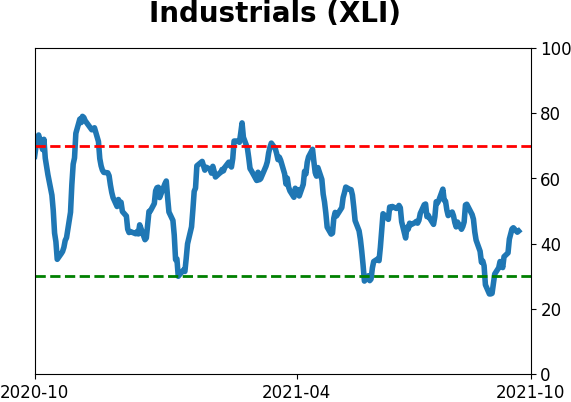
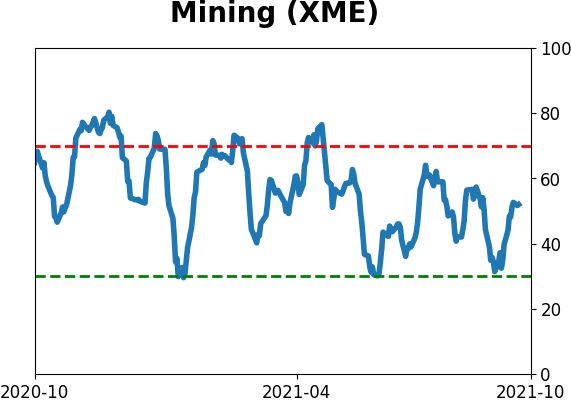
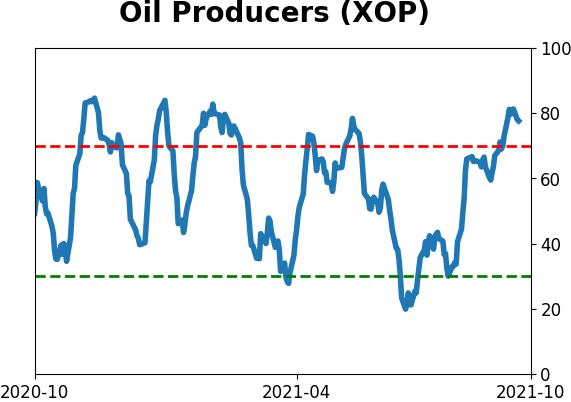
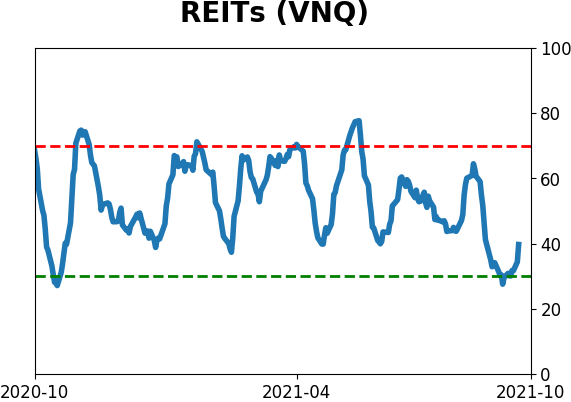
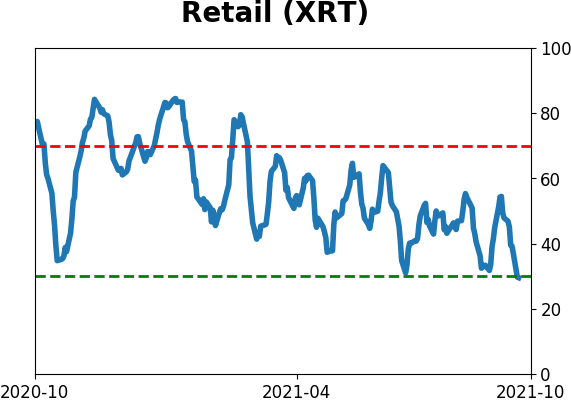
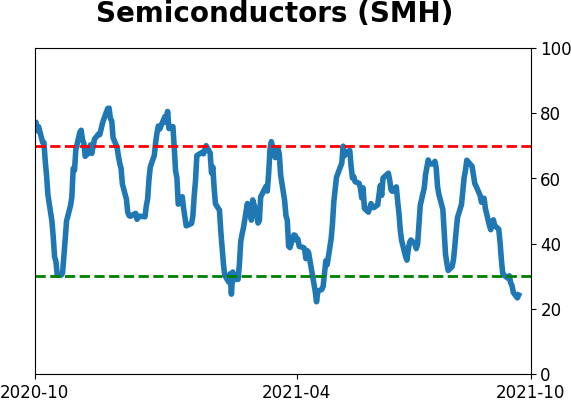
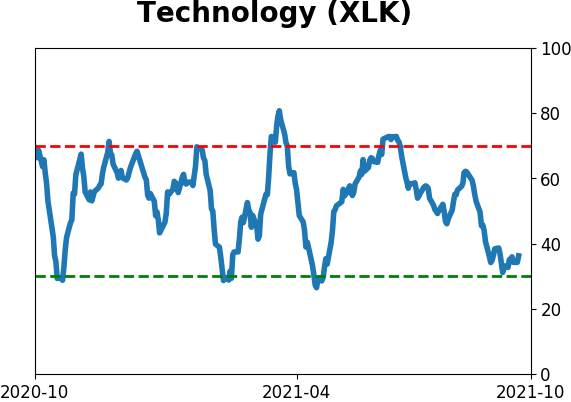
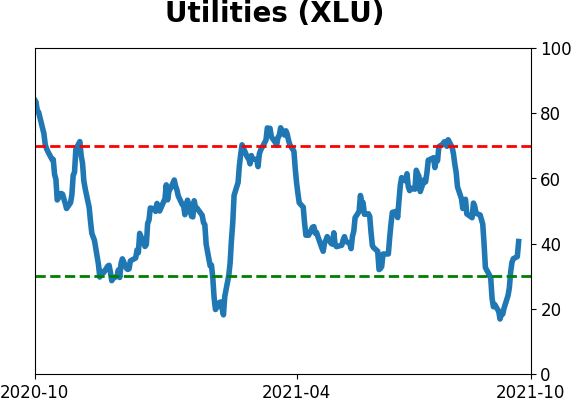
Sector ETF's - 10-Day Moving Average
|
|
|
Country ETF's - 10-Day Moving Average
|
|
|
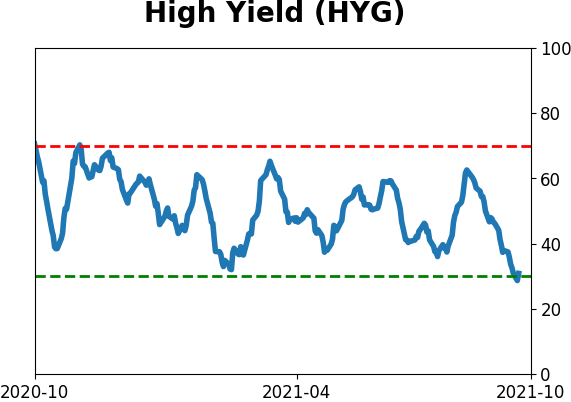
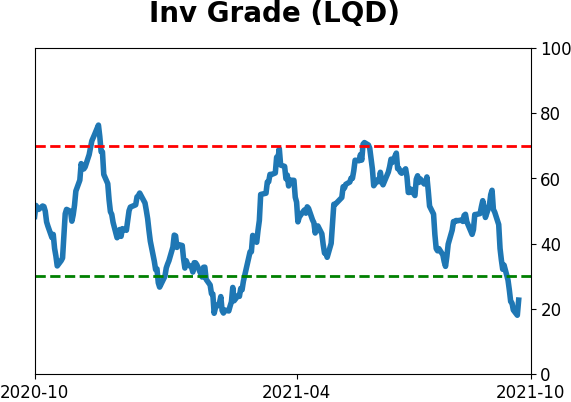
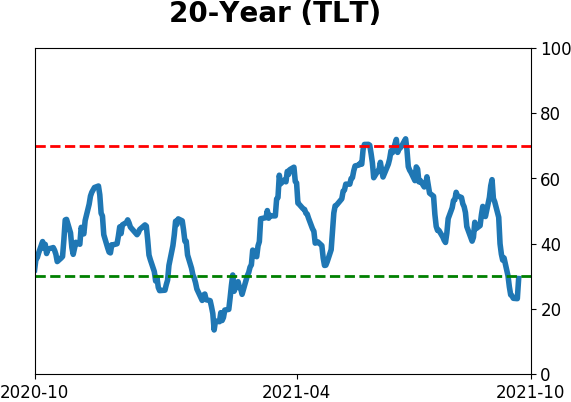
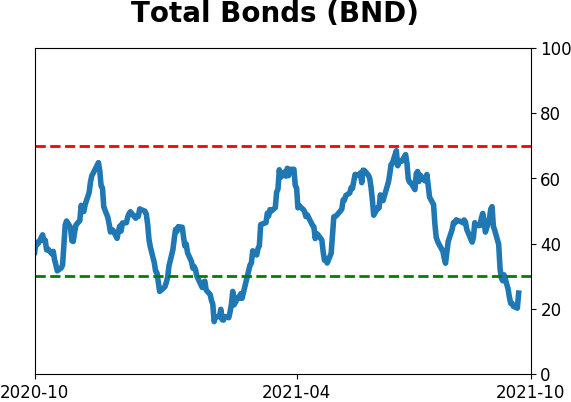
Bond ETF's - 10-Day Moving Average
|
|
|
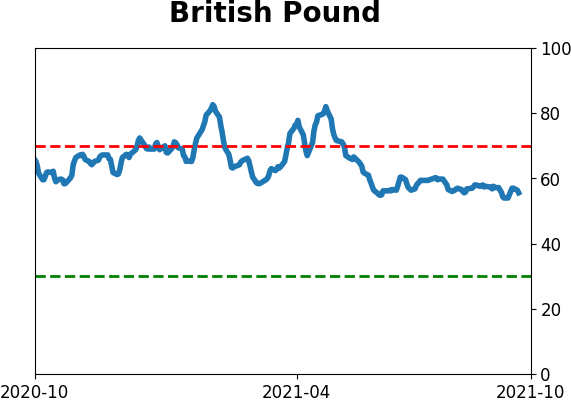
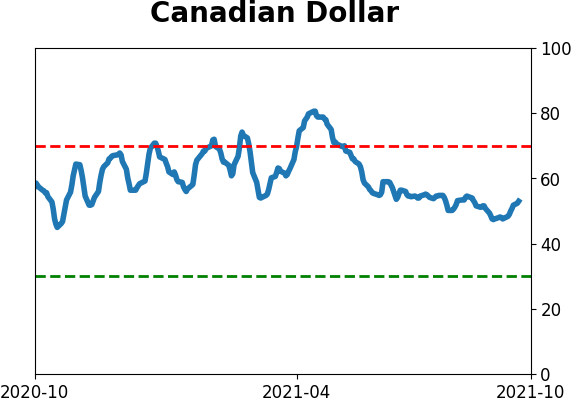
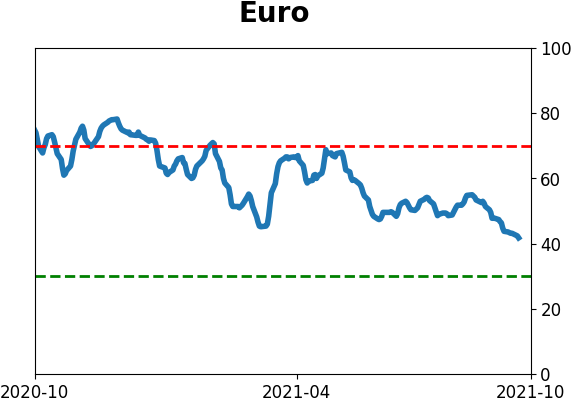
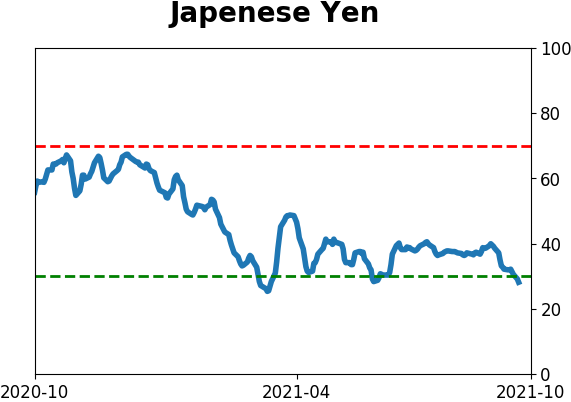
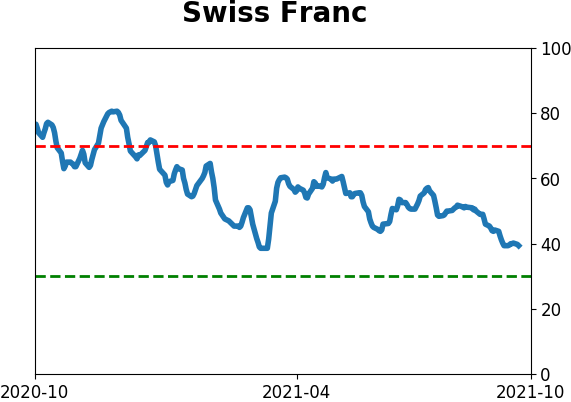
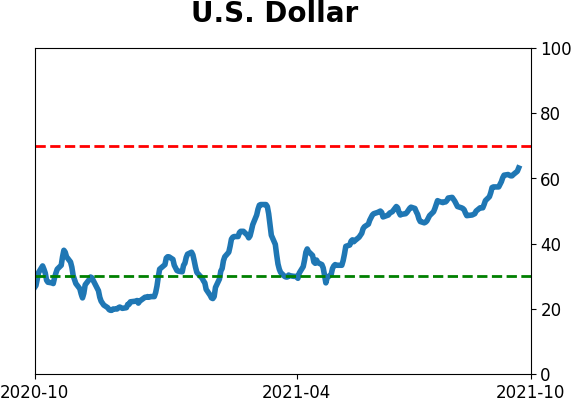
Currency ETF's - 5-Day Moving Average
|
|
|
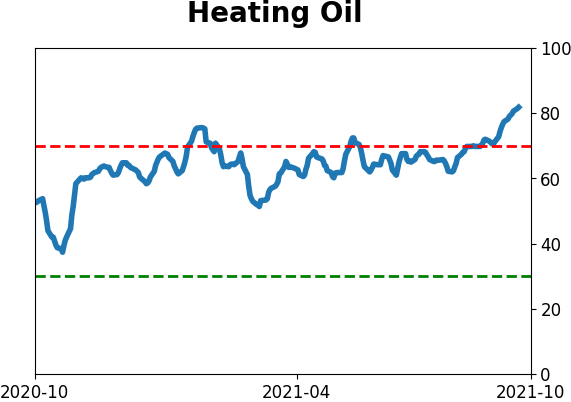
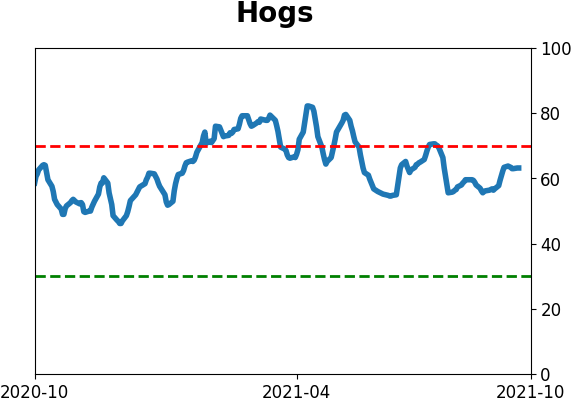
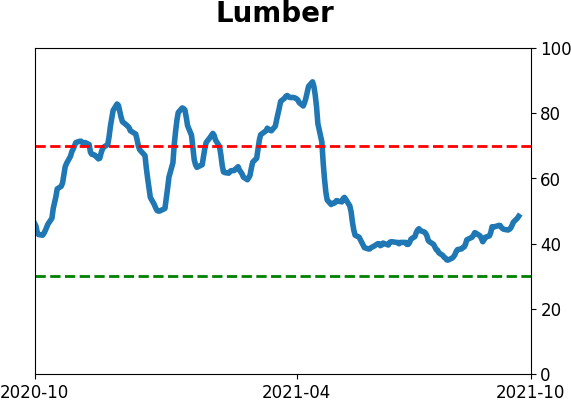
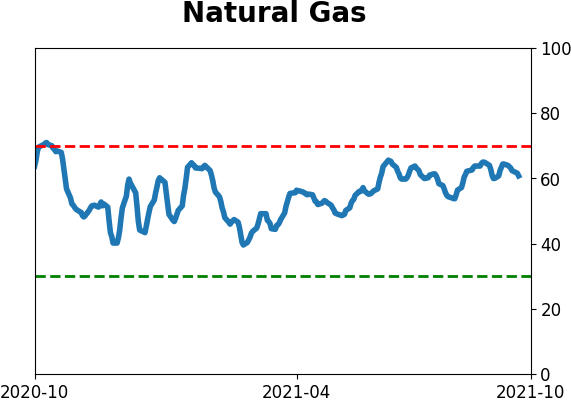
Commodity ETF's - 5-Day Moving Average
|
|