Headlines
|
|
Backtest Engine Scans I Have Known and Loved - The Smart/Dumb Money Confidence Spread Edition:
The ebb and flow between Smart Money and Dumb Money can be used in a variety of ways. This piece highlights a Backtest Engine scan that should be of particular interest to shorter-term traders.
The S&P 500's Summation Index is in the Worst Possible Position:
Poor internal participation has knocked the S&P 500's McClellan Summation Index below zero for the first time in over a year. That was one of its longest streaks since 1926. The ends of other persistent positive trends have typically led to a resumption of the uptrend.
Bottom Line:
STOCKS: Weak buy
The speculative frenzy in February is wrung out. There are some signs of pessimism, but the most compelling data show that buyers consistently tend to return once the first signs of extreme momentum end, especially as we head into a seasonally positive time of year. See the Outlook & Allocations page for more. BONDS: Hold
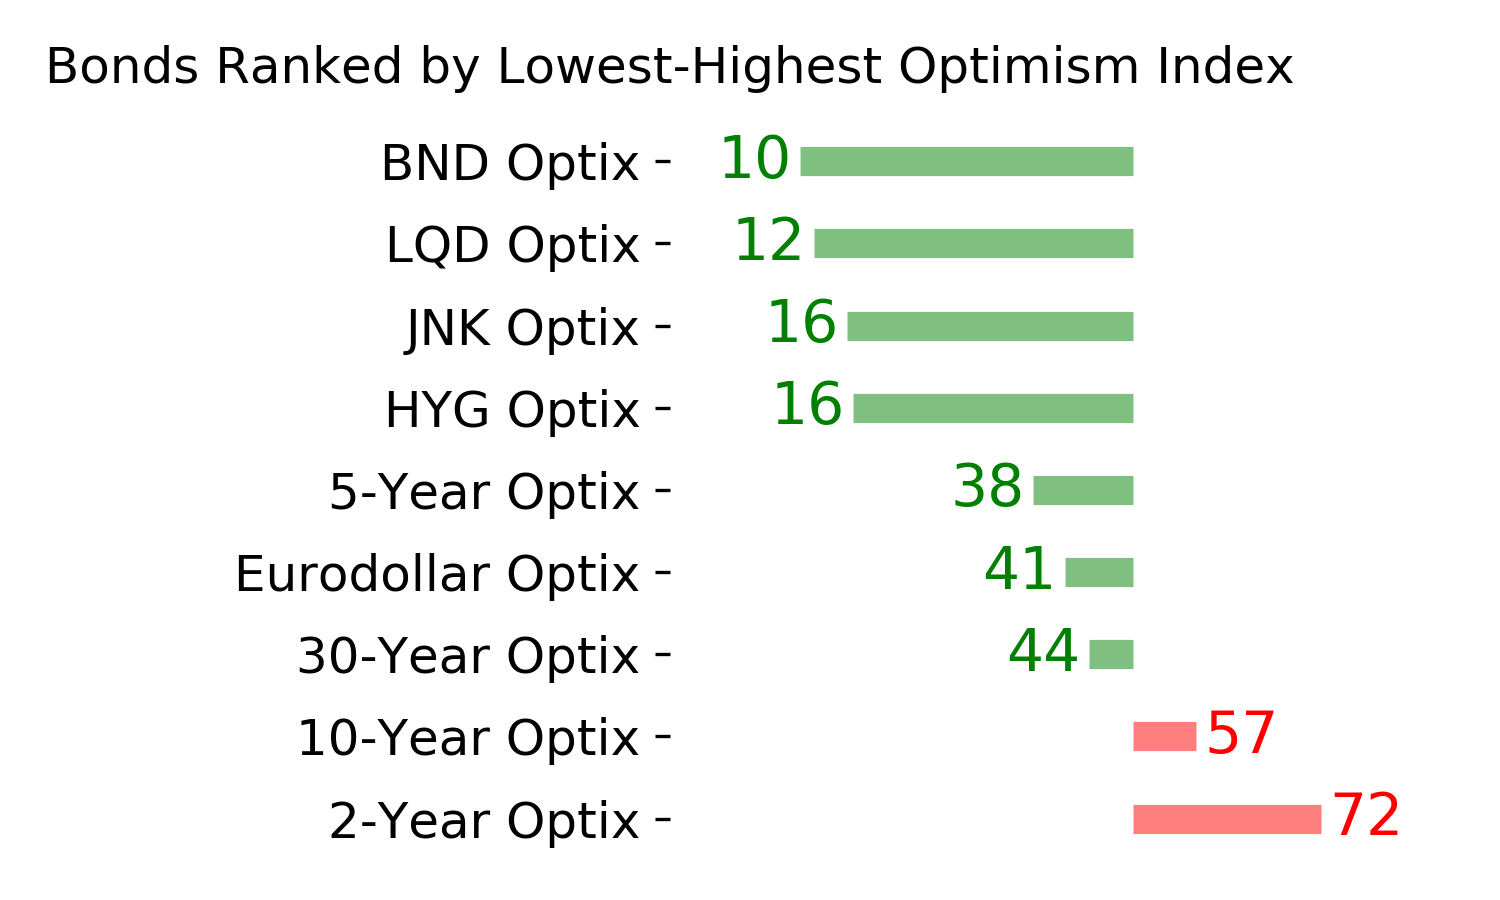
Various parts of the market got hit in March, with the lowest Bond Optimism Index we usually see during healthy environments. Bond prices have modest recovered and there is no edge among the data we follow. GOLD: Hold
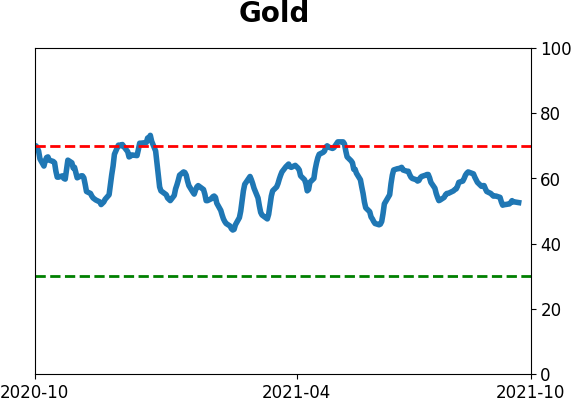
Gold and miners were rejected after trying to recover above their 200-day averages in May. Lately, some medium-term (not long-term) oversold extremes in breadth measures among miners have triggered.
|
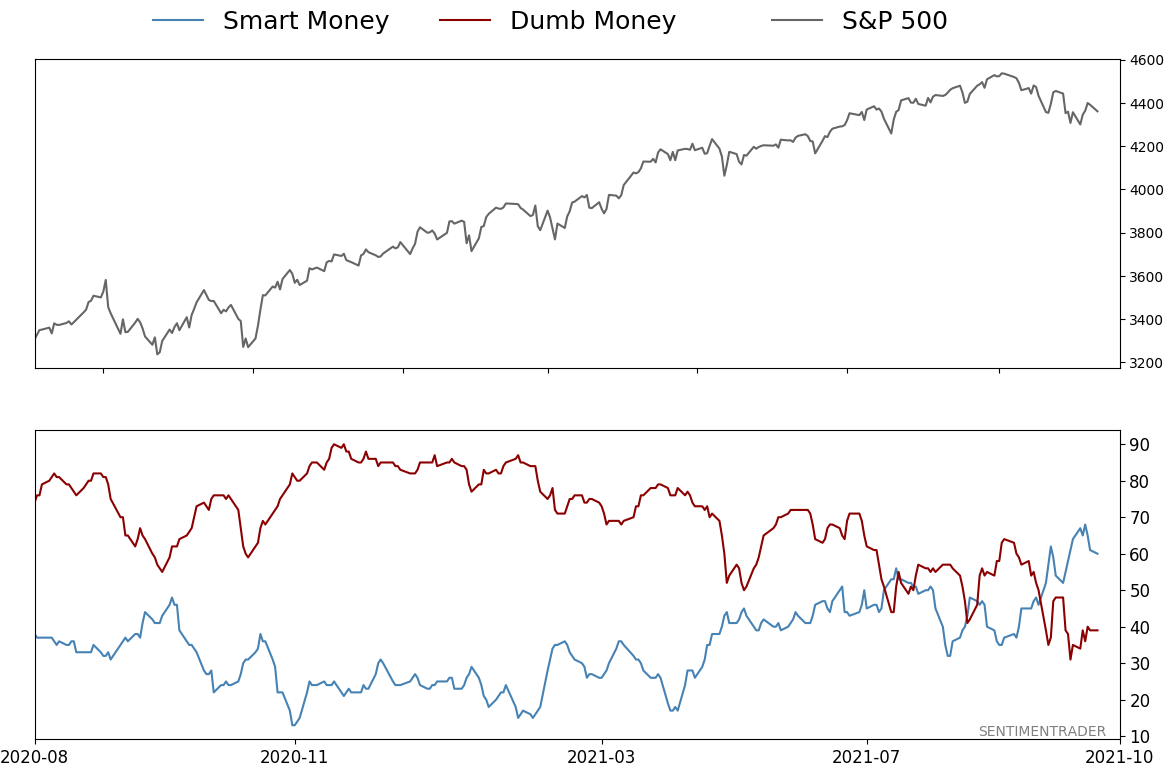
Smart / Dumb Money Confidence
|
Smart Money Confidence: 60%
Dumb Money Confidence: 39%
|
|
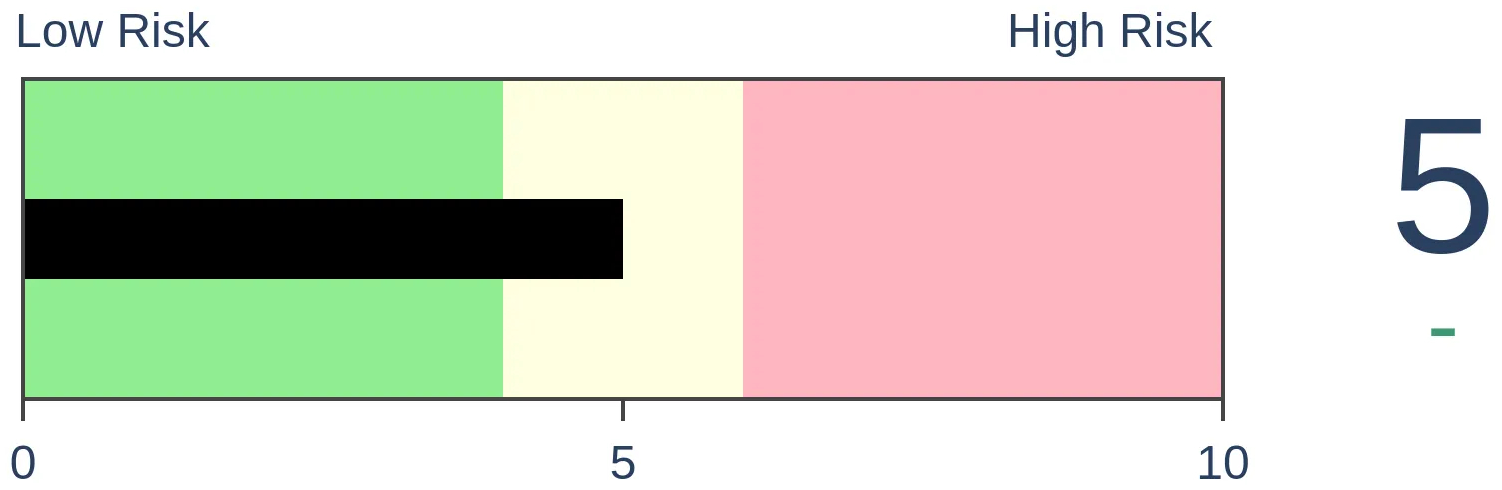
Risk Levels
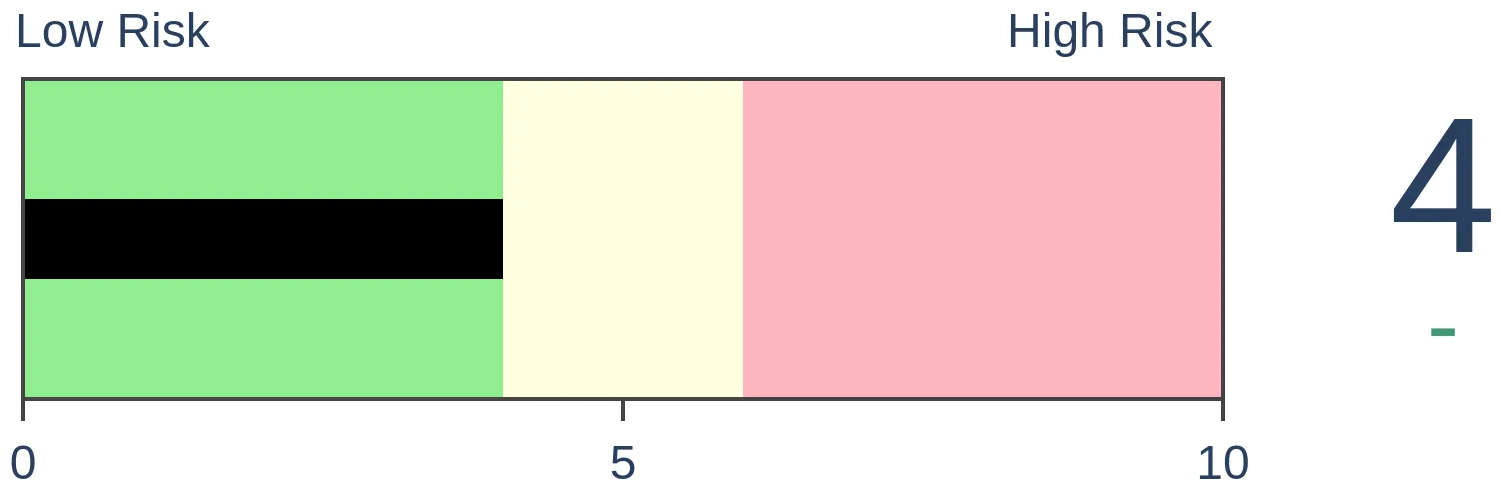
Stocks Short-Term

|
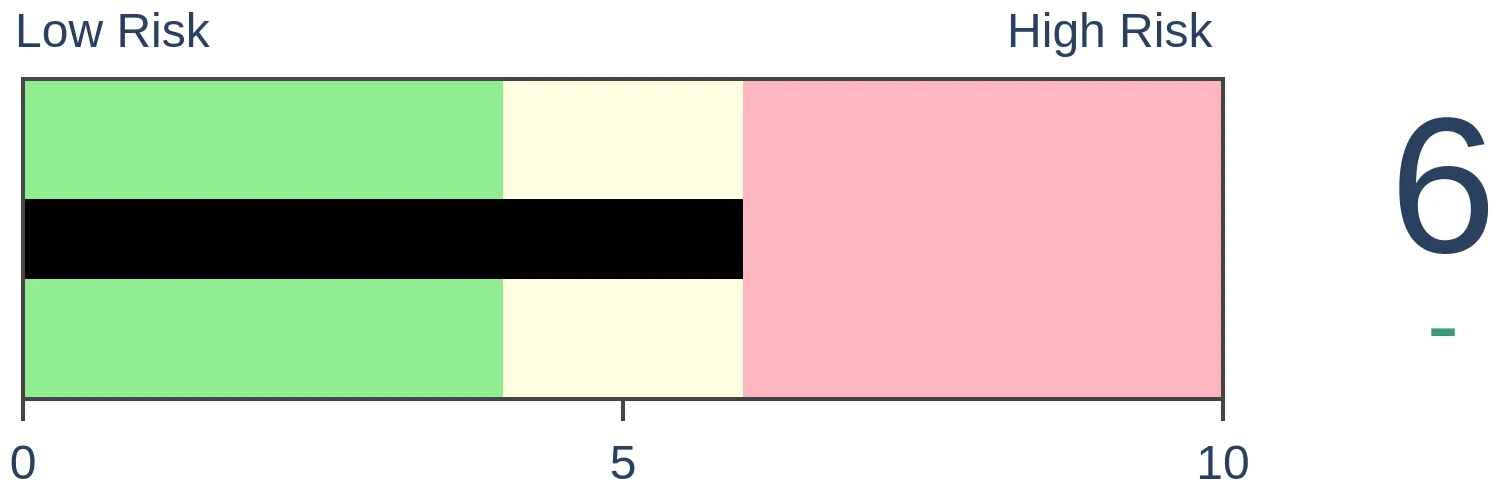
Stocks Medium-Term
|
|
Bonds

|
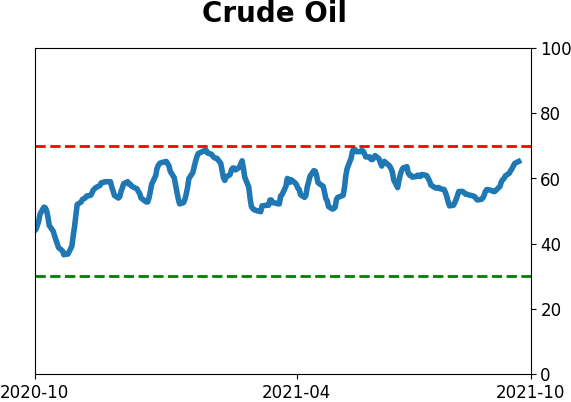
Crude Oil
|
|
Gold
|
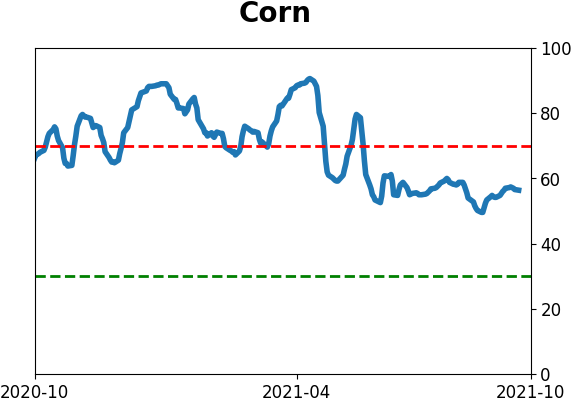
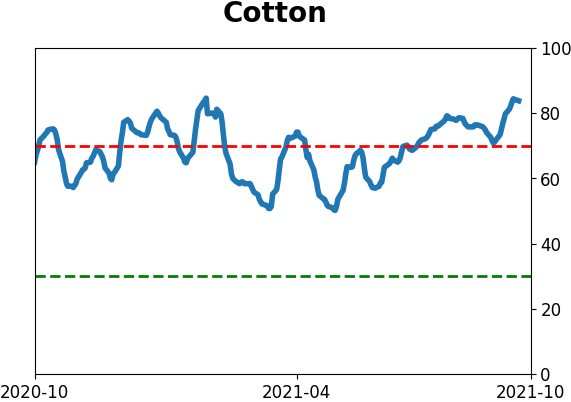
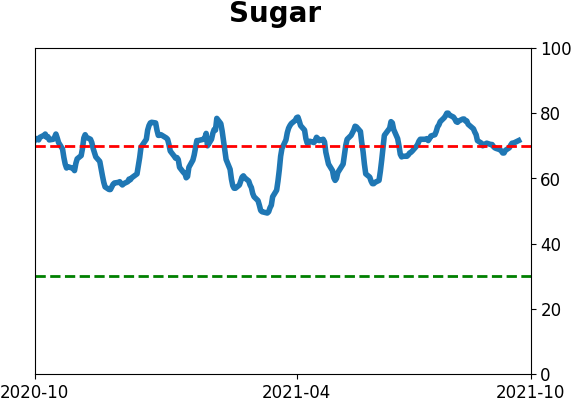
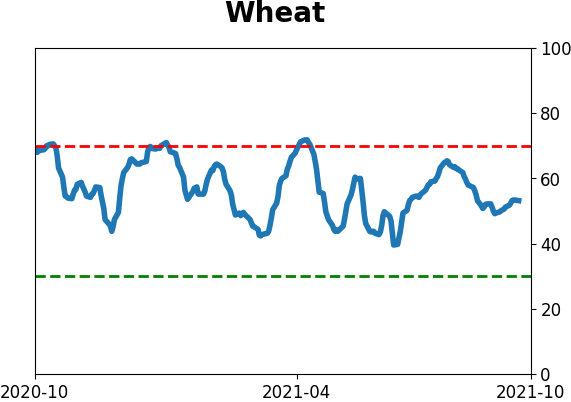
Agriculture

|
|
Research
By Jay Kaeppel
BOTTOM LINE
The ebb and flow between Smart Money and Dumb Money can be used in a variety of ways. This piece highlights a Backtest Engine scan that should be of particular interest to shorter-term traders.
FORECAST / TIMEFRAME
None
|
Please note that these scans are not necessarily presented on a "timely" basis. The goal is two-fold:
- To help you learn more about the Backtest Engine and its potentially powerful uses
- To help you build an arsenal of scans that may ultimately prove to be very useful at just the right time
One limitation to some of the articles in this series is that often the signal in question does NOT give signals very often. The bottom line is that:
- When signals do occur, they tend to be very useful
- But a trader cannot typically sit around and wait for a new signal
For this reason, users are encouraged to follow the steps farther down to save these scans to their "Favorites" and to sign up for the Evening Digest so that when a signal does occur, they will be alerted.
SMART MONEY / DUMB MONEY CONFIDENCE SPREAD
As the name implies, this indicator measures the daily difference between our "Smart Money" value and our "Dumb Money" value.
For this article:
A = (Smart Money value - Dumb Money value)
B = 20-day moving average of A
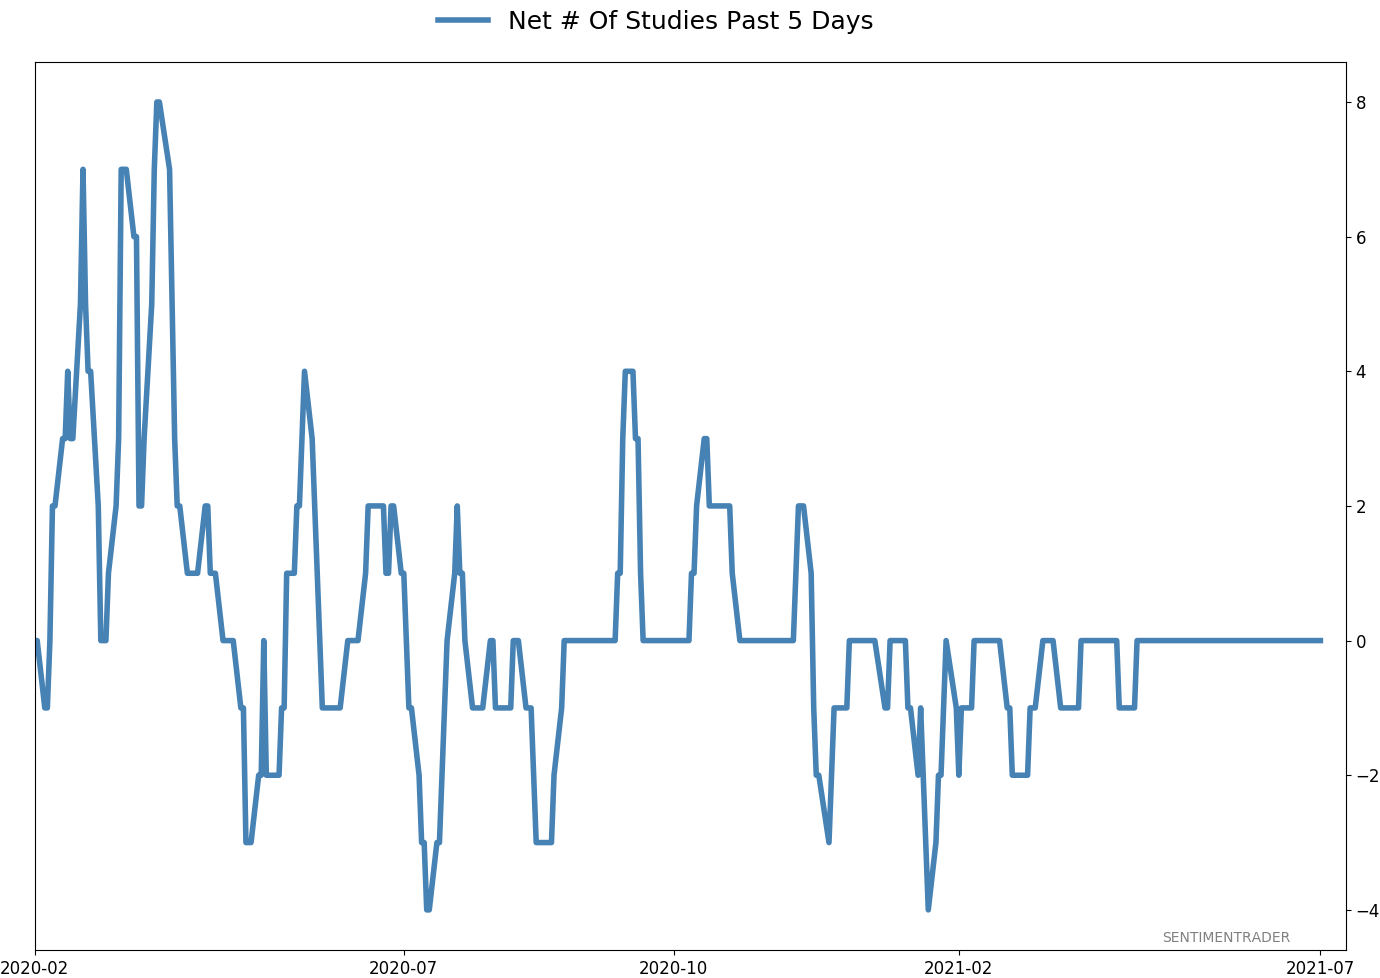
For our test, we will identify those days when:
- Variable B crosses above 0.45
- For the first time in 21 days
The screenshot below displays the input screen for this test (after you follow the steps below to Save this scan, anytime you recall it, the inputs will fill in automatically). You can launch this test by clicking here and then clicking "Run Backtest."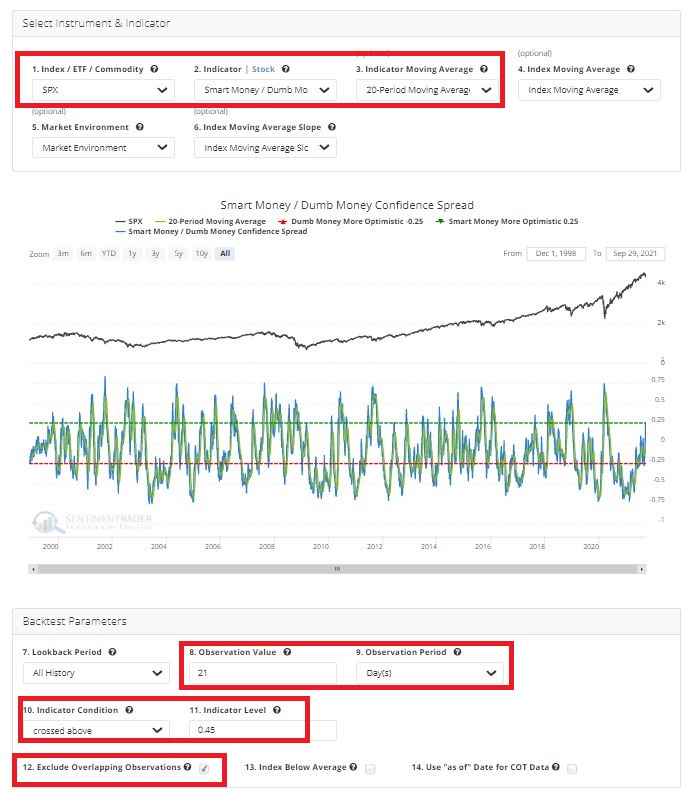
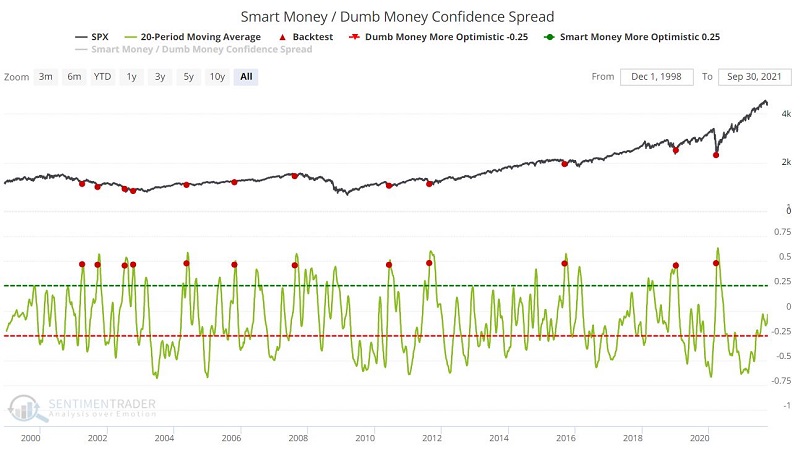
The chart below displays the signals generated by this test:
- The bad news is that this scenario occurs infrequently
- The good news is that when it does flash a signal, they tend to be quite useful - particularly for shorter-term traders
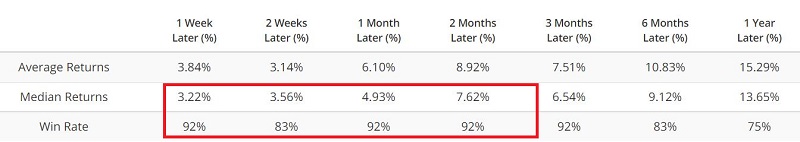
The screenshot below displays the summary of the results. The key things to note are:
- The high Win Rates
- And the robust Median Returns
- Over the shorter-term time frames
The screenshot below displays the full results for all previous signals.
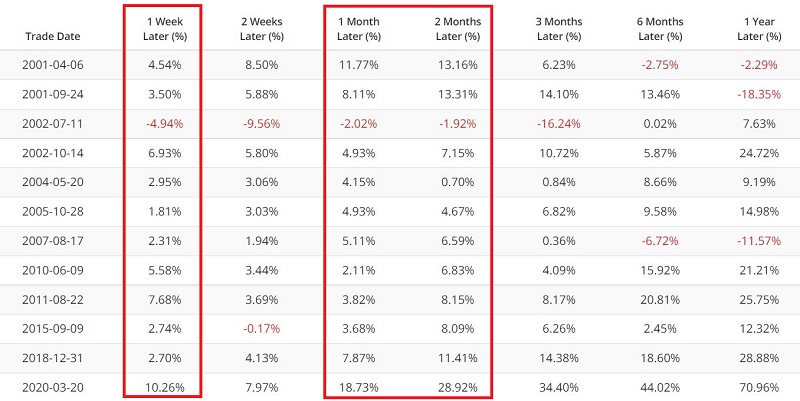
The bottom line:
- Signals from this particular scan are infrequent (and unfortunately, not close to triggering anytime soon)
- But when they do occur, short-term traders appear to have an outstanding opportunity to play the long side of the stock market
SAVING THE SCAN
Now let's look at how you can save this scan (or any scan) so that you will automatically be alerted when it gives a signal.
You can do this by:
- Clicking "Add to Favorites"
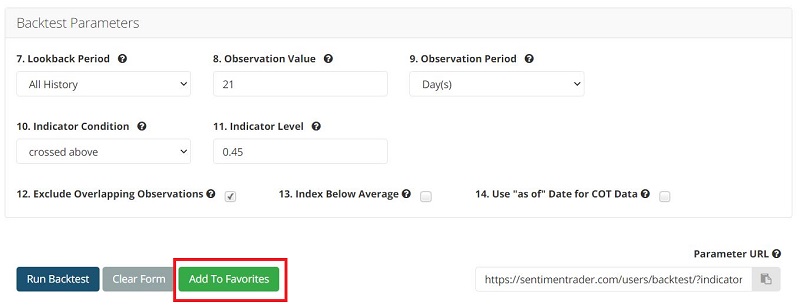
- Typing "Smart/Dumb Confidence Spread 20-day MA crosses above 0.45"

Then click "Save Favorite"
These steps will add this particular scan to your list of Favorites. Anytime you enter Backtest Engine, your Favorites will be listed at the bottom of the screen.

Finally, note that any Saved scan that is active is listed at the bottom of your Evening Digest email. You can go to My Website Preferences under My Account to ensure you get those (they are on by default).
By Jason Goepfert
BOTTOM LINE
Poor internal participation has knocked the S&P 500's McClellan Summation Index below zero for the first time in over a year. That was one of its longest streaks since 1926. The ends of other persistent positive trends have typically led to a resumption of the uptrend.
FORECAST / TIMEFRAME
None
|
At various points this year, the majority of stocks have trailed the major indexes. Sometimes, there was a wide divergence between what the average stock was doing versus, say, the S&P 500. Historically, that has preceded declines in the indexes, but 2021 has thrown a whole host of historical markers out the window.
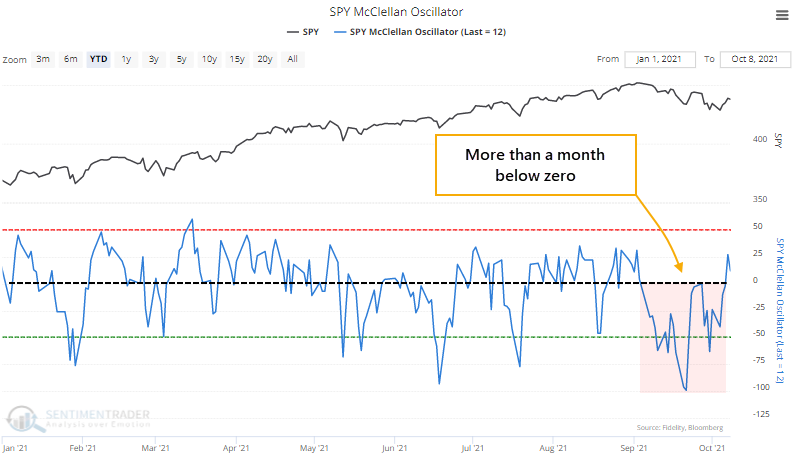
Even so, the internal weakness was enough so that when the S&P actually did start to struggle over a month ago, some of its breadth metrics really struggled. The rally at the tail end of last week started to change that; the McClellan Oscillator for the S&P 500 has turned positive for the first time in a month.
The extended run below zero in the Oscillator caused the longer-term Summation Index to plunge, and it recently dived below its zero line for the first time in well over a year. The worst possible scenario for an index or sector is when its Summation Index is negative and declining - that's when the ugliest selloffs tend to occur.
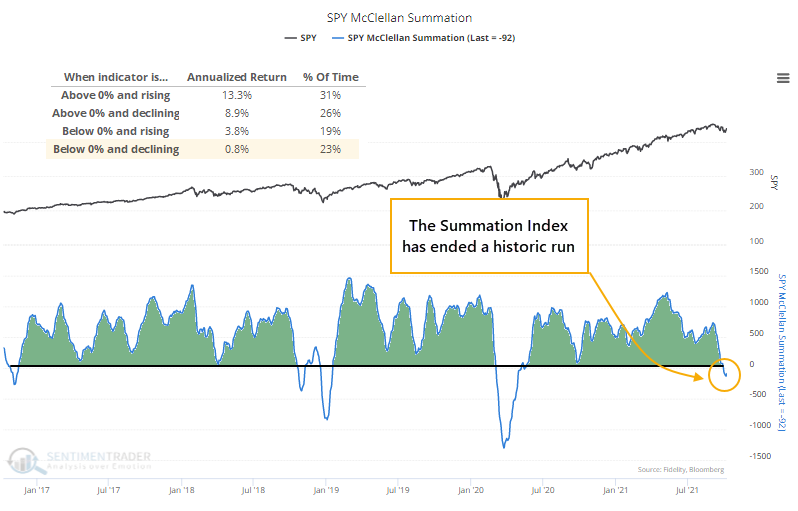
We can see the stark differences in annualized returns in the S&P 500 since 1926 based on various regimes in its Summation Index, and we're currently mired in the worst tranche. It's trying to curl up now, which helps, but we could breathe easier if it manages to keep rising and crosses above the zero line.
The drop below zero ended the 4th-longest streak in positive territory for the Summation Index since 1926, and it missed making it into 2nd place by only a few sessions.
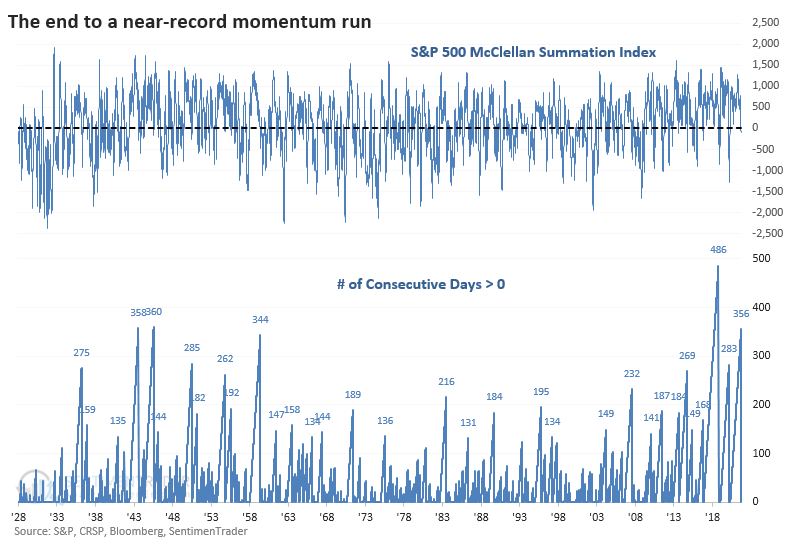
The longest streak ended in 2018, almost exactly three years ago, and ushered in some quick and painful losses. That was more the exception than the rule, though. After other long positive streaks ended, the S&P tended to show positive returns going forward, better than average returns, with generally small losses. Over the next three months, there were only two losers larger than -5%.
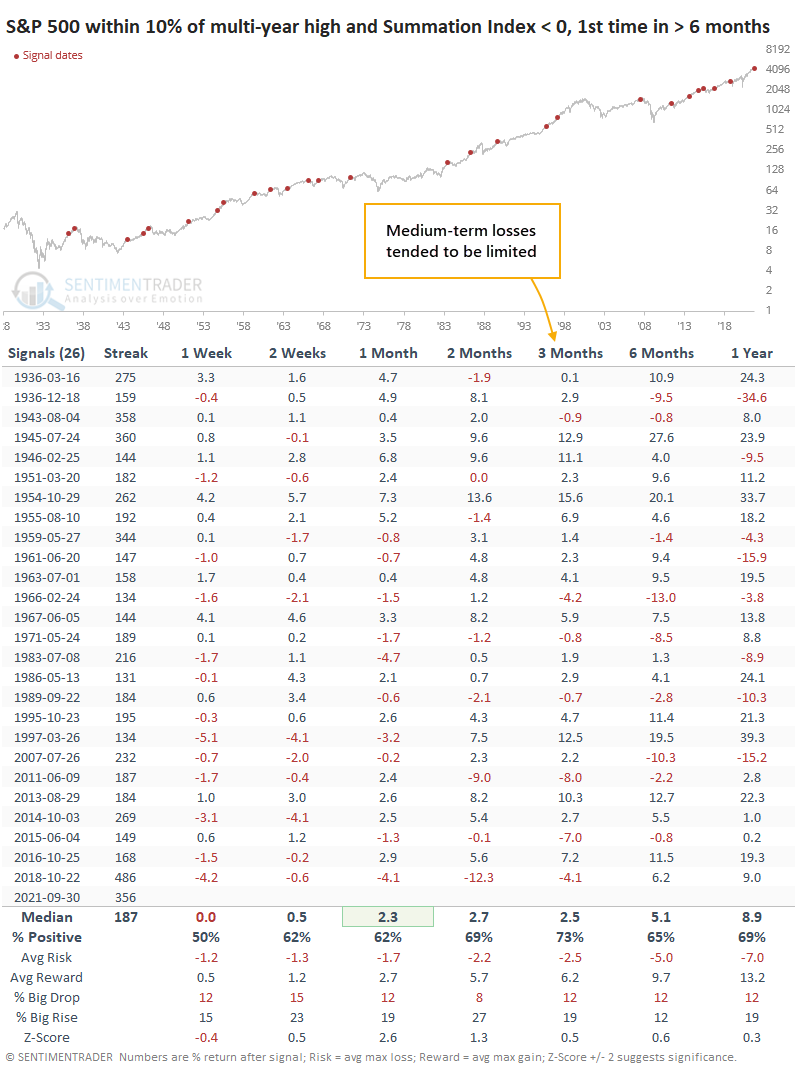
If we focus on the handful of signals since the global financial crisis, we can see more of a struggle. After these long positive streaks ended, the S&P fell into correction mode three times and quickly resumed its uptrend three times. That's a wash.
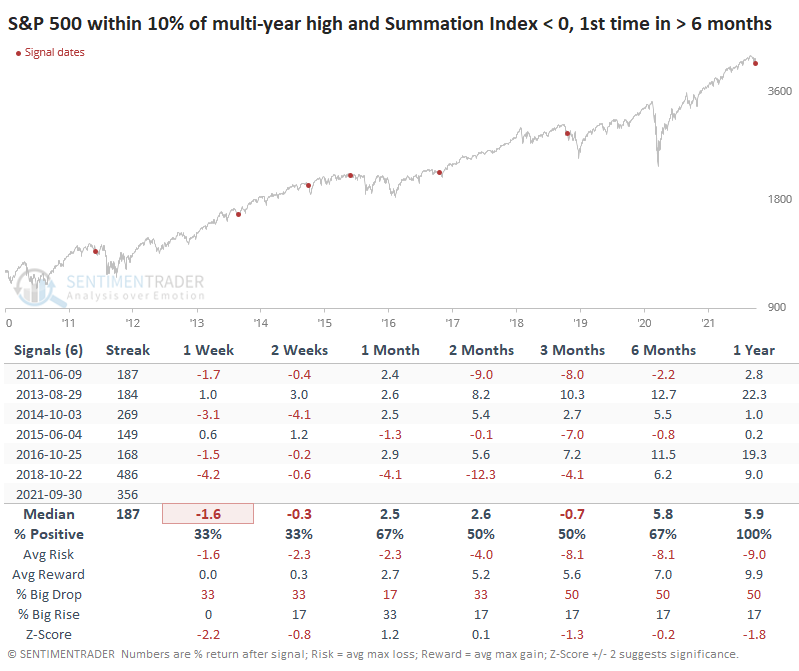
Over the past week, we've looked multiple times at the ends of long streaks of positive momentum. To a one, they showed a positive expectation going forward. After a long time with positive trends and internals, buyers have had a powerful tendency to see the first real pullback as an opportunity. We're amid that "opportunity" now, with solid seasonal trends as a tailwind. The following 2-3 weeks could (and should) be volatile as earnings come into focus and investors get more of a read on the spike in energy prices and potential contagion from foreign debt issues. But looking at the next 2-3 months, the bias should be higher unless something drastic has shifted in the market environment.
Active Studies
| Time Frame | Bullish | Bearish | | Short-Term | 0 | 0 | | Medium-Term | 7 | 0 | | Long-Term | 11 | 5 |
|
Indicators at Extremes
Portfolio
| Position | Description | Weight % | Added / Reduced | Date | | Stocks | RSP | 10.5 | Added 6.4% | 2021-10-01 | | Bonds | 23.9% BND, 6.9% SCHP | 31.5 | Reduced 7.1% | 2021-05-19 | | Commodities | GCC | 2.6 | Reduced 2.1%
| 2020-09-04 | | Precious Metals | GDX | 4.2 | Reduced 4.2% | 2021-05-19 | | Special Situations | 9.8% KWEB, 4.7% XLE, 2.9% PSCE | 17.3 | Added 9.78% | 2021-10-01 | | Cash | | 34.0 | | |
|
Updates (Changes made today are underlined)
Much of our momentum and trend work has remained positive for several months, with some scattered exceptions. Almost all sentiment-related work has shown a poor risk/reward ratio for stocks, especially as speculation drove to record highs in exuberance in February. Much of that has worn off, and most of our models are back toward neutral levels. There isn't much to be excited about here. The same goes for bonds and even gold. Gold has been performing well lately and is back above long-term trend lines. The issue is that it has a poor record of holding onto gains when attempting a long-term trend change like this, so we'll take a wait-and-see approach. Momentum has ebbed quickly in recent weeks, and nearing oversold levels in some indicators. This can be a dangerous area, with a lot of short-term volatility, but we'd be more inclined to add medium- to long-term exposure rather than sell on much more of a decline, thanks to already rock-bottom exposure. Other areas look more attractive, including some overseas markets. RETURN YTD: 9.9% 2020: 8.1%, 2019: 12.6%, 2018: 0.6%, 2017: 3.8%, 2016: 17.1%, 2015: 9.2%, 2014: 14.5%, 2013: 2.2%, 2012: 10.8%, 2011: 16.5%, 2010: 15.3%, 2009: 23.9%, 2008: 16.2%, 2007: 7.8%
|
|
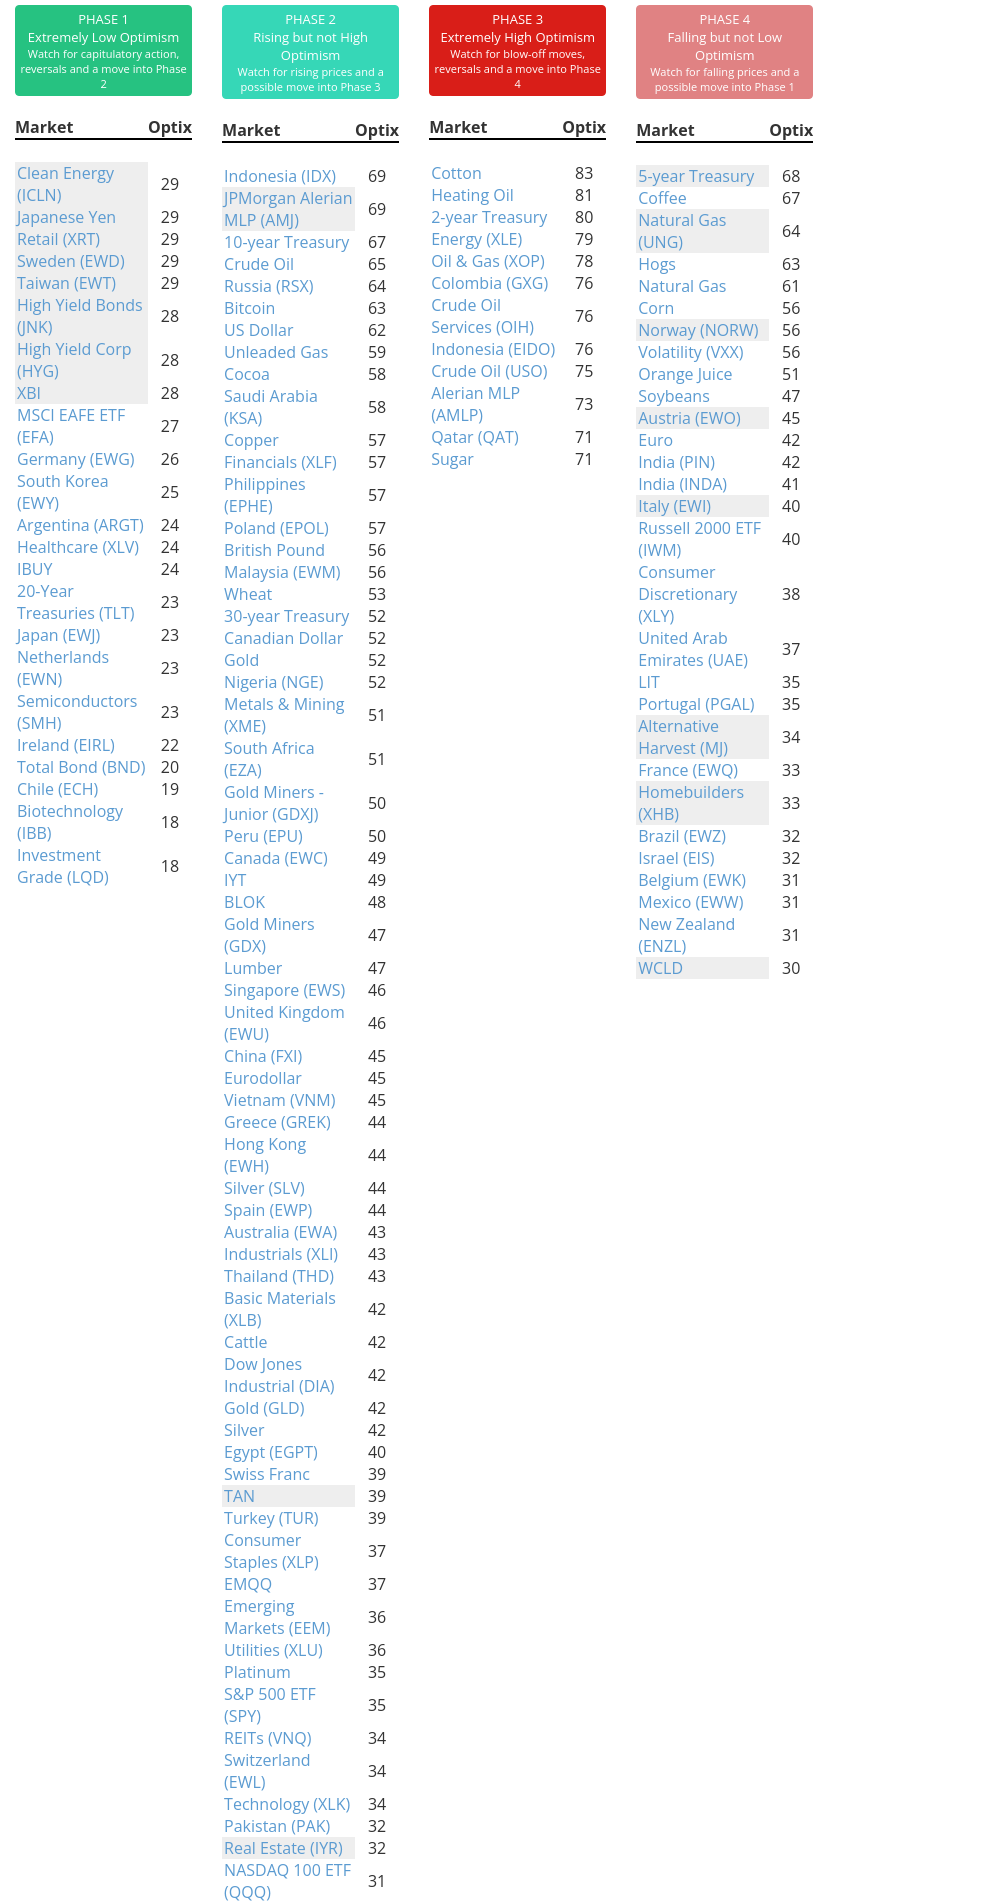
Phase Table
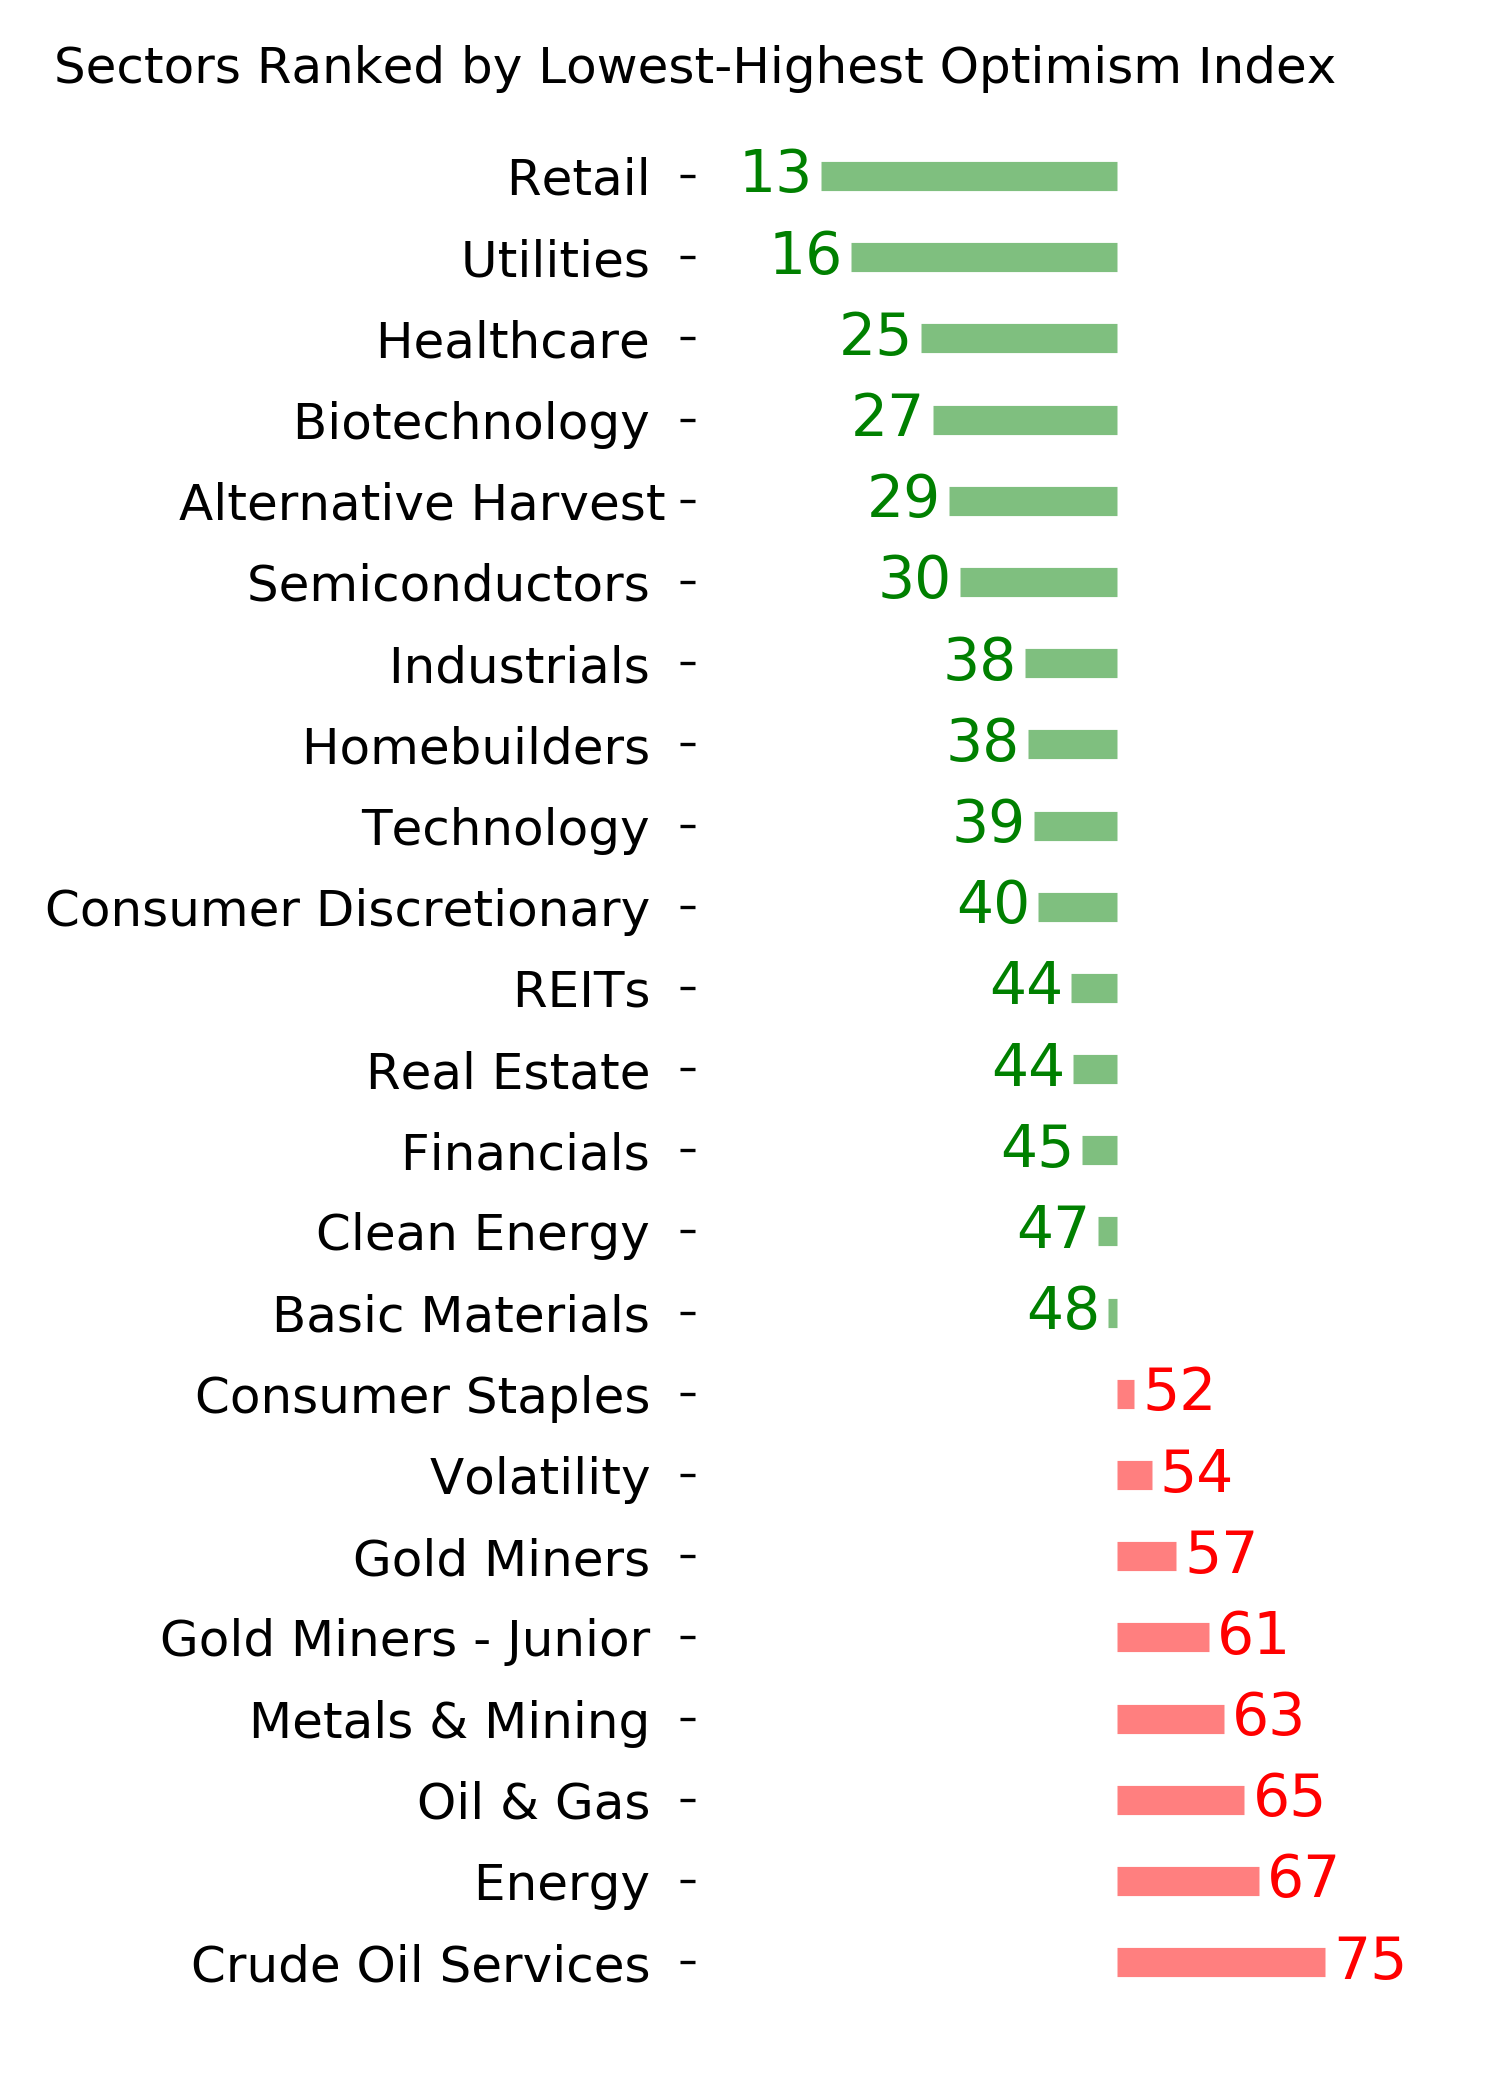
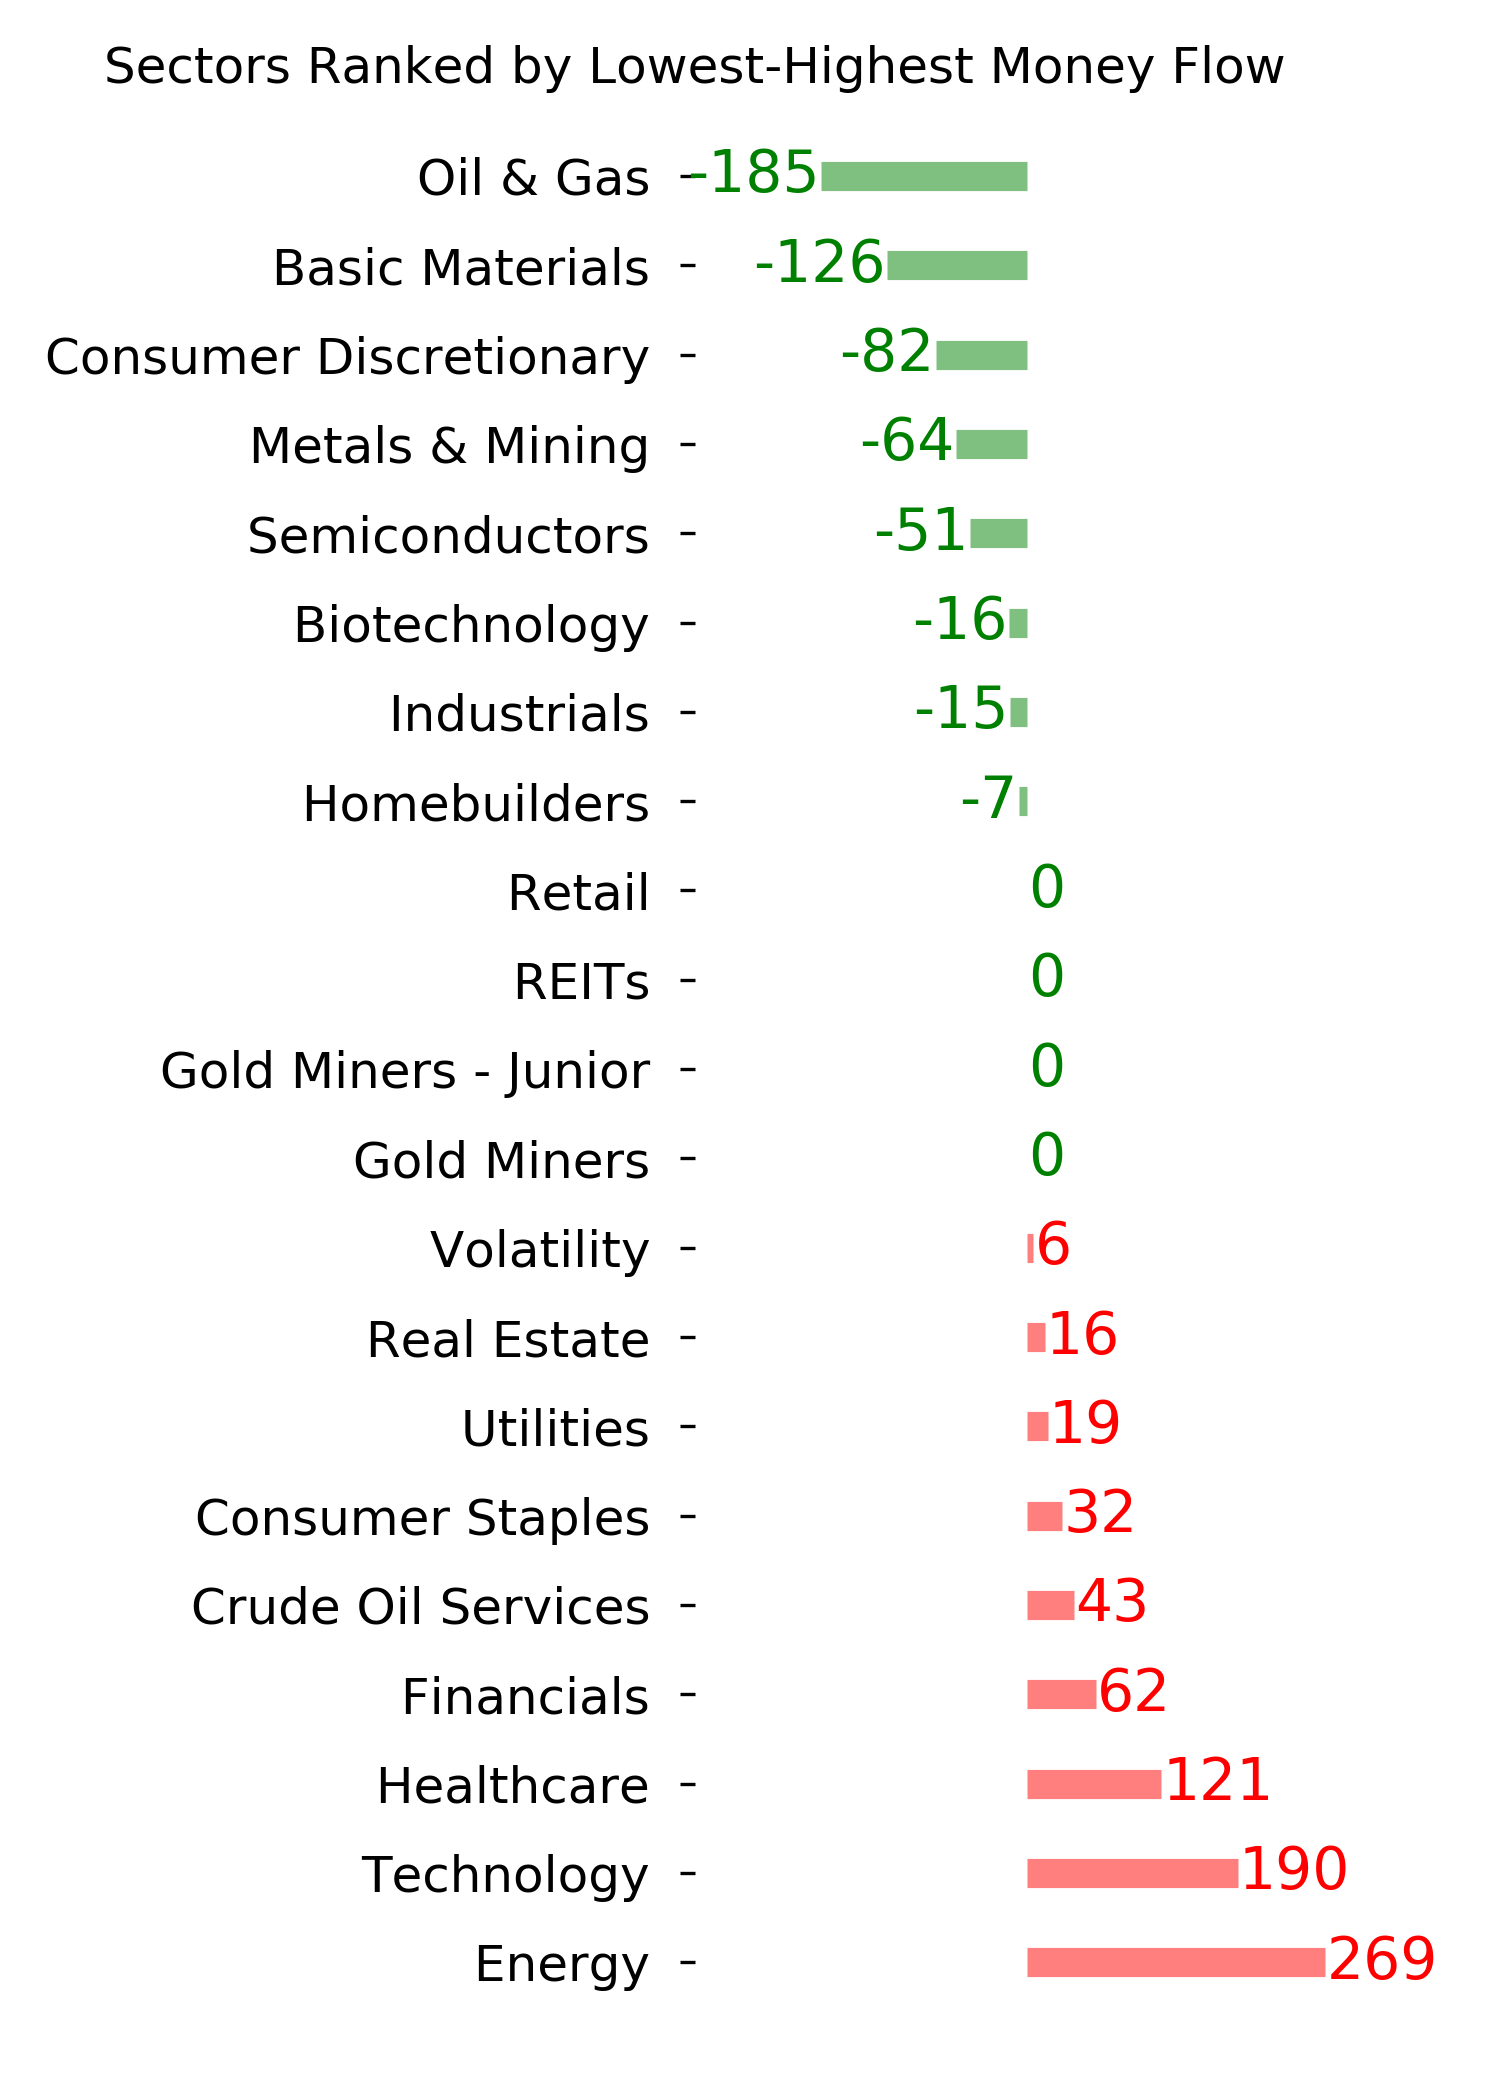
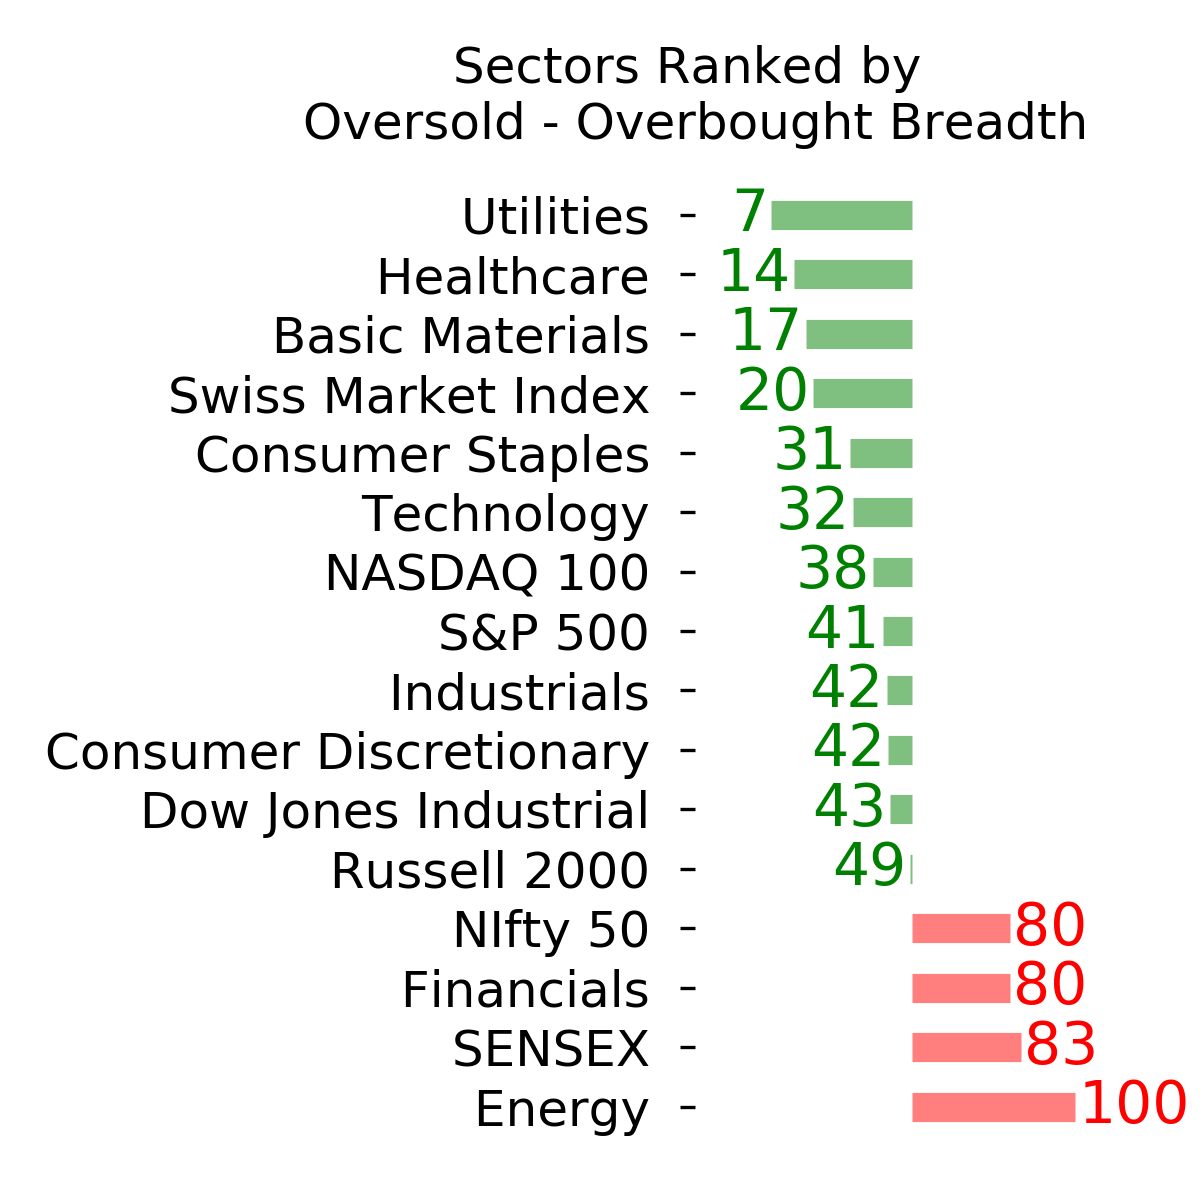
Ranks
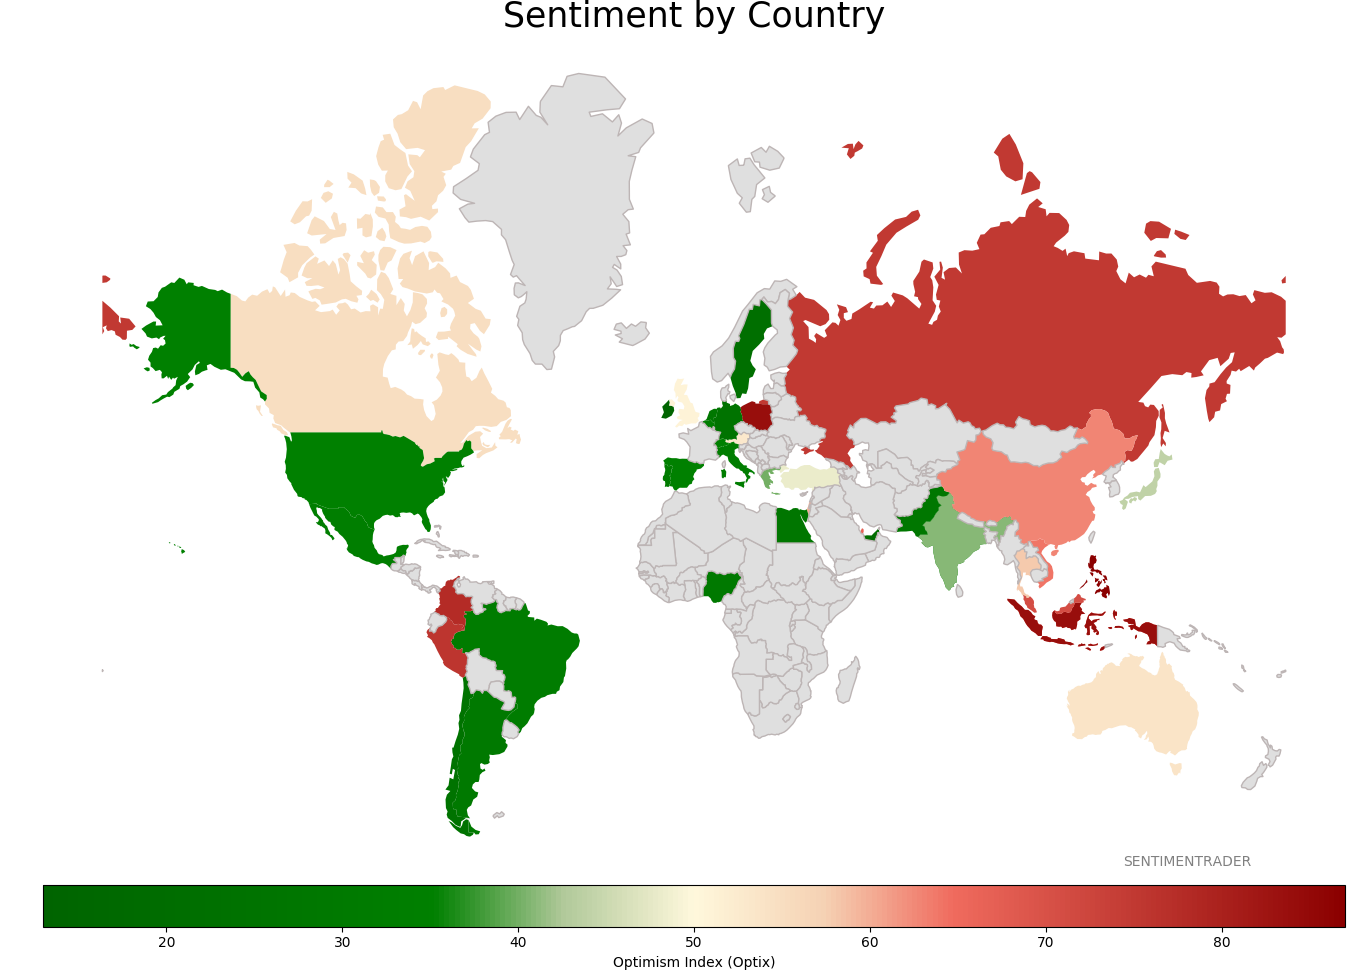
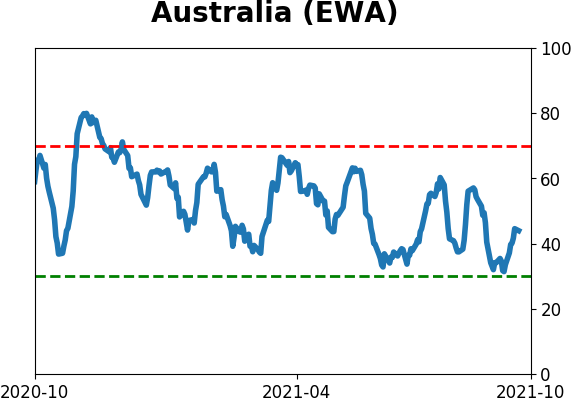
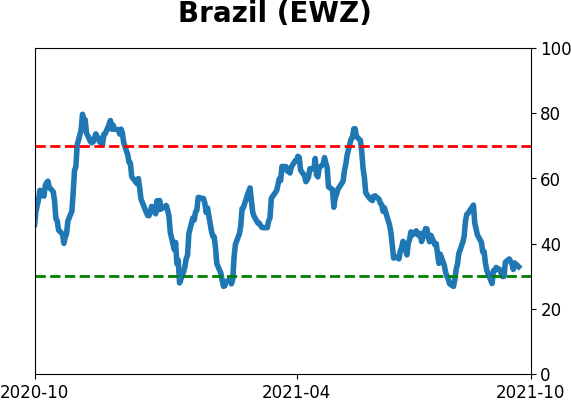
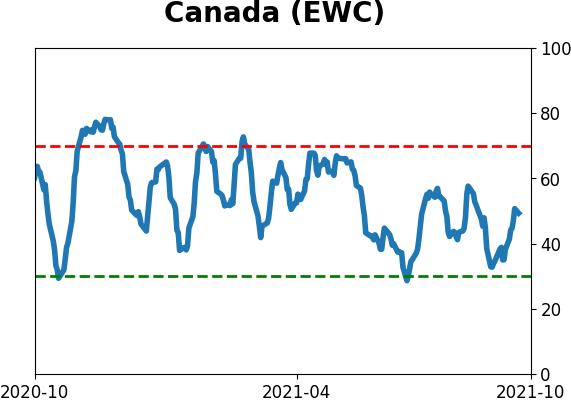
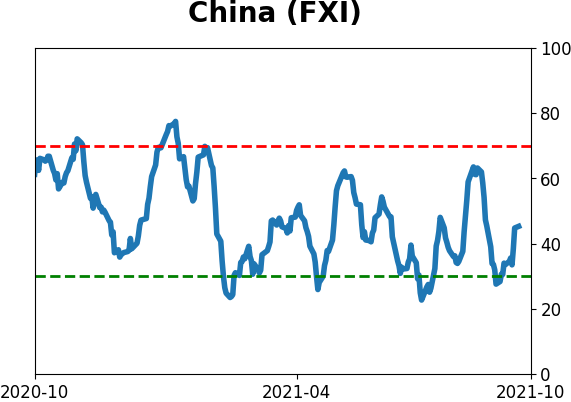
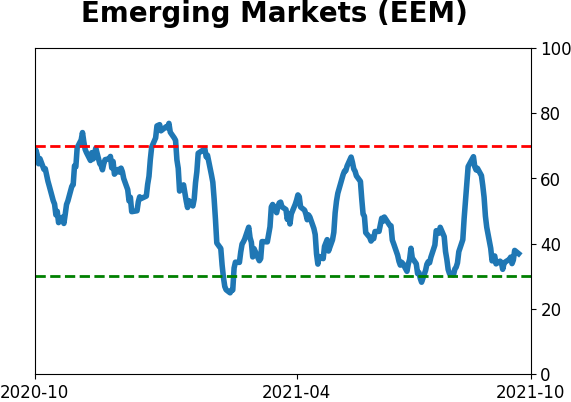
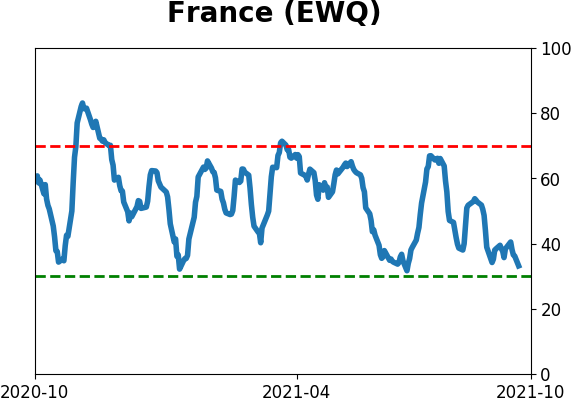
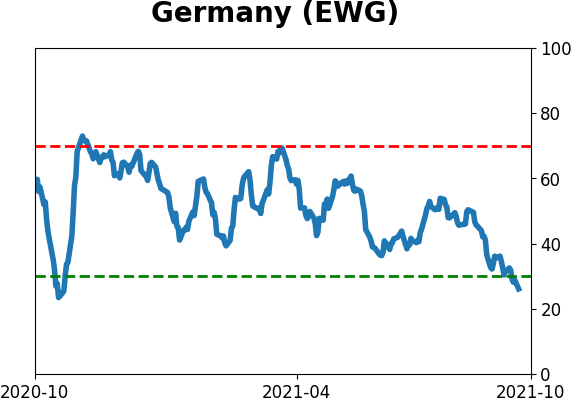
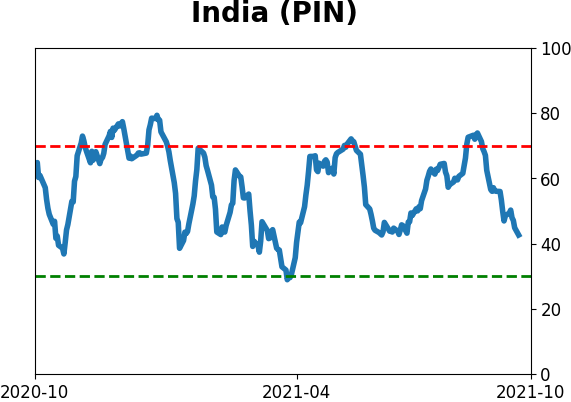
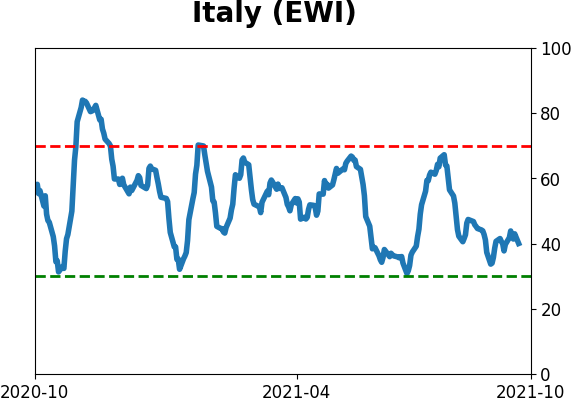
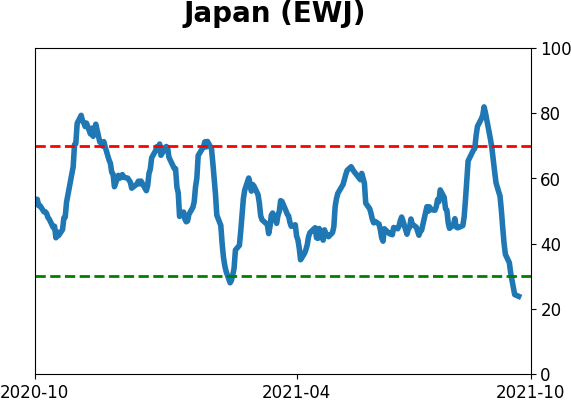
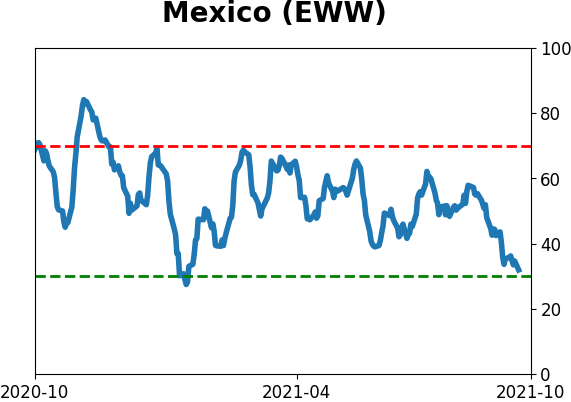
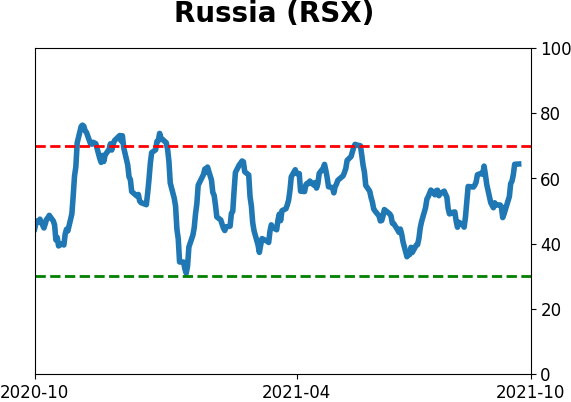
Sentiment Around The World
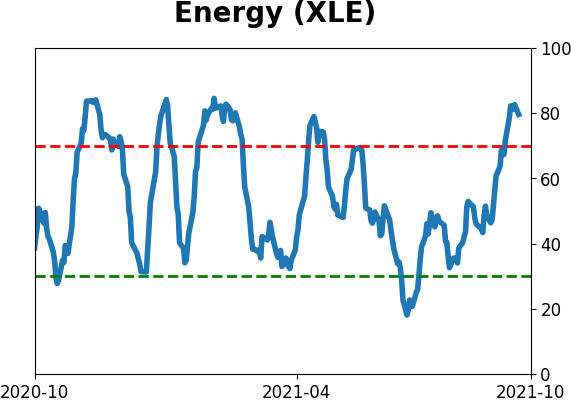
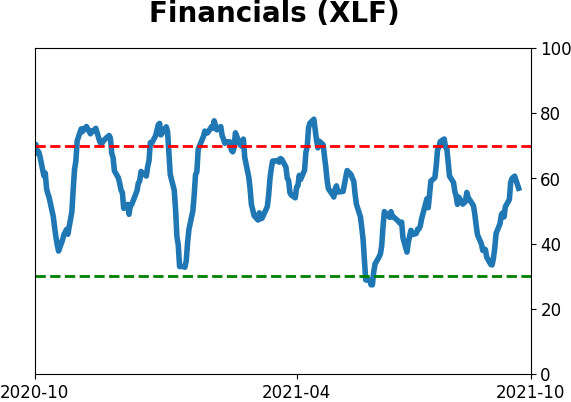
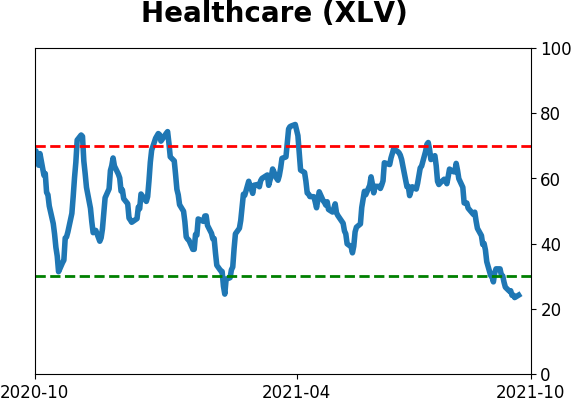
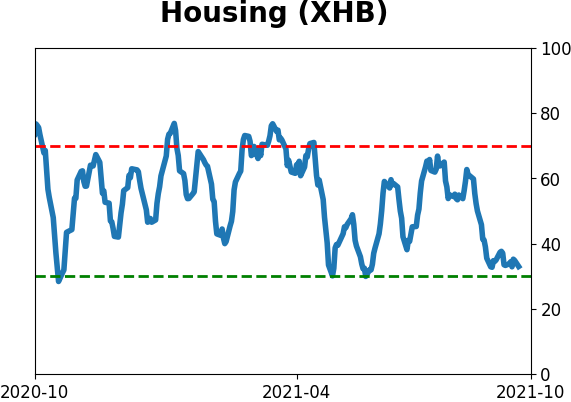
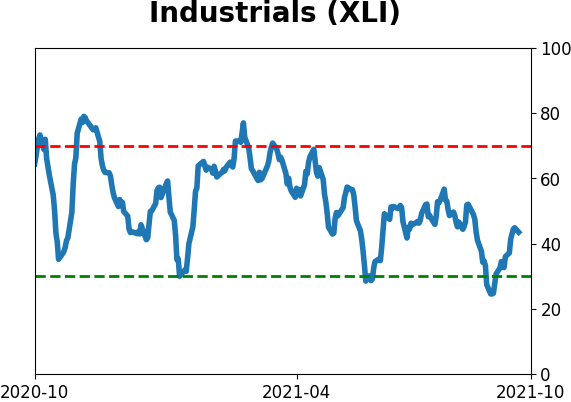
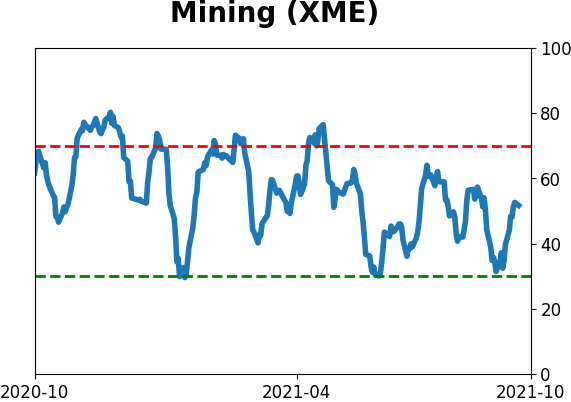
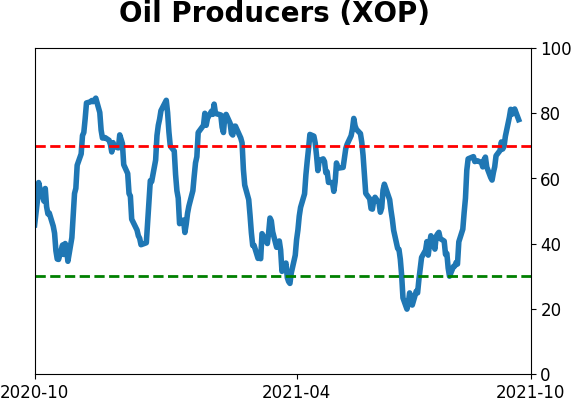
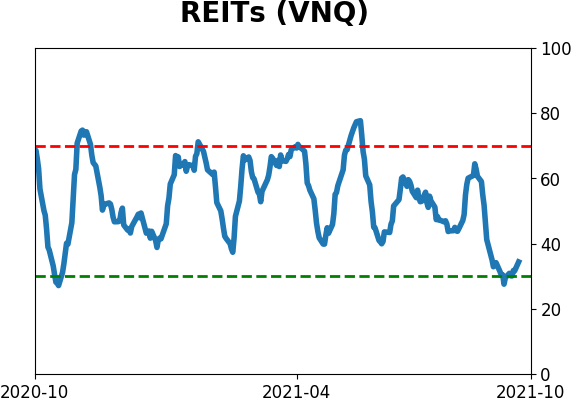
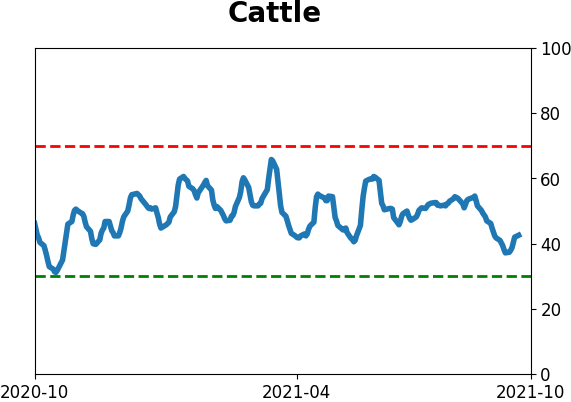
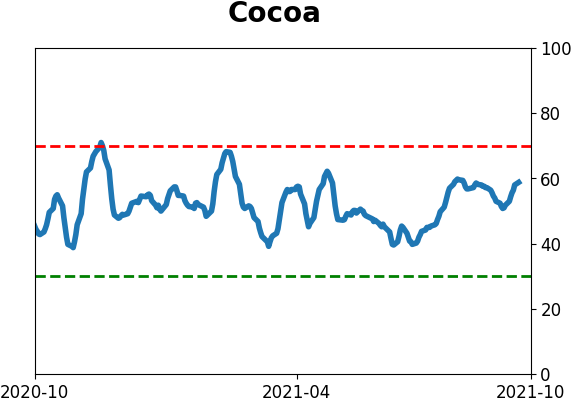
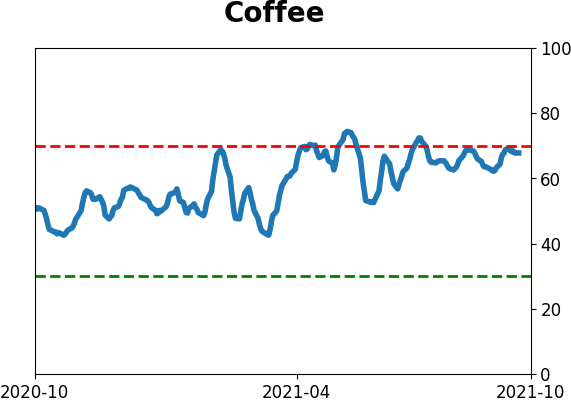
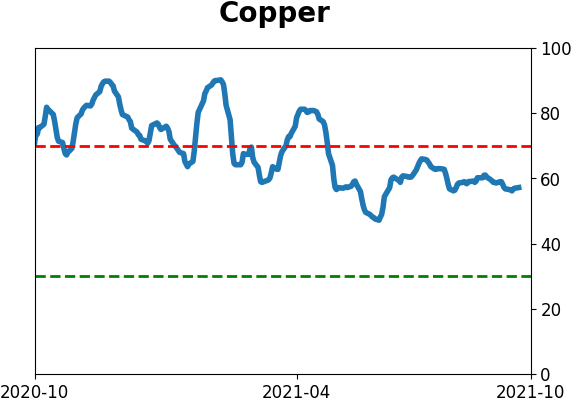
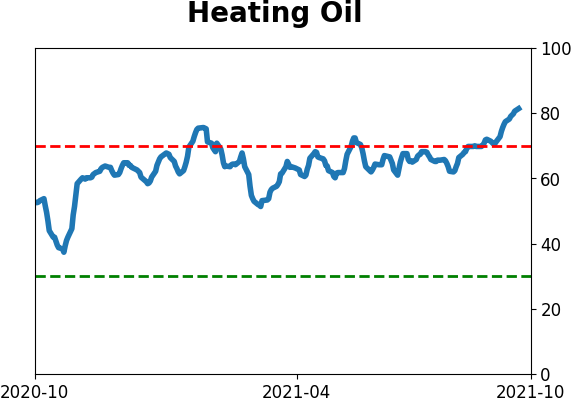
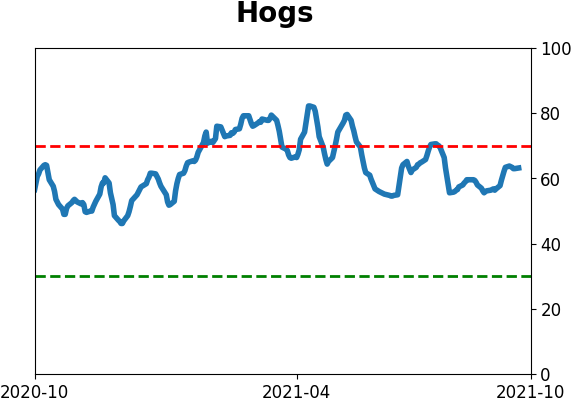
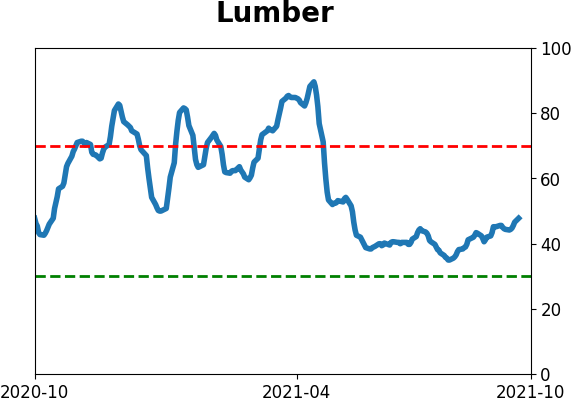
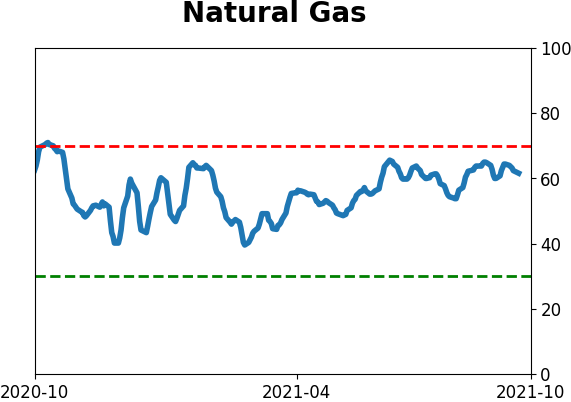
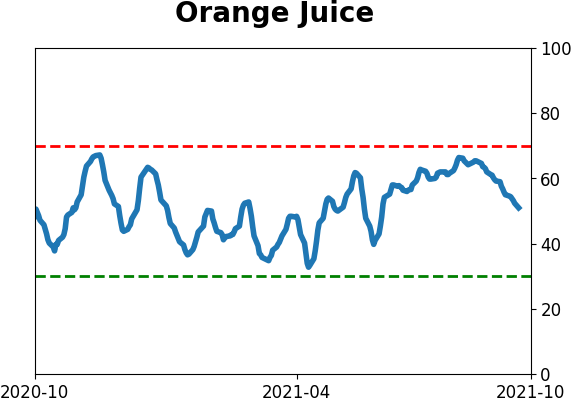
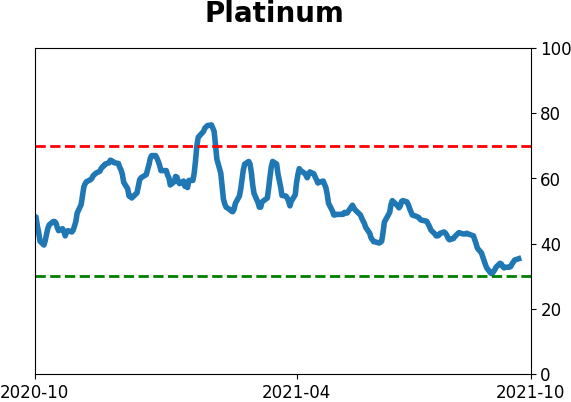
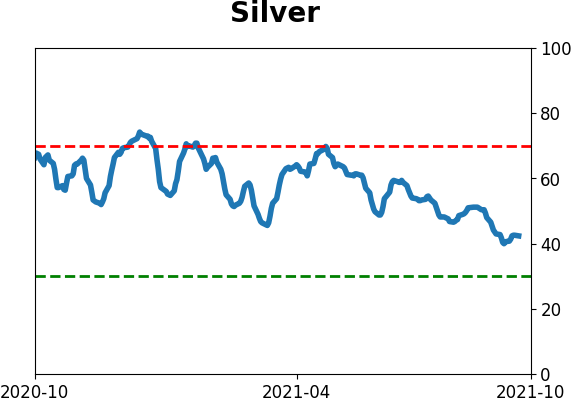
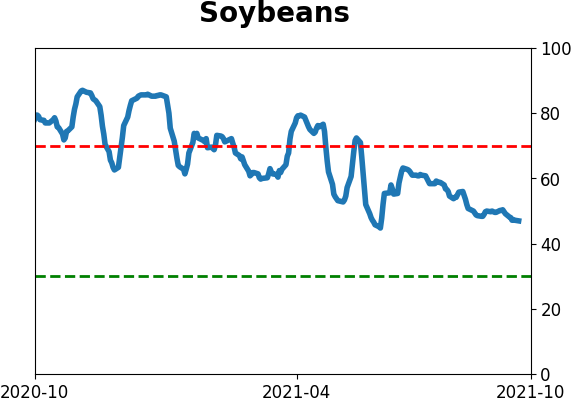
Optimism Index Thumbnails
|
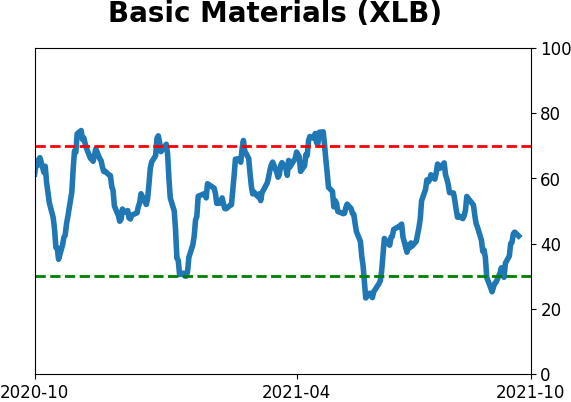
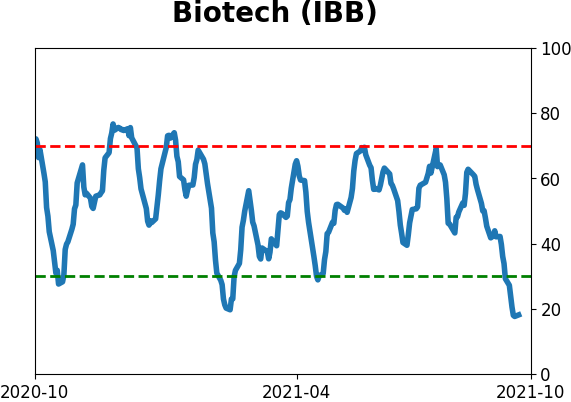
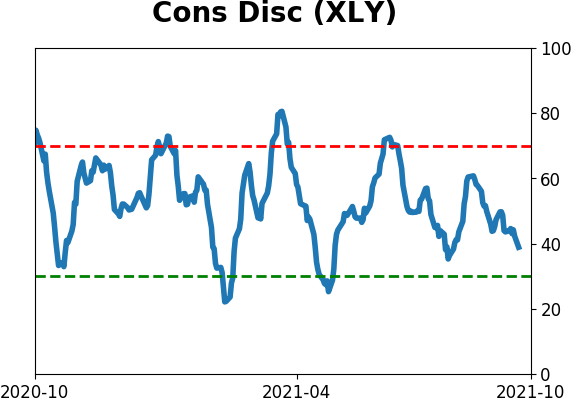
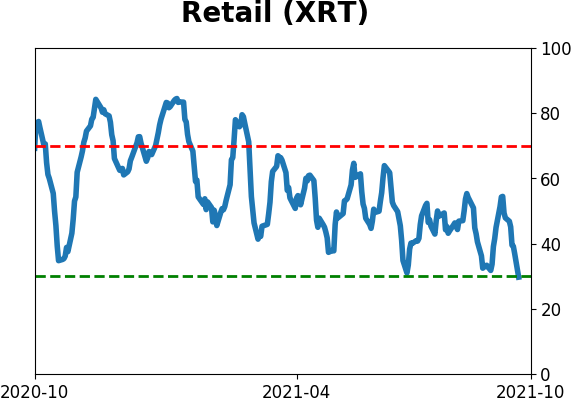
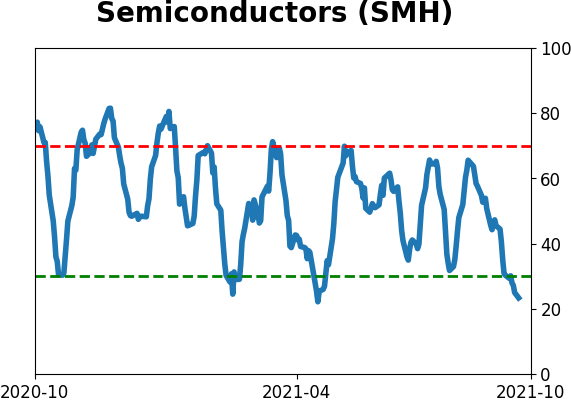
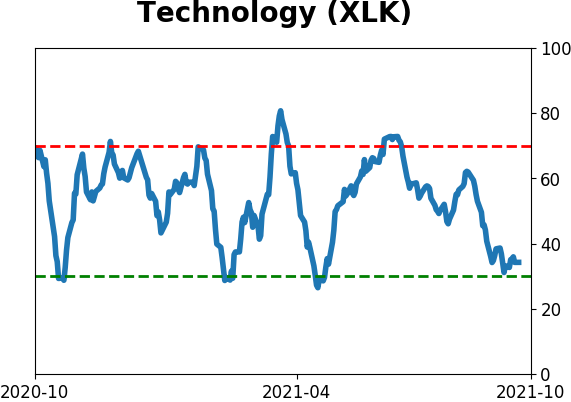
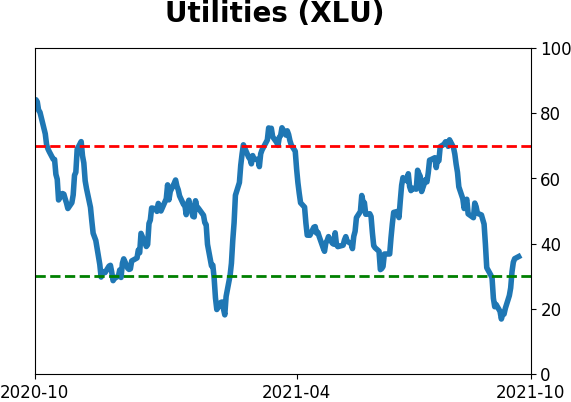
Sector ETF's - 10-Day Moving Average
|
|
|
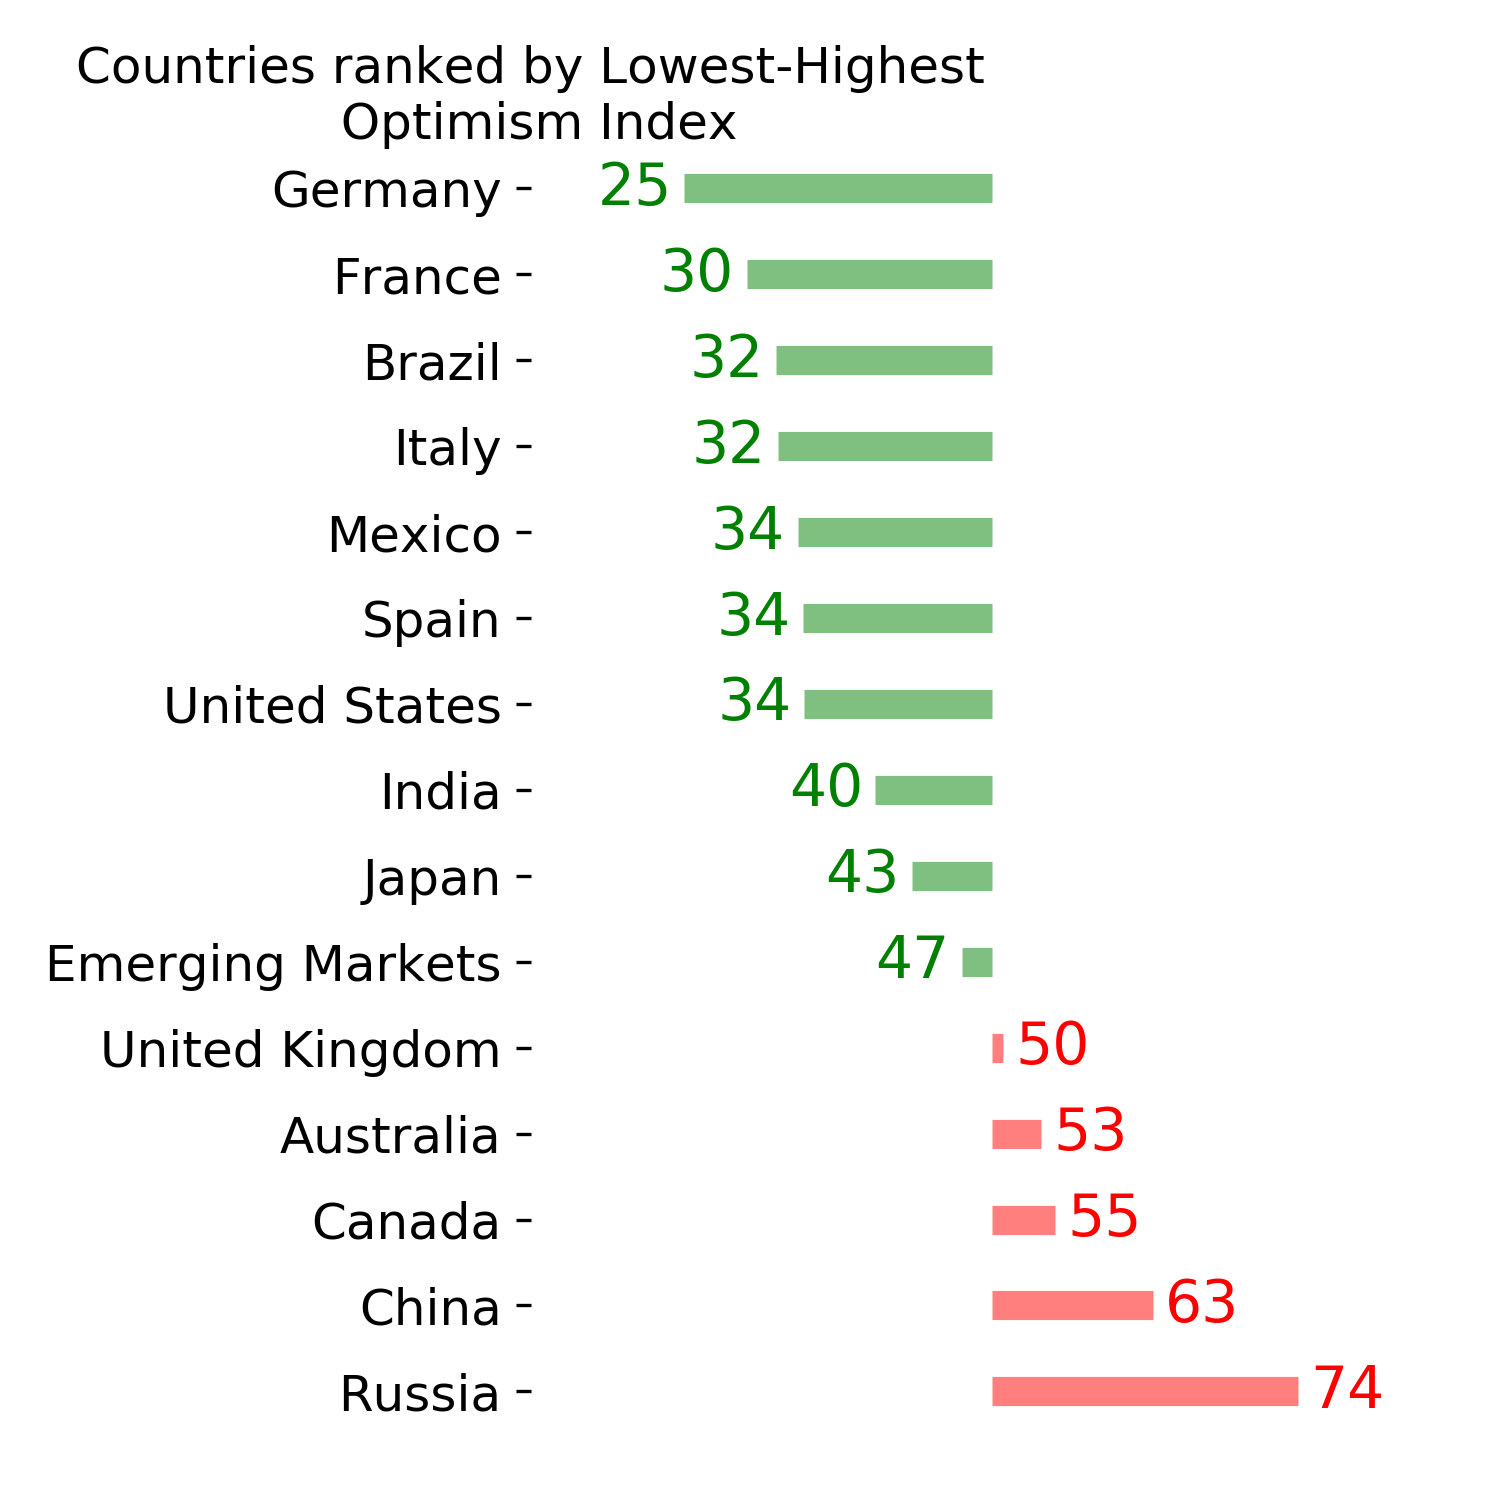
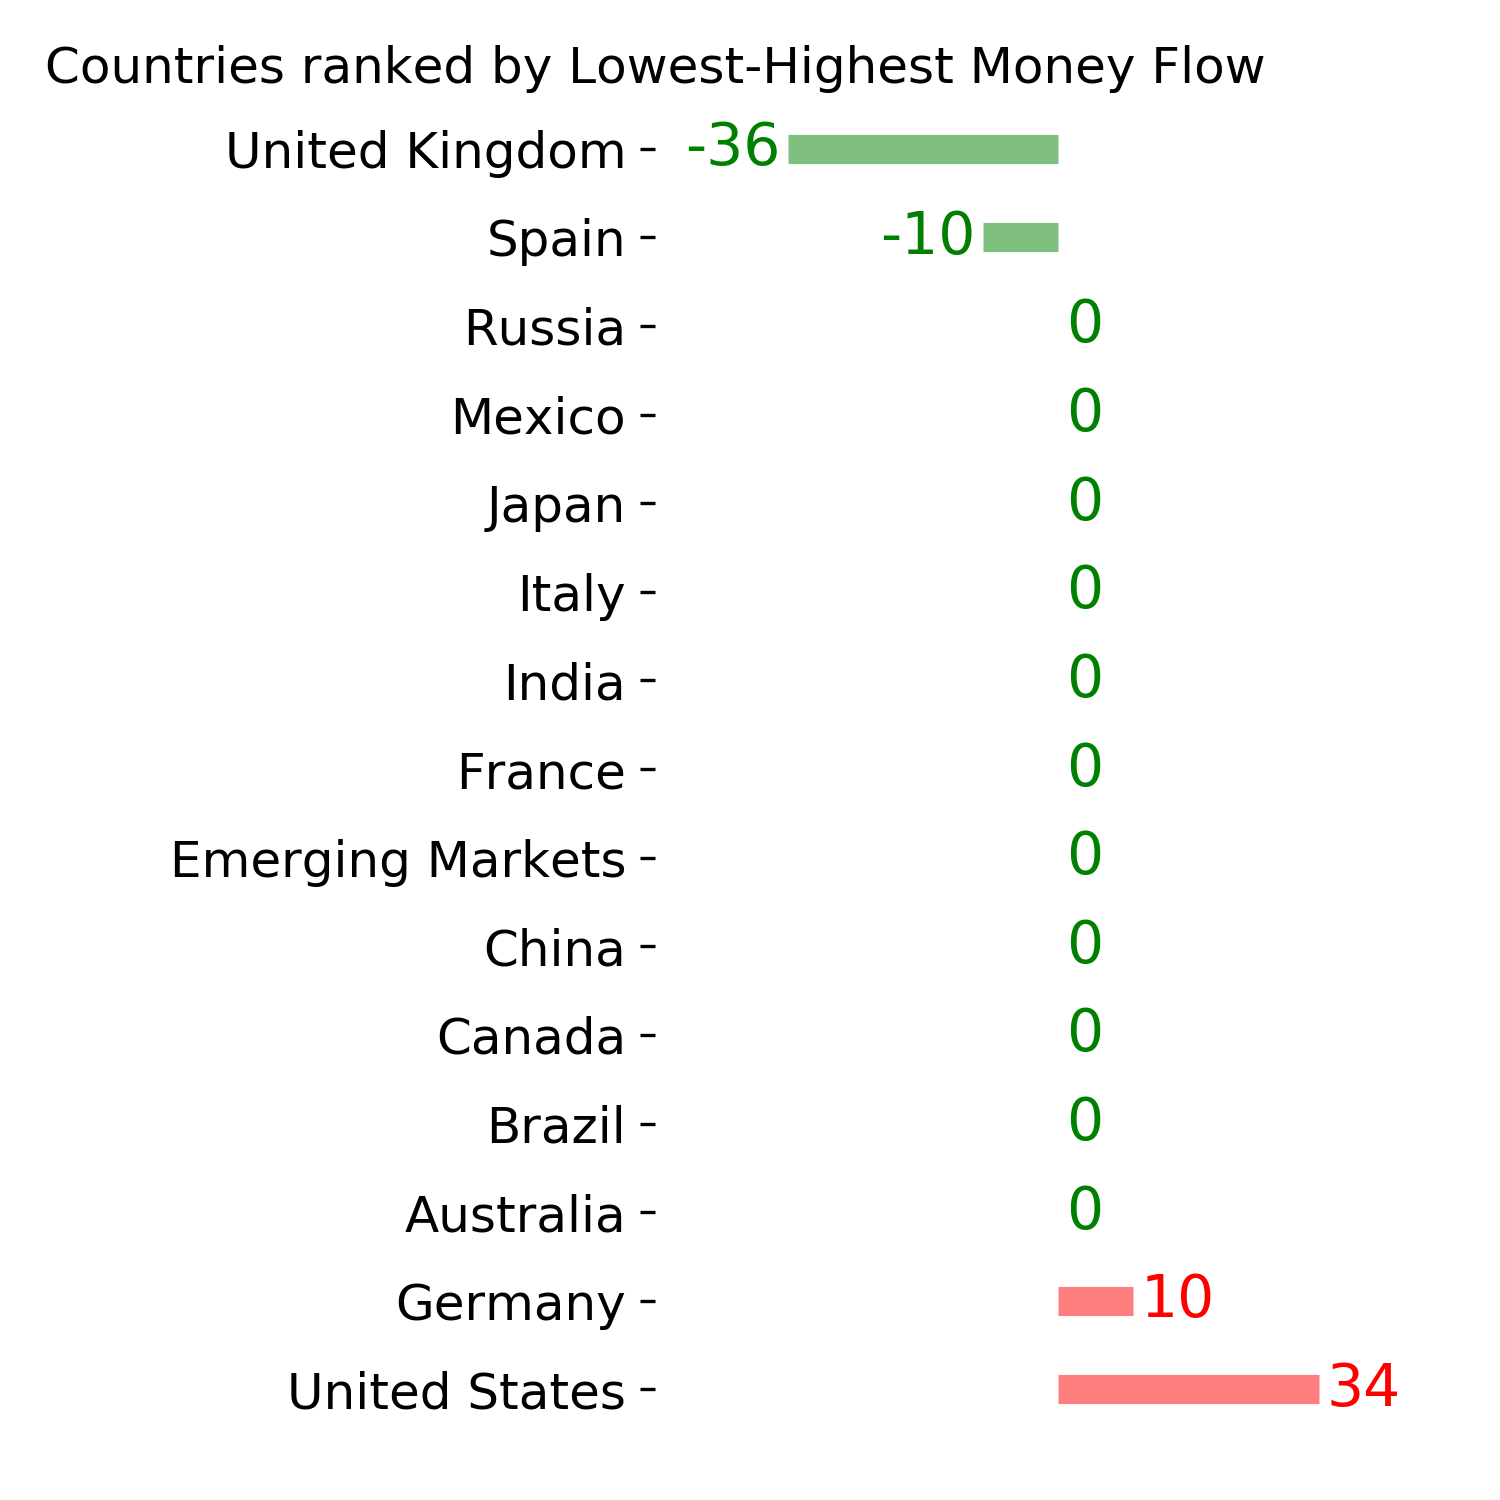
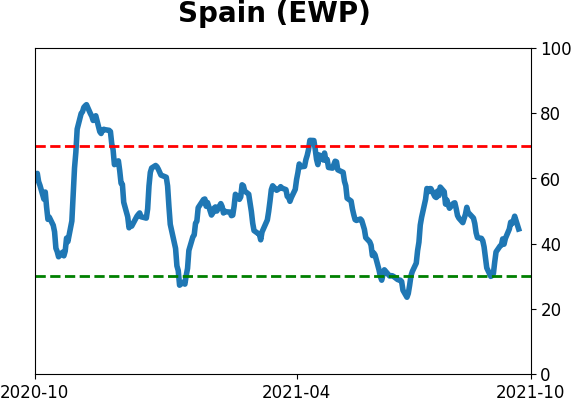
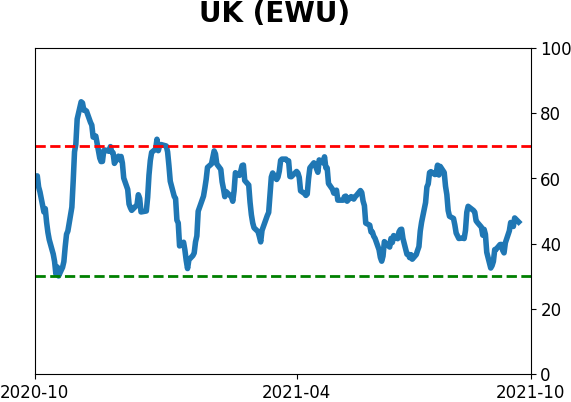
Country ETF's - 10-Day Moving Average
|
|
|
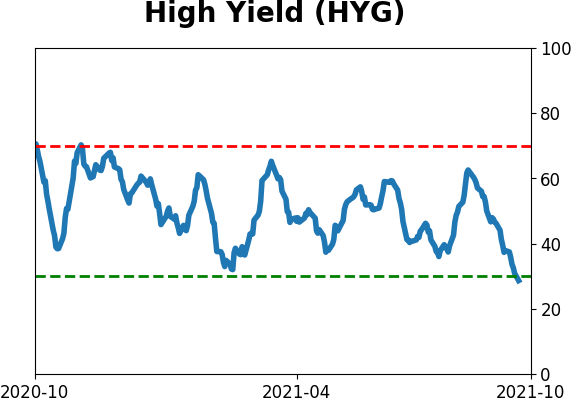
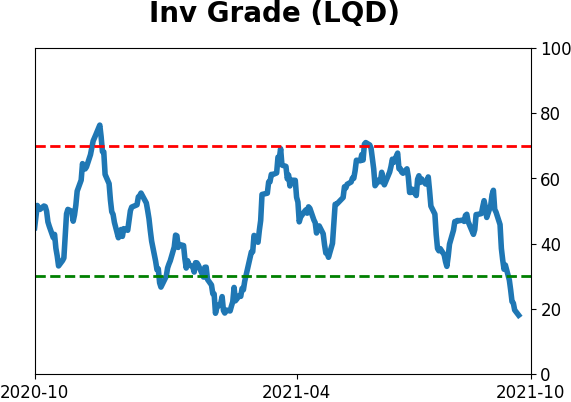
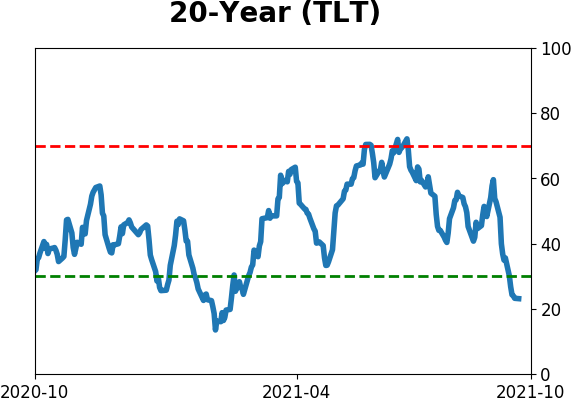
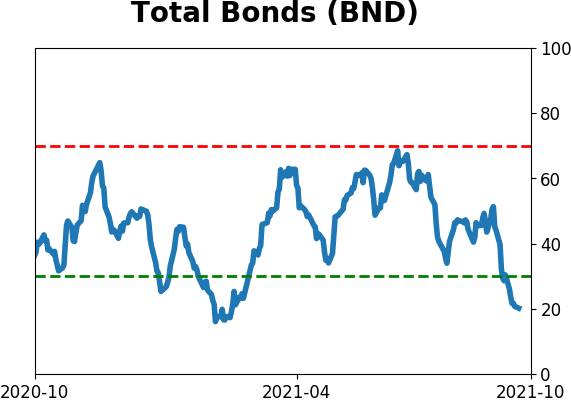
Bond ETF's - 10-Day Moving Average
|
|
|
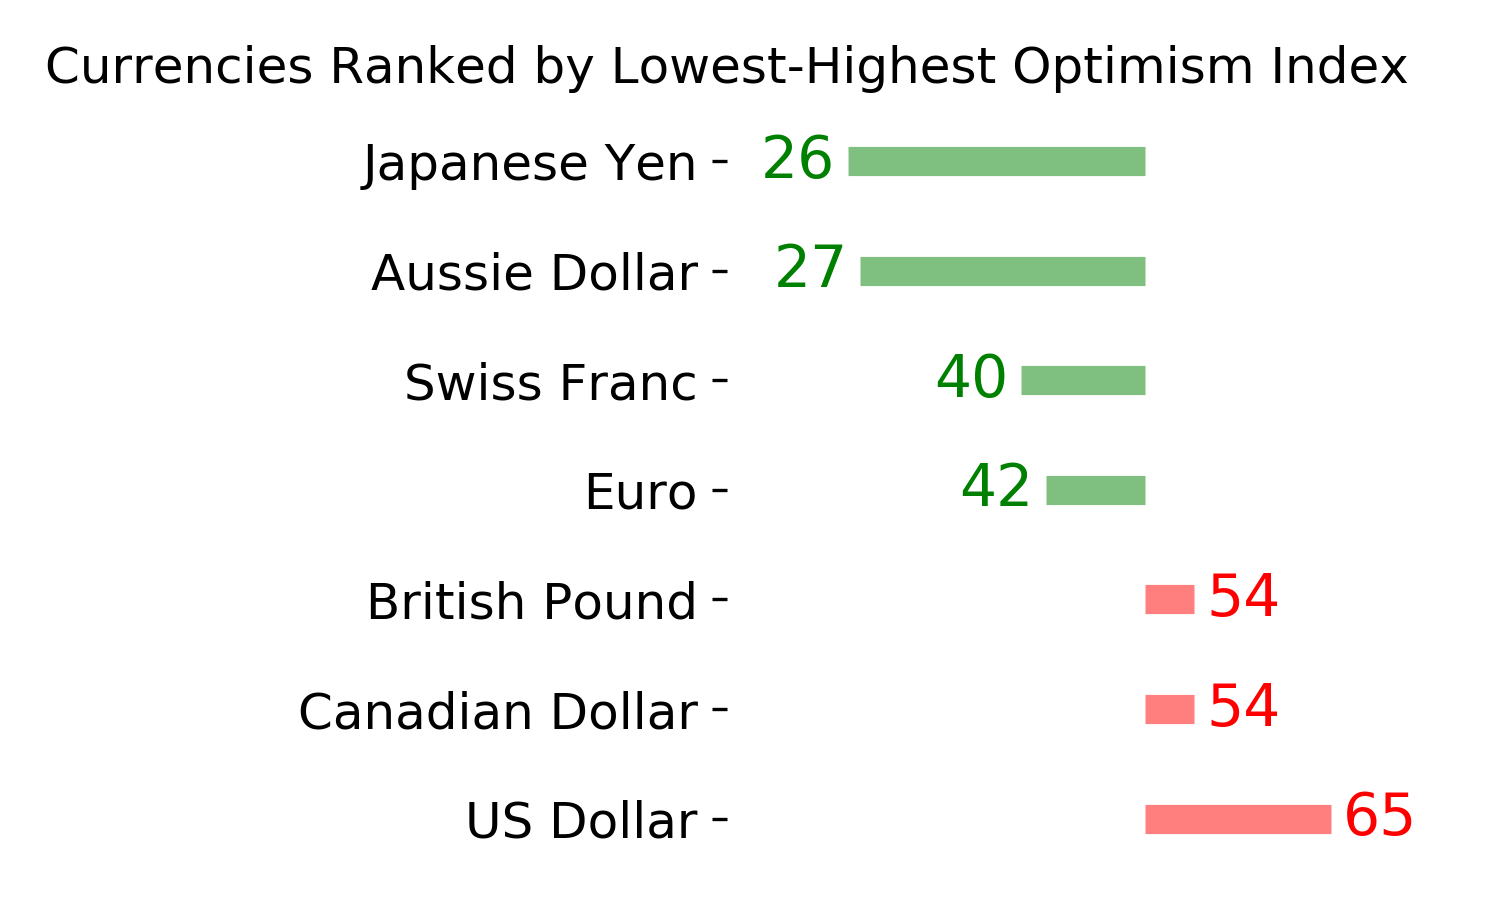
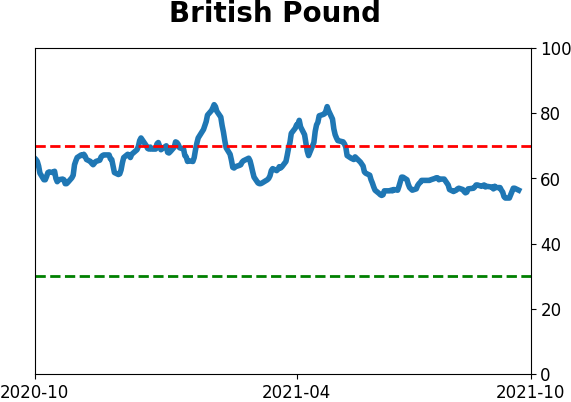
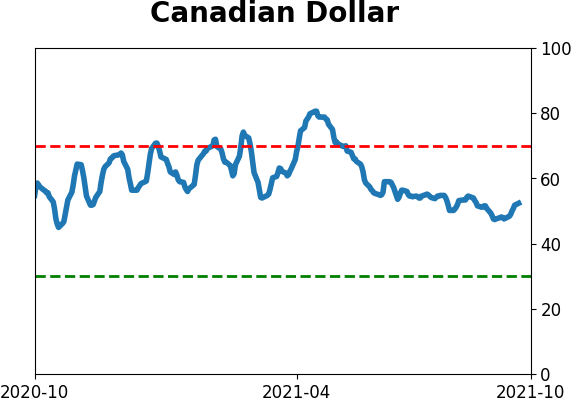
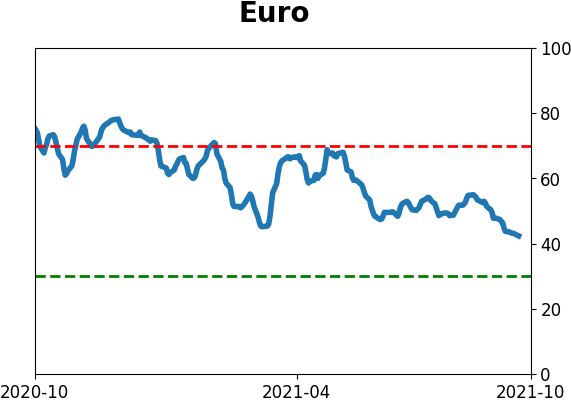
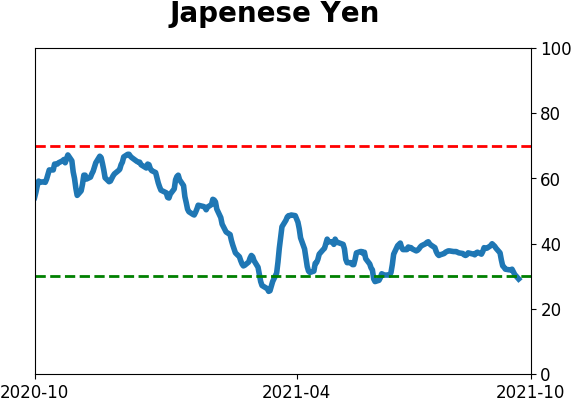
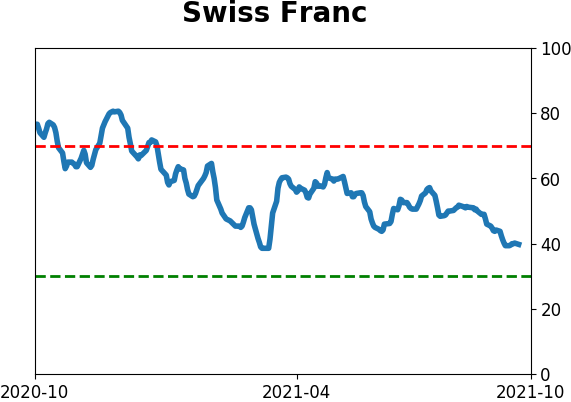
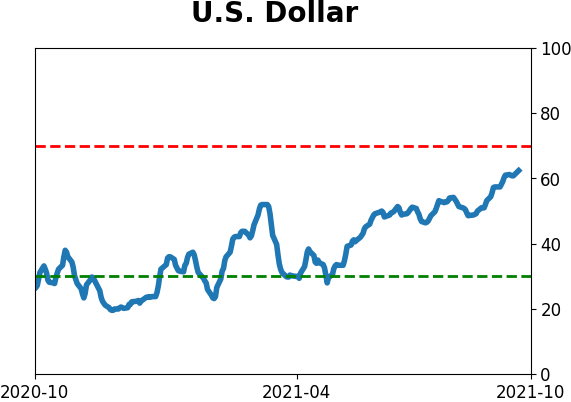
Currency ETF's - 5-Day Moving Average
|
|
|
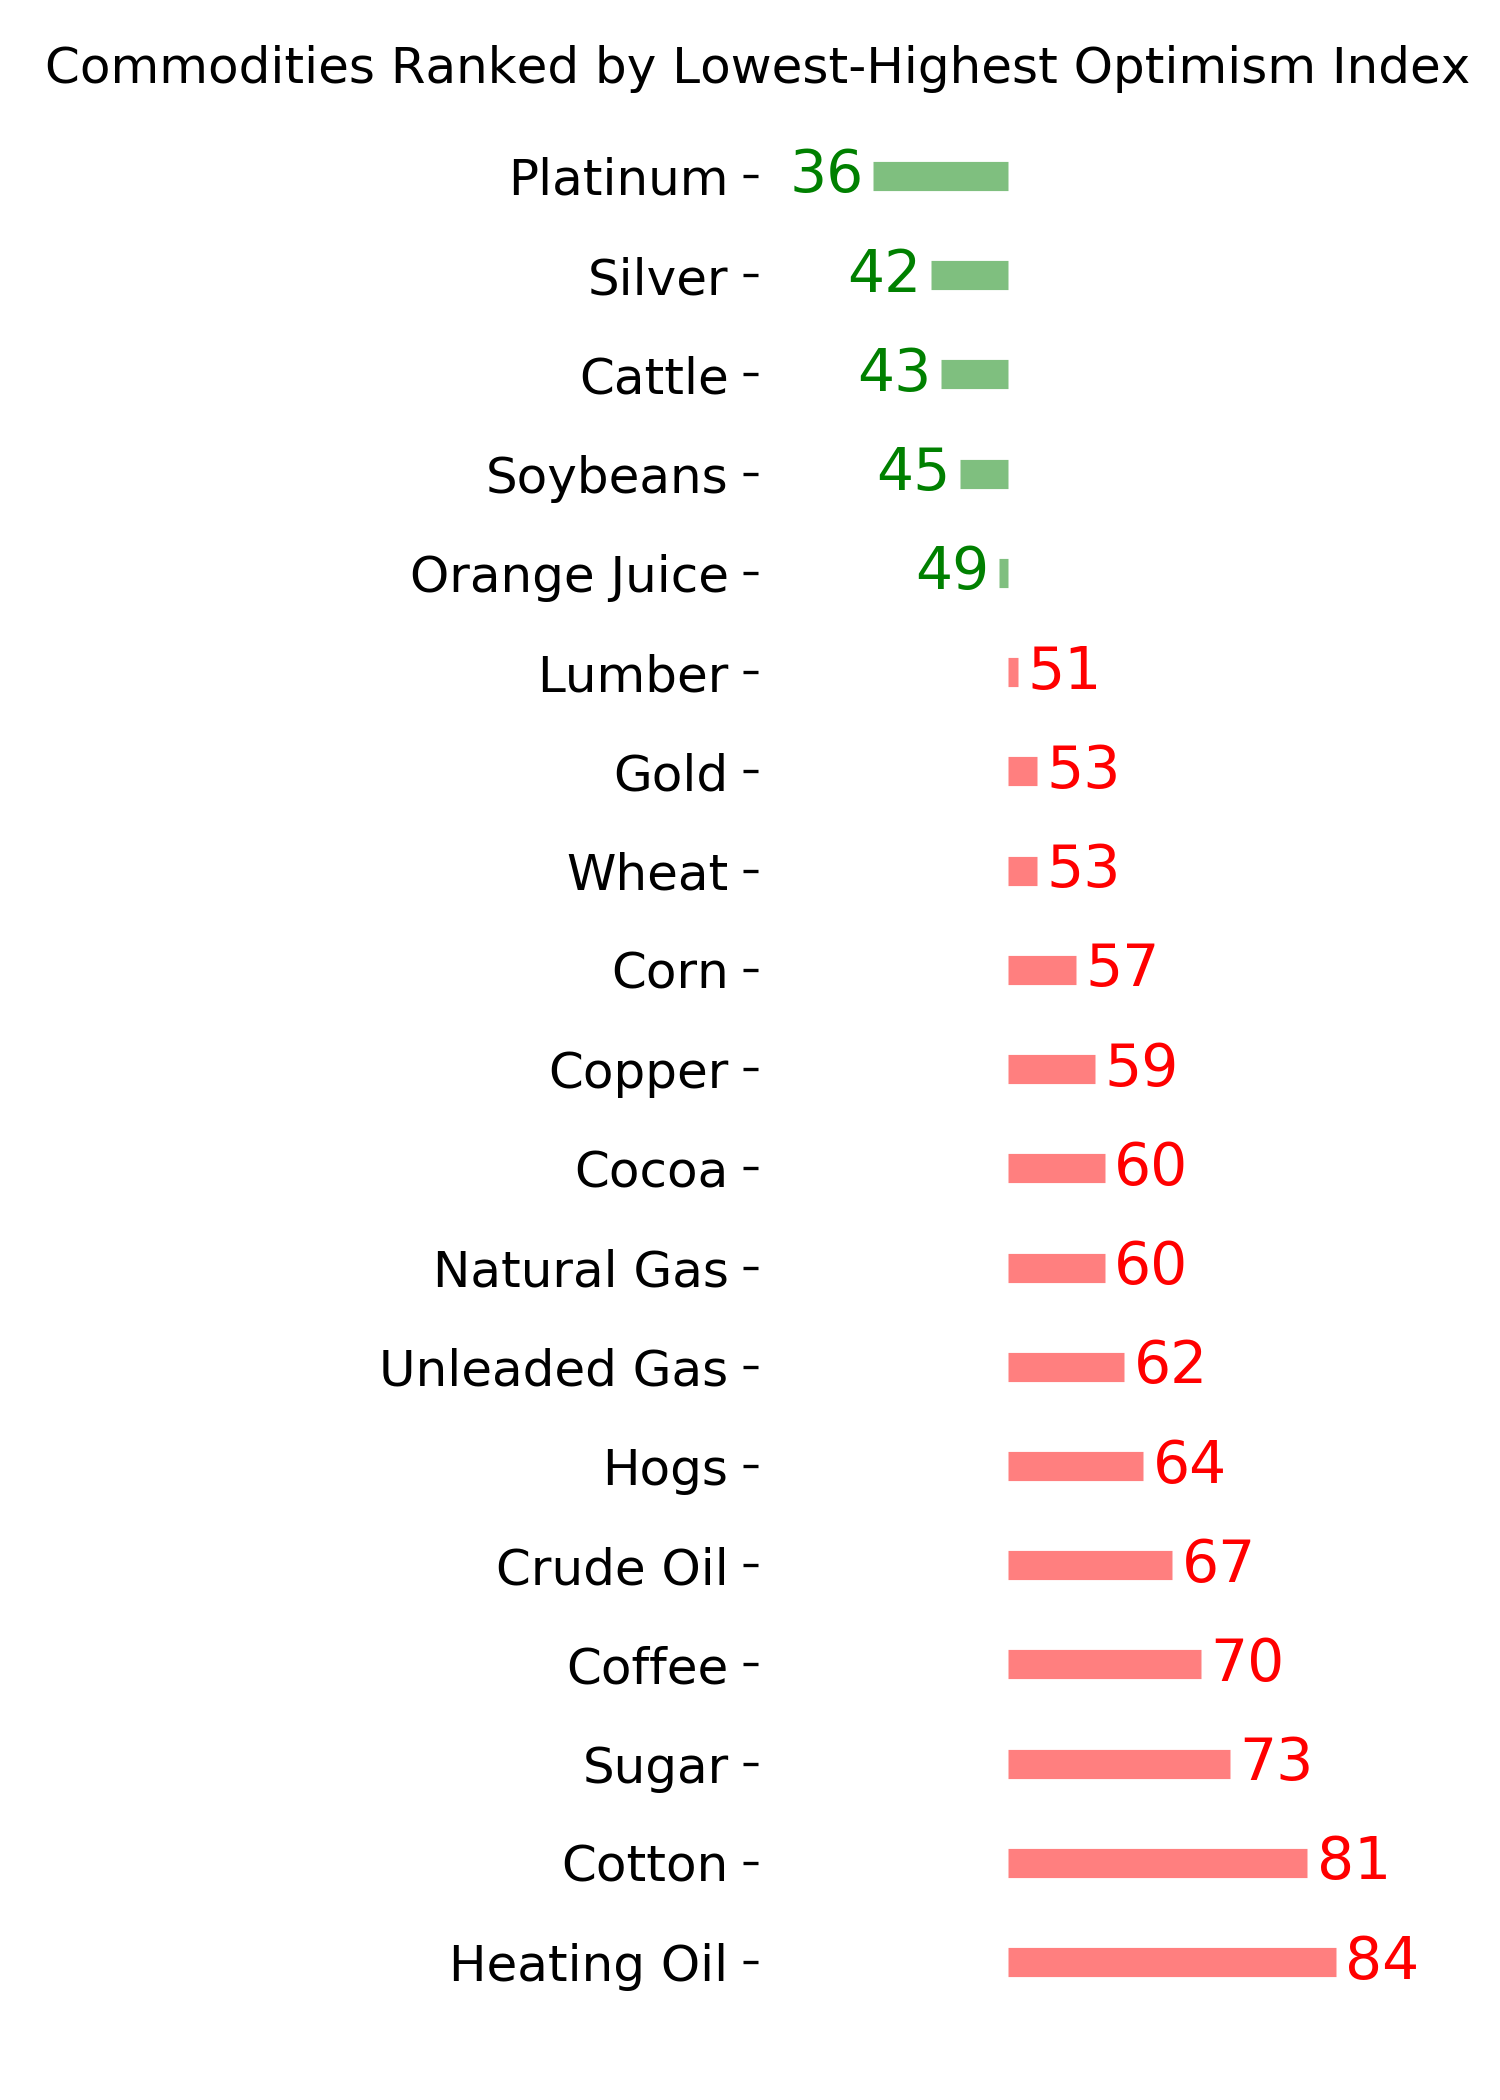
Commodity ETF's - 5-Day Moving Average
|
|