Headlines
|
|
The Most Extended Pullback in 200 Days:
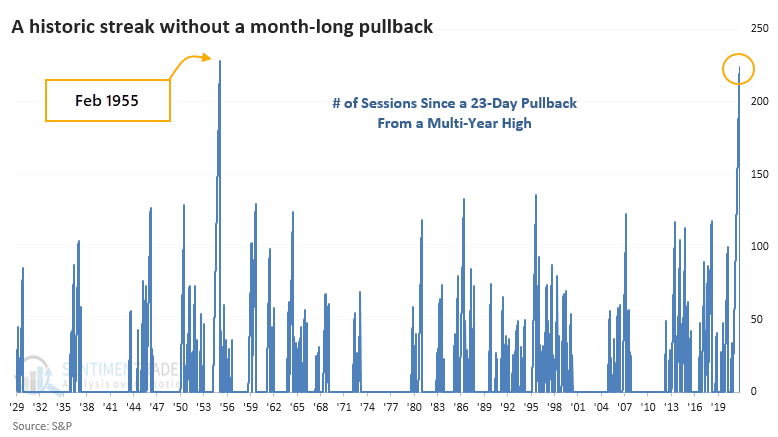
The S&P 500 has gone 23 trading days without setting a new high, it longest stretch in over 200 days, the 2nd-longest in history. Other times when the index finally suffered a 23-day pullback, buyers tended to flood in and drive stocks higher in the months ahead.
Bottom Line:
STOCKS: Weak buy
The speculative frenzy in February is wrung out. There are some signs of pessimism, but the most compelling data show that buyers consistently tend to return once the first signs of extreme momentum end, especially as we head into a seasonally positive time of year. See the Outlook & Allocations page for more. BONDS: Hold
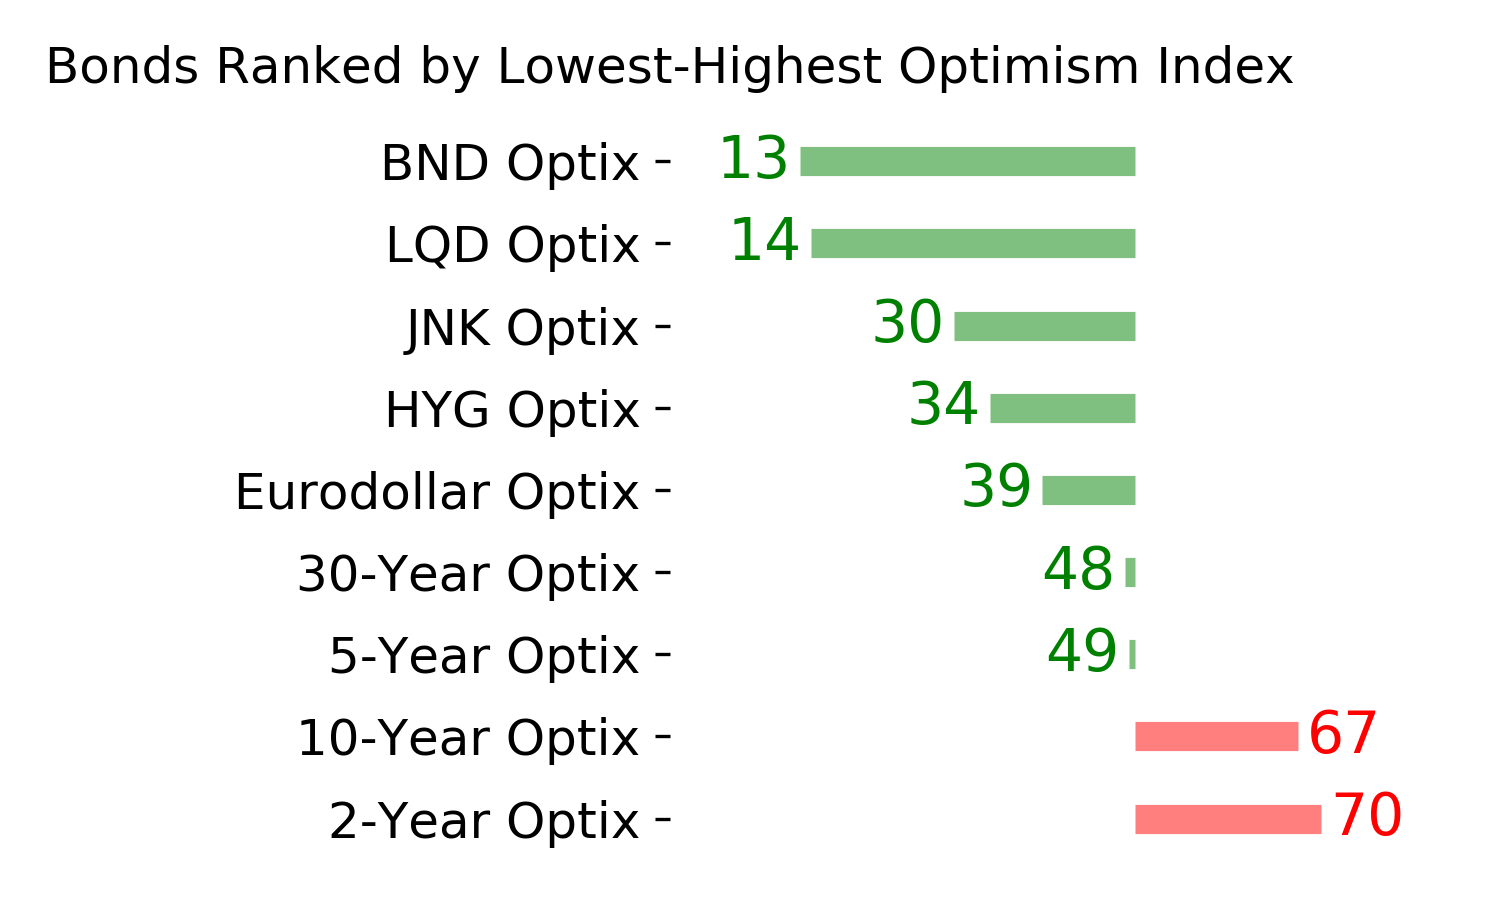
Various parts of the market got hit in March, with the lowest Bond Optimism Index we usually see during healthy environments. Bond prices have modest recovered and there is no edge among the data we follow. GOLD: Hold
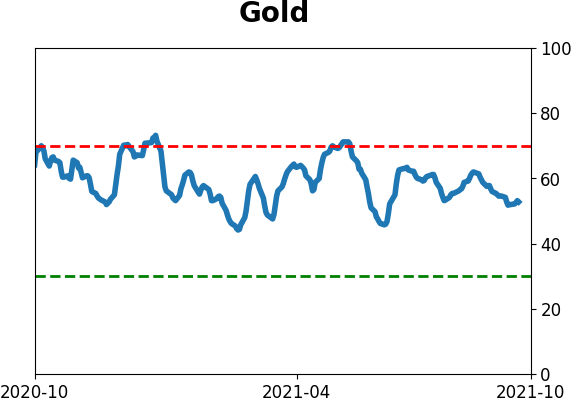
Gold and miners were rejected after trying to recover above their 200-day averages in May. Lately, some medium-term (not long-term) oversold extremes in breadth measures among miners have triggered.
|
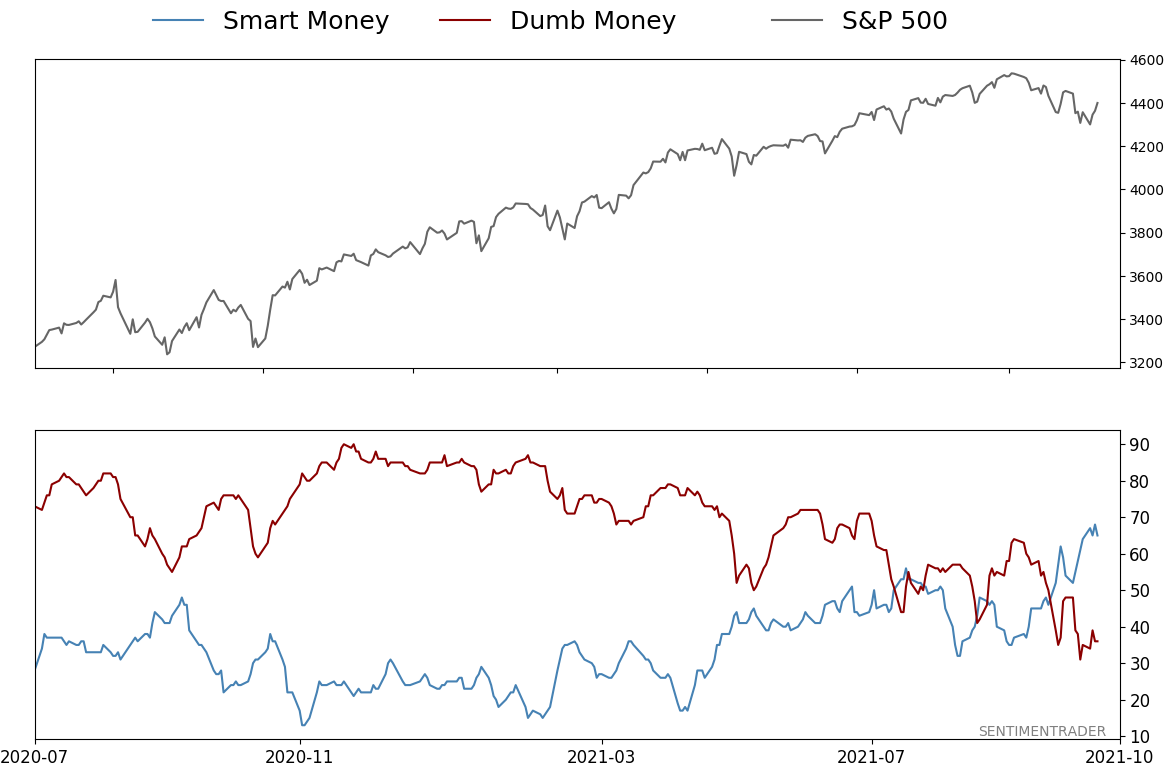
Smart / Dumb Money Confidence
|
Smart Money Confidence: 65%
Dumb Money Confidence: 36%
|
|
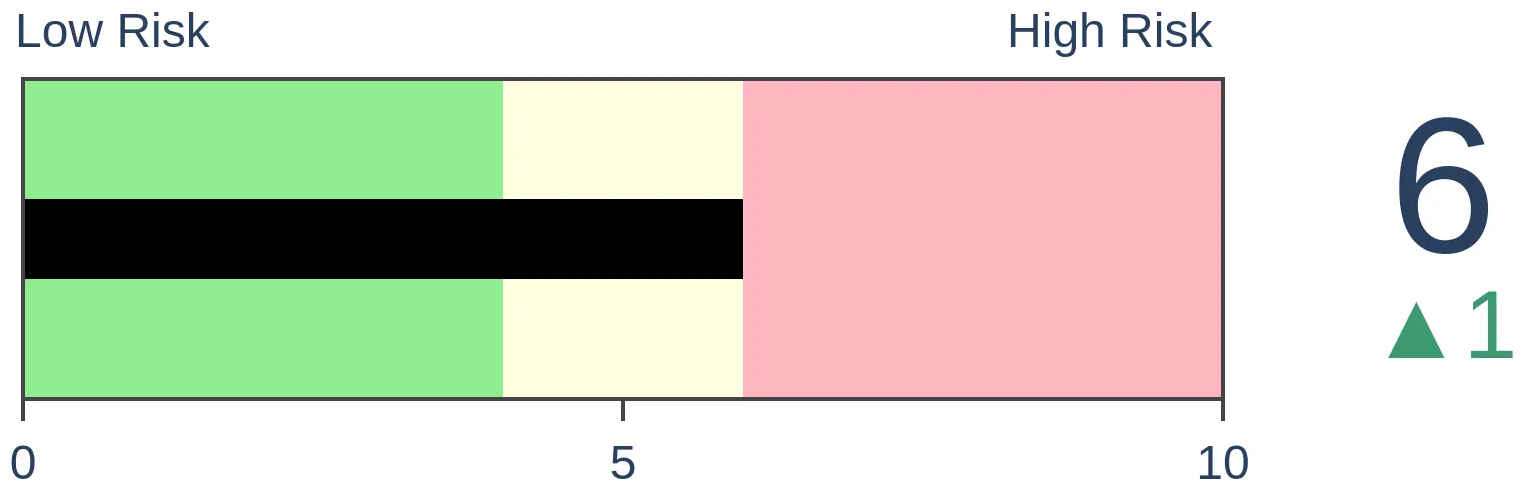
Risk Levels
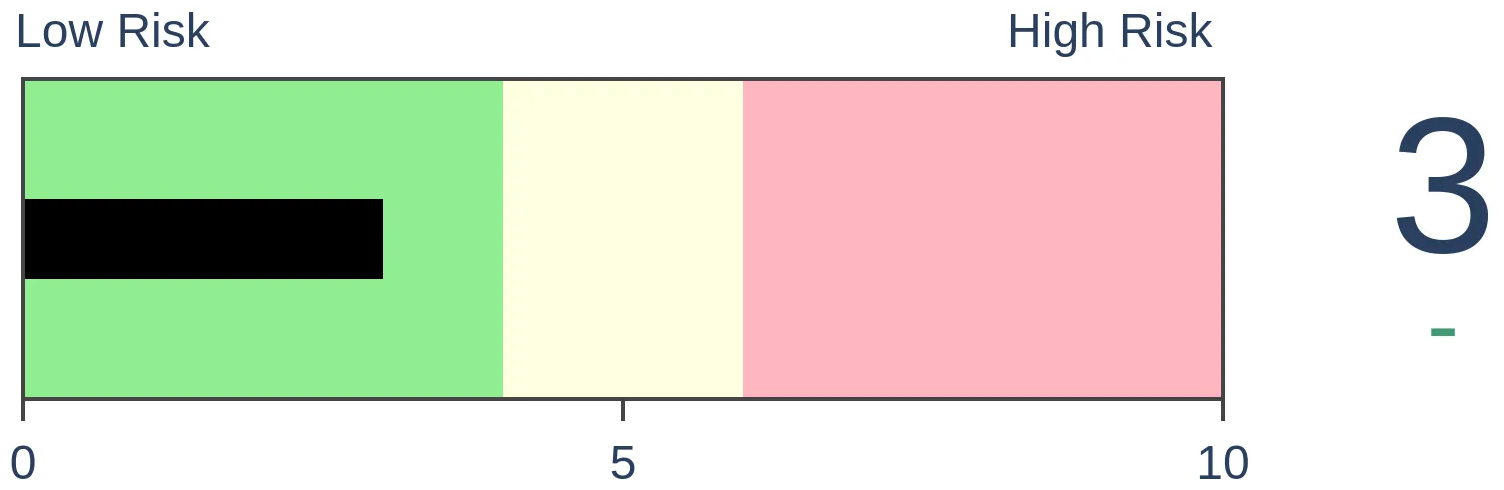
Stocks Short-Term
|
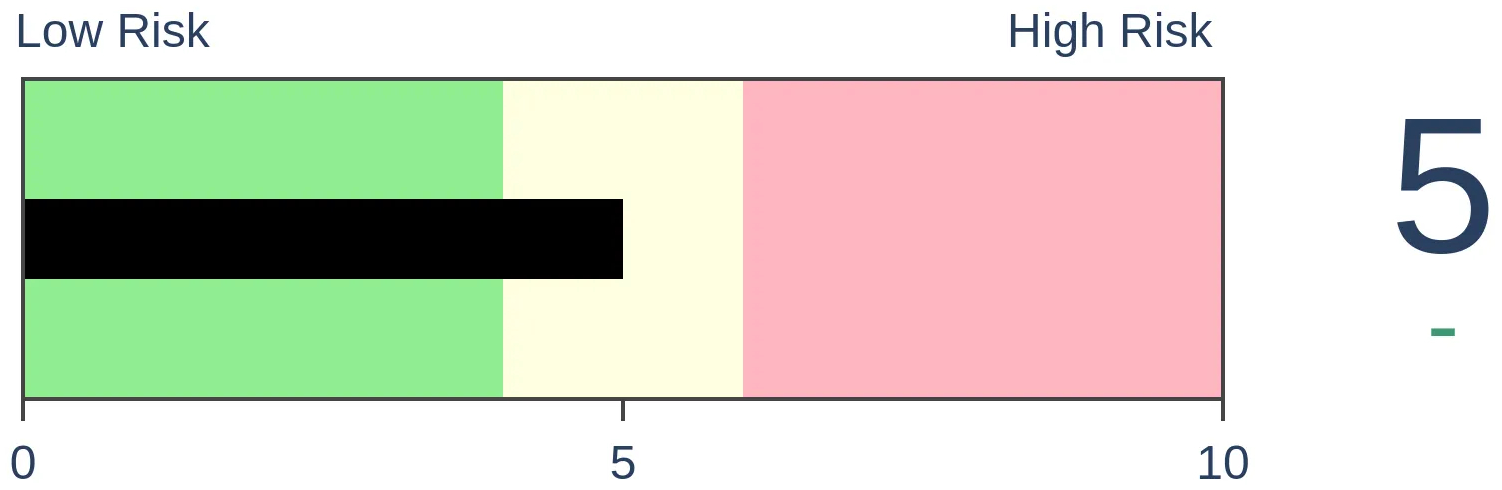
Stocks Medium-Term
|
|
Bonds

|
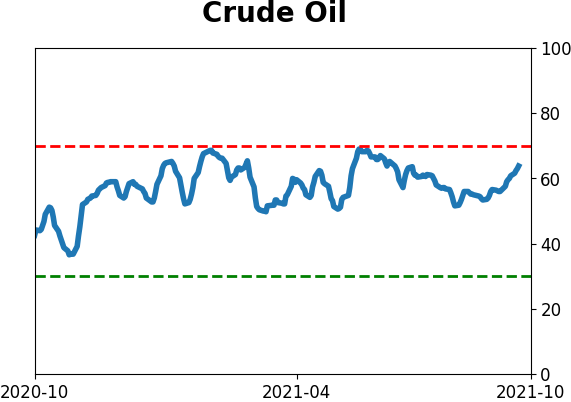
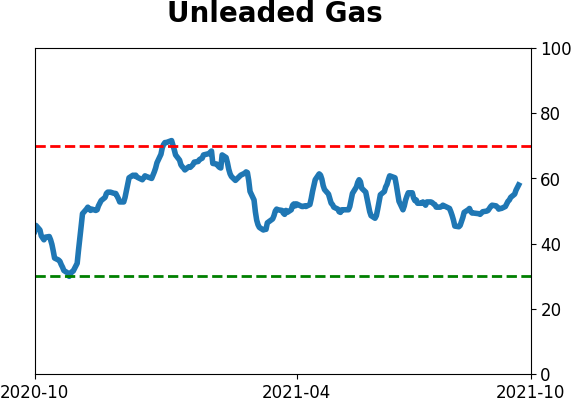
Crude Oil

|
|
Gold
|
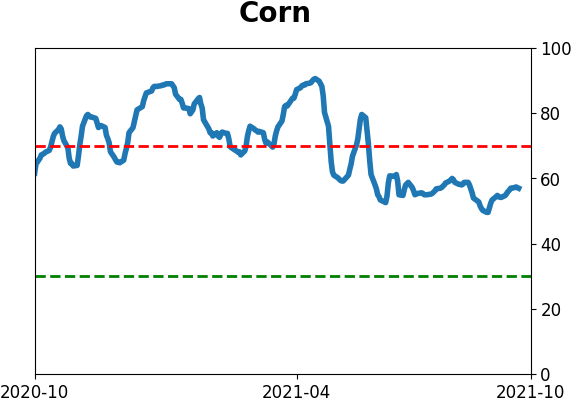
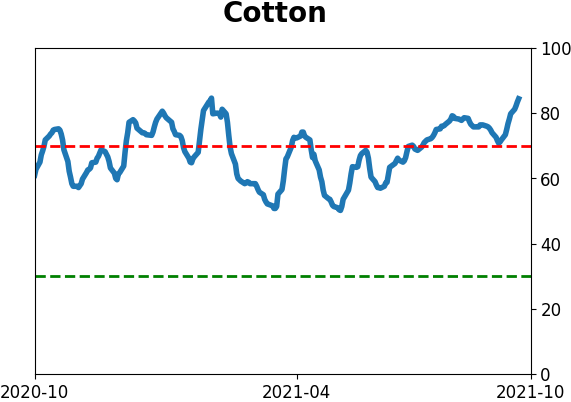
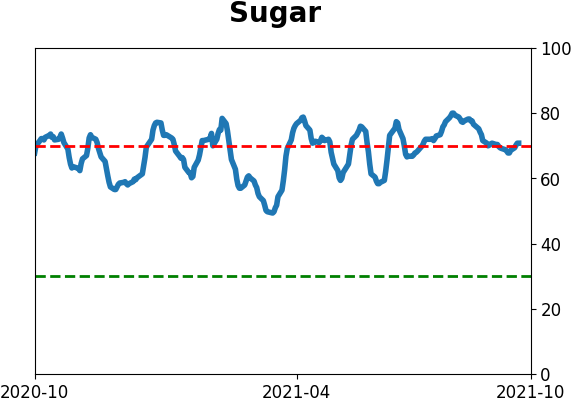
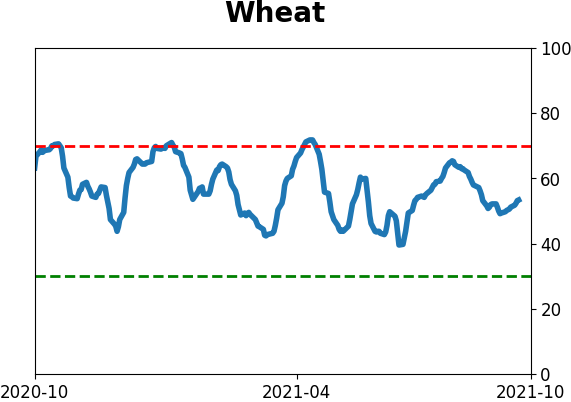
Agriculture
|
|
Research
By Jason Goepfert
BOTTOM LINE
The S&P 500 has gone 23 trading days without setting a new high, it longest stretch in over 200 days, the 2nd-longest in history. Other times when the index finally suffered a 23-day pullback, buyers tended to flood in and drive stocks higher in the months ahead.
FORECAST / TIMEFRAME
SPY -- Up, Medium-Term
|
Last August, the S&P 500 did what was unthinkable just a few months prior - it broke out to a new all-time high.
Soon after, stocks saw a bit of a blow-off peak, and the S&P didn't regain its highs until November. And it hasn't looked back since. The most protracted pullback that investors suffered was 22 days in June. Until now.
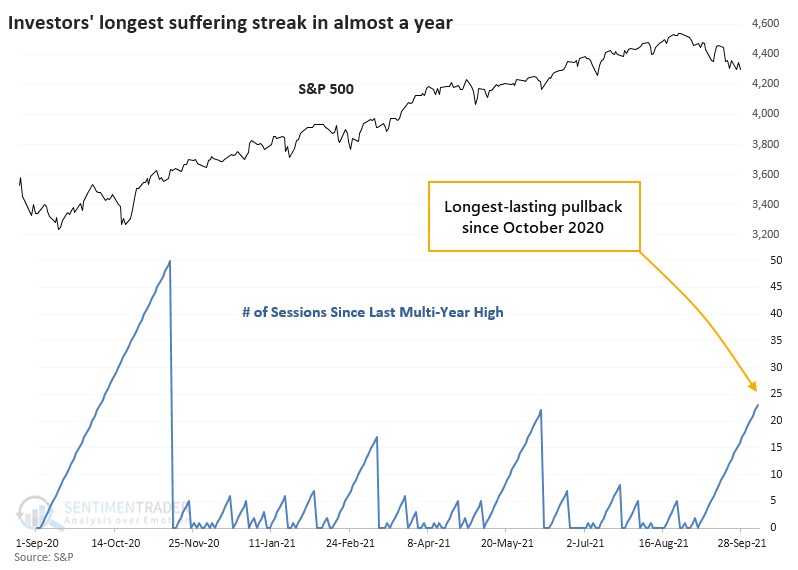
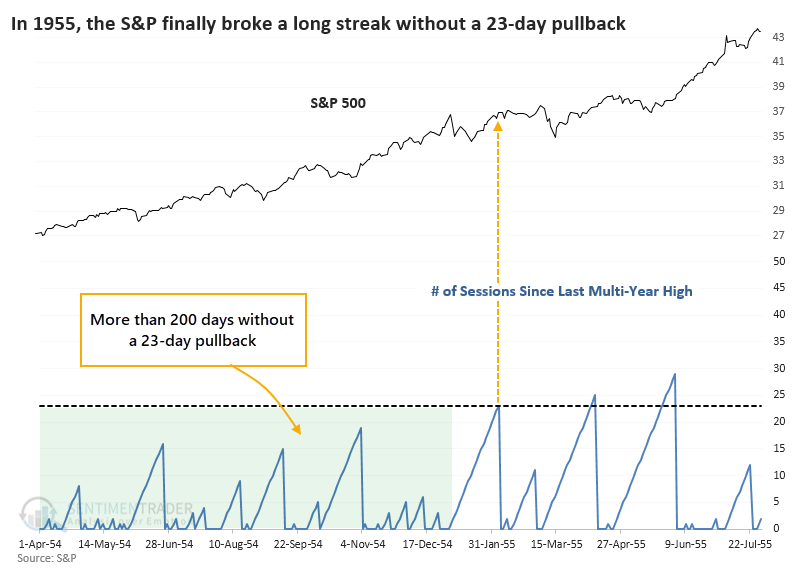
This ends a near-record run with investors not having to suffer more than 22 days without seeing a new multi-year high (not considering bear markets). The only period that exceeded our current run, and that was just barely, ended in February 1955.
Buyers came in immediately after that streak ended, setting a new high the next day, and pushed the S&P 500 higher by a couple of percentage points over the next month. It did suffer some longer pullbacks after that but enjoyed double-digit gains within six months.
That was more the rule than the exception. After other long streaks without a 23-day pullback finally ended, the S&P rebounded during the next three months every time.
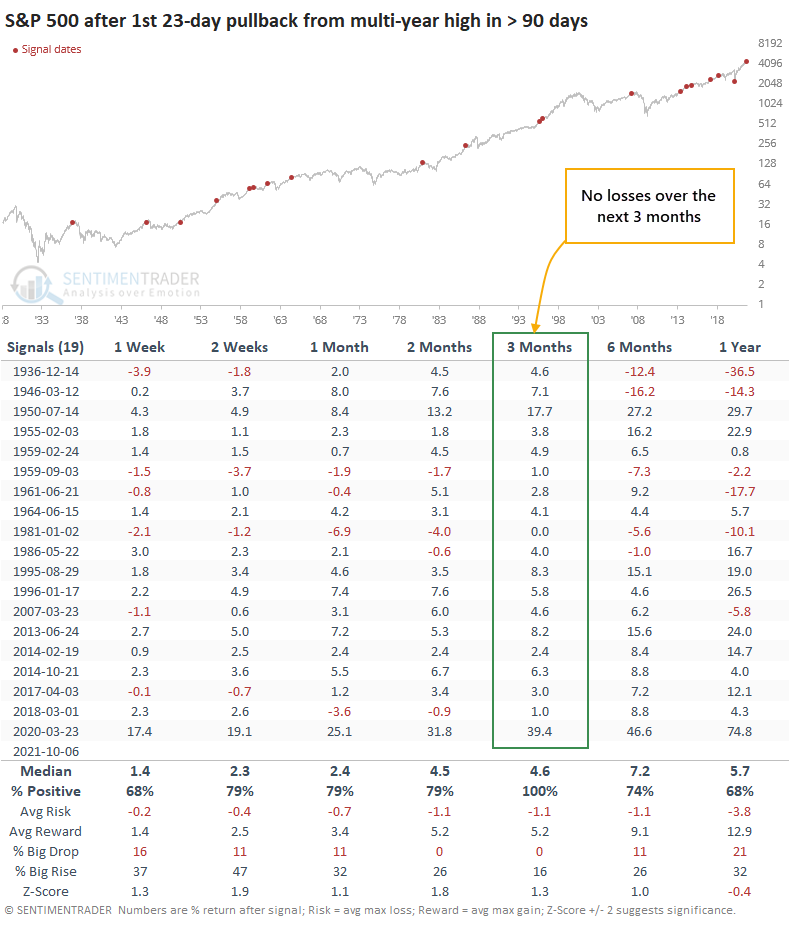
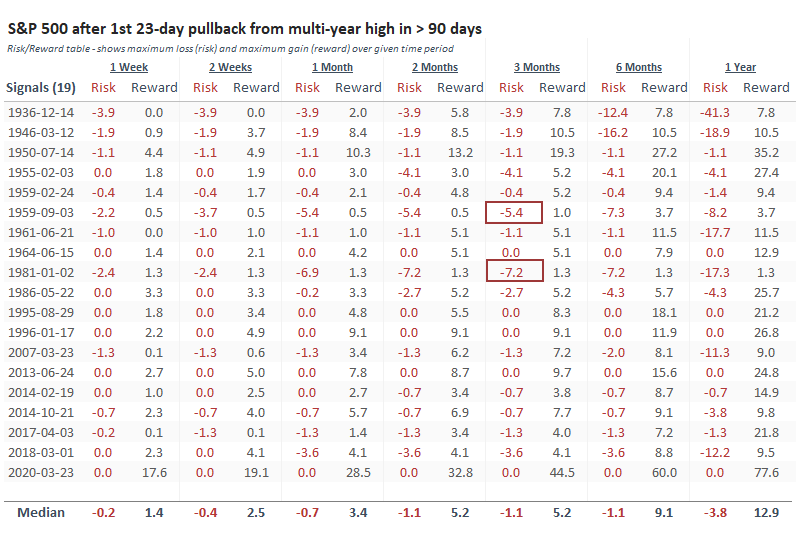
Over the following three months, risk was very low relative to reward. Only 2 out of the 19 signals saw more than a further 5% decline at any point within that time frame, while a whopping 14 of them saw more than a 5% gain at the best point.
As we saw with the ends of other streaks of price momentum, risk-on sentiment, and year-to-date gains, the first substantial pullback has had a strong tendency to attract buyers.
There's an old traders' cliche about high volatility when stocks are near a high as being a bad thing. Not sure where it came from, but it's probably one of the many heuristics that some guy thought up, and it got around because it was simple and it sounded good. But most of the time, the first bout of volatility following an extended run of new highs leads to tremendous dip-buying interest from all those who were too cautious during the initial run. They finally see a good opportunity to get in.
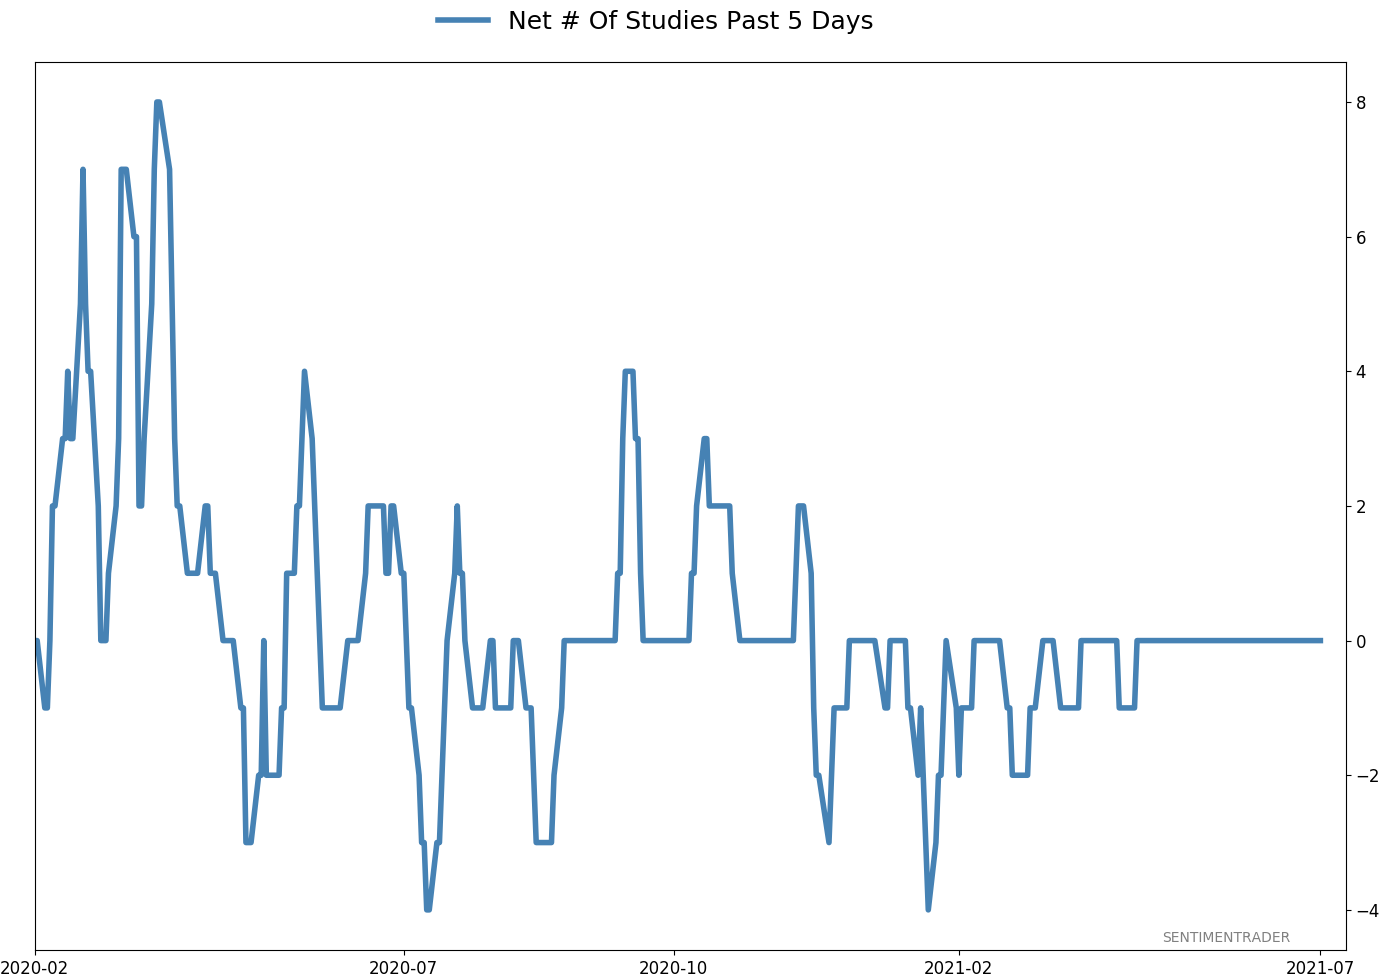
Active Studies
| Time Frame | Bullish | Bearish | | Short-Term | 0 | 0 | | Medium-Term | 7 | 0 | | Long-Term | 11 | 5 |
|
Indicators at Extremes
Portfolio
| Position | Description | Weight % | Added / Reduced | Date | | Stocks | RSP | 10.5 | Added 6.4% | 2021-10-01 | | Bonds | 23.9% BND, 6.9% SCHP | 31.5 | Reduced 7.1% | 2021-05-19 | | Commodities | GCC | 2.6 | Reduced 2.1%
| 2020-09-04 | | Precious Metals | GDX | 4.2 | Reduced 4.2% | 2021-05-19 | | Special Situations | 9.8% KWEB, 4.7% XLE, 2.9% PSCE | 17.3 | Added 9.78% | 2021-10-01 | | Cash | | 34.0 | | |
|
Updates (Changes made today are underlined)
Much of our momentum and trend work has remained positive for several months, with some scattered exceptions. Almost all sentiment-related work has shown a poor risk/reward ratio for stocks, especially as speculation drove to record highs in exuberance in February. Much of that has worn off, and most of our models are back toward neutral levels. There isn't much to be excited about here. The same goes for bonds and even gold. Gold has been performing well lately and is back above long-term trend lines. The issue is that it has a poor record of holding onto gains when attempting a long-term trend change like this, so we'll take a wait-and-see approach. Momentum has ebbed quickly in recent weeks, and nearing oversold levels in some indicators. This can be a dangerous area, with a lot of short-term volatility, but we'd be more inclined to add medium- to long-term exposure rather than sell on much more of a decline, thanks to already rock-bottom exposure. Other areas look more attractive, including some overseas markets. RETURN YTD: 10.0% 2020: 8.1%, 2019: 12.6%, 2018: 0.6%, 2017: 3.8%, 2016: 17.1%, 2015: 9.2%, 2014: 14.5%, 2013: 2.2%, 2012: 10.8%, 2011: 16.5%, 2010: 15.3%, 2009: 23.9%, 2008: 16.2%, 2007: 7.8%
|
|
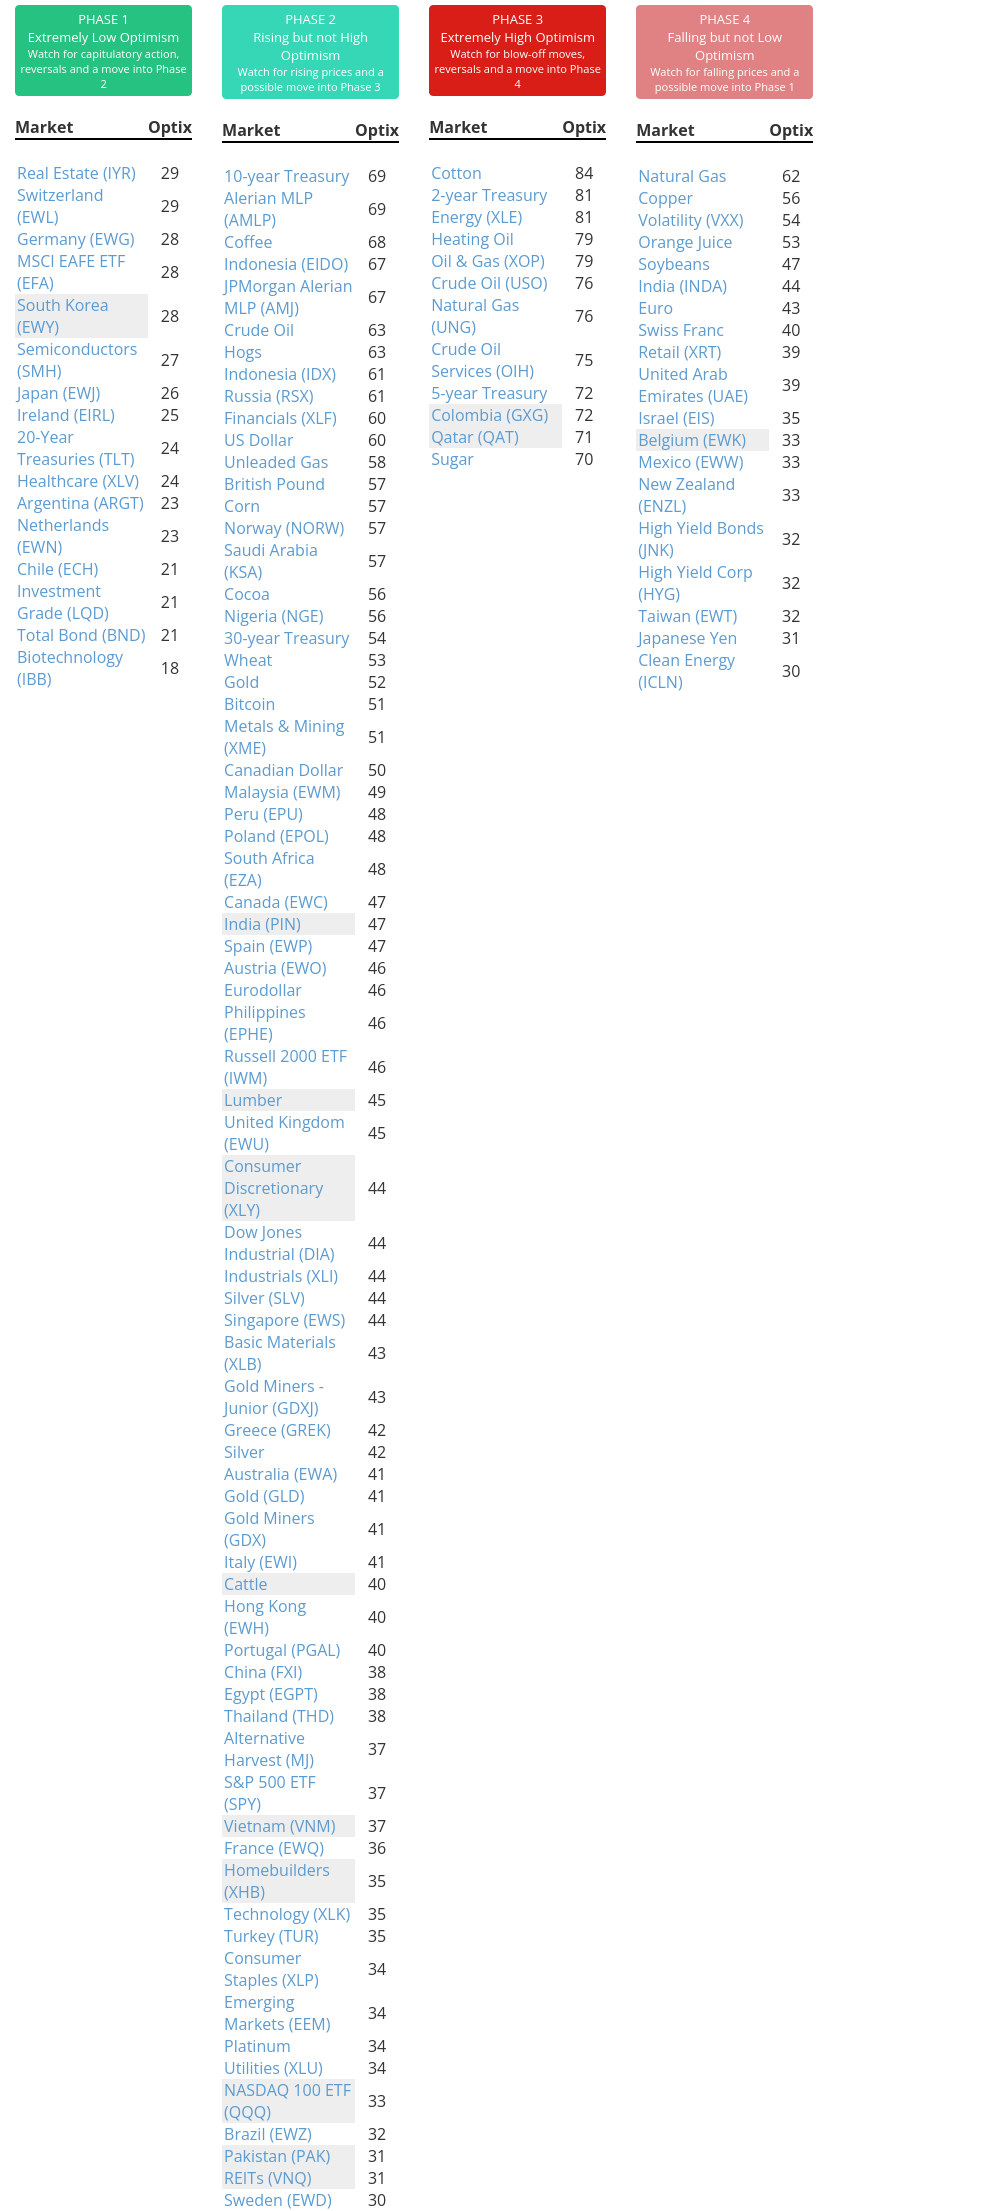
Phase Table
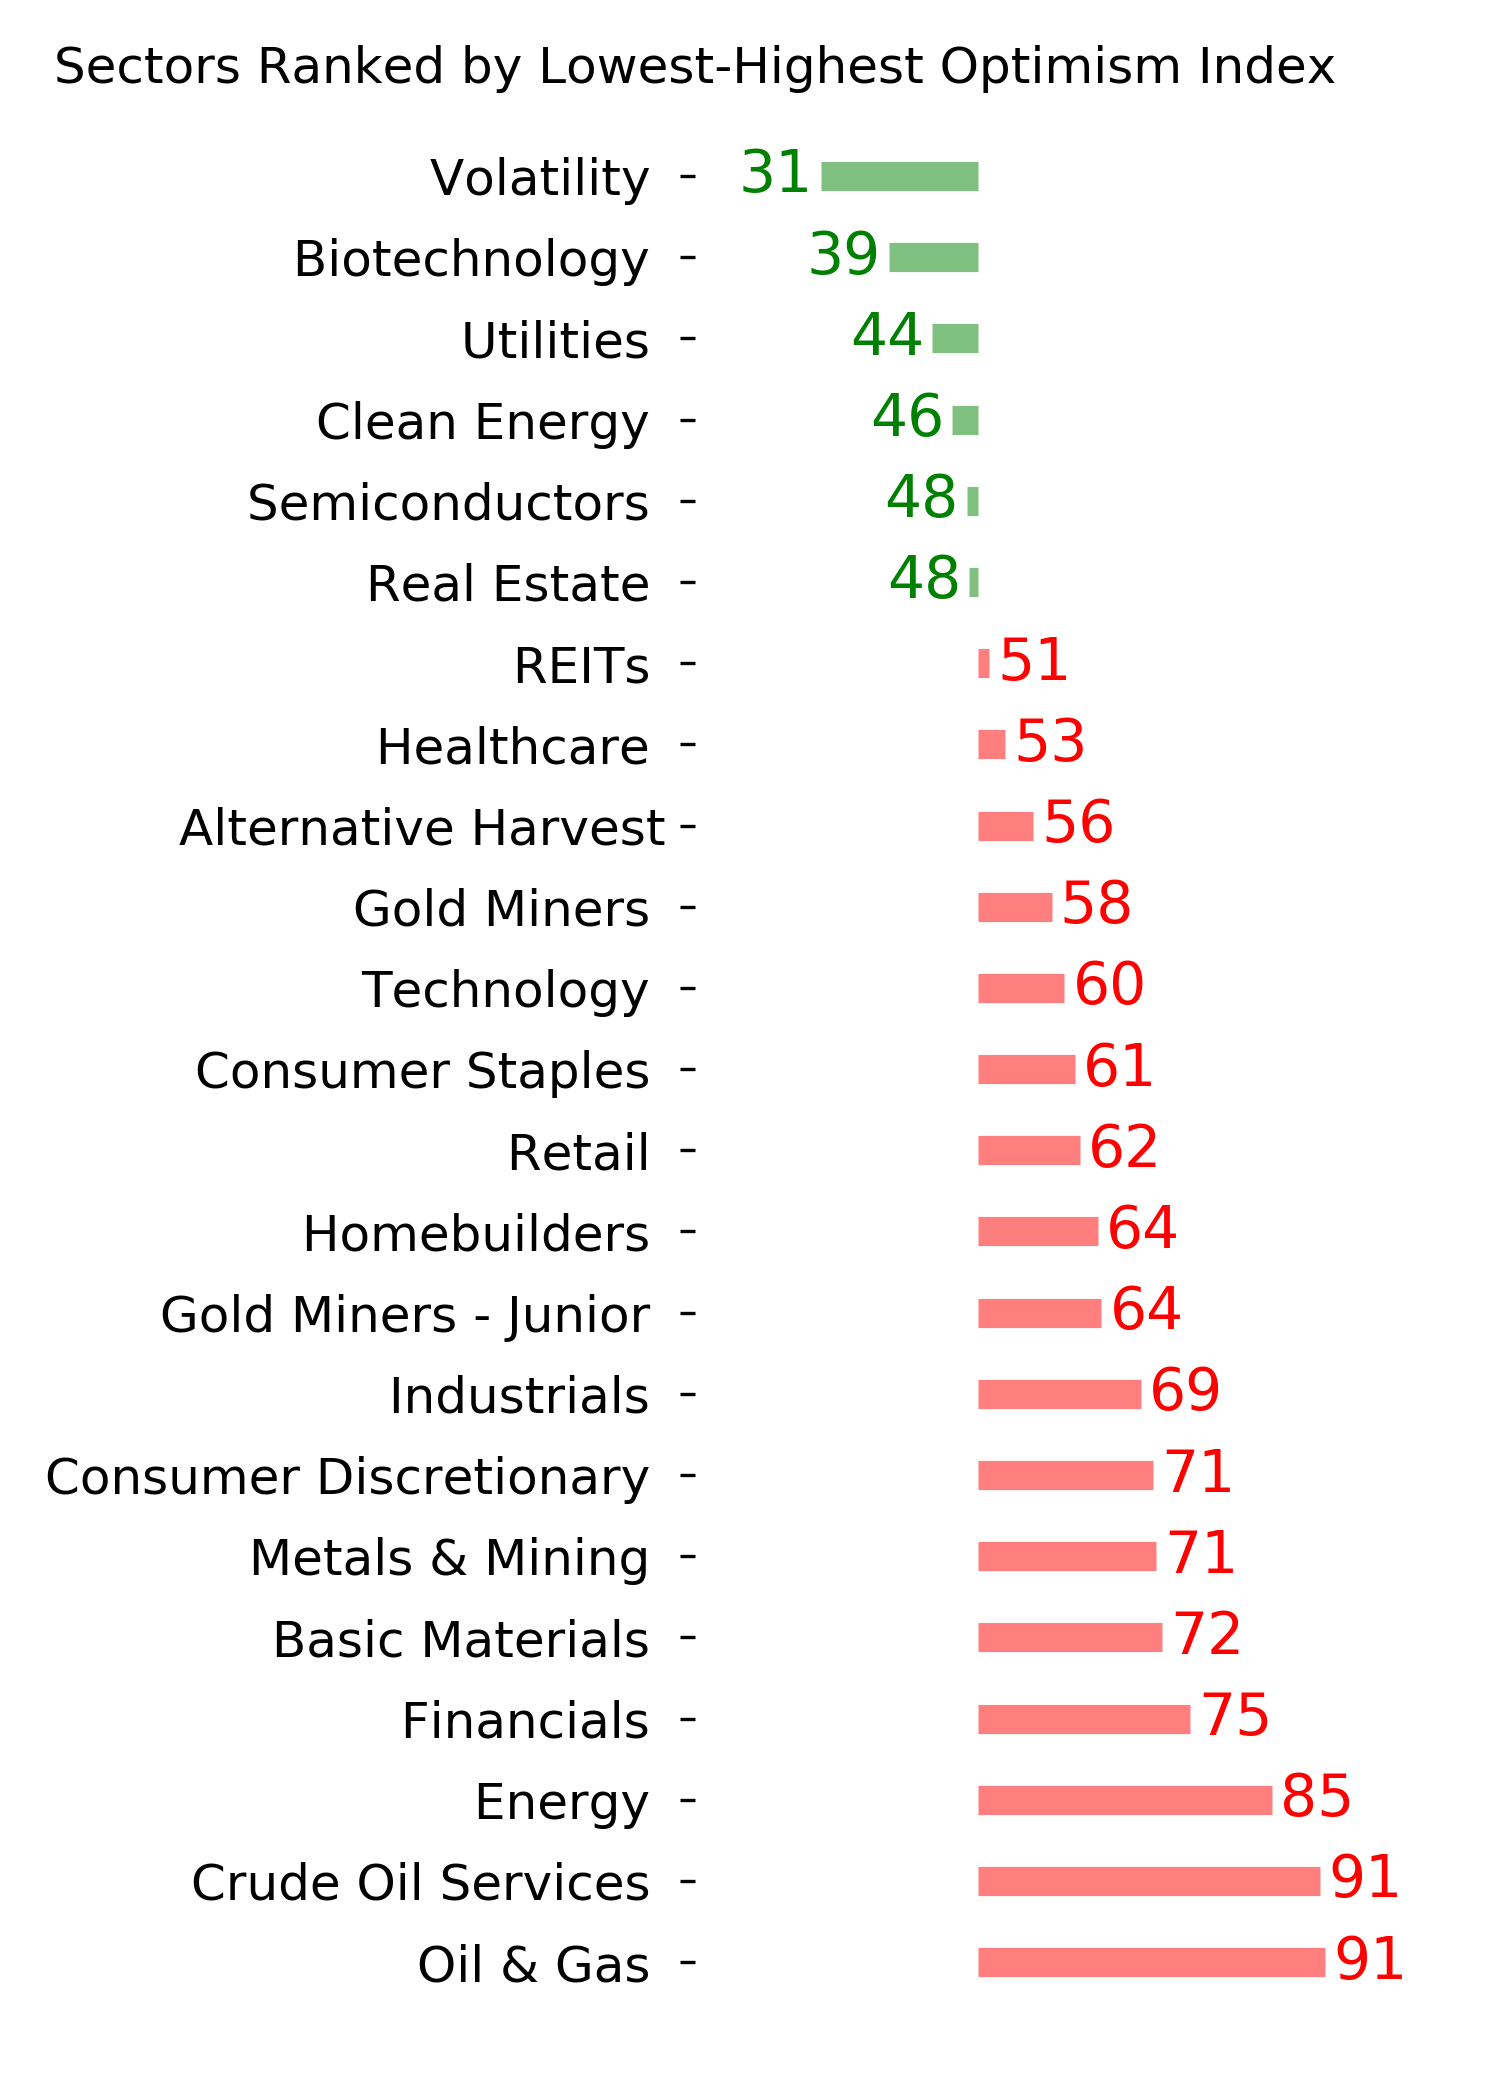
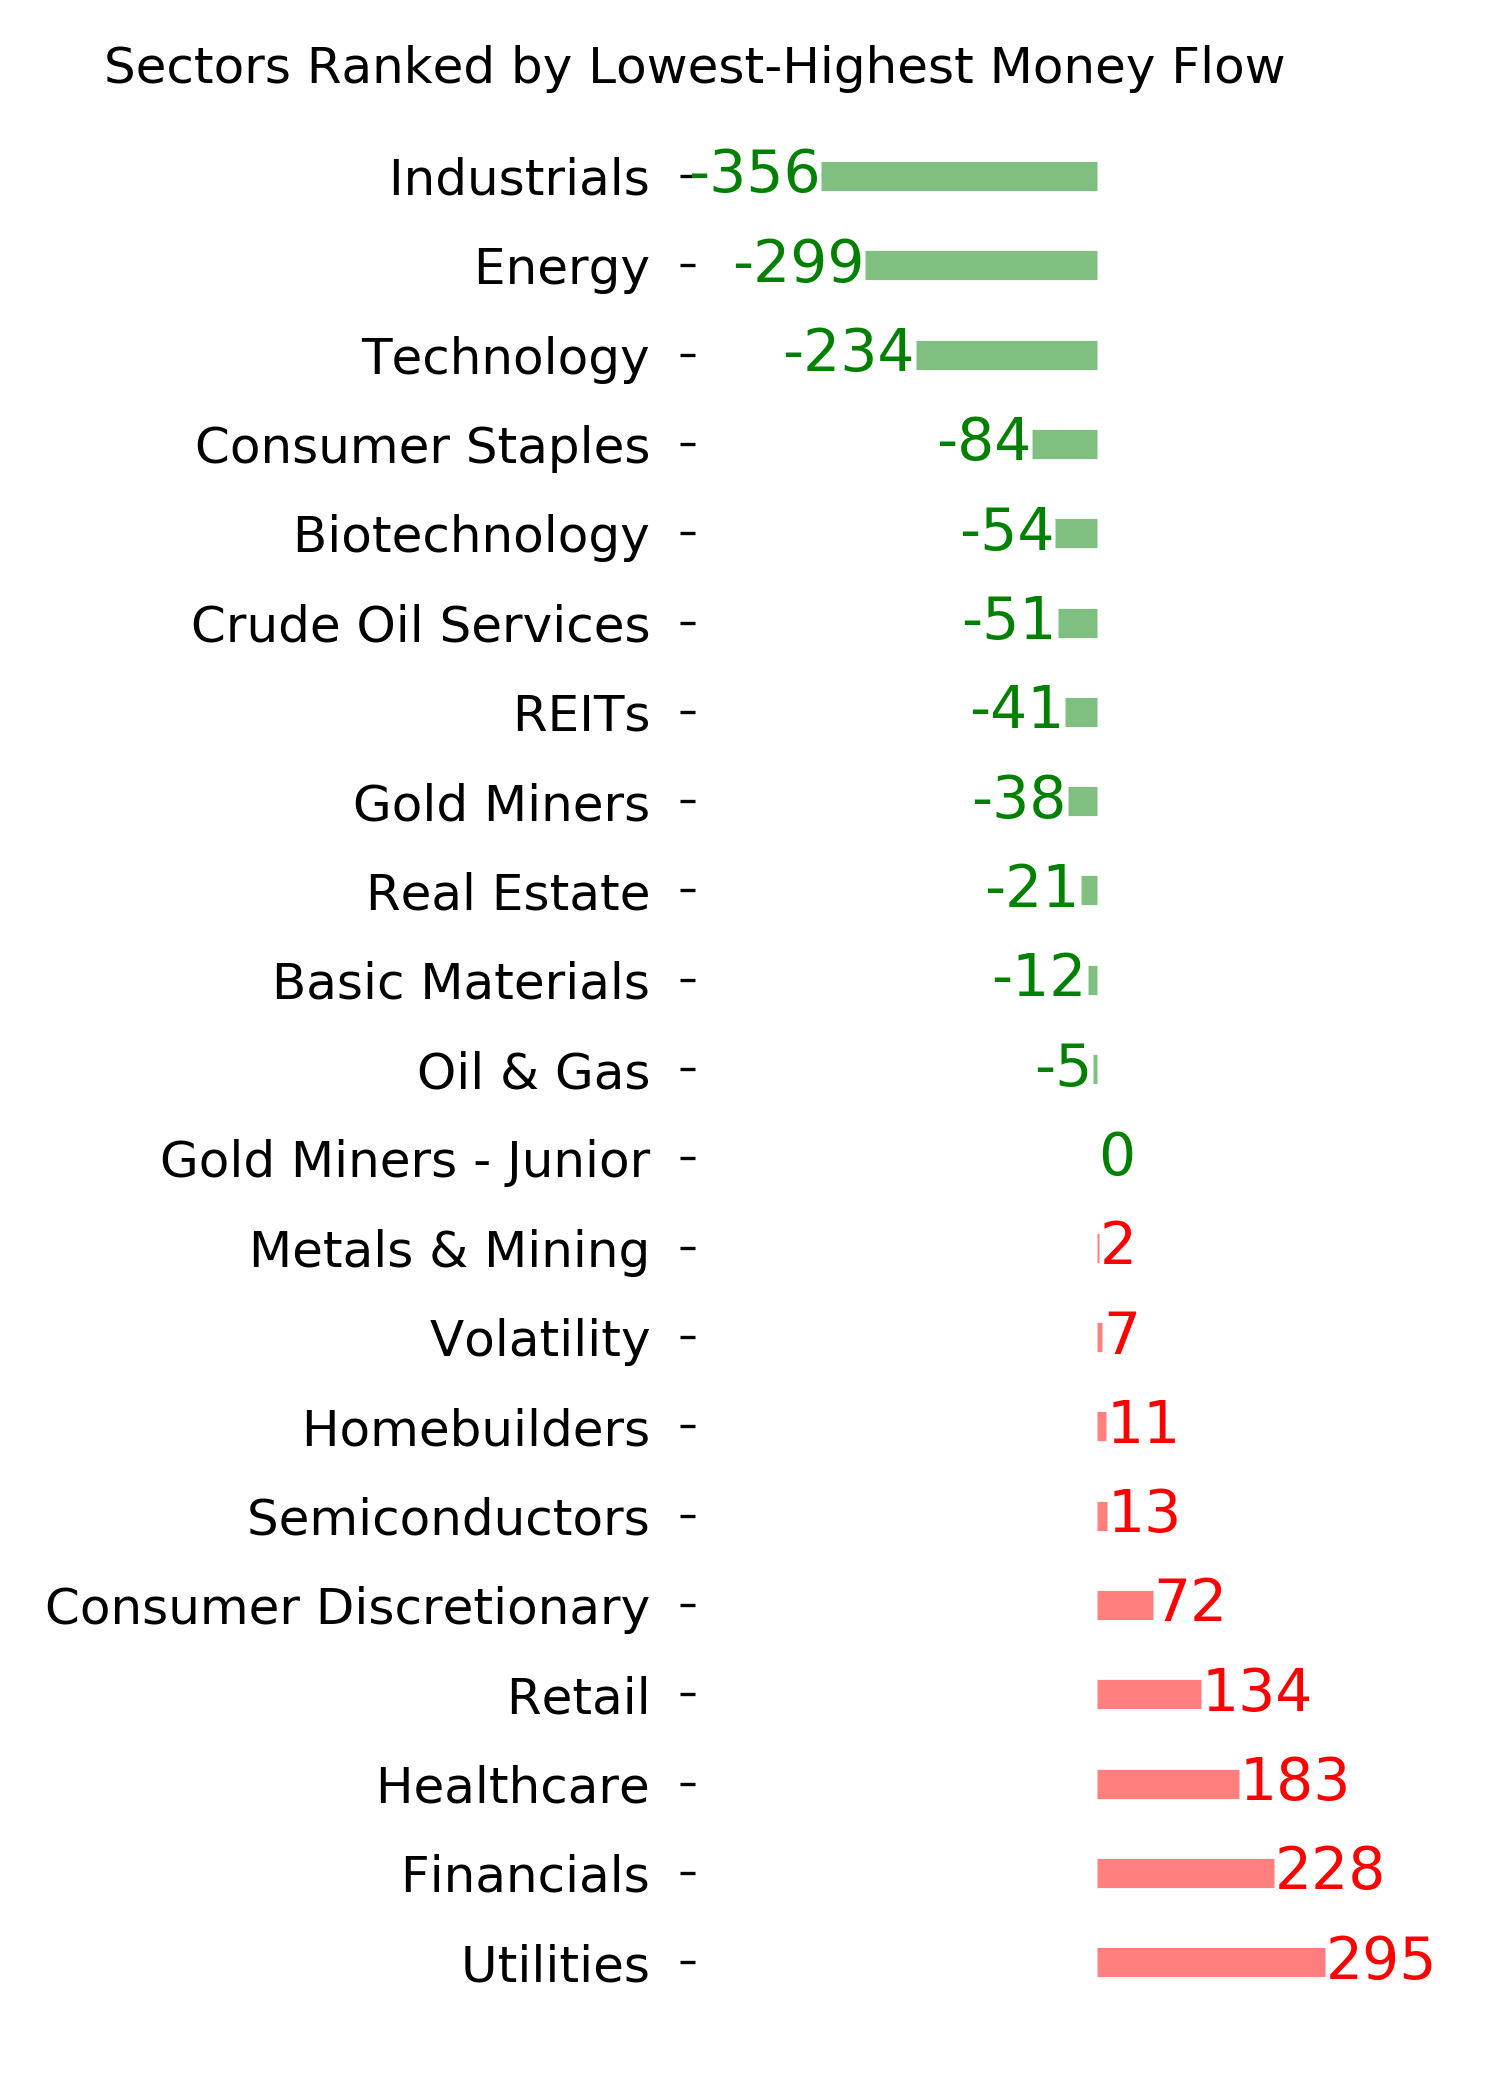
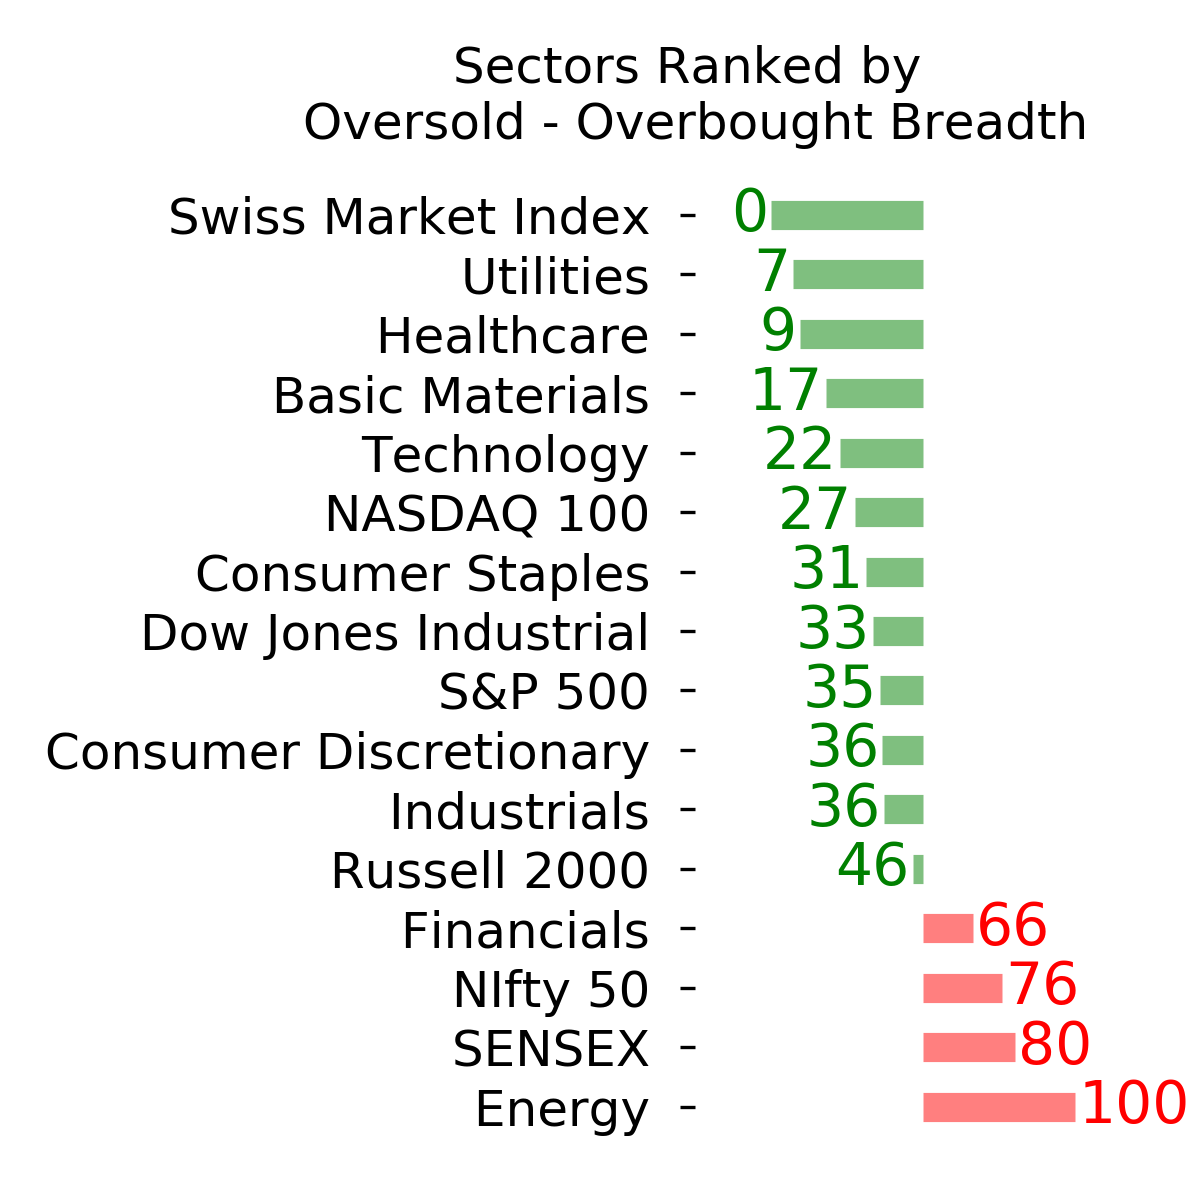
Ranks
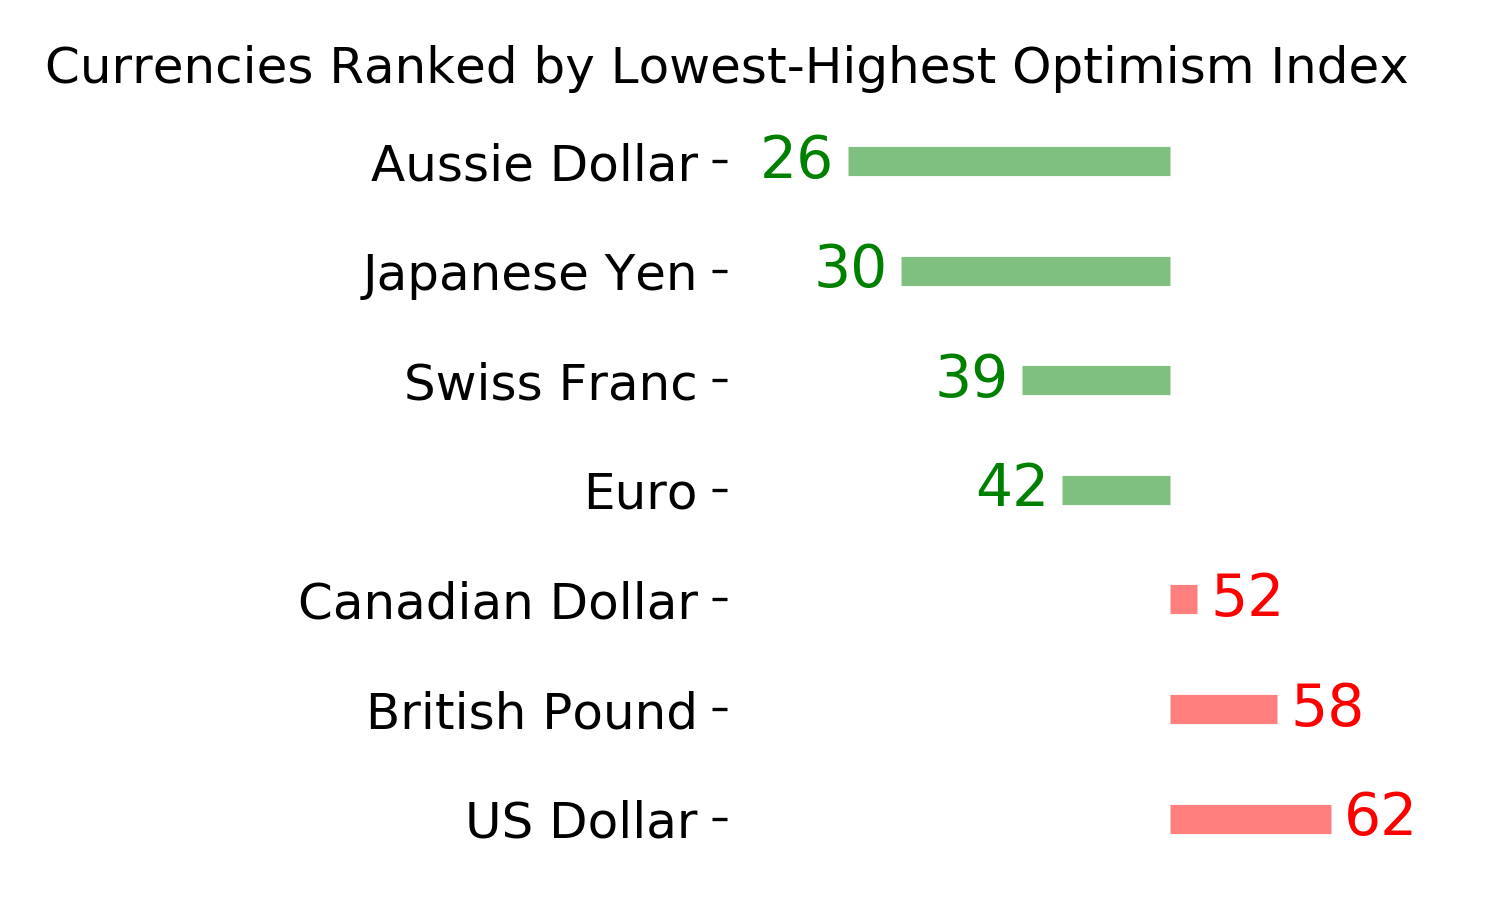
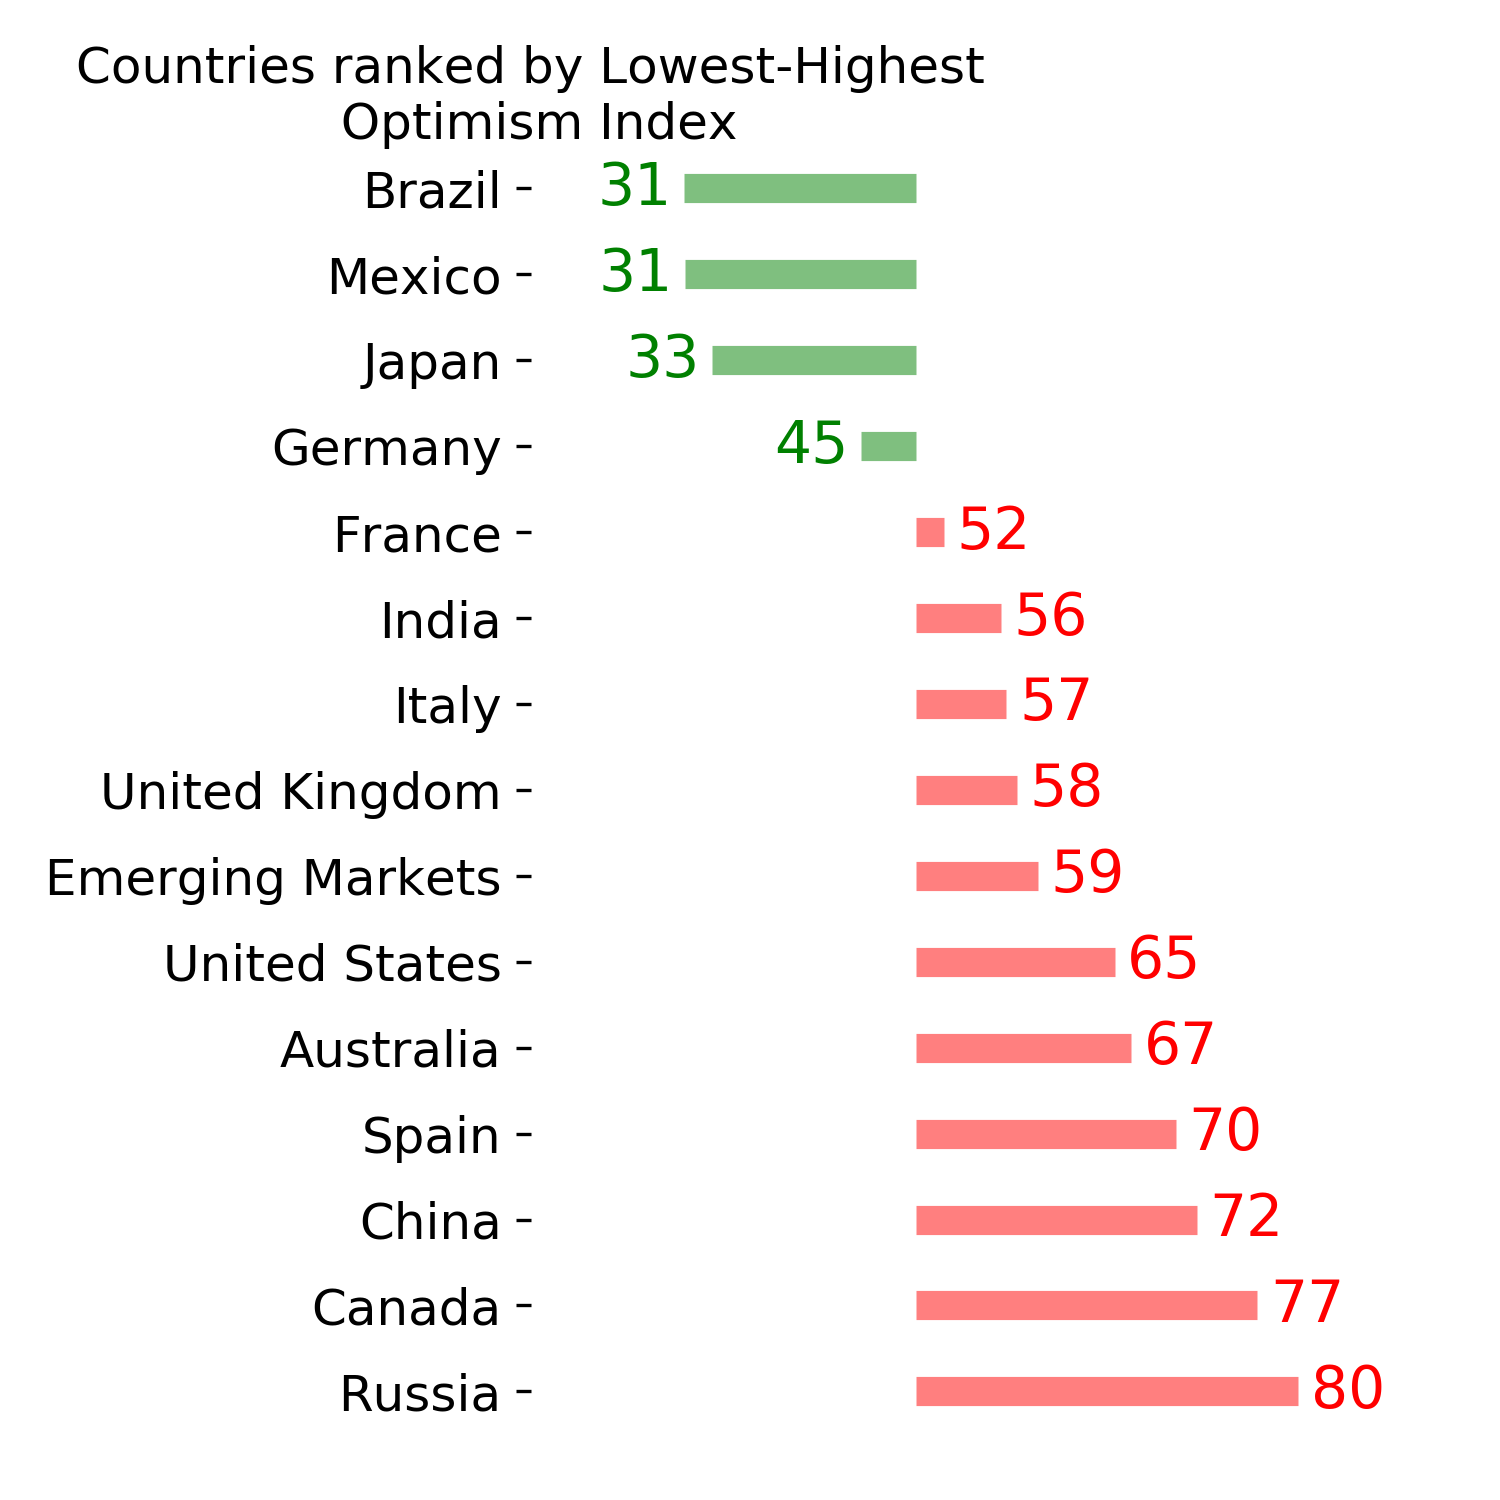
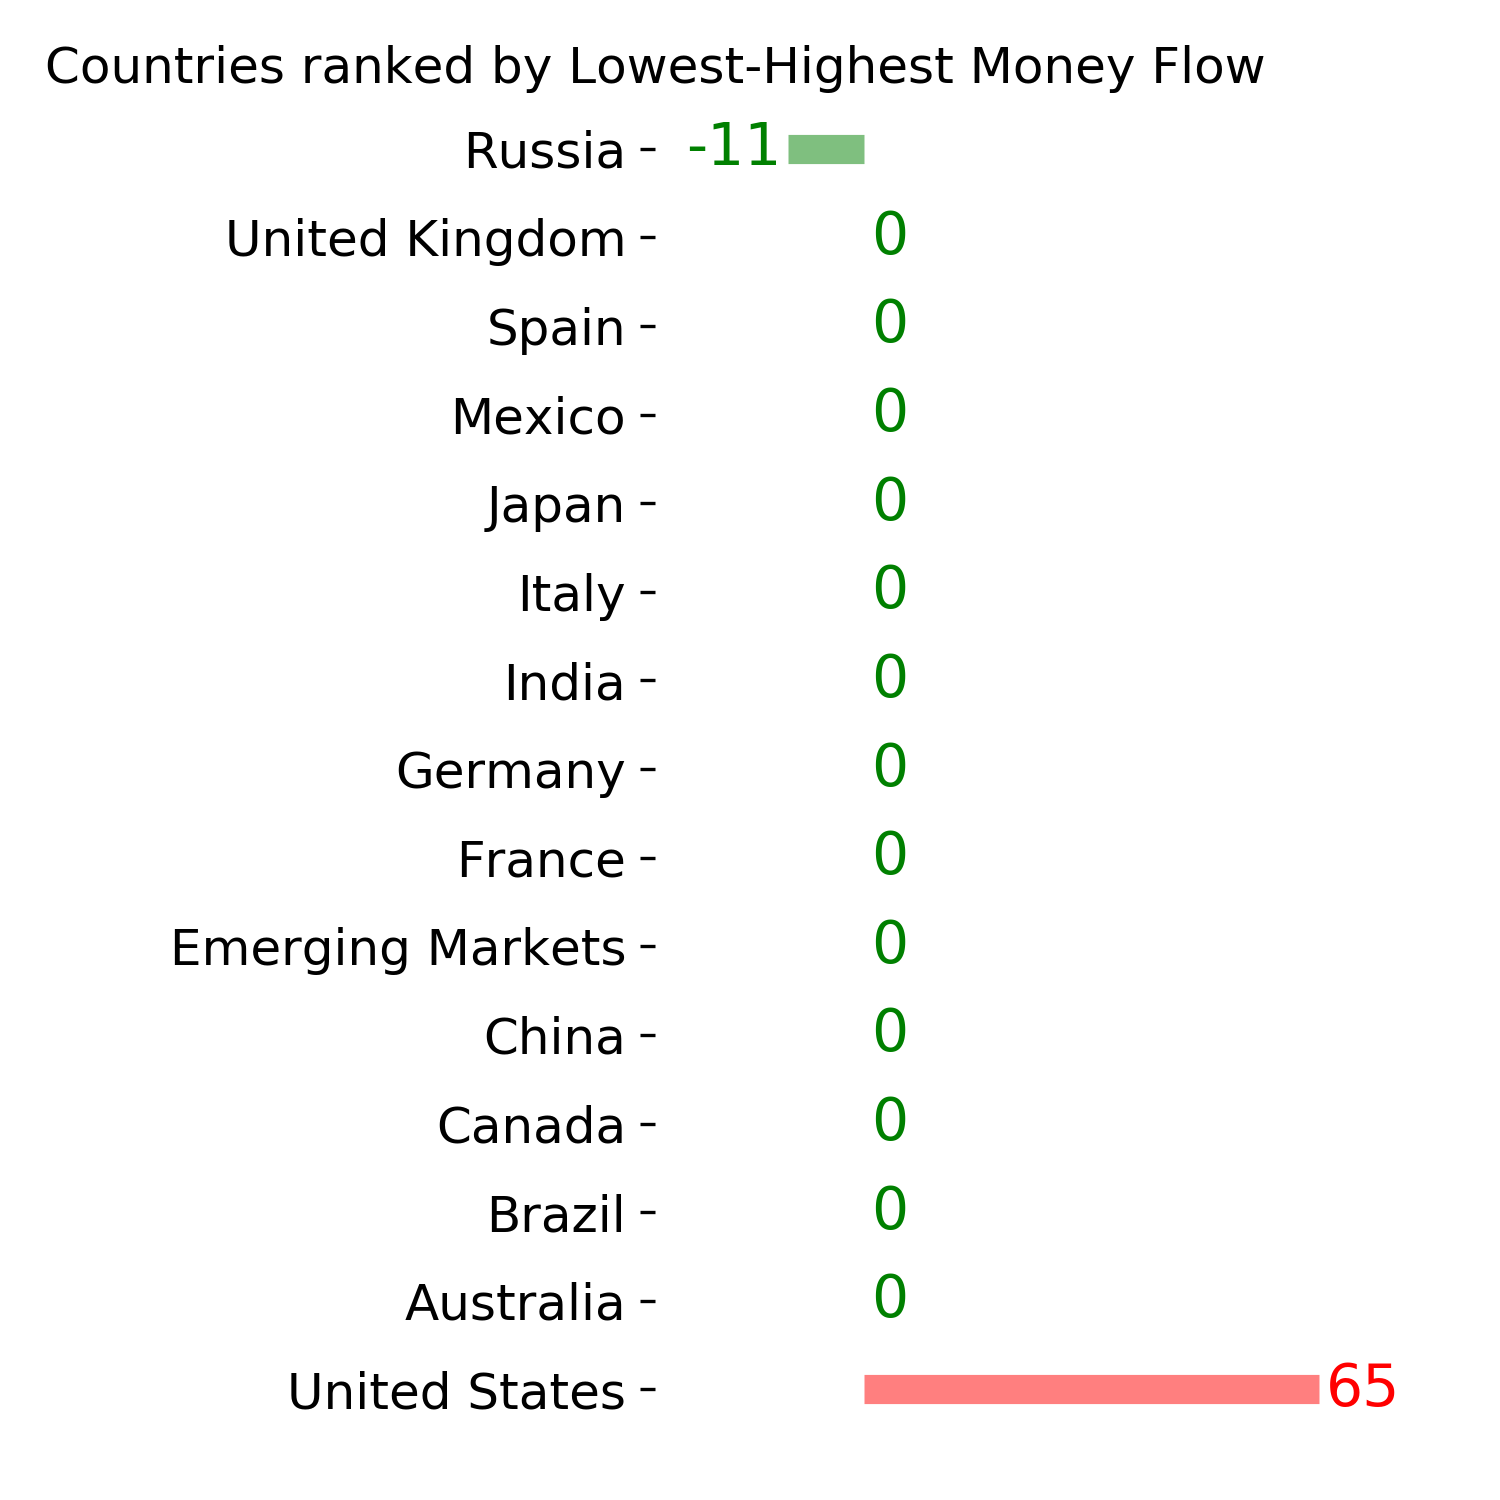
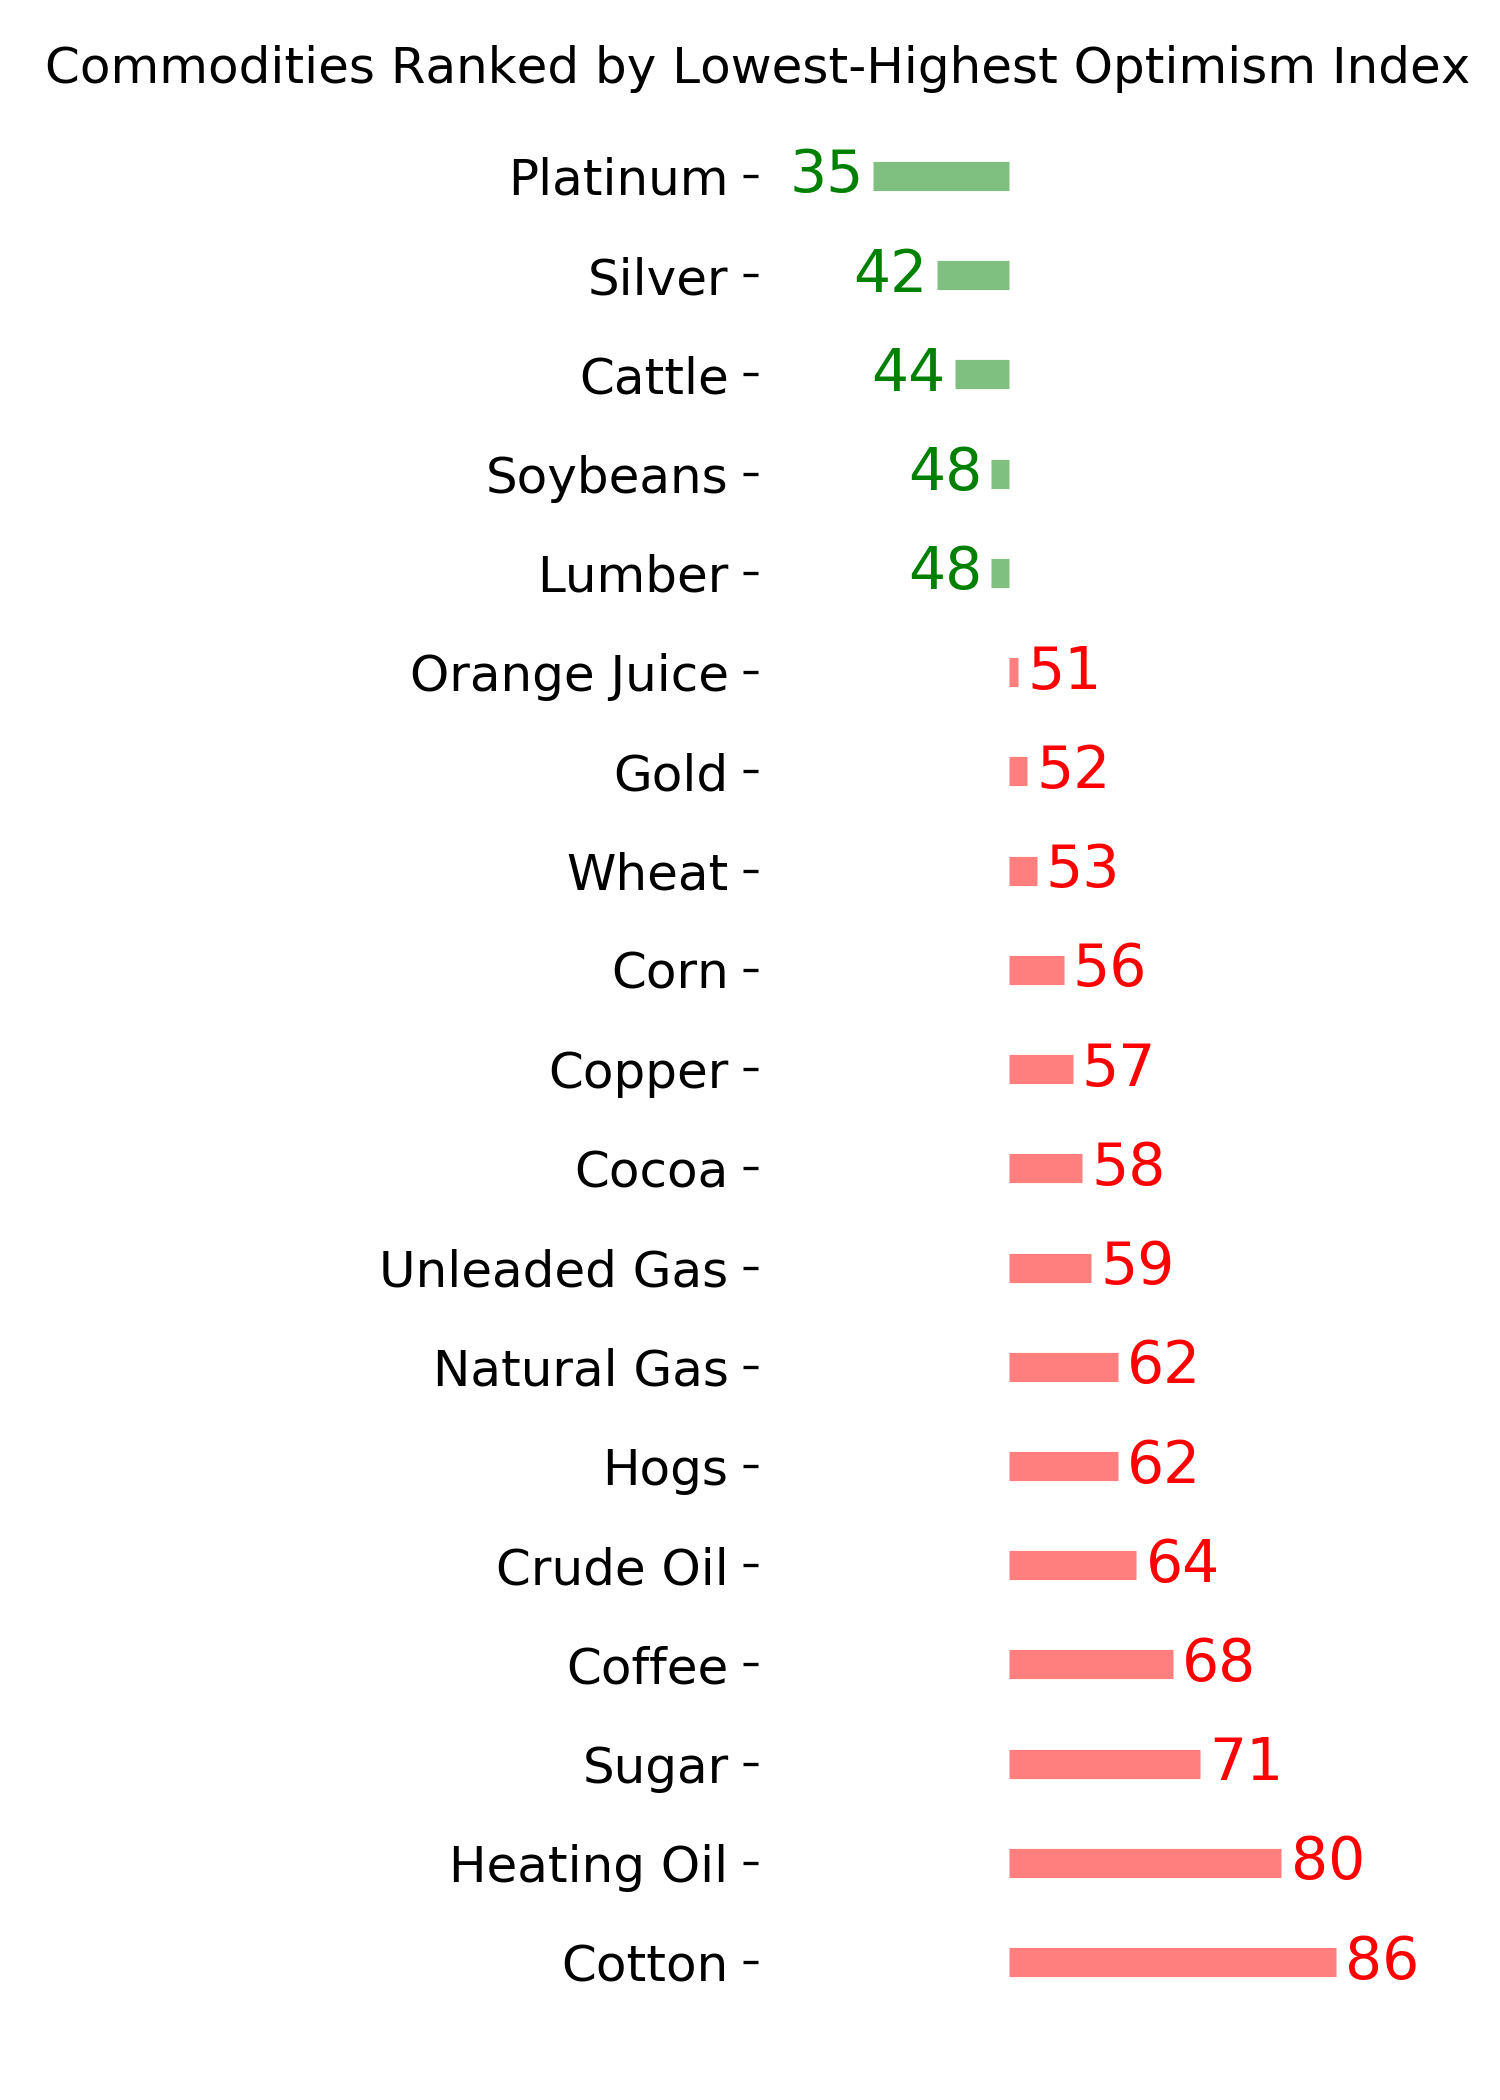
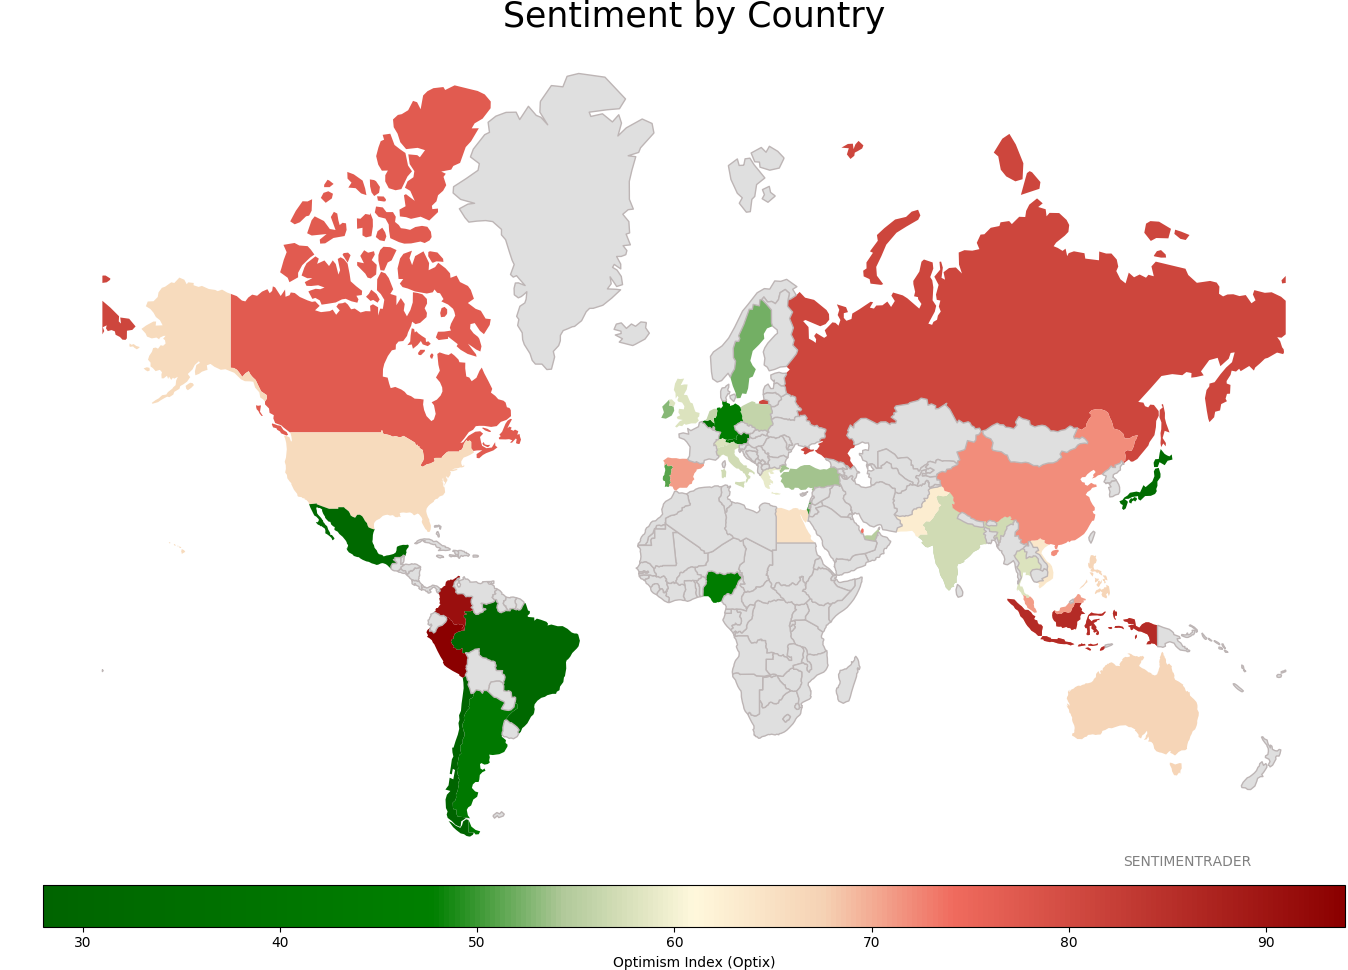
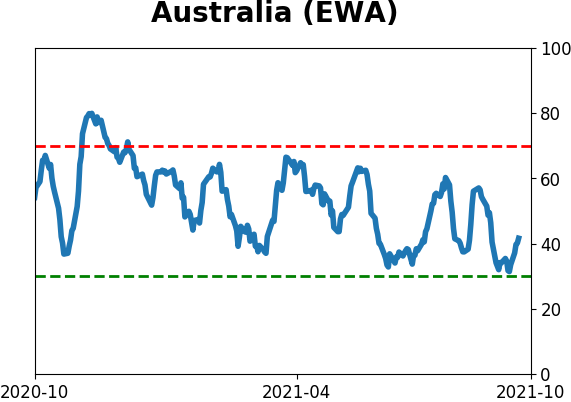
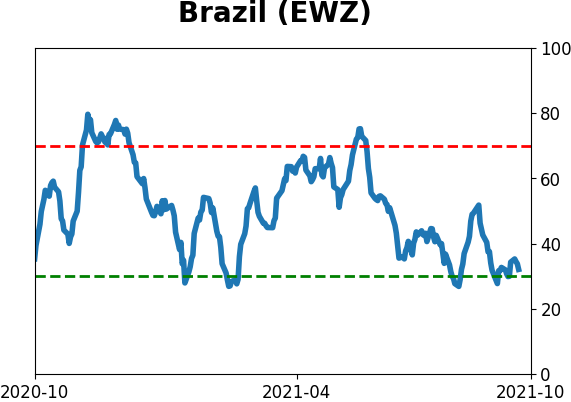
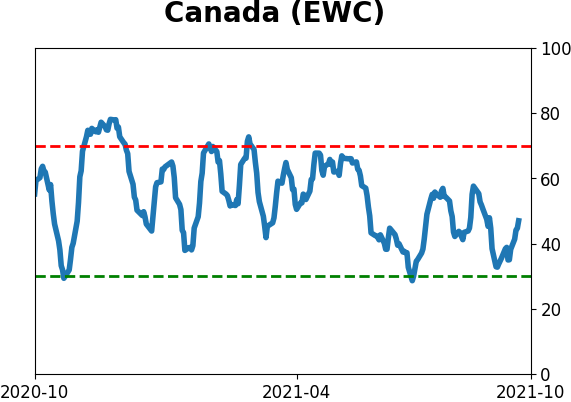
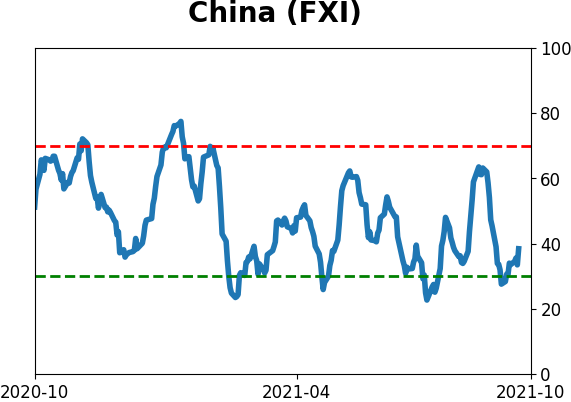
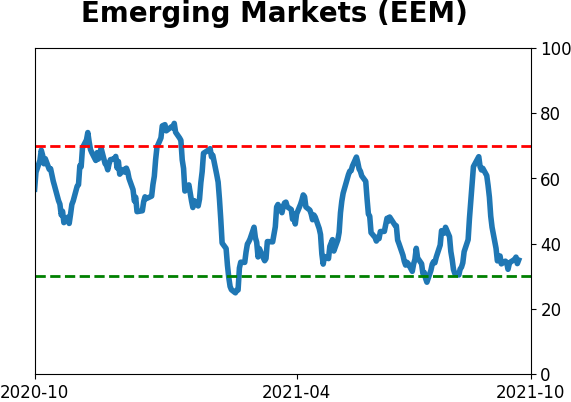
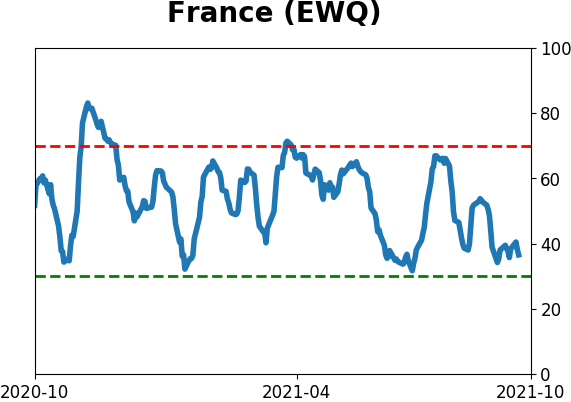
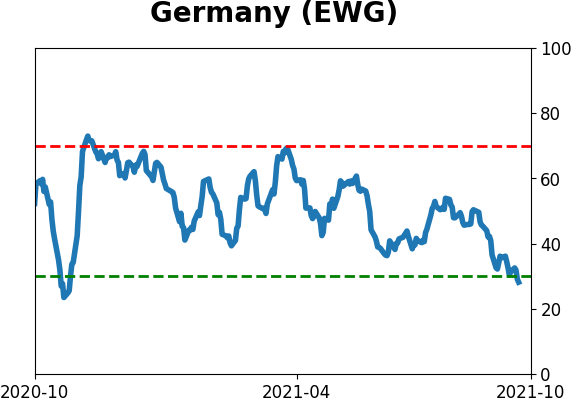
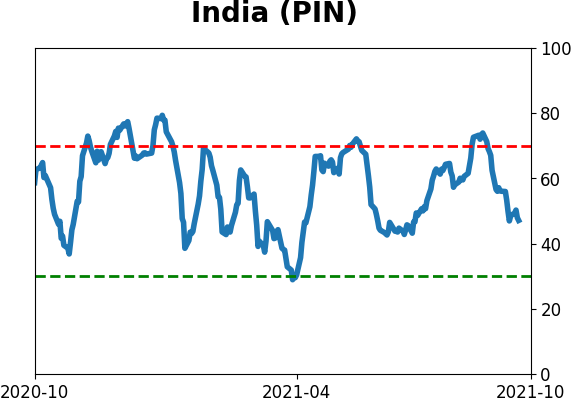
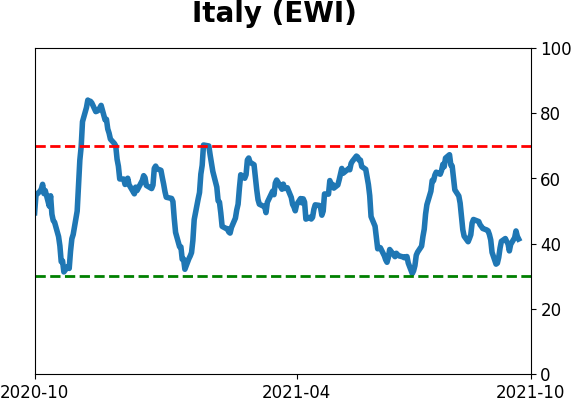
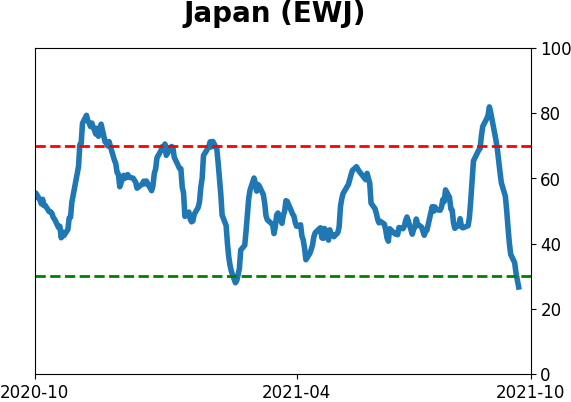
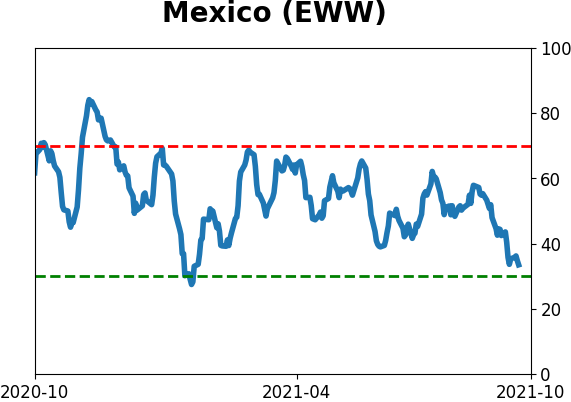
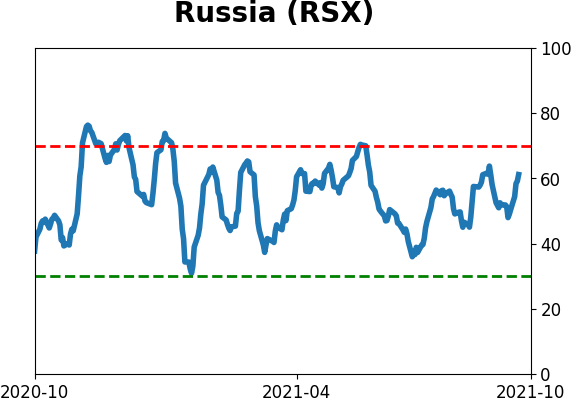
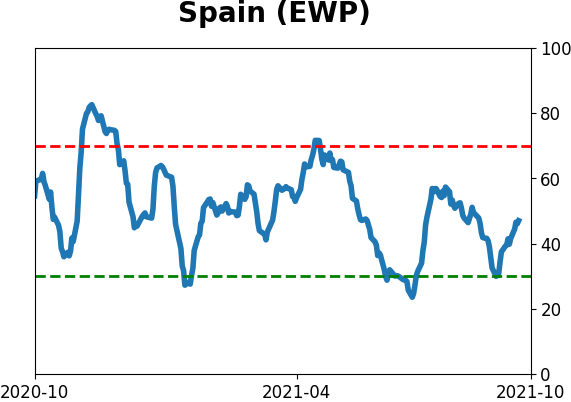
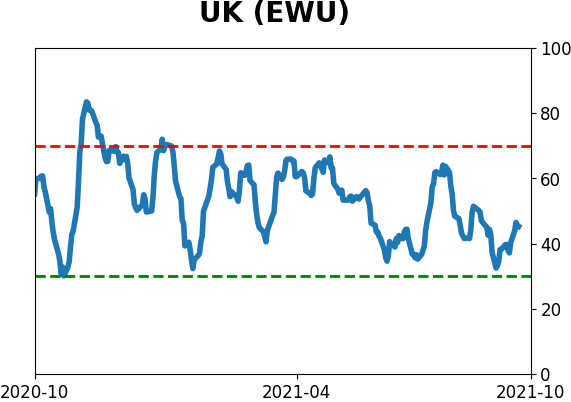
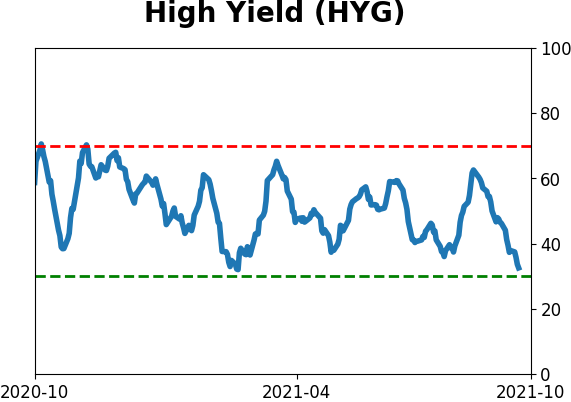
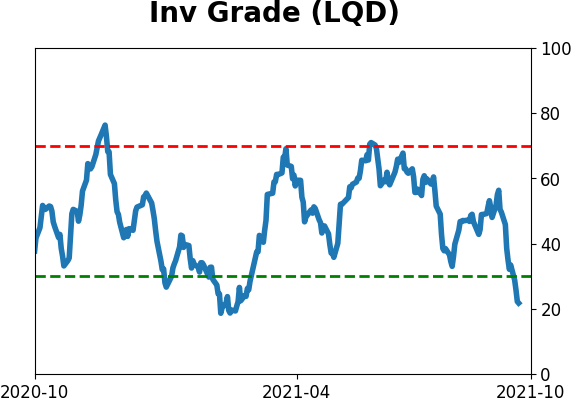
Sentiment Around The World
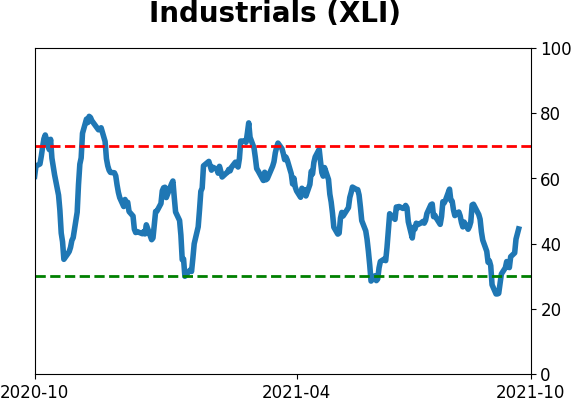
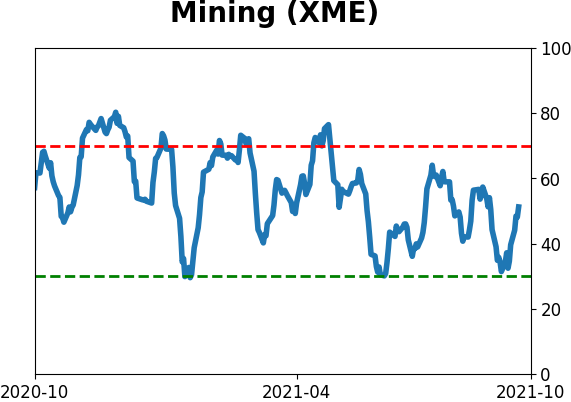
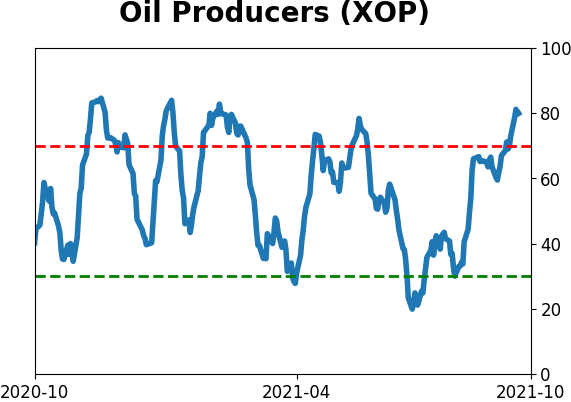
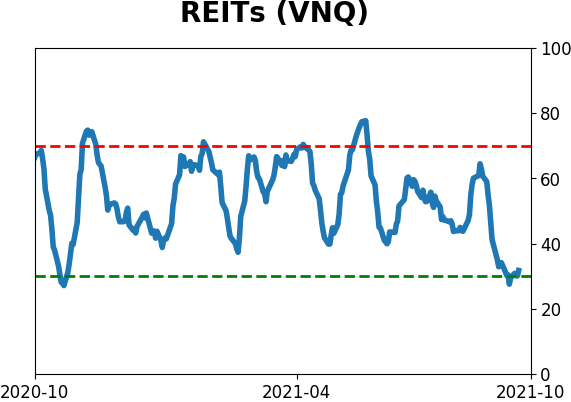
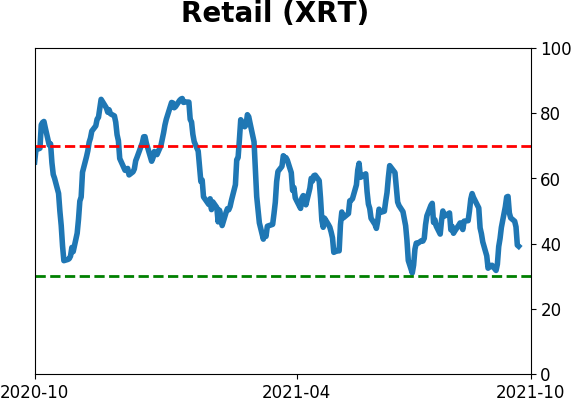
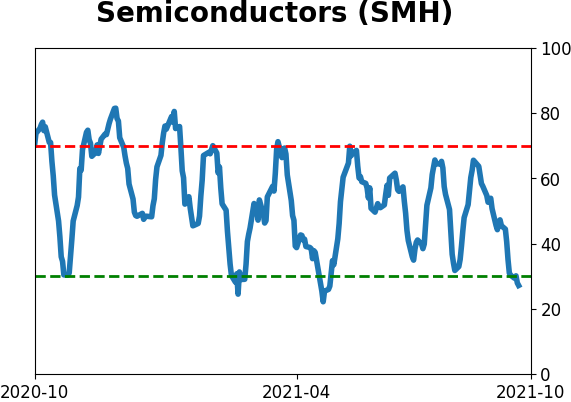
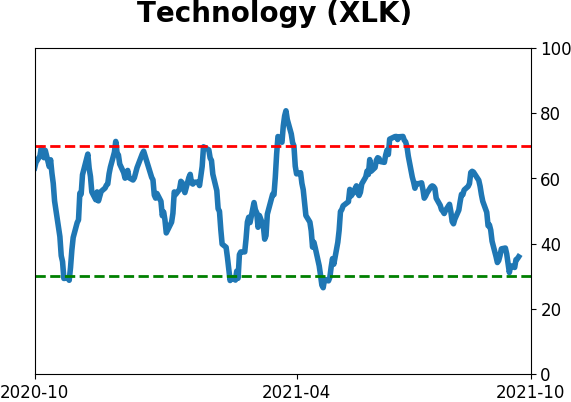
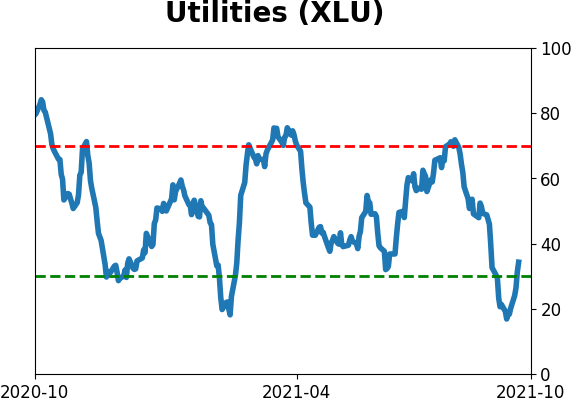
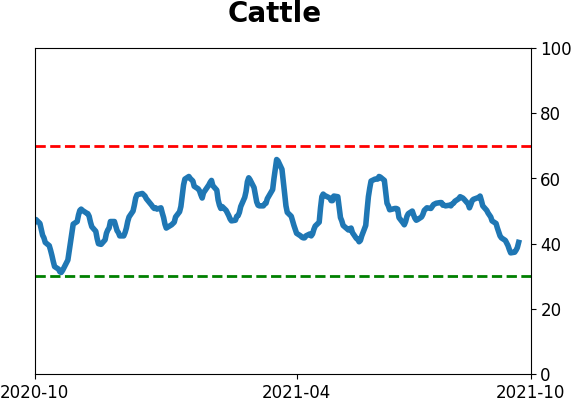
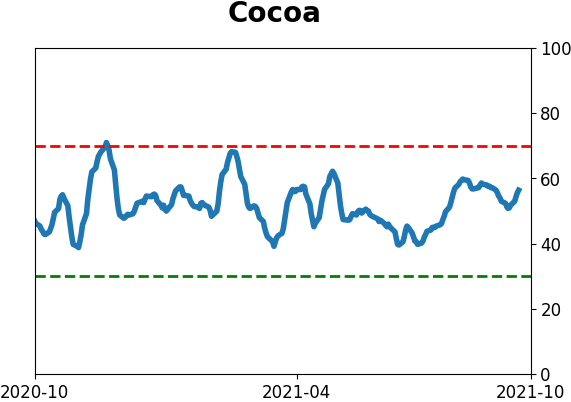
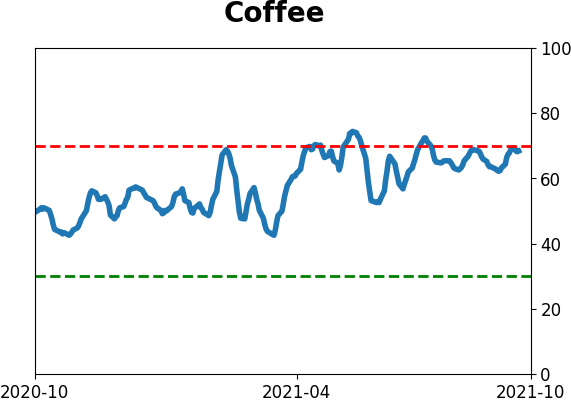
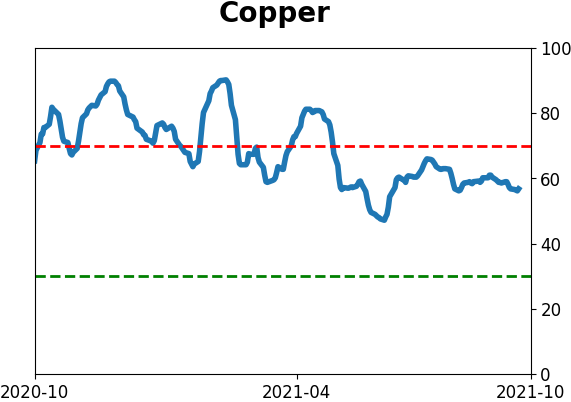
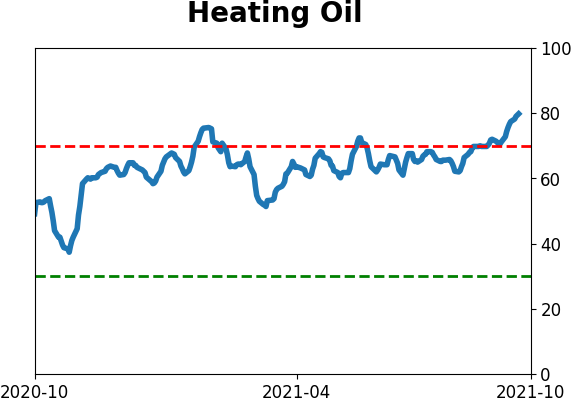
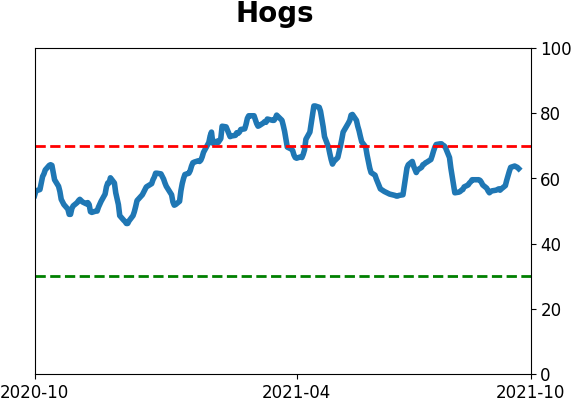
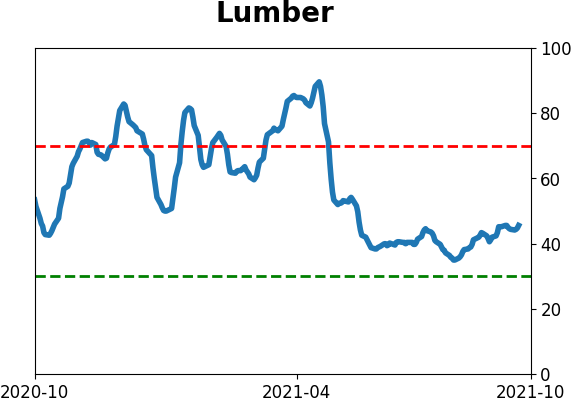
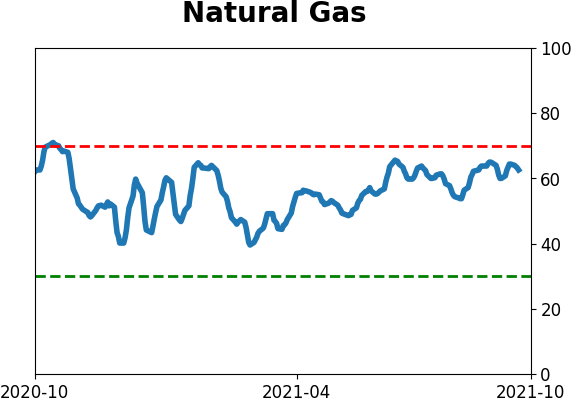
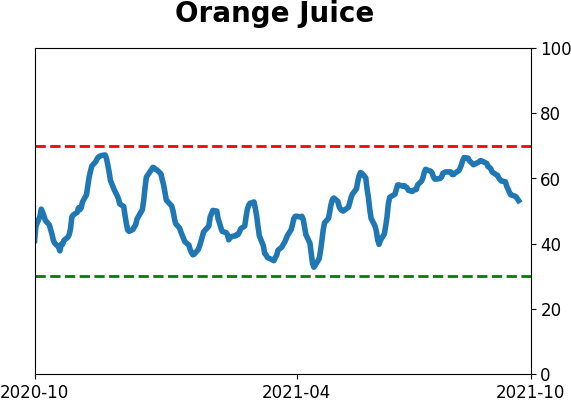
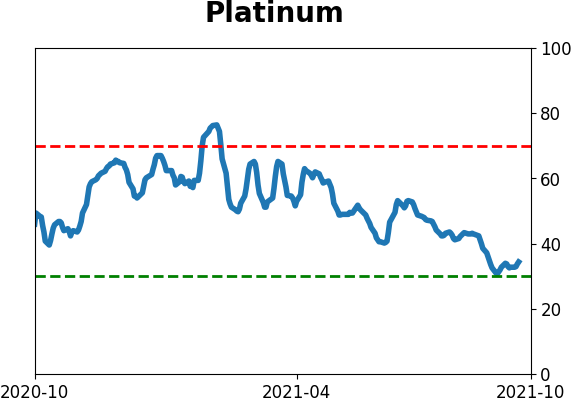
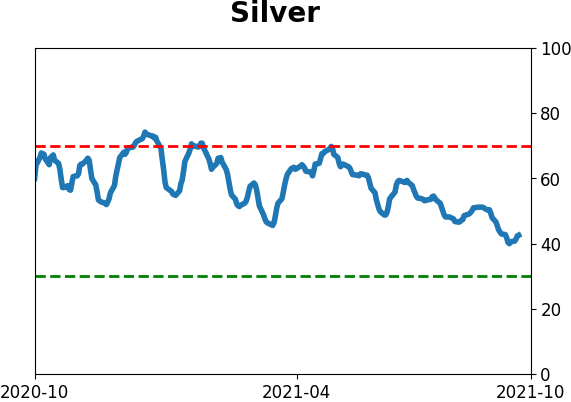
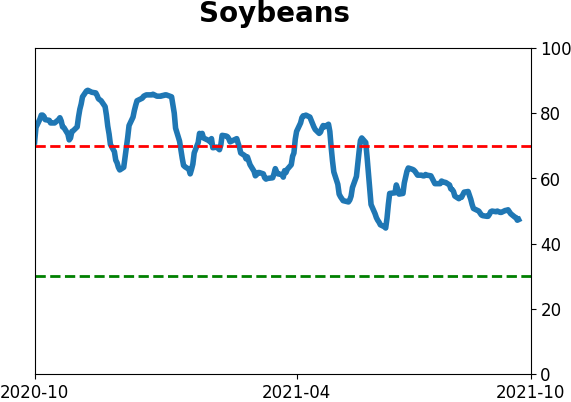
Optimism Index Thumbnails
|
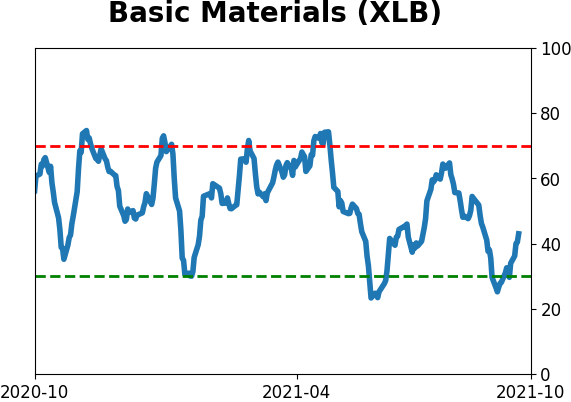
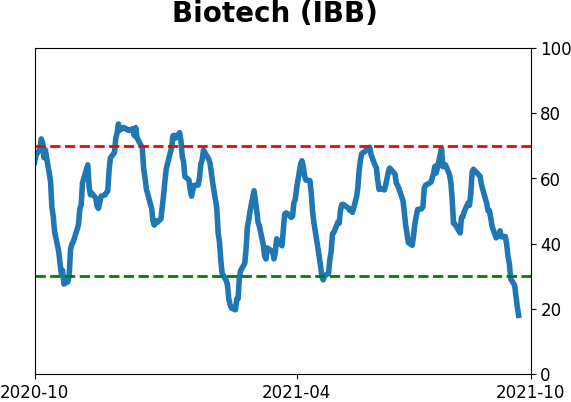
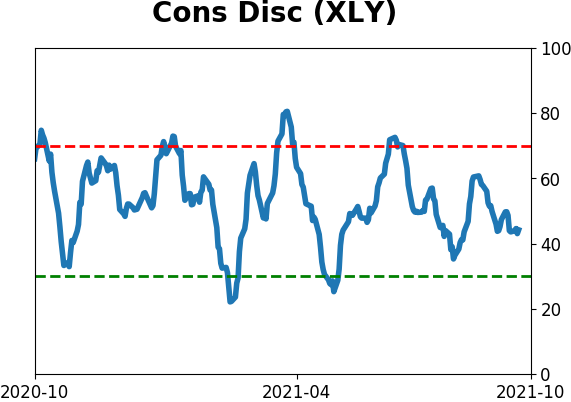
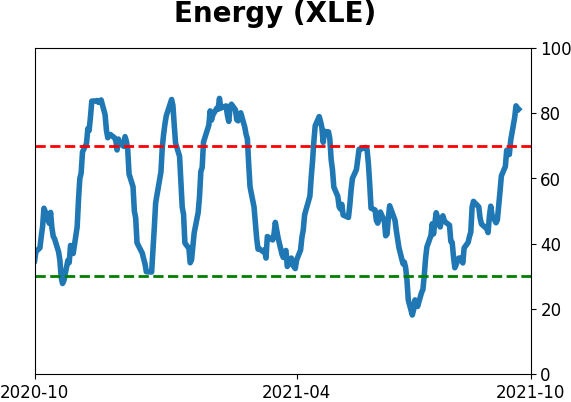
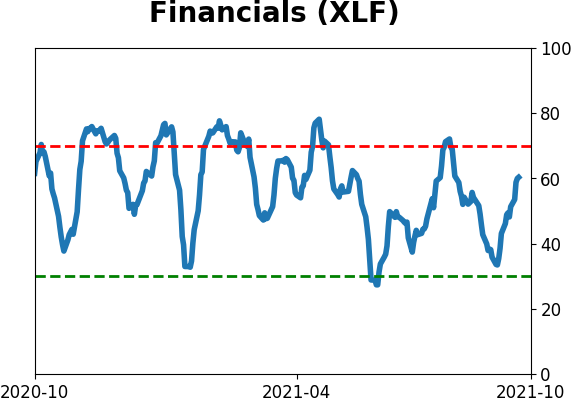
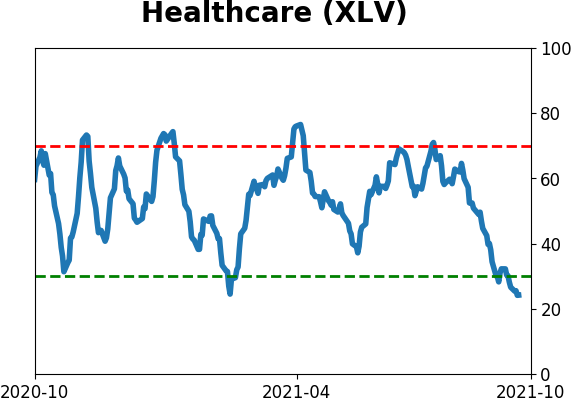
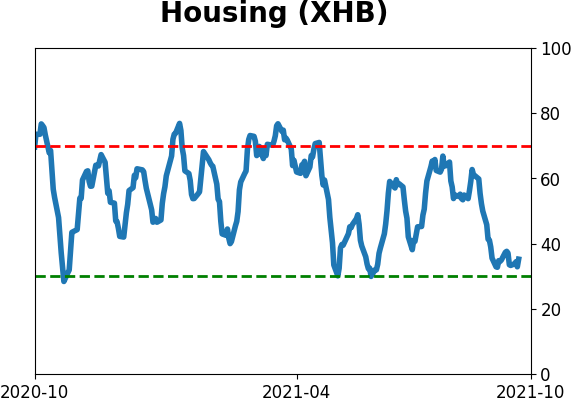
Sector ETF's - 10-Day Moving Average
|
|
|
Country ETF's - 10-Day Moving Average
|
|
|
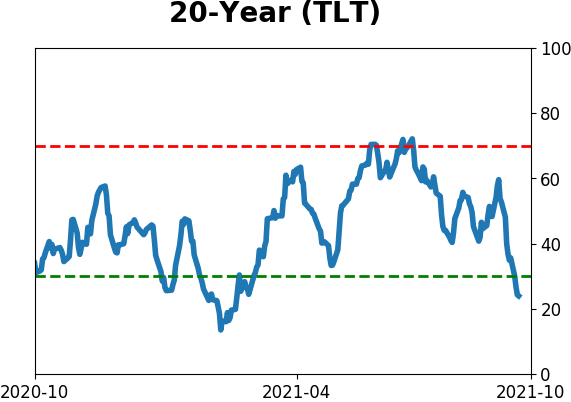
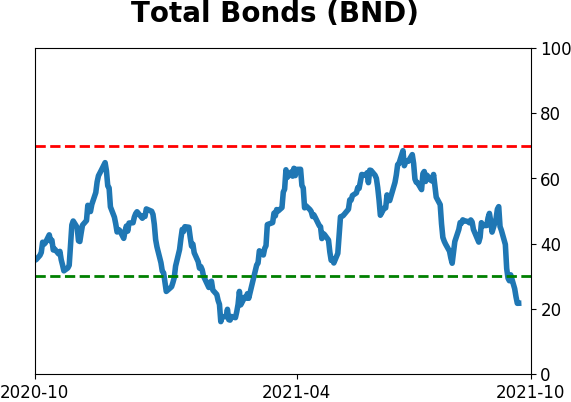
Bond ETF's - 10-Day Moving Average
|
|
|
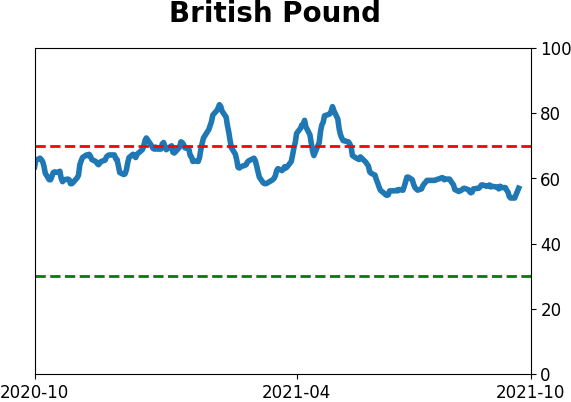
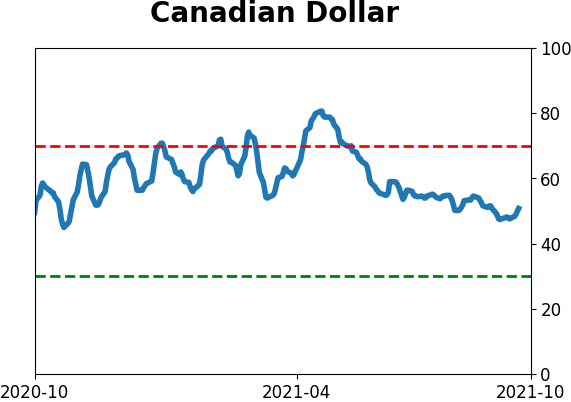
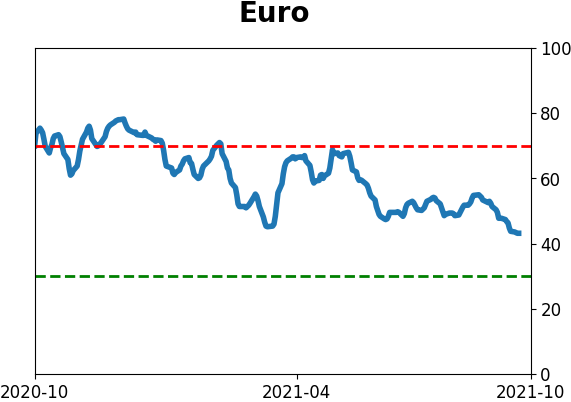
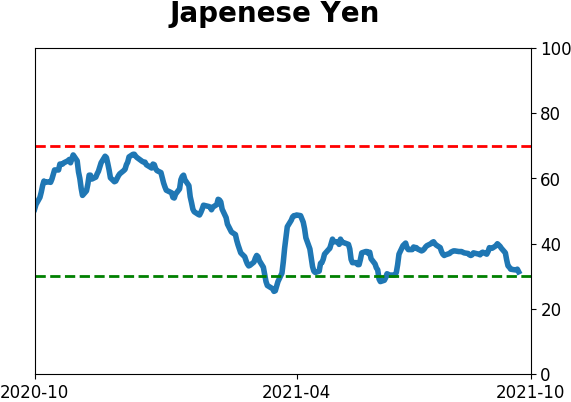
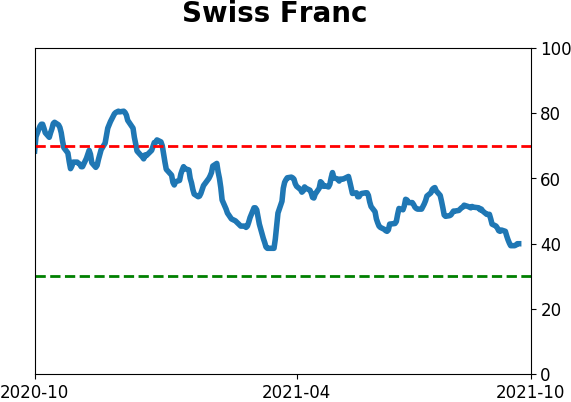
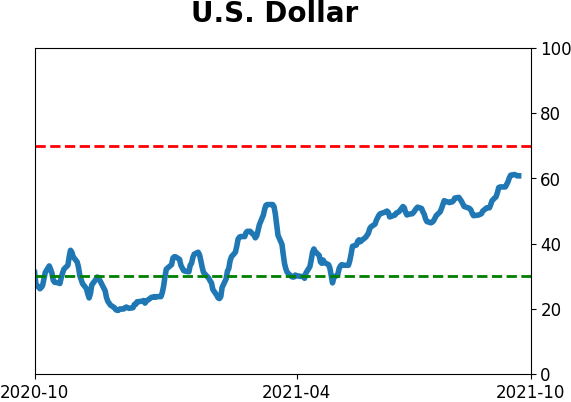
Currency ETF's - 5-Day Moving Average
|
|
|
Commodity ETF's - 5-Day Moving Average
|
|