Headlines
|
|
Staples Reach Oversold as Investors Give Up:
Investors have largely given up on Consumer Staples, and they carry nearly the lowest weight in the S&P 500 since 1990. Selling pressure has been severe and protracted enough that the McClellan Summation Index for the sector is oversold, a rare feat during an uptrending market. Insiders aren't buying much, though, and other measures are showing only moderate extremes at best.
Bottom Line:
STOCKS: Weak buy
The speculative frenzy in February is wrung out. There are some signs of pessimism, but the most compelling data show that buyers consistently tend to return once the first signs of extreme momentum end, especially as we head into a seasonally positive time of year. See the Outlook & Allocations page for more. BONDS: Hold
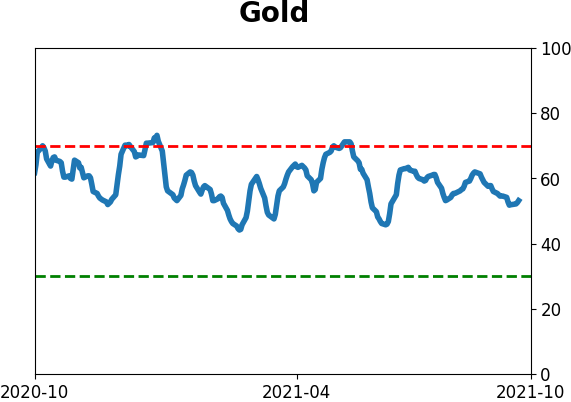
Various parts of the market got hit in March, with the lowest Bond Optimism Index we usually see during healthy environments. Bond prices have modest recovered and there is no edge among the data we follow. GOLD: Hold
Gold and miners were rejected after trying to recover above their 200-day averages in May. Lately, some medium-term (not long-term) oversold extremes in breadth measures among miners have triggered.
|
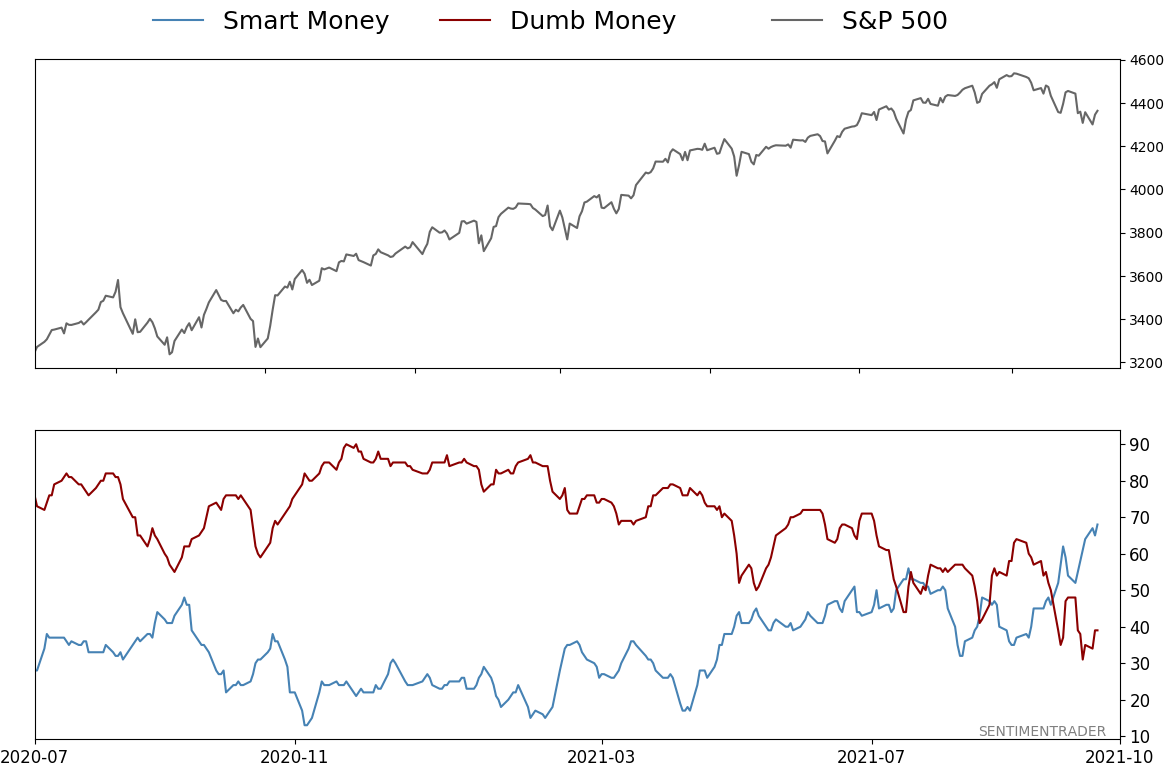
Smart / Dumb Money Confidence
|
Smart Money Confidence: 68%
Dumb Money Confidence: 39%
|
|
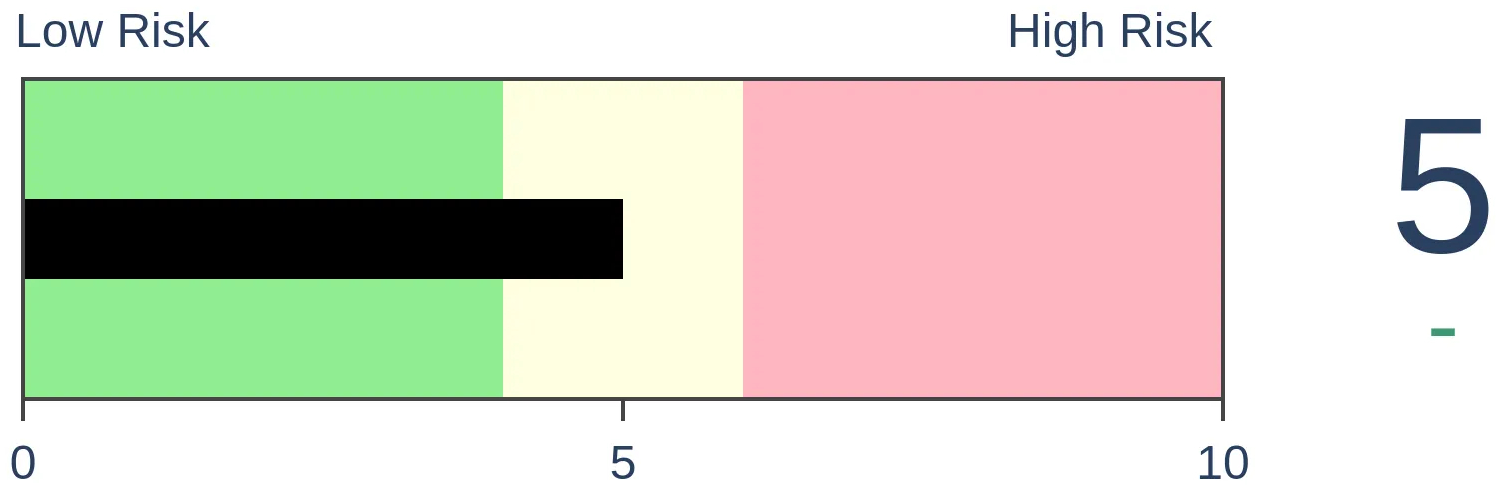
Risk Levels
Stocks Short-Term
|
Stocks Medium-Term
|
|
Bonds

|
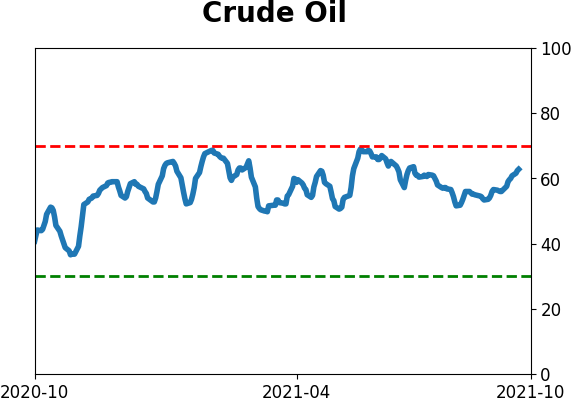
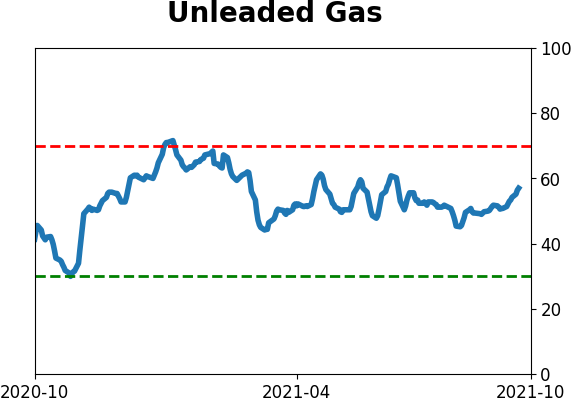
Crude Oil

|
|
Gold

|
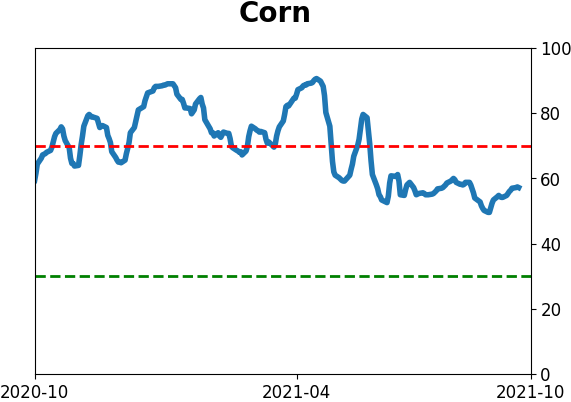
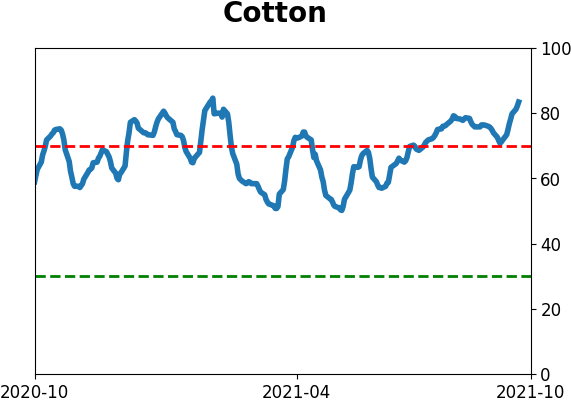
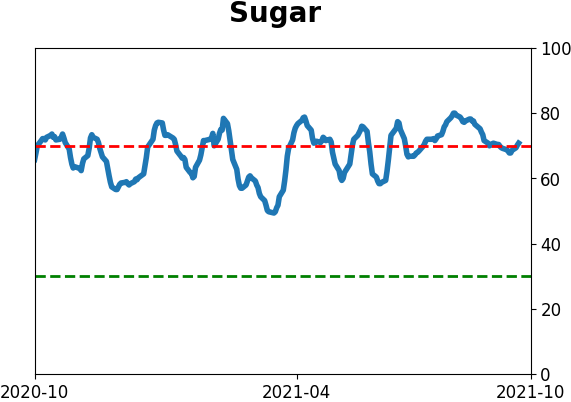
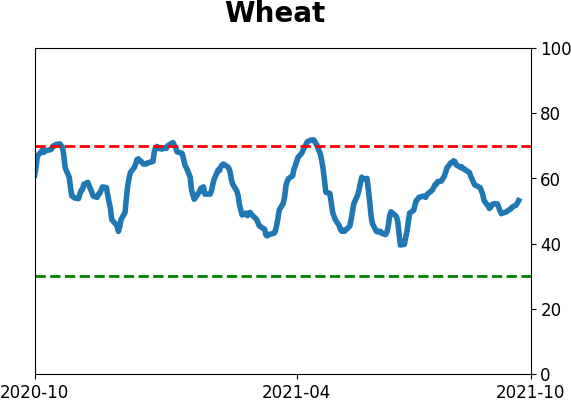
Agriculture

|
|
Research
By Jason Goepfert
BOTTOM LINE
Investors have largely given up on Consumer Staples, and they carry nearly the lowest weight in the S&P 500 since 1990. Selling pressure has been severe and protracted enough that the McClellan Summation Index for the sector is oversold, a rare feat during an uptrending market. Insiders aren't buying much, though, and other measures are showing only moderate extremes at best.
FORECAST / TIMEFRAME
XLP -- Up, Long-Term
|
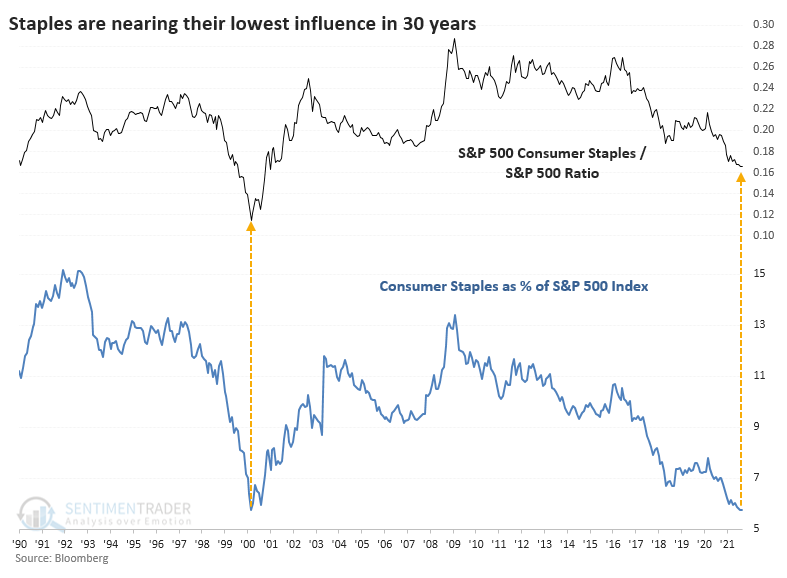
Consumer Staples stocks rarely get investors excited. Now is definitely one of those times.
Thanks to lagging stock prices and shrinking market cap while other sectors gain, Staples' share of the S&P 500 has shrunk below 6% for only the 2nd time in 30 years, according to Bloomberg calculations. That happened to be in early 2000 as stocks were peaking and Staples went on to massive outperformance over the next couple of years.
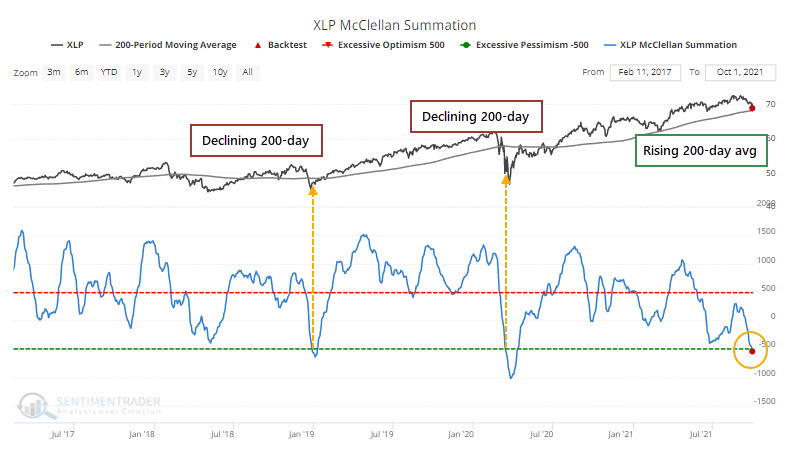
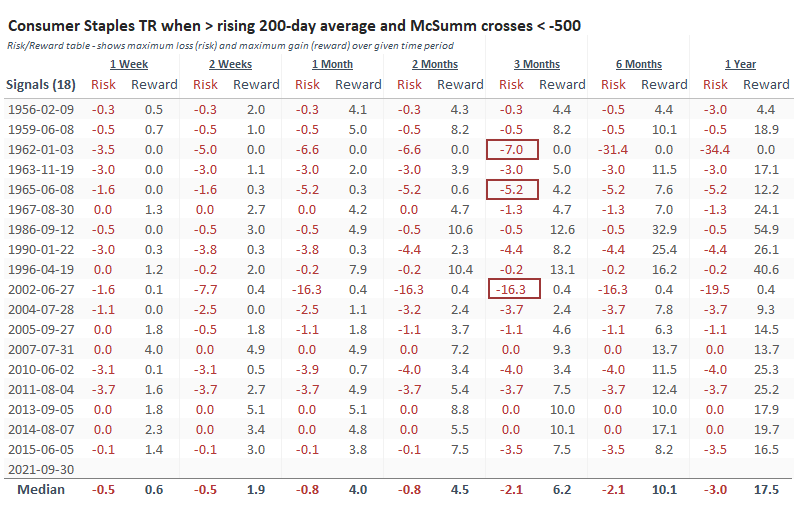
So many of the stocks have been forgotten, for so long, that the McClellan Summation Index for the sector has dropped below -500, enough to consider it deeply oversold. Curiously, this triggered even though the sector itself has been holding above a rising 200-day moving average. That wasn't the case the last two times the Summation Index fell to such a low level according to the Backtest Engine.
The total return on Staples when it was trading above a rising 200-day moving average and the Summation Index fell below -500 was positive across all time frames, with especially positive returns over the next six months. Out of the 18 signals, 16 showed a positive return over that time frame.
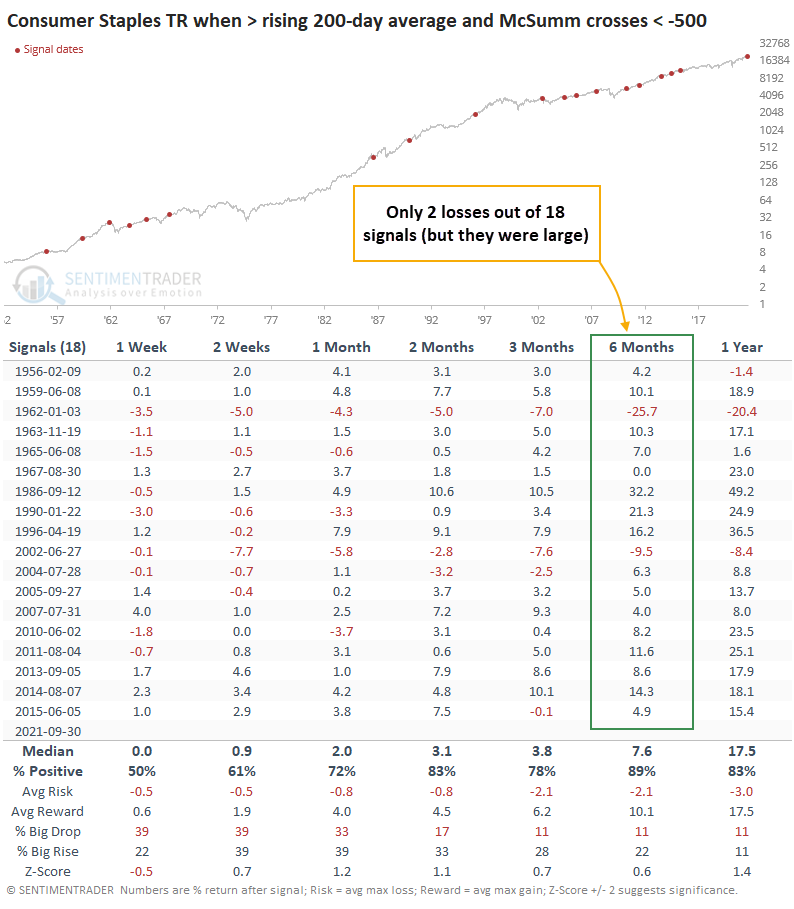
Over the next three months, only 3 dates led to a maximum decline greater than -5% while 10 of them preceded a maximum gain greater than +5%. Across most time frames, the reward-to-risk ratio exceeded 3-to-1, which is the minimum that we typically look for to indicate a compelling opportunity.
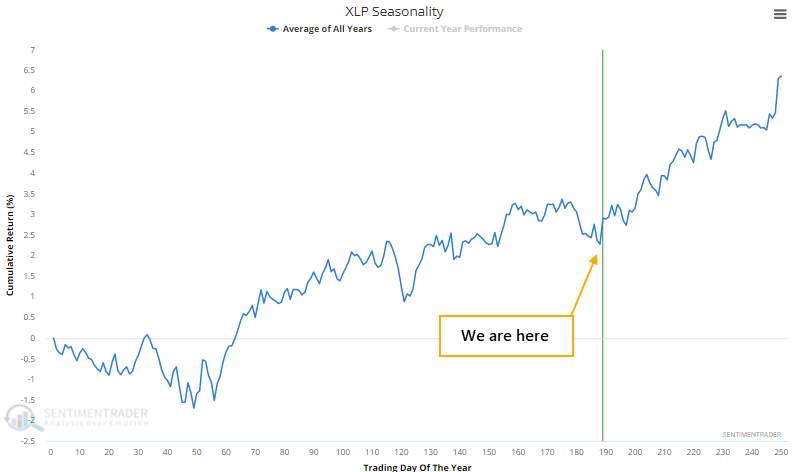
If Staples are going to take off, this is about the time to do it, according to the calendar. The stocks have tended to do well in Q4, with XLP forming its seasonal fall low a couple of days ago.
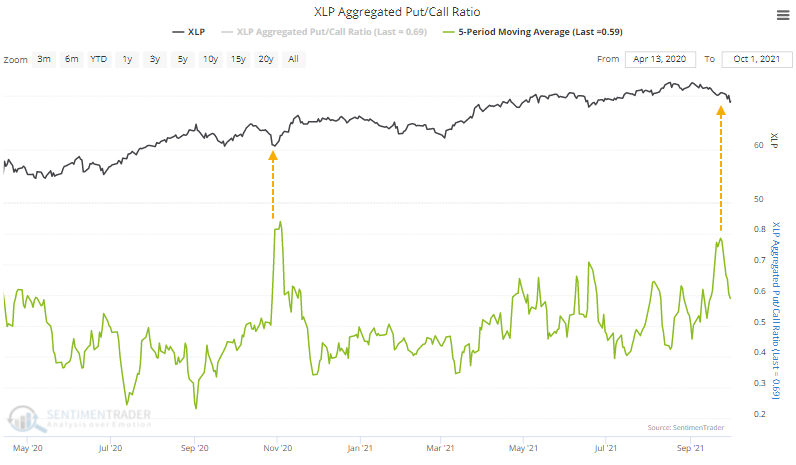
There is a bit of a gambling mentality for further downside. Over the past week, the aggregate volume of put options relative to call options among stocks in the sector reached its 2nd-highest level since the pandemic bottom. Historically, this activity is still subdued and not showing excessive pessimism. We're only talking about the post-pandemic period here.
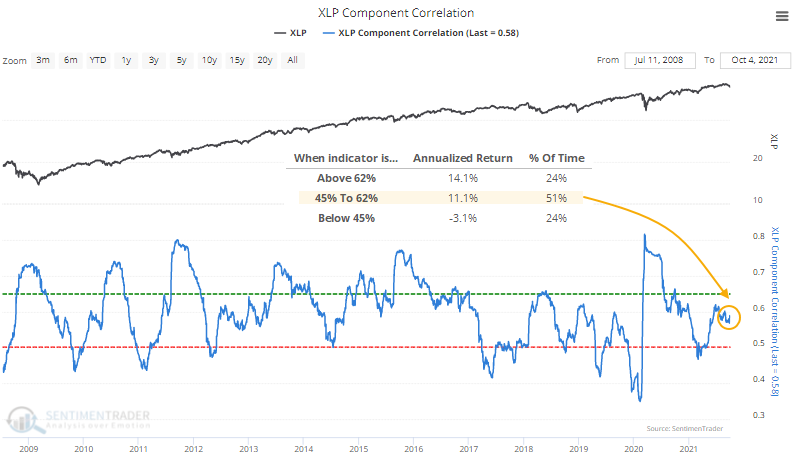
There isn't outright panic according to most other measures. Correlation among stocks in the sector remains neutral, though on the upper end of its range over the past decade. The chart below shows that when the correlation among Staples stocks is above 62%, which happens about a quarter of the time, XLP returned an annualized +14.1%. That compares to a woeful -3.1% annualized return when investors were complacent and correlations dropped below 45%.
Among corporate insiders in Staples stocks, sell transactions are nearly the lowest they've been in a decade. Unfortunately, so are buy transactions.
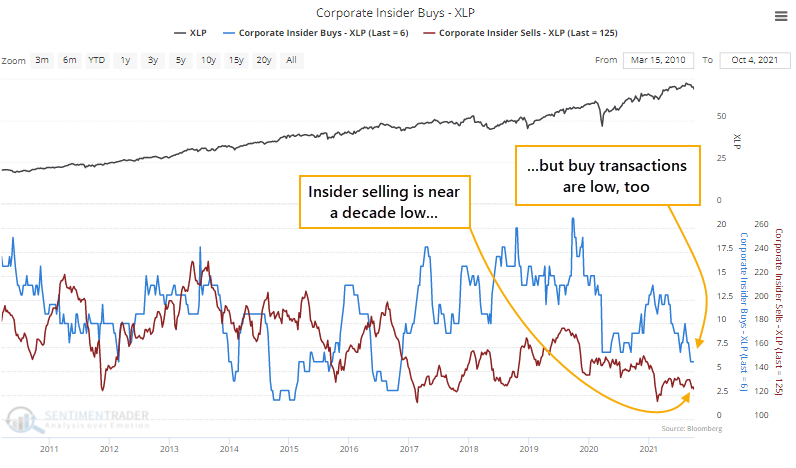
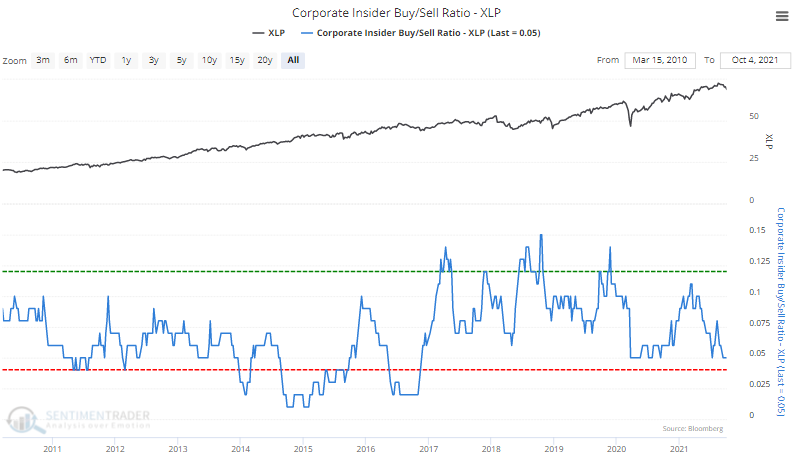
That has pushed the Corporate Insider Buy/Sell Ratio toward the bottom of its range. Like most sectors, and stocks in general, a surge in buy transactions has historically been a much better "smart money" gauge than sell transactions. Insiders may sell for a variety of reasons, including the potential that their stock price may decline; they buy for one major reason - they think the stock is going up.
There are few sectors that excite investors less than Consumer Staples, and that's one of their endearing qualities when the broad stock market gets tough. It's one of the better places to hide during protracted sell-offs. If stocks take off during Q4, and there are reasons to expect they might, Staples might come along for the ride but will almost certainly underperform; they don't lead risk-on rallies. The setup in these stocks isn't at slam-dunk levels, but it's at least compelling given the oversold nature of many of the component stocks and and lack of interest they generate among investors. It might be worth a modest overweight, just in case stocks don't follow through on Q4 expectations.
Active Studies
| Time Frame | Bullish | Bearish | | Short-Term | 0 | 0 | | Medium-Term | 6 | 0 | | Long-Term | 11 | 5 |
|
Indicators at Extremes
Portfolio
| Position | Description | Weight % | Added / Reduced | Date | | Stocks | RSP | 10.5 | Added 6.4% | 2021-10-01 | | Bonds | 23.9% BND, 6.9% SCHP | 31.5 | Reduced 7.1% | 2021-05-19 | | Commodities | GCC | 2.6 | Reduced 2.1%
| 2020-09-04 | | Precious Metals | GDX | 4.2 | Reduced 4.2% | 2021-05-19 | | Special Situations | 9.8% KWEB, 4.7% XLE, 2.9% PSCE | 17.3 | Added 9.78% | 2021-10-01 | | Cash | | 34.0 | | |
|
Updates (Changes made today are underlined)
Much of our momentum and trend work has remained positive for several months, with some scattered exceptions. Almost all sentiment-related work has shown a poor risk/reward ratio for stocks, especially as speculation drove to record highs in exuberance in February. Much of that has worn off, and most of our models are back toward neutral levels. There isn't much to be excited about here. The same goes for bonds and even gold. Gold has been performing well lately and is back above long-term trend lines. The issue is that it has a poor record of holding onto gains when attempting a long-term trend change like this, so we'll take a wait-and-see approach. Momentum has ebbed quickly in recent weeks, and nearing oversold levels in some indicators. This can be a dangerous area, with a lot of short-term volatility, but we'd be more inclined to add medium- to long-term exposure rather than sell on much more of a decline, thanks to already rock-bottom exposure. Other areas look more attractive, including some overseas markets. RETURN YTD: 8.9% 2020: 8.1%, 2019: 12.6%, 2018: 0.6%, 2017: 3.8%, 2016: 17.1%, 2015: 9.2%, 2014: 14.5%, 2013: 2.2%, 2012: 10.8%, 2011: 16.5%, 2010: 15.3%, 2009: 23.9%, 2008: 16.2%, 2007: 7.8%
|
|
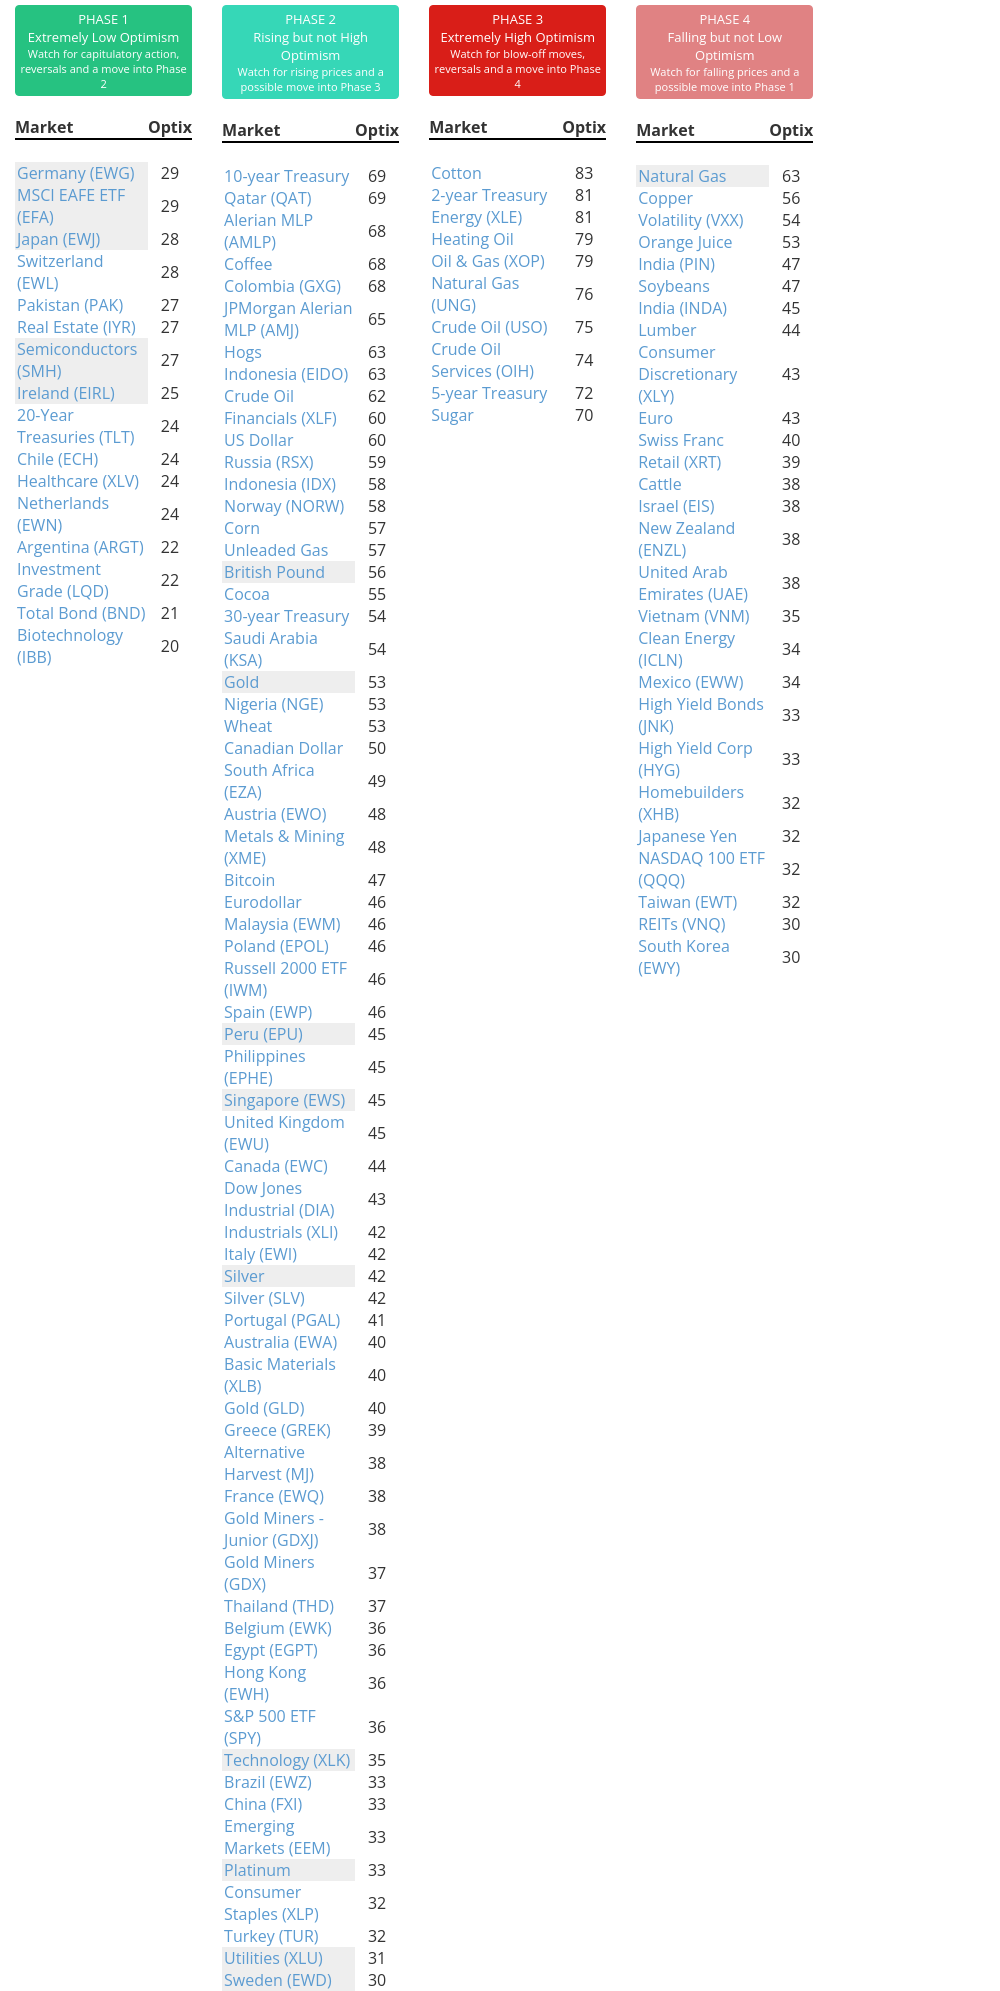
Phase Table
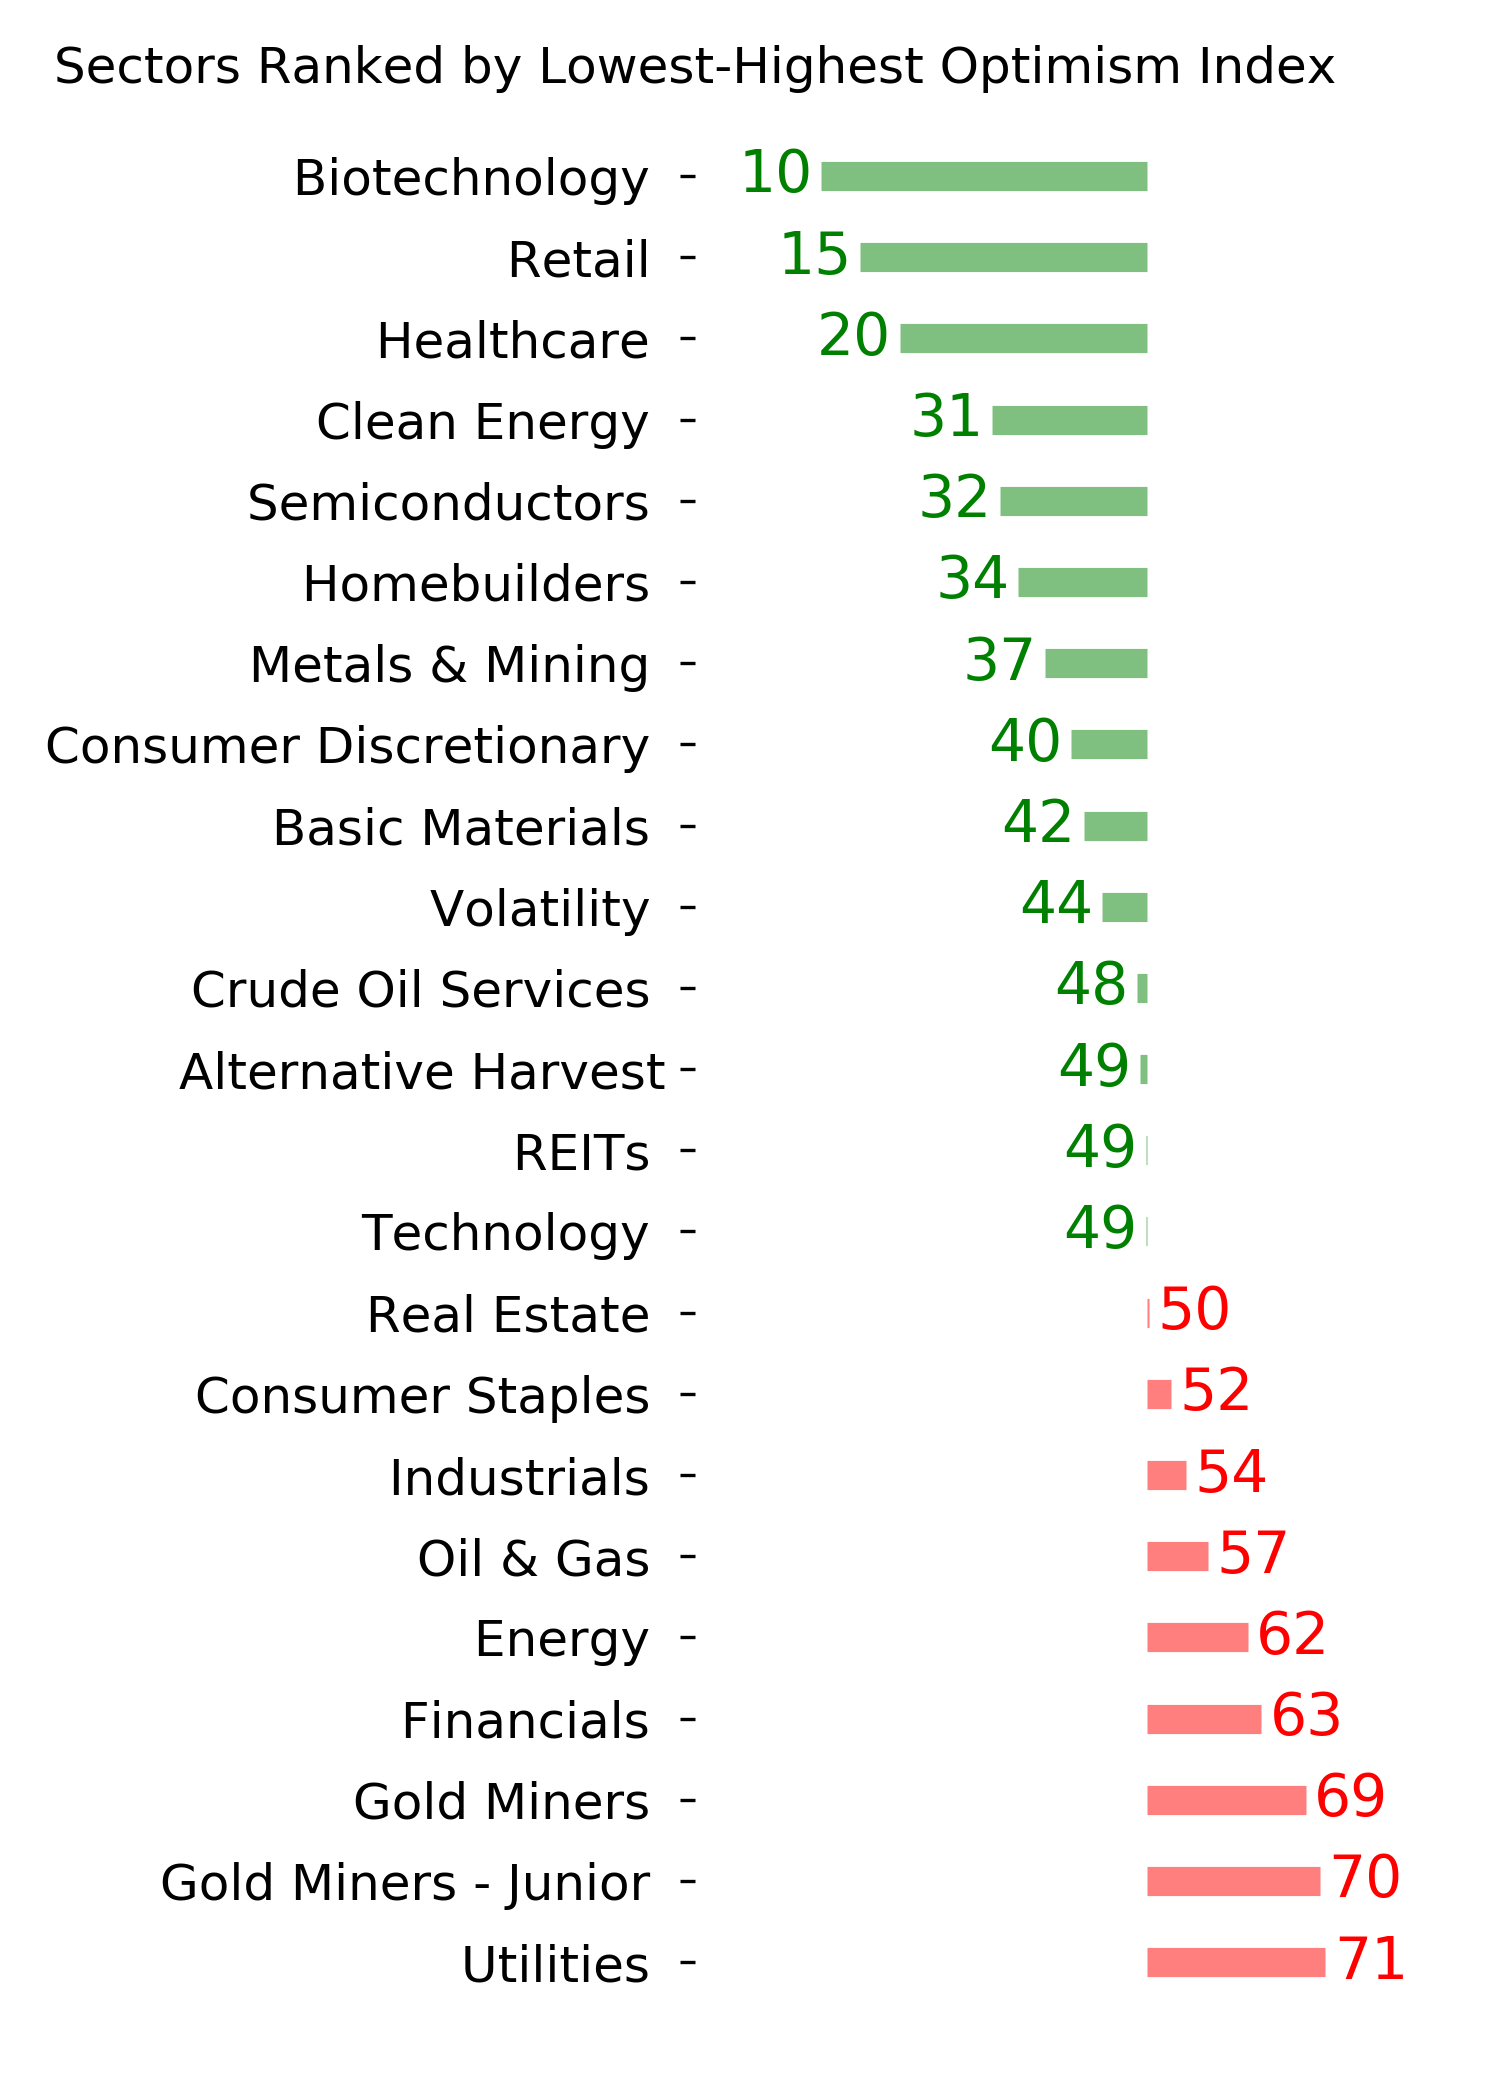
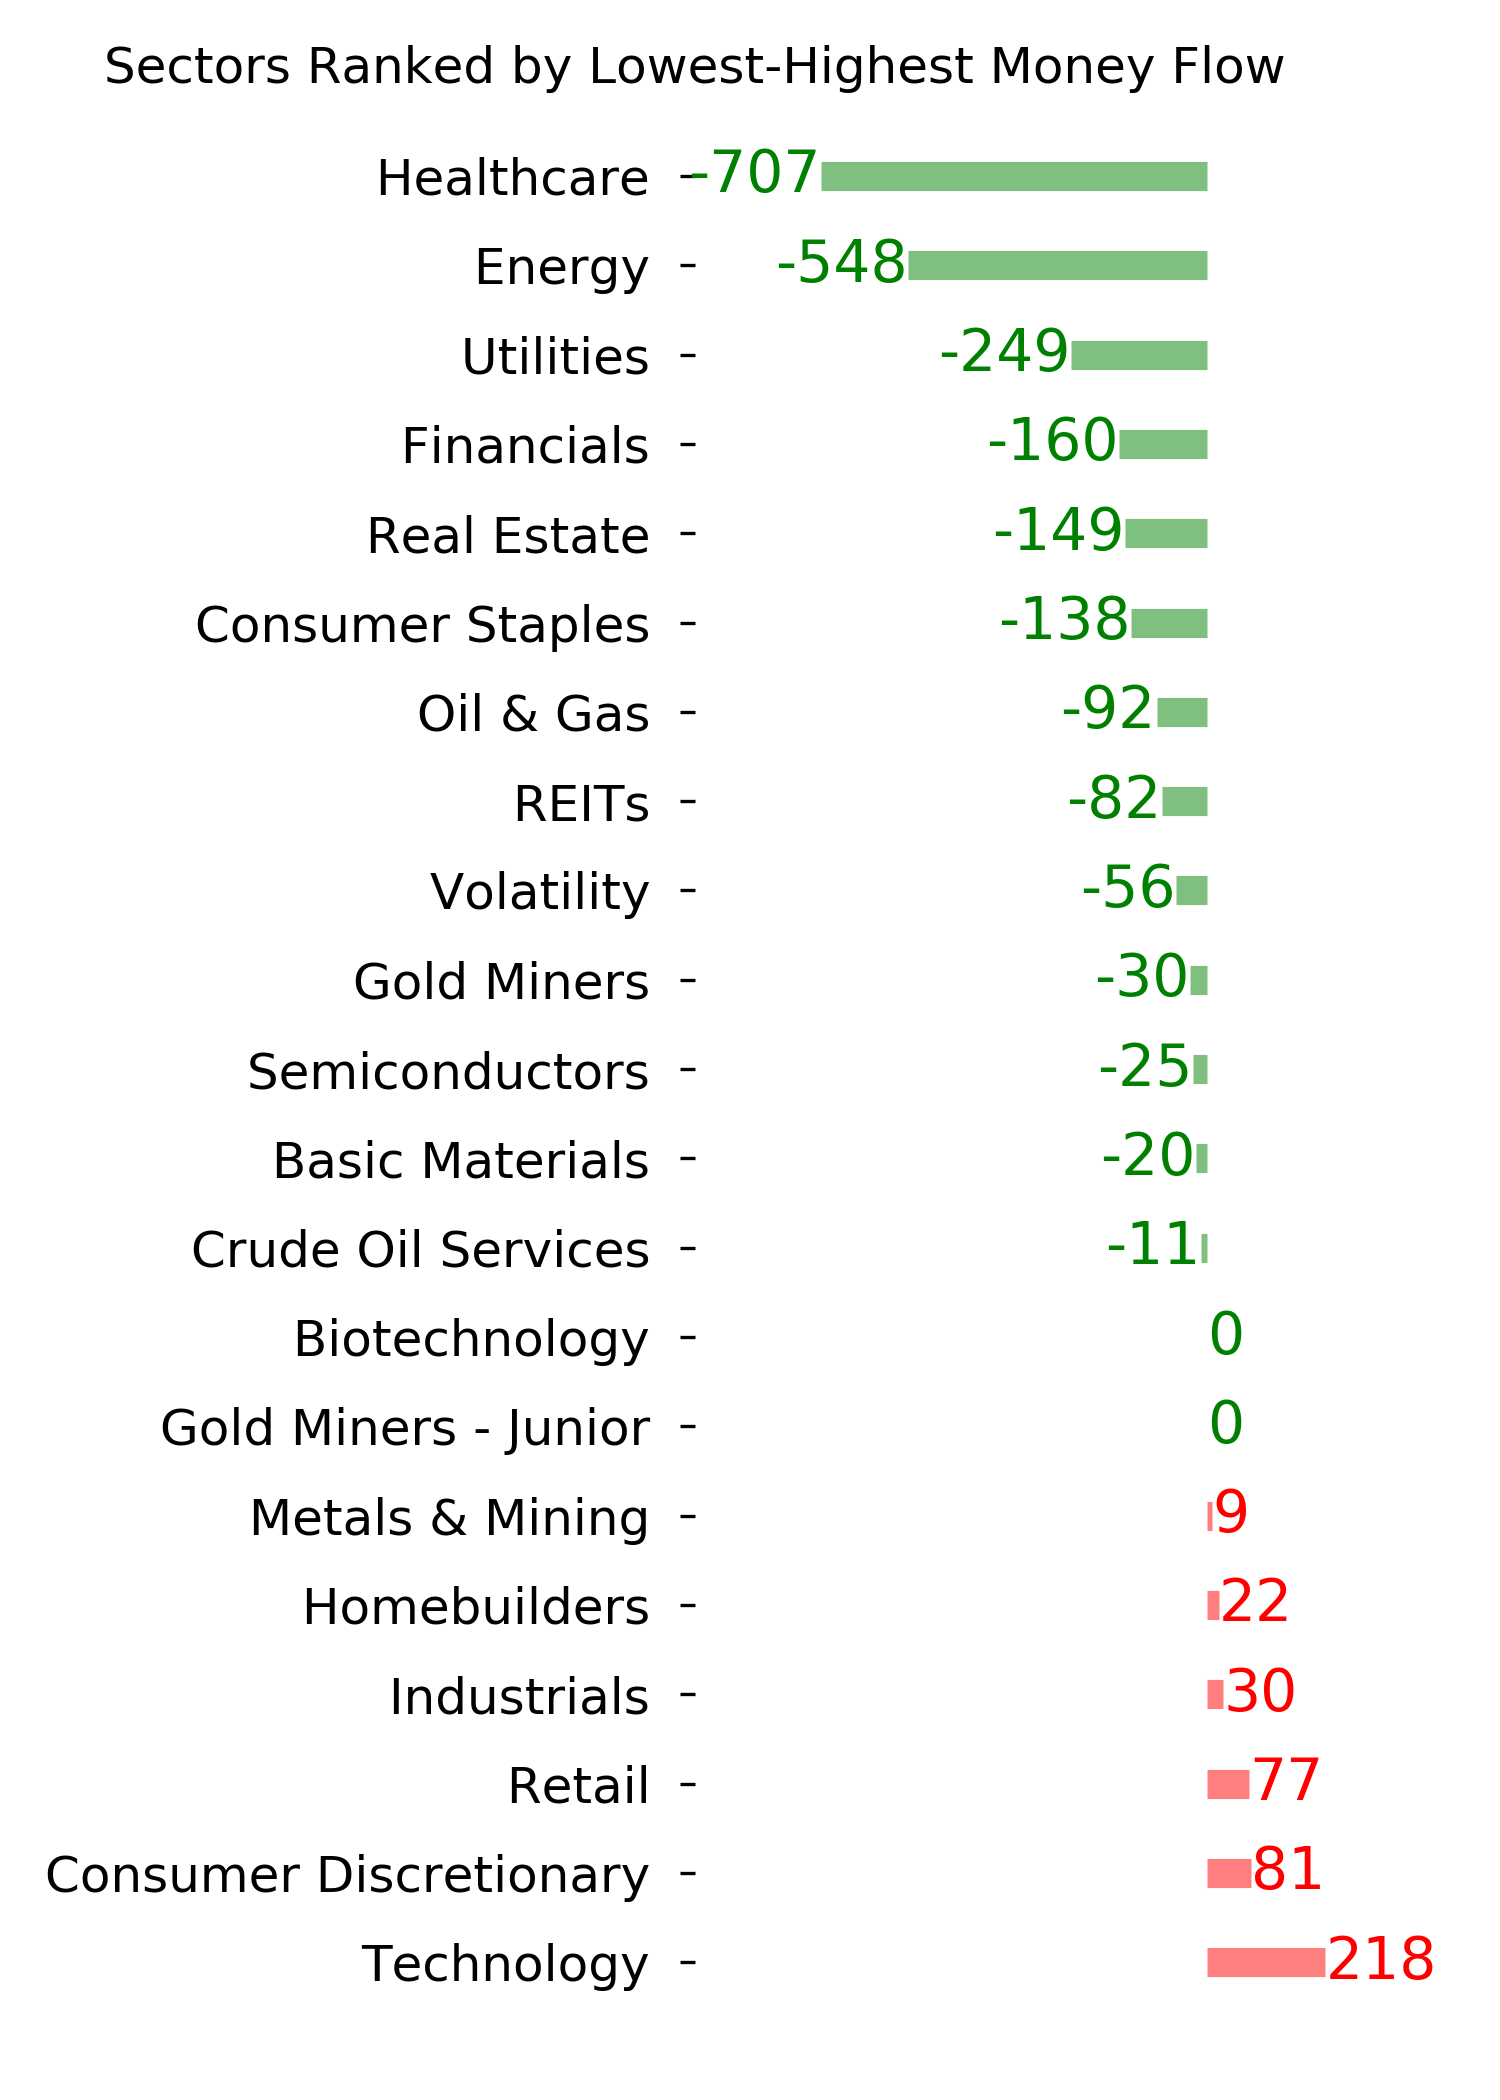
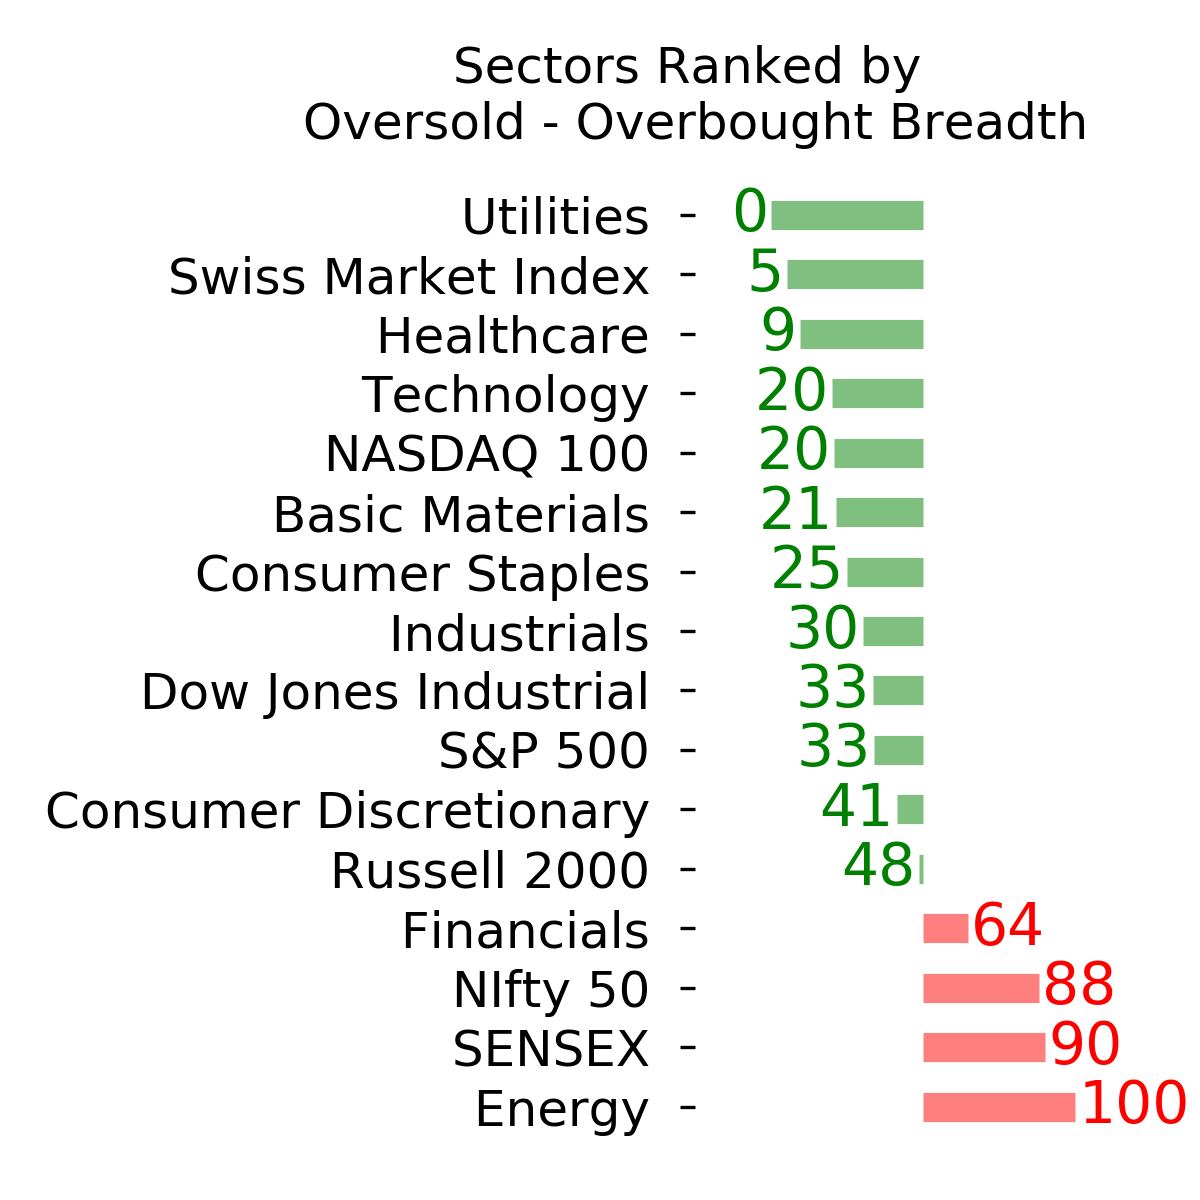
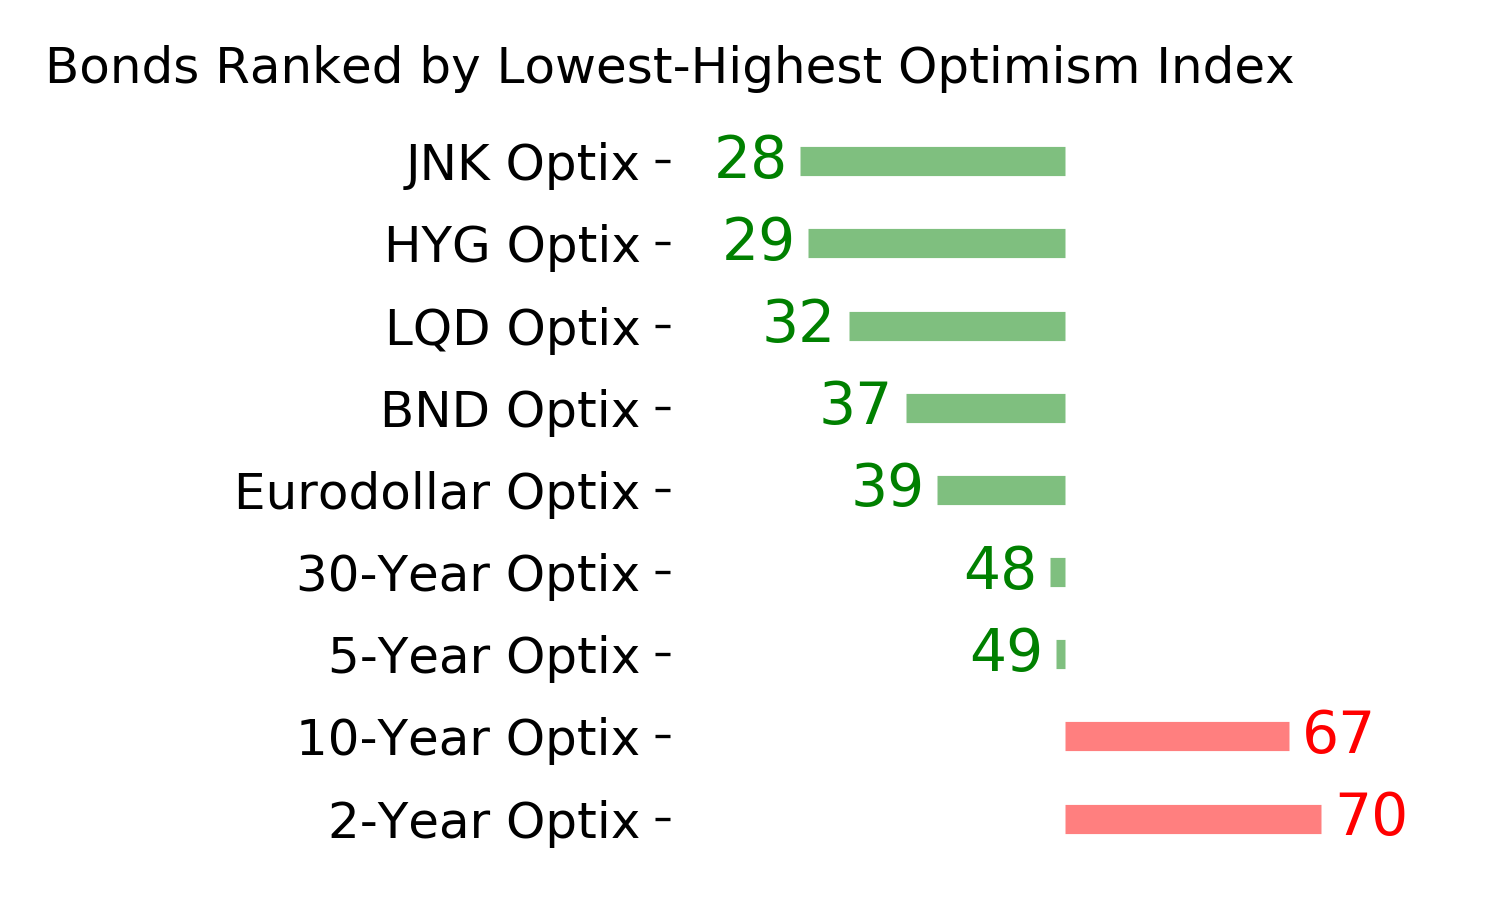
Ranks
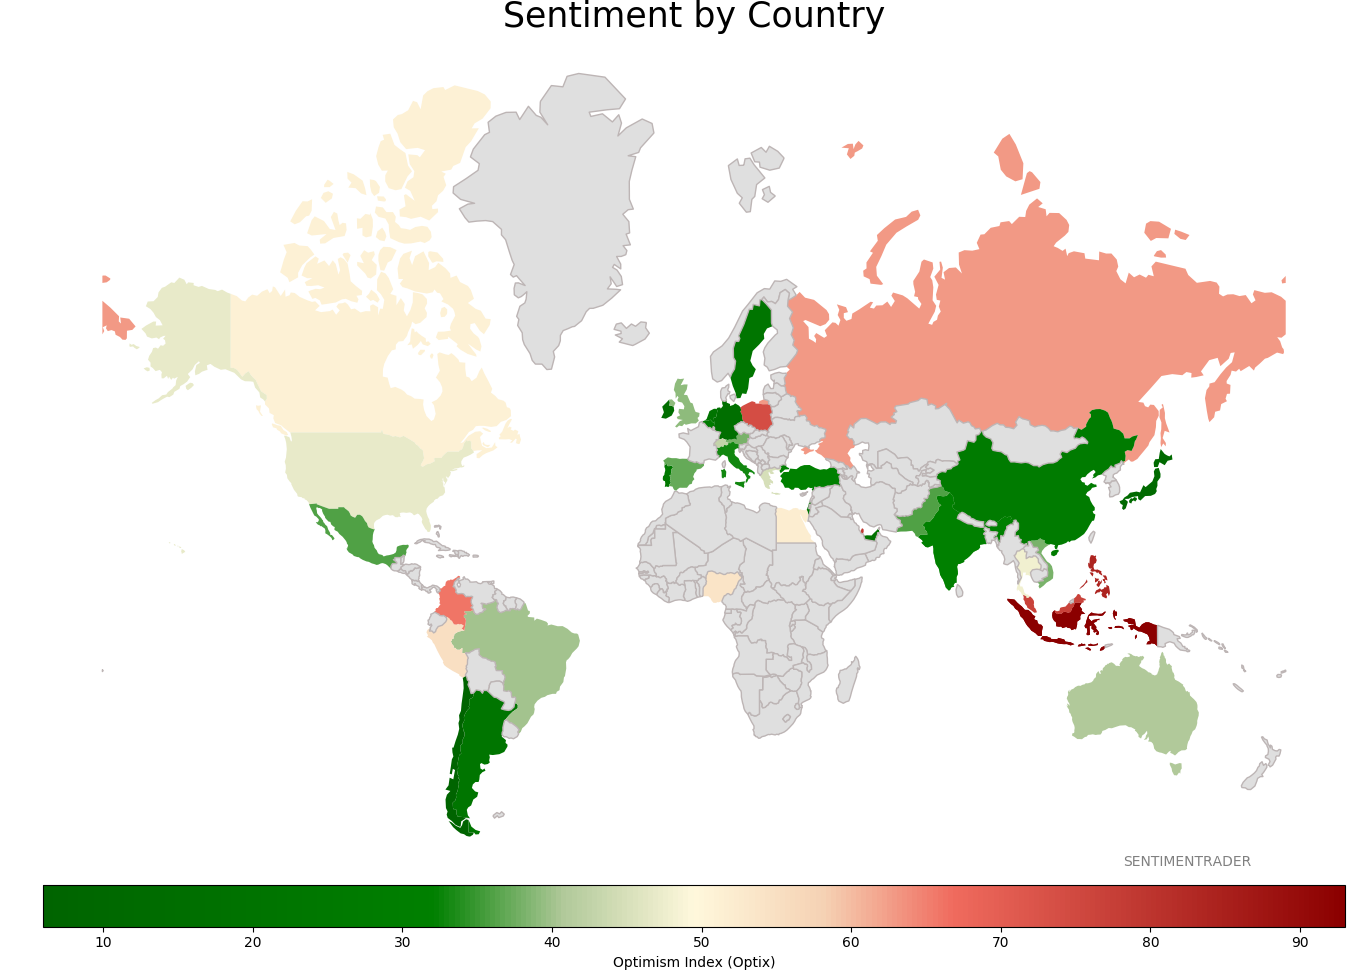
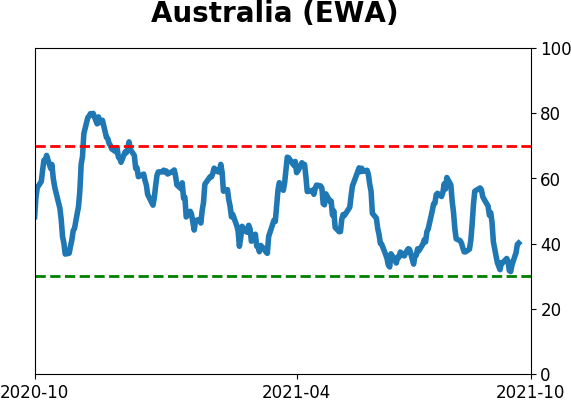
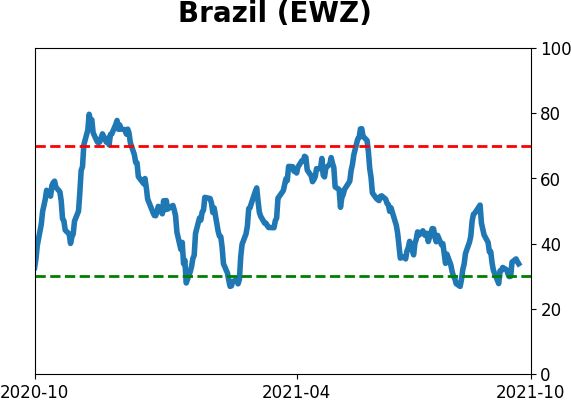
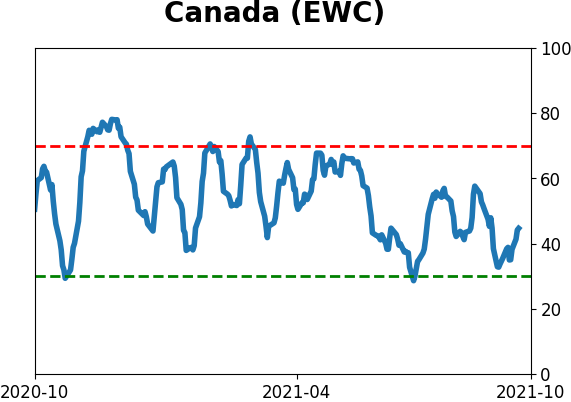
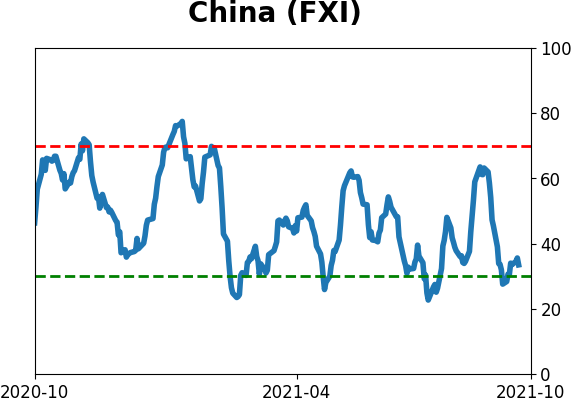
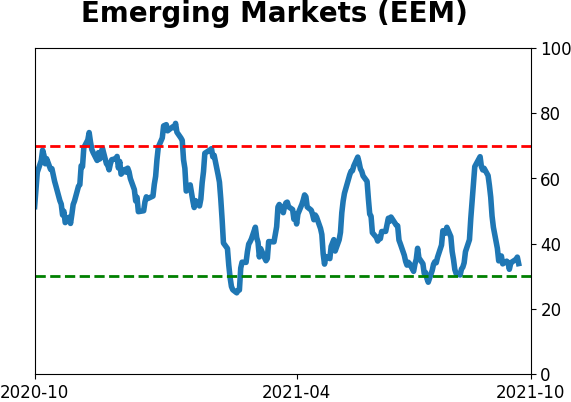
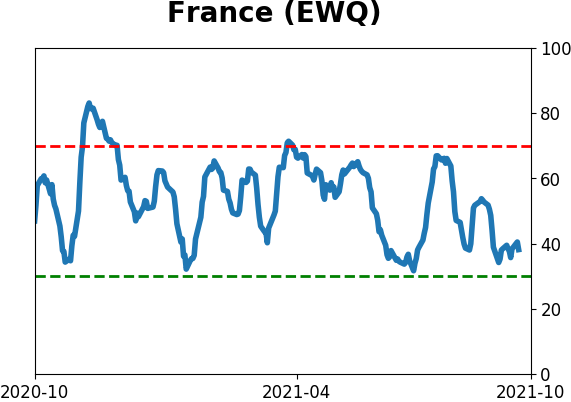
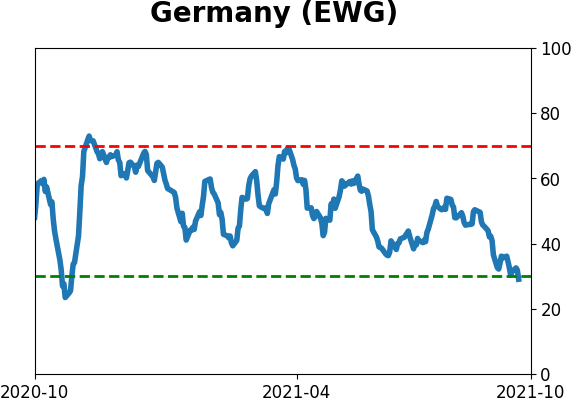
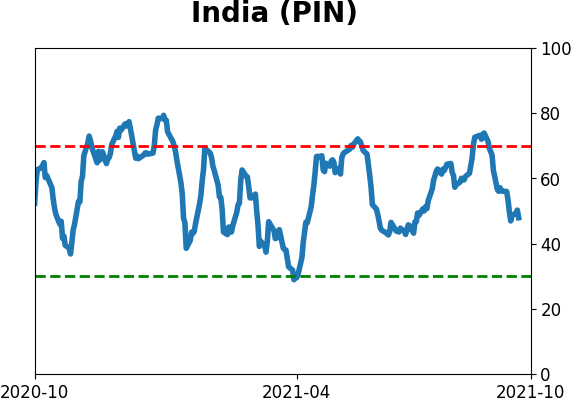
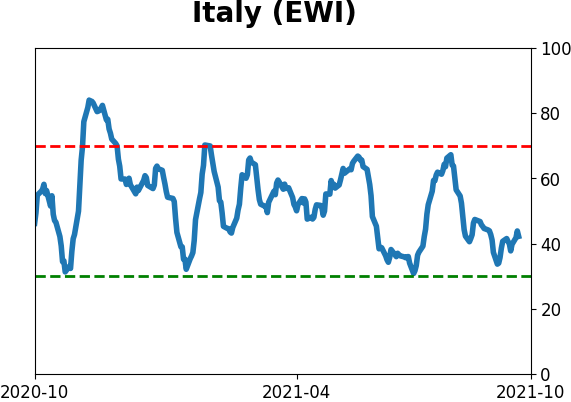
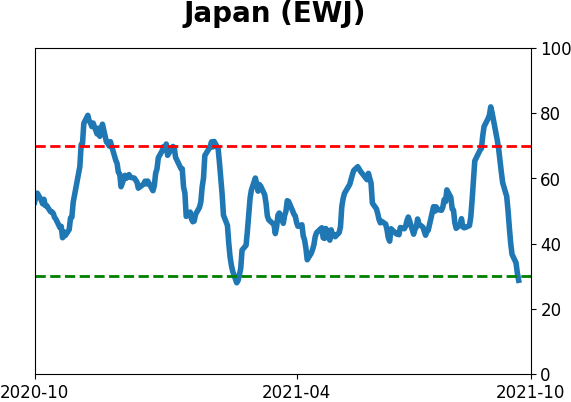
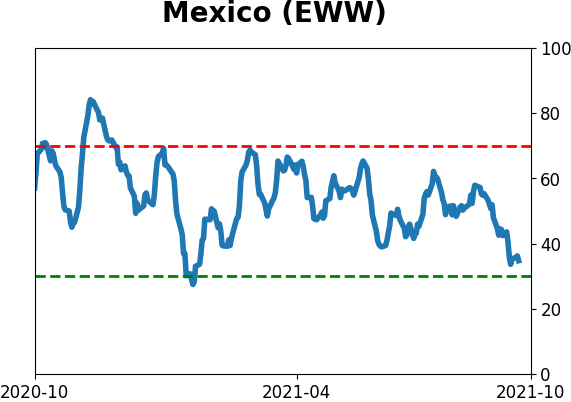
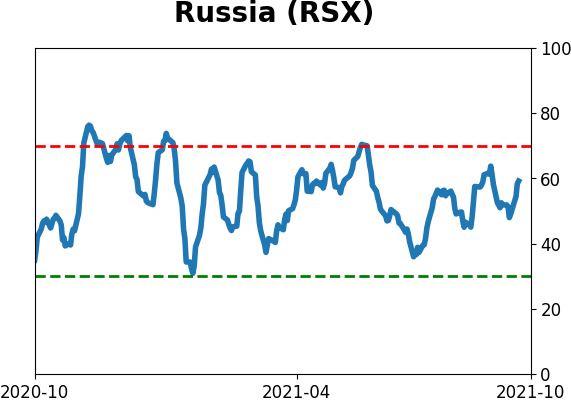
Sentiment Around The World
Optimism Index Thumbnails
|
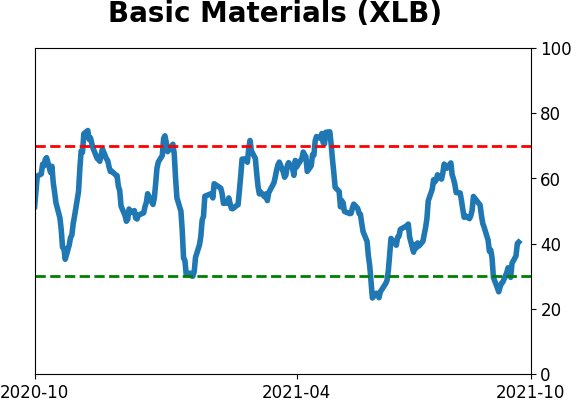
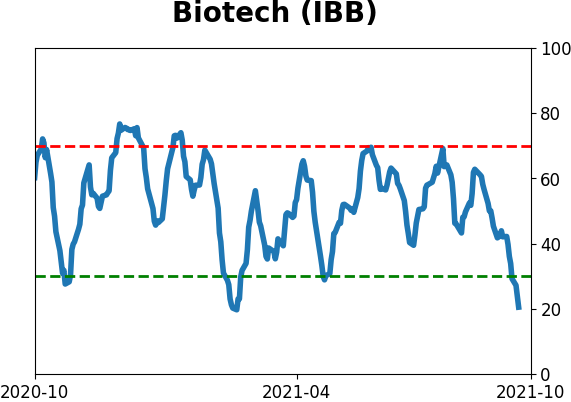
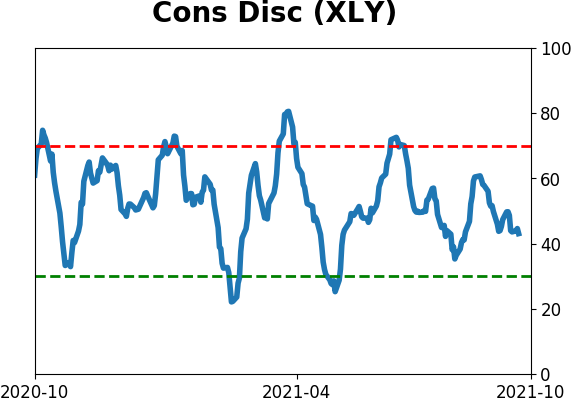
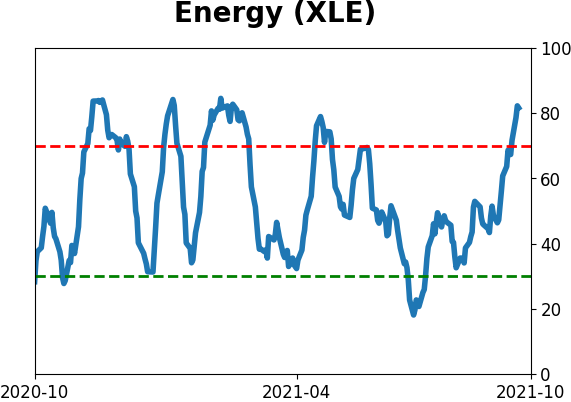
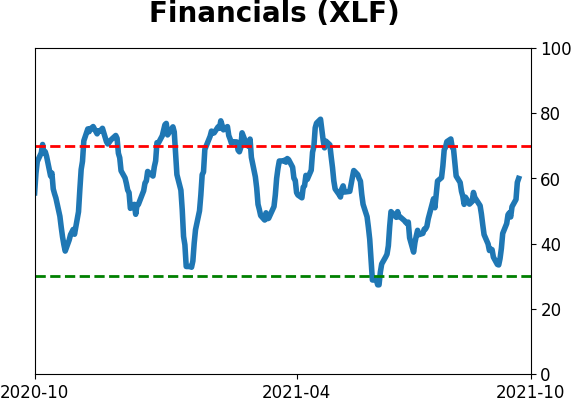
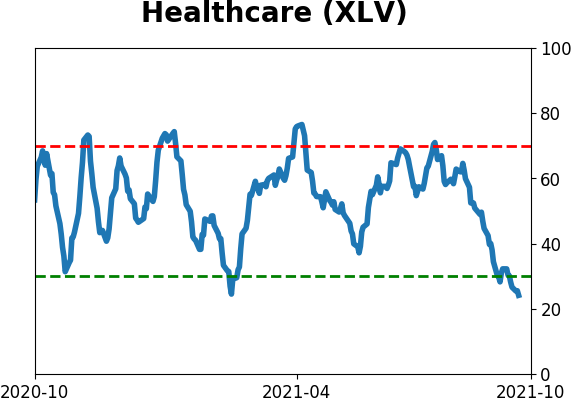
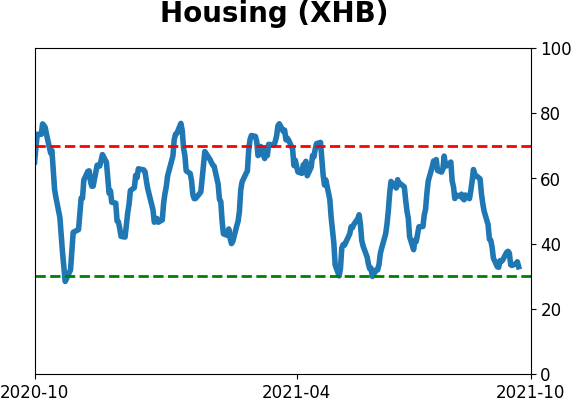
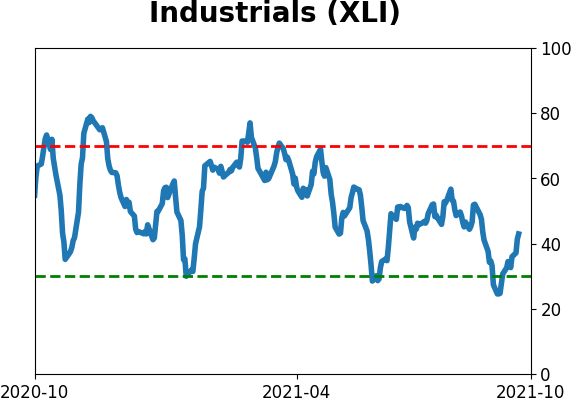
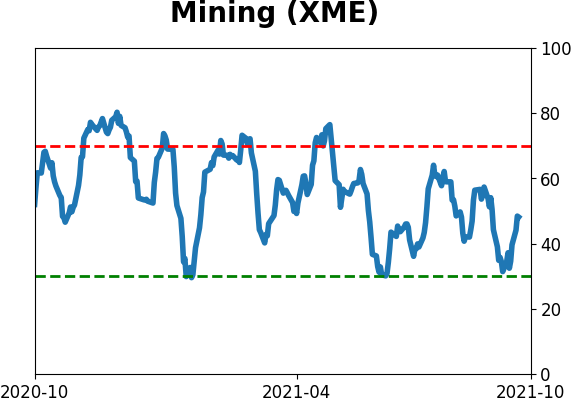
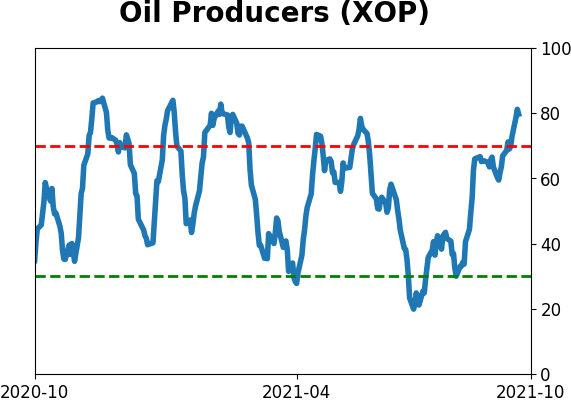
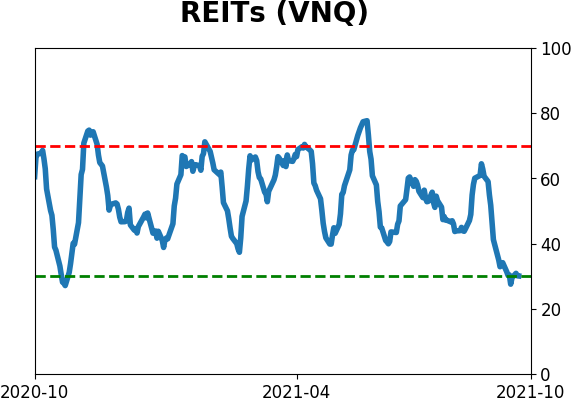
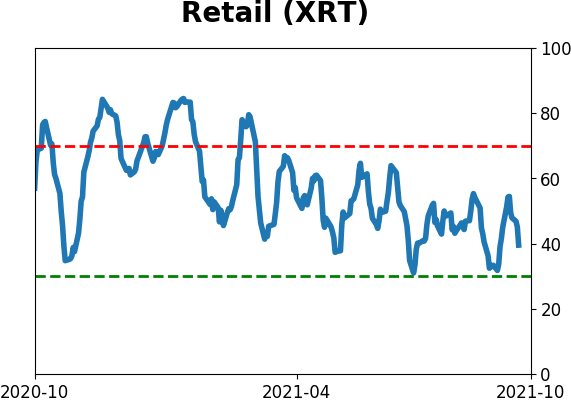
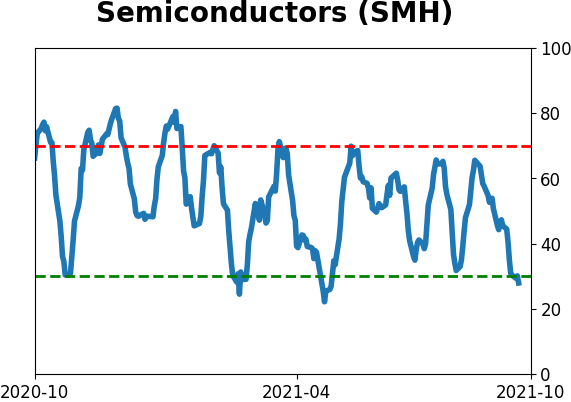
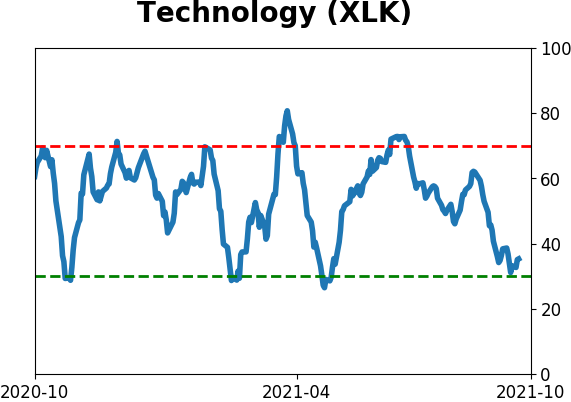
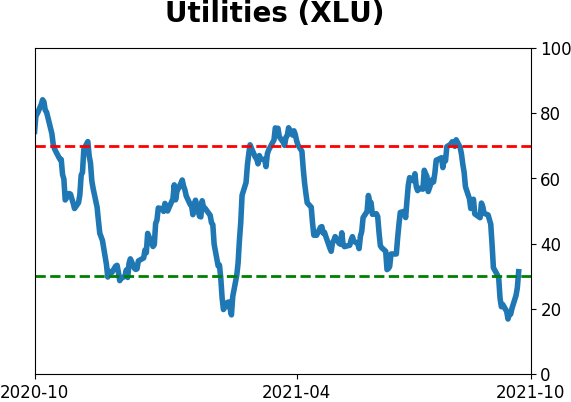
Sector ETF's - 10-Day Moving Average
|
|
|
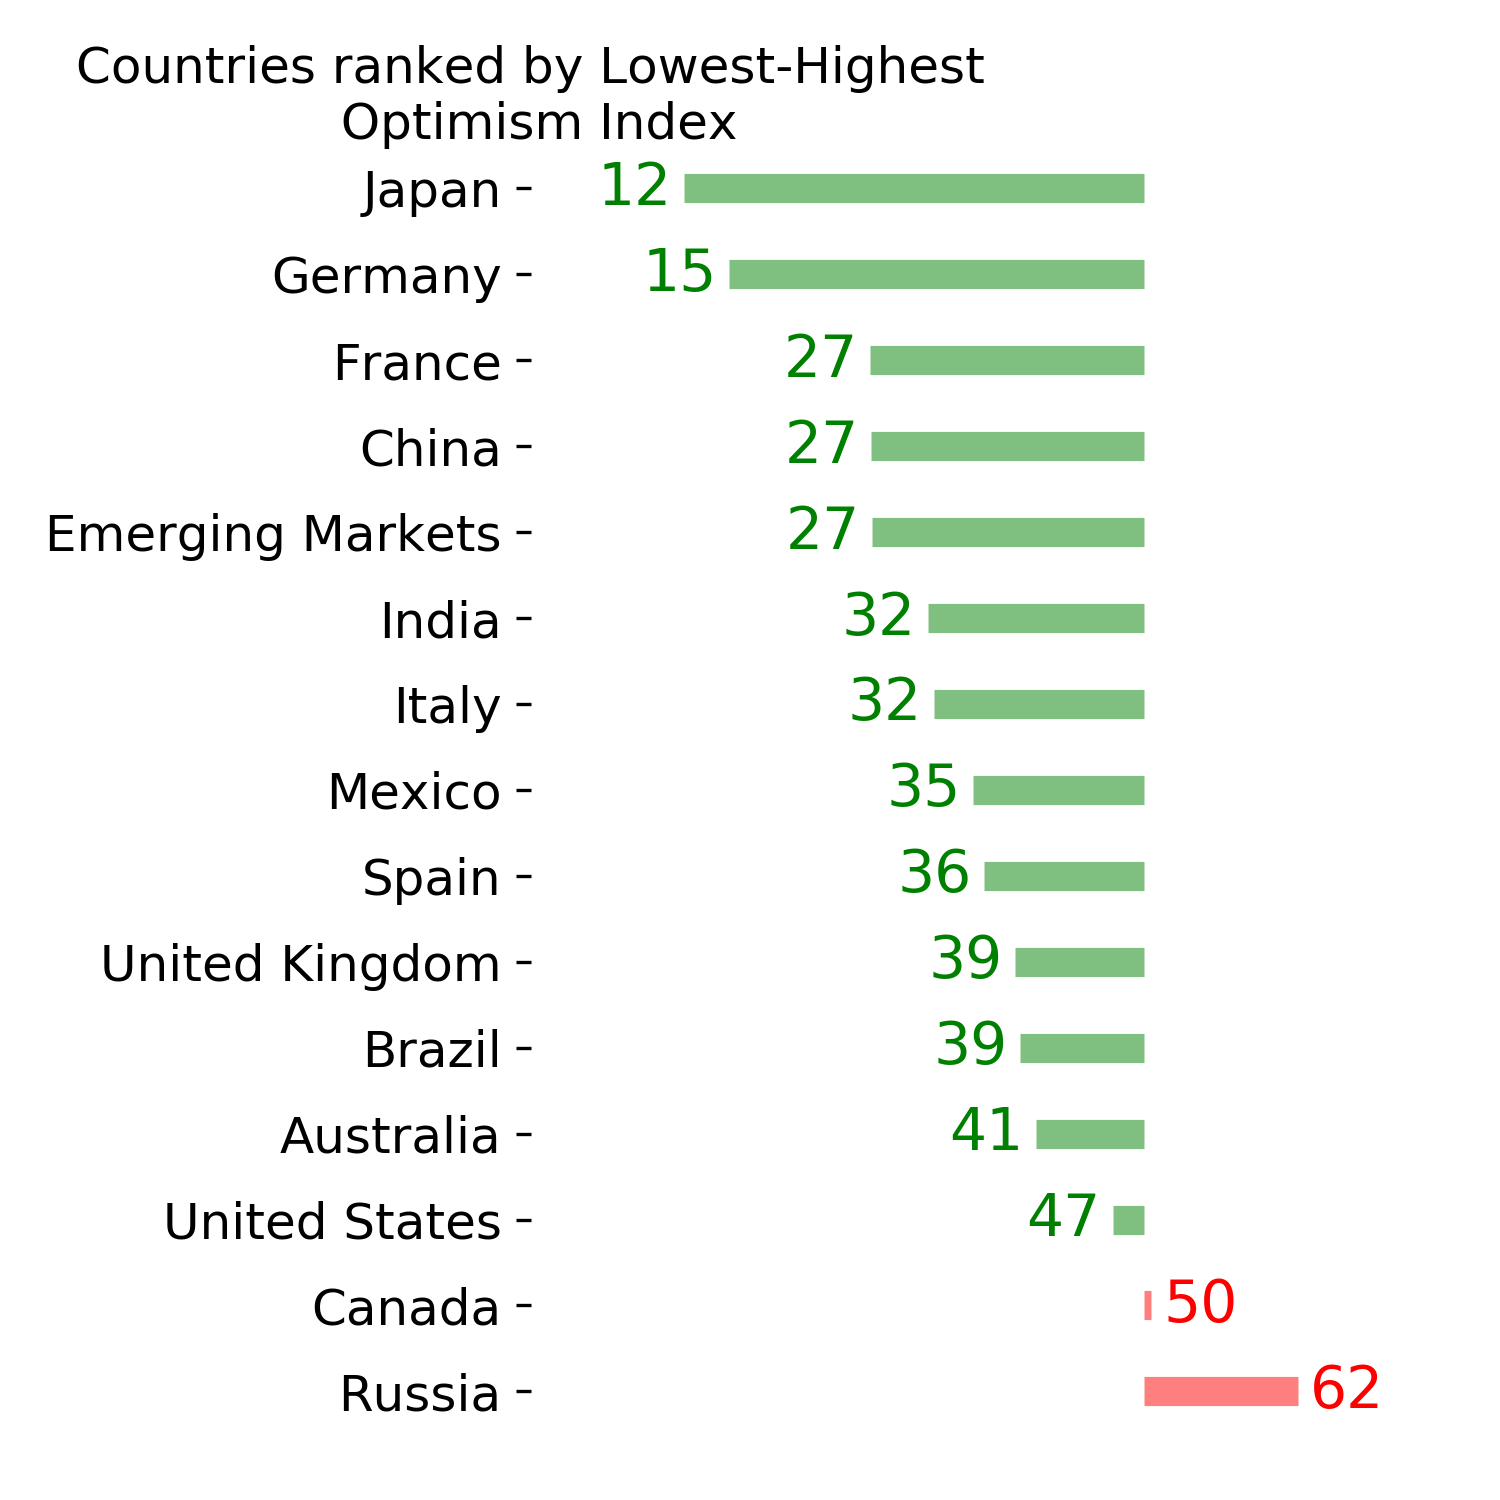
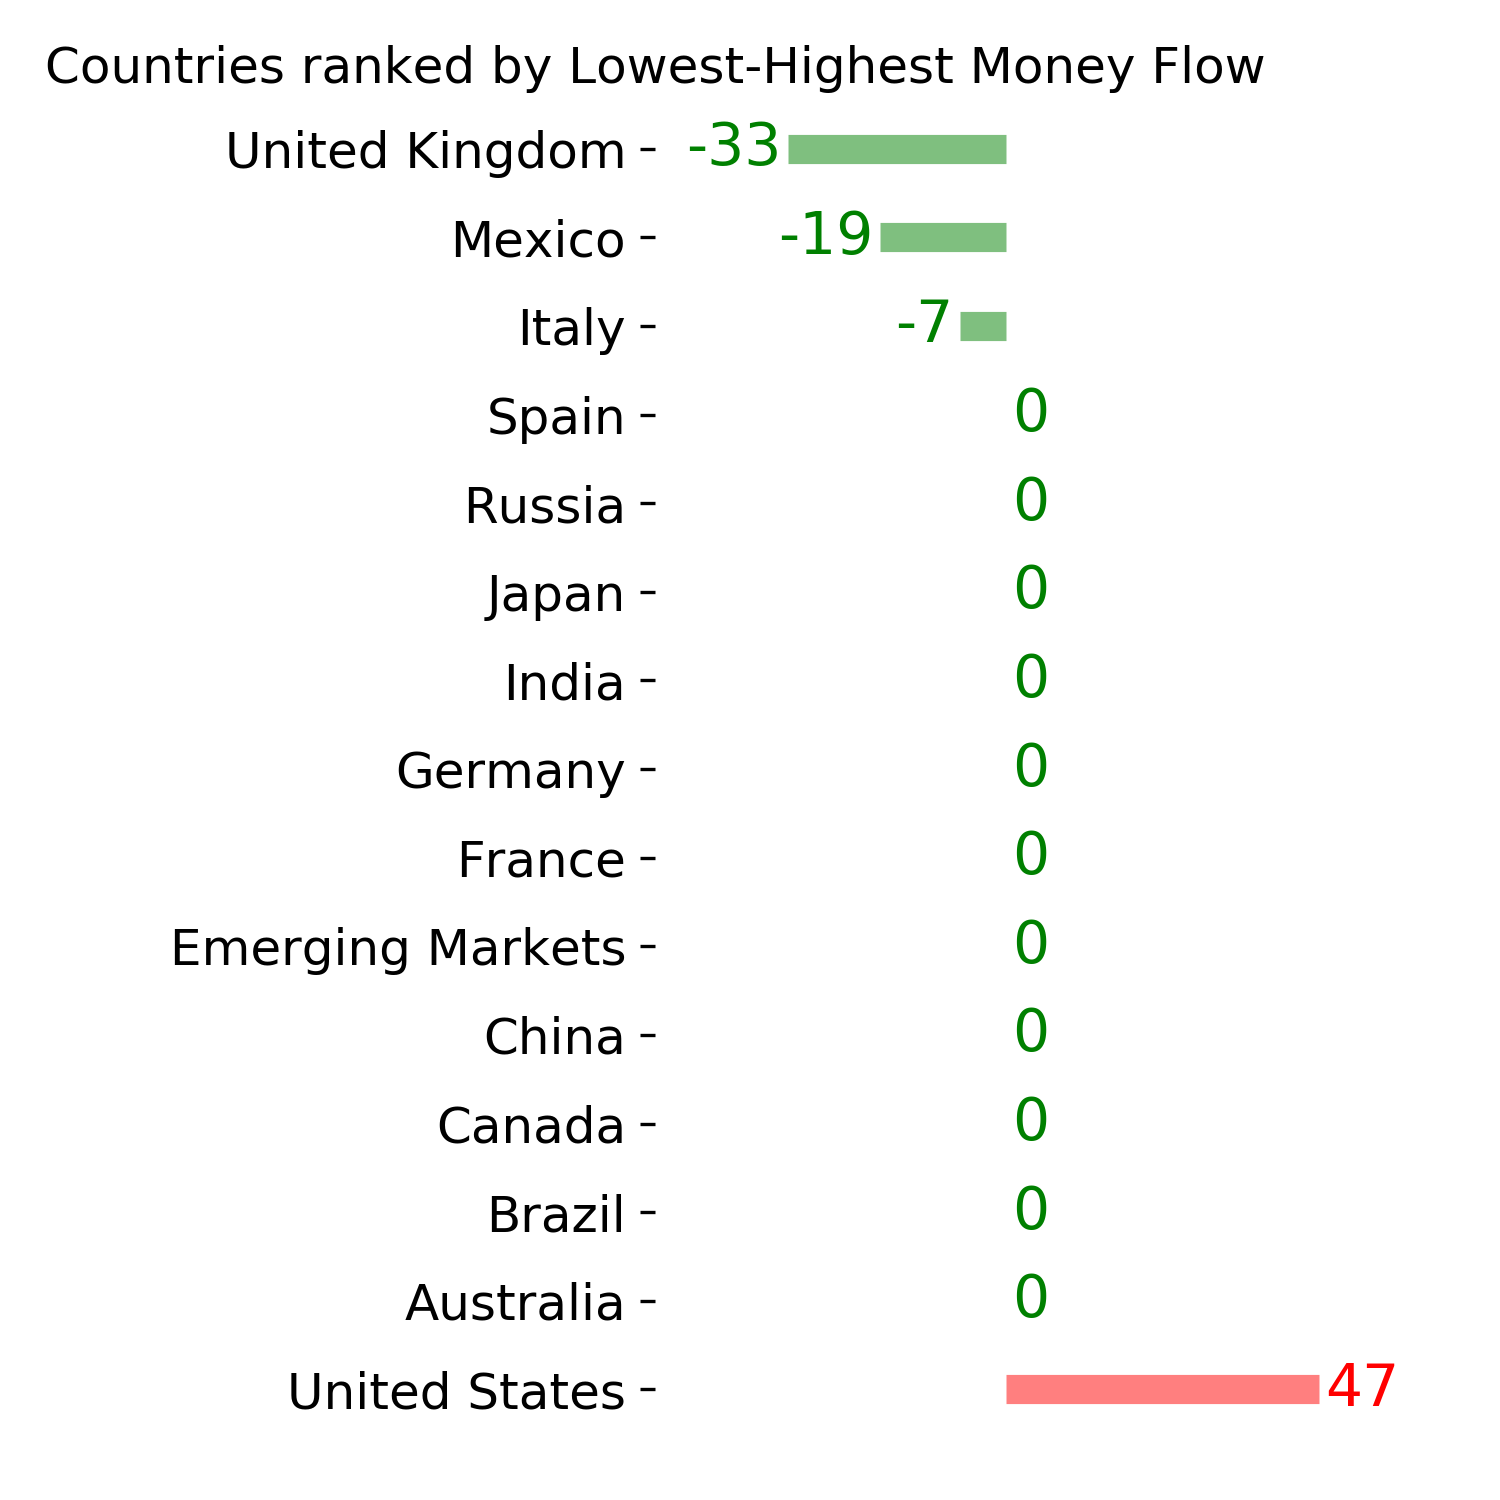
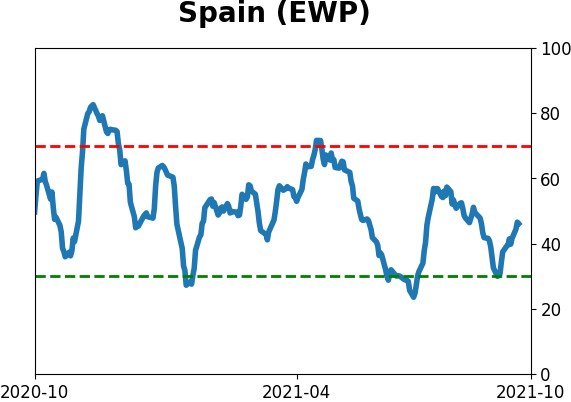
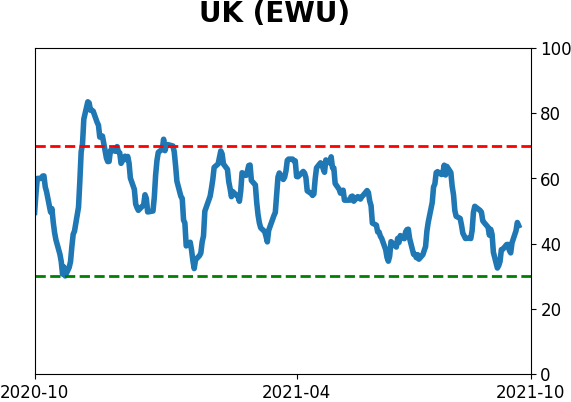
Country ETF's - 10-Day Moving Average
|
|
|
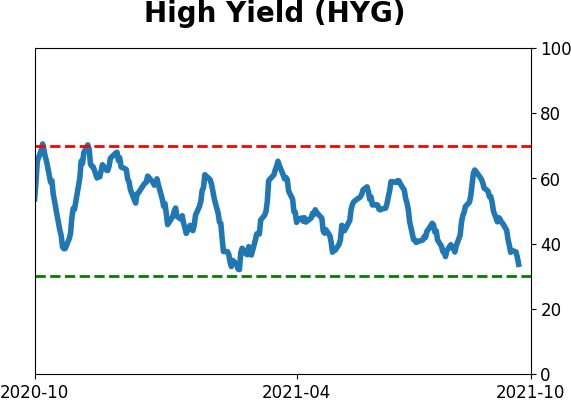
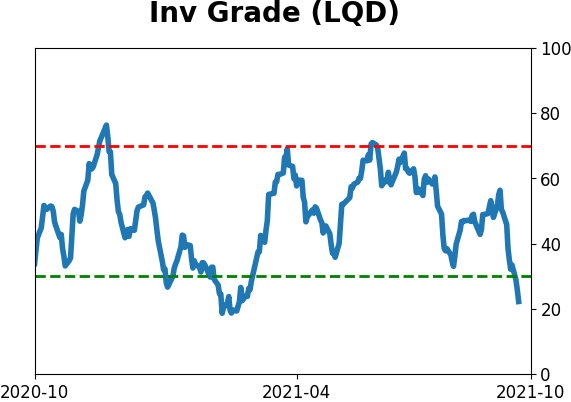
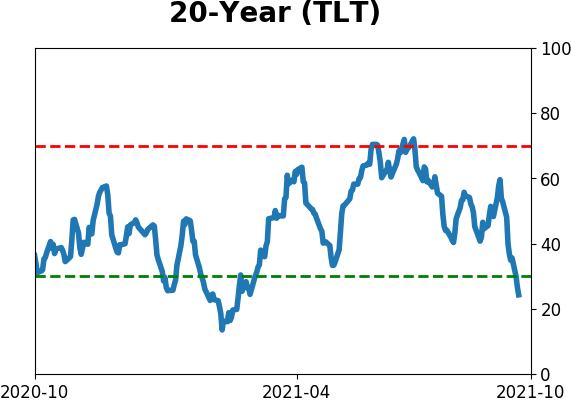
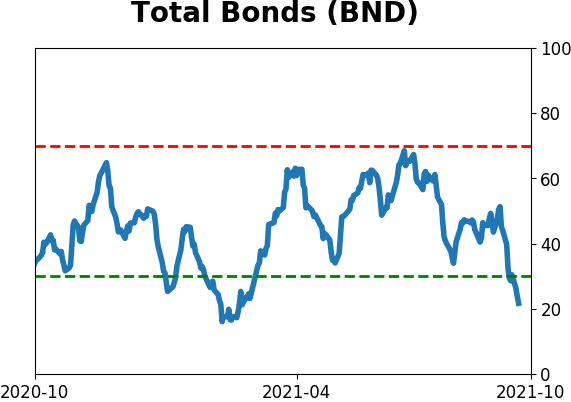
Bond ETF's - 10-Day Moving Average
|
|
|
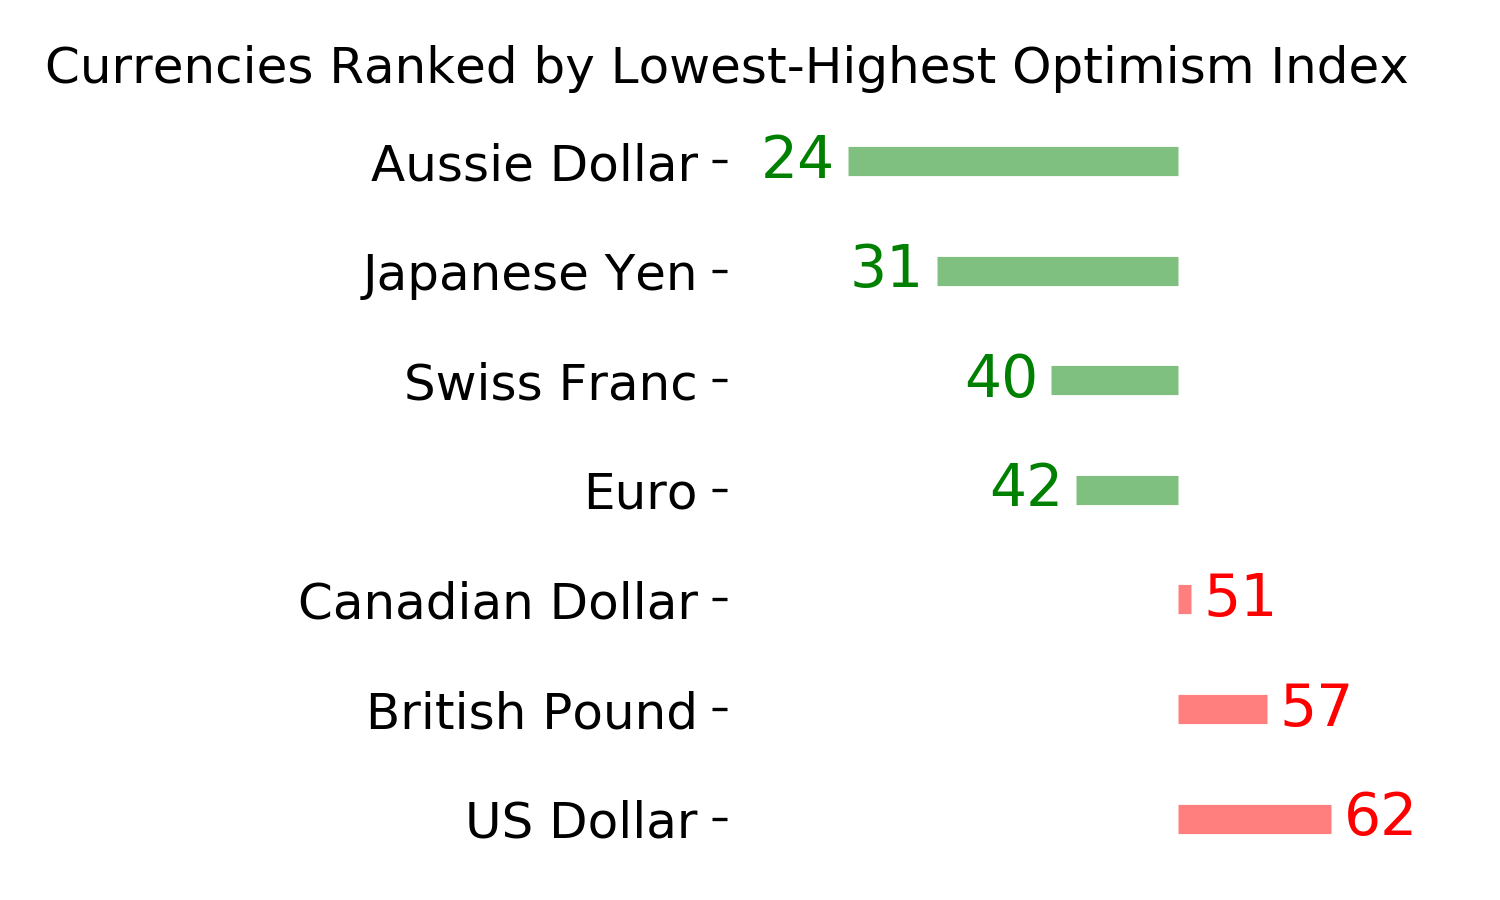
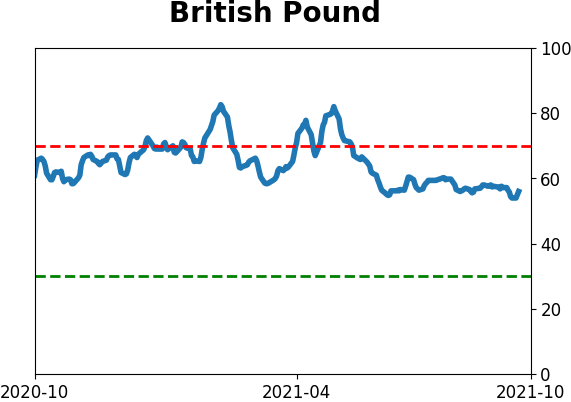
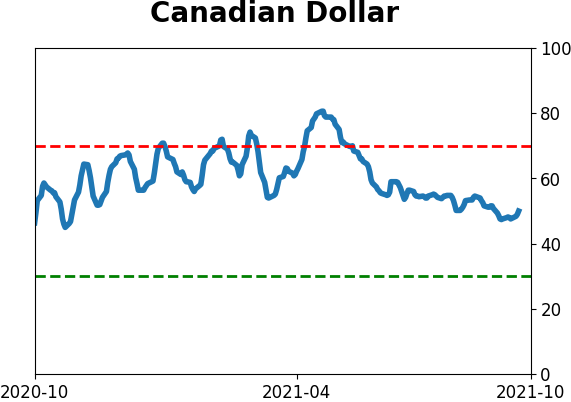
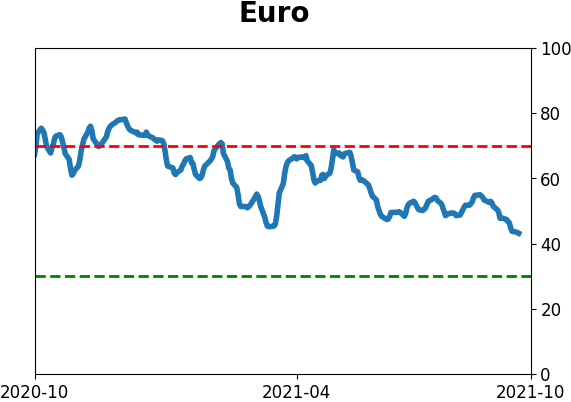
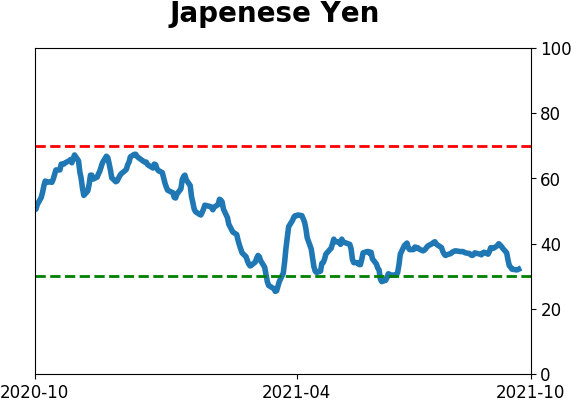
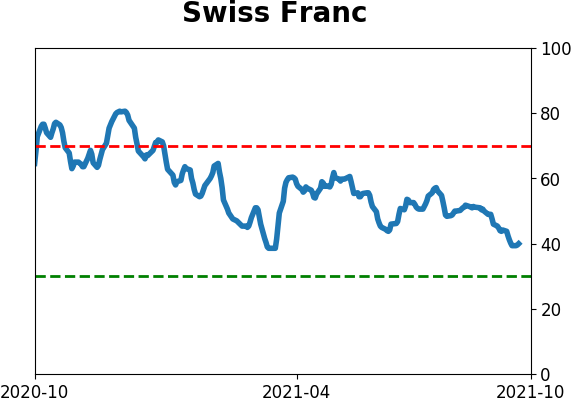
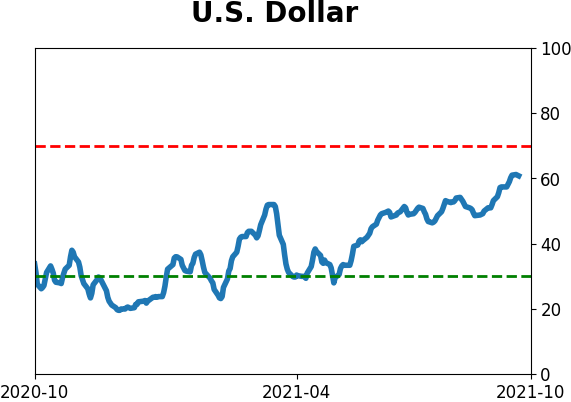
Currency ETF's - 5-Day Moving Average
|
|
|
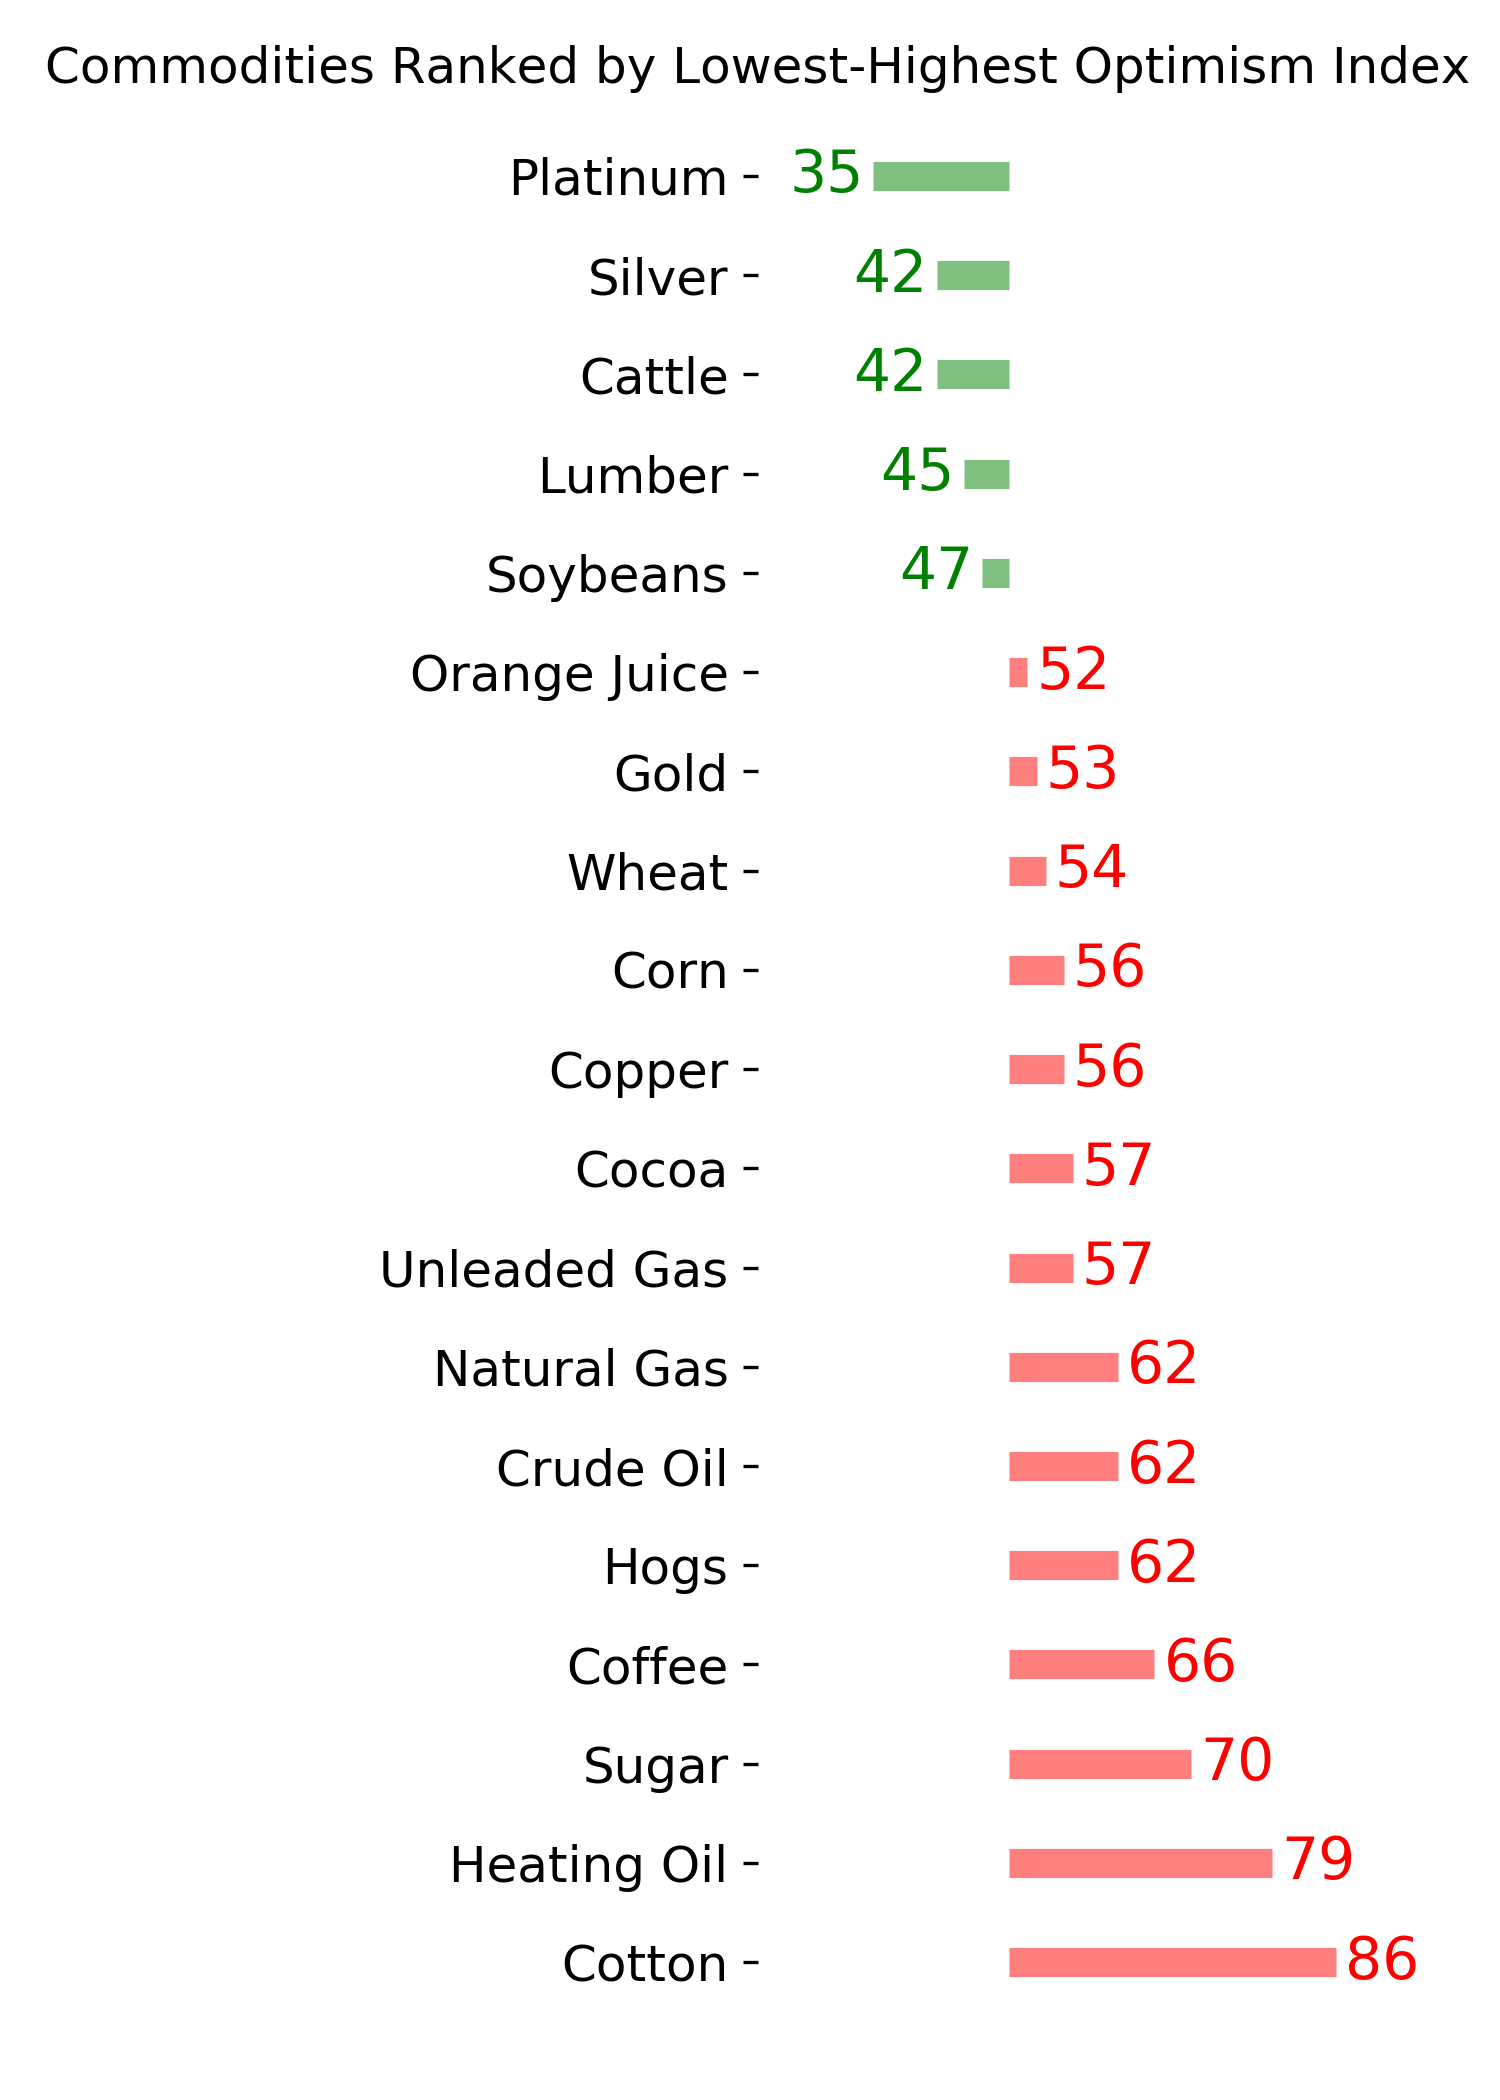
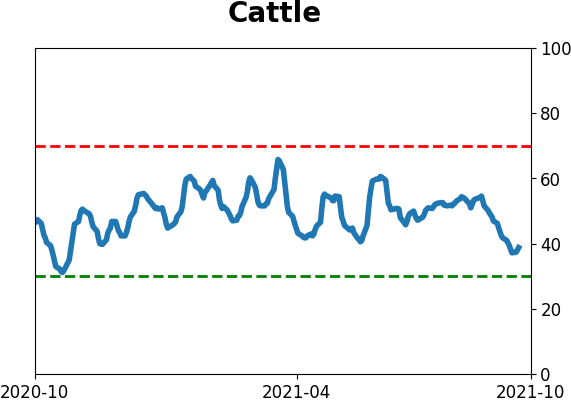
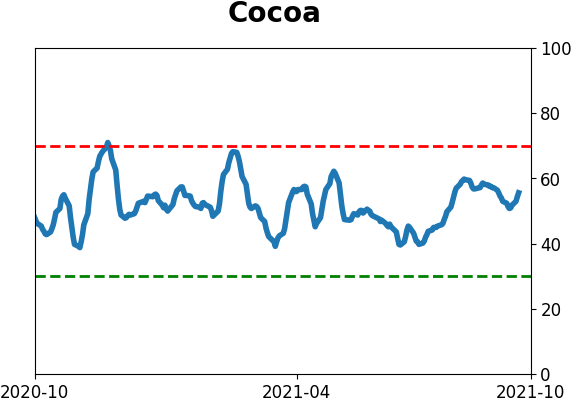
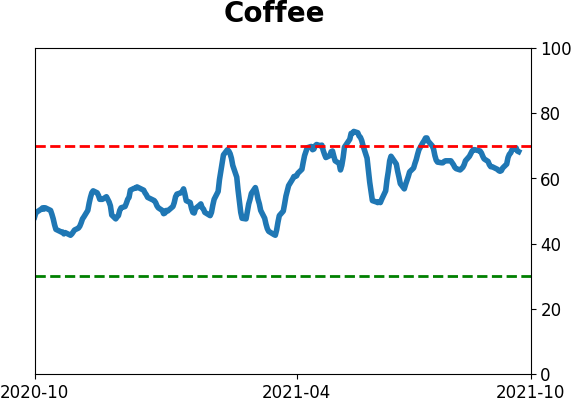
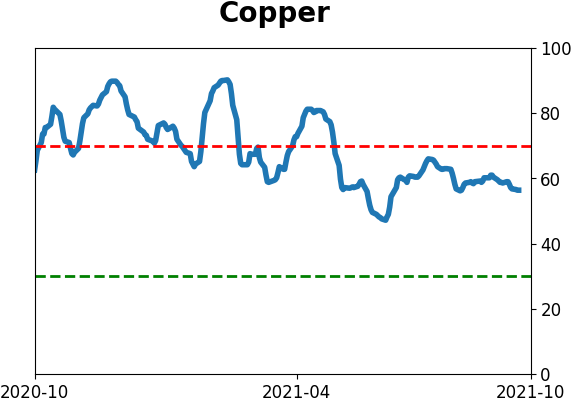
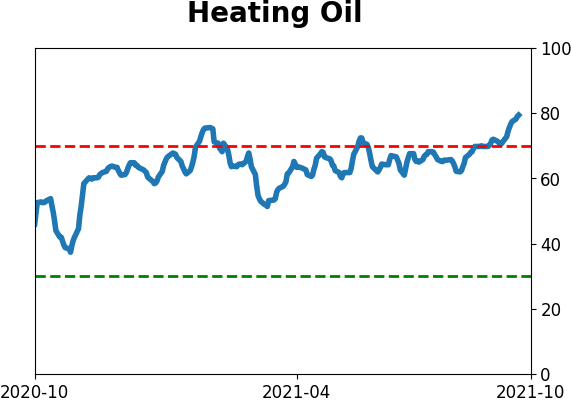
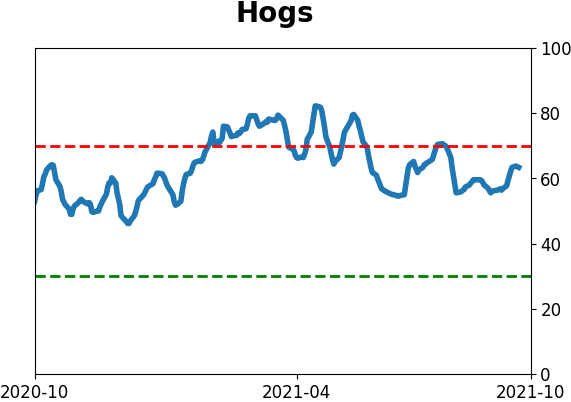
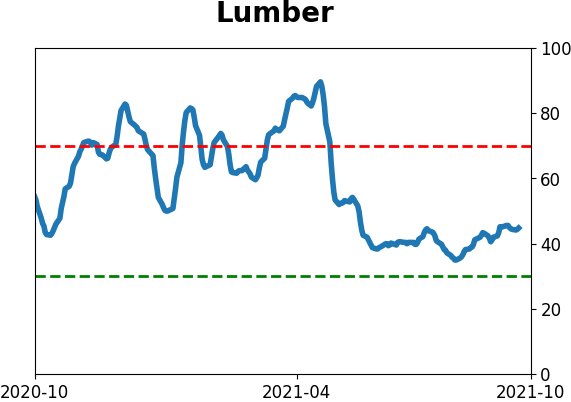
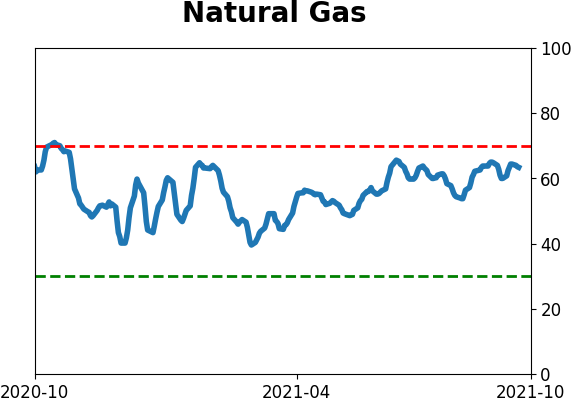
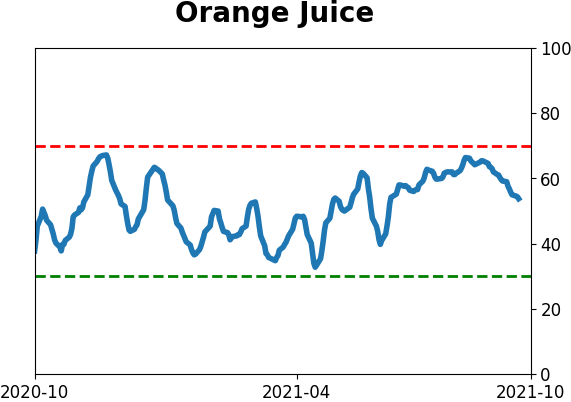
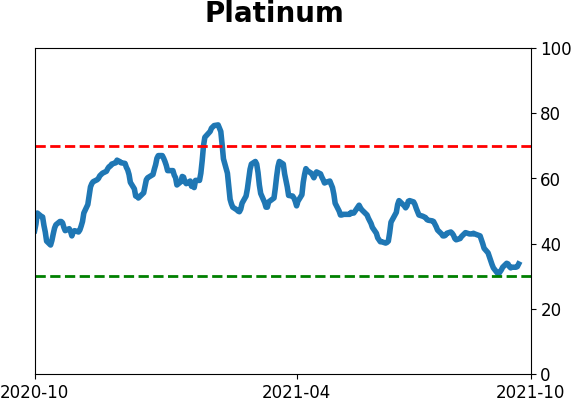
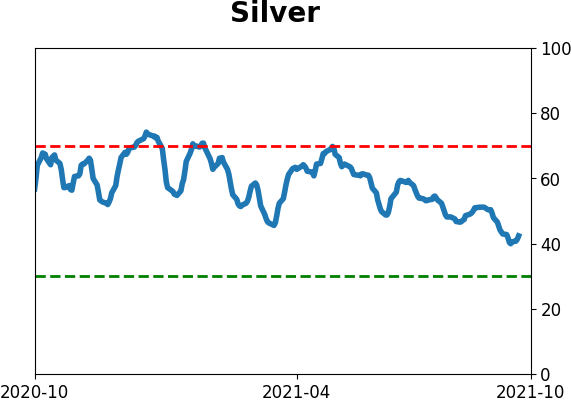
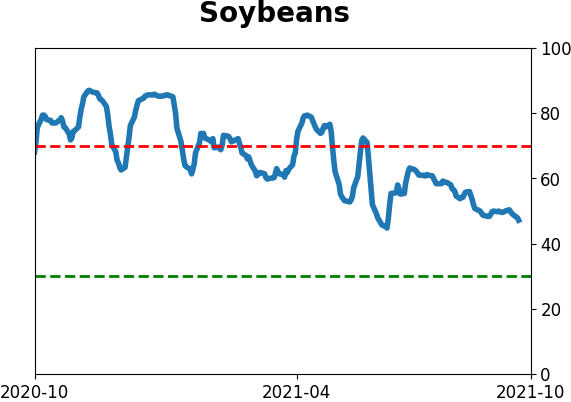
Commodity ETF's - 5-Day Moving Average
|
|