Headlines
|
|
More Than 80% of Stocks Show a Gain:
In 2021, more than 80% of stocks in the S&P 500 showed a positive year-to-date return through the first 3 quarters. This was one of only six years in the past 40 to show such strong, broad-based returns among member stocks. Every other time it happened, stocks continued to gain into year-end.
Bottom Line:
STOCKS: Hold
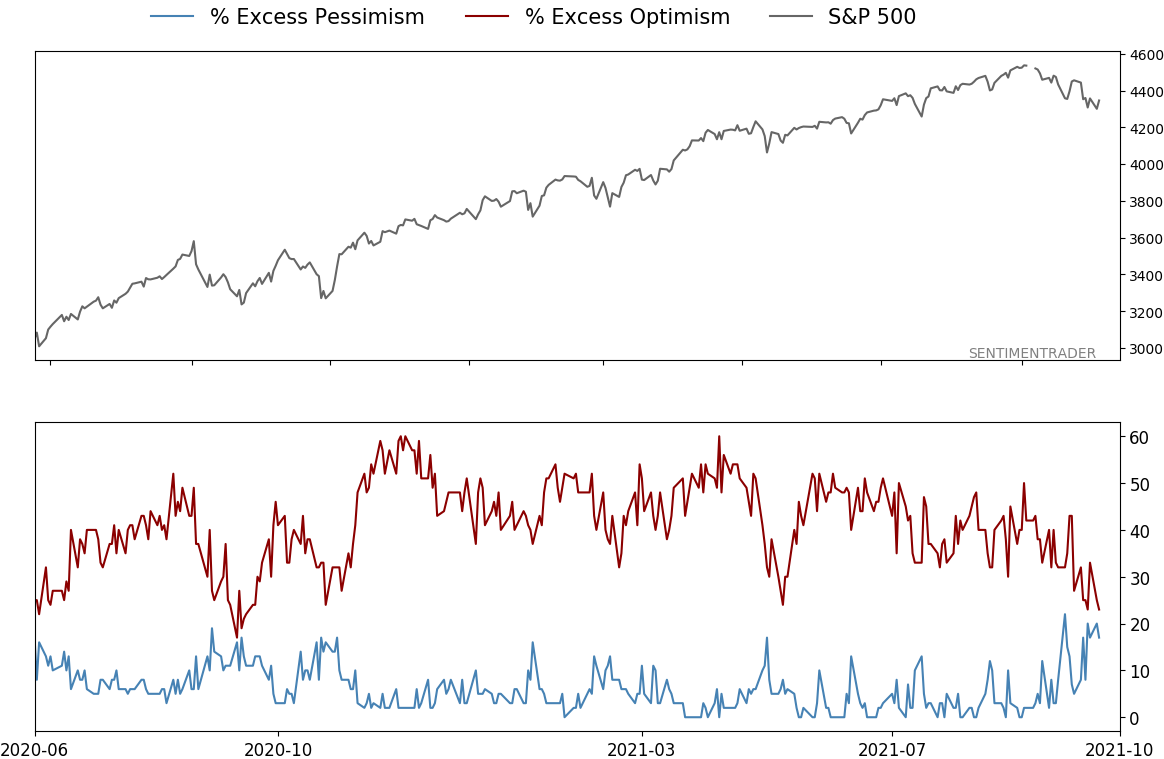
Sentiment continues to decline from the speculative February peak. With deteriorating breadth, this raises the risk of poor short- to medium-term returns until optimism and better breadth returns. See the Outlook & Allocations page for more. BONDS: Hold
Various parts of the market got hit in March, with the lowest Bond Optimism Index we usually see during healthy environments. Bond prices have modest recovered and there is no edge among the data we follow. GOLD: Hold
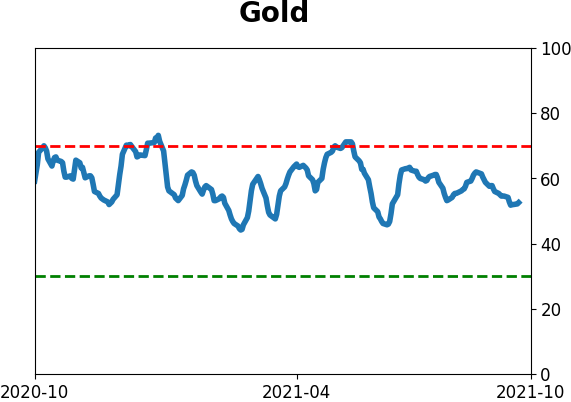
Gold and miners were rejected after trying to recover above their 200-day averages in May. Lately, some medium-term (not long-term) oversold extremes in breadth measures among miners have triggered.
|
Smart / Dumb Money Confidence
|
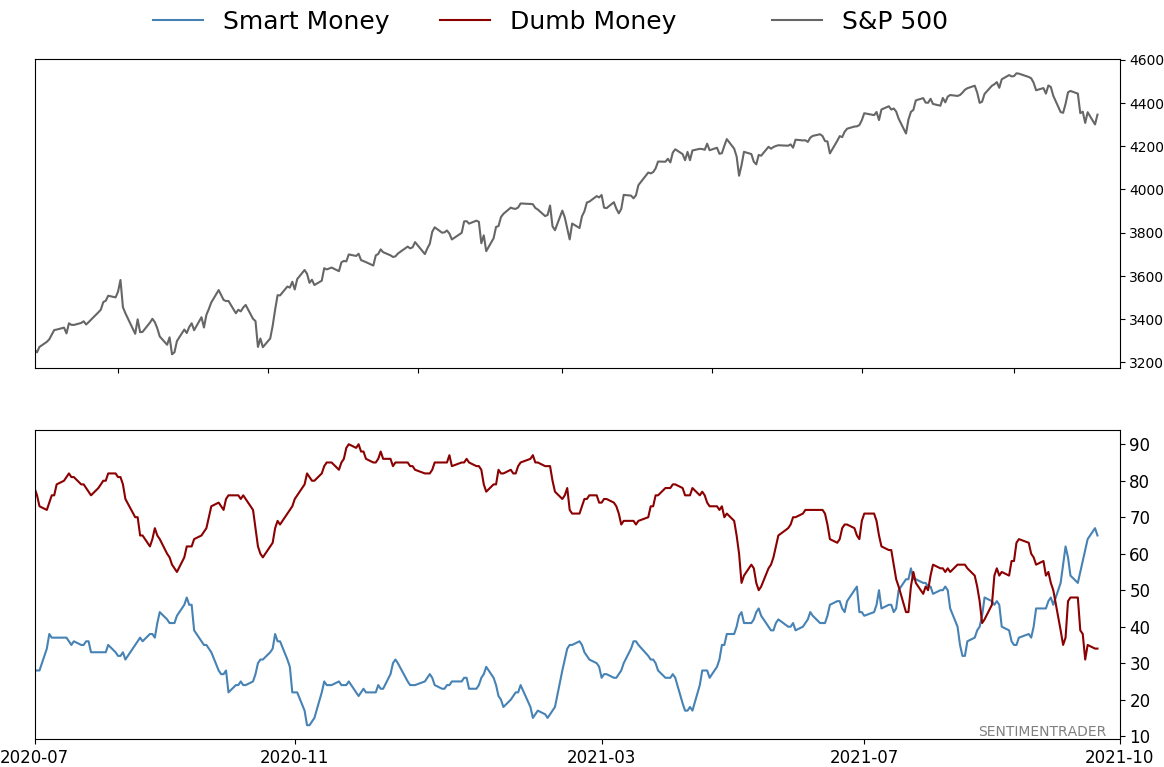
Smart Money Confidence: 65%
Dumb Money Confidence: 34%
|
|
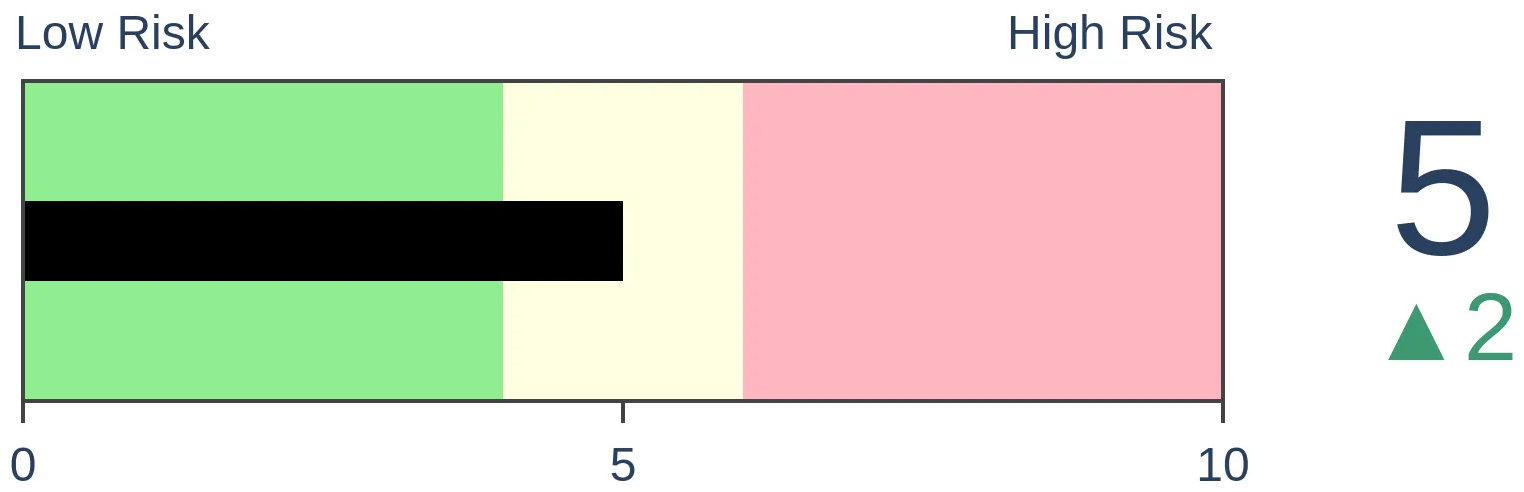
Risk Levels
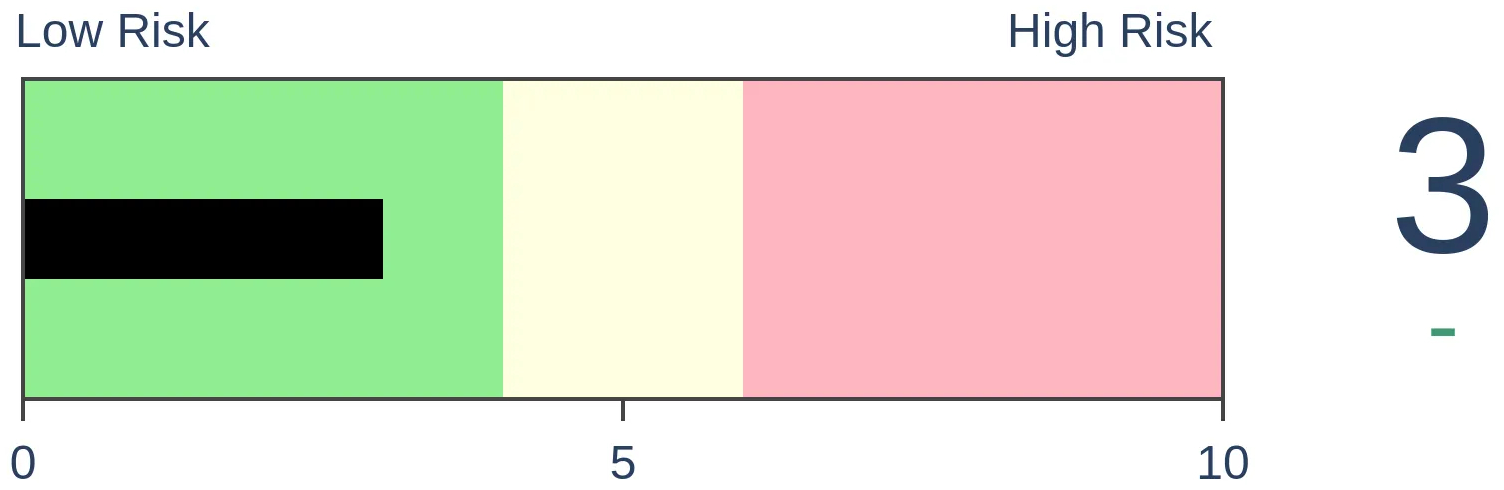
Stocks Short-Term
|
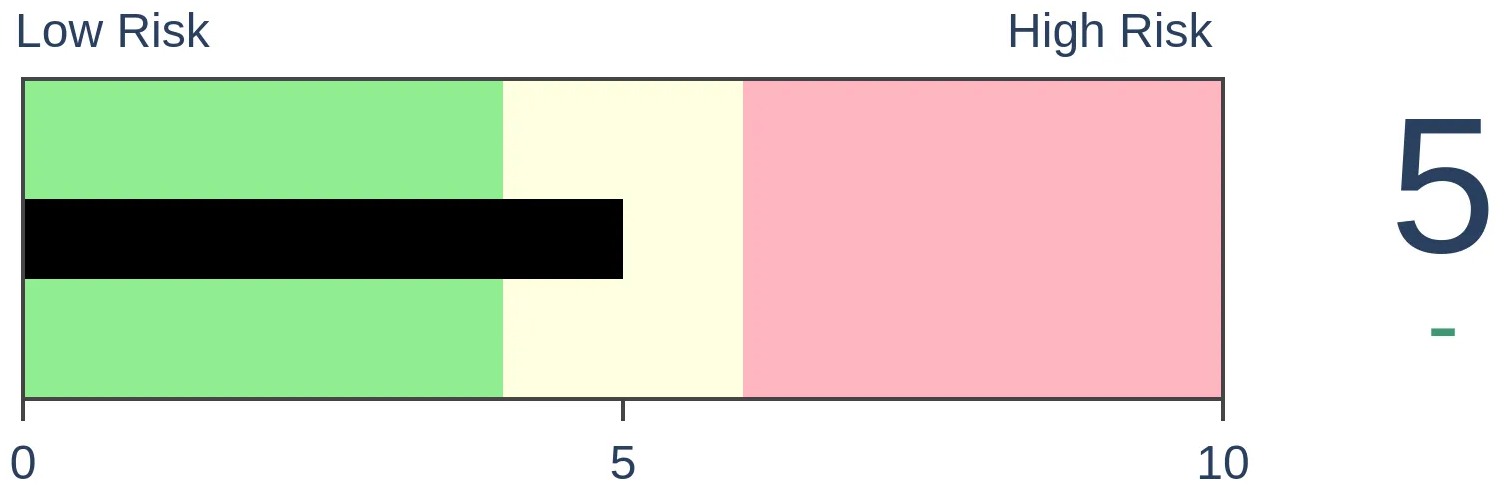
Stocks Medium-Term
|
|
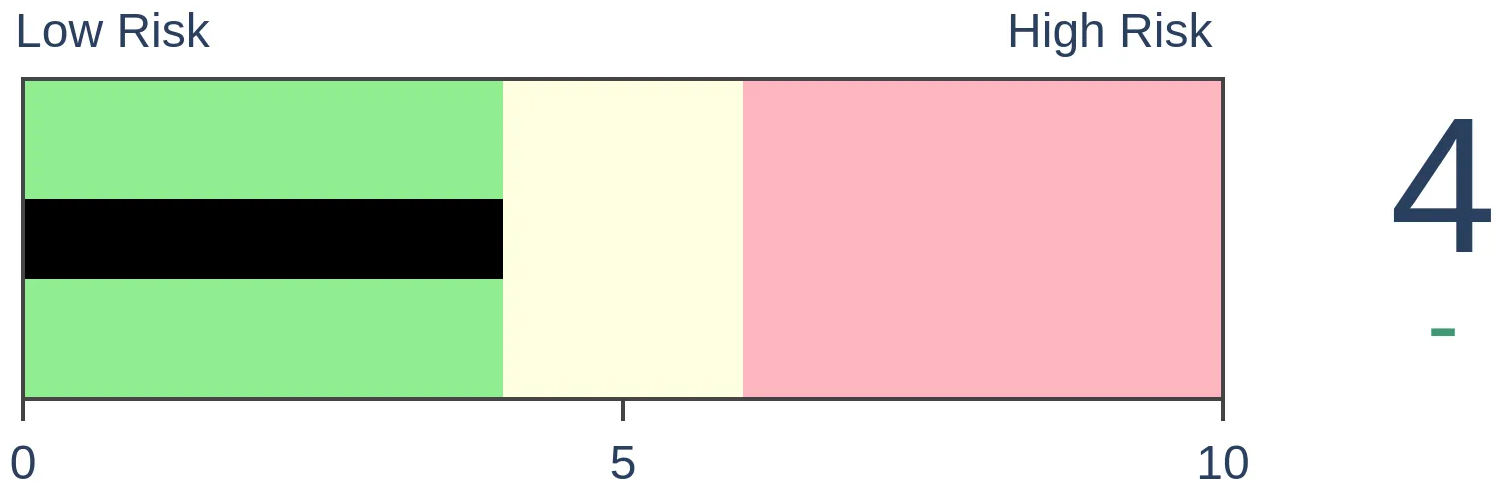
Bonds

|
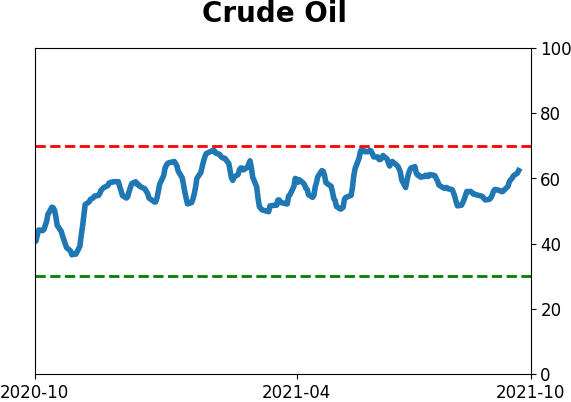
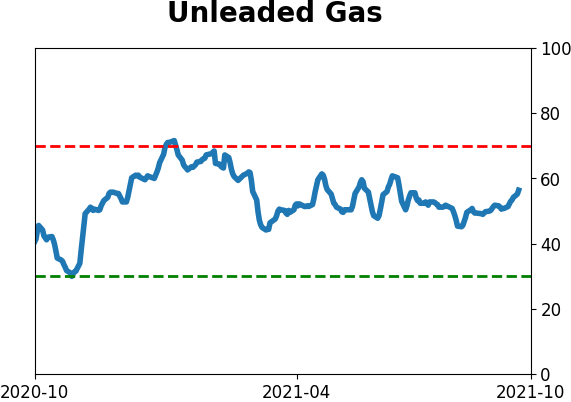
Crude Oil
|
|
Gold

|
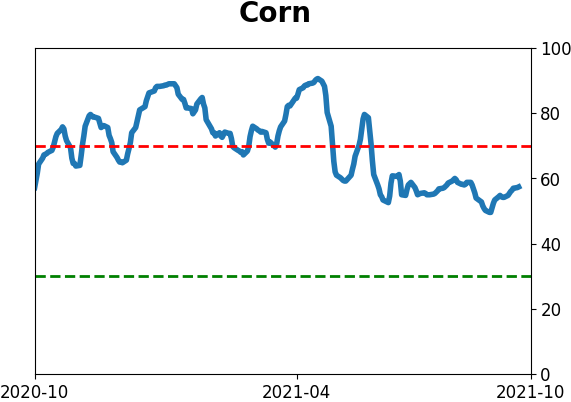
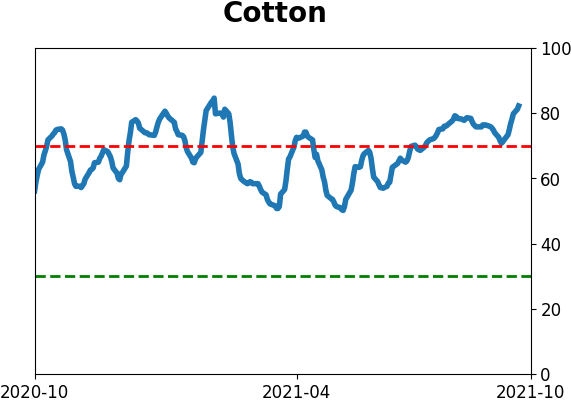
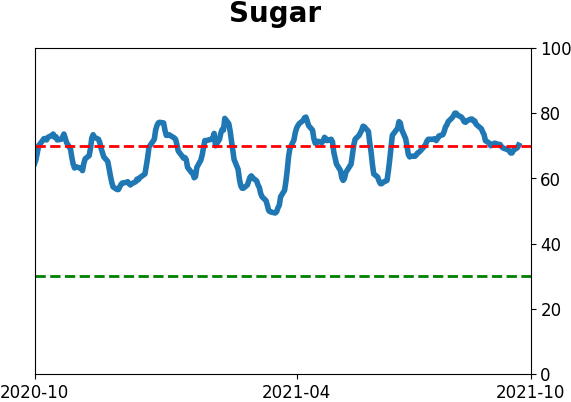
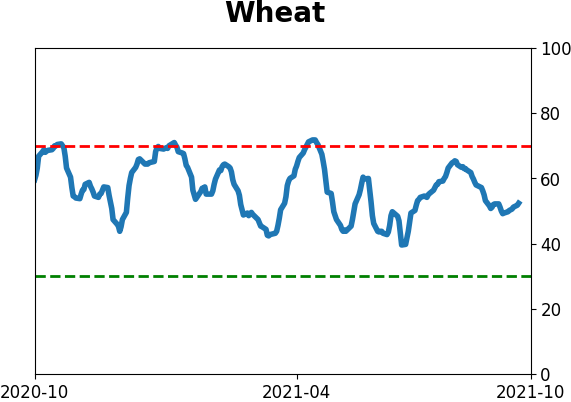
Agriculture
|
|
Research
By Jason Goepfert
BOTTOM LINE
In 2021, more than 80% of stocks in the S&P 500 showed a positive year-to-date return through the first 3 quarters. This was one of only six years in the past 40 to show such strong, broad-based returns among member stocks. Every other time it happened, stocks continued to gain into year-end.
FORECAST / TIMEFRAME
None
|
There has been no shortage of remarkable stats about stocks in 2021. By late January, the uptrend was throwing traditional indicators out the window, and through June, stocks were showing some of the best trends in history. The ends of other long stretches of positive momentum have had a strong tendency to lead to only small, brief losses.
Most investors fixate on indexes like the S&P 500, and for a good reason. It's the most-benchmarked index in the world. Under the surface, it's been a tough row to hoe for stock-pickers, this year more than most.
Even so, Bloomberg notes that most stocks in the S&P 500 show a positive return year-to-date.
"So far this year, 412 members of the S&P 500 are in the green, the third most for any year since at least 2001, according to data compiled by Bloomberg. Only five times since 2001 have more than 400 stocks been positive through September -- and every time the market added to those gains to cap off the year."
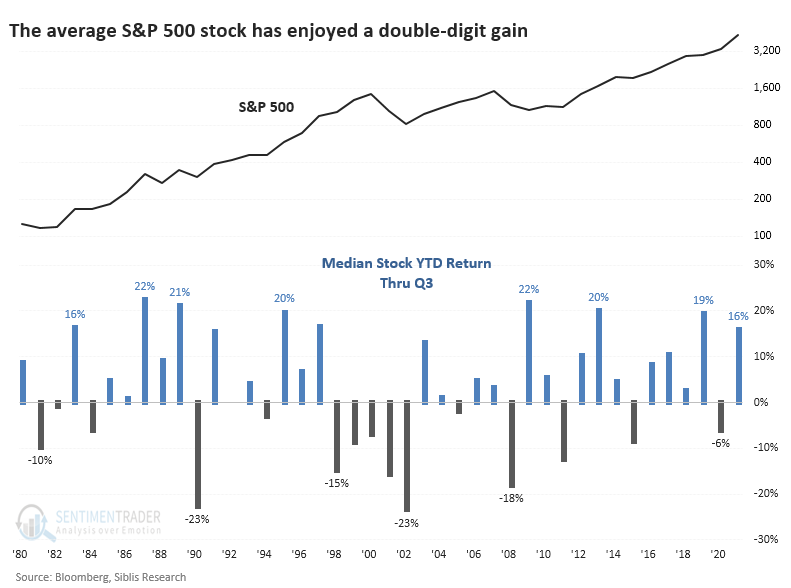
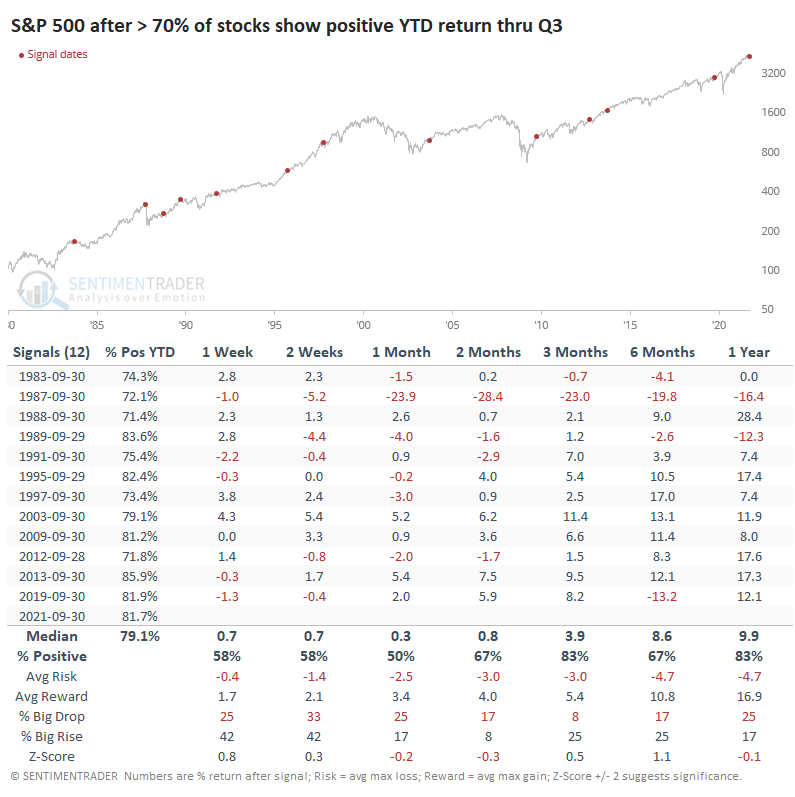
Indeed, this year marked one of the few in four decades when at least 80% of stocks sported a positive YTD return through the third quarter. Over that span, only six years accomplished this, four of which have been since the global financial crisis in 2008.
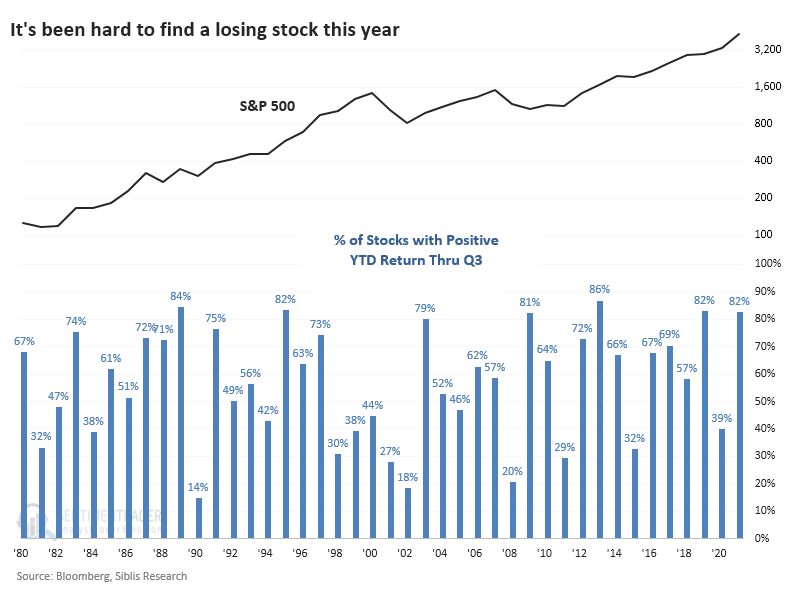
It's also been a year with some of the best gains. The median stock in the index returned 16% through Q3. That ties for 7th place among all years since 1980.
The five other times when more than 80% of stocks showed a positive return through the end of September, the S&P 500 index itself continued to rise through year-end each time, averaging an impressive return of +6.6%. Two of those ended up giving back the gains and then some in the months after that, though.
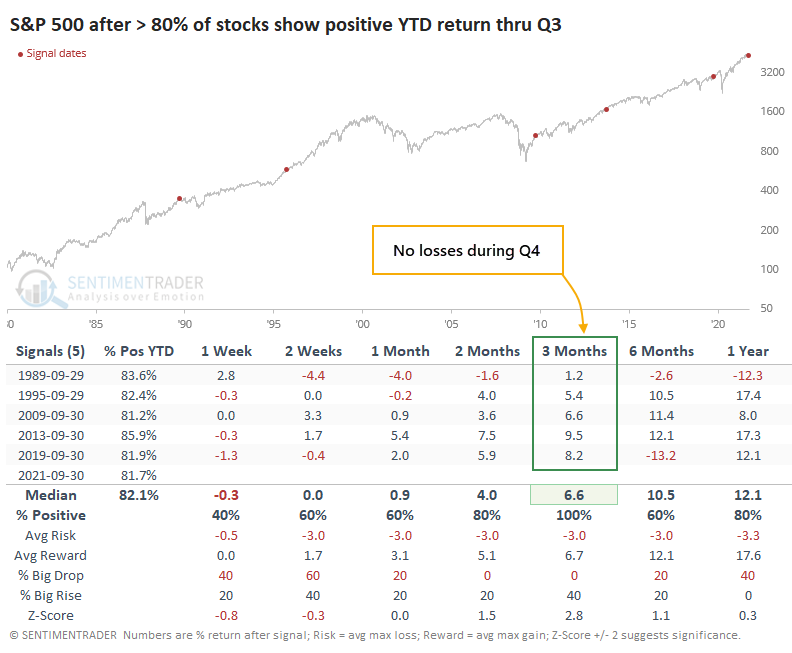
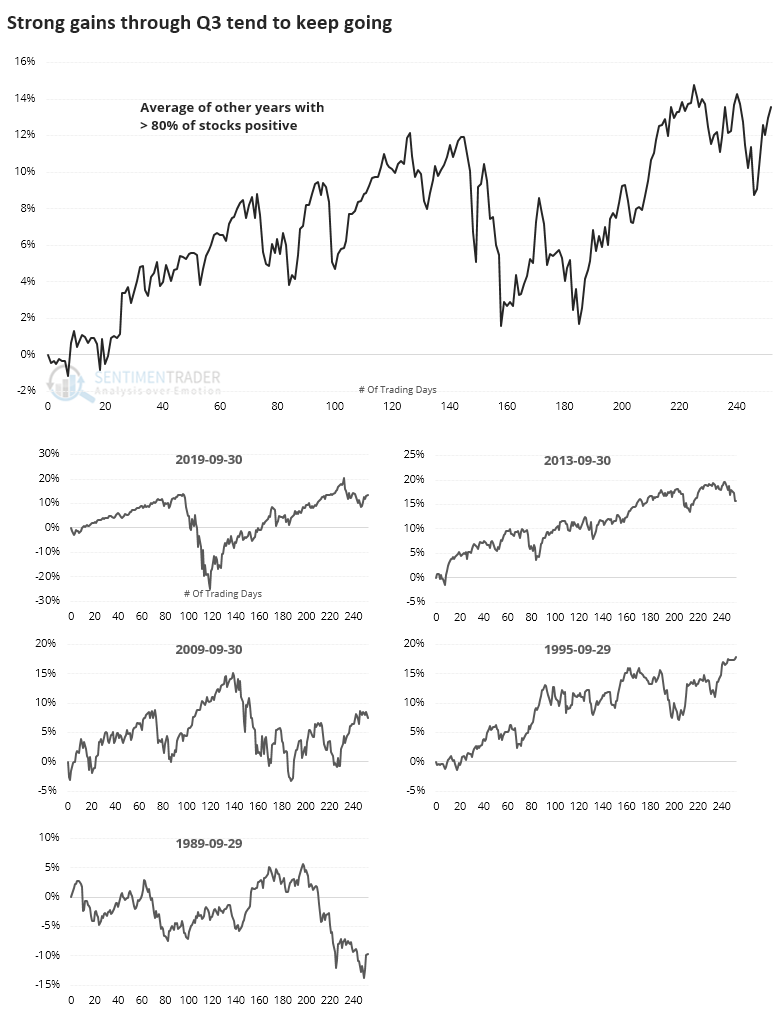
Looking at the (admittedly tiny) sample size visually, we can see the consistent tendency to see rising prices over the next three months at least before the index suffered chopper trading activity. The only standout was 1989, which barely showed a positive return over the next few months.
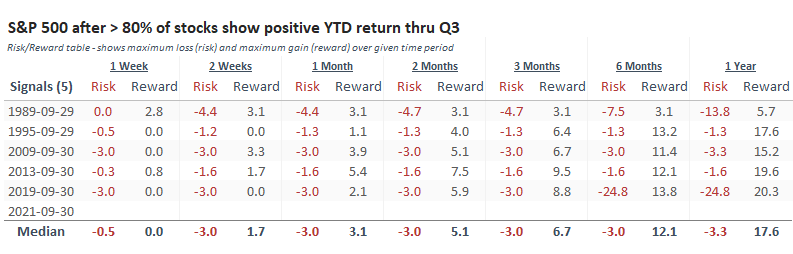
The Risk/Reward Table shows that risk was relatively small and front-loaded during October. Virtually all of the maximum drawdown over the next three months was suffered during the first couple weeks of October.
It's tough to have a lot of confidence with a sample size of five. If we relax the parameters to those years when 70% or more of stocks enjoyed a positive YTD return through Q3 (instead of 80% or more), the conclusion was essentially the same. Those years perhaps suffered some October volatility but showed a strong tendency for a positive return over the next three months. The only big exception - and it was BIG - was 1987.
Like we've seen with virtually every momentum study in 2021, and there have been a lot of them, buyers do not tend to stop after having the capacity to push prices persistently higher for months on end. Any short-term volatility is viewed as the first real good buying opportunity in months, if not longer, and they tend to participate with enthusiasm. The calendar is also proving to be a tailwind, suggesting that a rough start to October should quickly bring in buying interest.
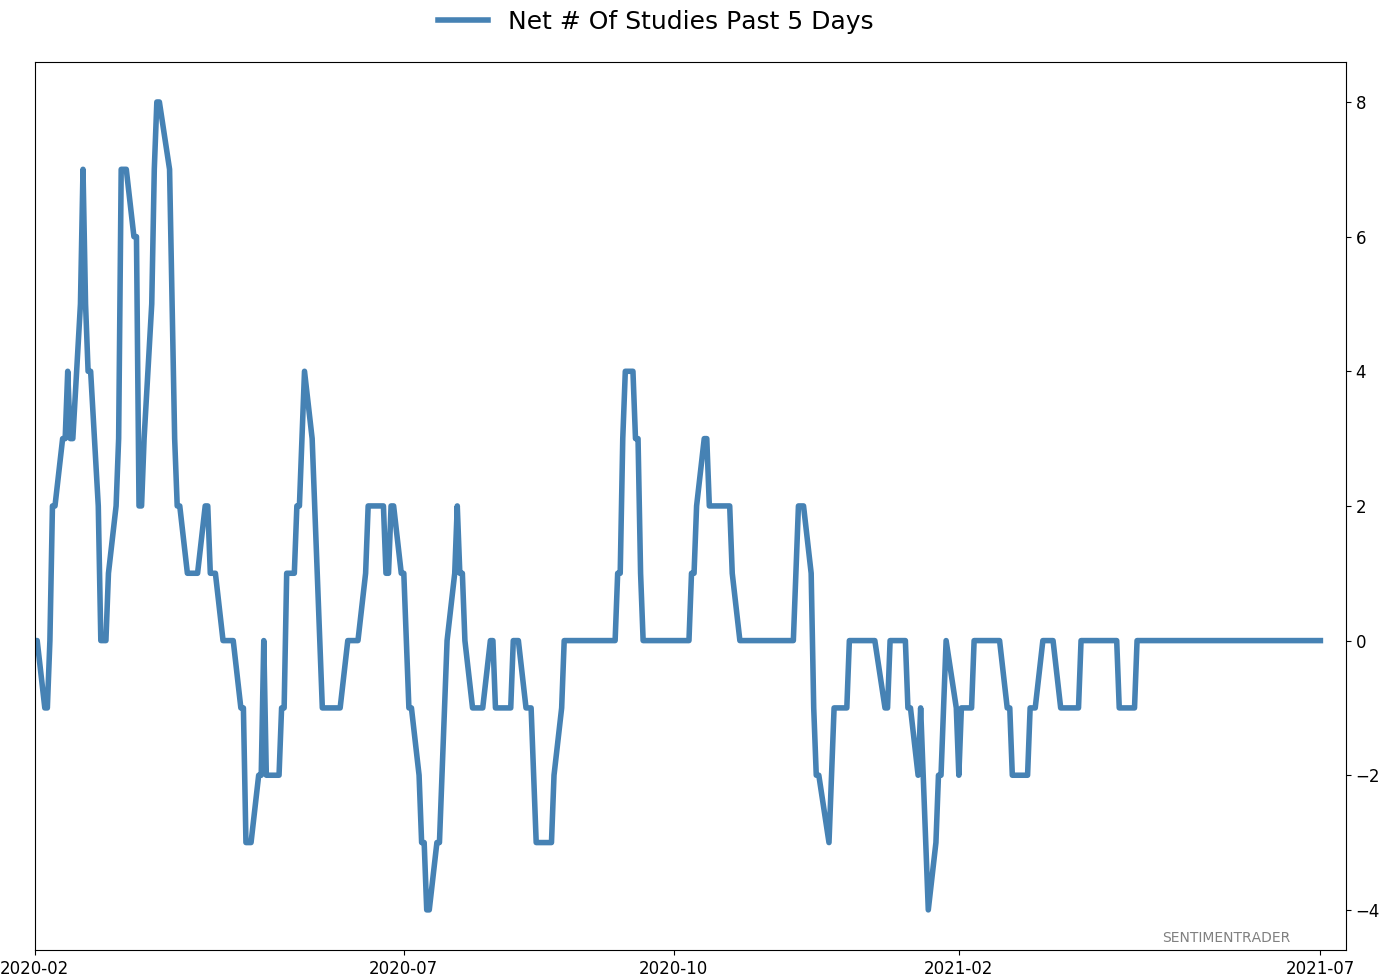
Active Studies
| Time Frame | Bullish | Bearish | | Short-Term | 0 | 6 | | Medium-Term | 9 | 3 | | Long-Term | 11 | 5 |
|
Indicators at Extremes
Portfolio
| Position | Description | Weight % | Added / Reduced | Date | | Stocks | RSP | 10.5 | Added 6.4% | 2021-10-01 | | Bonds | 23.9% BND, 6.9% SCHP | 31.5 | Reduced 7.1% | 2021-05-19 | | Commodities | GCC | 2.6 | Reduced 2.1%
| 2020-09-04 | | Precious Metals | GDX | 4.2 | Reduced 4.2% | 2021-05-19 | | Special Situations | 9.8% KWEB, 4.7% XLE, 2.9% PSCE | 17.3 | Added 9.78% | 2021-10-01 | | Cash | | 34.0 | | |
|
Updates (Changes made today are underlined)
Much of our momentum and trend work has remained positive for several months, with some scattered exceptions. Almost all sentiment-related work has shown a poor risk/reward ratio for stocks, especially as speculation drove to record highs in exuberance in February. Much of that has worn off, and most of our models are back toward neutral levels. There isn't much to be excited about here. The same goes for bonds and even gold. Gold has been performing well lately and is back above long-term trend lines. The issue is that it has a poor record of holding onto gains when attempting a long-term trend change like this, so we'll take a wait-and-see approach. Momentum has ebbed quickly in recent weeks, and nearing oversold levels in some indicators. This can be a dangerous area, with a lot of short-term volatility, but we'd be more inclined to add medium- to long-term exposure rather than sell on much more of a decline, thanks to already rock-bottom exposure. Other areas look more attractive, including some overseas markets. RETURN YTD: 9.0% 2020: 8.1%, 2019: 12.6%, 2018: 0.6%, 2017: 3.8%, 2016: 17.1%, 2015: 9.2%, 2014: 14.5%, 2013: 2.2%, 2012: 10.8%, 2011: 16.5%, 2010: 15.3%, 2009: 23.9%, 2008: 16.2%, 2007: 7.8%
|
|
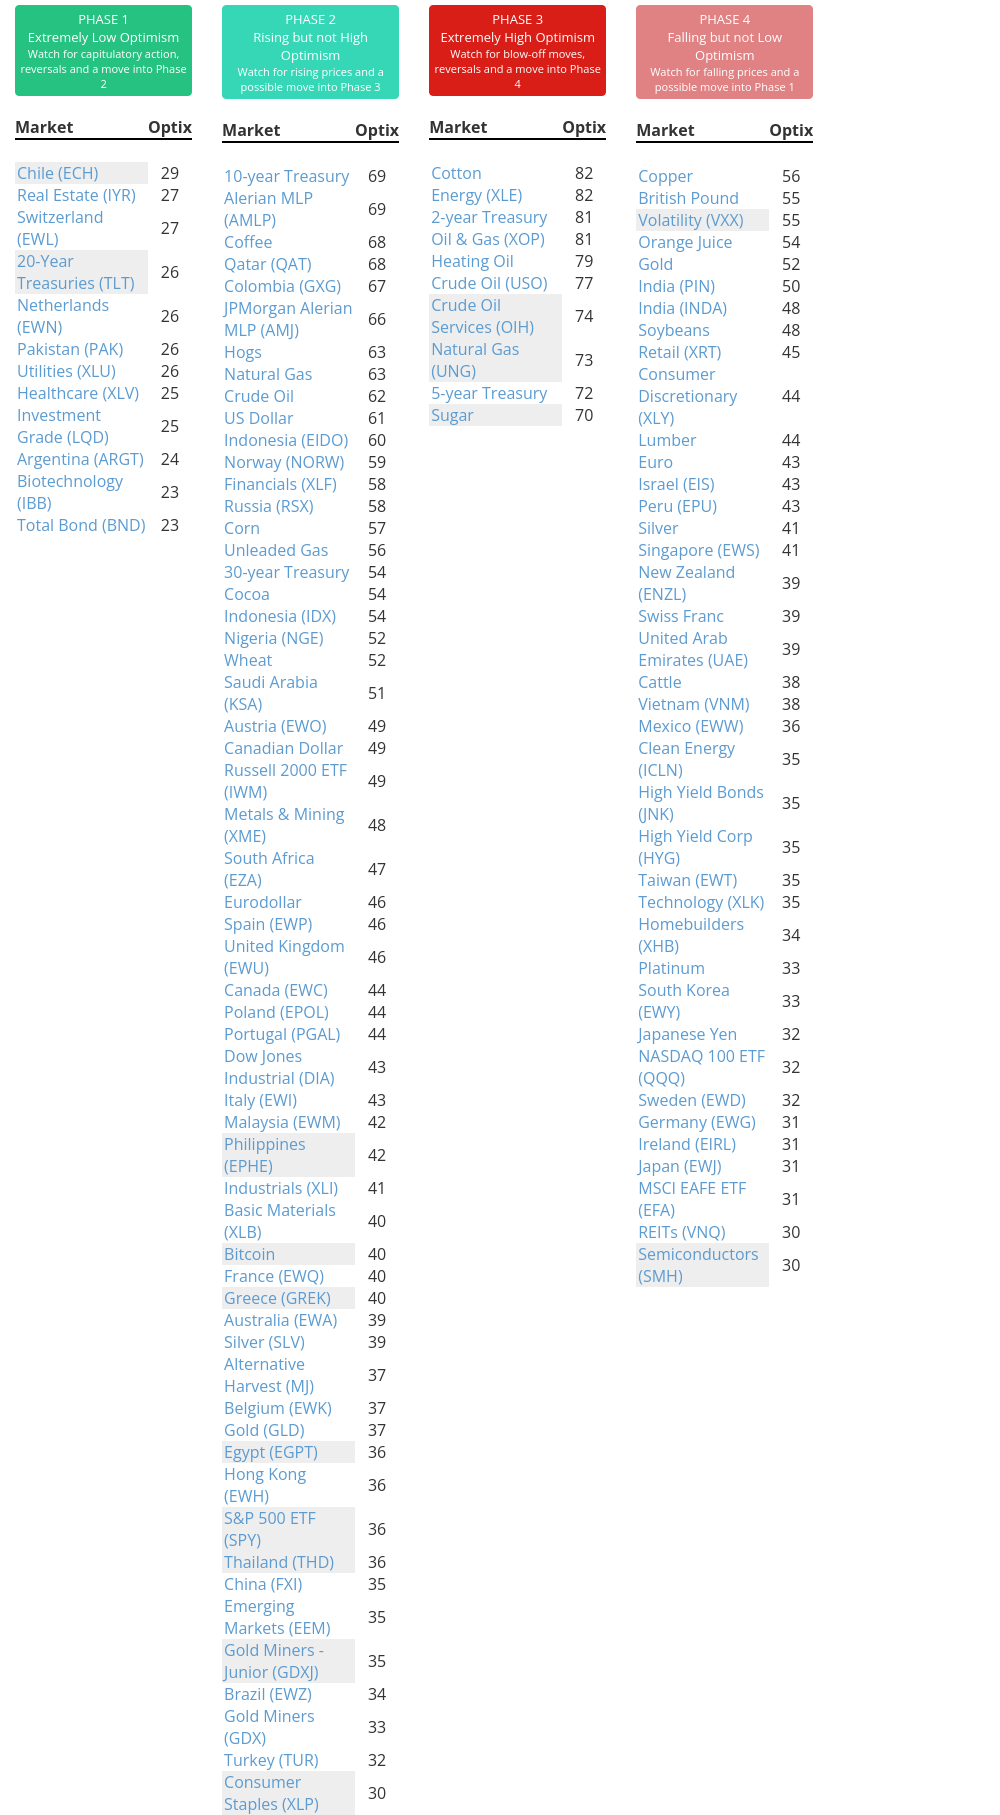
Phase Table
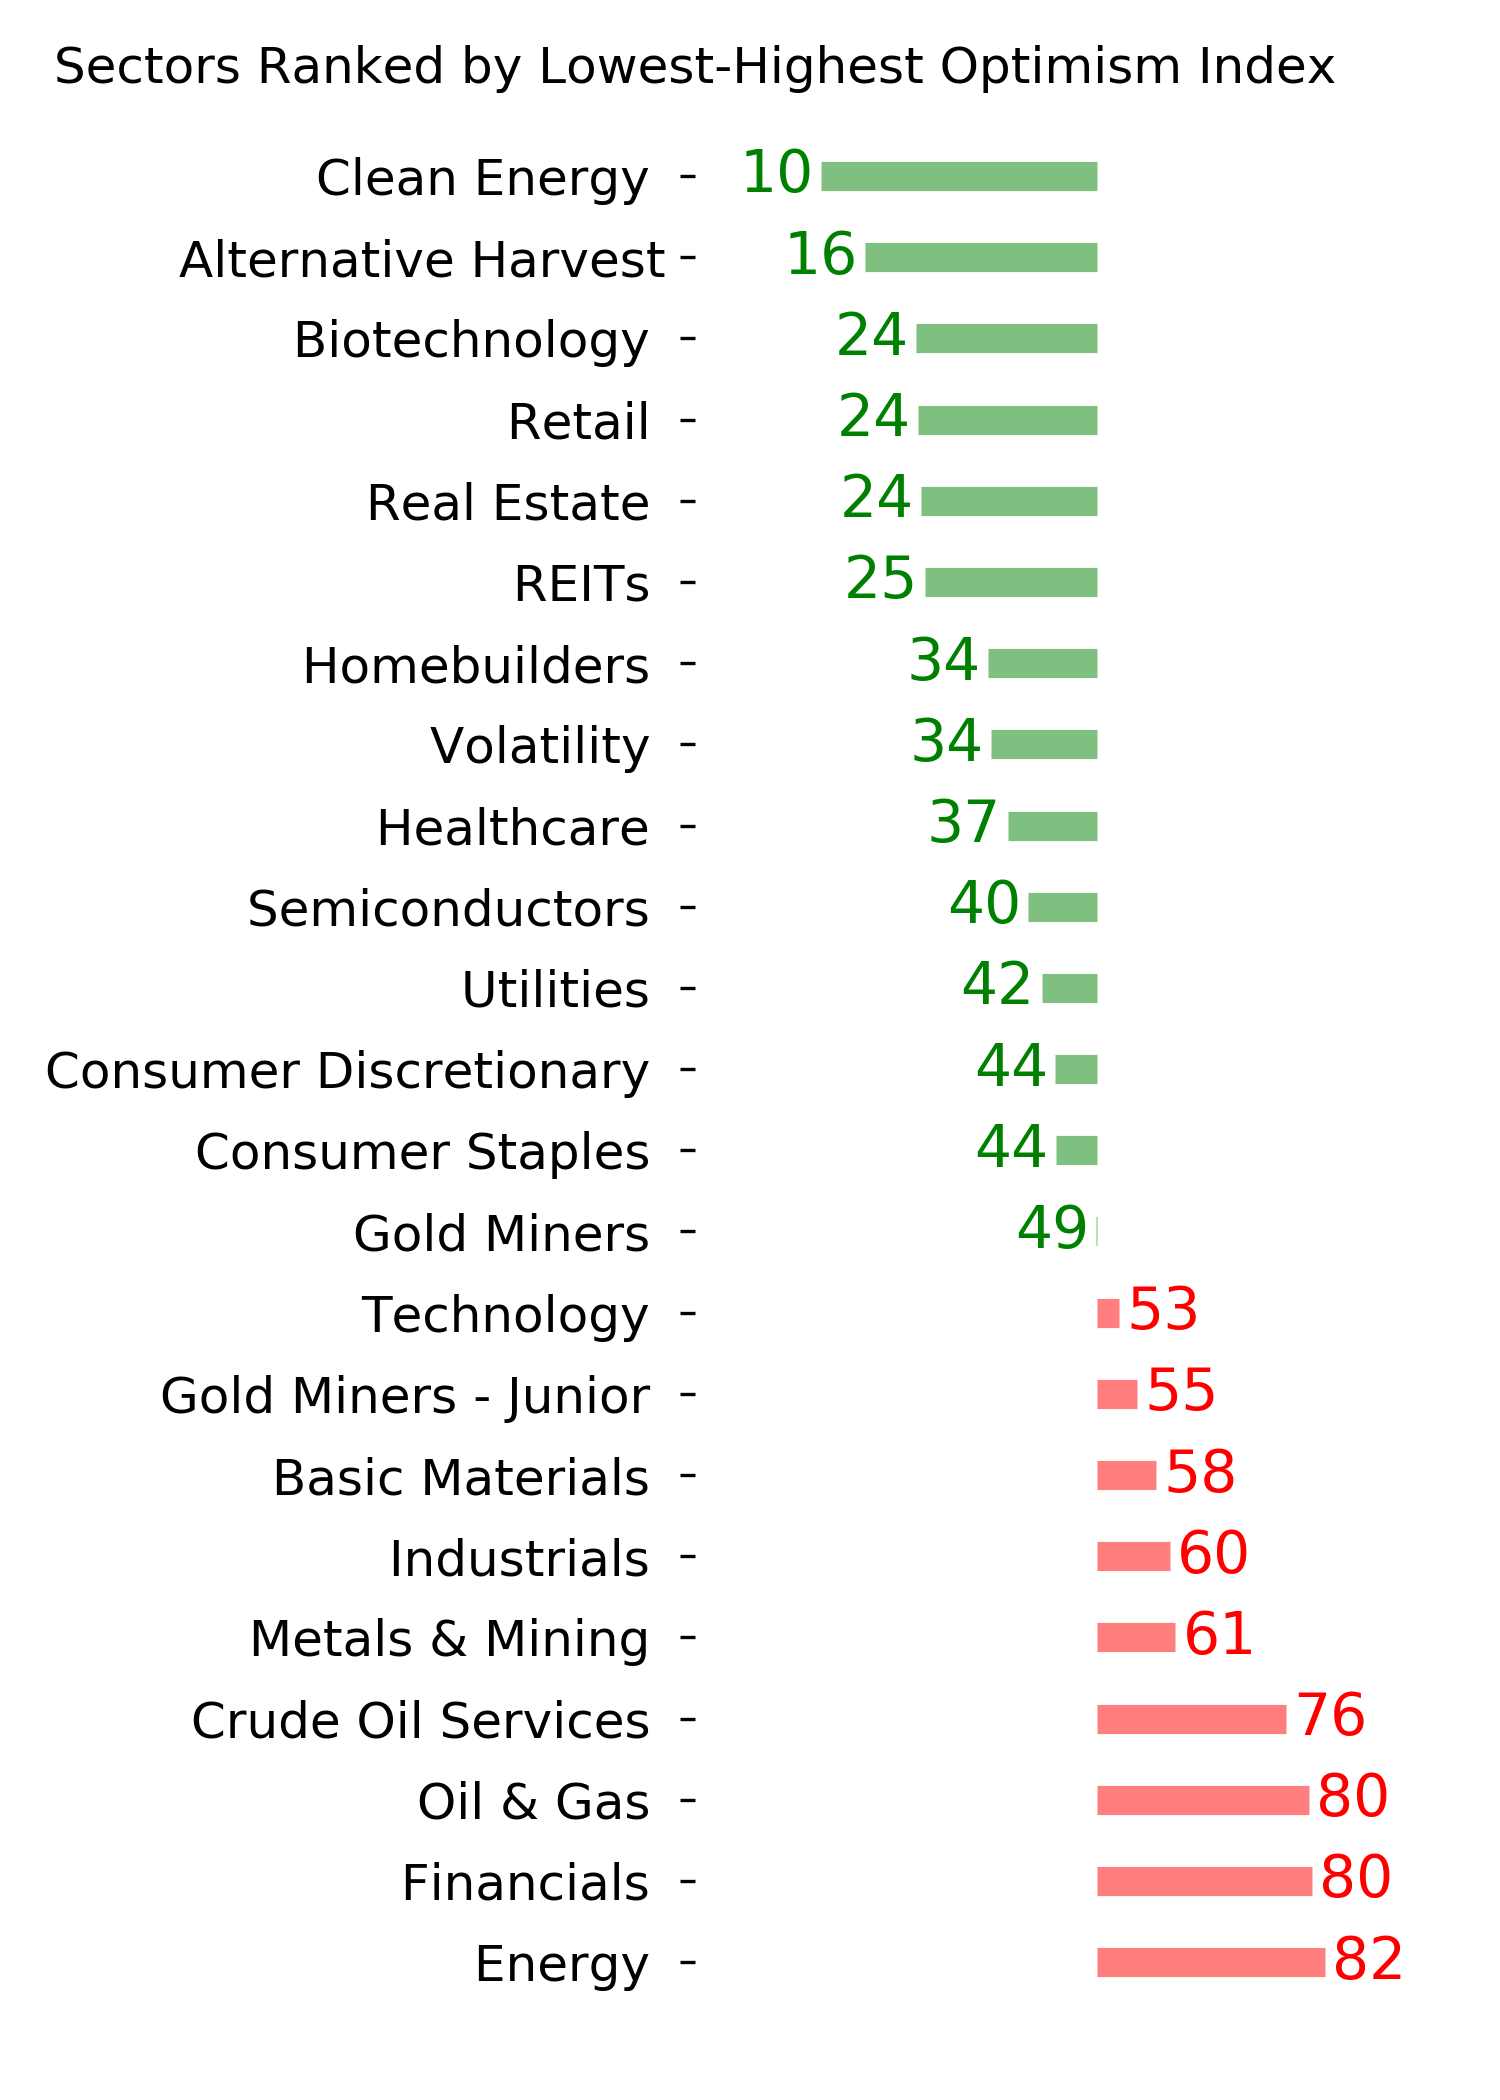
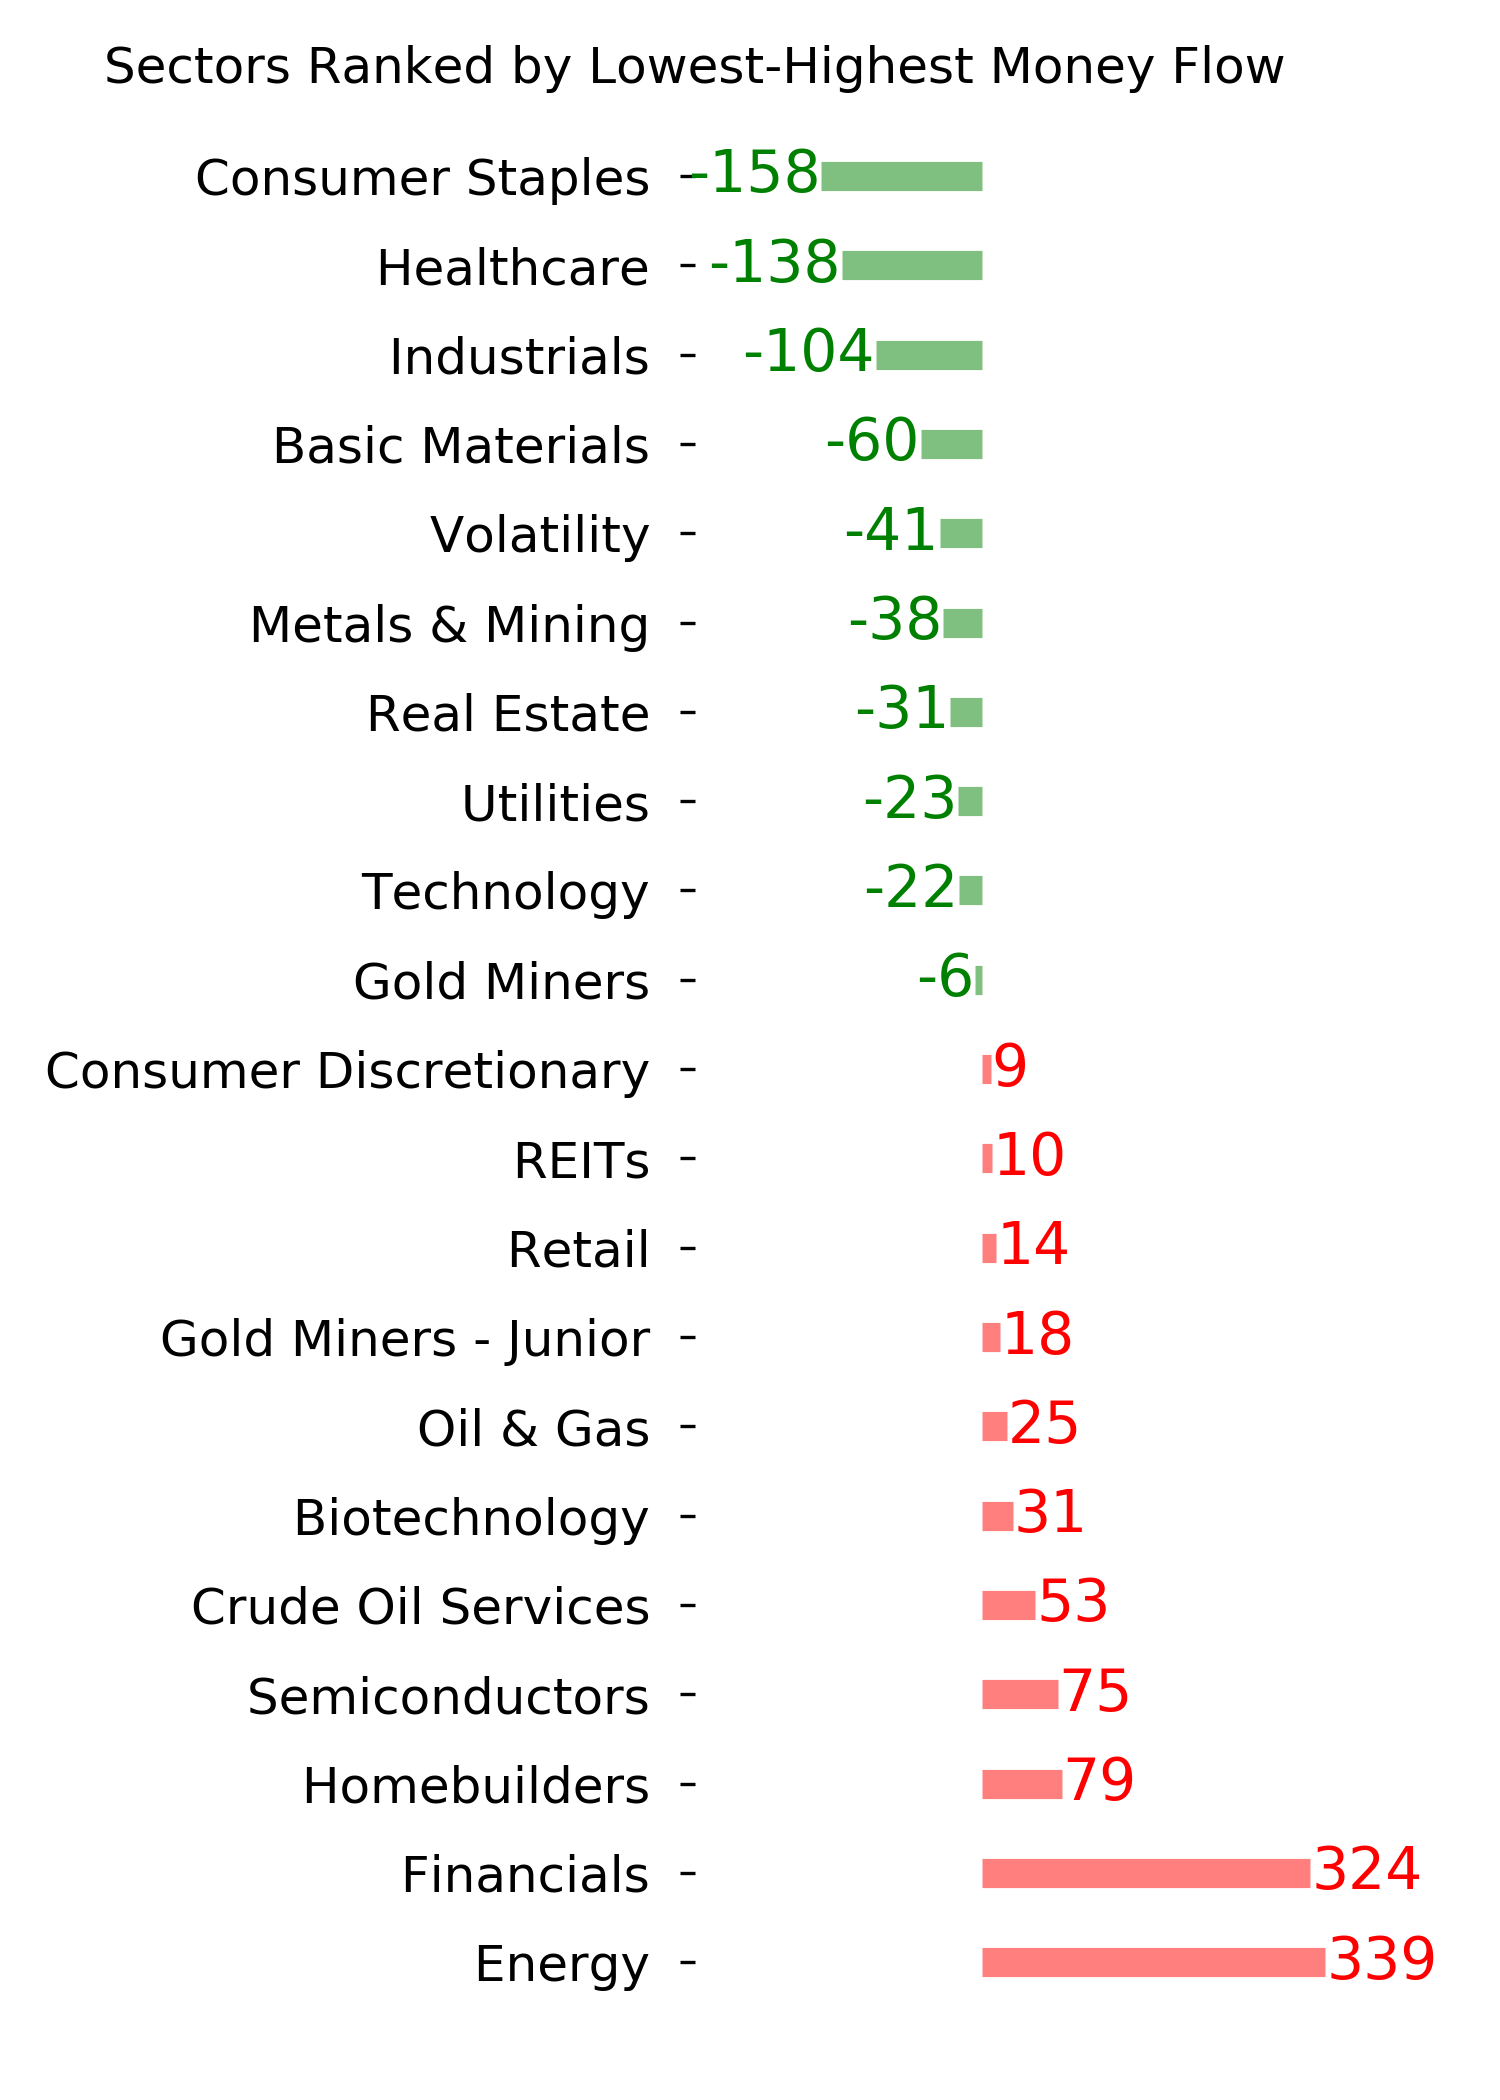
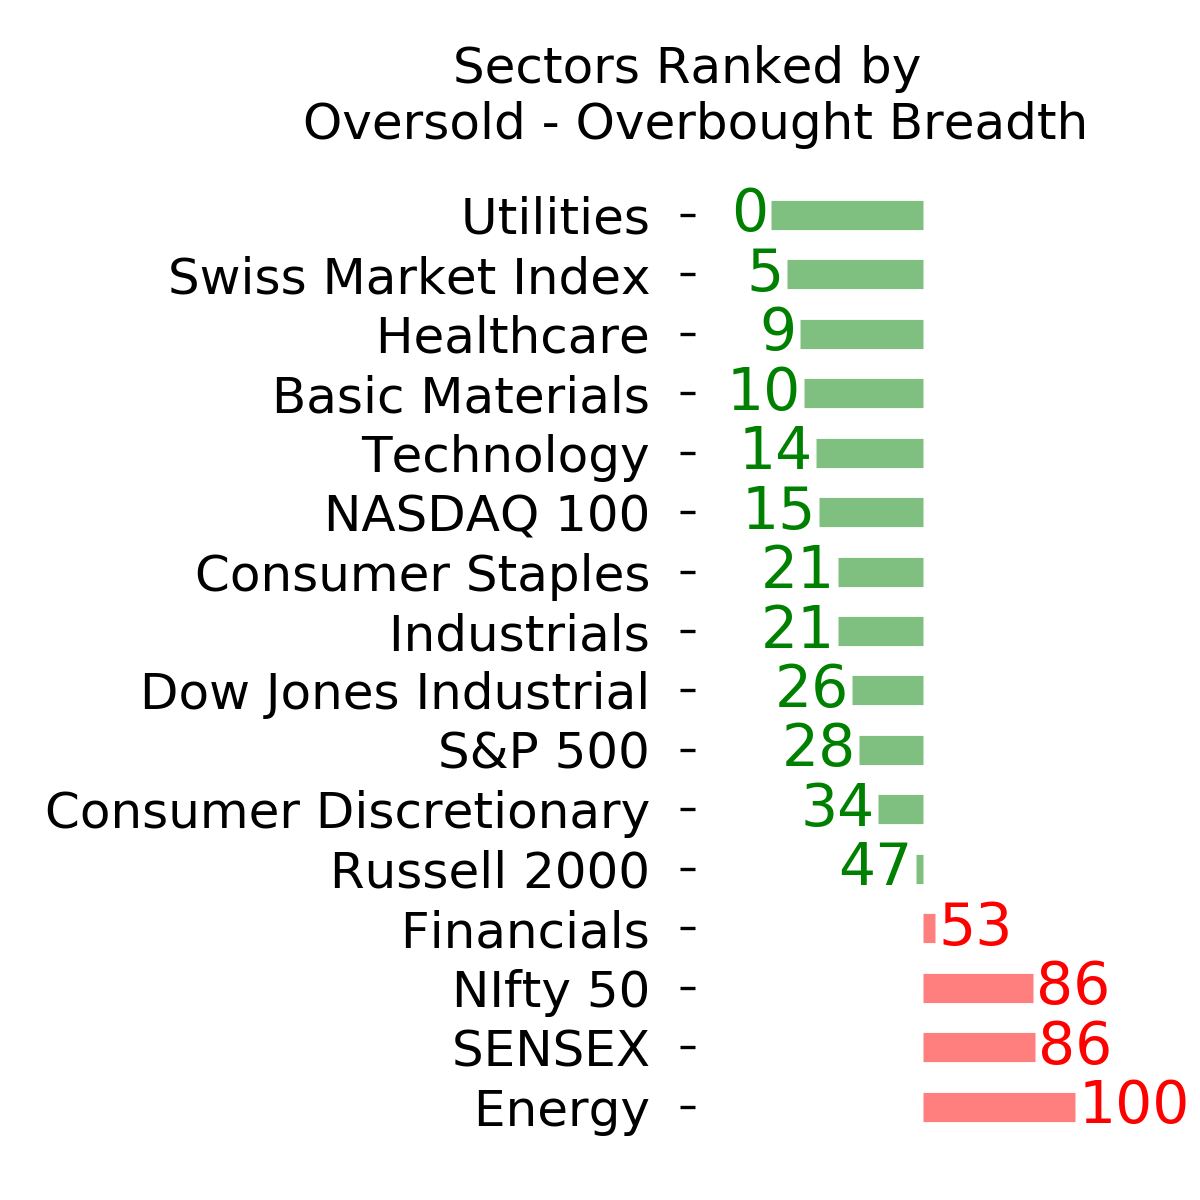
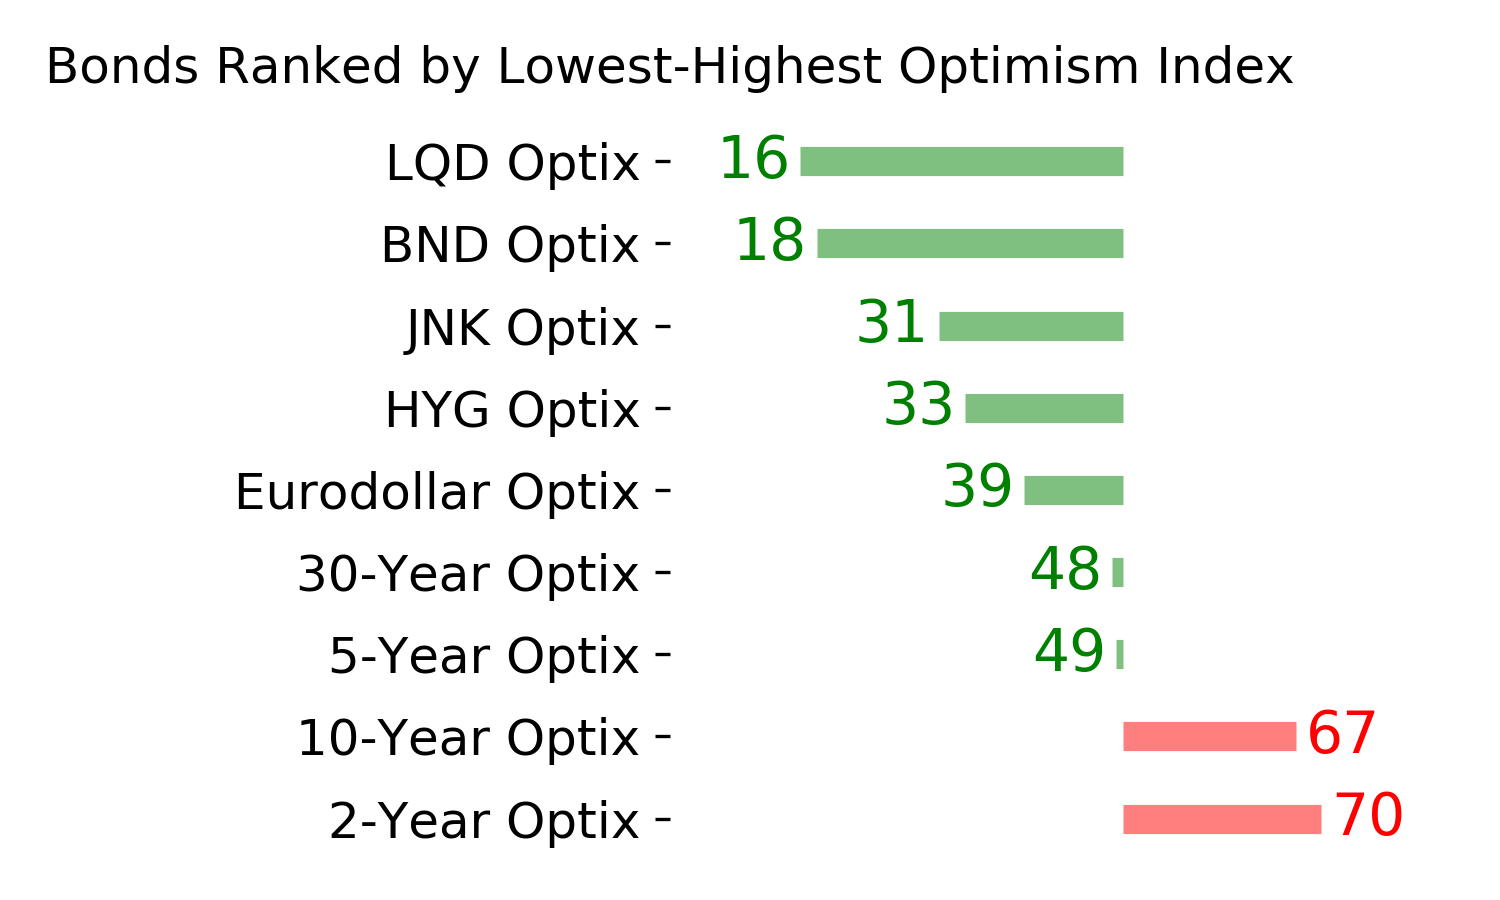
Ranks
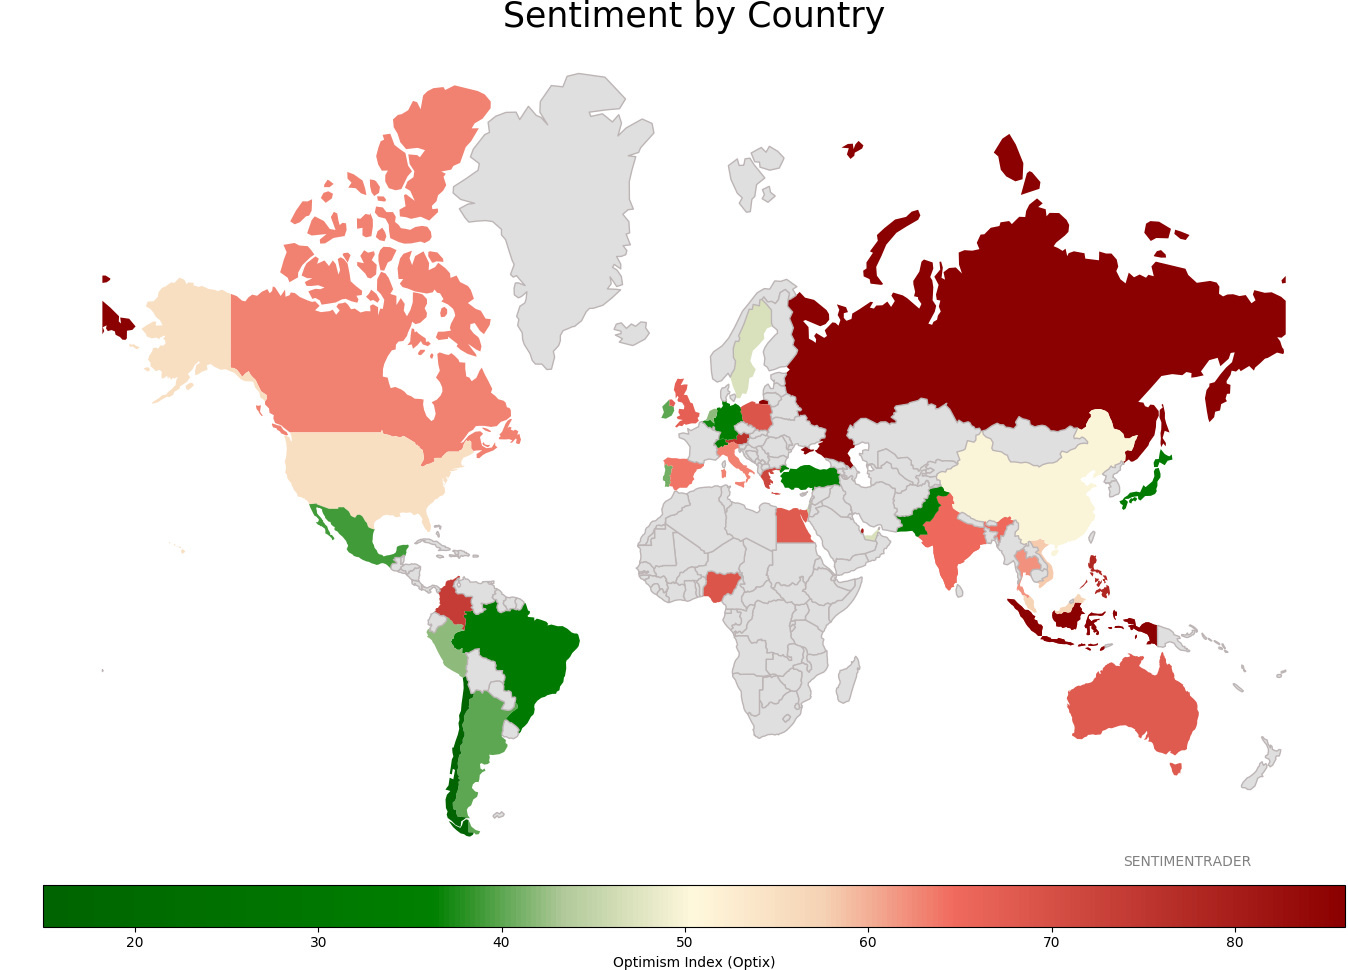
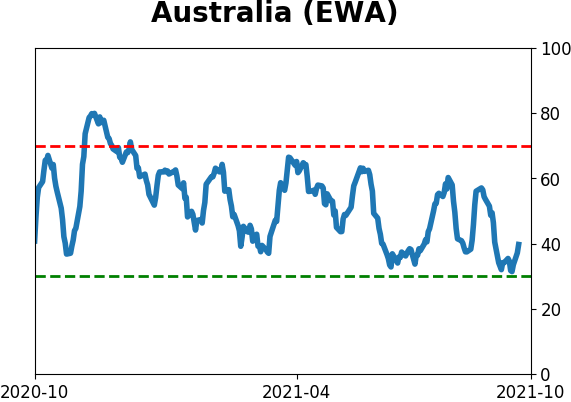
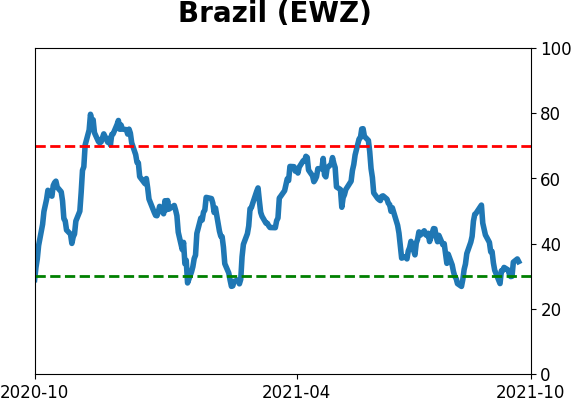
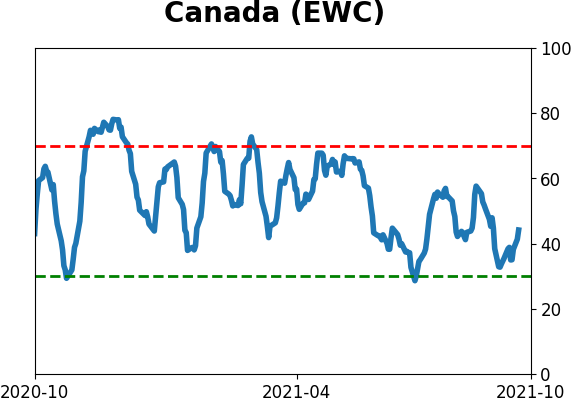
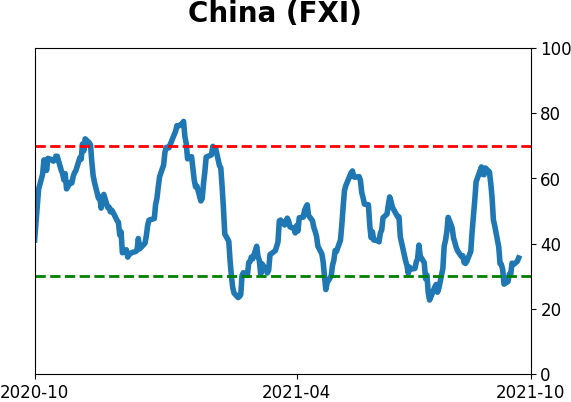
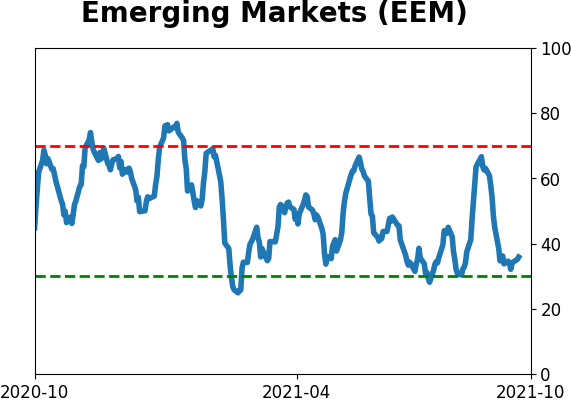
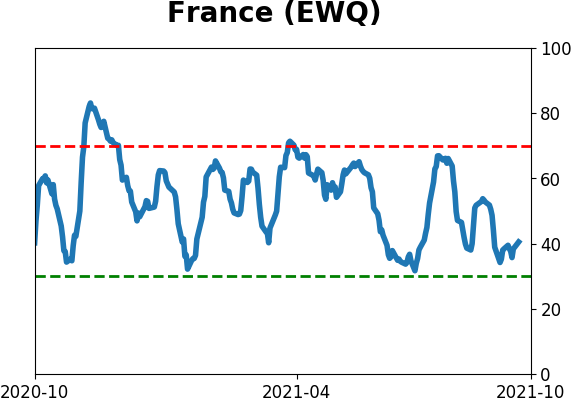
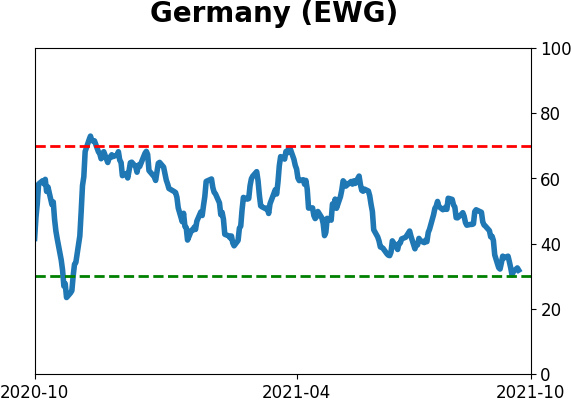
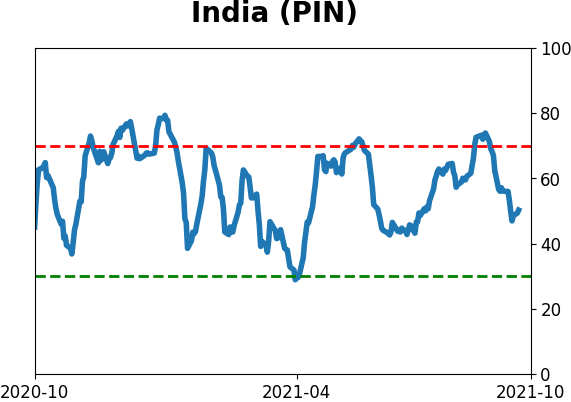
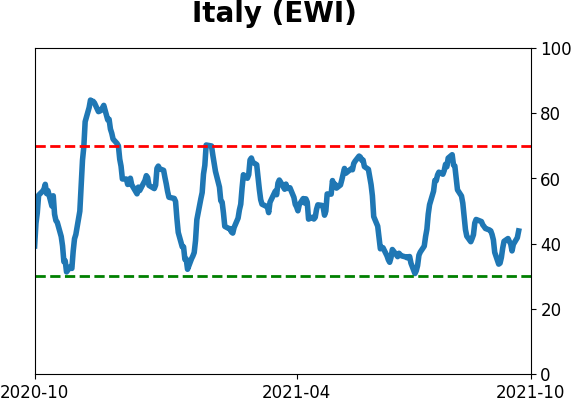
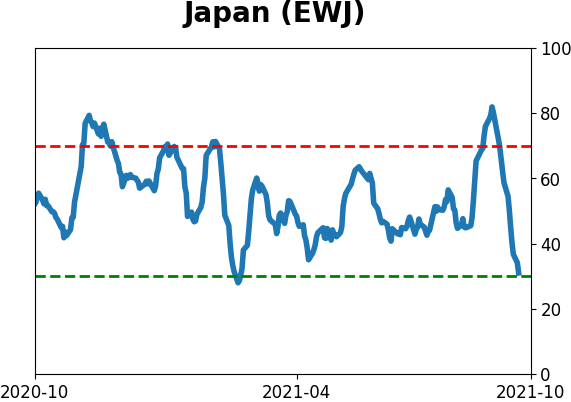
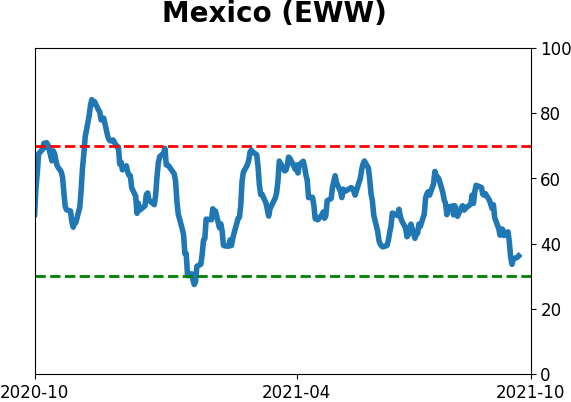
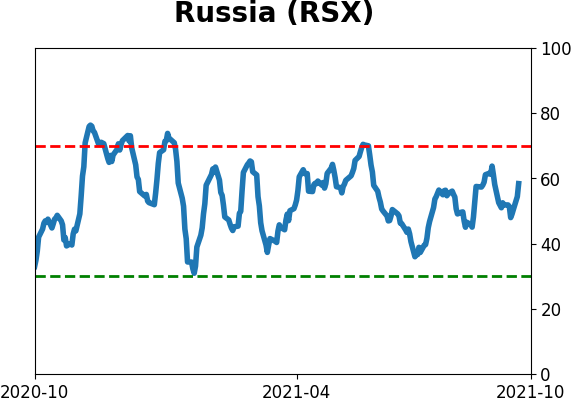
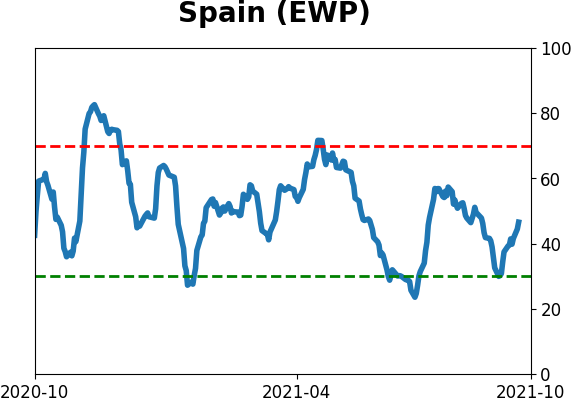
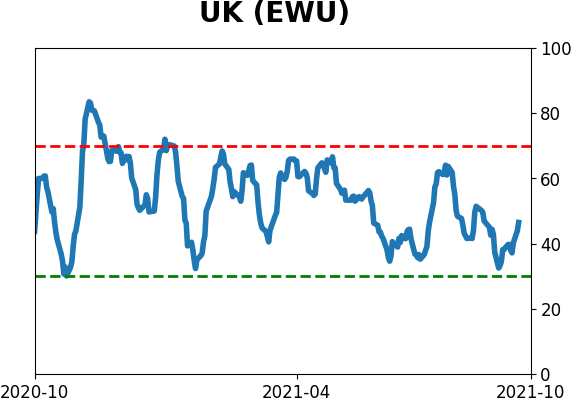
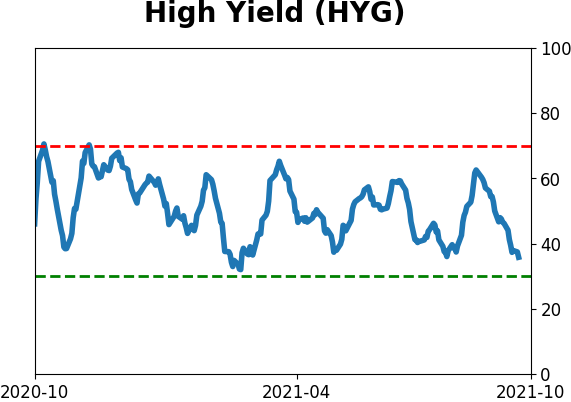
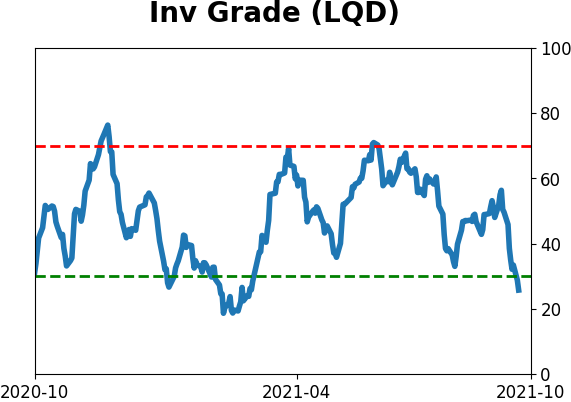
Sentiment Around The World
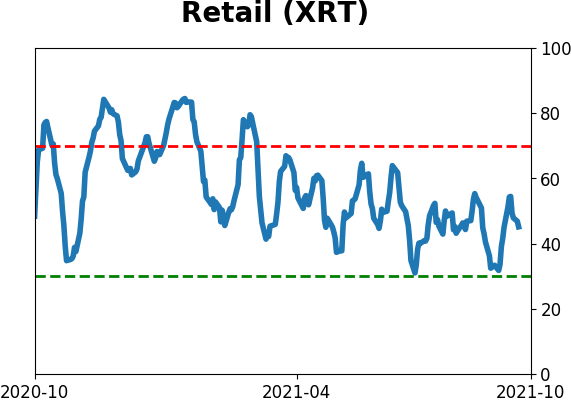
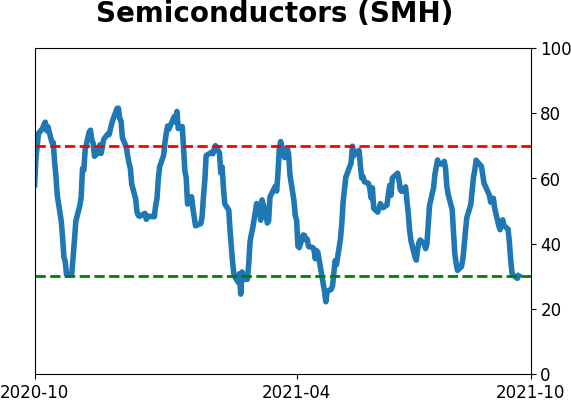
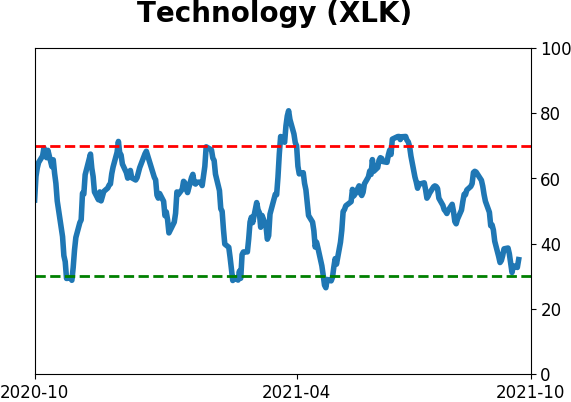
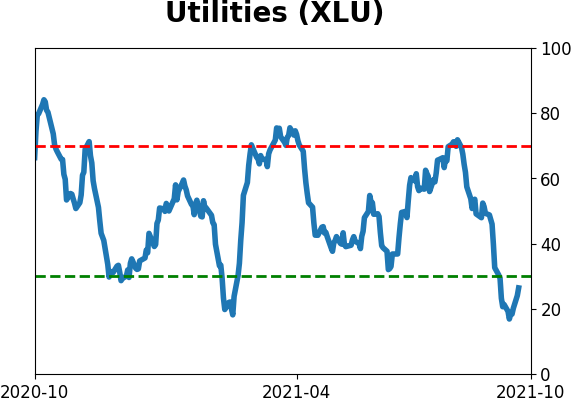
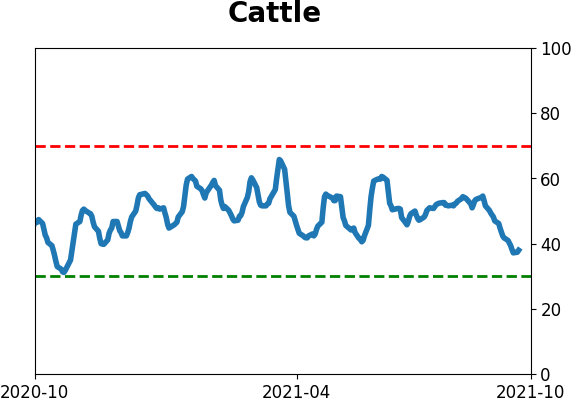
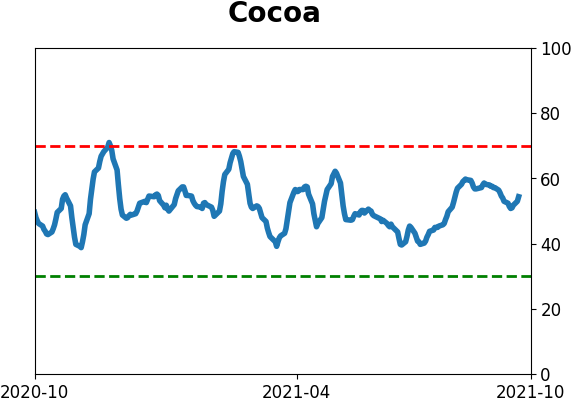
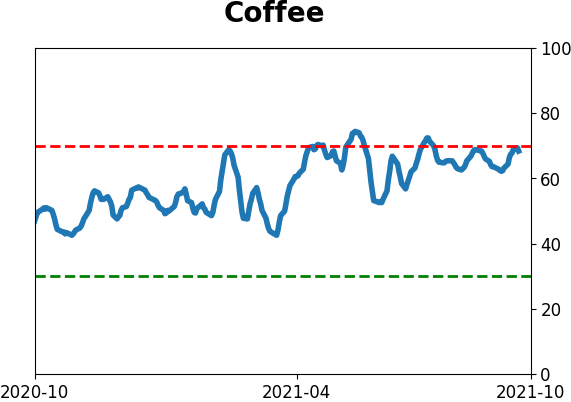
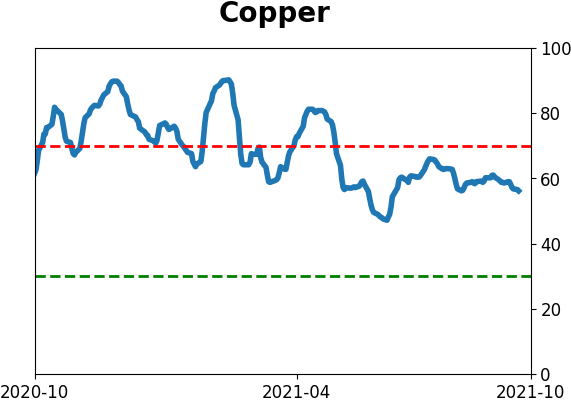
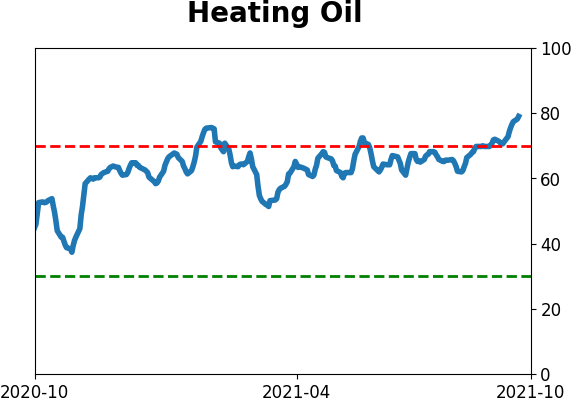
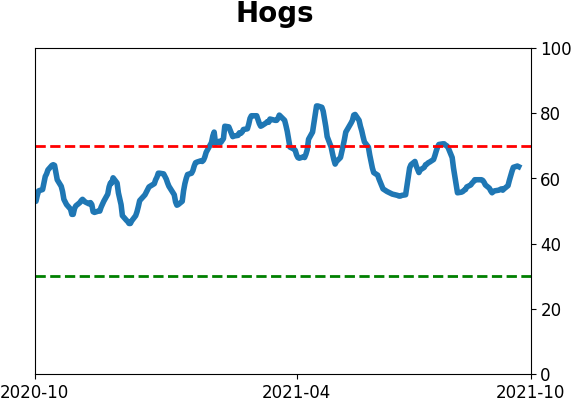
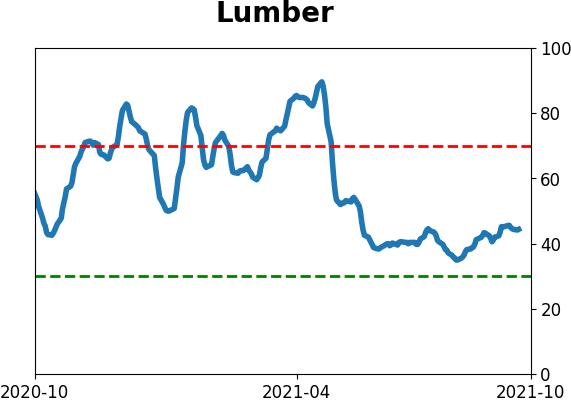
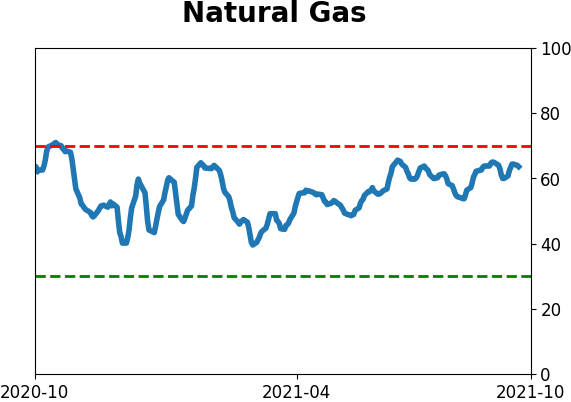
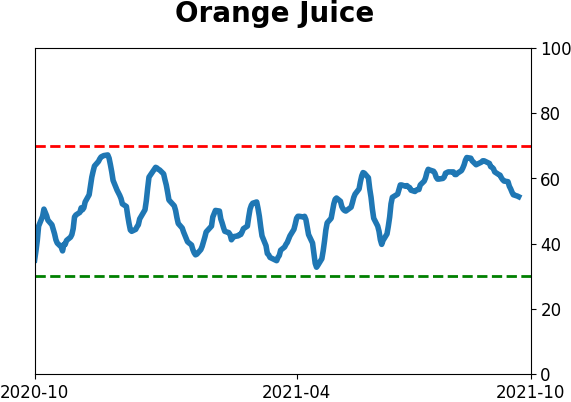
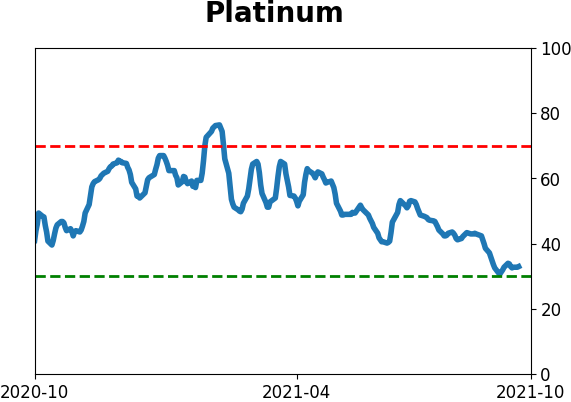
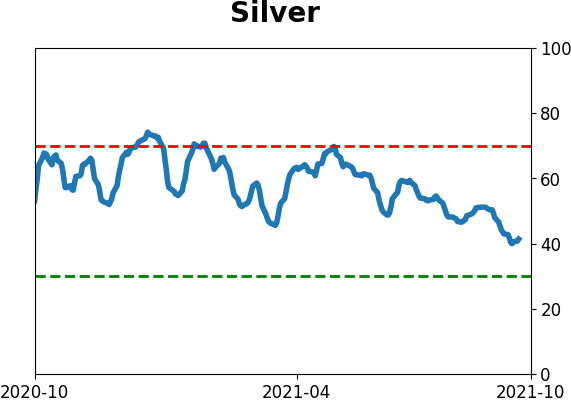
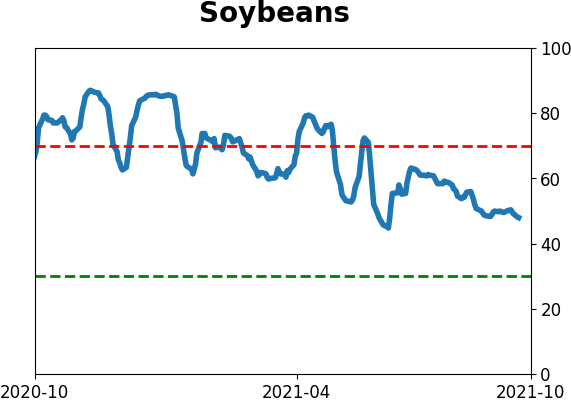
Optimism Index Thumbnails
|
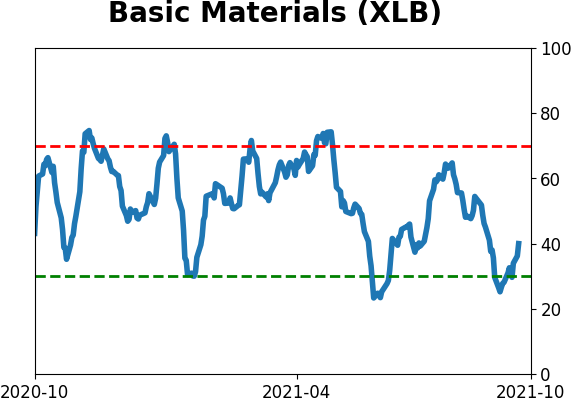
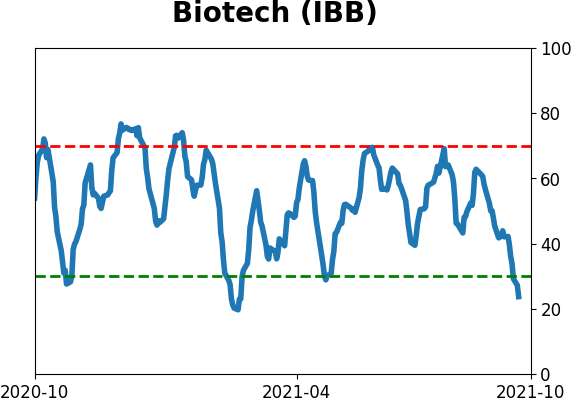
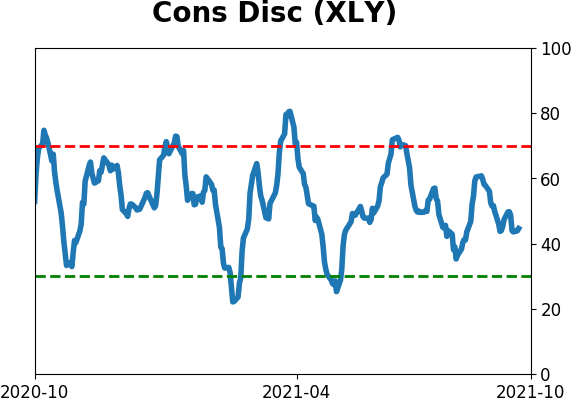
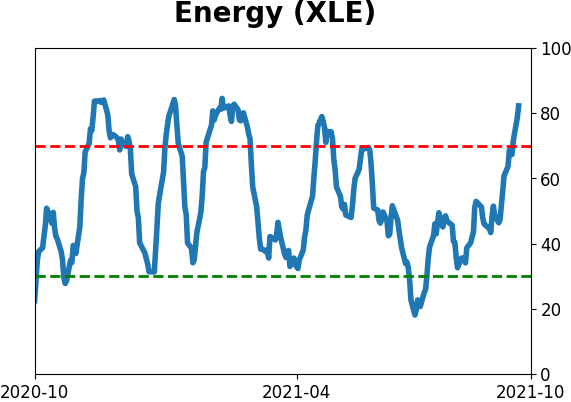
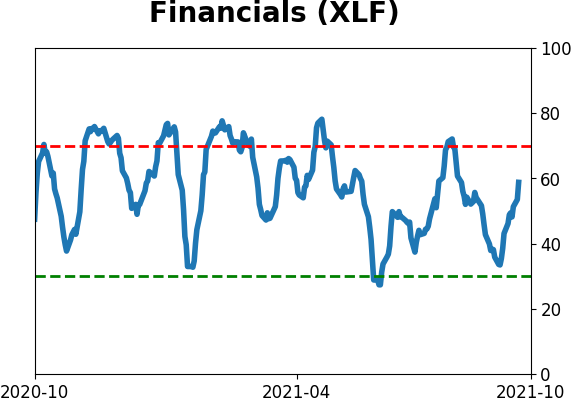
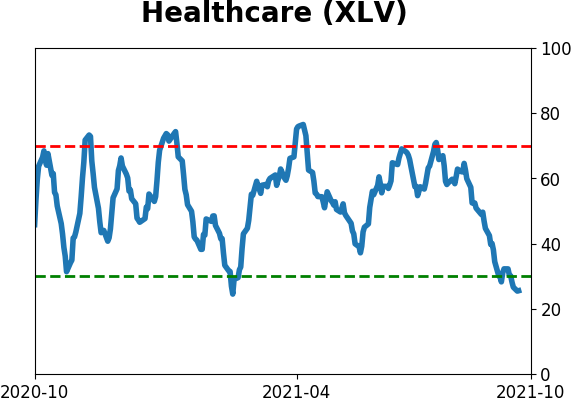
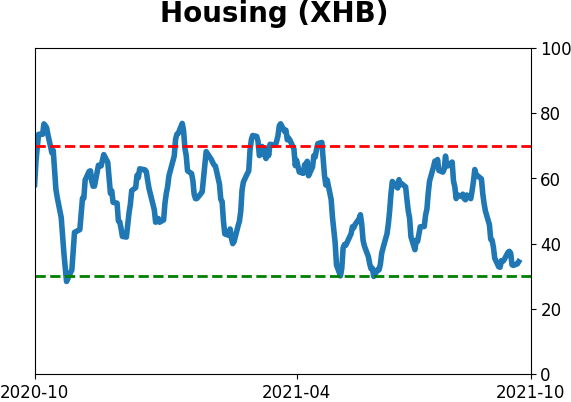
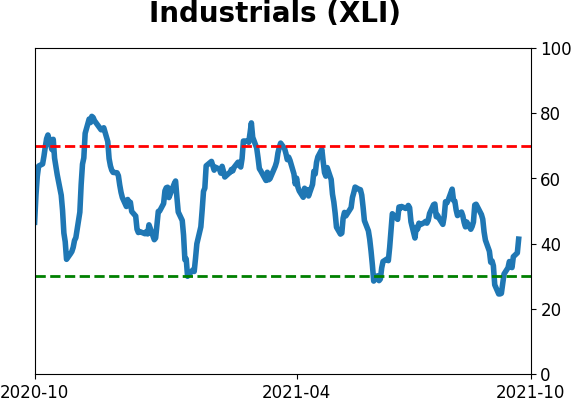
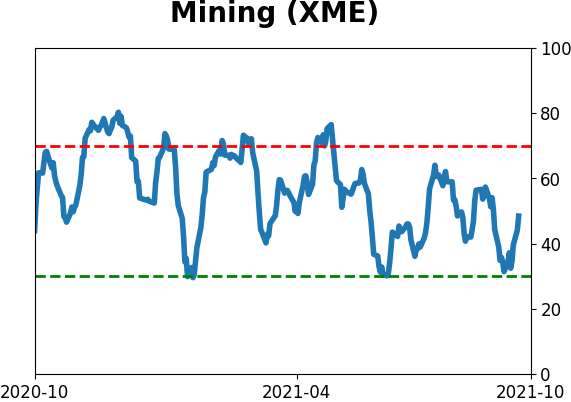
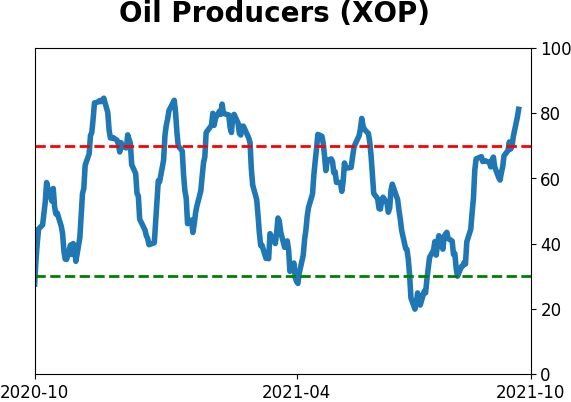
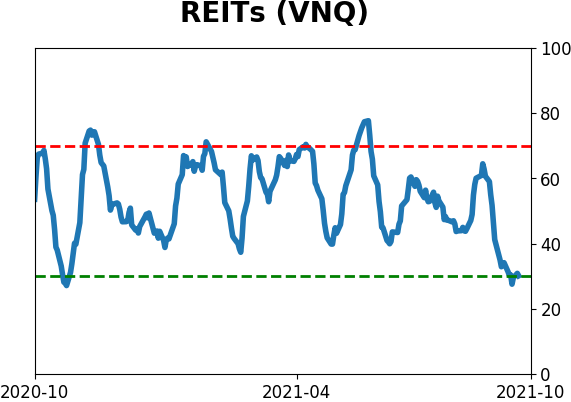
Sector ETF's - 10-Day Moving Average
|
|
|
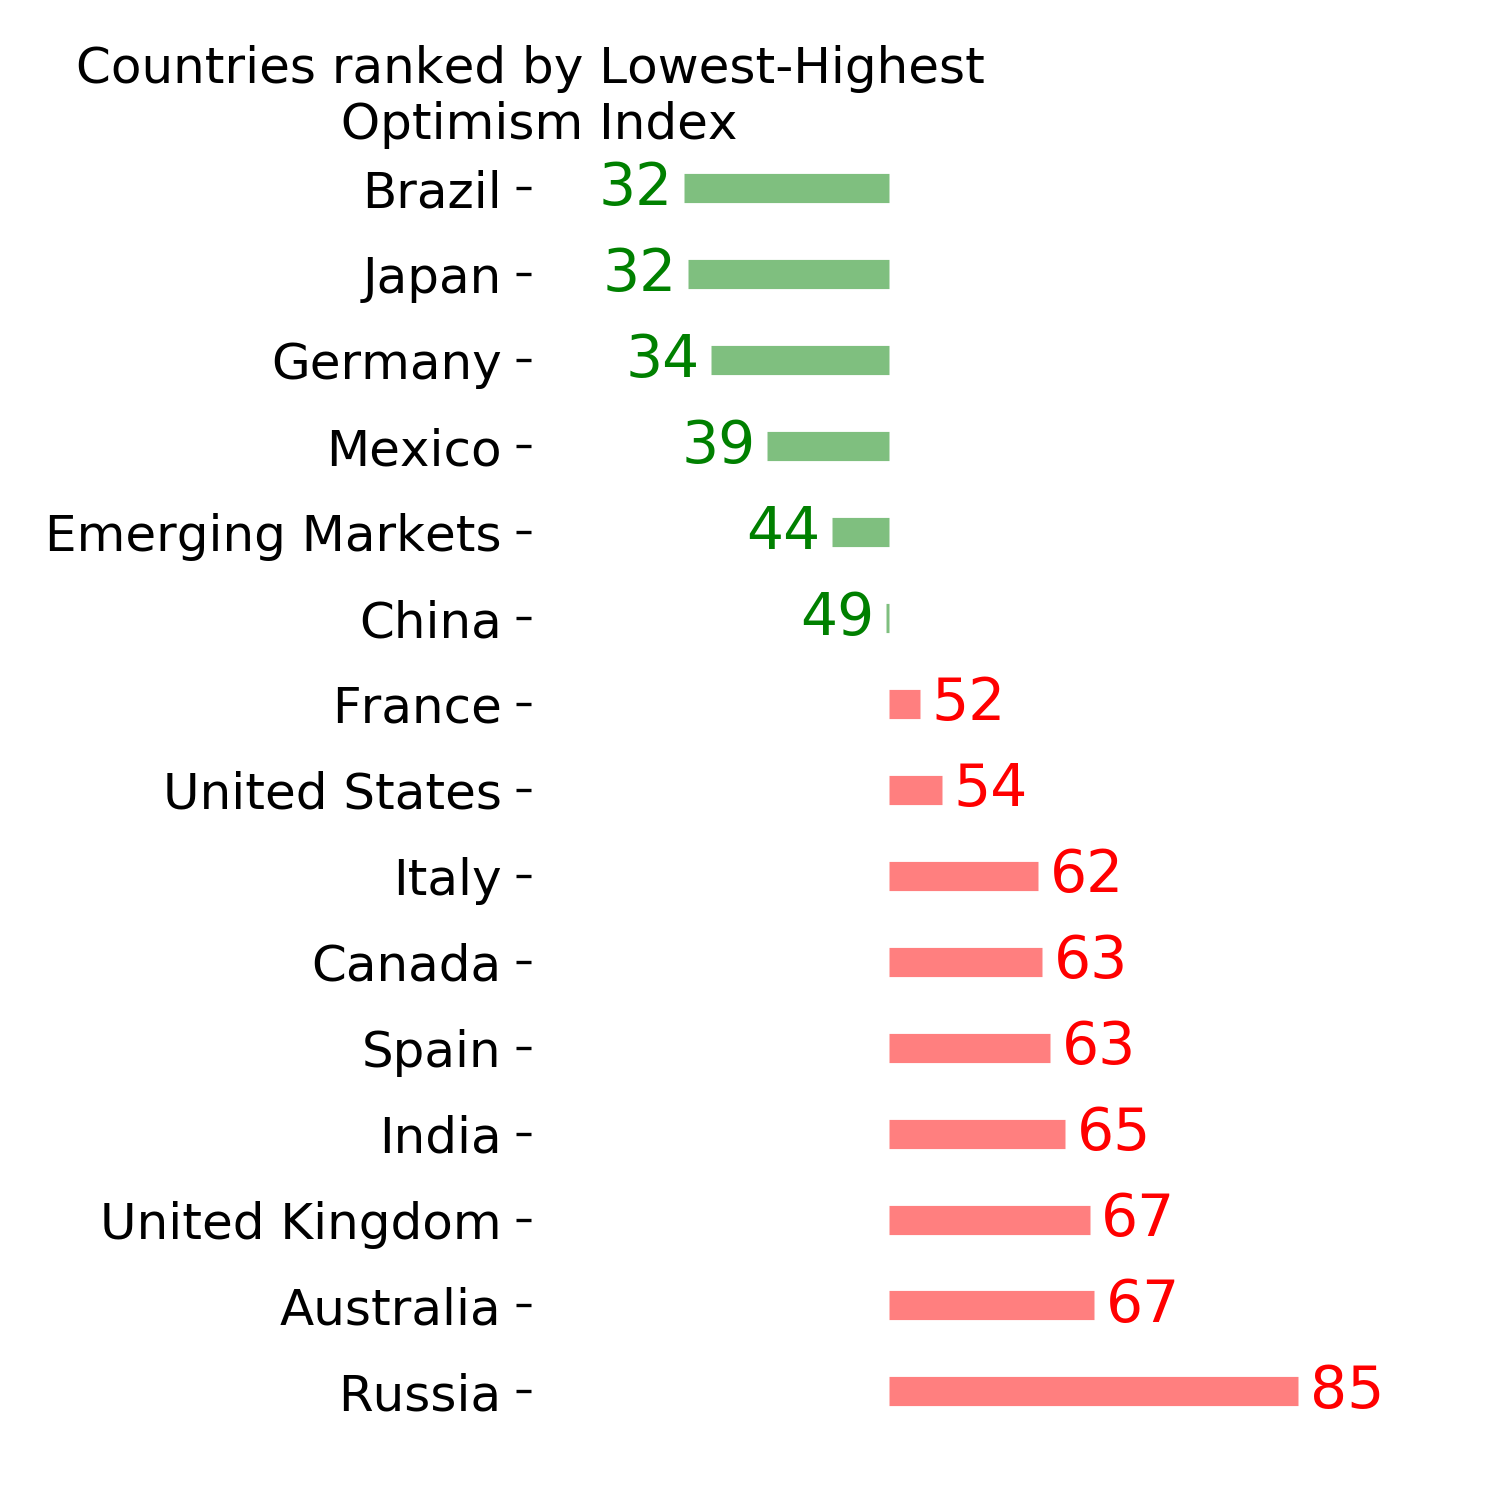
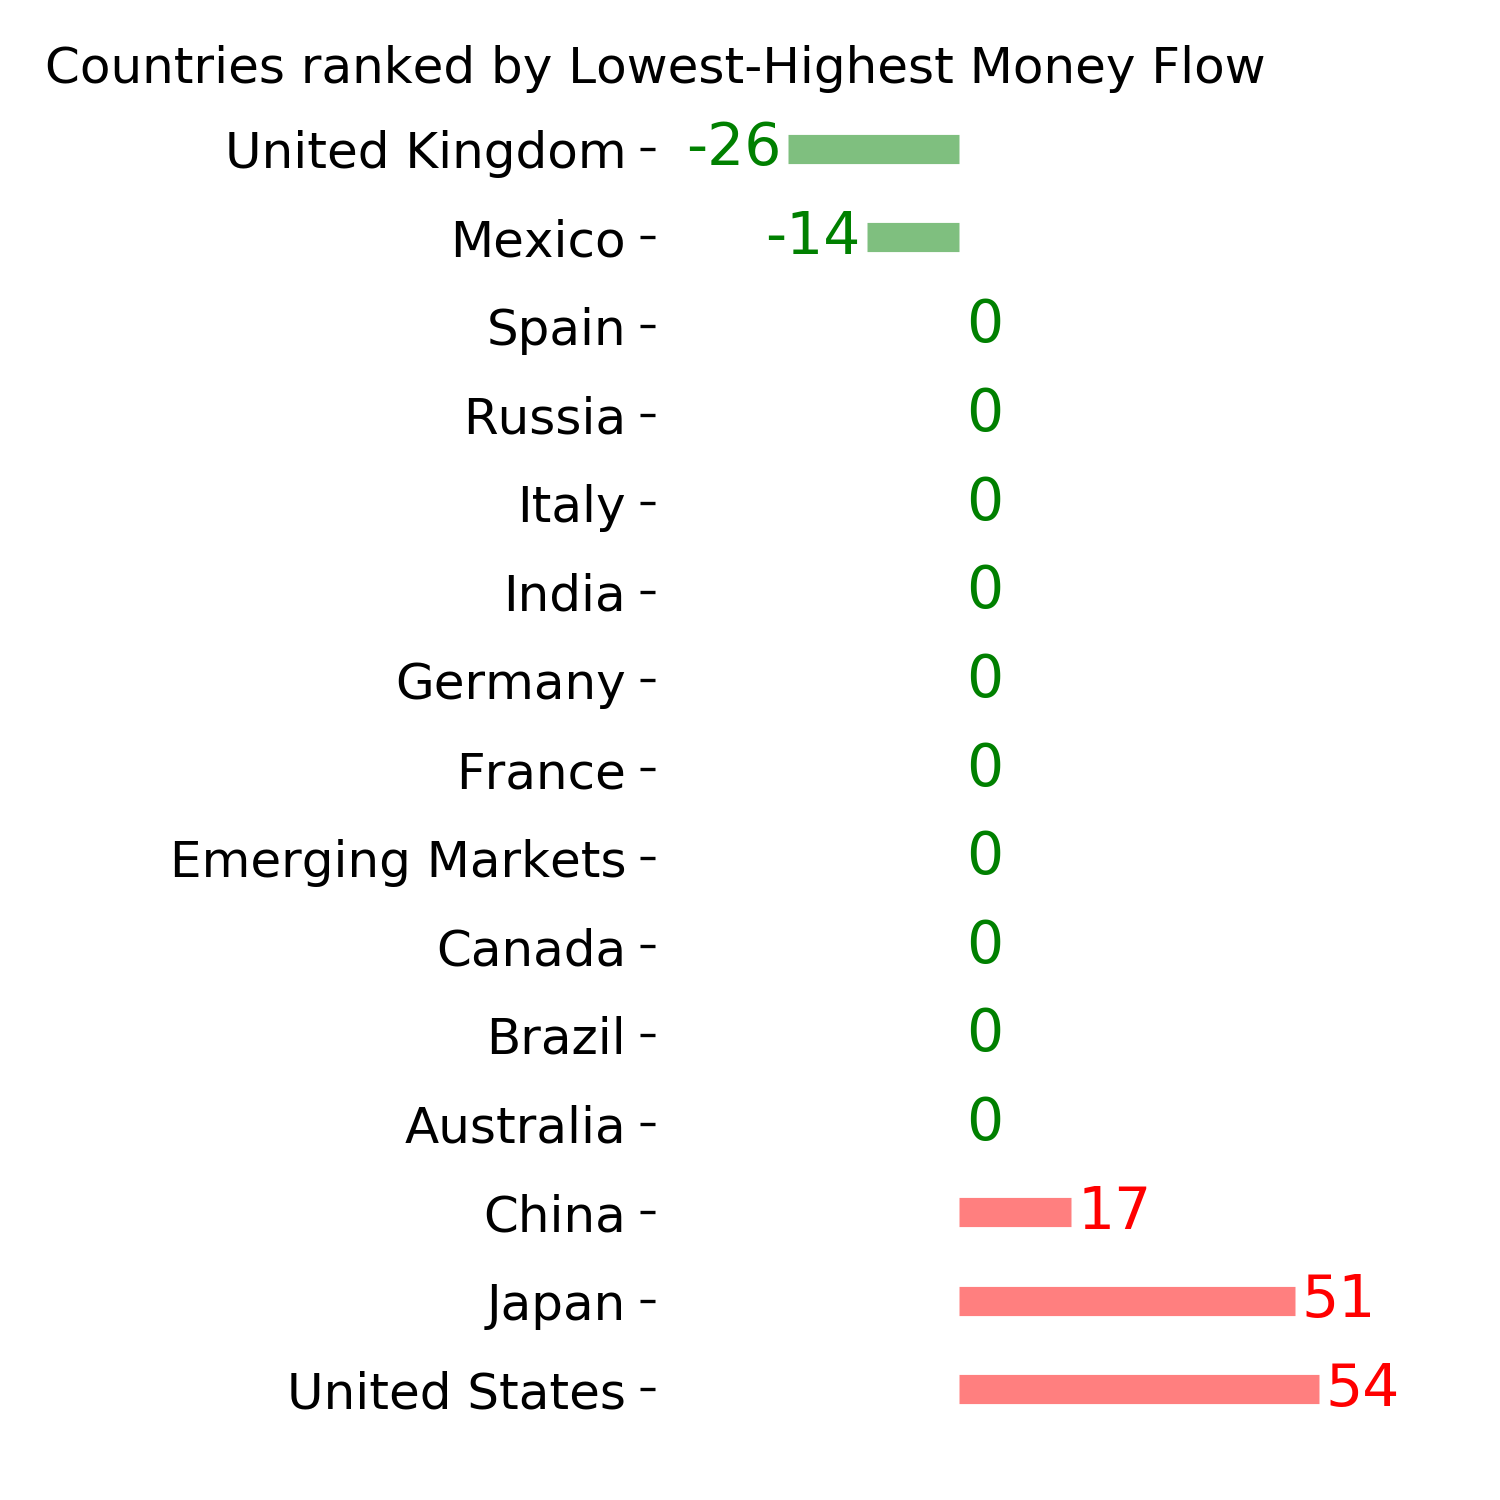
Country ETF's - 10-Day Moving Average
|
|
|
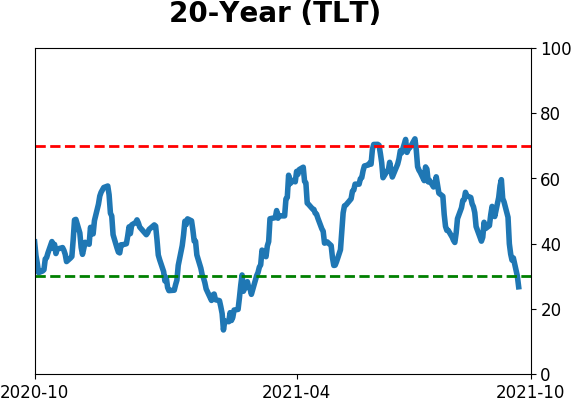
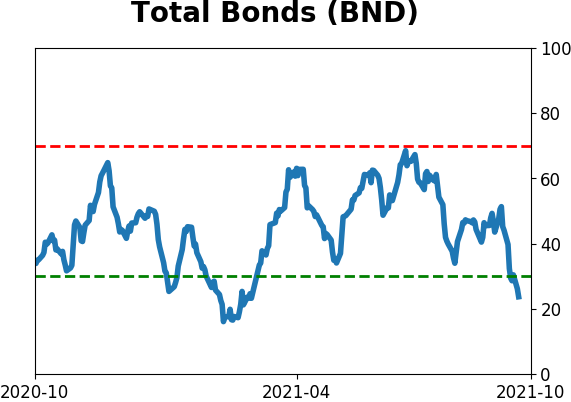
Bond ETF's - 10-Day Moving Average
|
|
|
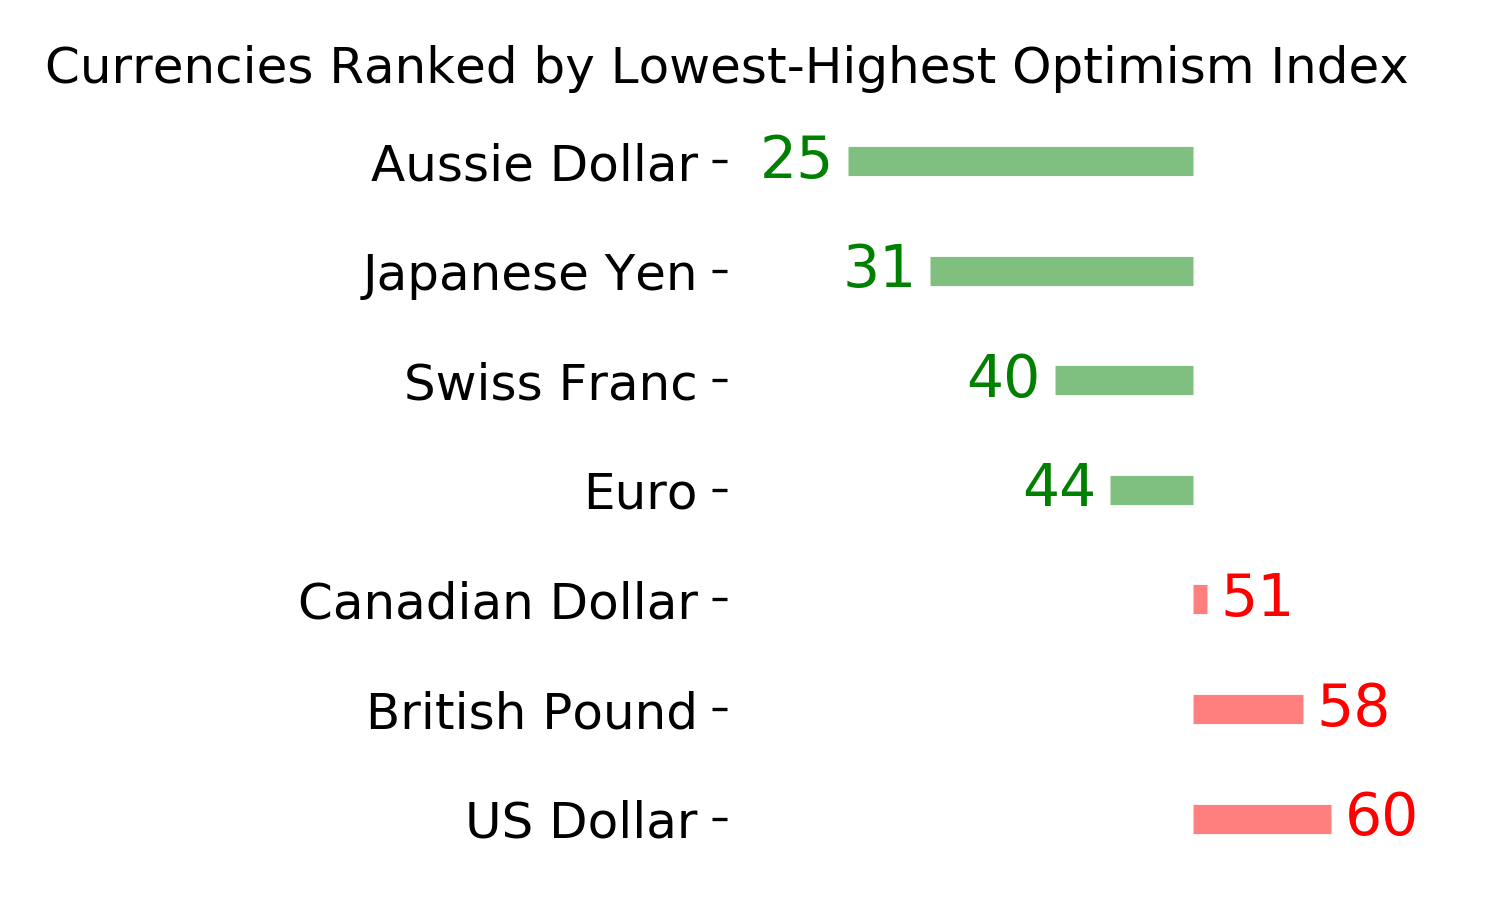
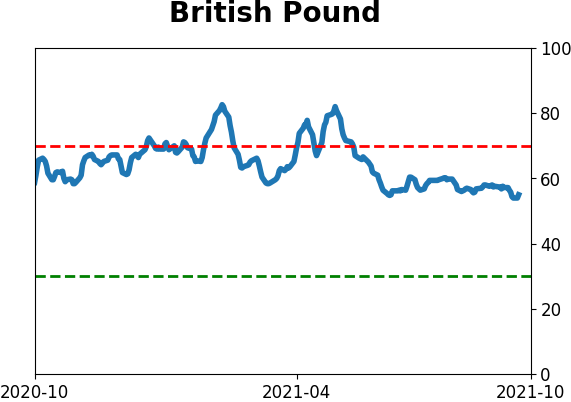
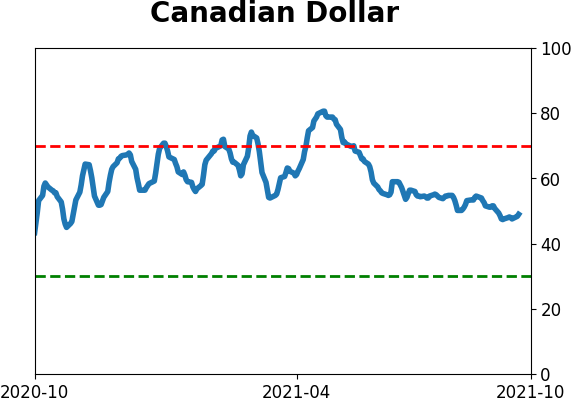
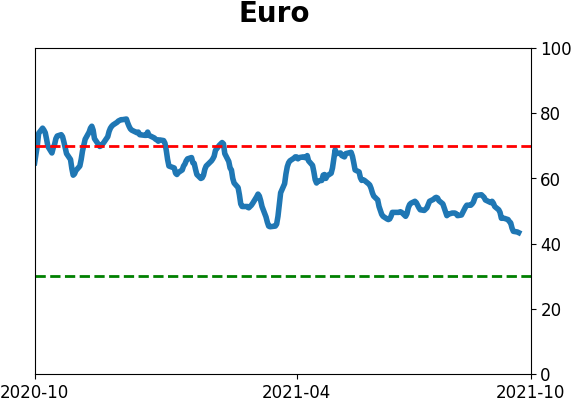
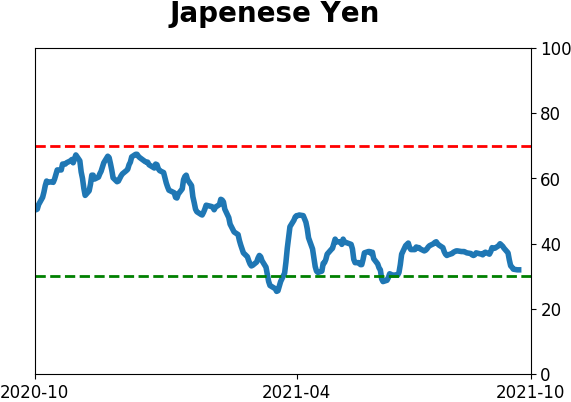
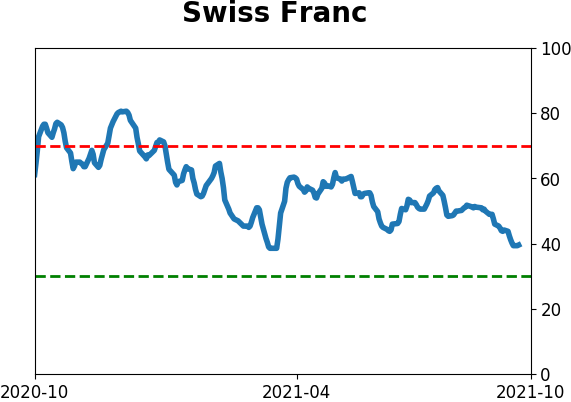
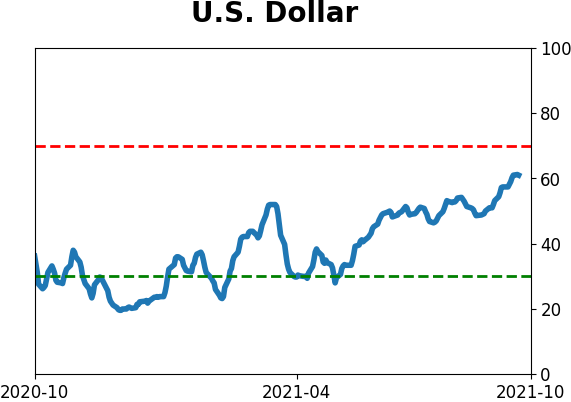
Currency ETF's - 5-Day Moving Average
|
|
|
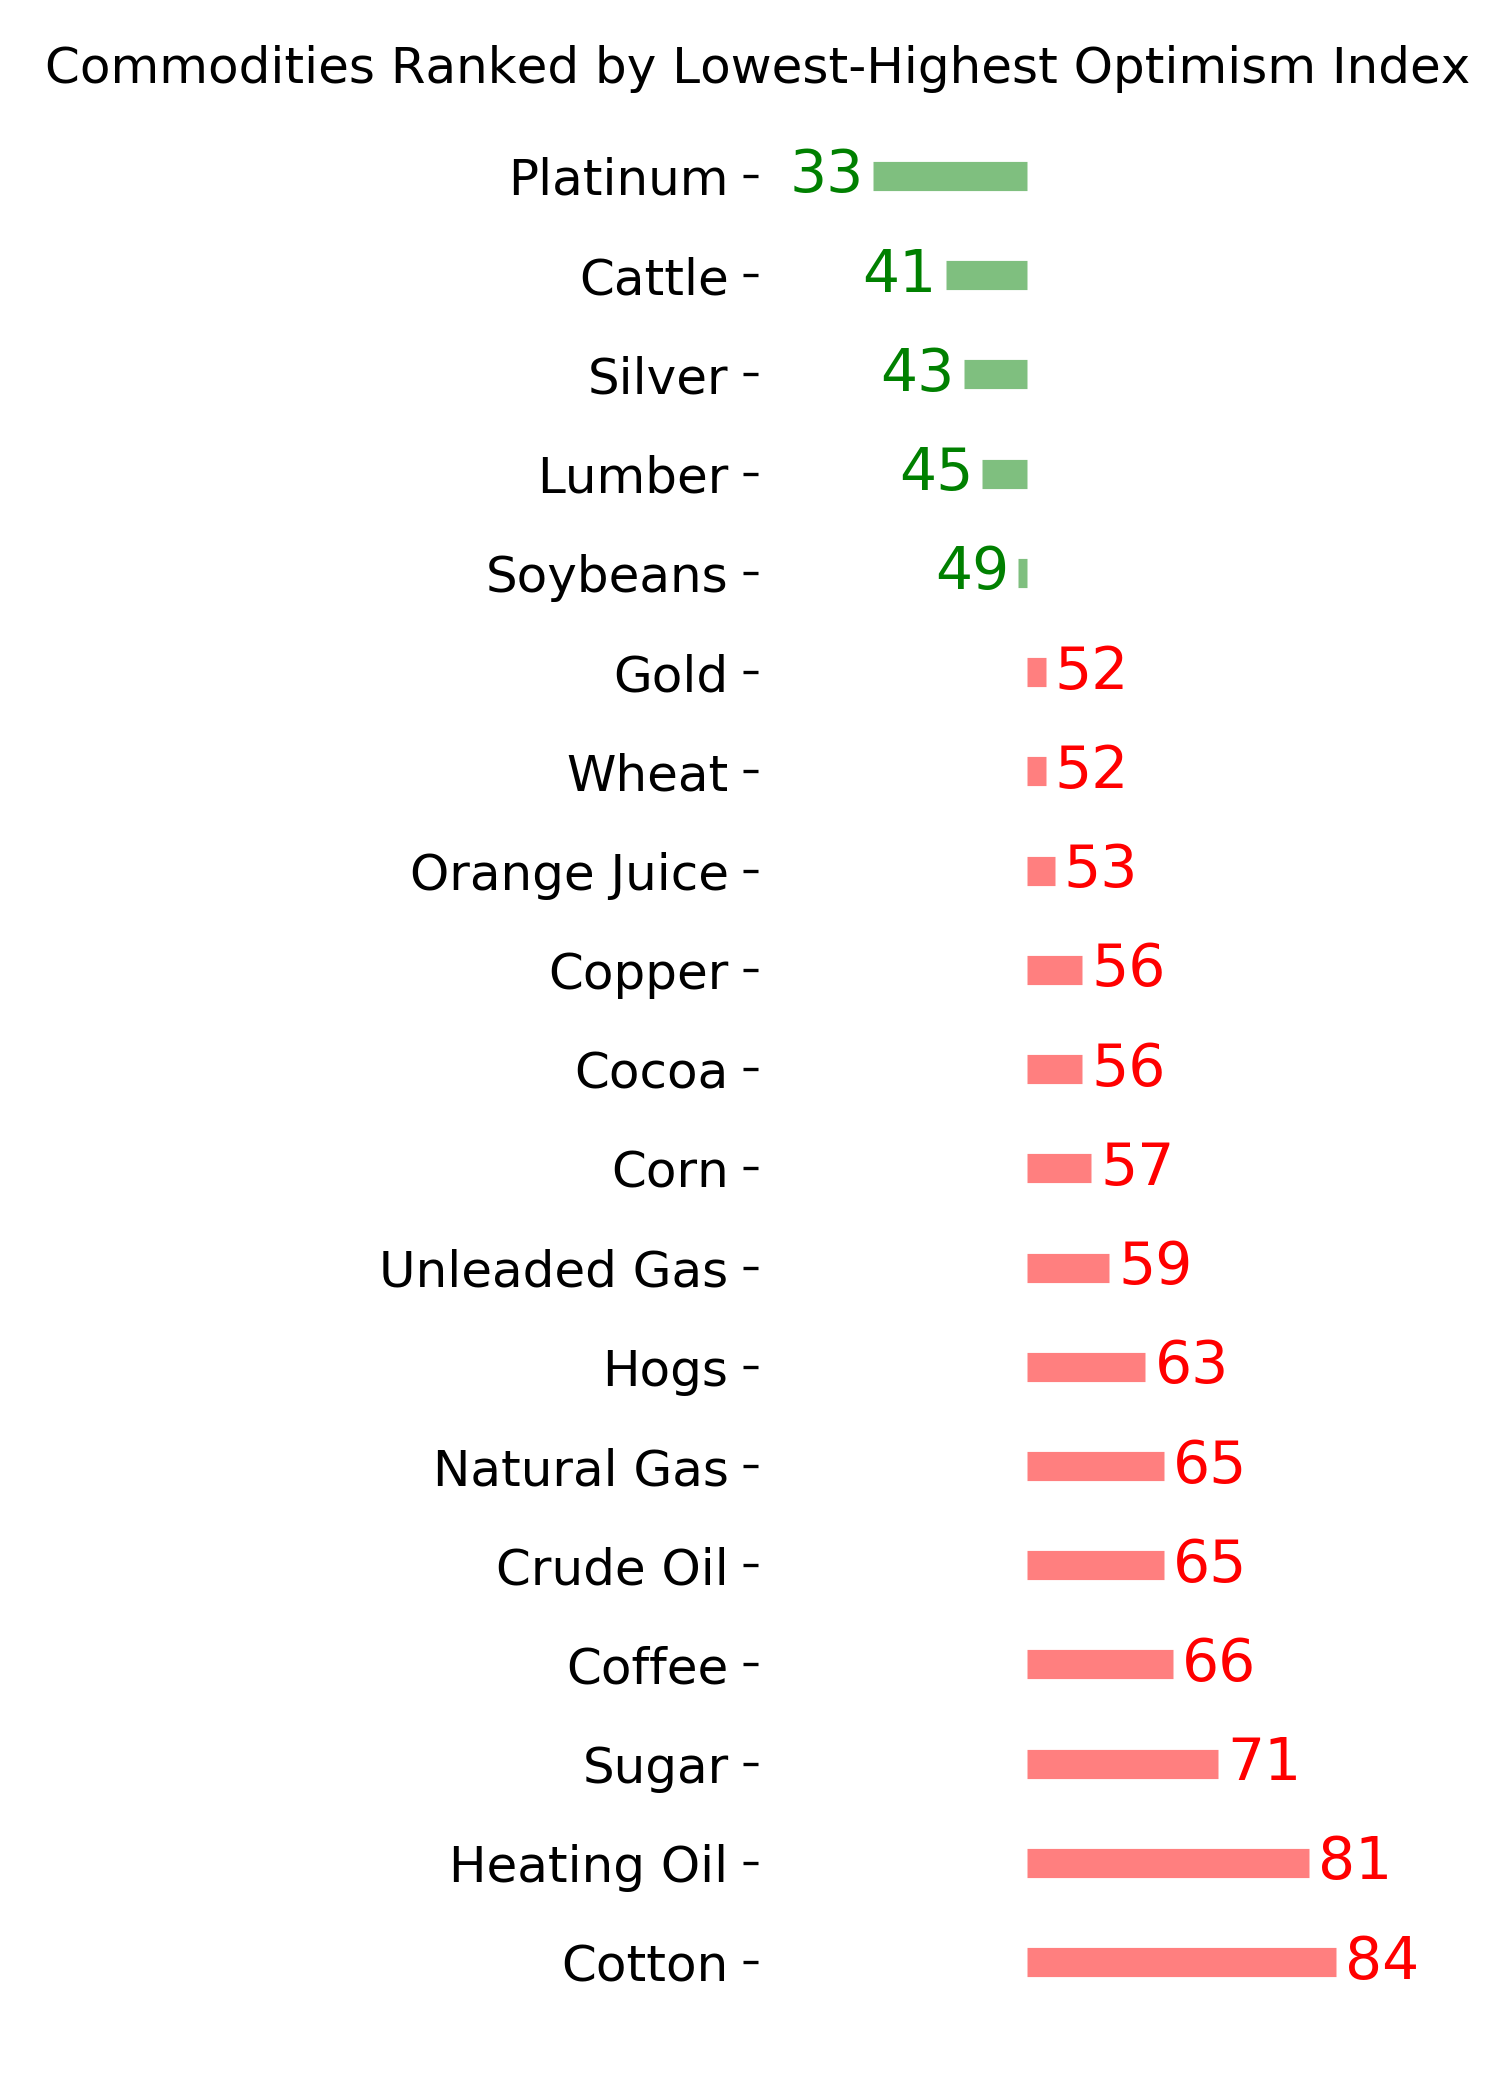
Commodity ETF's - 5-Day Moving Average
|
|