Headlines
|
|
For the First Time in a Year, Investors Move to Risk-Off:
For the first time in over a year, investors are showing risk-off behavior, and there are widespread signs of at least modest pessimism. After other long streaks of optimism and risk-on behavior ended, stocks had a strong tendency to rebound over the medium- to long-term.
Bottom Line:
STOCKS: Hold
Sentiment continues to decline from the speculative February peak. With deteriorating breadth, this raises the risk of poor short- to medium-term returns until optimism and better breadth returns. See the Outlook & Allocations page for more. BONDS: Hold
Various parts of the market got hit in March, with the lowest Bond Optimism Index we usually see during healthy environments. Bond prices have modest recovered and there is no edge among the data we follow. GOLD: Hold
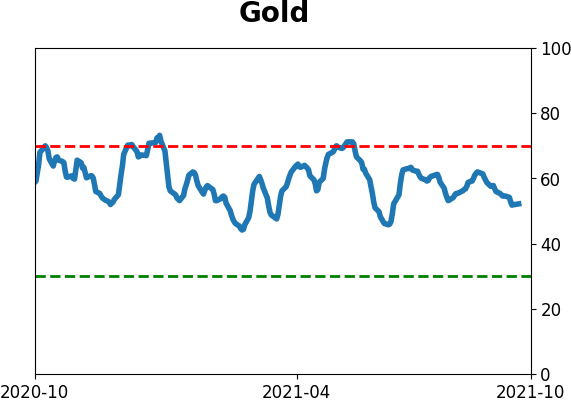
Gold and miners were rejected after trying to recover above their 200-day averages in May. Lately, some medium-term (not long-term) oversold extremes in breadth measures among miners have triggered.
|
Smart / Dumb Money Confidence
|
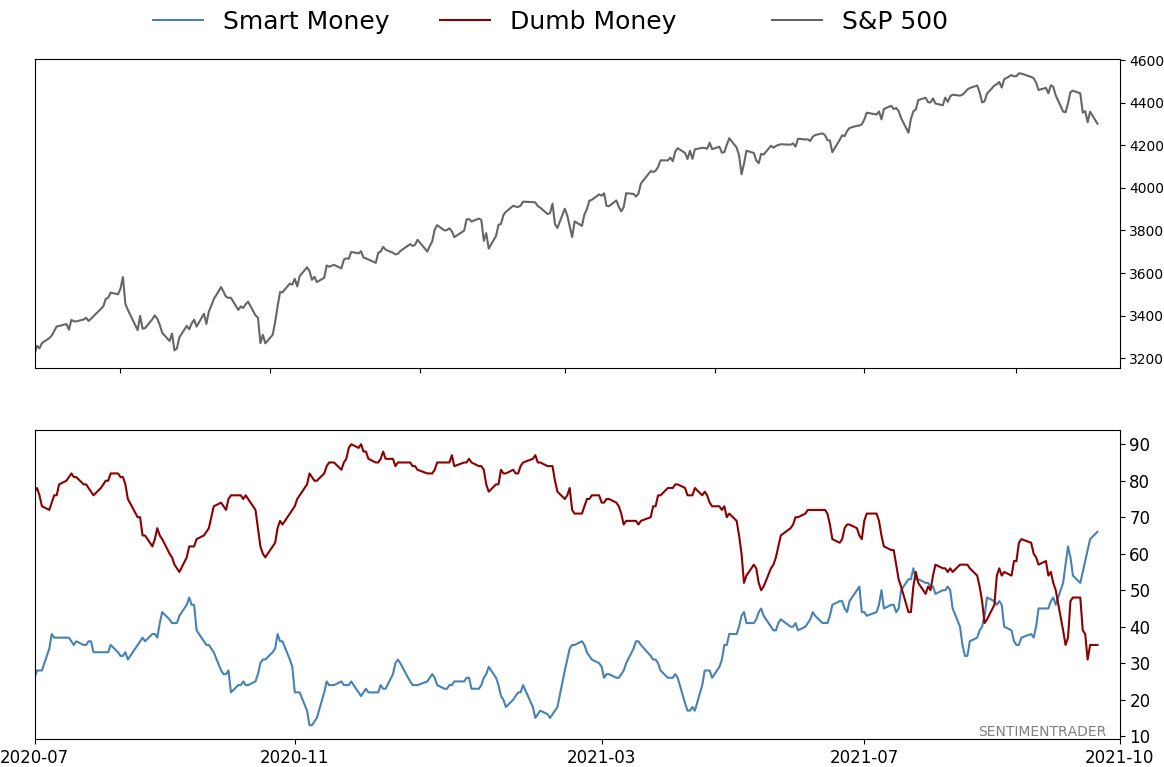
Smart Money Confidence: 66%
Dumb Money Confidence: 35%
|
|
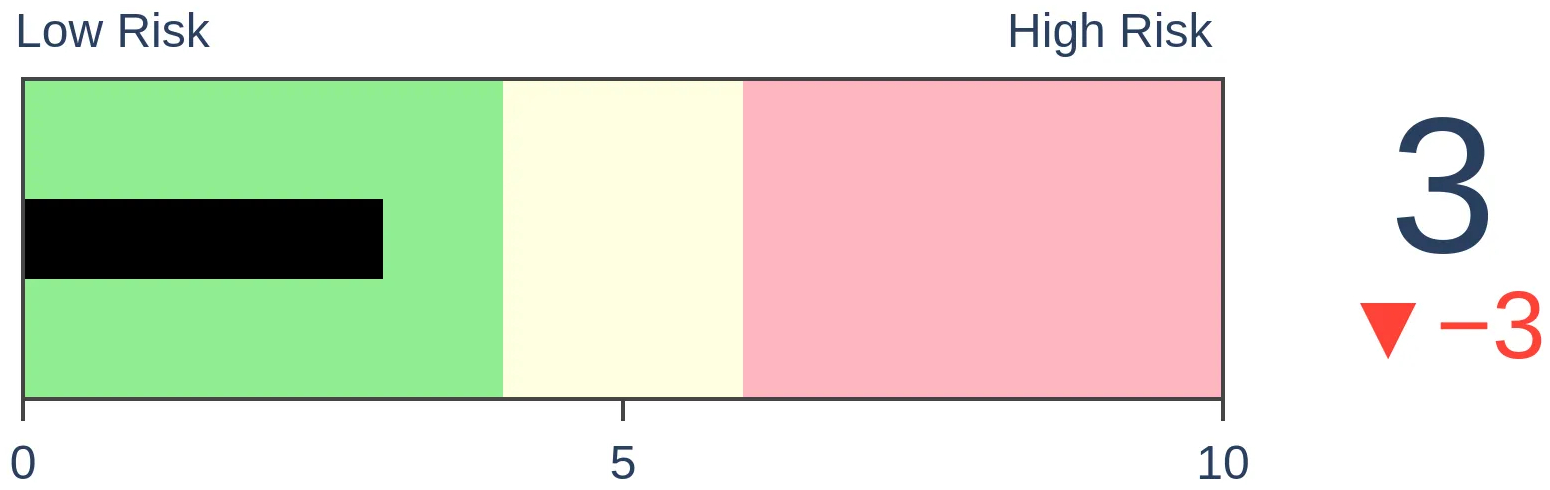
Risk Levels
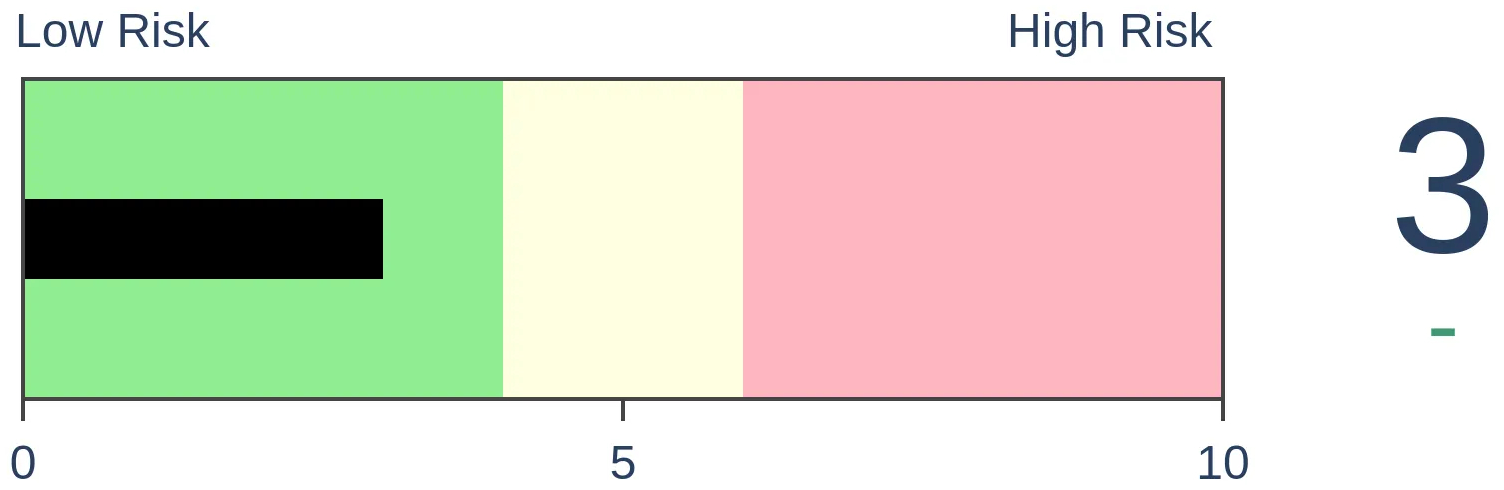
Stocks Short-Term
|
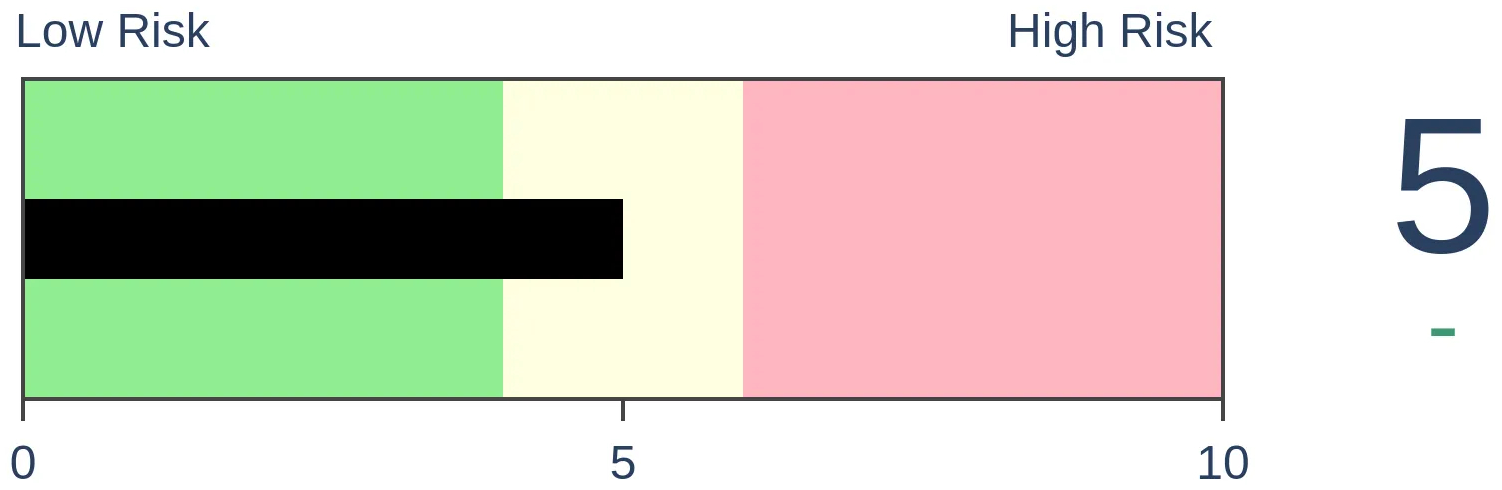
Stocks Medium-Term
|
|
Bonds

|
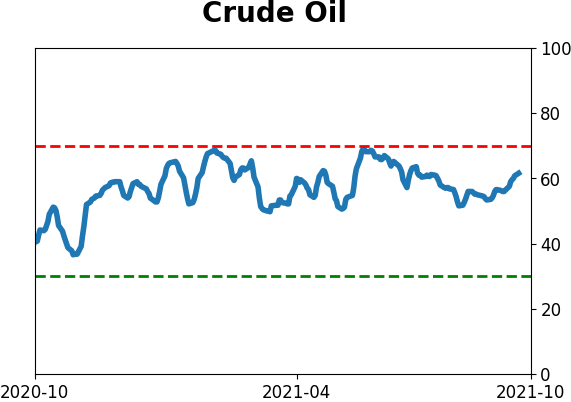
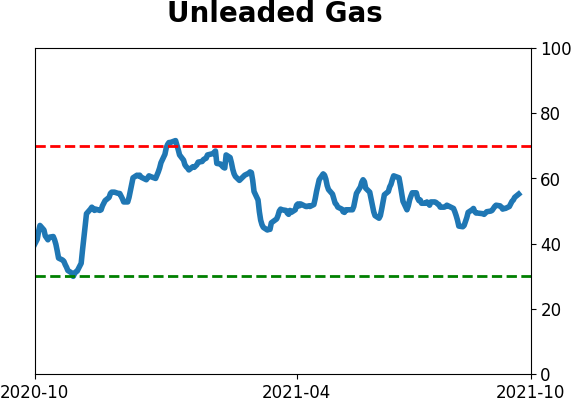
Crude Oil

|
|
Gold
|
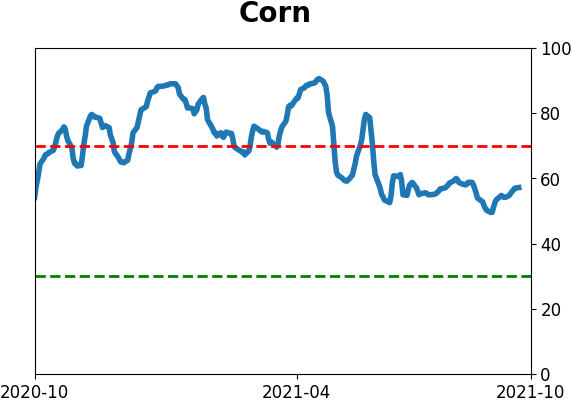
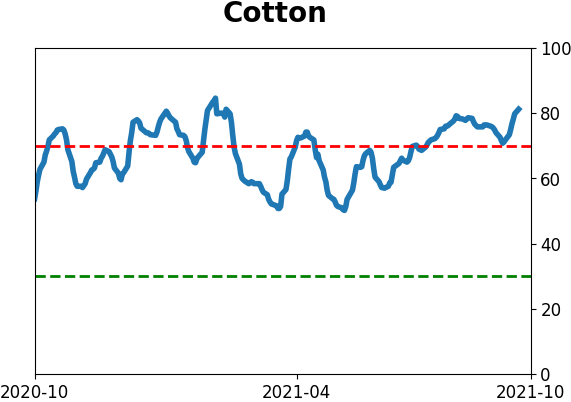
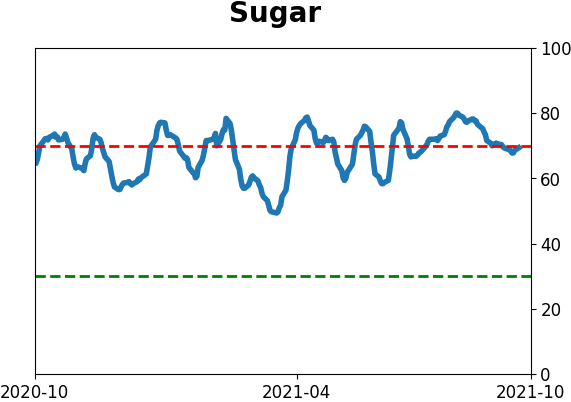
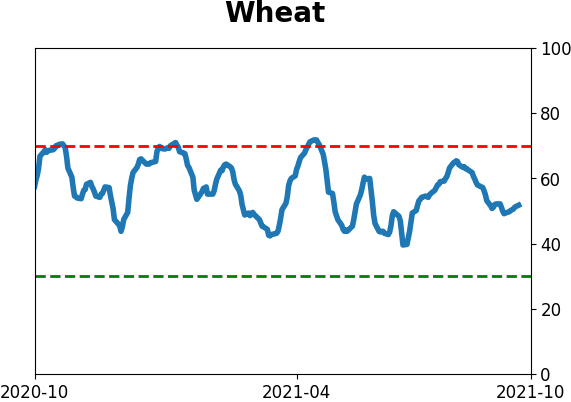
Agriculture
|
|
Research
By Jason Goepfert
BOTTOM LINE
For the first time in over a year, investors are showing risk-off behavior, and there are widespread signs of at least modest pessimism. After other long streaks of optimism and risk-on behavior ended, stocks had a strong tendency to rebound over the medium- to long-term.
FORECAST / TIMEFRAME
None
|
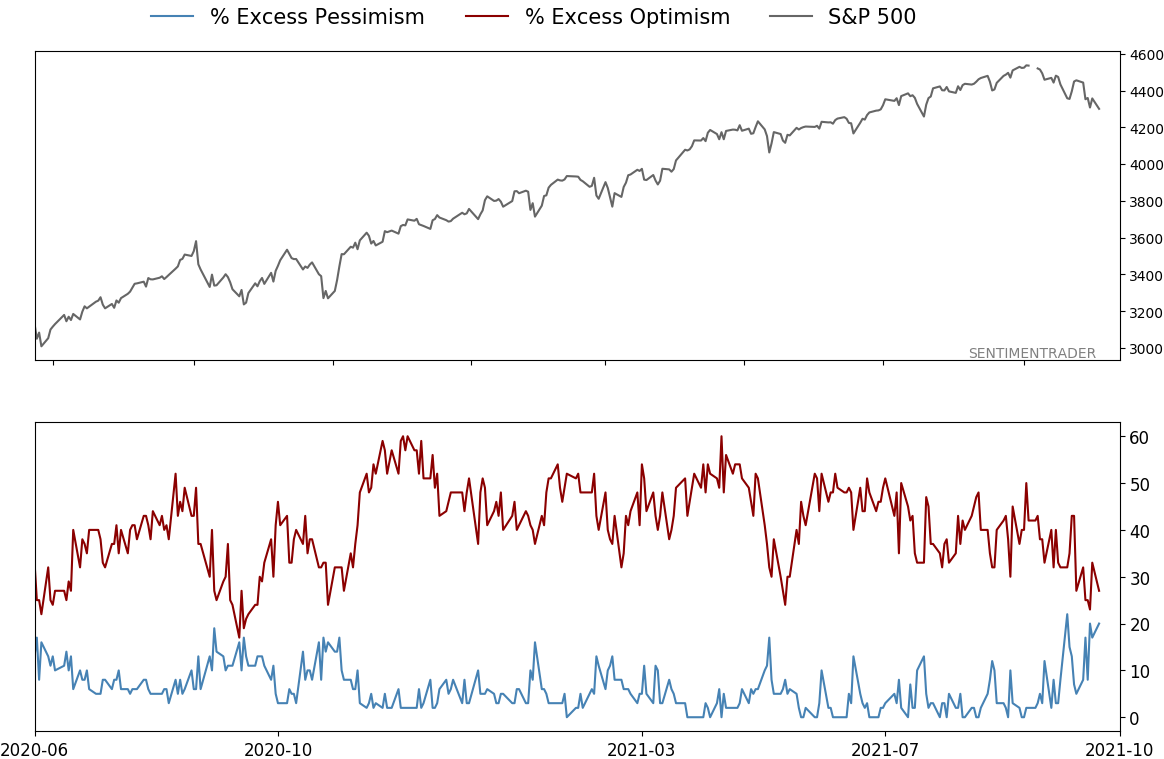
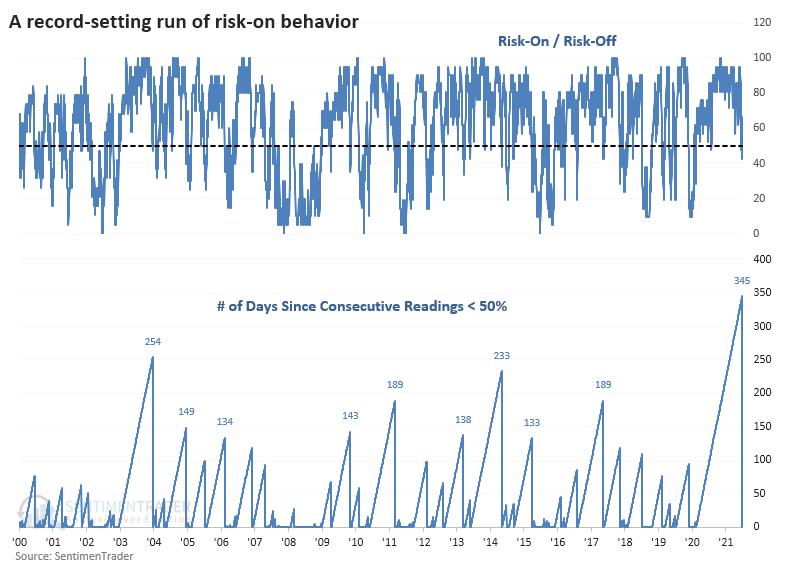
For the first time in over a year, investors have a risk-off mentality and show signs of widespread pessimism.
It's not extreme in most cases, and Friday's rebound puts a dent in the argument, but last week showed the first real signs of concern since the spring of 2020.
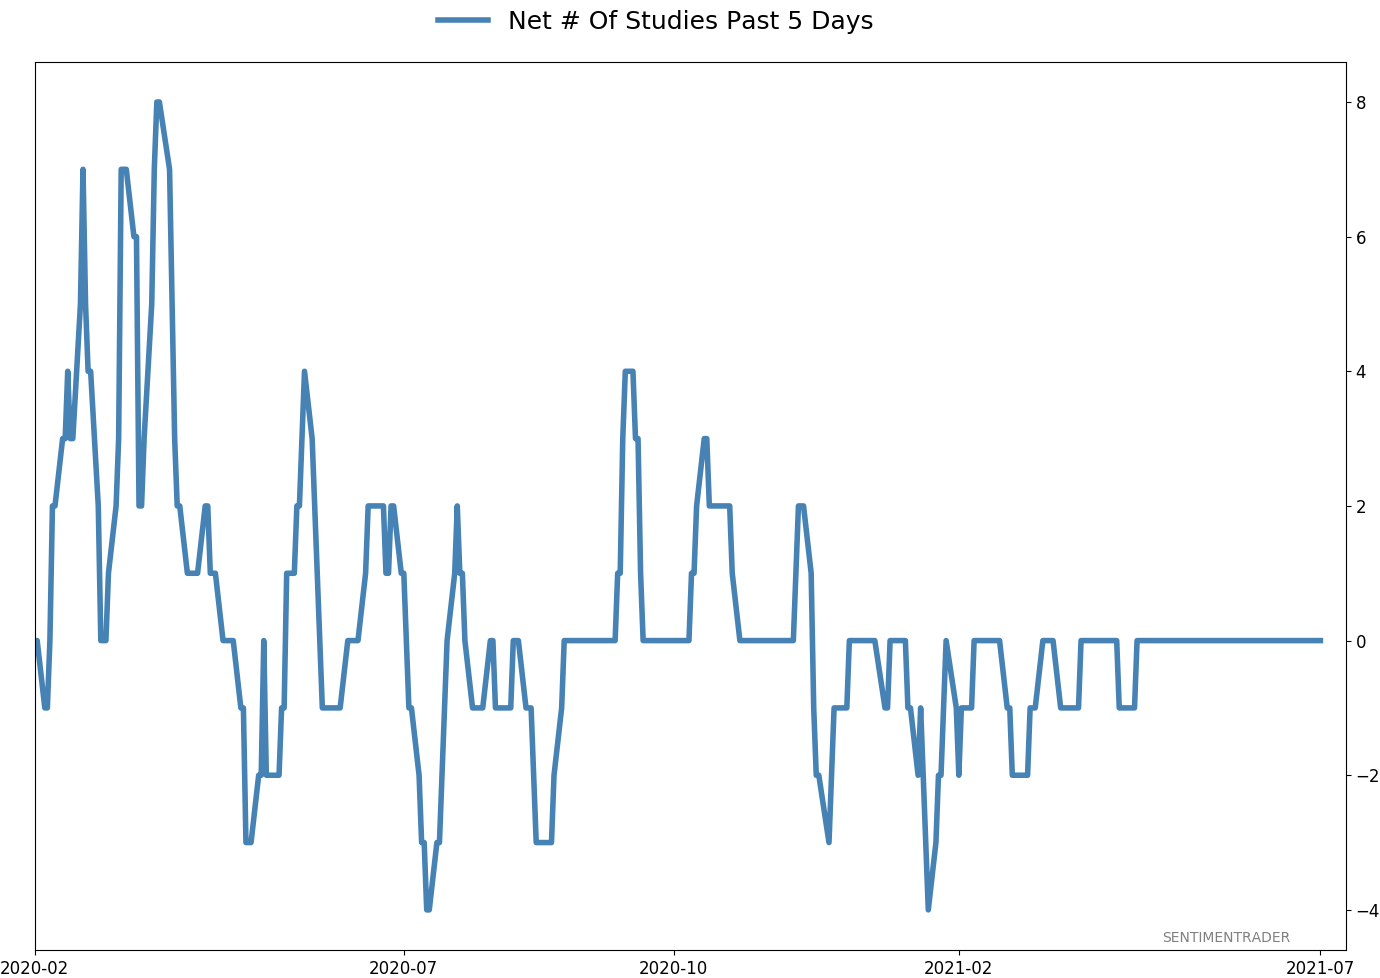
The Risk-On / Risk-Off Indicator looks at more than 20 indicators and calculates the percentage displaying risk-on or risk-off behavior. You can see them individually by going to Spotlights > Spotlight on Sentiment. The two other times that the indicator tipped into risk-off territory over the past year, buying pressure came in immediately. Last week was the first time that didn't happen.
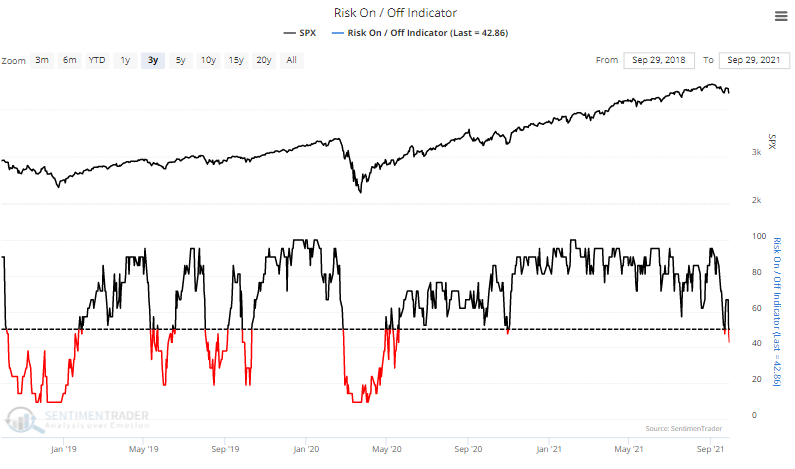
That ended the longest streak of the Risk-On / Risk-Off Indicator above 50% on consecutive days.
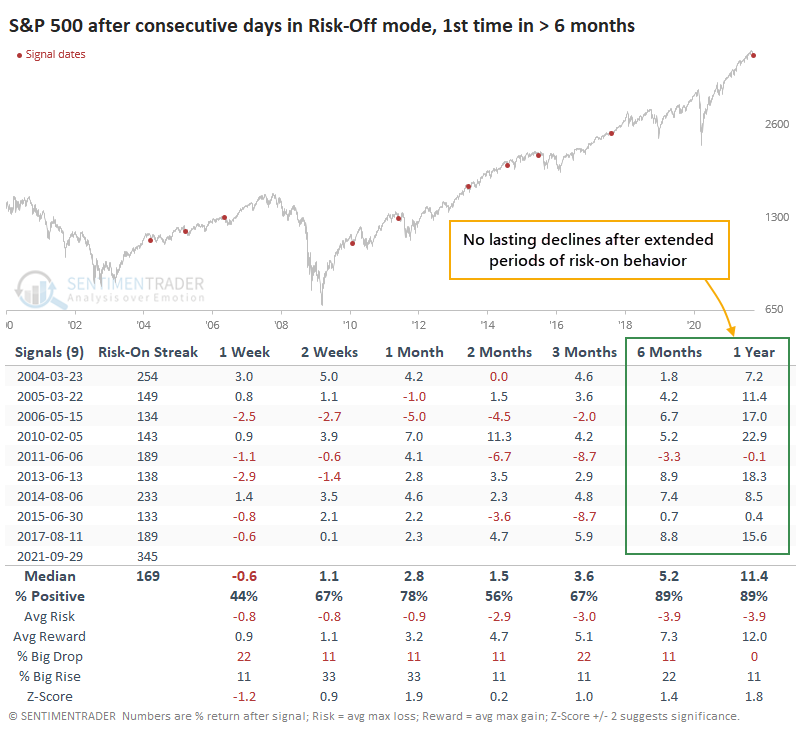
After other long streaks of risk-on behavior finally ended, it didn't prove to be a negative sign for stocks. As we repeat often, momentum (and optimistic behavior) does not die easily. While the S&P 500 suffered some short-term volatility, it consistently rebounded in the months ahead. Over the next 6-12 months, there was only a single slight loss.
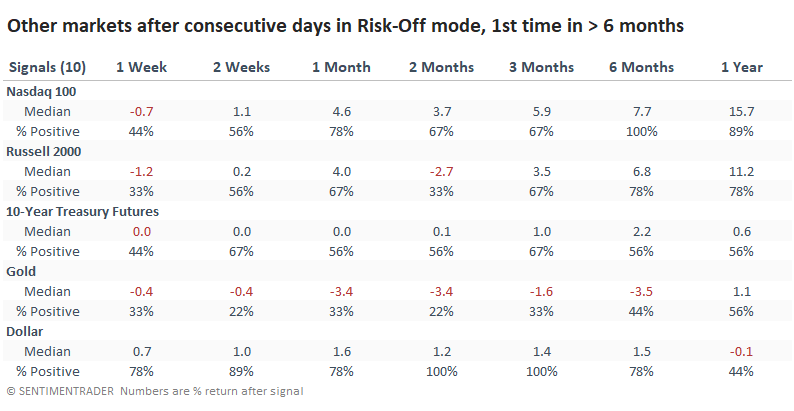
There was a consistent return of risk appetite among other markets. The Nasdaq 100 showed the best returns, with investors shunning gold.
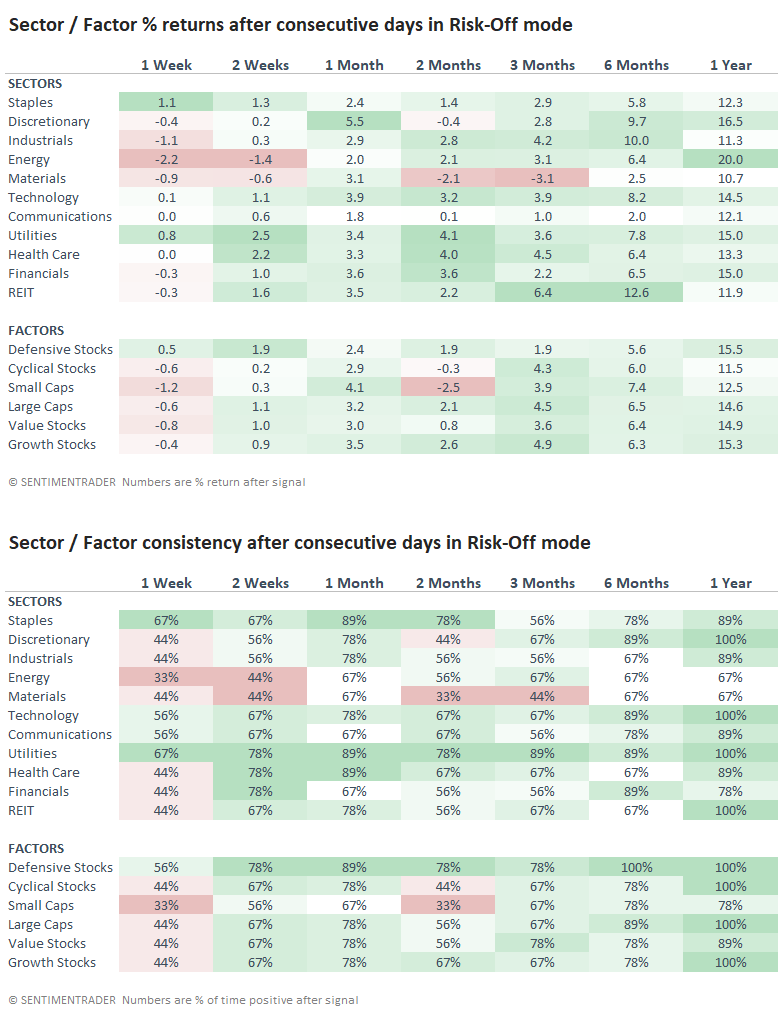
It's not cut-and-dried, but among sectors and factors, we can also see some similar behavior. The biggest standout was small-cap stocks, which did not react well in the first couple of months.
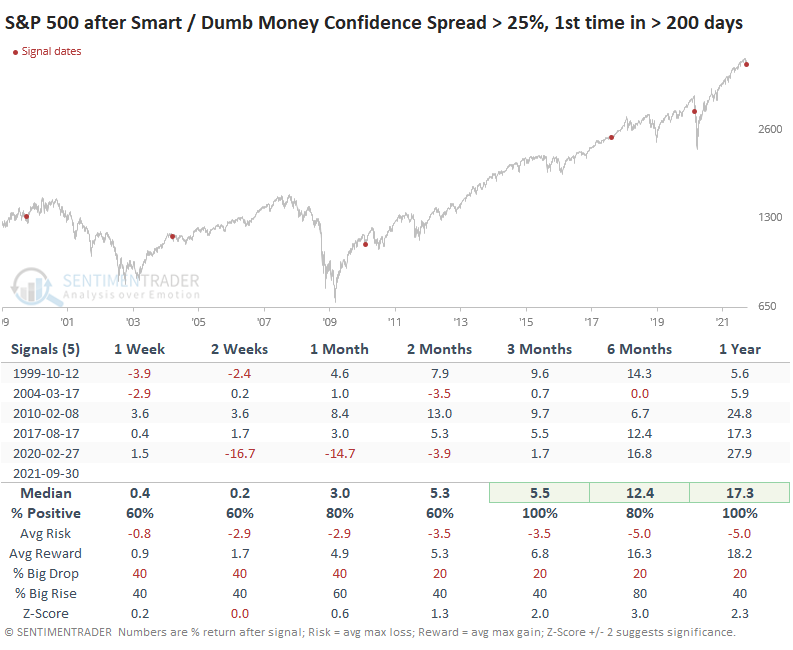
Composite sentiment indicators tend to mirror one other, so it's not a big surprise that others are showing similar behavior. The spread between Smart Money and Dumb Money Confidence has now crossed above +25% for the first time in 17 months. The spread will rise as "smart money" indicators show rising confidence in a rally combined with declining "dumb money" indicators showing reduced confidence.
As a reminder, smart money indicators, almost by definition, will fight a trend because they have underlying exposure and use markets to hedge. Dumb money indicators will follow a trend and will be correct most of the time. They get their monikers because the smart money tends to be most long near bottoms and most net short near peaks; dumb money indicators show the opposite tendencies.
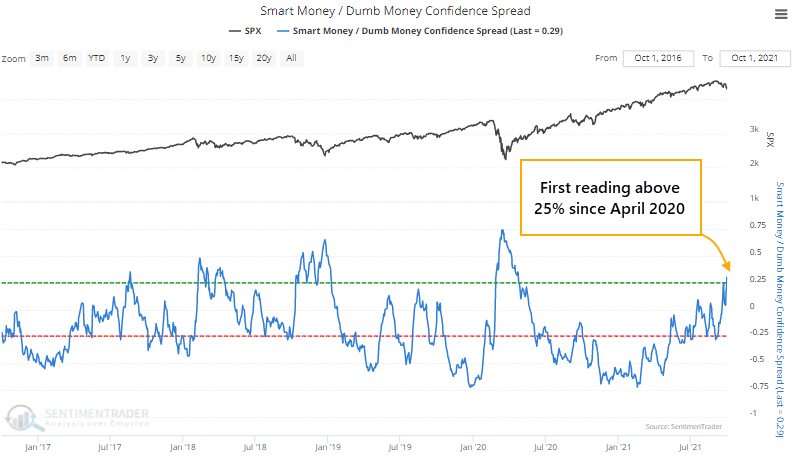
That ends the longest streak below 25% since we began calculating this near the end of 1998. The only time investors went longer without even a hint of pessimism was the one that ended in August 2017.
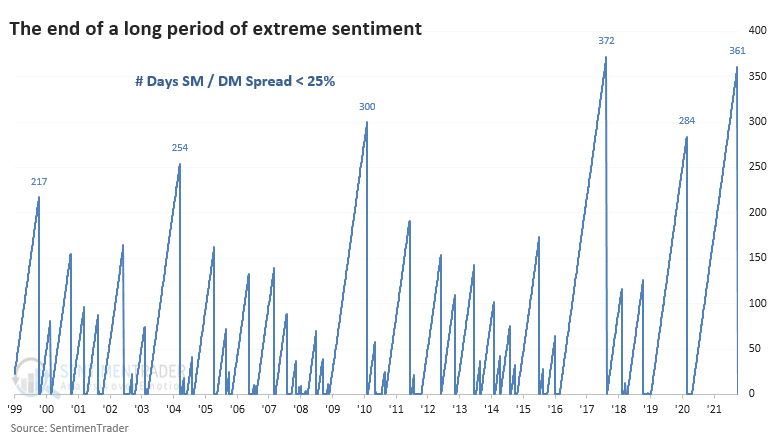
After investors showed their first bit of pessimism that August, stocks immediately turned, and buyers rushed in with full force. Within a couple of months, the S&P had rallied more than 5%, and stocks enjoyed a spectacular run into a blow-off peak in January 2018.
The only real failure here was the pandemic. Investors had been supremely confident for over a year heading into February 2020, and the initial selloff as traders braced for contagion was just that - initial. Stocks continued to plunge over the next month before staging one of the most furious rebounds in history.
The most benchmarked index in the world ended a couple of historic streaks of price momentum last week, driven by a historic run of confidence among traders and investors in U.S. stocks. That kind of event tends to bring out the boo-birds, who suggest that now, finally, stocks will crash and investors will get their due. With retail investors dominating markets right now, specifically in the options markets, and those investors most likely to panic-sell, a quick retreat makes a ton of sense.
There is no doubt that the environment seems scary for a contrarian, with bouts of wild speculation, record valuations, and loose credit. They are the kindling that sparks many quick and painful selloffs. But there are many differences with other bear market setups, as well, making this one of the most confusing and contradicting environments we've possibly ever witnessed.
Based on the streaks we looked at last week and tables above, we're more inclined to give bulls the continued benefit of the doubt until they proved themselves unworthy.
Active Studies
| Time Frame | Bullish | Bearish | | Short-Term | 0 | 6 | | Medium-Term | 9 | 3 | | Long-Term | 11 | 5 |
|
Indicators at Extremes
Portfolio
| Position | Description | Weight % | Added / Reduced | Date | | Stocks | RSP | 10.5 | Added 6.4% | 2021-10-01 | | Bonds | 23.9% BND, 6.9% SCHP | 31.5 | Reduced 7.1% | 2021-05-19 | | Commodities | GCC | 2.6 | Reduced 2.1%
| 2020-09-04 | | Precious Metals | GDX | 4.2 | Reduced 4.2% | 2021-05-19 | | Special Situations | 9.8% KWEB, 4.7% XLE, 2.9% PSCE | 17.3 | Added 9.78% | 2021-10-01 | | Cash | | 34.0 | | |
|
Updates (Changes made today are underlined)
Much of our momentum and trend work has remained positive for several months, with some scattered exceptions. Almost all sentiment-related work has shown a poor risk/reward ratio for stocks, especially as speculation drove to record highs in exuberance in February. Much of that has worn off, and most of our models are back toward neutral levels. There isn't much to be excited about here. The same goes for bonds and even gold. Gold has been performing well lately and is back above long-term trend lines. The issue is that it has a poor record of holding onto gains when attempting a long-term trend change like this, so we'll take a wait-and-see approach. Momentum has ebbed quickly in recent weeks, and nearing oversold levels in some indicators. This can be a dangerous area, with a lot of short-term volatility, but we'd be more inclined to add medium- to long-term exposure rather than sell on much more of a decline, thanks to already rock-bottom exposure. Other areas look more attractive, including some overseas markets. RETURN YTD: 8.6% 2020: 8.1%, 2019: 12.6%, 2018: 0.6%, 2017: 3.8%, 2016: 17.1%, 2015: 9.2%, 2014: 14.5%, 2013: 2.2%, 2012: 10.8%, 2011: 16.5%, 2010: 15.3%, 2009: 23.9%, 2008: 16.2%, 2007: 7.8%
|
|
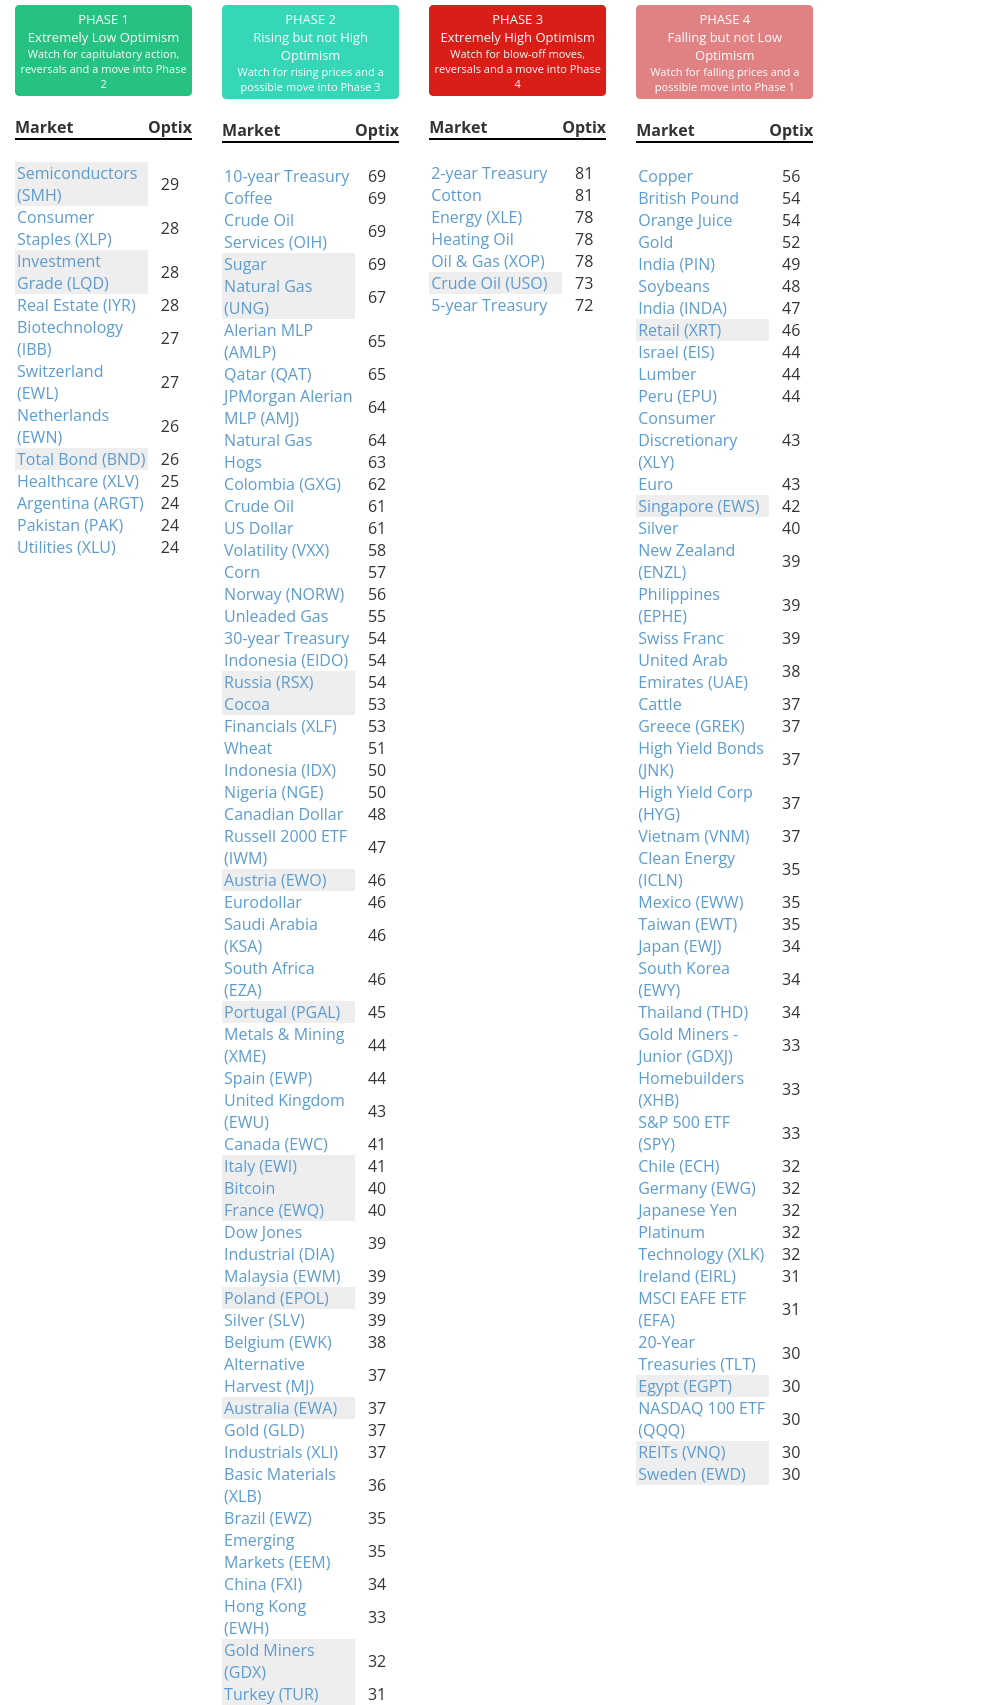
Phase Table
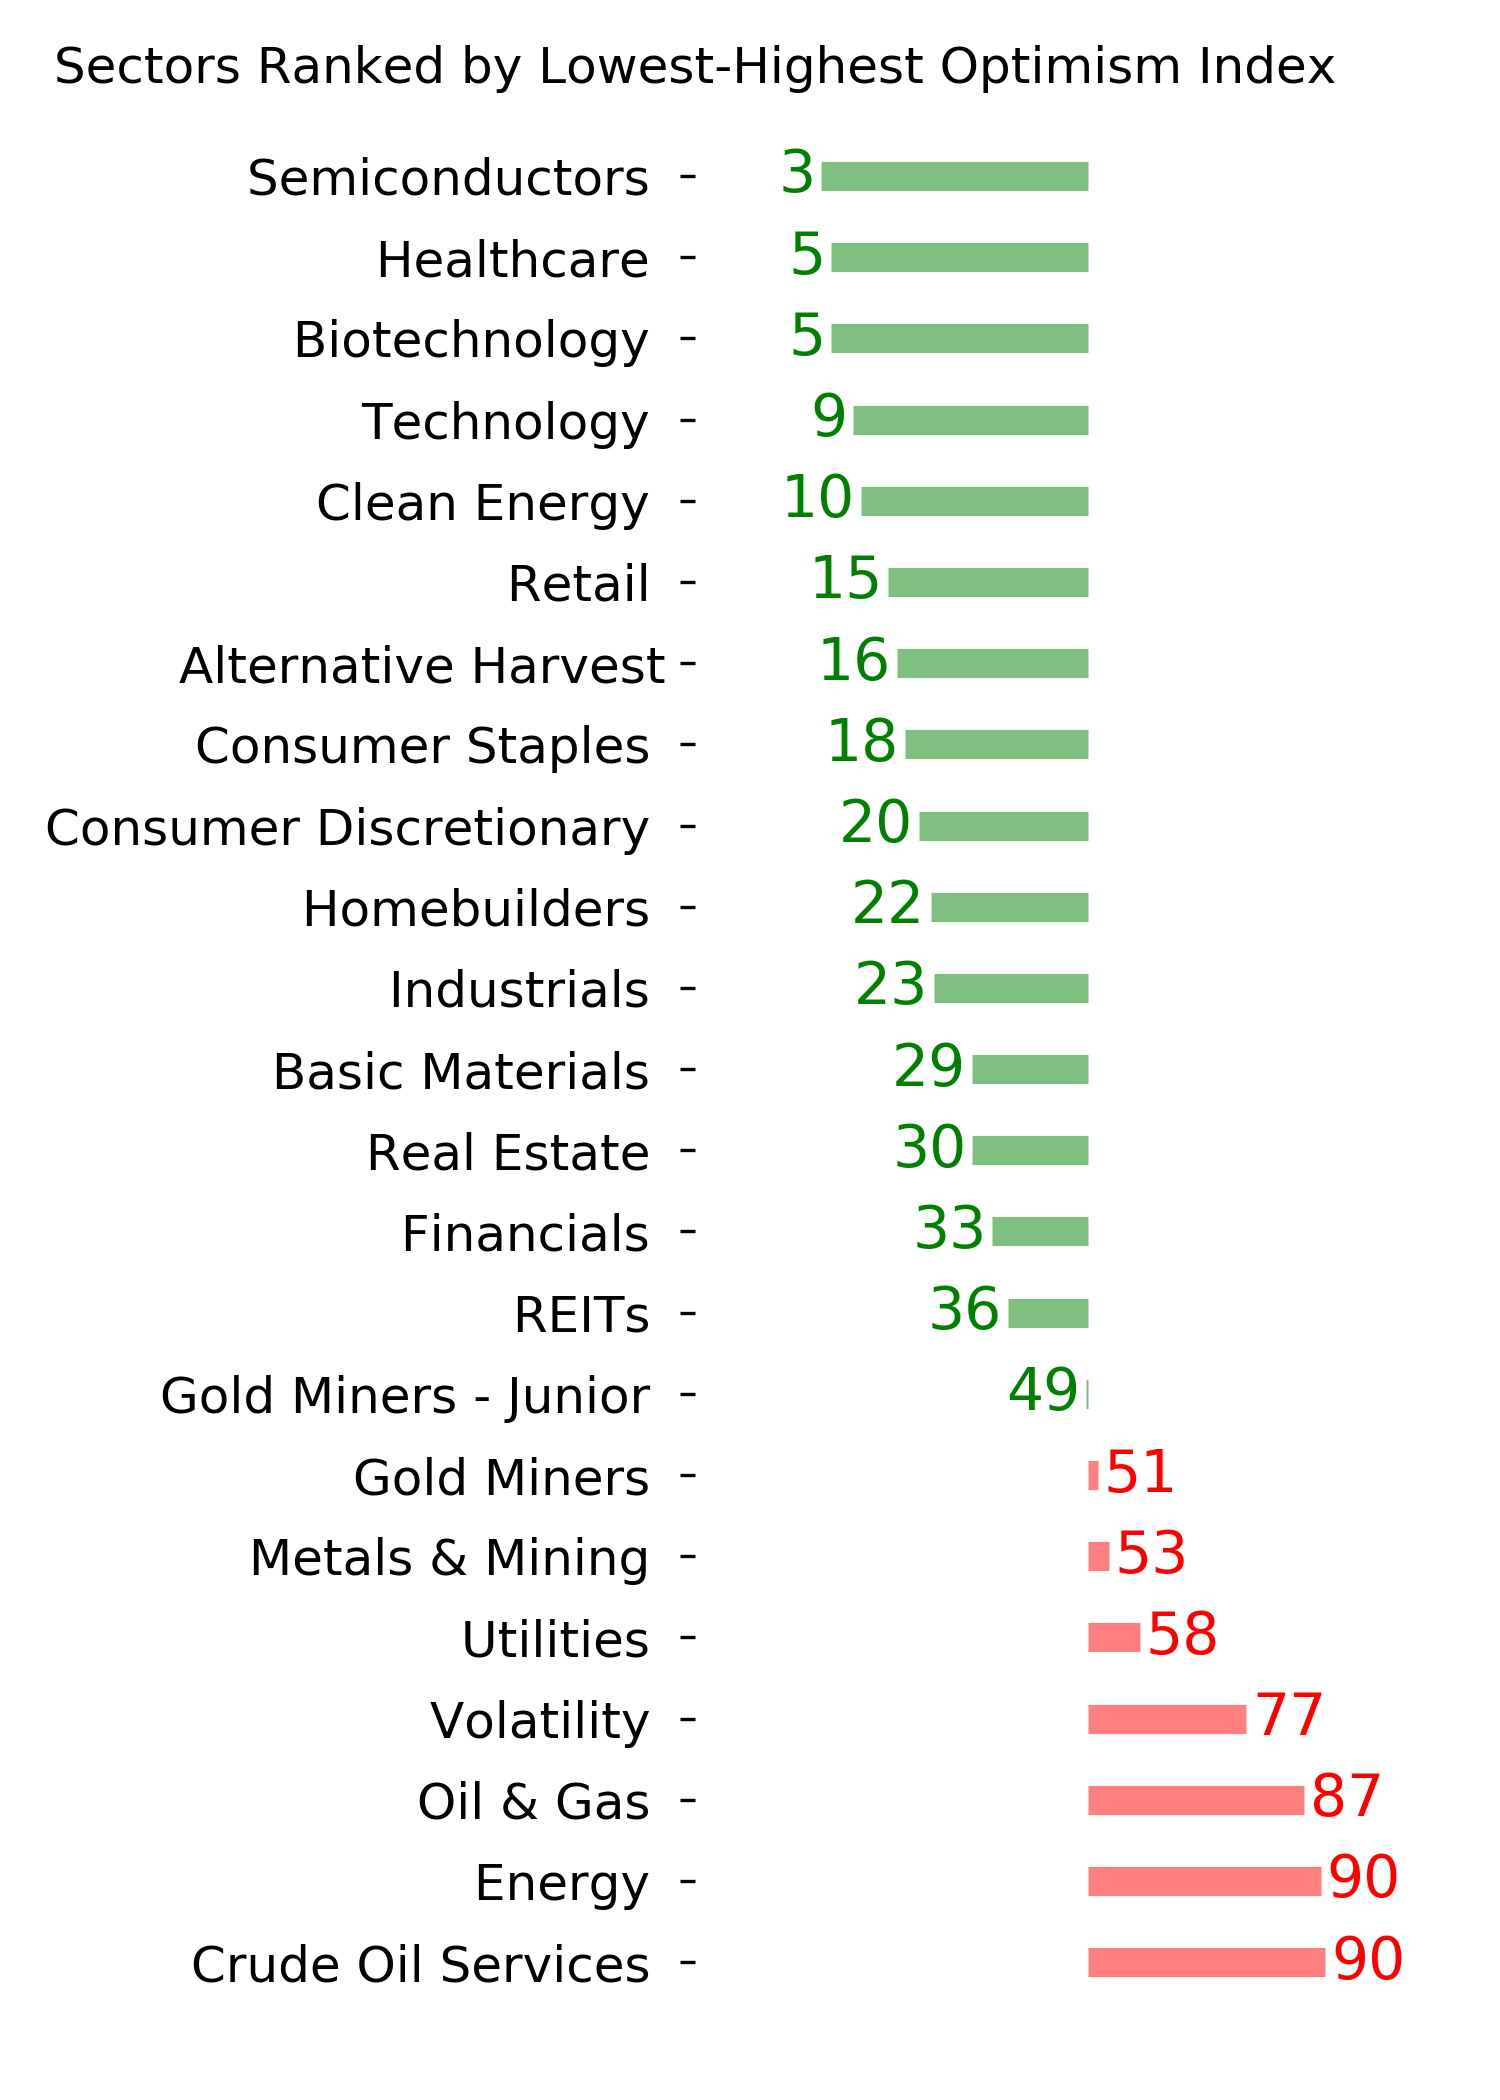
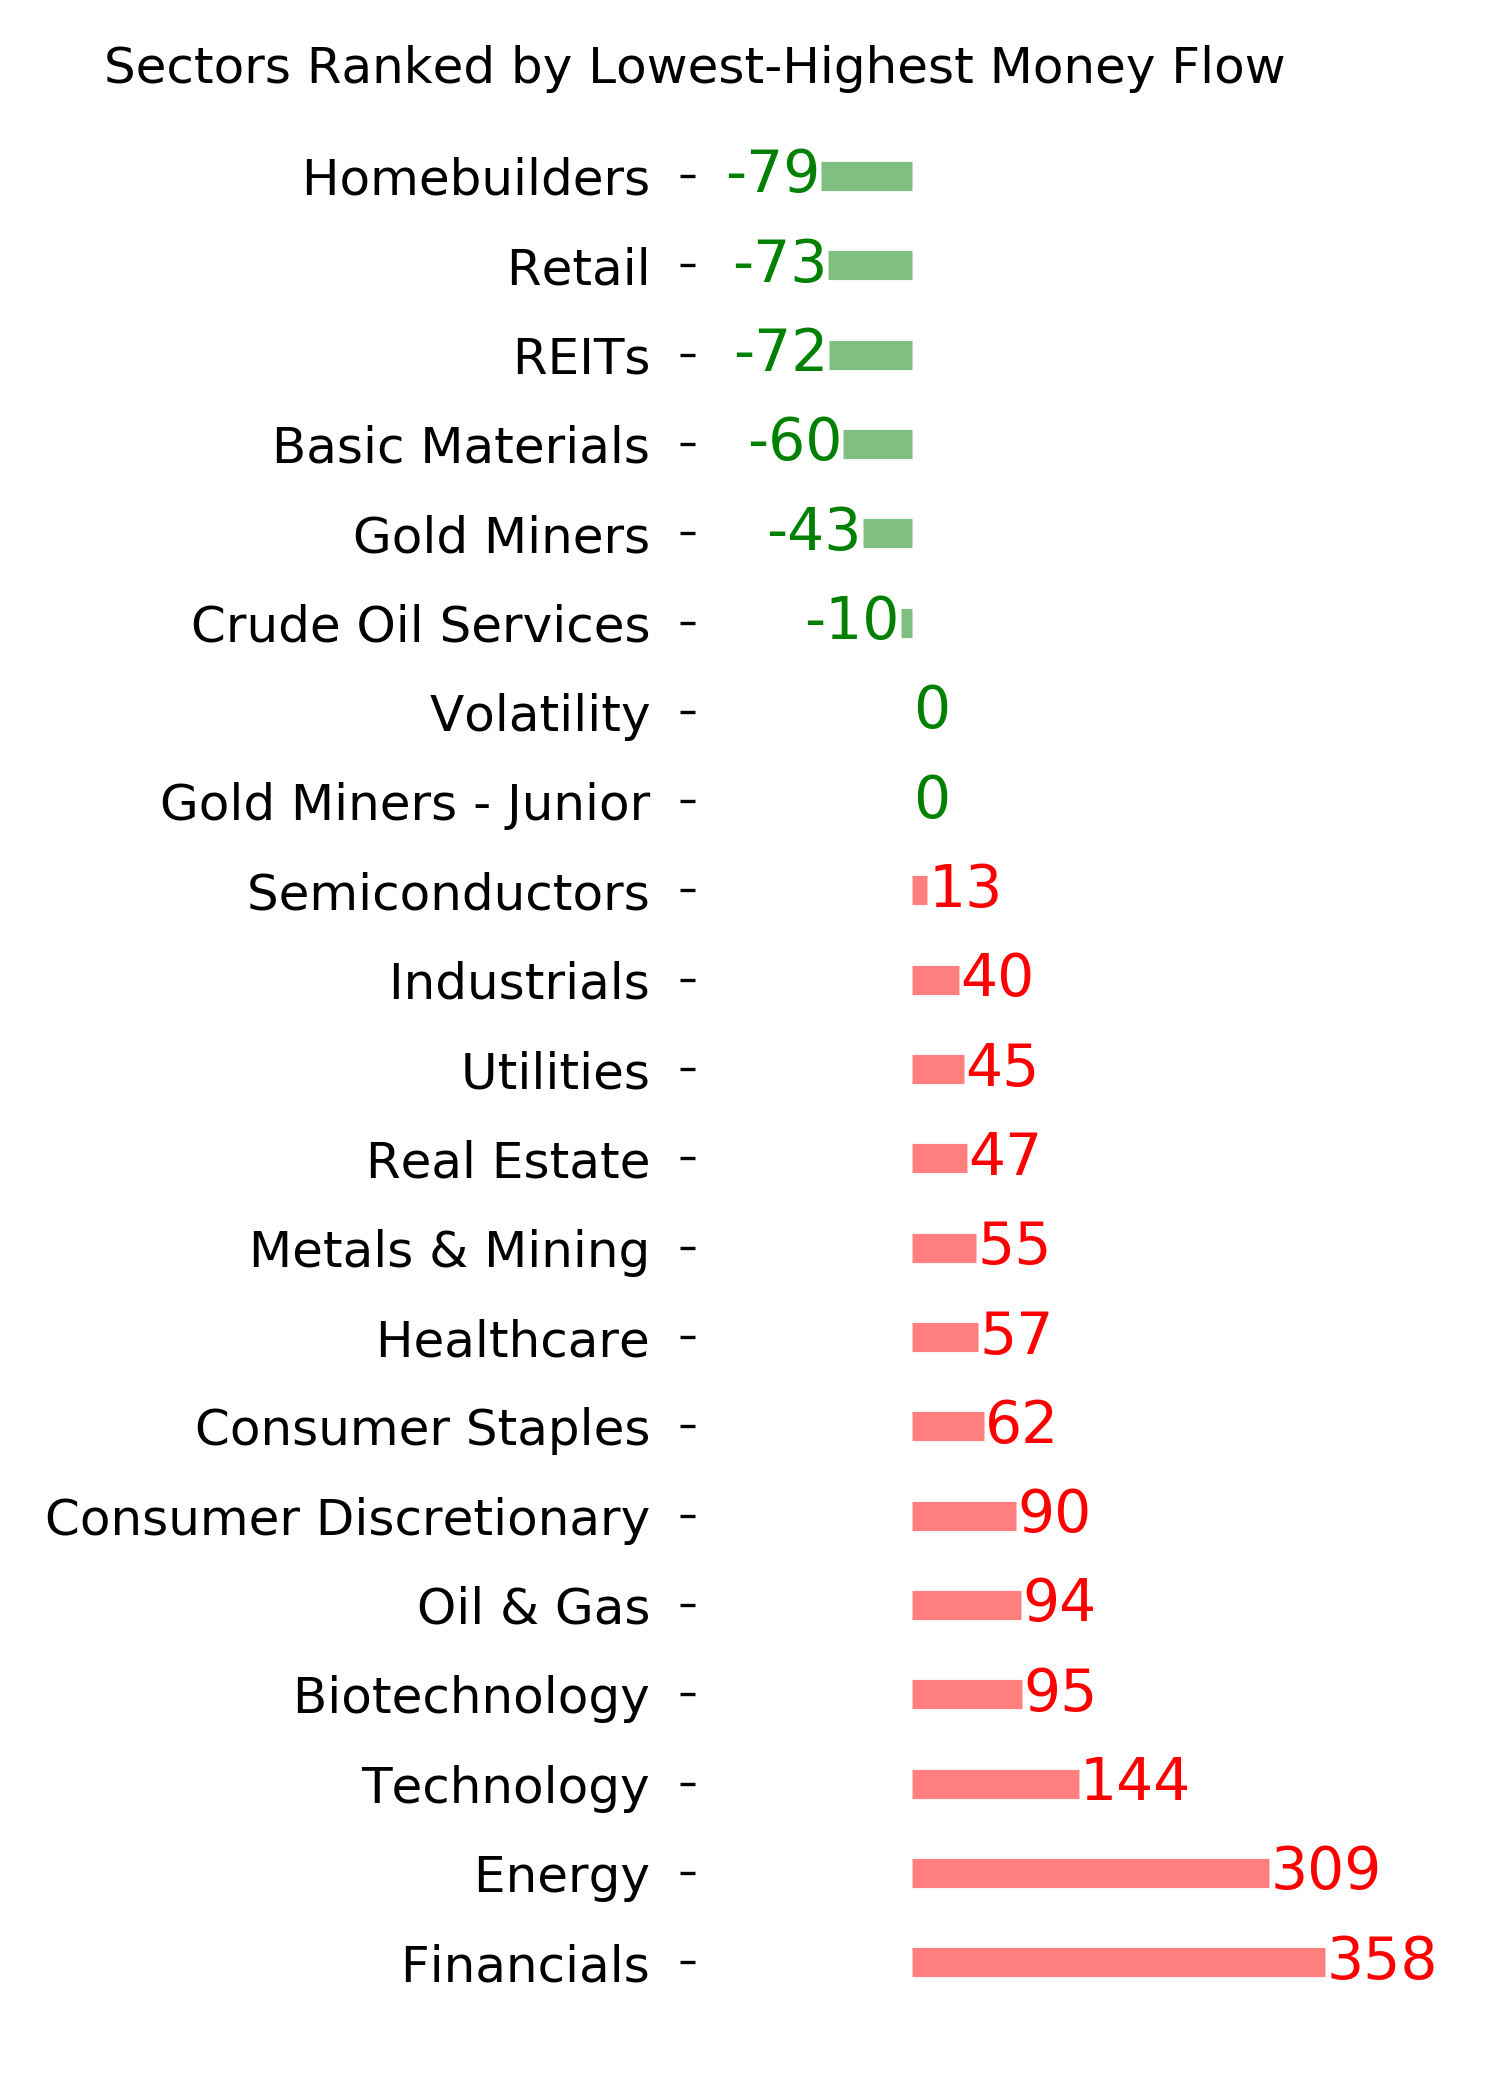
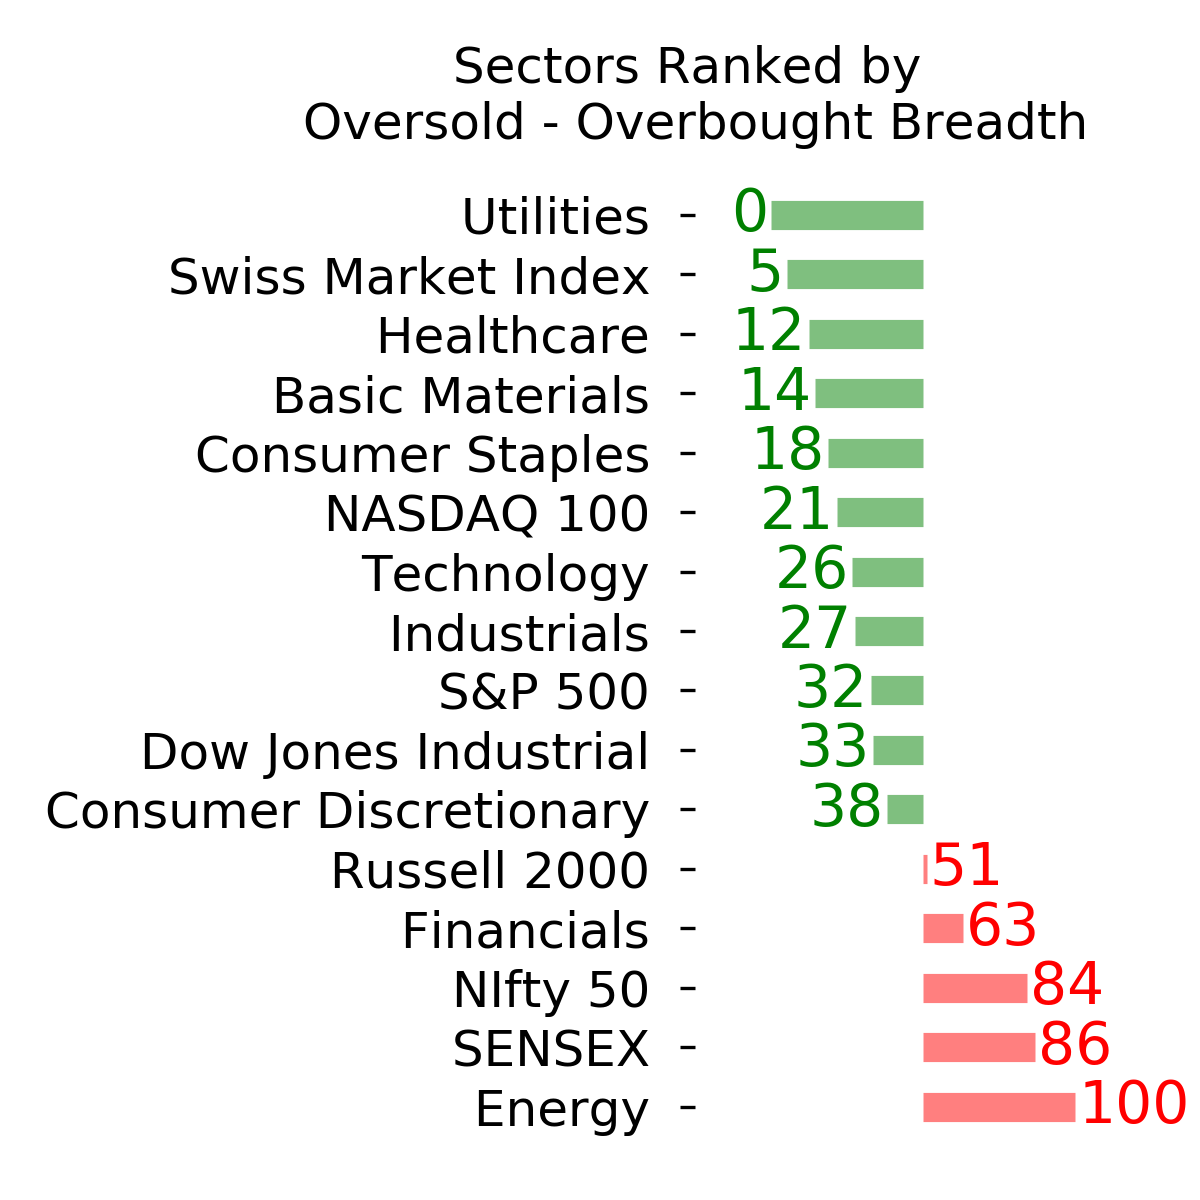
Ranks
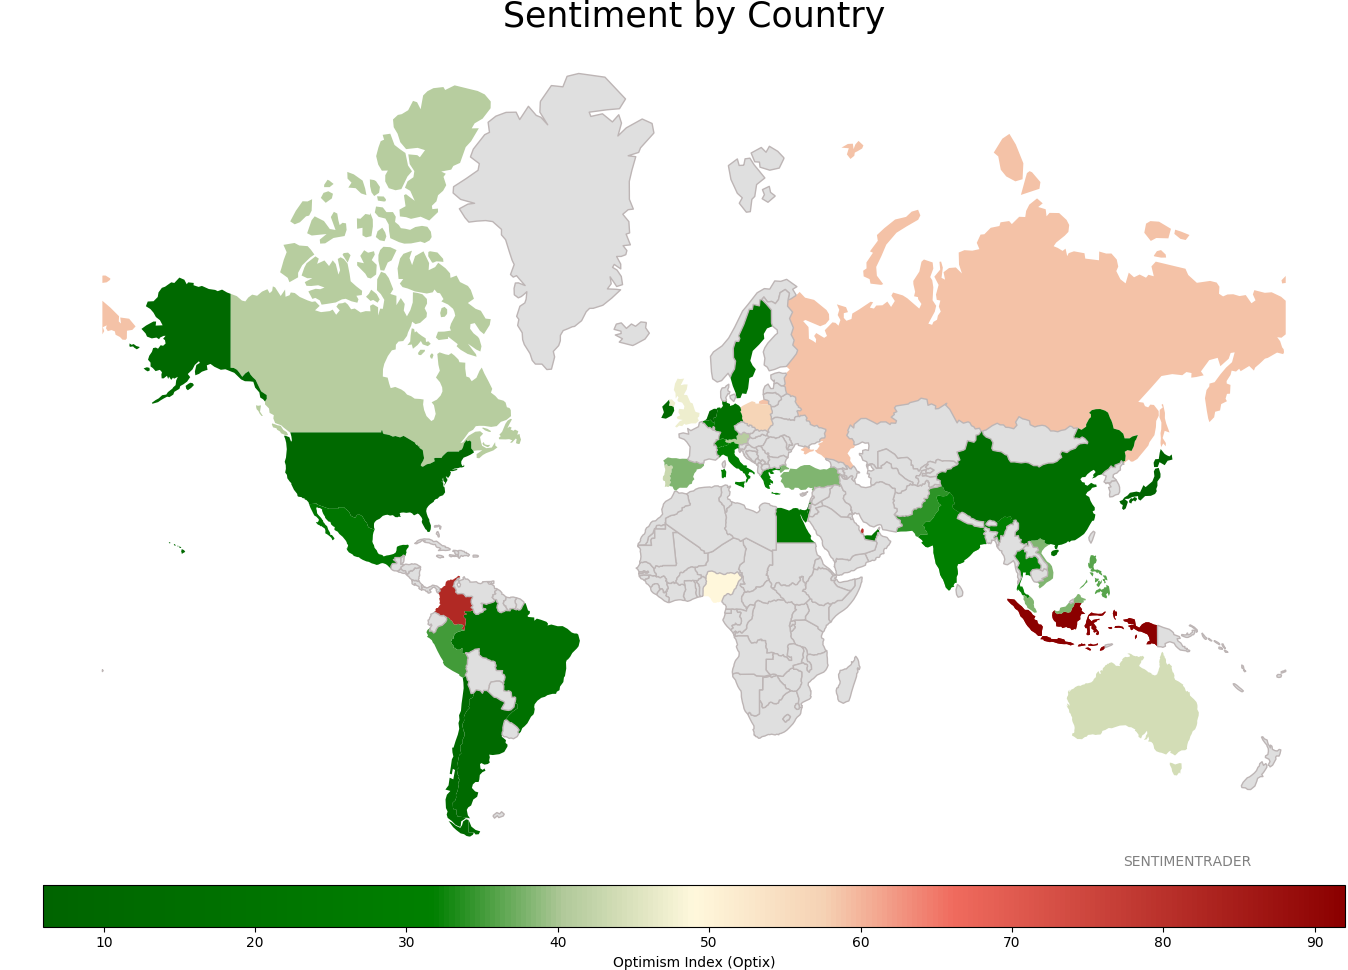
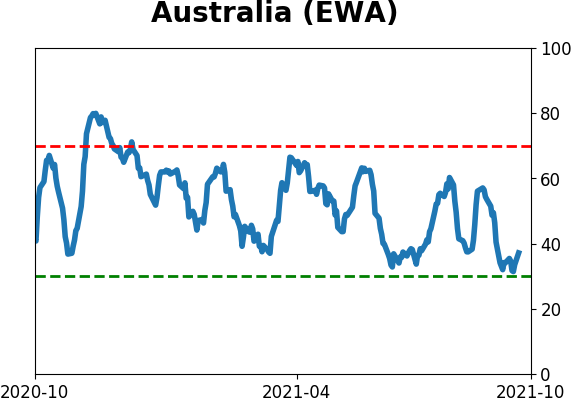
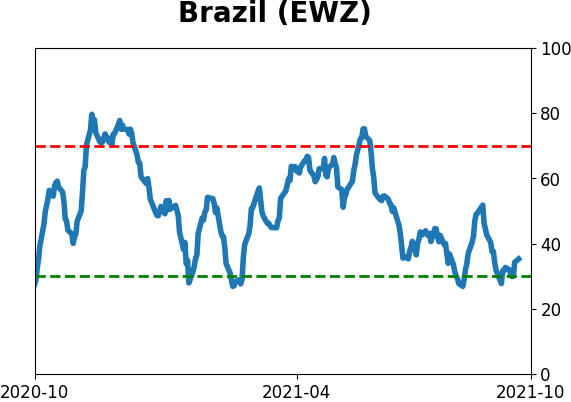
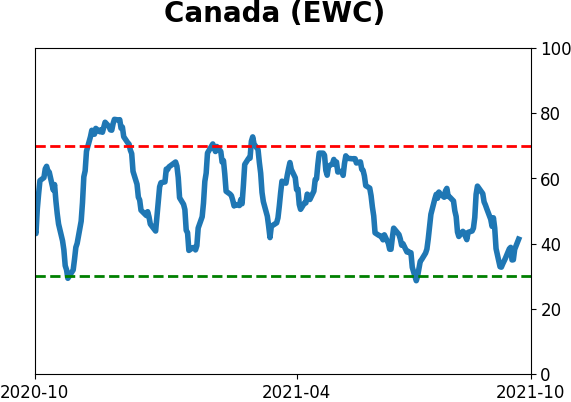
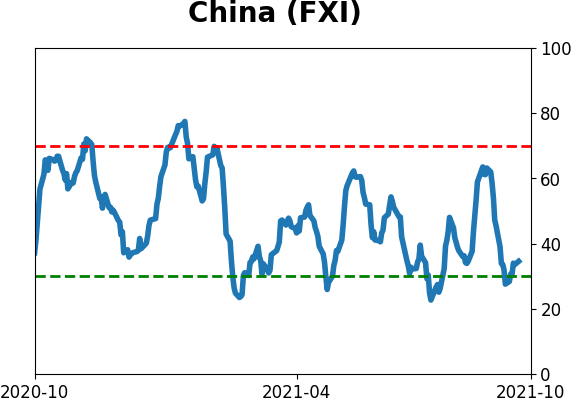
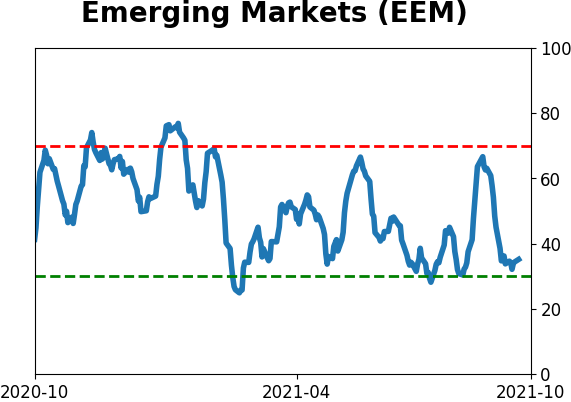
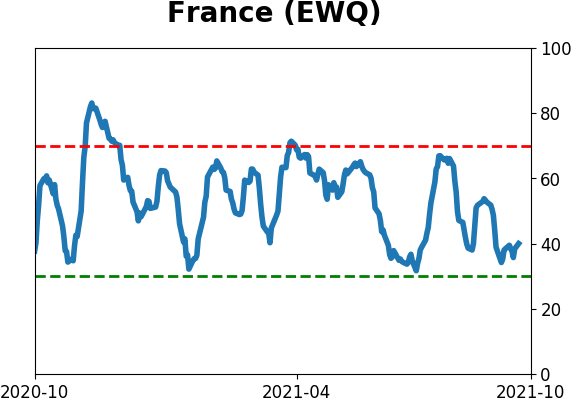
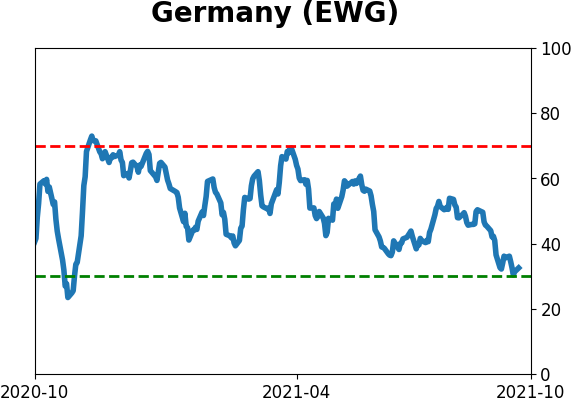
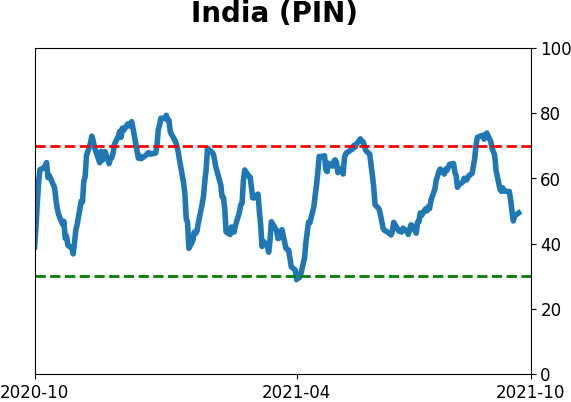
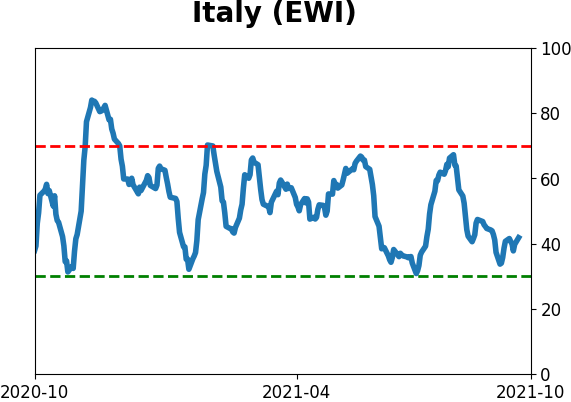
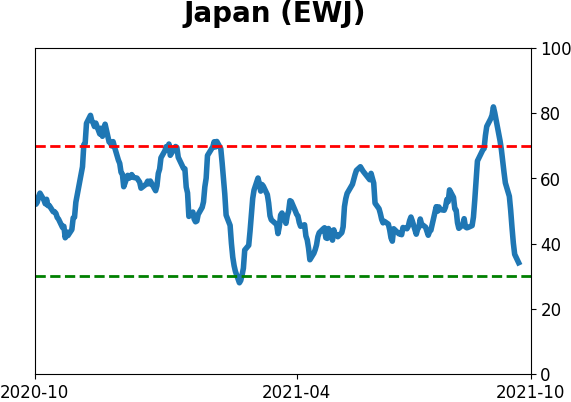
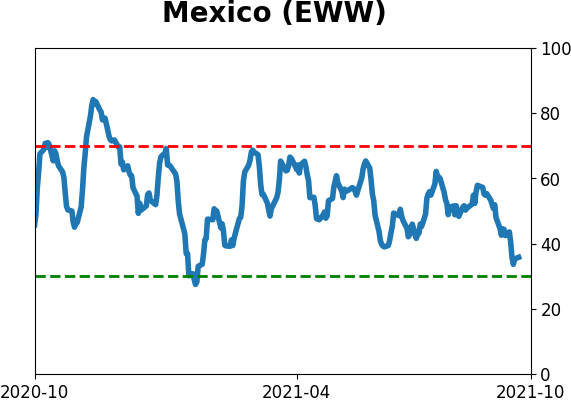
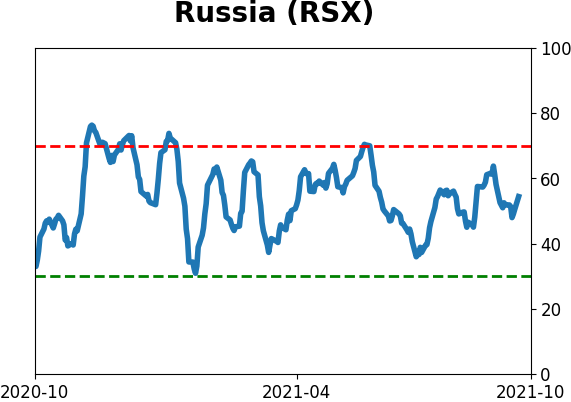
Sentiment Around The World
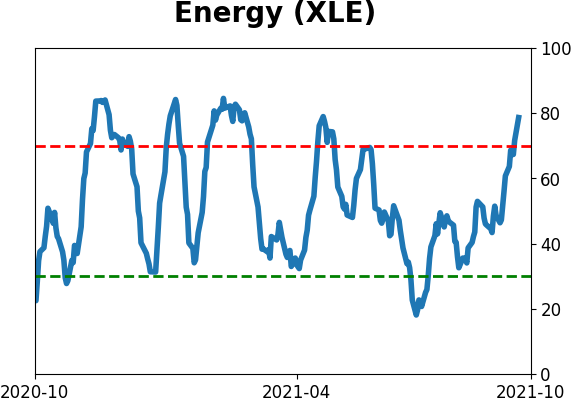
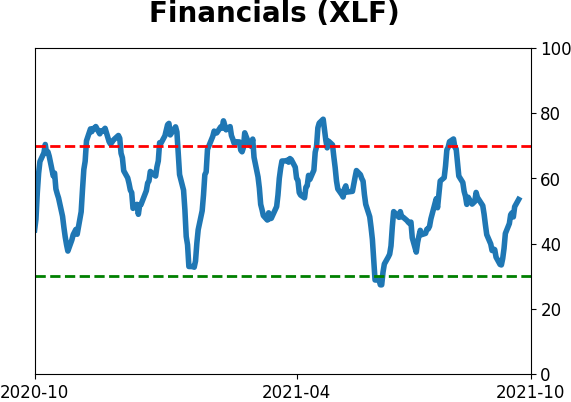
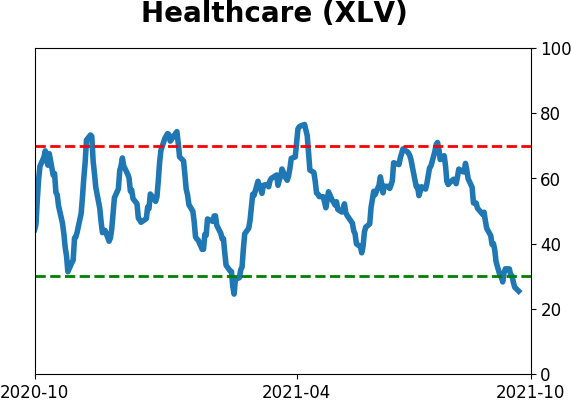
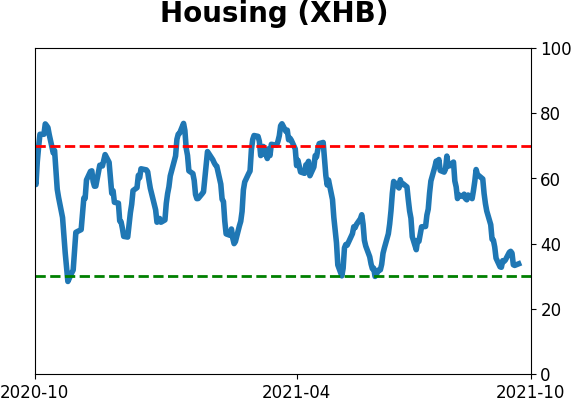
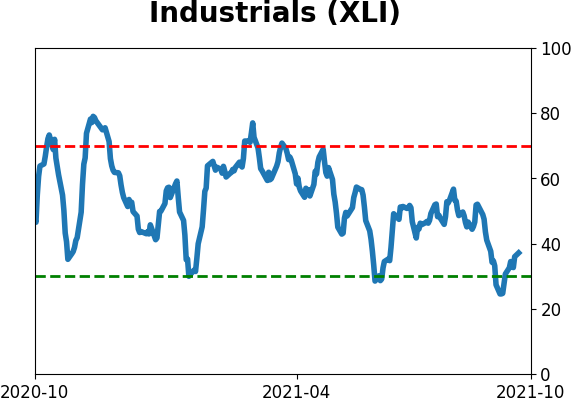
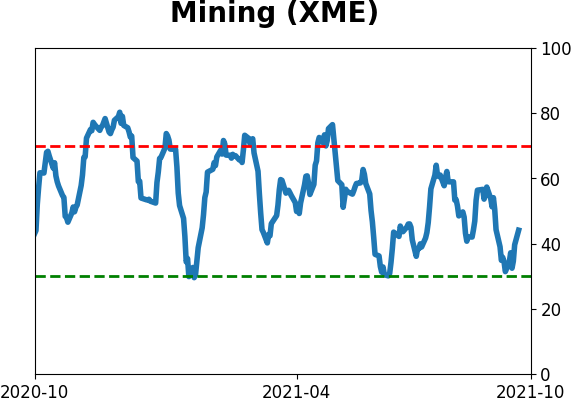
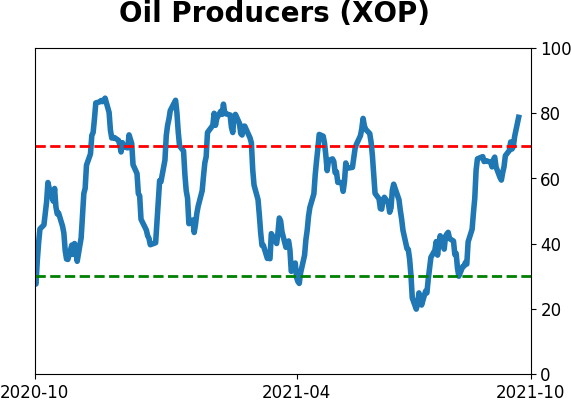
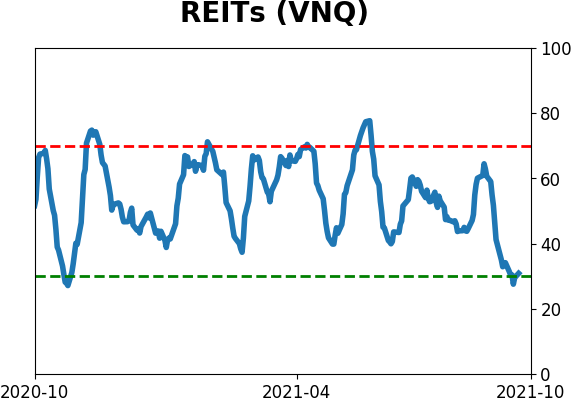
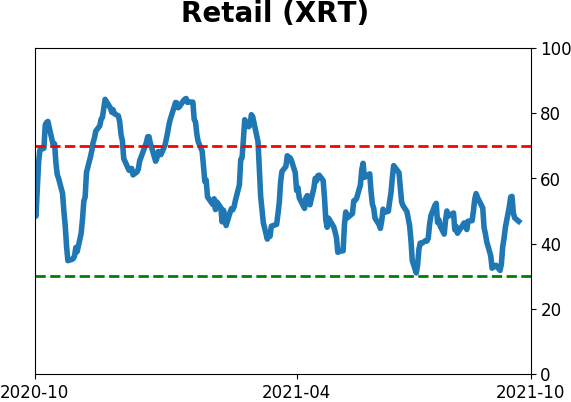
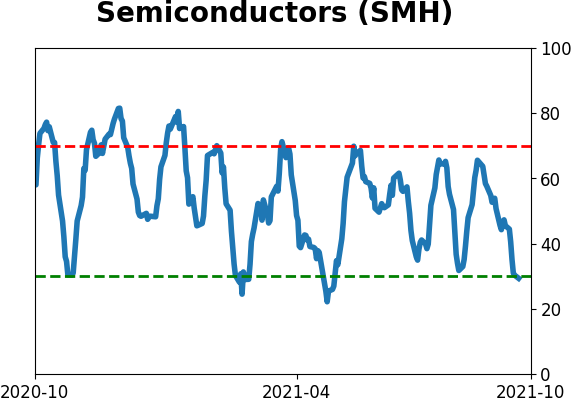
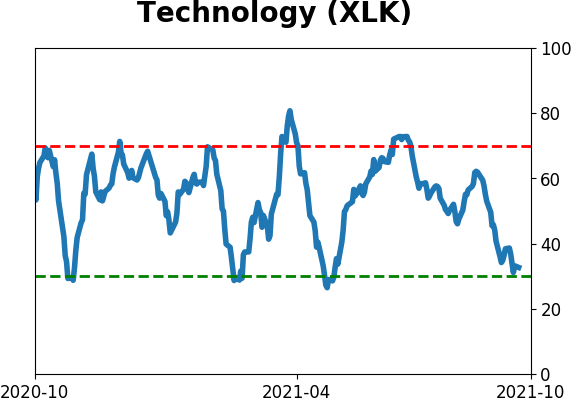
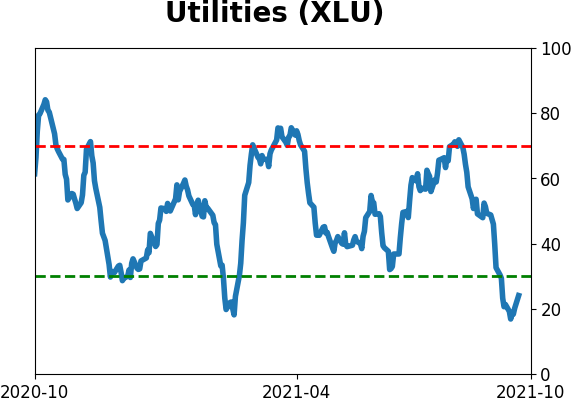
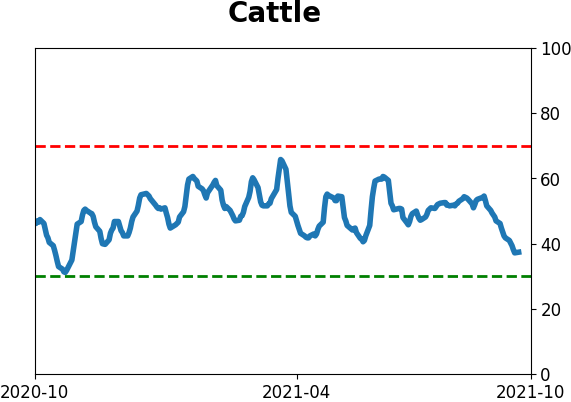
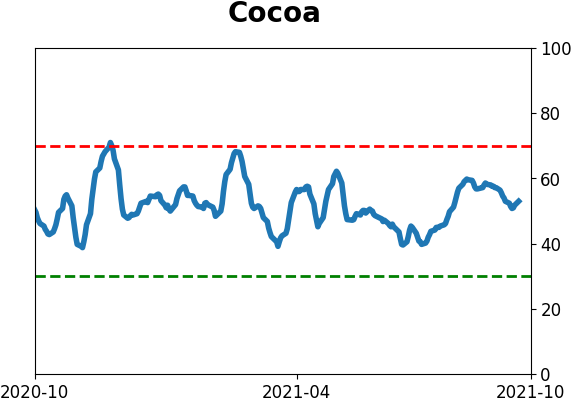
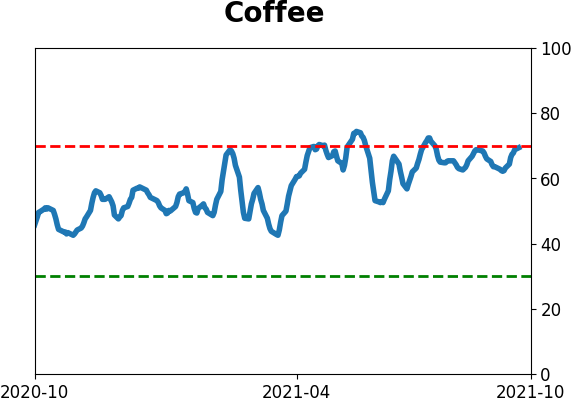
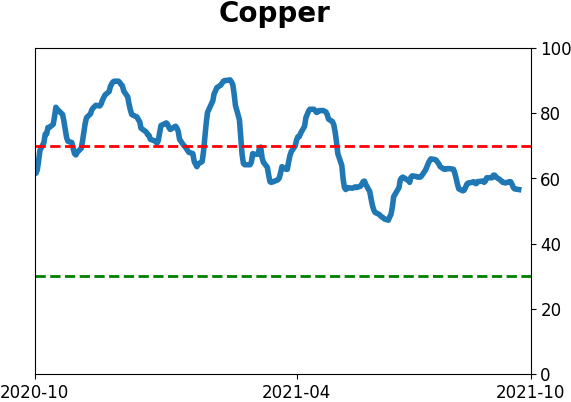
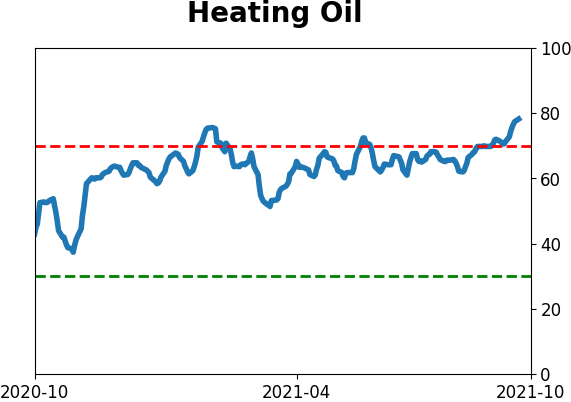
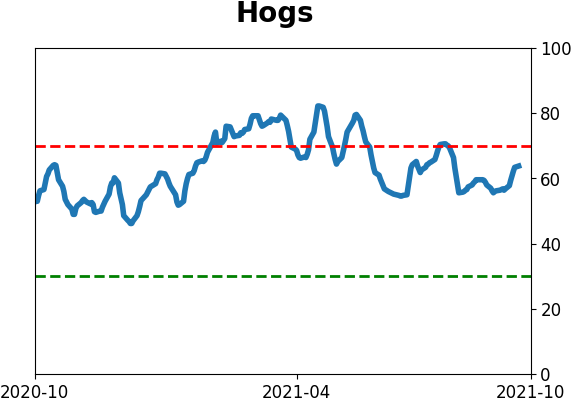
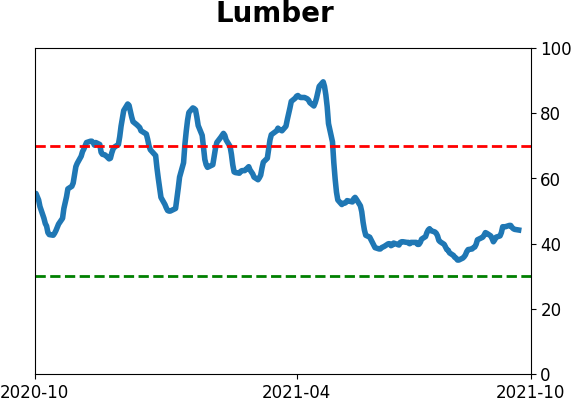
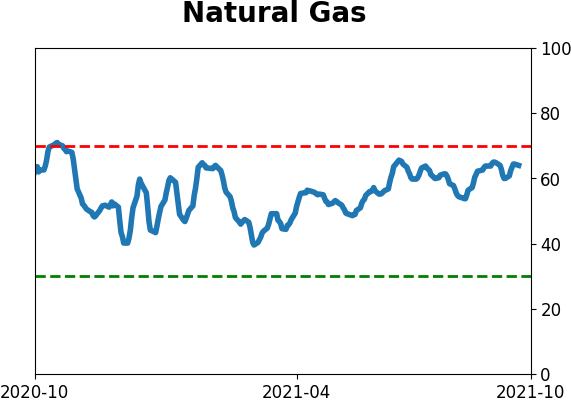
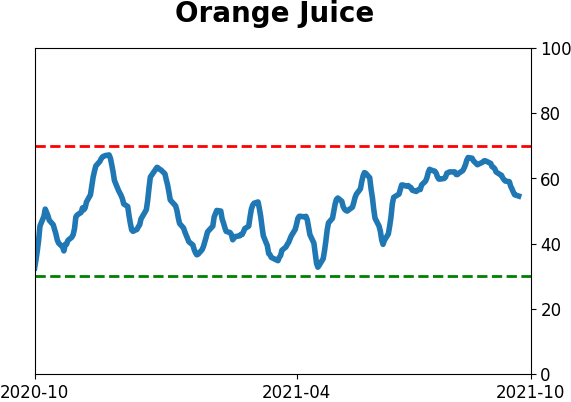
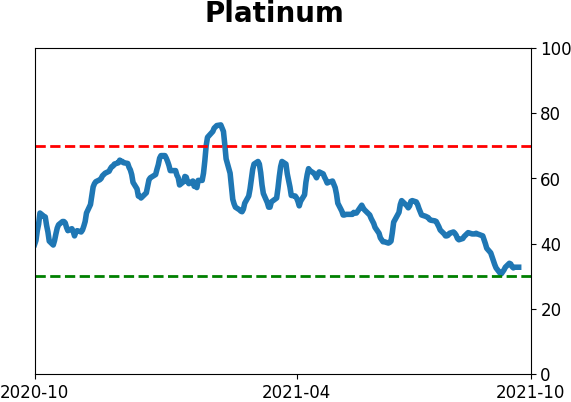
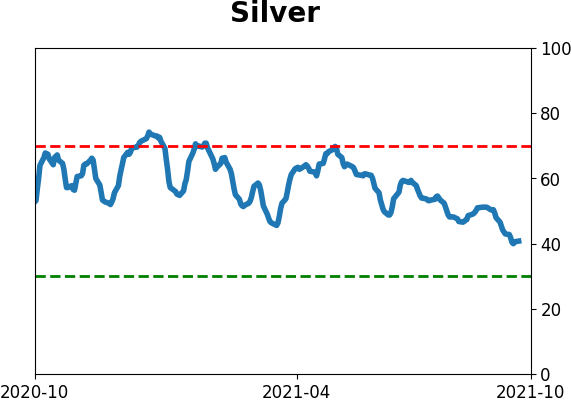
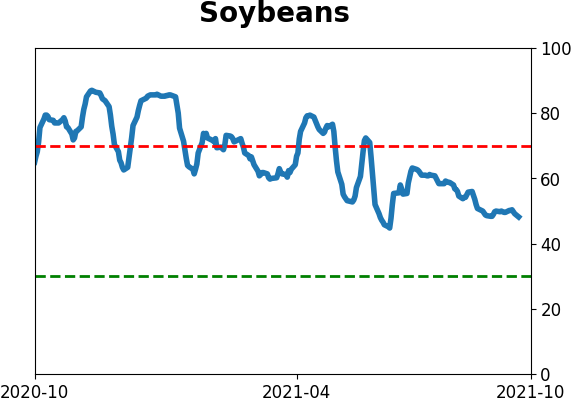
Optimism Index Thumbnails
|
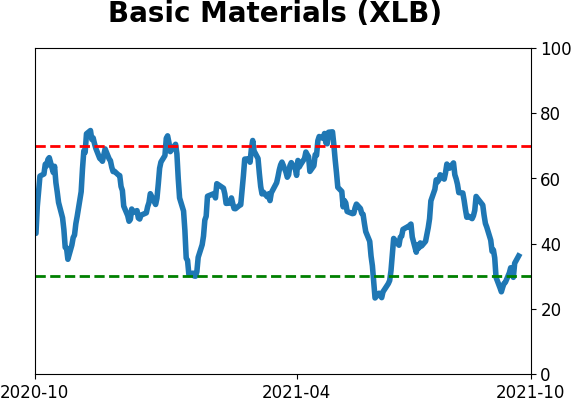
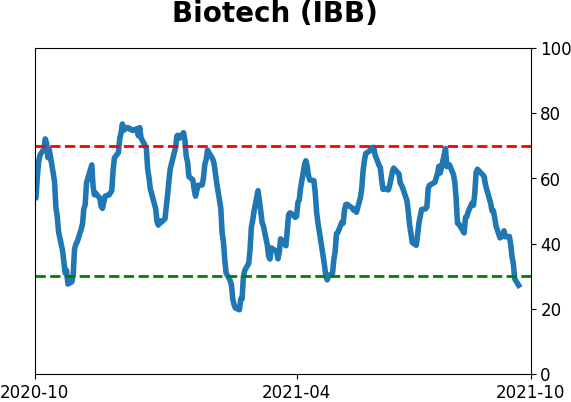
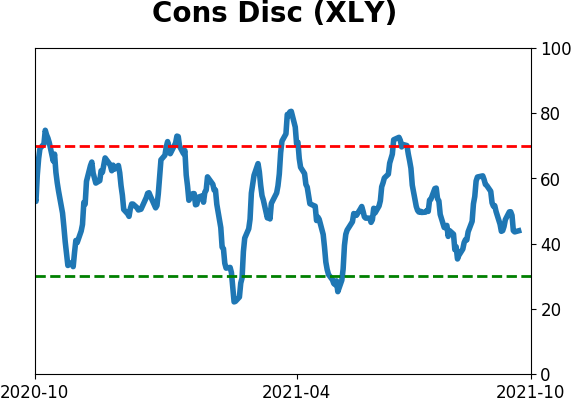
Sector ETF's - 10-Day Moving Average
|
|
|
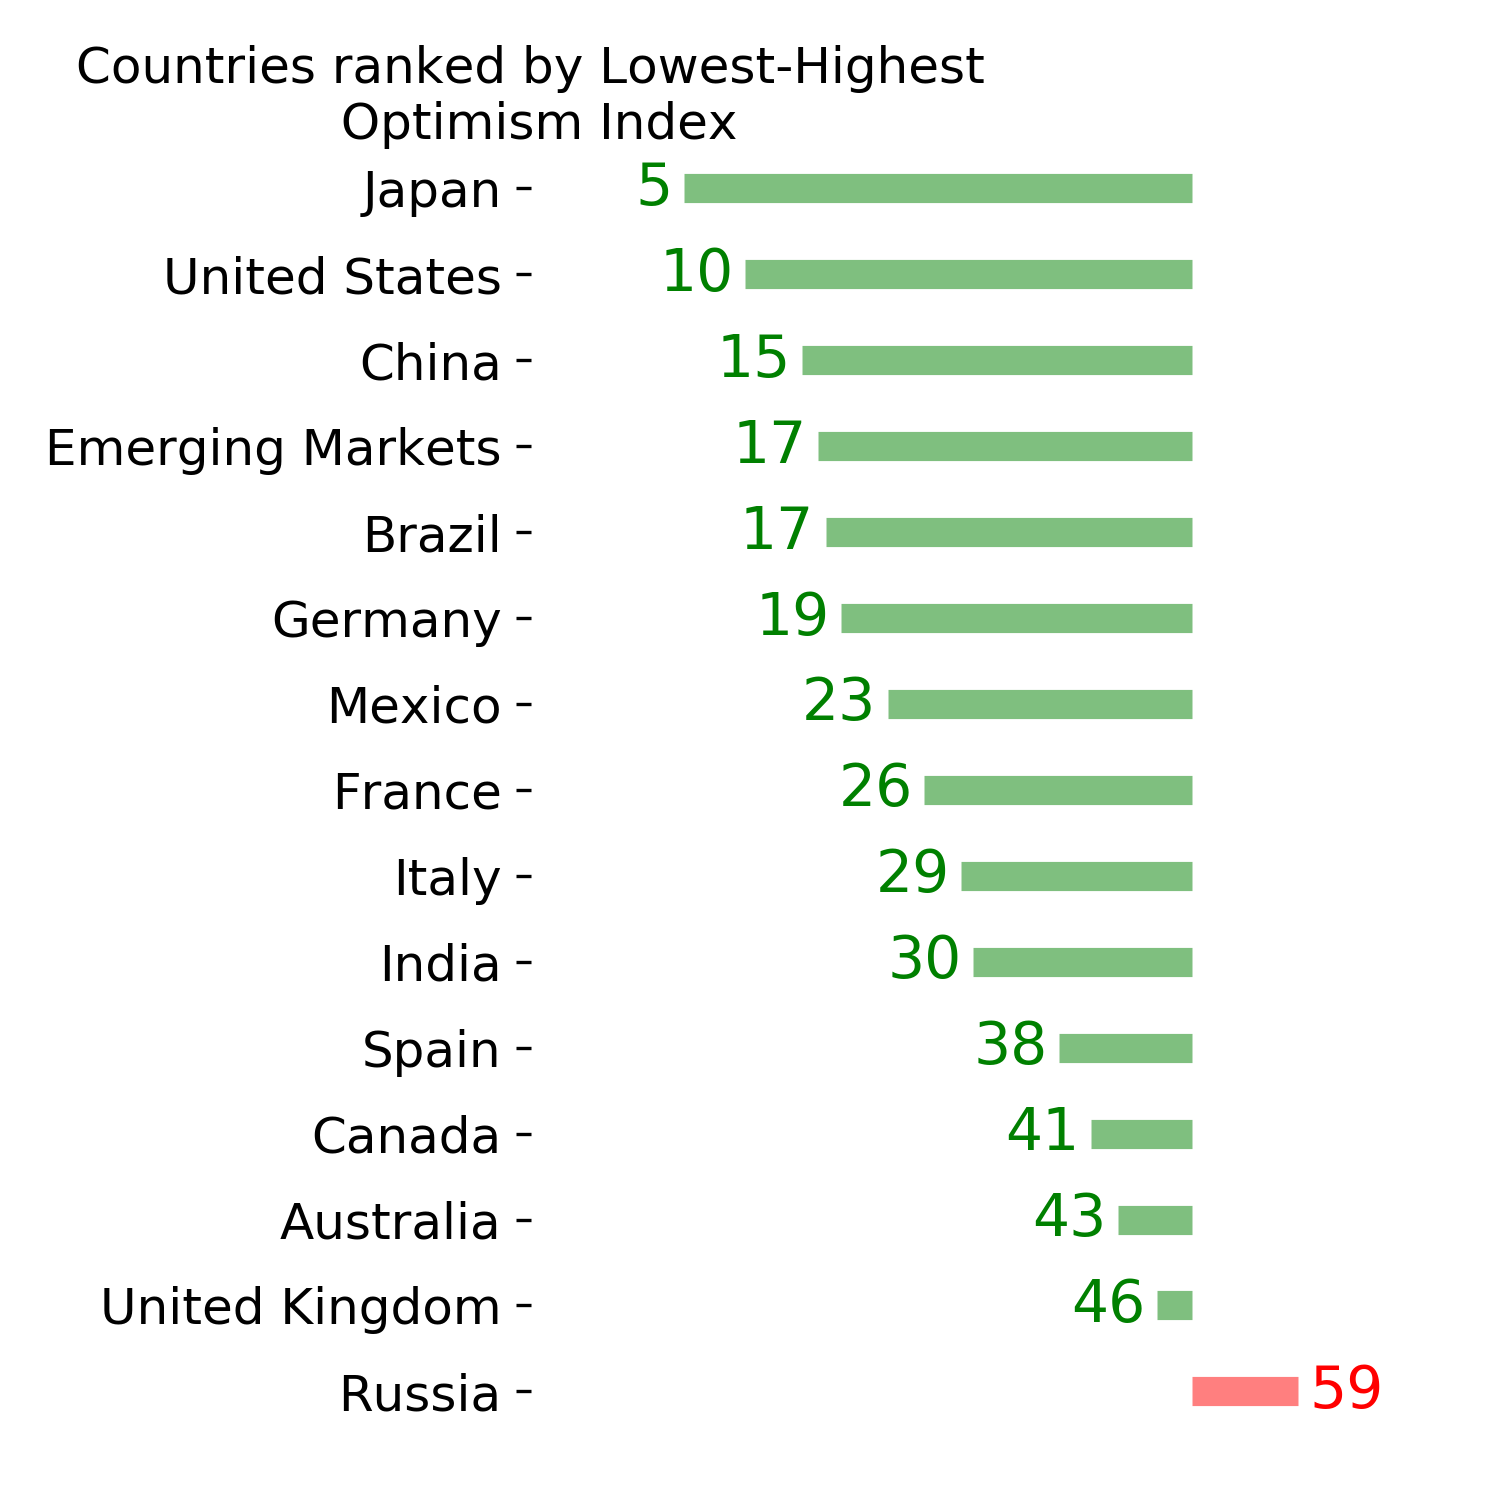
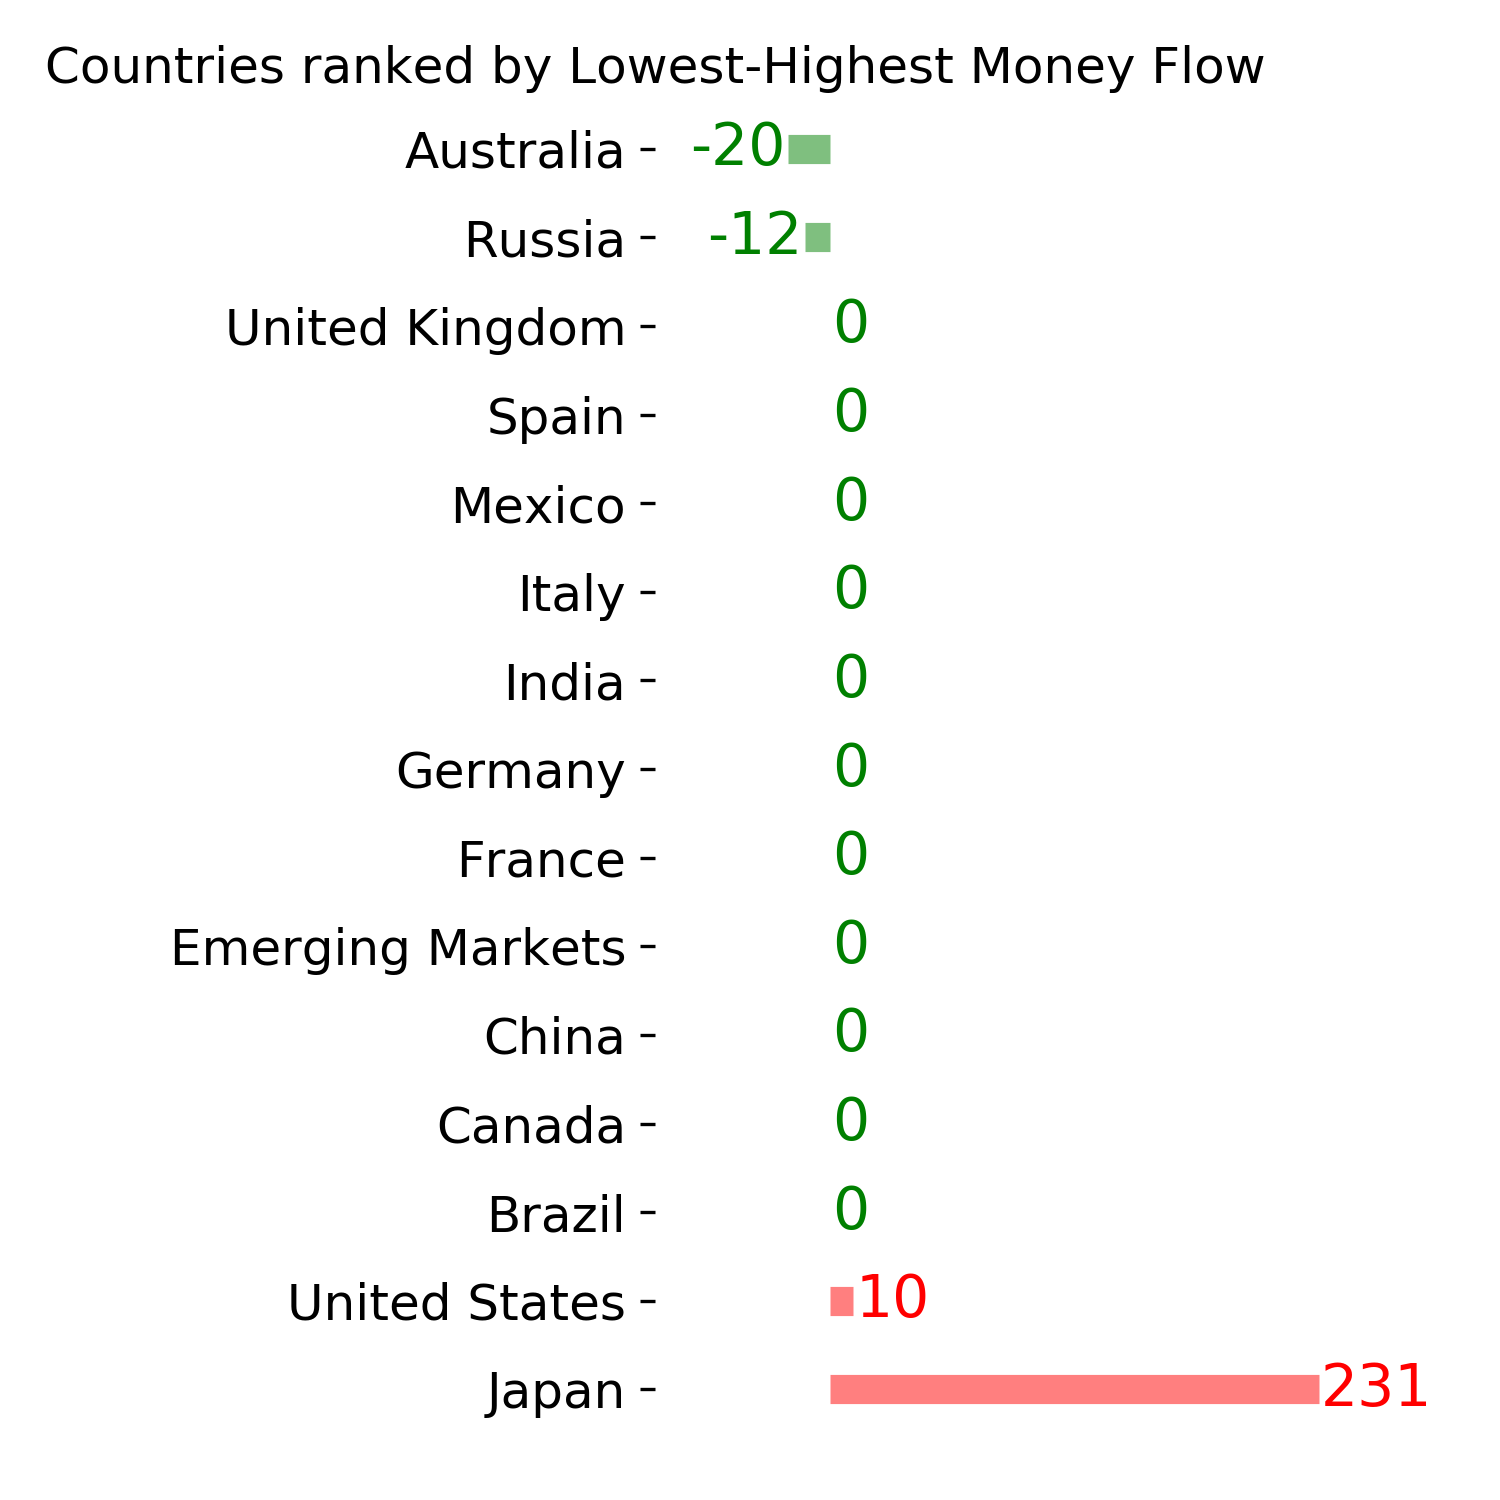
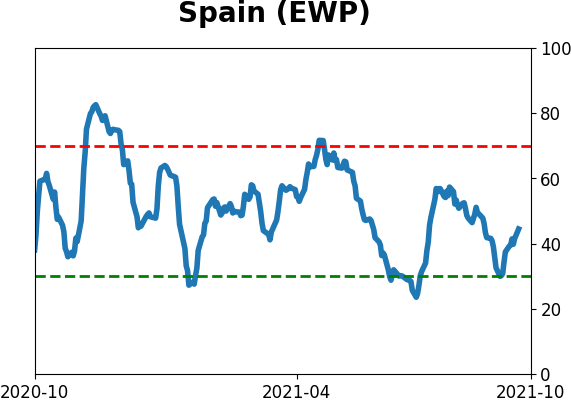
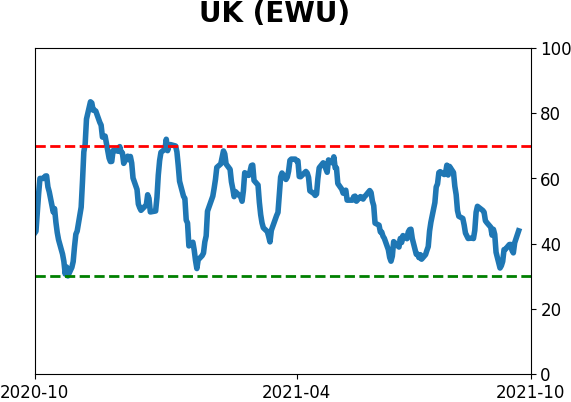
Country ETF's - 10-Day Moving Average
|
|
|
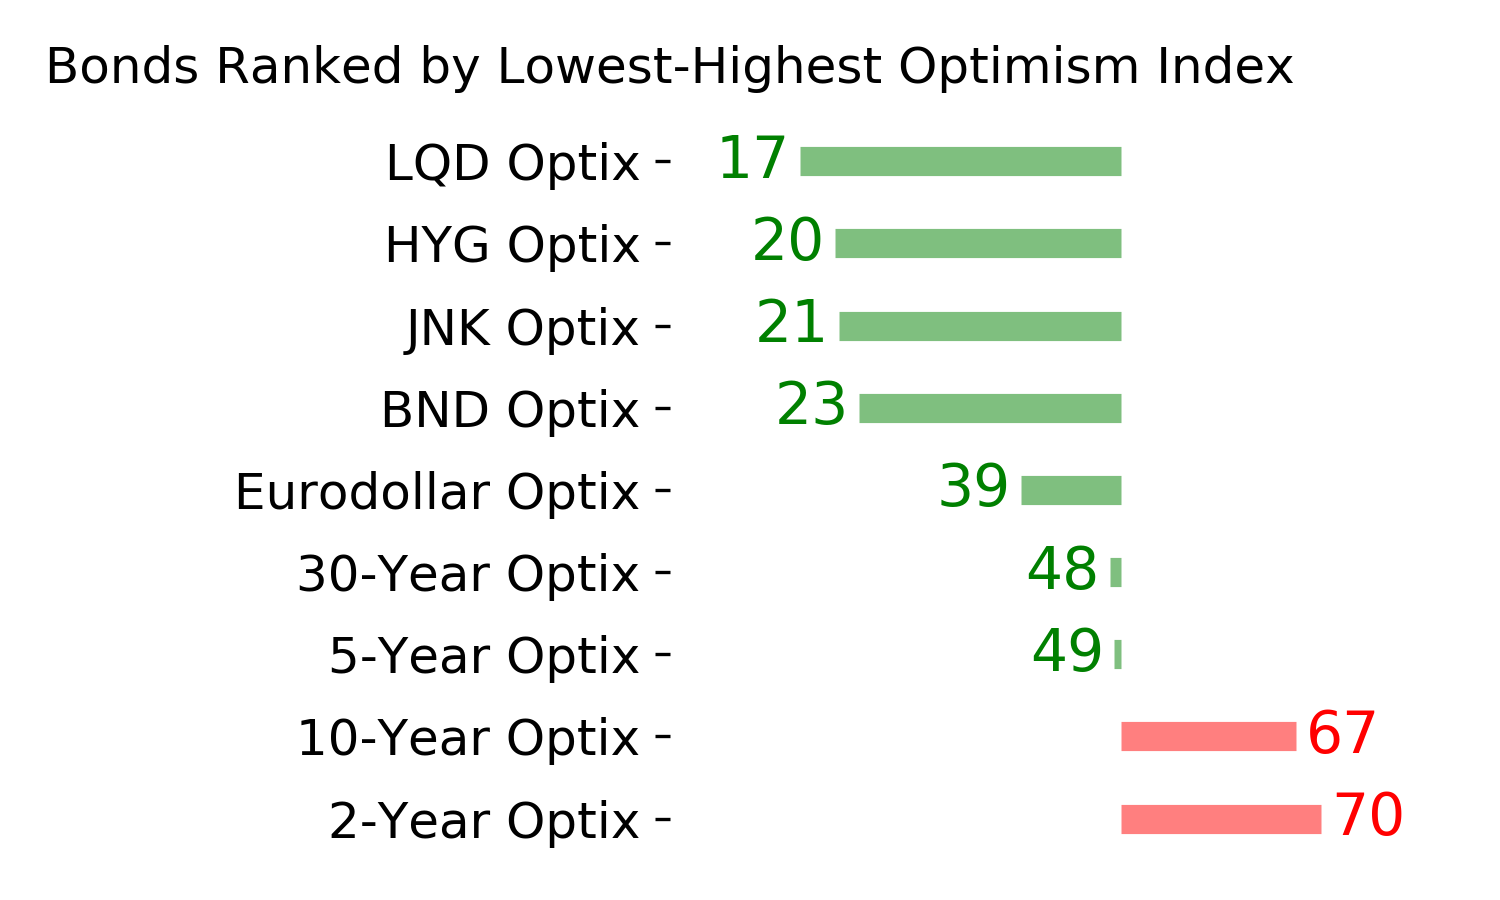
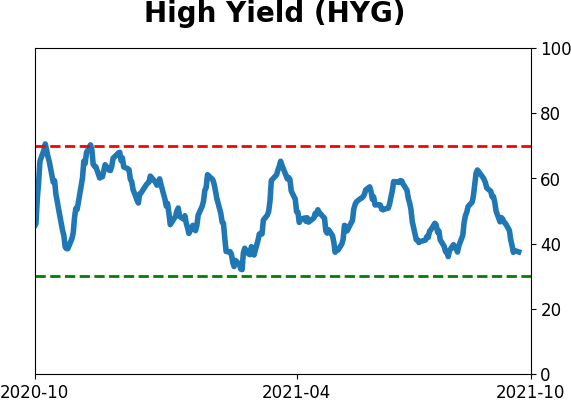
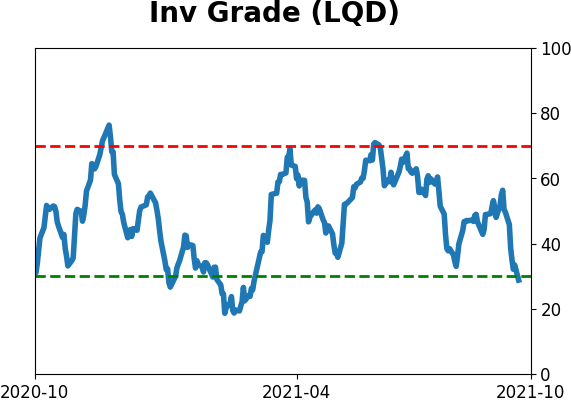
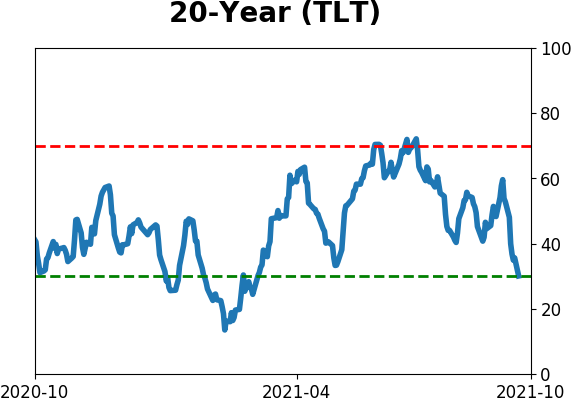
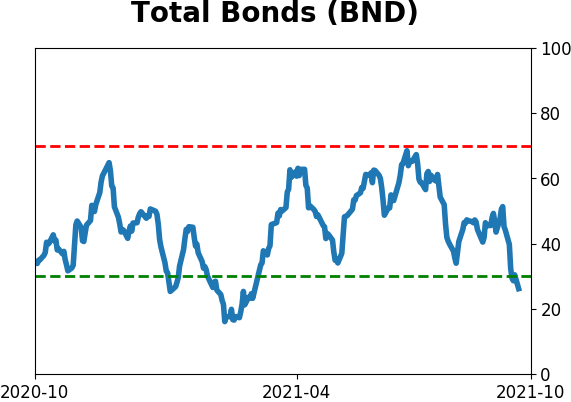
Bond ETF's - 10-Day Moving Average
|
|
|
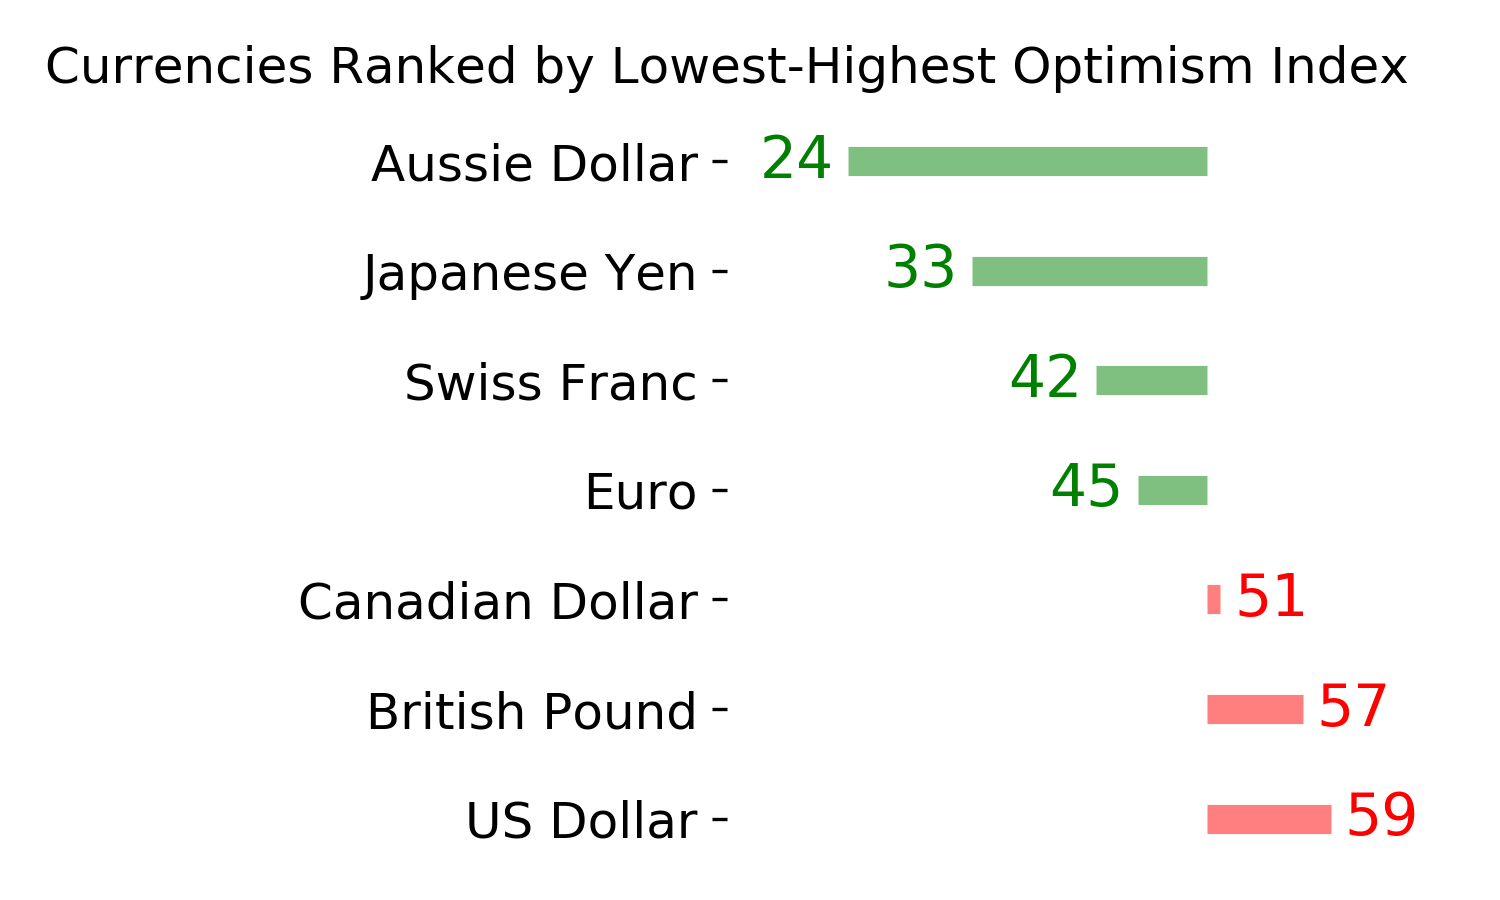
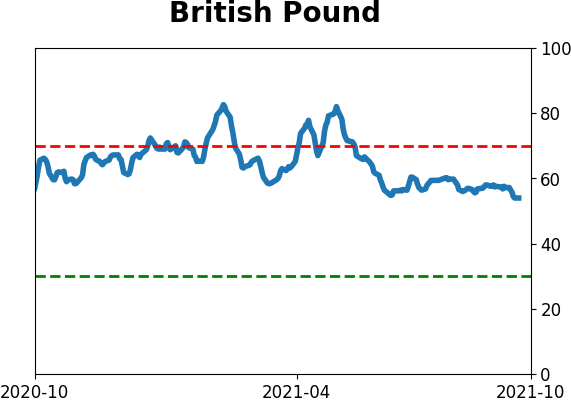
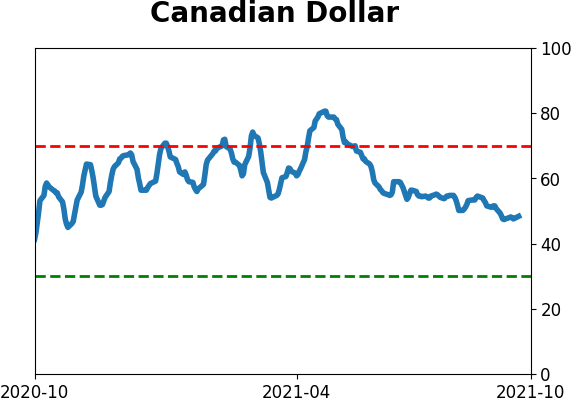
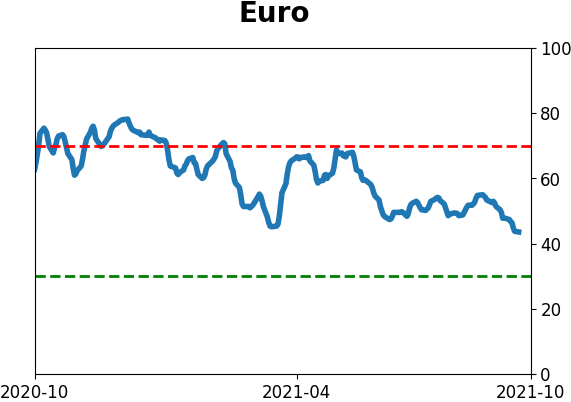
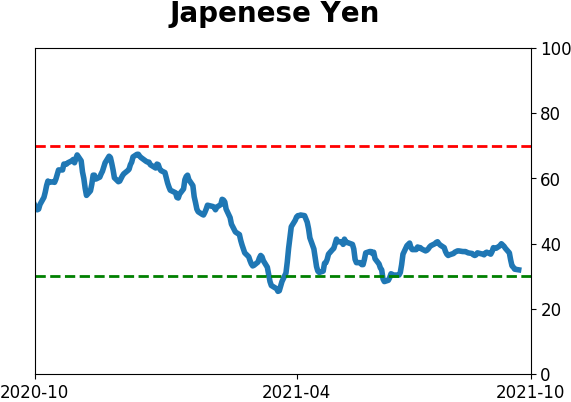
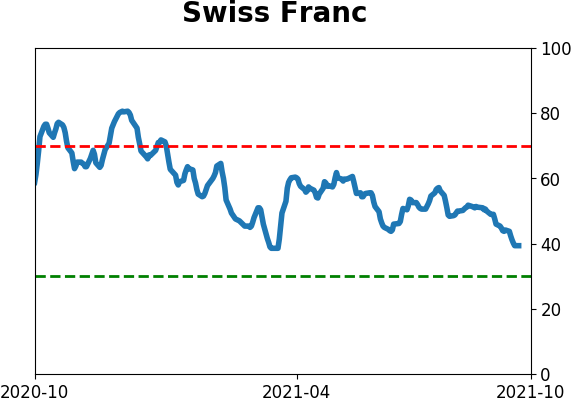
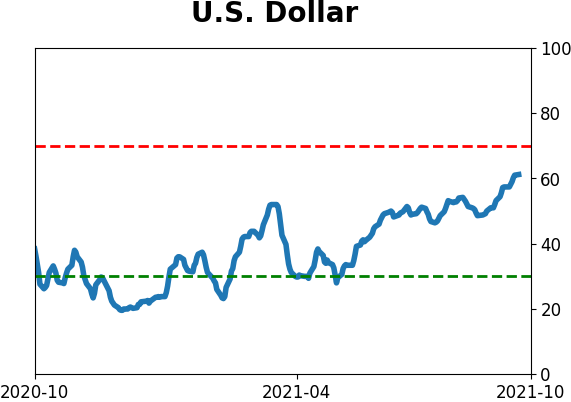
Currency ETF's - 5-Day Moving Average
|
|
|
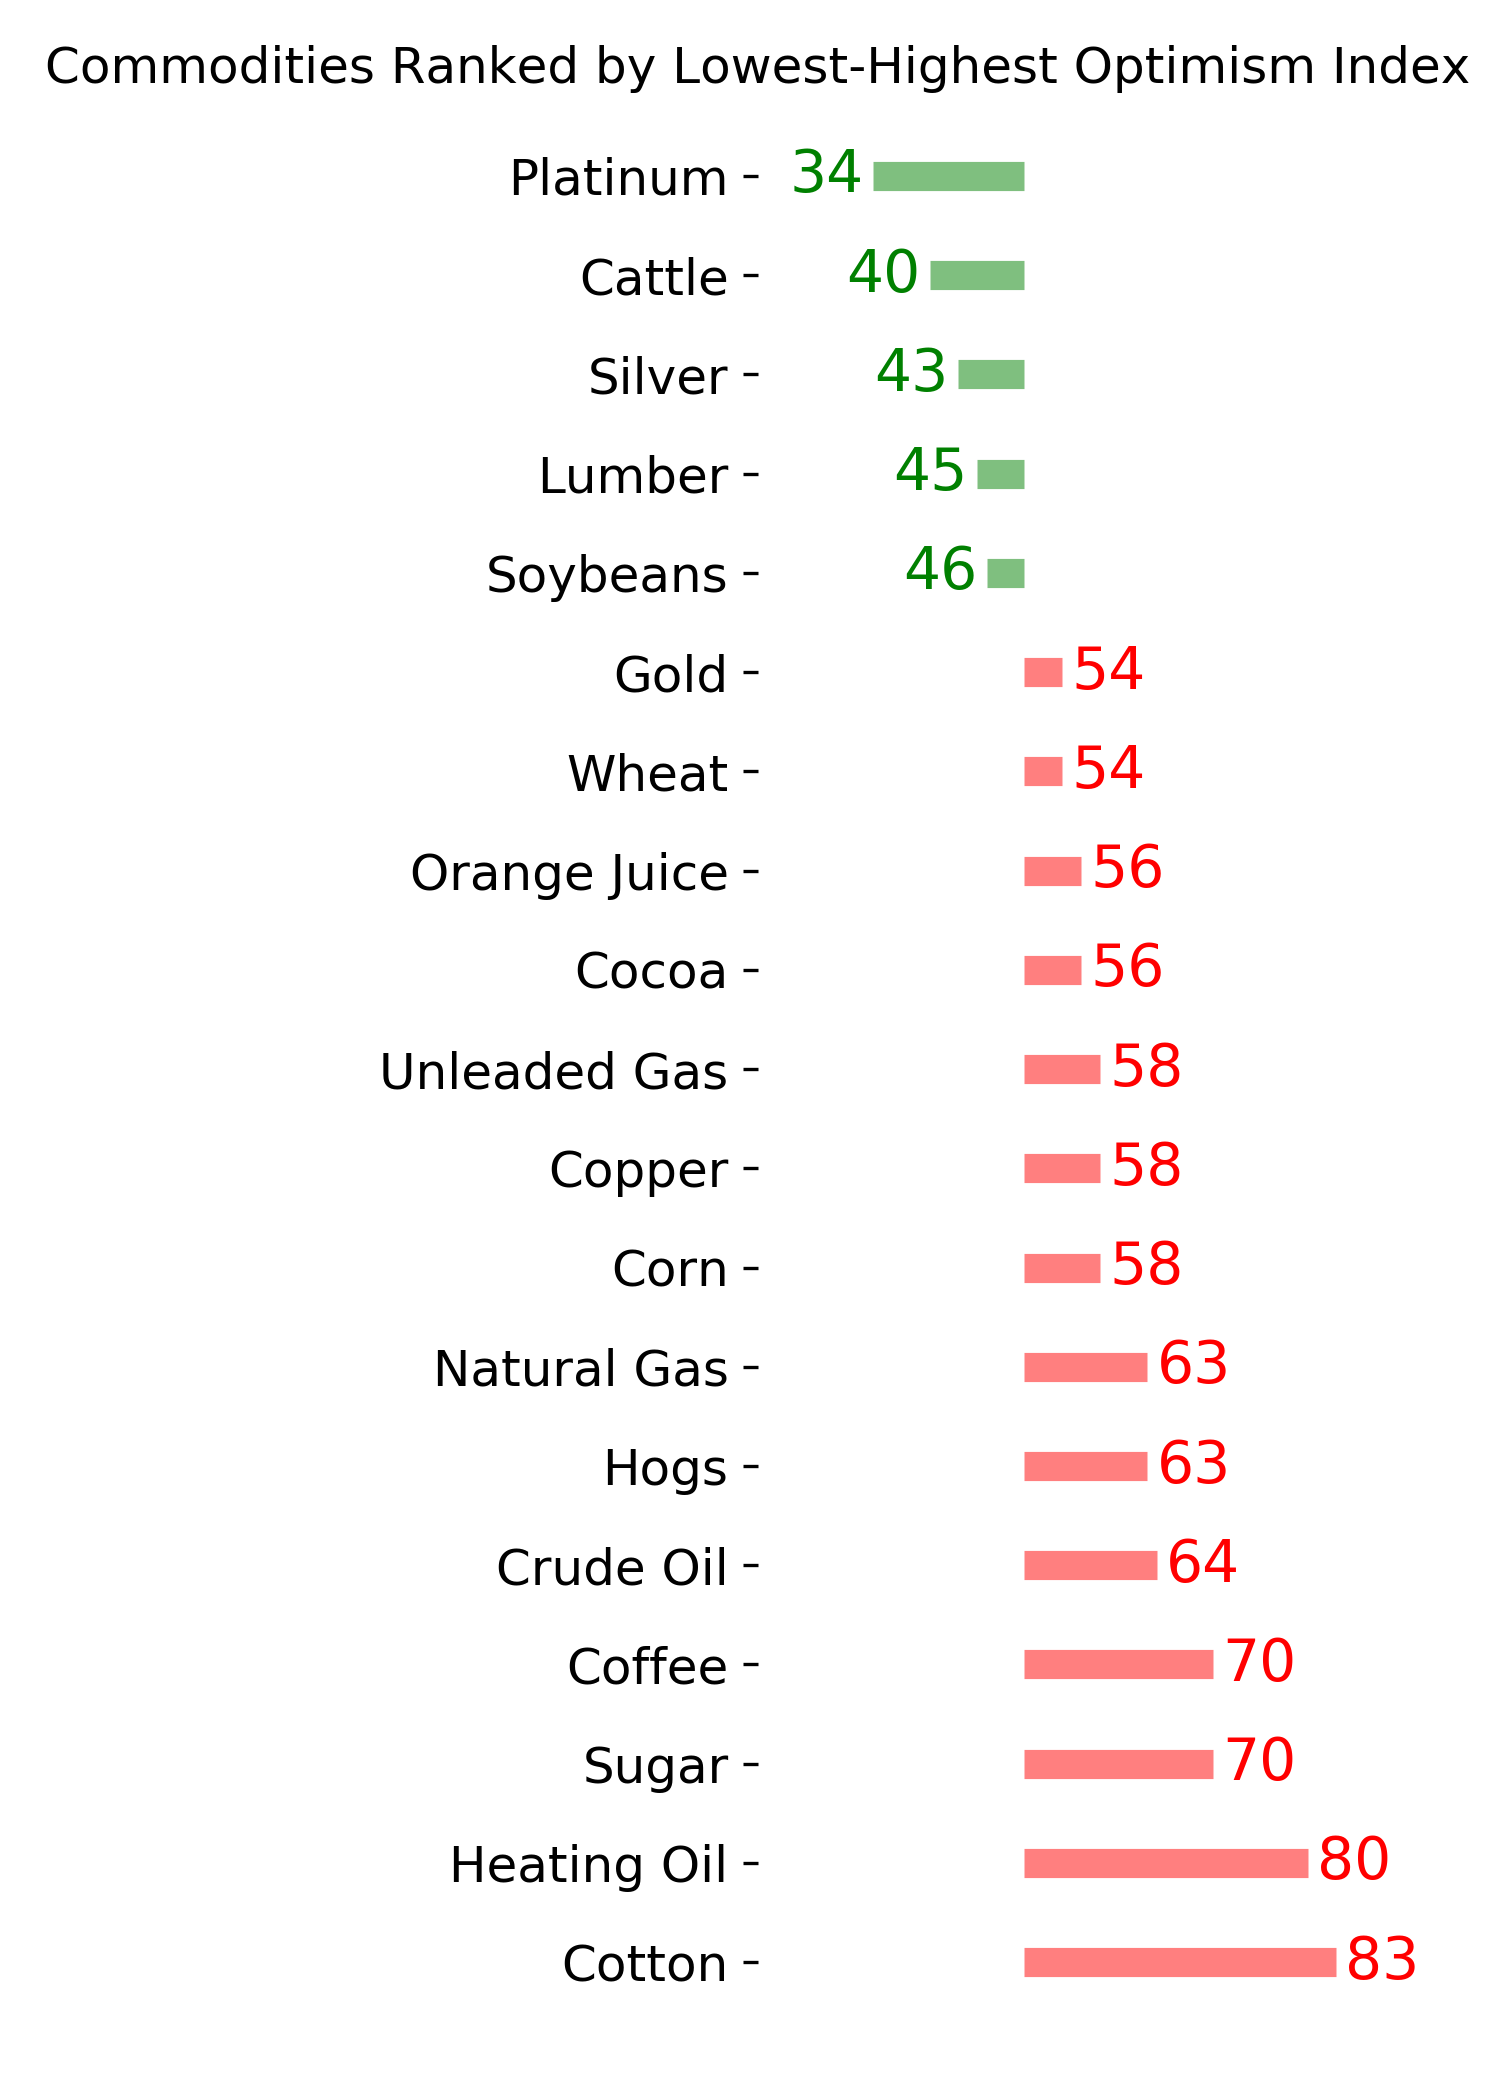
Commodity ETF's - 5-Day Moving Average
|
|