Daily Report : Weekly Wrap for Oct 1 - Momentum Streaks End, Couple of Commodities Surge, Chinese Tech Washout

| View/Print a PDF version of this Report |
Headlines
|
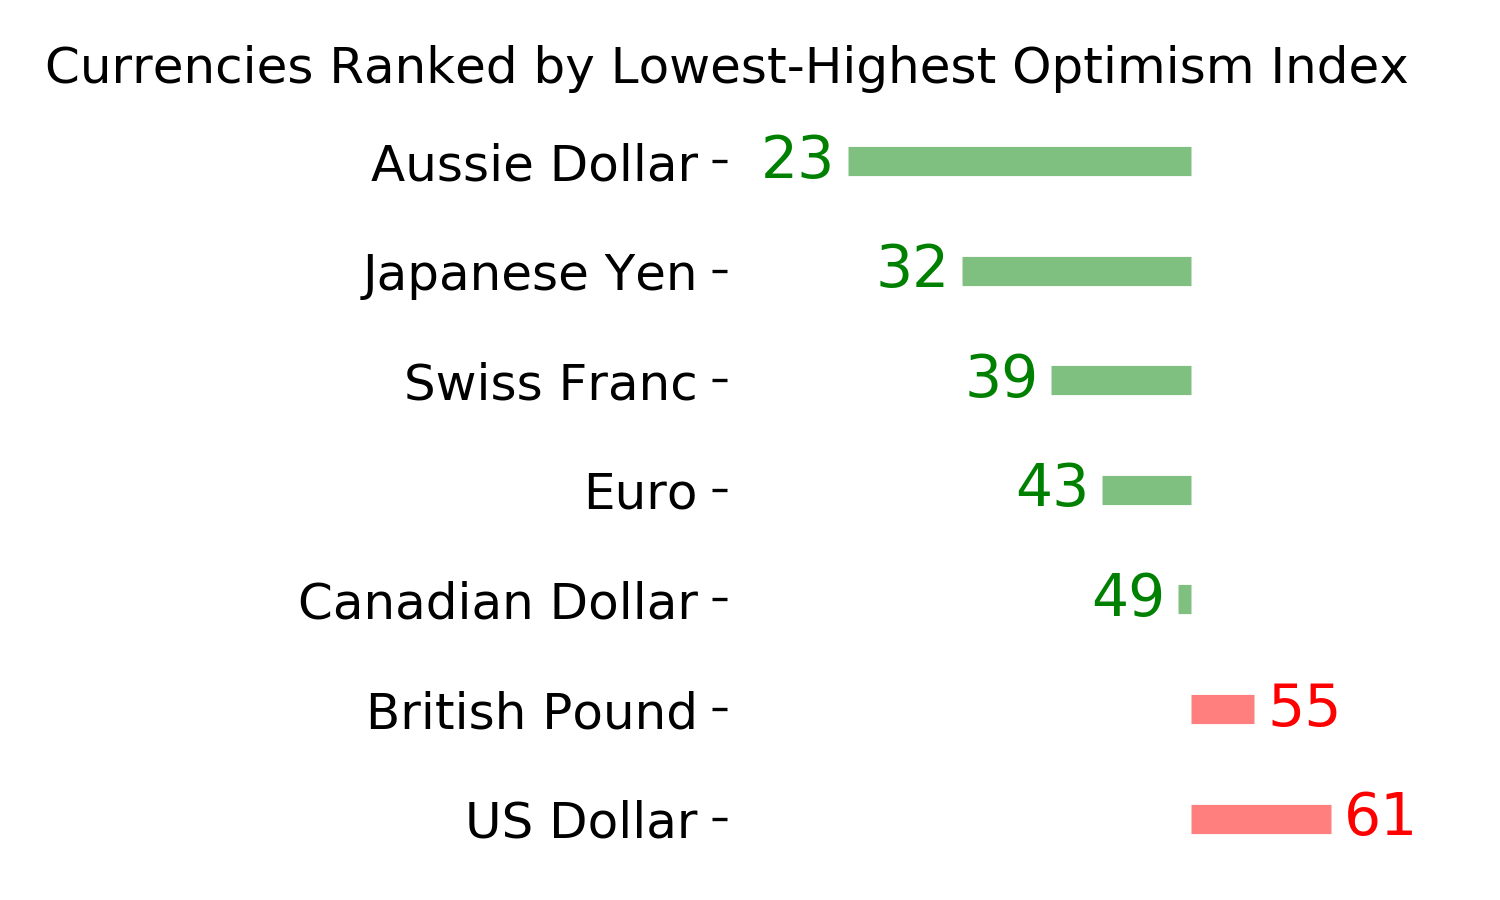
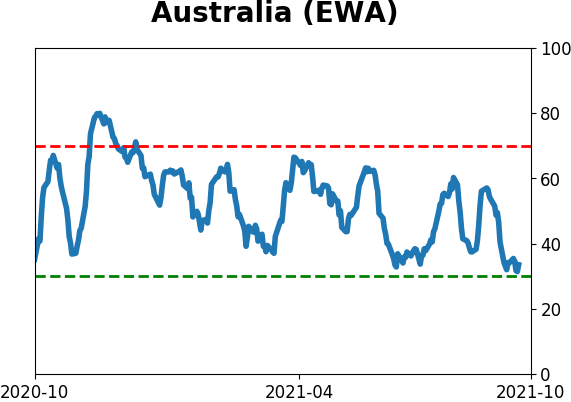
Weekly Wrap for Oct 1 - Momentum Streaks End, Couple of Commodities Surge, Chinese Tech Washout: This week, we saw small options traders pull back on speculative activity, as the small-cap Russell 2000 continued a near-record stretch without a new high or falling into a correction. Utilities have been pounded, and Chinese tech stocks are showing panic-level breadth. Bonds also got hit, and crude oil is facing an important juncture. The latest Commitments of Traders report was released, covering positions through Tuesday: The 3-Year Min/Max Screen shows that "smart money" commercial hedgers once again moved to multi-year extreme long exposure to the Aussie dollar, which is closing in on a record in terms of the absolute number of contracts as well as a % of open interest. They sold heavily into the rally in cotton, moving close to record short exposure. They're now holding a record number of palladium contracts net long and haven't held this much of the open interest net long in 20 years. The moves in the most widely-traded precious metals haven't spurred them enough to near extremes in either gold or silver. They have the least short exposure in a couple of years, but it's far from other major bottoms when hedgers went net long or nearly so. Bottom Line: STOCKS: Hold BONDS: Hold GOLD: Hold |
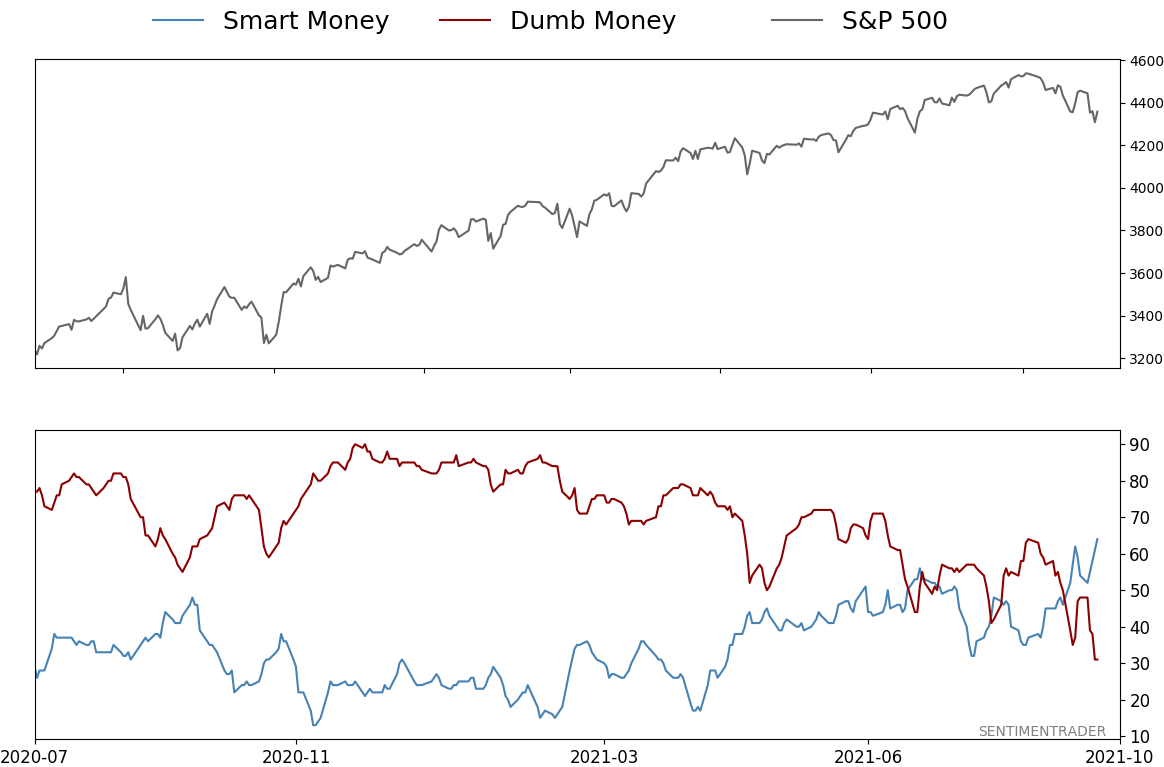
Smart / Dumb Money Confidence
|
|
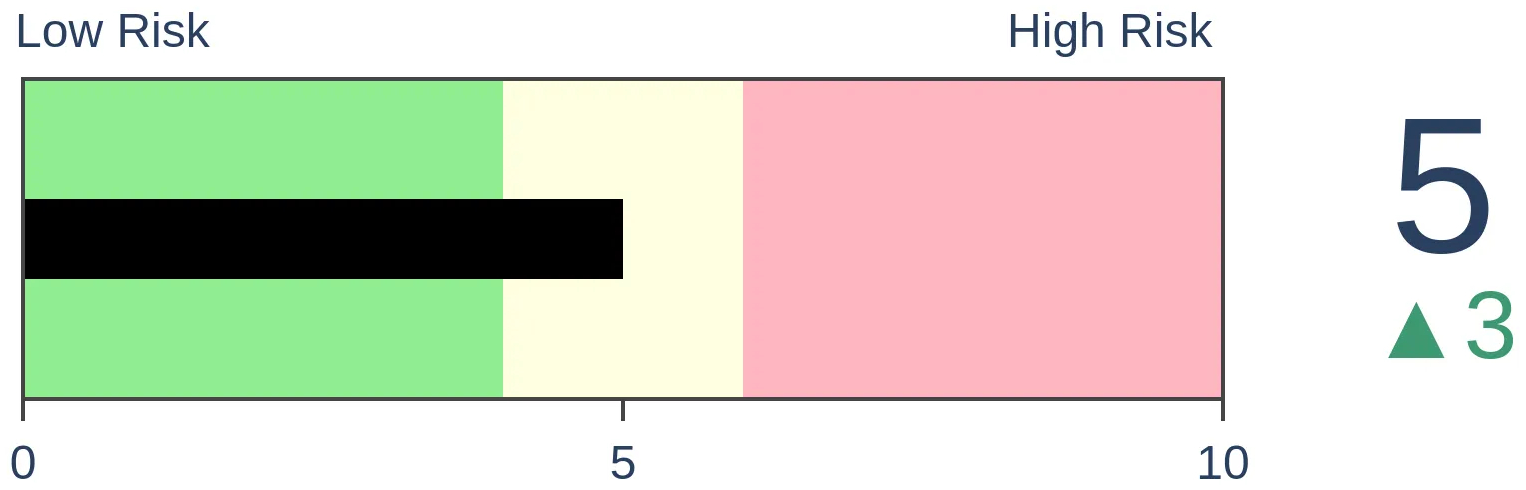
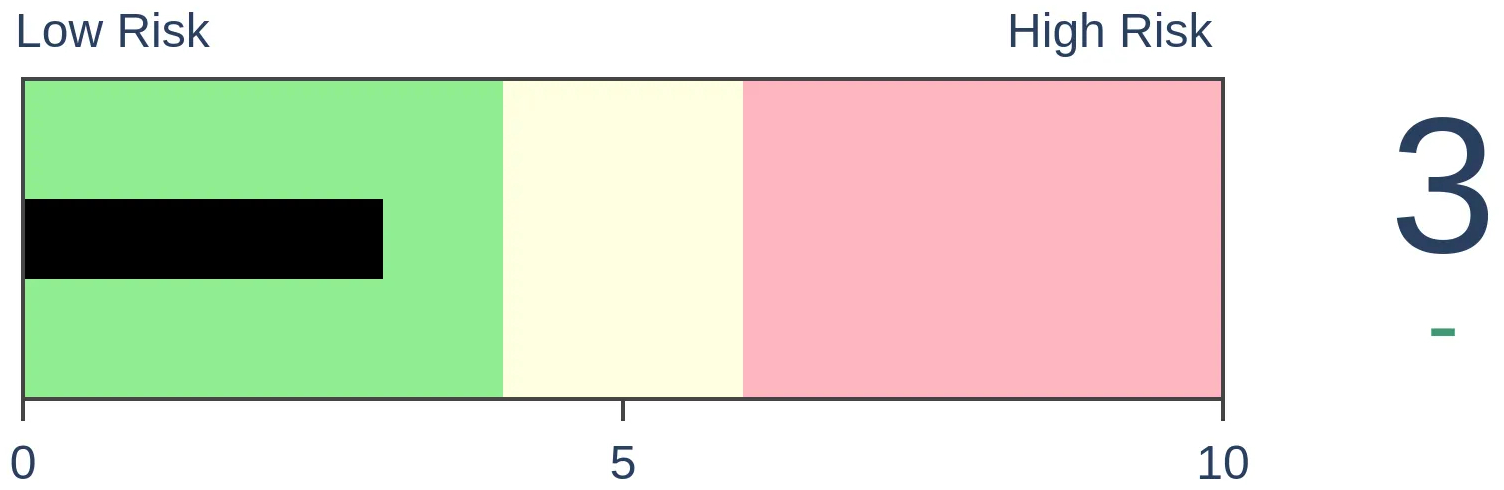
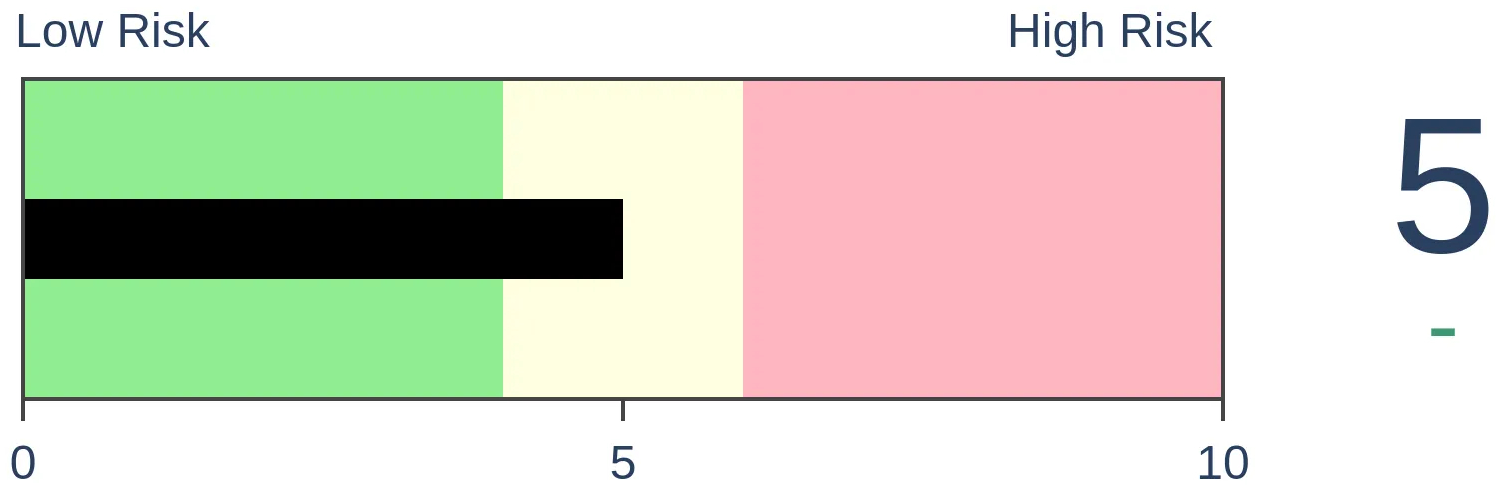
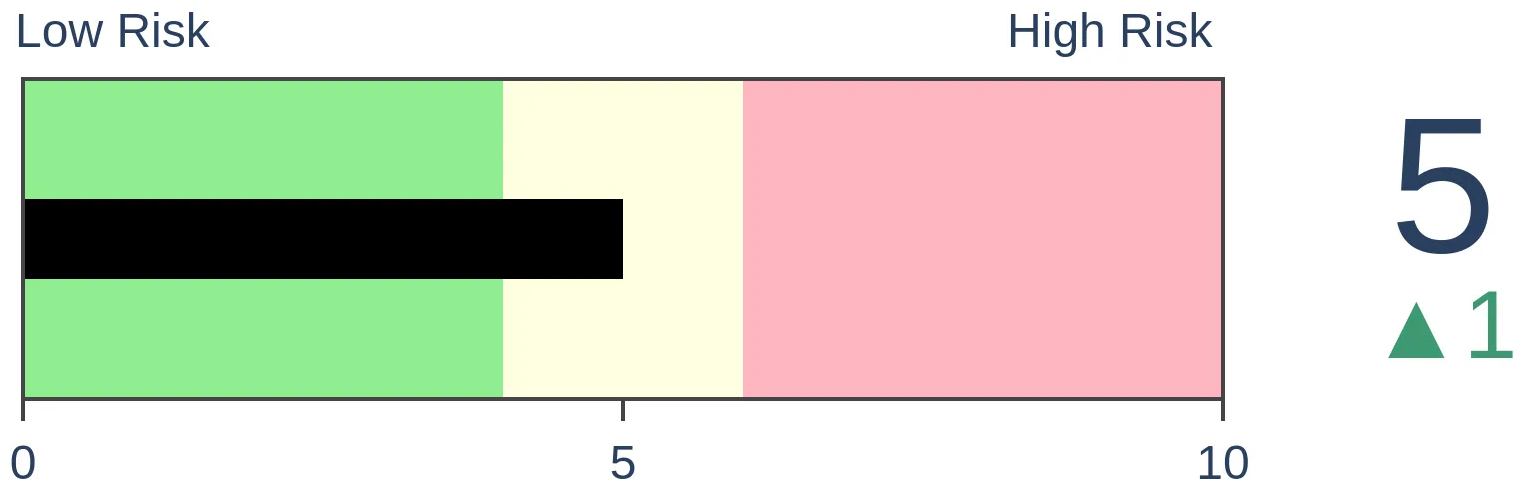
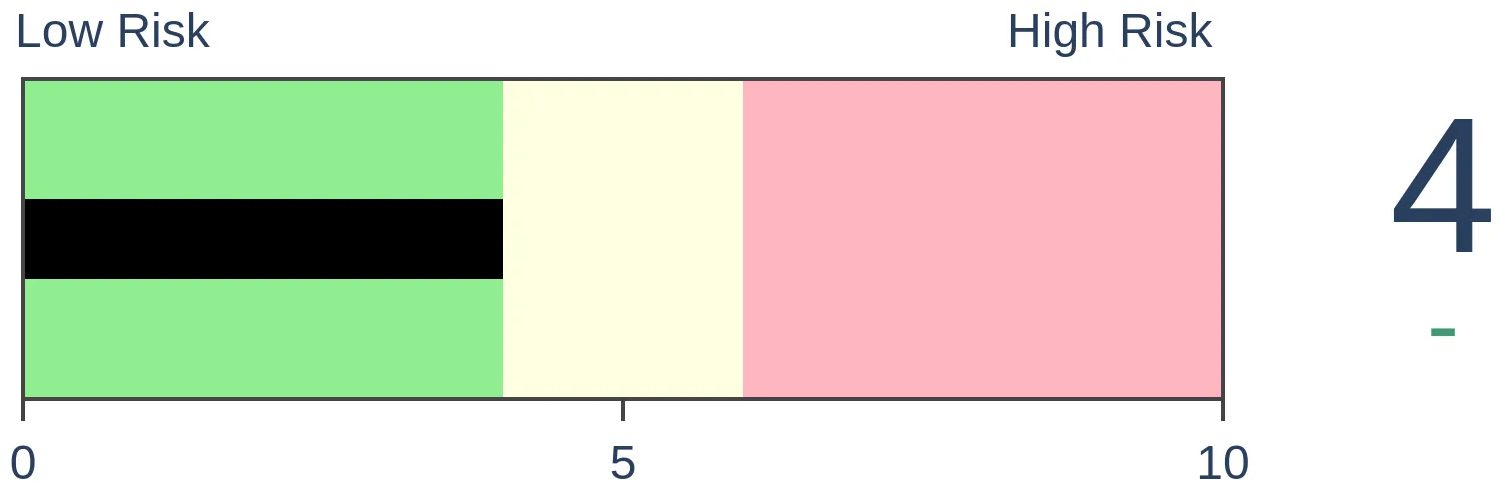
Risk Levels
|
|
|

Research
Weekly Wrap for Oct 1 - Momentum Streaks End, Couple of Commodities Surge, Chinese Tech WashoutBy Jason GoepfertBOTTOM LINEThis week, we saw small options traders pull back on speculative activity, as the small-cap Russell 2000 continued a near-record stretch without a new high or falling into a correction. Utilities have been pounded, and Chinese tech stocks are showing panic-level breadth. Bonds also got hit, and crude oil is facing an important juncture. FORECAST / TIMEFRAME |
The goal of the Weekly Wrap is to summarize our recent research. Some of it includes premium content (underlined links), but we're highlighting the key focus of the research for all. Sometimes there is a lot to digest, with this summary meant to highlight the highest conviction ideas we discussed. Tags will show any symbols and time frames related to the research.
| STOCKS | ||
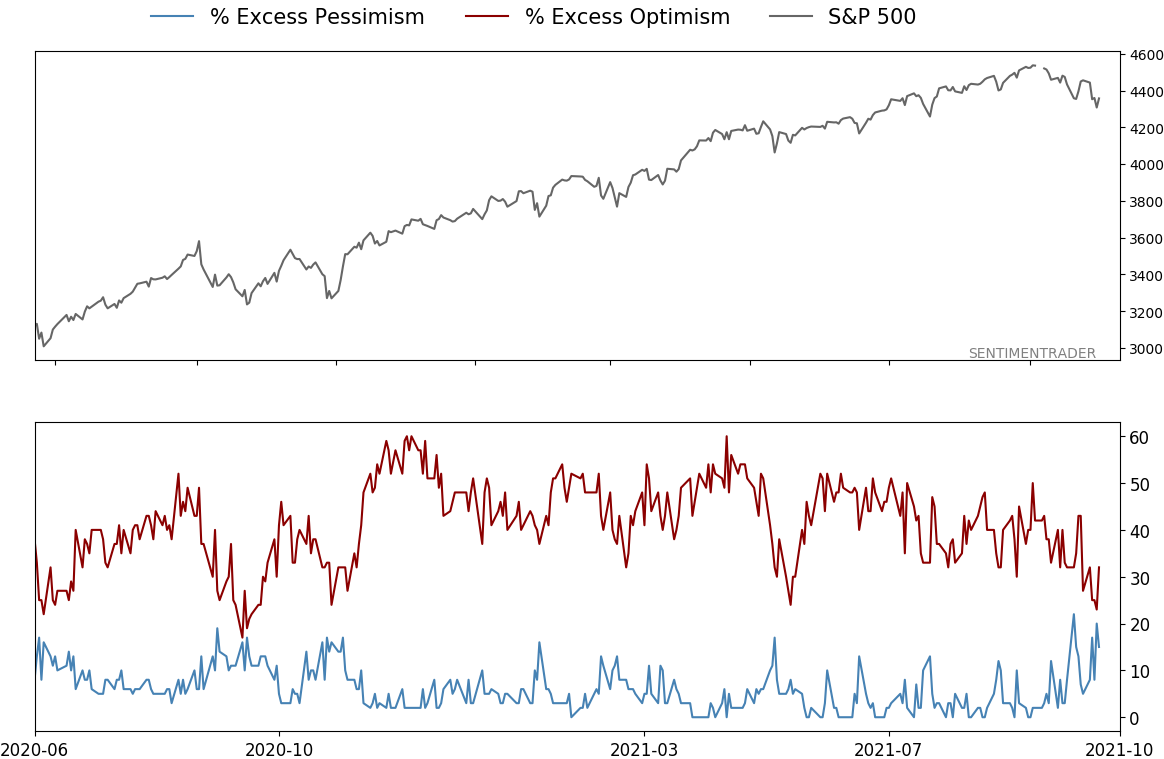
 |  | |
In January and February, sentiment was driven to a frenzy, primarily on the backs of wild-eyed options traders.
Small-caps peaked for the year right about then. Deterioration under the surface of other indexes has finally dented investors' optimism, and many of the indicators we follow have moved back into neutral, or even slightly pessimistic, territory. Among options traders, that internal choppiness has led the smallest of traders to pull back significantly on their bullish bets.
Last week, these small traders spent only 43% of their volume buying speculative call options to open. That's the least concentration on outright bullish bets so far in 2021.
Looking at the broader universe of traders, the Options Speculation Index (OSI) shows us that there was only 30% more volume in bullish options strategies than bearish strategies last week. That's among the lowest levels since the initial recovery from the pandemic panic last spring.
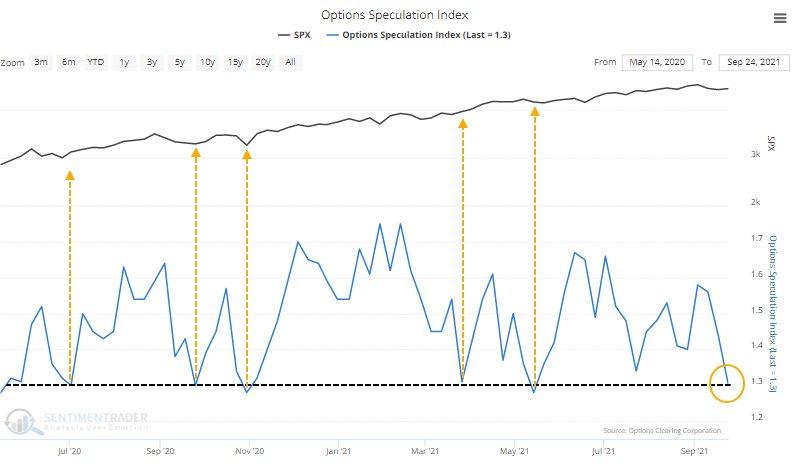
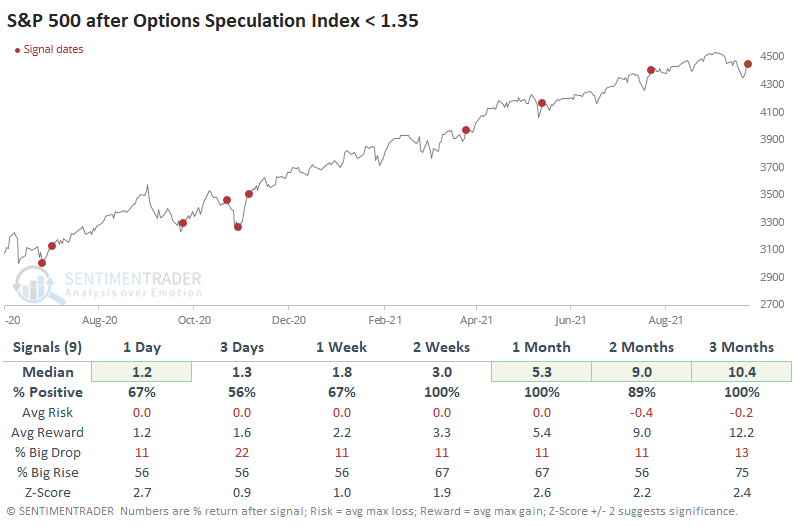
Again, if we zoom out to the full history, we see that the current level is nowhere near pessimism. We're only talking about the post-pandemic free-for-all here. And if we're still in that kind of environment, then risk in the weeks ahead is small. The table below shows the S&P 500's returns in the days and weeks following an OSI reading below 1.35 since June 2020.
The suggestion would be that if we're still in the post-pandemic lala land, then we should expect higher stock prices pretty much immediately. There was an ounce of pessimism evident last week, and since the thrust from the spring 2020 low, that's been all that's required to bring in bargain hunters and drive the indexes to new highs.
As always, what we're more interested in looking for is deviations from recent behavior. Based on that table above, almost any loss of more than 1% over any time frame would be the first hint that something has changed.
SMALL STOCKS, BIG TRADING RANGE
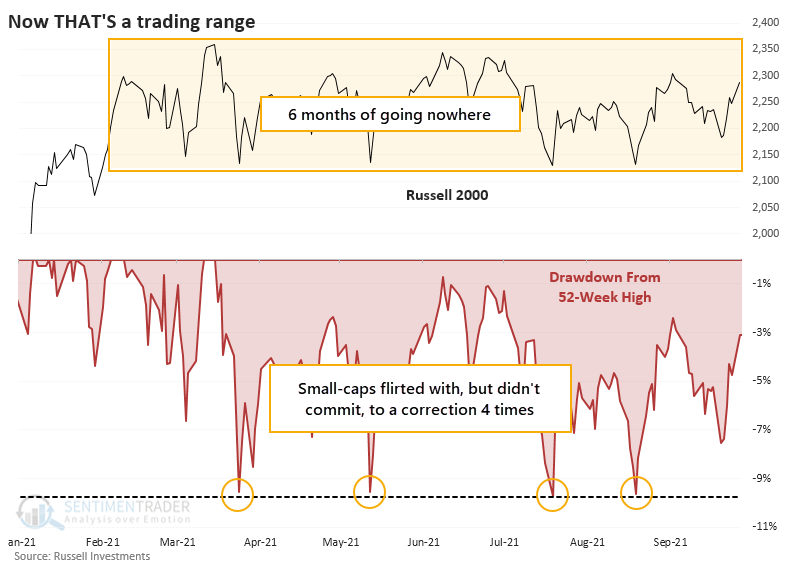
The small-cap Russell 2000 hasn't gone anywhere for six months. On Monday, we noted that these stocks peaked when options traders' speculative fervor did, and these stocks have been trying to shrug off the hangover ever since.
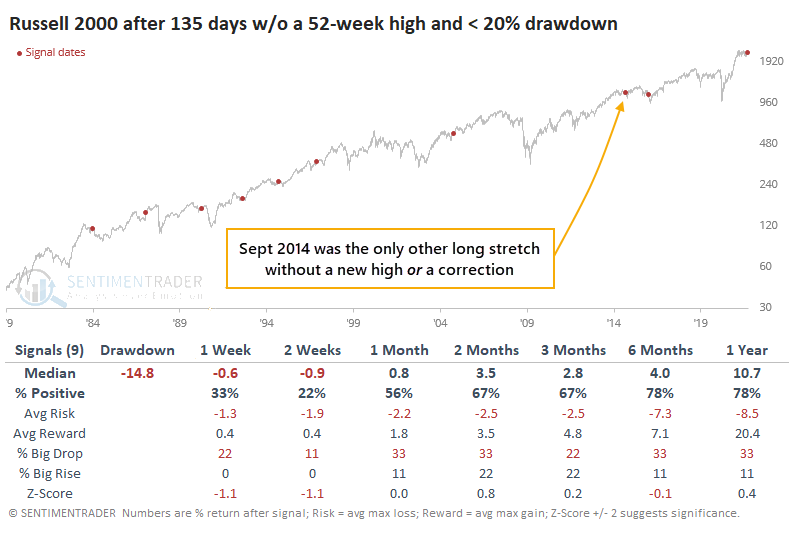
The Russell has gone more than 135 days without a 52-week high, yet it was down less than 10% at its worst point. Even though it's been six months, it hasn't even suffered the standard definition of a correction.
Time-wise, this is one of the longer stretches between 52-week highs, but by no means the longest. It went more than two years without one during the last two protracted bear markets.
It's unusual that the index has gone so long without a new high but didn't even suffer a 10% pullback along the way. Only one other stretch in the history of the Russell 2000 can claim this. That was almost exactly seven years ago, which quickly saw small-cap stocks lose a lot more in the weeks ahead before popping back up again.
One big check in the bulls' box is that during the surge in small-caps to start the year, more than 93% of Russell 2000 members traded above their 200-day moving averages, the most in more than 20 years. That has since corrected back down toward 40%. Healthy markets consistently see more than 60% of members above their 200-day averages, with forays toward 40% proving to be buying opportunities.
Over the past 30 years, when the Russell 2000 has gone this long without a 52-week high and without falling into a bear market, it has broken out to the upside every time, with positive returns 12 months later each time (the two signals before that were losers).
It is questionable whether it would be a better bet than the S&P 500 juggernaut, and evidence would suggest it's not. But if small-cap stocks can hold up and see some surges in the coming weeks, enough to turn the Summation Index positive, it should be a good sign for the medium- to long-term.
THE ENDS OF LONG STREAKS OF MOMENTUM WERE GOOD SIGNS
Investors had a tough month as September worked its usual spell of being difficult to navigate for bulls.
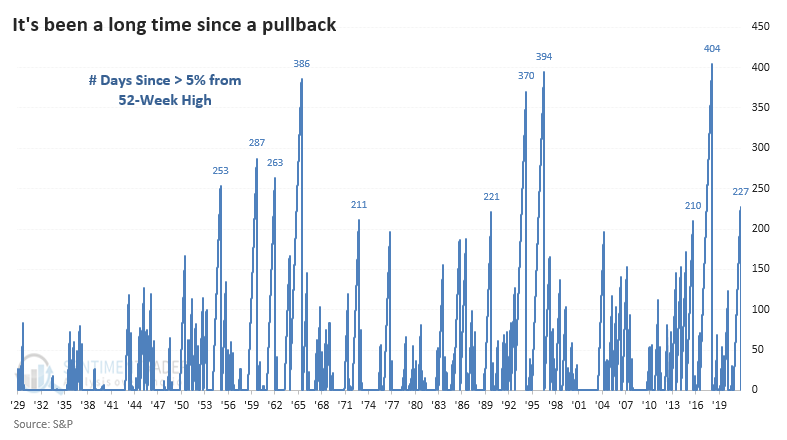
With a loss to end the month, the S&P 500 finally ended its streak of 227 days of being within 5% of a 52-week high. That was the 8th-longest streak of being within 5% of a high since 1928.
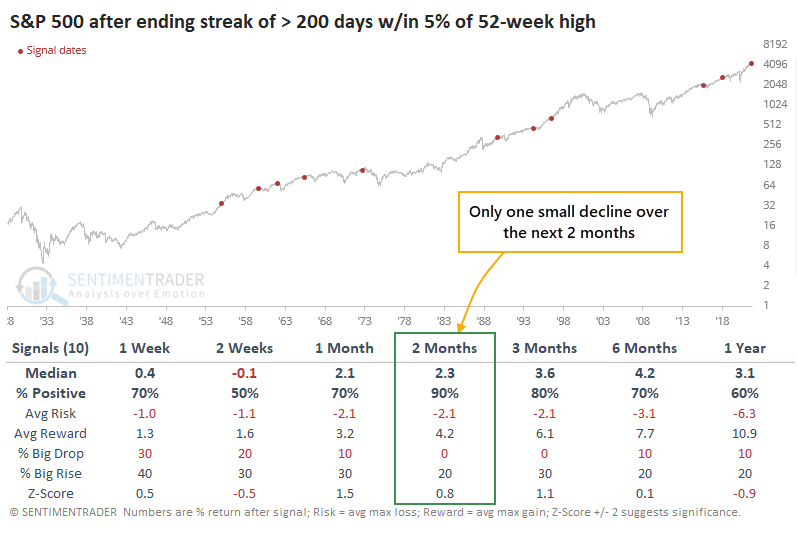
There were 10 total instances of it going more than 200 days without much of a pullback, and the ends of those streaks were not a good reason to sell. Over the next two months, the index rebounded 9 of the 10 times, with the only loss being less than 2%.
The S&P also ended its long streak of positive months. It was the first lower monthly close in 7 months. That's not its longest streak but is one of the longer ones when trading at an all-time high.
Once again, the signals showed limited risk in the months ahead. Only 2 of the 12 signals showed a maximum loss of more than 5% at any point up to three months later, though several ended up seeing more selling over the longer term.
STOCKS AND SECTORS - OVERSEAS MARKETS
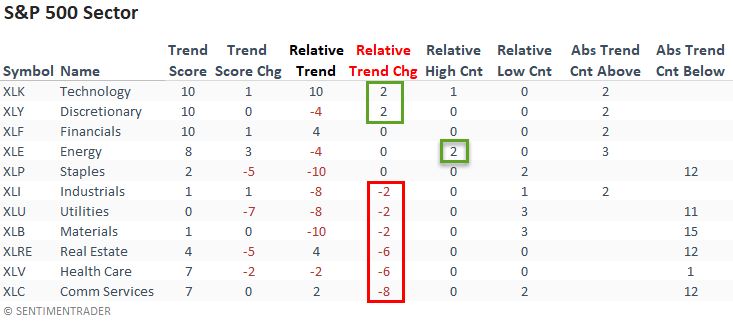
Dean updated his absolute and relative trend following indicators for domestic and international ETFs.
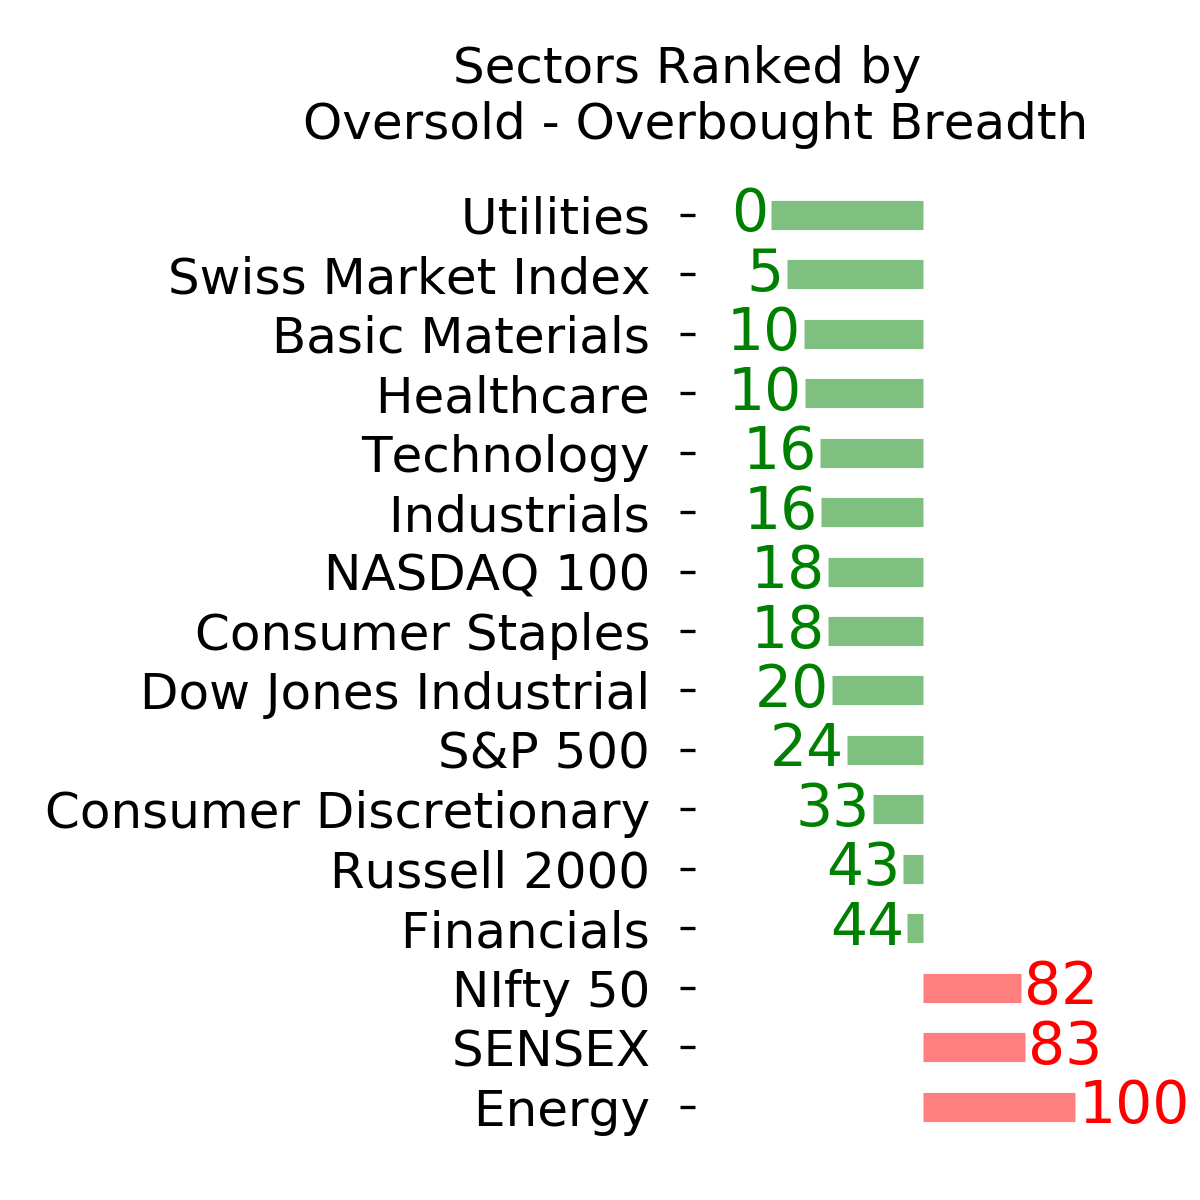
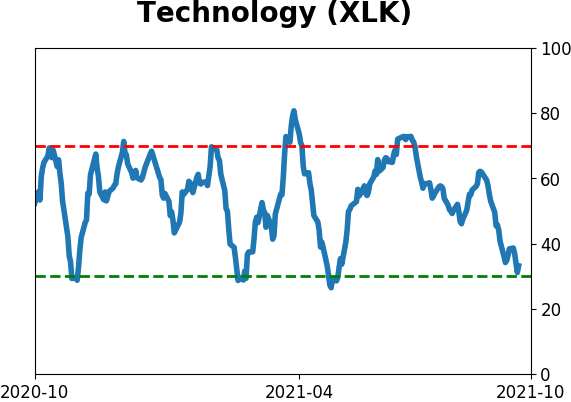
The technology sector returned to a perfect combined trend score with an absolute and relative trend score increase. While its relative trend score remains negative, the discretionary continues to improve. Energy was the only sector to register multiple relative highs last week. Cyclical-oriented sectors like industrials and materials continue to soften on a relative basis.
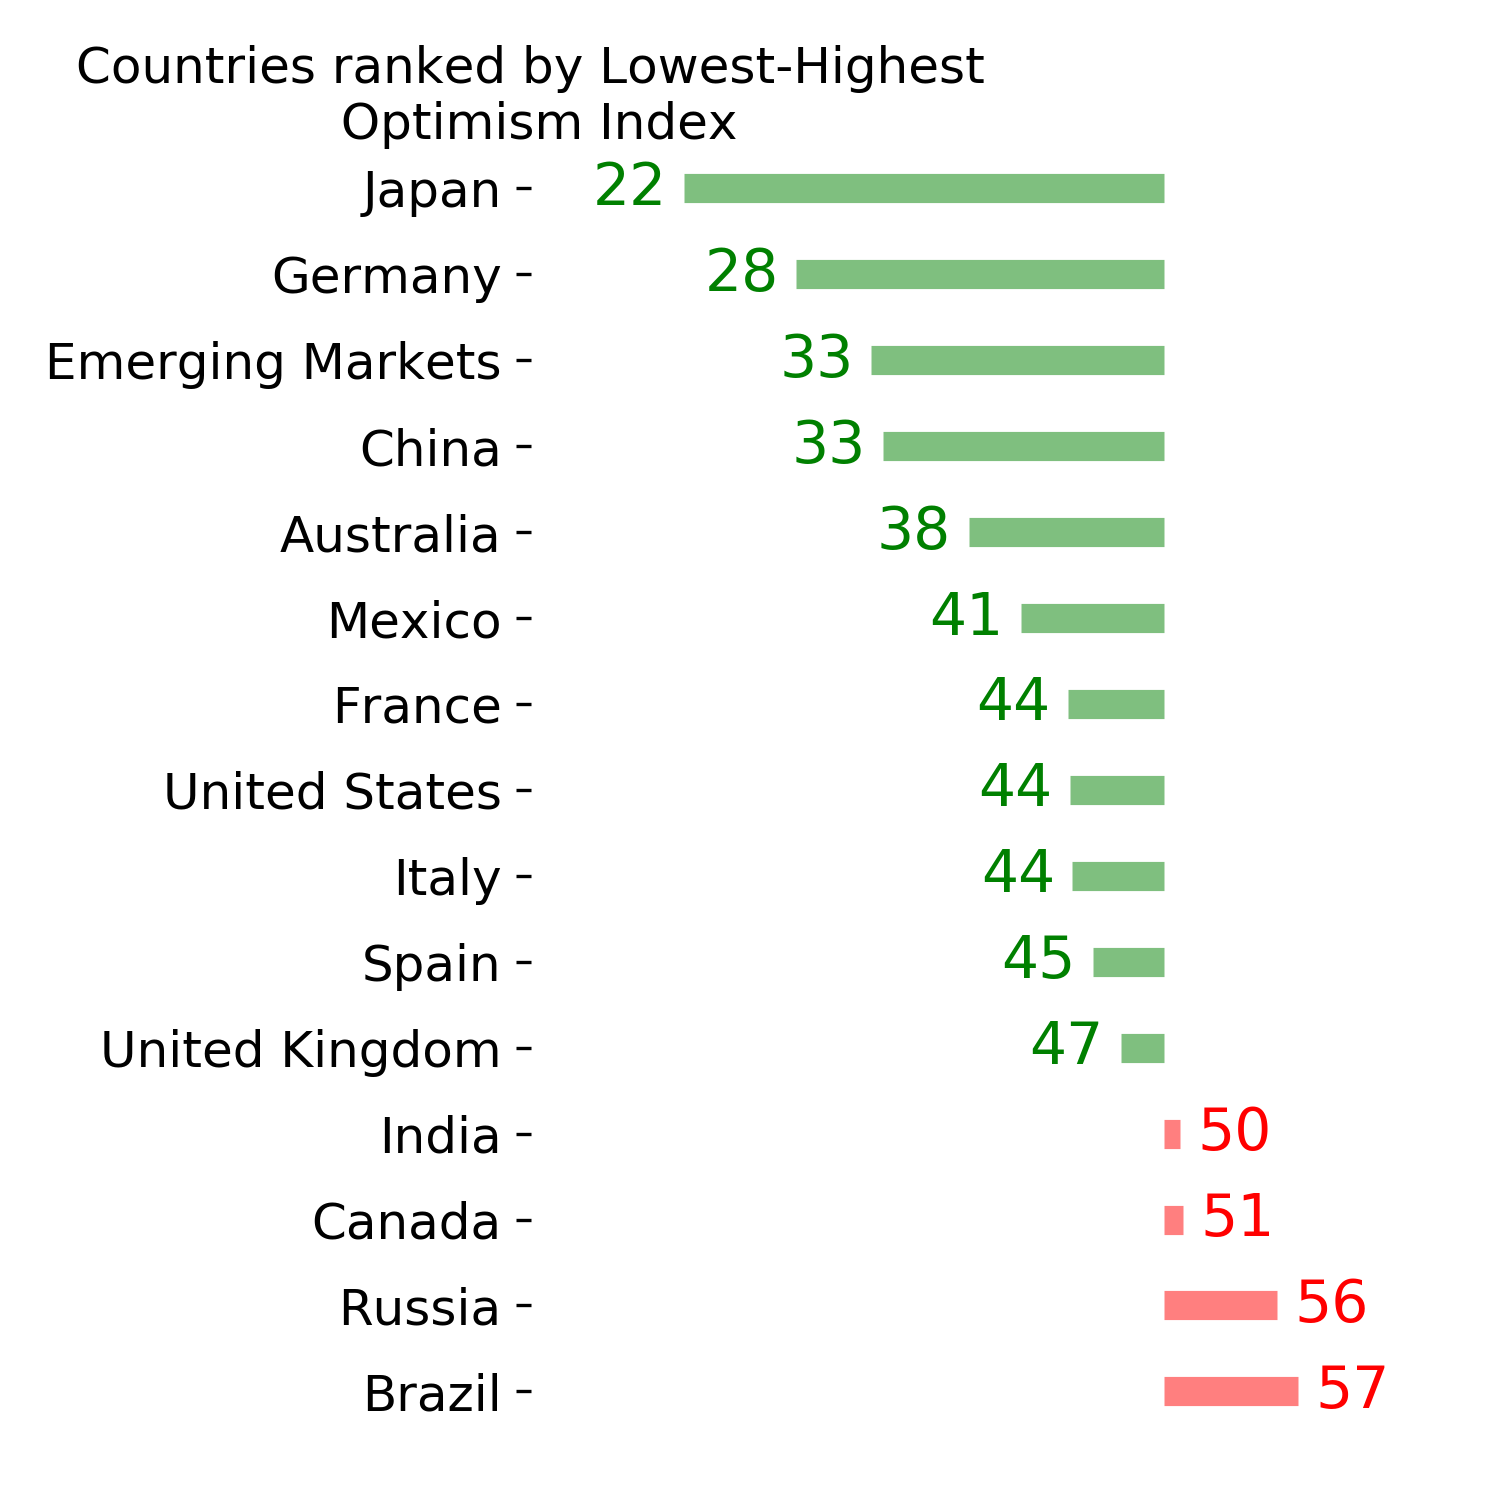
Overseas, the percentage of countries down 10% or more (in a correction) from a rolling 252-day is an excellent series to monitor. It can highlight a divergence between global indices and the USA. Typically, when the percentage of countries down 10% or more increases to 80% and the S&P 500 is near a high, take note.
The most recent divergence occurred in October 2018 when 85% of countries were down 10% or more, and the S&P 500 was down less than 2% from its respective high. The S&P 500 subsequently corrected by almost 20%.
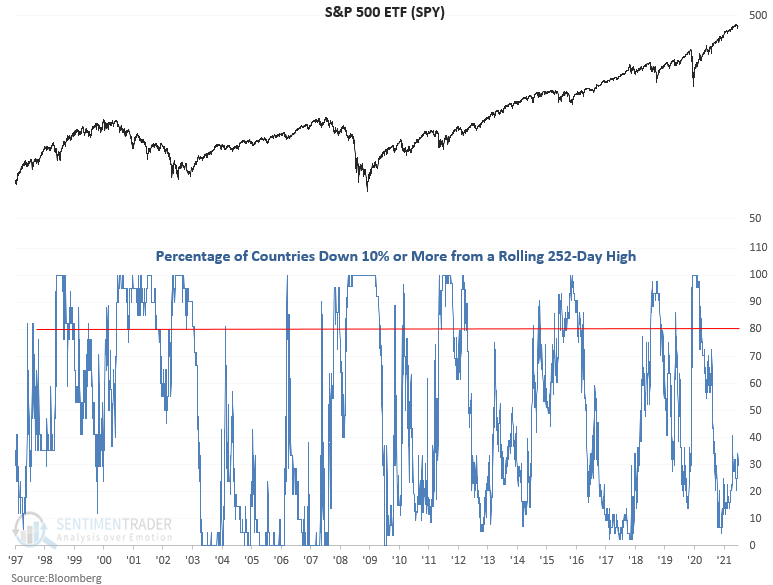
While the current figure is well below the trigger level, it's perhaps notable that more and more countries are falling into corrections lately even while the S&P has been marching to new highs.
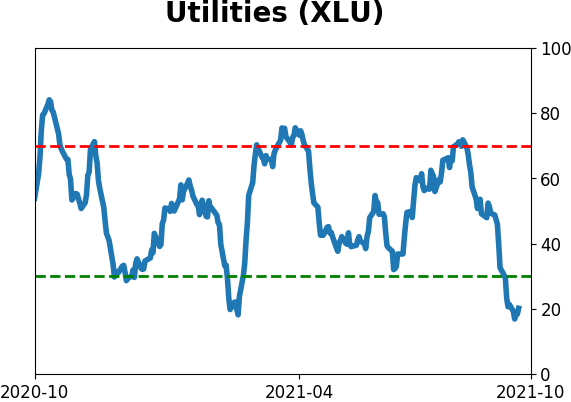
STOCKS AND SECTORS - UTILITIES
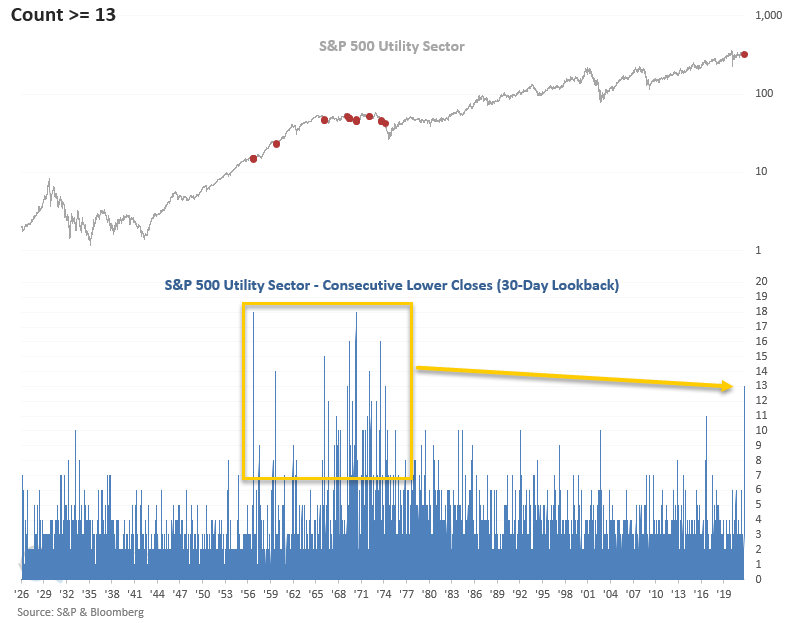
Dean noted that the S&P 500 Utility sector closed lower for 13 consecutive days. The last instance of the magnitude occurred over 48 years ago, in April 1974. We wonder if the interest-rate-sensitive utility sector is signaling that inflation will persist at a higher level for a much more extended period than most think. The surge in energy prices of late certainly helps the case.
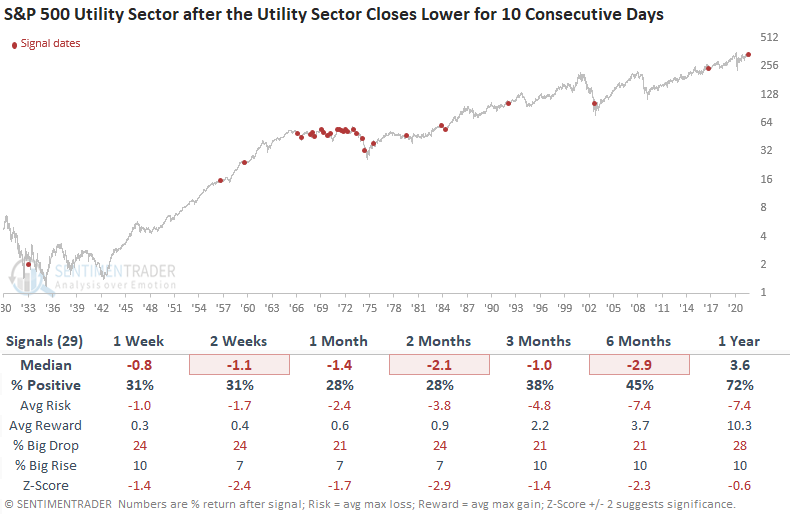
Let's conduct a study to assess the outlook when utilities close lower for ten consecutive days. The lower threshold level allows access to more historical instances.
The results for utilities look poor on almost all time frames. Interestingly, the 1-year time frame looks okay from a consistency point of view. The study is heavily influenced by the 1966-1982 secular bear period when inflation impacted equities.
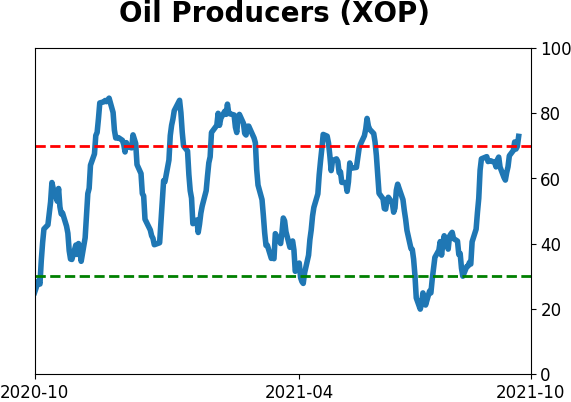
STOCKS AND SECTORS - ENERGY
Like we saw with the Hang Seng and Industrials, Energy stocks have seen something of a panic. But unlike the other two, these stocks have also seen a quick about-face.
Using the same concept as the other two, and computing a composite breadth measure that aggregates nine different breadth metrics to detect hints of panic, Energy stocks suffered a panic spike in mid-August. But within a 30-day window, the panic completely reversed and went into negative territory.
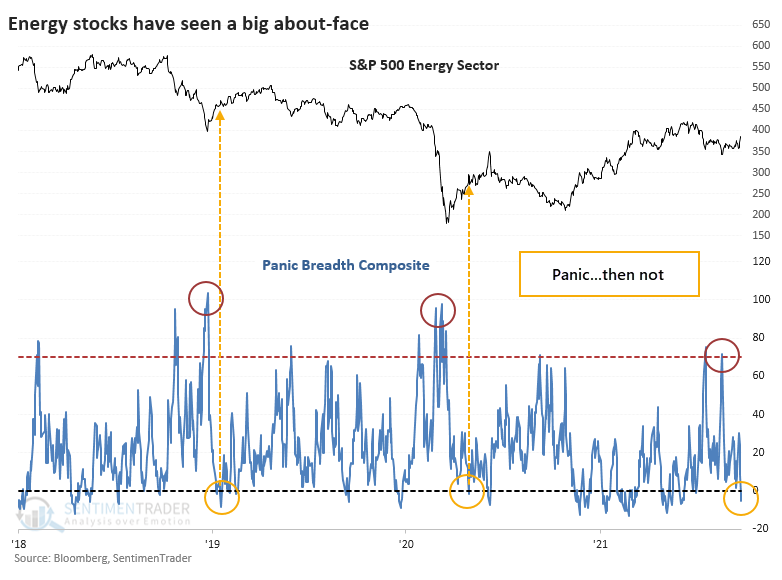
There have been two recent times when the Panic Breadth Composite reversed from above 70% to below zero within 30 days, in January 2019 and April 2020. Volatility was extremely high following the initial pandemic rebound but the sector did work higher both times for a couple of months before giving back those gains.
Volatility tends to be higher during bear markets, and the overwhelming majority of signals occurred when the S&P 500 Energy sector was below its 200-day moving average. There were only four other times it triggered when above the 200-day, like it did this time. The success rate was higher (as much as we can read into a sample size of four), but not without volatility. Over the next year, Energy stocks rallied each time, but three of the four instances were clustered in an 8-month window.
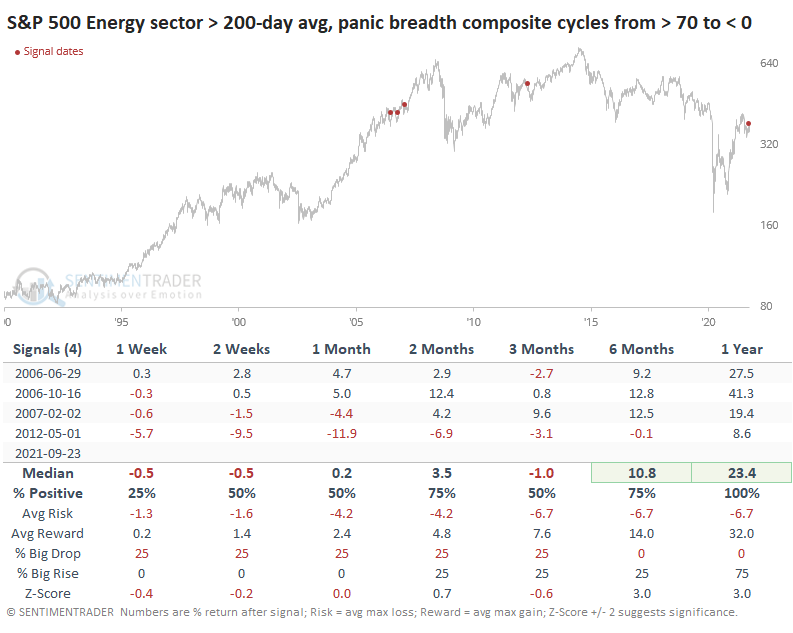
With signals like this, losers tend to start losing right away as sellers see their first real opportunity to get out at a good price. While that can happen with winning signals, too, the selling tends to be milder and briefer. Overbought conditions are seen as less of a barrier and perhaps even a sign of unusual and persistent strength, which attracts even more buyers. The sector has a lot to prove, and this will be a good test.
STOCKS AND SECTORS - CHINESE TECH STOCKS
Few markets have been hit by a more constant barrage of uncertainty and negativity over the past several months than Chinese stocks. Technology-related issues have been hit particularly hard from all sides.
The most popular domestic fund for trading Chinese internet stocks is KWEB, based on the CSI Overseas China Internet Index. The index has just over 50 member stocks, and it's hard to find an uptrend among them.
During mid-August, exactly 0% of these stocks were trading above their 50-day moving averages before bouncing. It's an even uglier picture when looking at the percentage of these stocks in long-term uptrends. In recent days, only 4% of them have closed above their 200-day moving averages, ranking among the very worst readings in available history.
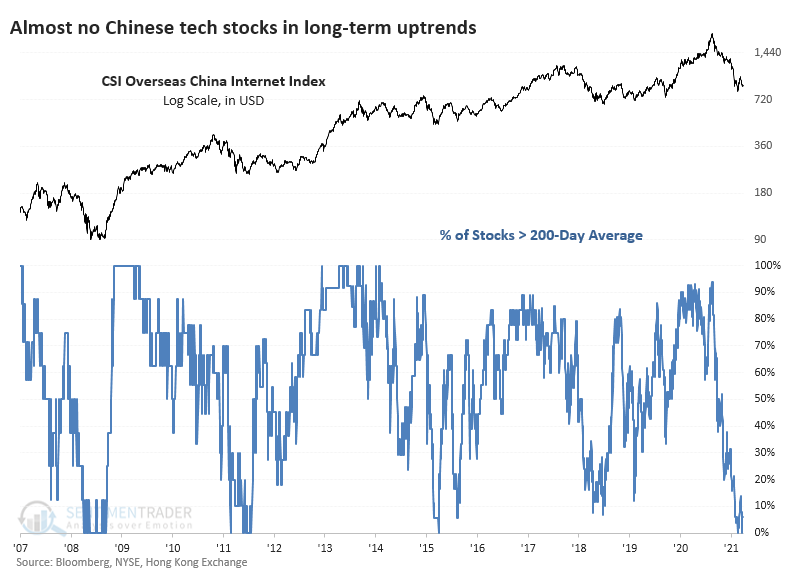
The plunge in late July caused more than 50% of Chinese 'net stocks to fall to a 52-week low, only the third time in 15 years that so many have done so at the same time. Not only have they been falling to new lows, but they've also suffered gigantic drawdowns. Across the 53 stocks in the index, the average stock is down nearly 60% from its 52-week high. The only period that (barely) exceeded this rout was the depths of the global financial crisis.
At least one of these firms - the most important one, carrying by far the most weight - is apparently sensing a bargain in their own shares. The company has authorized, and executed, stock buybacks almost every day for over a month. While it's not a big percentage of its outstanding shares, it's still the largest in almost a decade and ranks 4th since 2004.
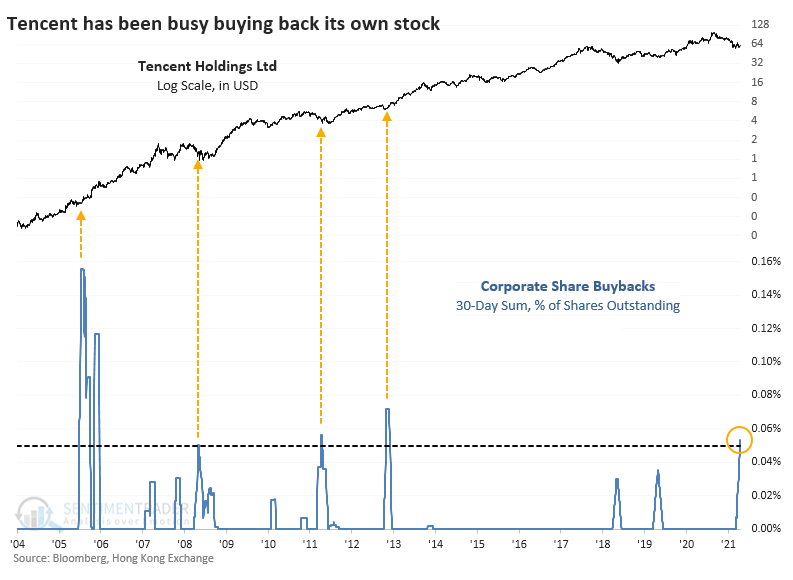
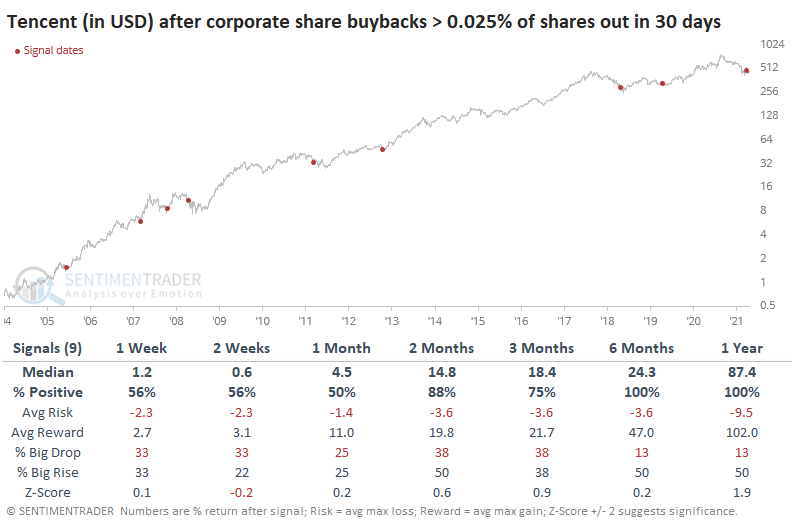
The company has had an exceptional record at deploying capital in this way at opportune moments. Whenever they've bought back 0.025% of shares within a 30-day window, their stock has rallied a median of 84% over the next year, with no losses either 6 or 12 months later.
Who's not buying? The retail traders who rely on margin. The volume of shares bought on margin has plunged in recent sessions, down more than 50% from the peak. It hasn't reached the depths of apathy seen at other lows in speculative behavior, but it's getting close quickly.
There is a clear danger, both known and unknown, in these stocks. Nobody knows what the government will do or say, and whether the worst of the news has already been priced in. Companies like Tencent seem to believe so, or they wouldn't be buying back their own shares.
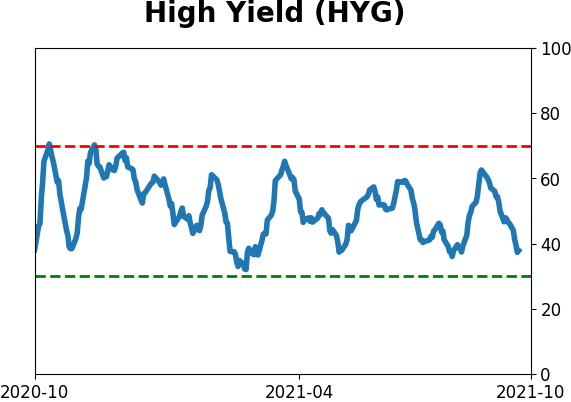
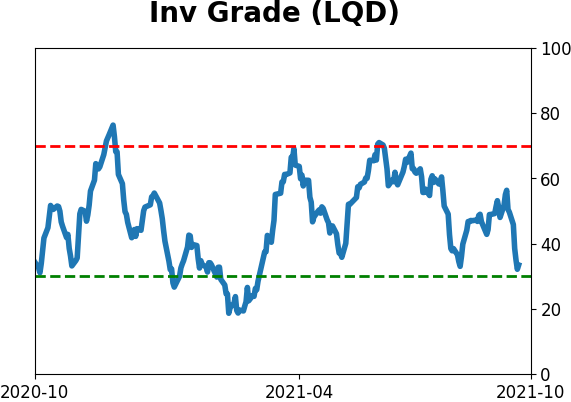
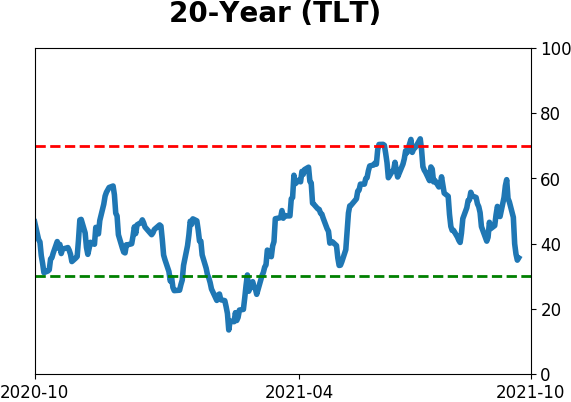
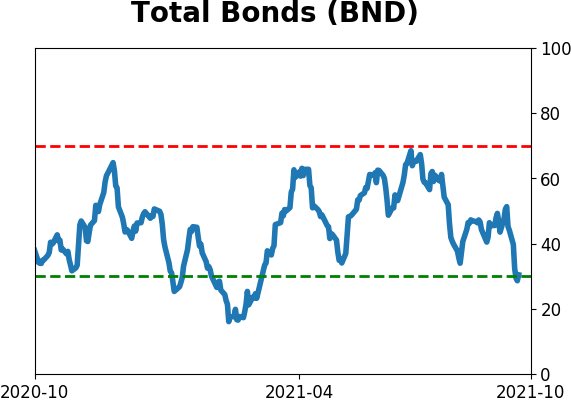
| BONDS | ||
 | ||
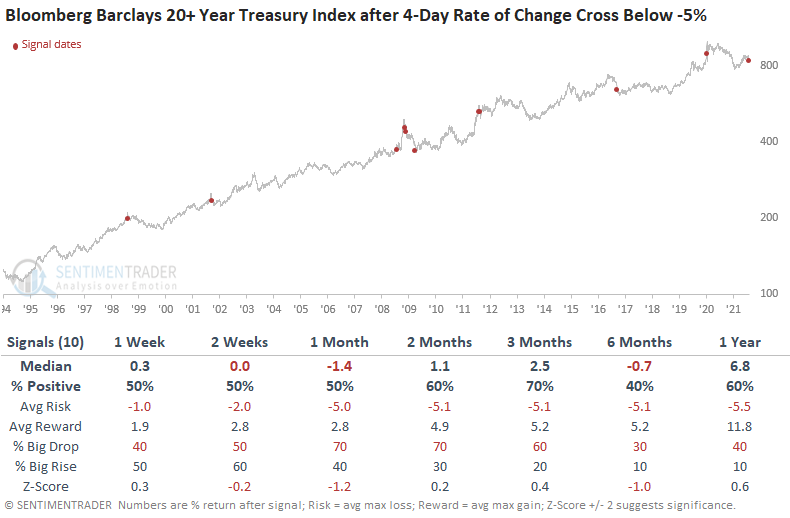
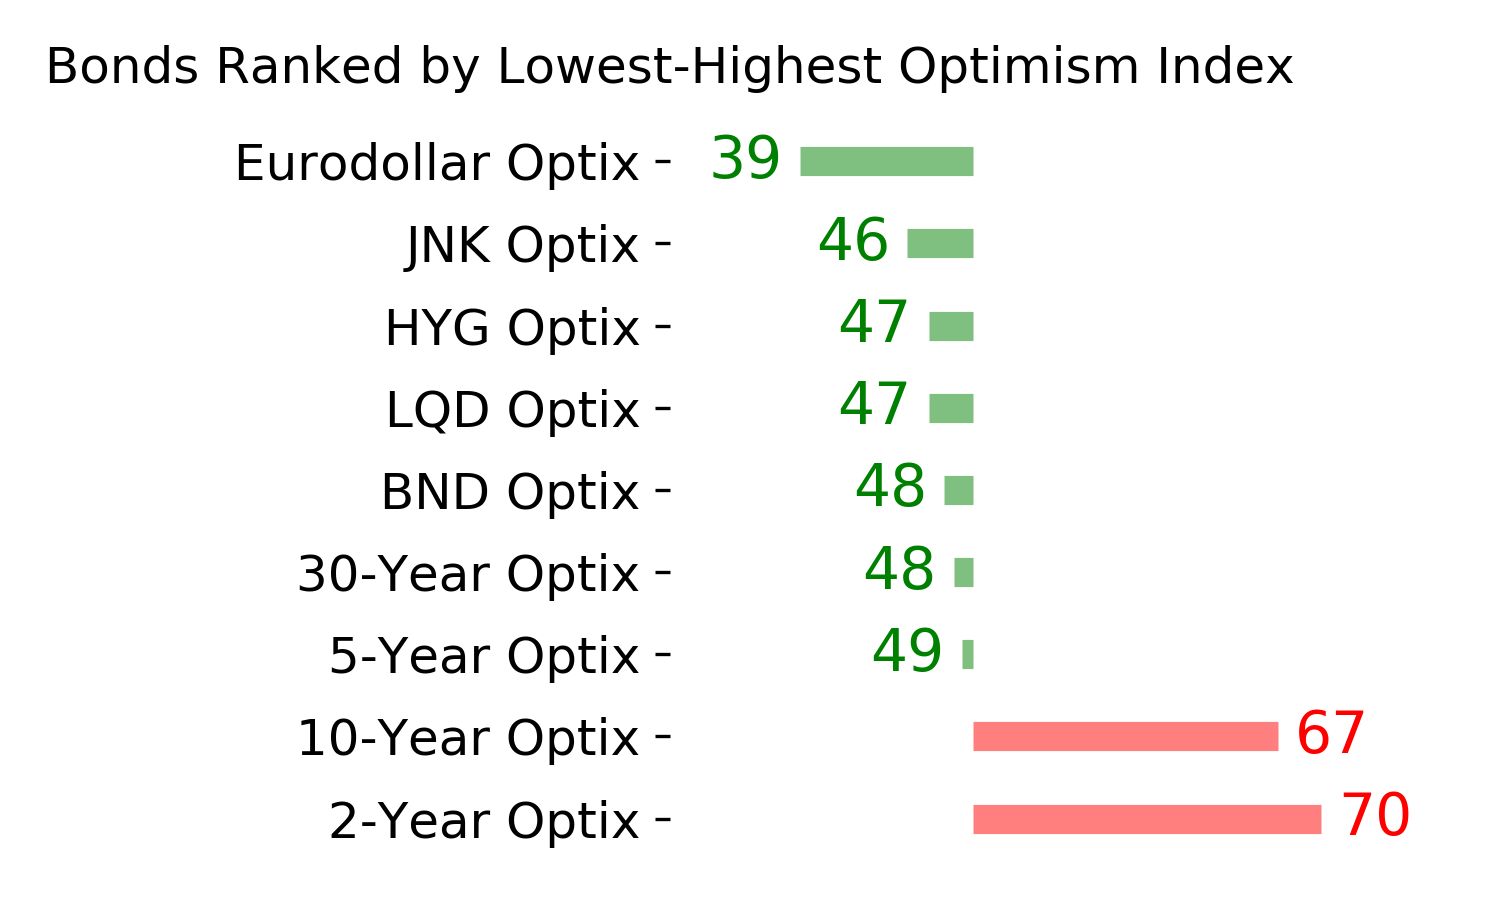
At the close of trading on Tuesday, the Bloomberg Barclays 20+ Year Treasury Bond Index registered a 4-day decline of greater than 5%. According to Dean, this is only the 11th reversal so big since the data started in 1994.
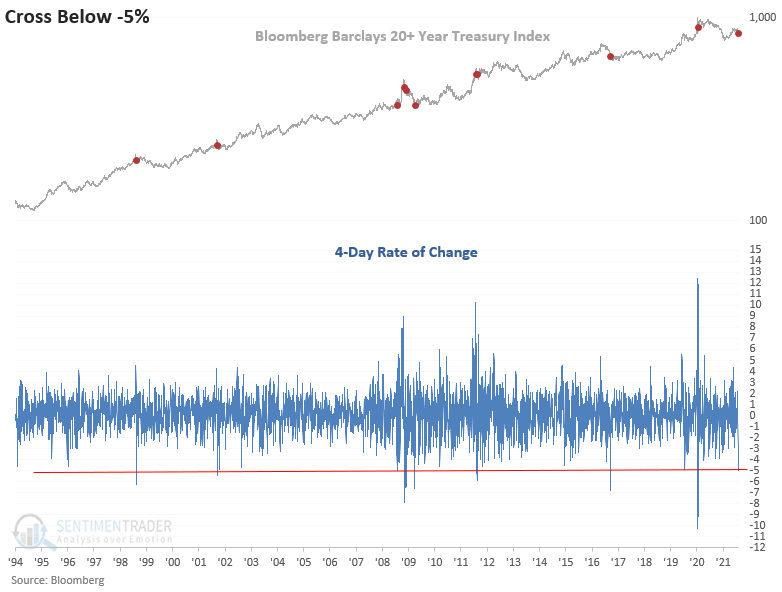
While the sample size is small, one can spot a pattern. We see a coin toss environment with generally weaker returns in the first month followed by a mean reversion bounce in the 2-3 month time frame. The 6-month window would suggest falling prices or a rising interest rate environment.
The S&P 500 returns look slightly better than historical averages on a short-term to intermediate-term basis and much better in the 6-12 month window. The Dollar Index looks strong on an intermediate-term basis. Once you get past the 3-month window, the dollar shows a tendency to decline.
Determining the market message from bonds is critical at this juncture in the cycle. Rising energy prices will put upward pressure on yields. The crucial question is how sustainable are the inflationary pressures and will it influence monetary policy.
Jay noted that the bond market staged a nice advance from mid-March into late July. Since then, things have taken a turn for the worse and now we are about to enter a seasonally unfavorable period.
The chart below displays the cumulative $ +(-) from holding a long position in t-bond futures ONLY during the seasonally unfavorable period from Trading Day of the Year 191 through TDY 217.
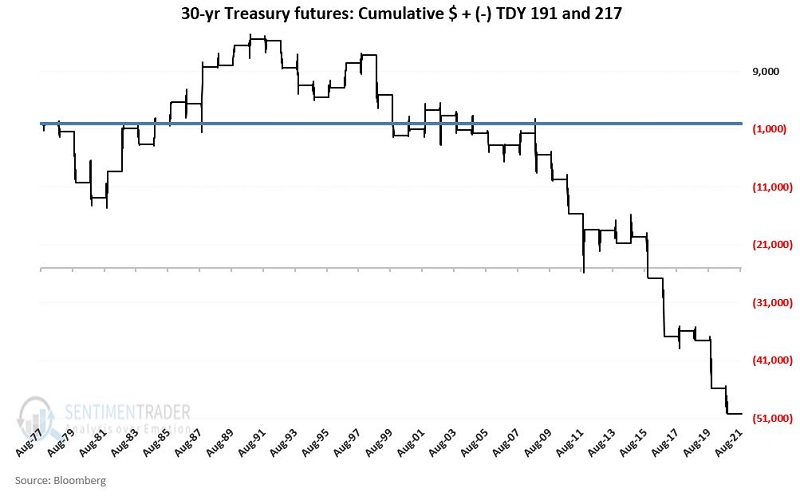
This period did see some strength in the 1980s. But since then, it has mostly been pure pain. Since 1998, this stretch of the calendar showed a gain 5 times while declining 18 times, with an average loss more than twice as large as the average gain.
| COMMODITIES | ||
 | ||
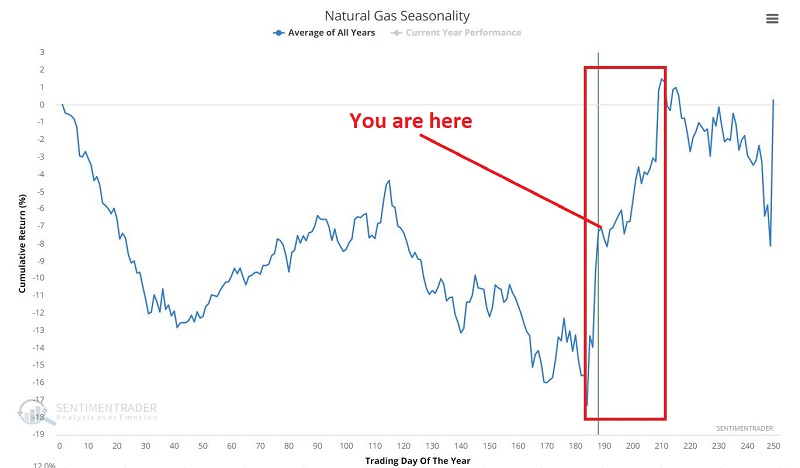
Jay looked at the outlook for a natural gas breakout, and why a Bull Call Spread might be an appropriate strategy for someone willing to bet on that breakout.
As you can see in the chart below, natural gas remains in a favorable seasonal period, with further potential upside in the next month and a half.
For the sake of example, we will assume that a trader wants to bet on an upside breakout while keeping risk at a reasonable level.
In the chart below (courtesy of Optionsanalysis.com), we see that the implied volatility (solid black line) for options on ticker UNG has risen to a very high level. This tells us that UNG options are "expensive," i.e., there is a great deal of time premium built into the price of the options.
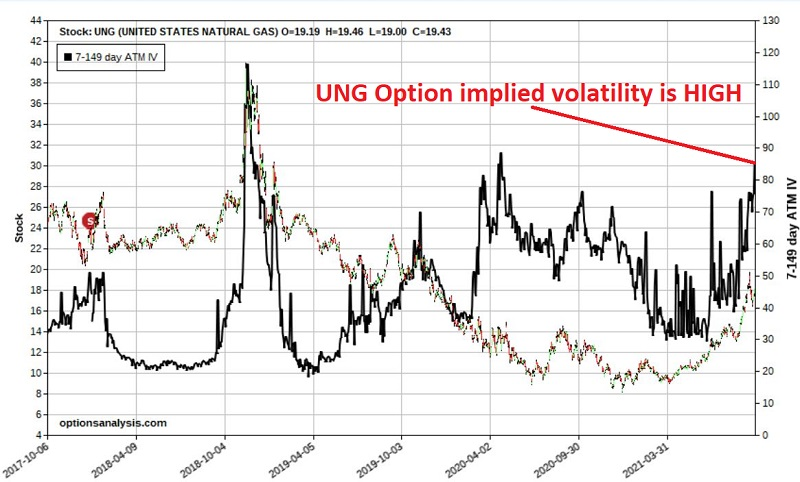
This high implied volatility tells us that if we buy a call option:
- IF the breakout falls to materialize AND price retreats (or even remains mostly unchanged for a while)
- There is a good chance that call option IV will plummet
- Thus leading to a large loss of time premium in the call option we bought
So I will invoke two arbitrary assumptions/decisions:
- Because of high price volatility, I do not want to sell premium (for fear of getting stuck on the wrong side)
- Because of high implied options volatility, I do not want to buy straight calls or puts
So, what does that leave? In this instance, let's look for the potential to buy one option at a lower volatility and sell another option at a higher volatility.
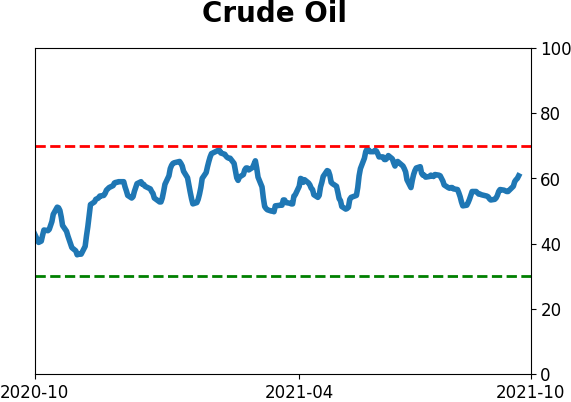
CRUDE ISSUES
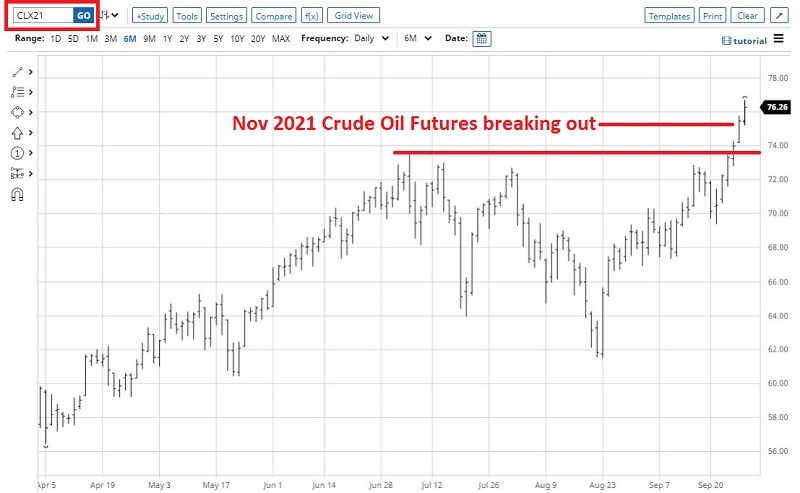
Up until about July of this year, crude oil had been one of the hottest commodities around. After cratering in April 2020, crude has rallied north of $75 a barrel.
In the chart below, we see that crude oil futures just broke out to a new high in powerful fashion after several months of consolidation.
At the moment - and as always - some pundits expect crude to continue to rally much higher, while others hold the opposite opinion. But Jay shows that one thing we do know is that owning a long position in crude during October and November can be a dangerous place to be.
The chart below displays the Annual Seasonal Trend for Crude Oil.
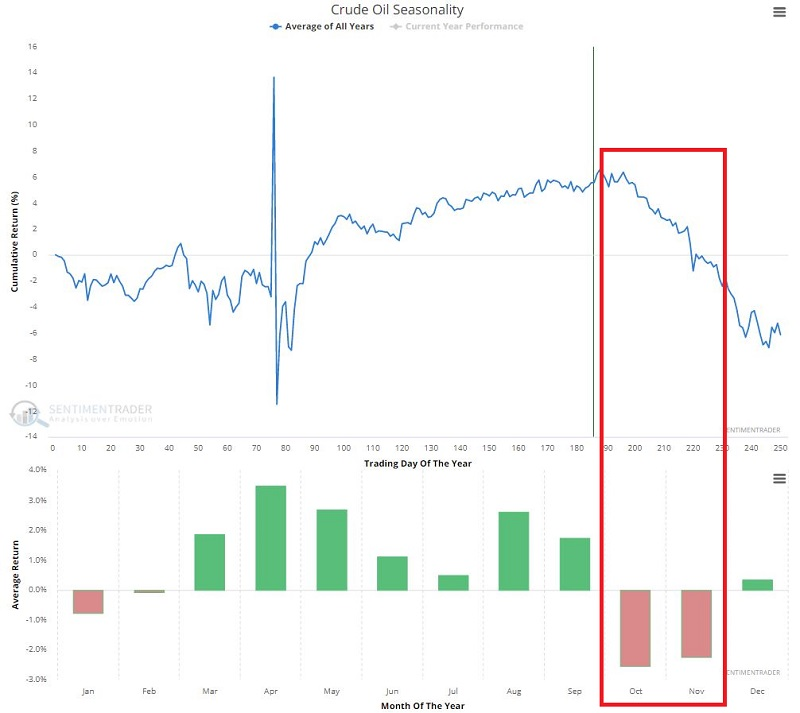
Now the first reaction from many people when they see this chart is to assume that crude oil is doomed to lose ground in the months ahead. But that is not the correct message. Consider that 42% of the time, crude registered a gain during October and November combined, and in 2011, crude oil futures gained over $21,000 per contract.
So, blindly assuming that crude is headed lower over the next two months is probably a mistake. At the same time, one would typically need a compelling reason (not to mention nerves of steel) to hold a long position in crude oil during this period.
Jay also notes that the term structure of crude oil futures shows the relationship of the near-term futures contract to a further-out contract. If it is above 1.0, then the near-term contract is priced higher than the further-out contract, called backwardation. If below 1.0, then the market is in contango. When it goes into severe contango, that is a sign of stress in the market and has typically only occurred when the crude oil formed a long-term bottom.
Historically, readings above 1.05 have signaled a less than favorable outlook for energy commodities. If we look at the performance of crude oil starting back into the 1980s when Crude Oil Term Structure crossed above 1.05 for the first time in 3 months, in the past 15 years results have been decidedly poor.
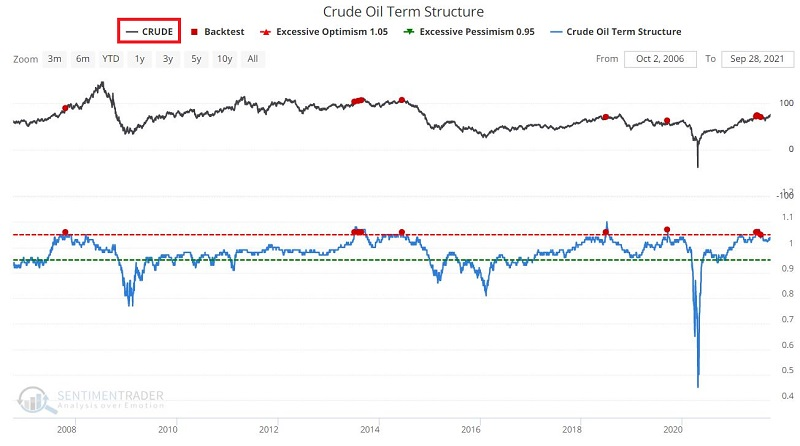
According to our Backtest Engine, crude was higher six months later only 14% of the time. Returns also tended to be negative for unleaded gas and heating oil following these signals in crude.
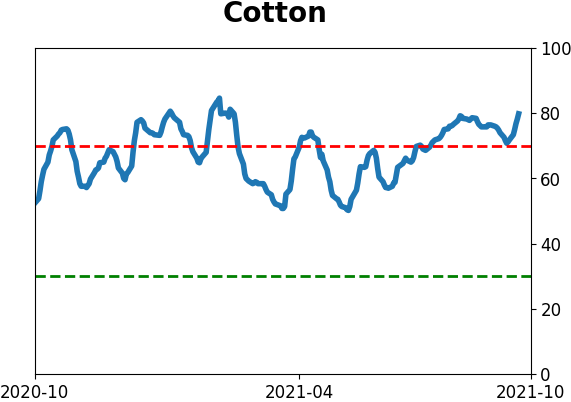
COTTON RALLY
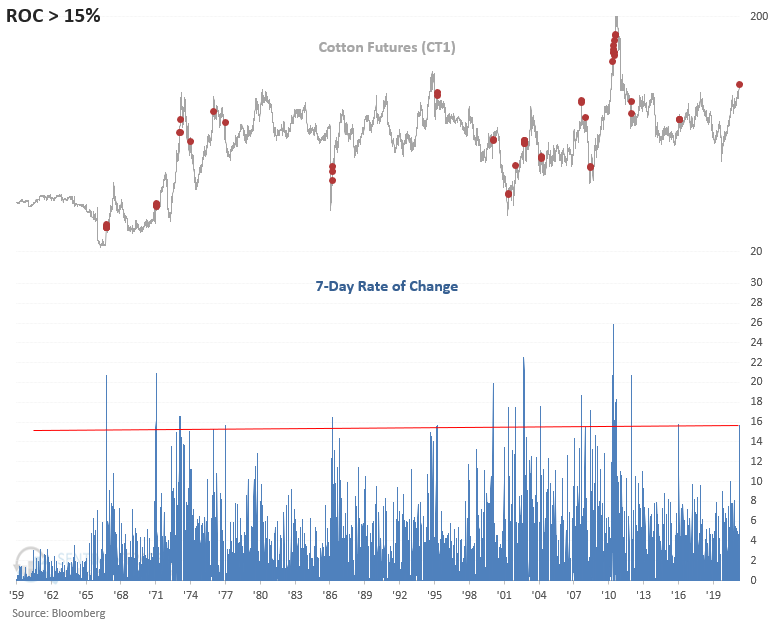
Dean pointed out that for only the 23rd time since 1959, cotton prices have risen by 15% or more over a seven-day period.
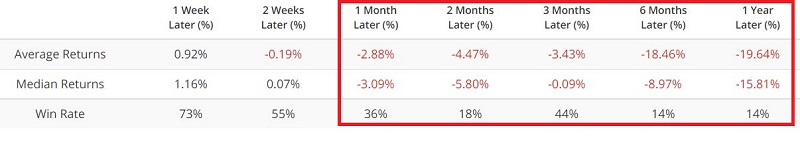
Let's conduct a study to assess the outlook for cotton futures when the 7-day rate of change crosses above 15% and include a condition that the commodity closes at a 2-year high. The goal is to isolate historical instances similar to the current one.
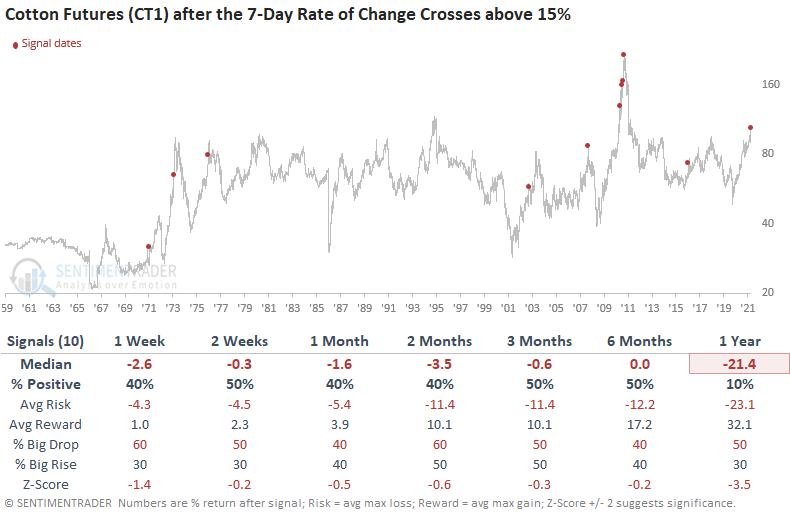
Results look weak across all time frames, and the 1-year window looks dreadful. As the chart shows, cotton is a commodity that rarely sustains long uptrends.
Active Studies
|
|
|
|
|
|
Indicators at Extremes
|
|
|
Portfolio
|
|
|
|
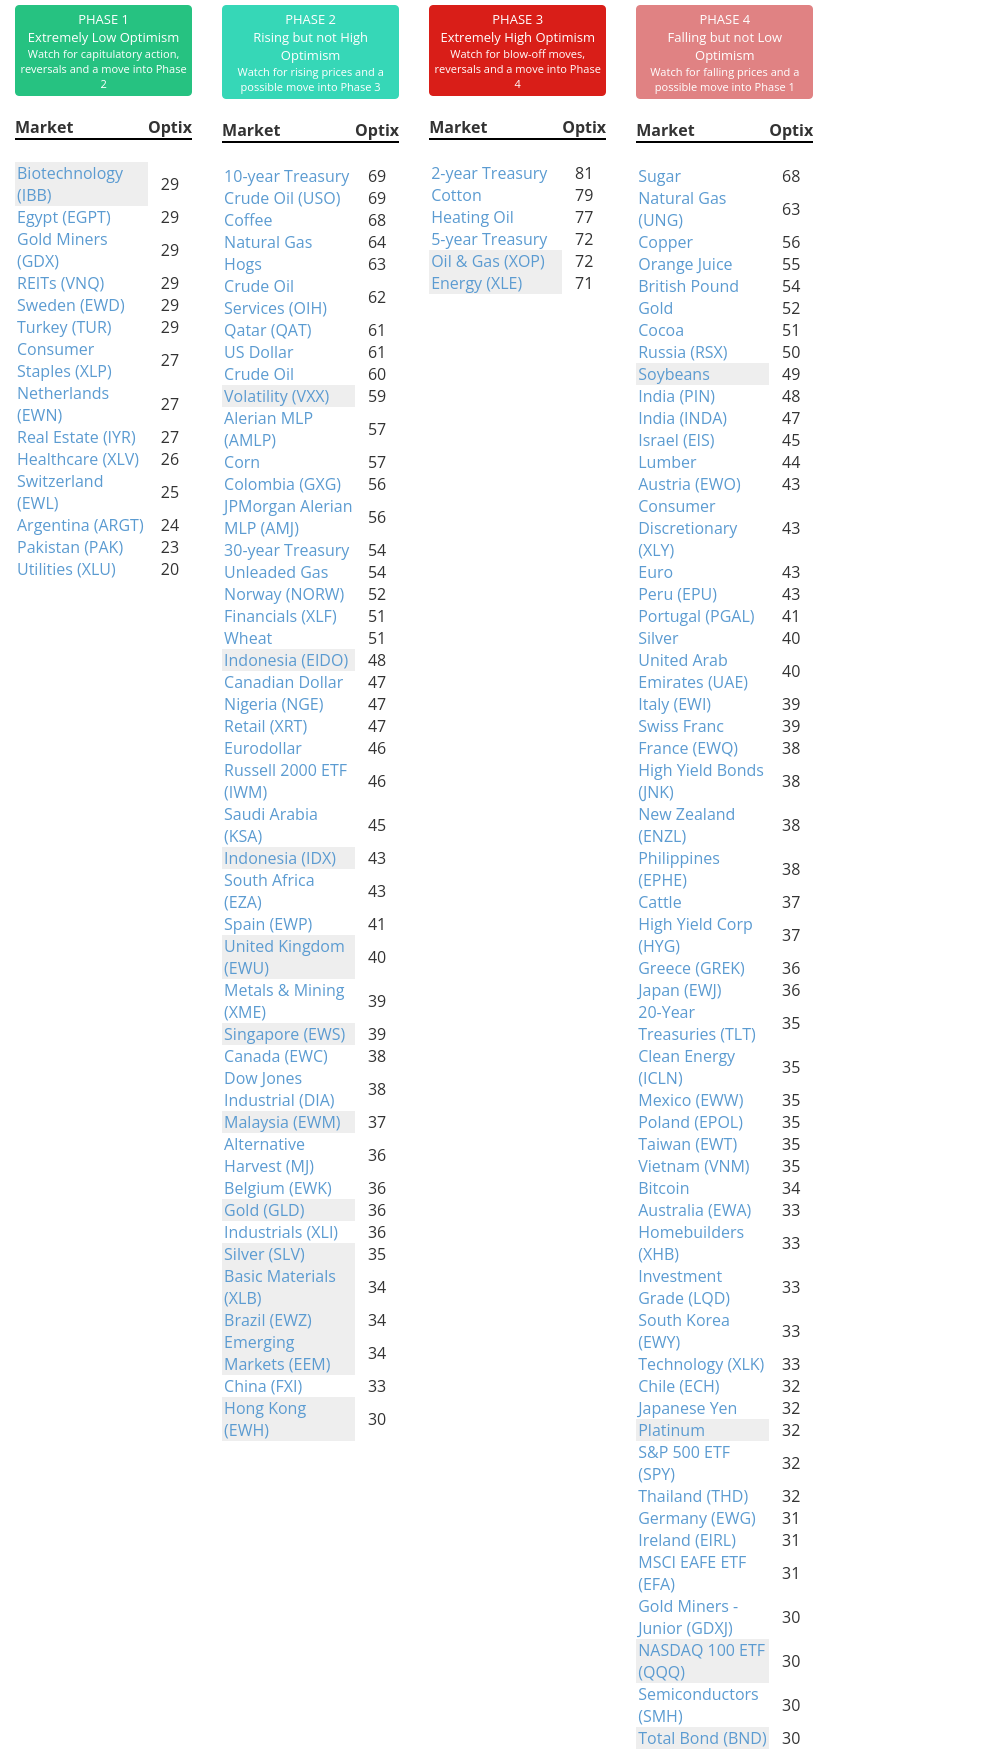
Phase Table
|
|
|
Ranks
|
|
|
|
|
|
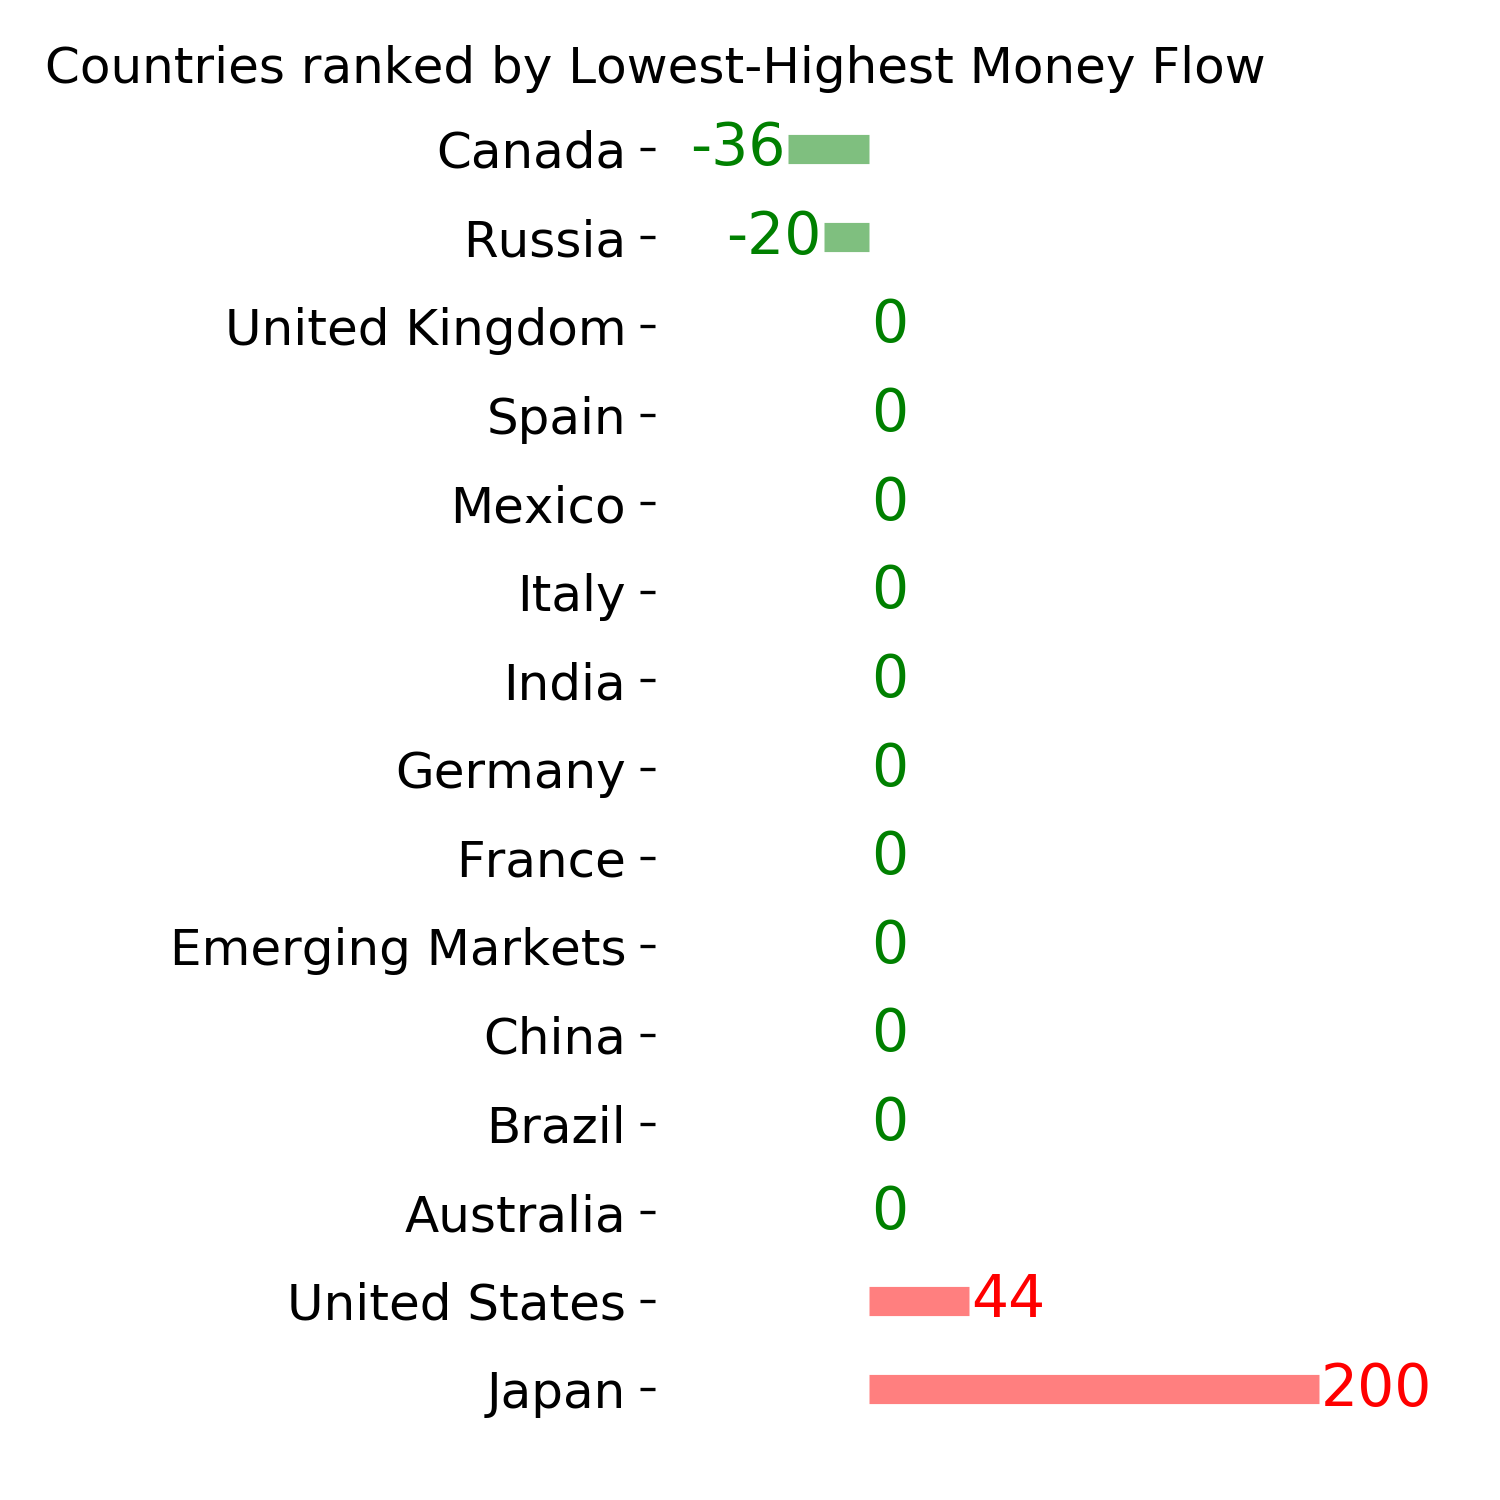
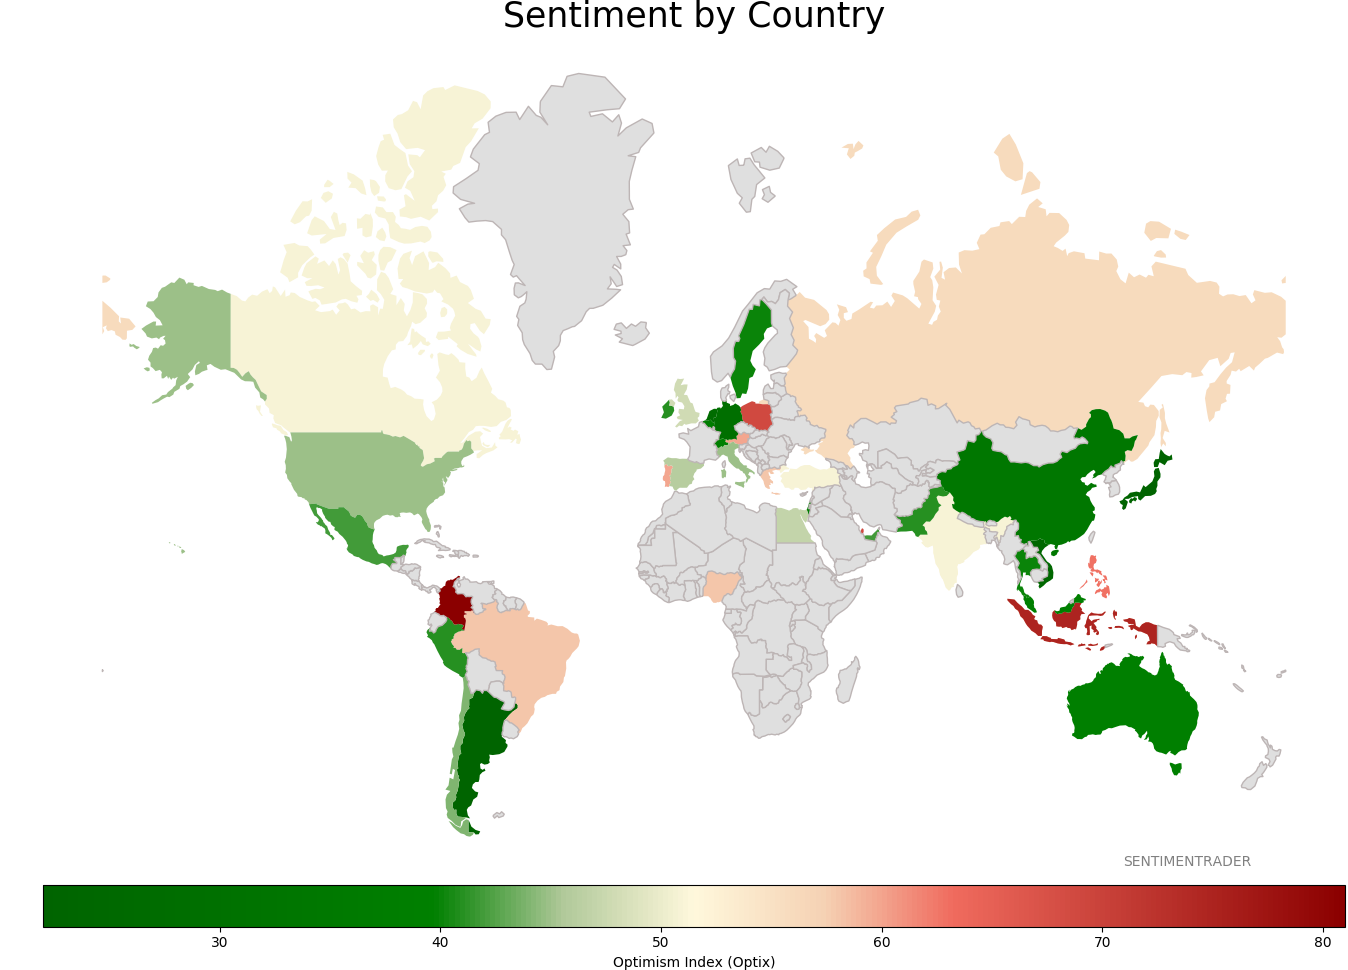
Sentiment Around The World
|
|
|
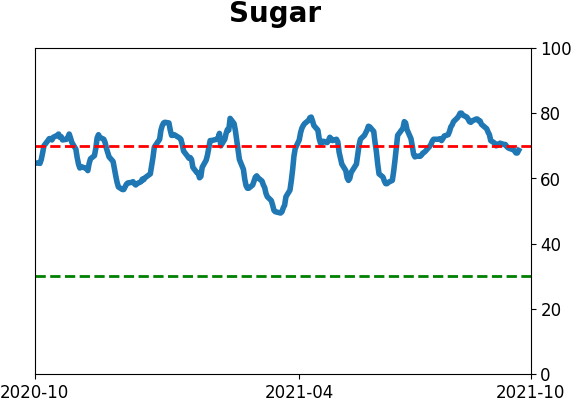
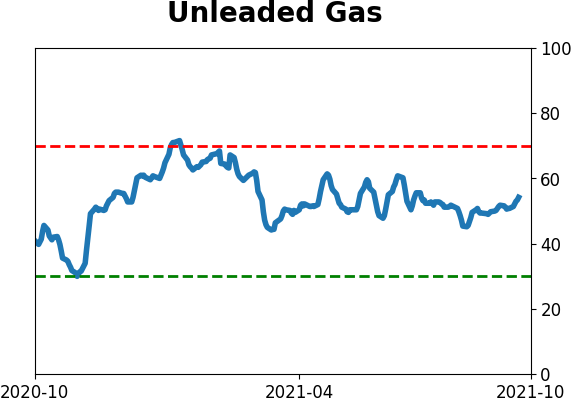
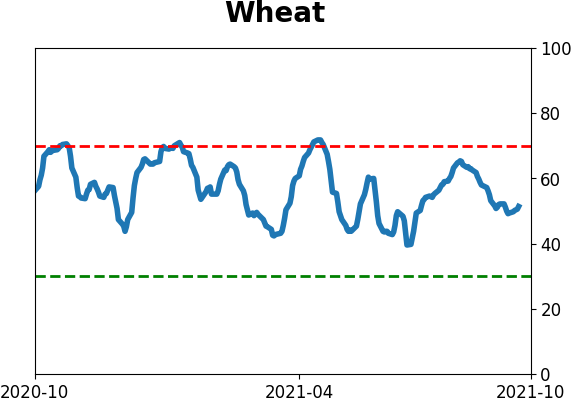
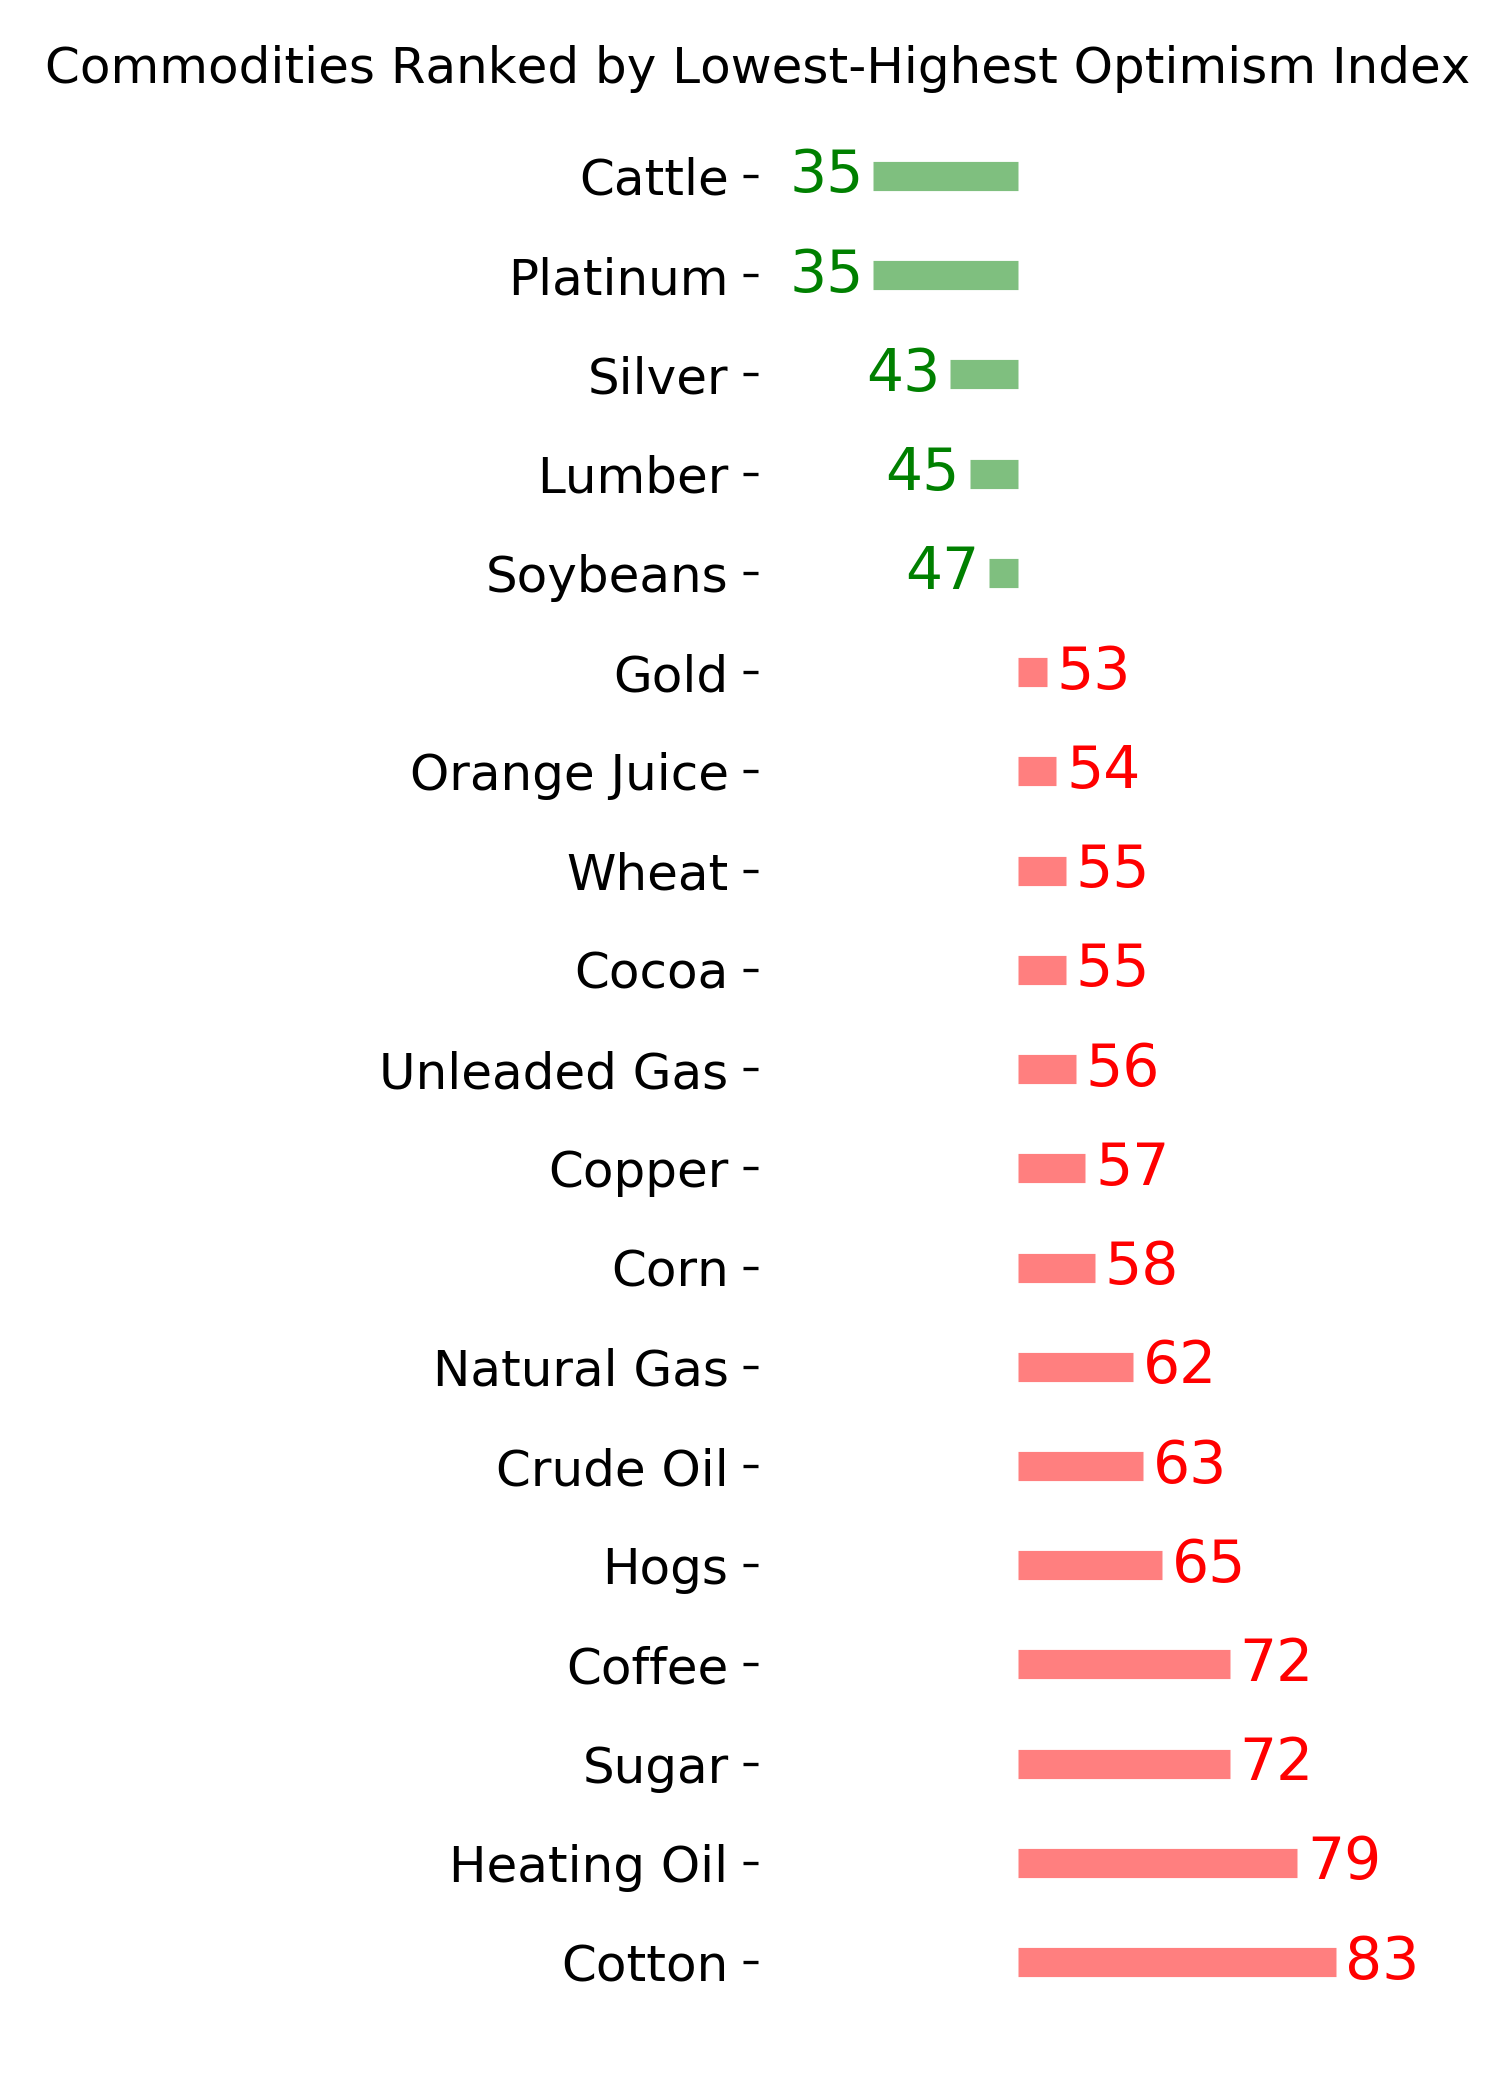
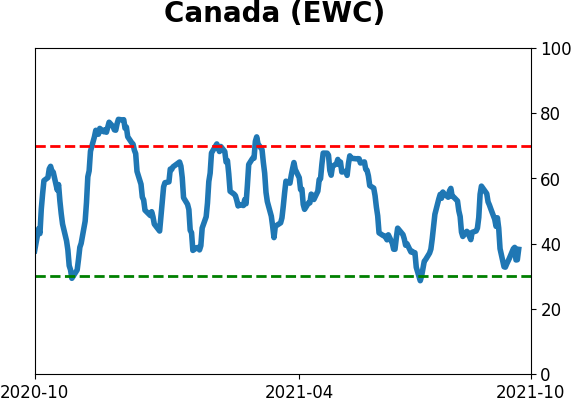
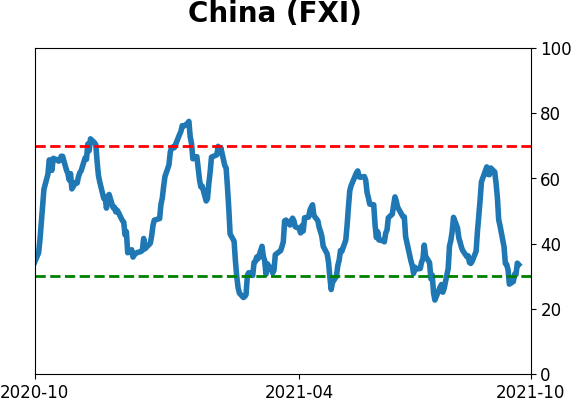
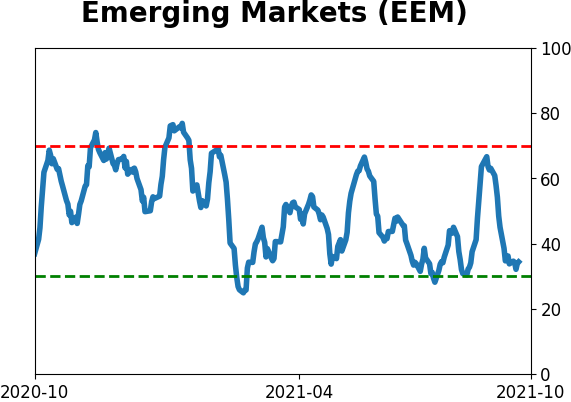
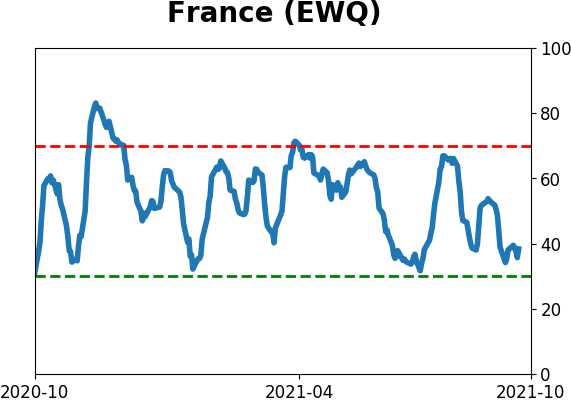
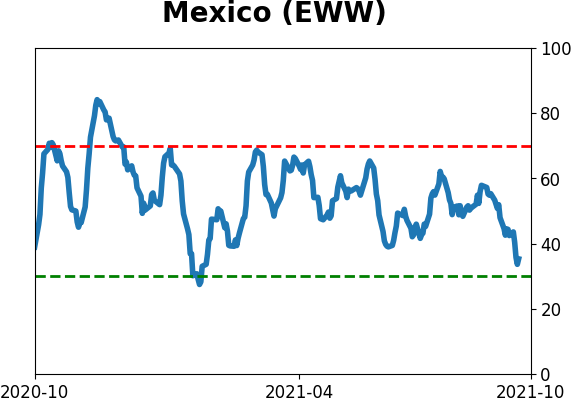
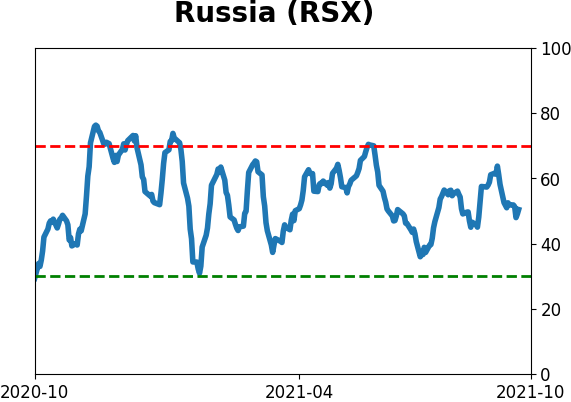
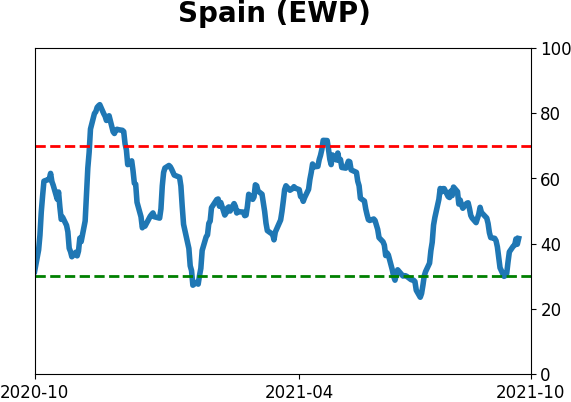
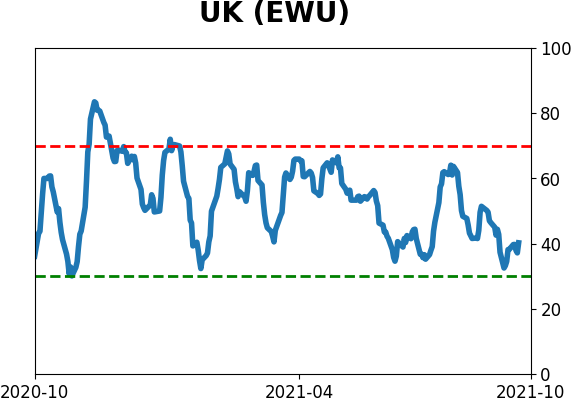
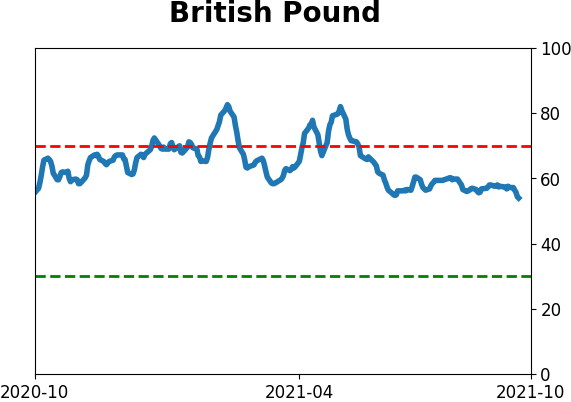
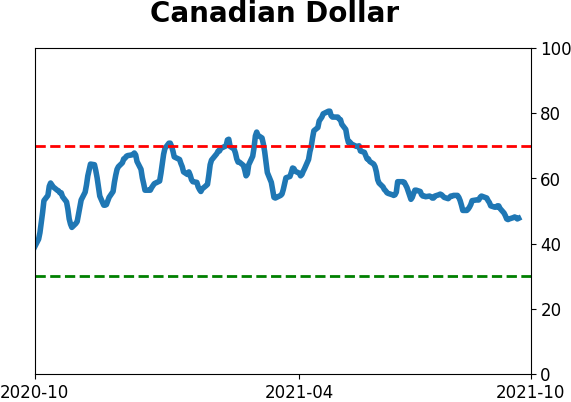
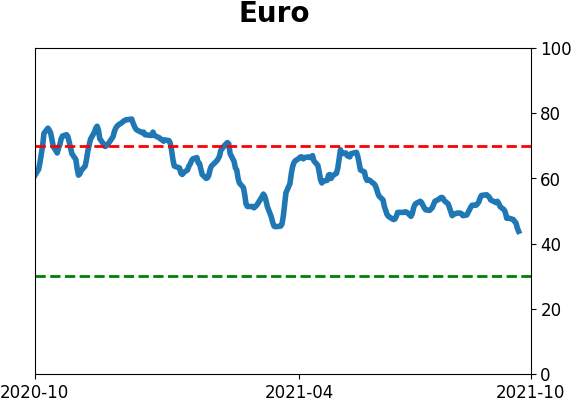
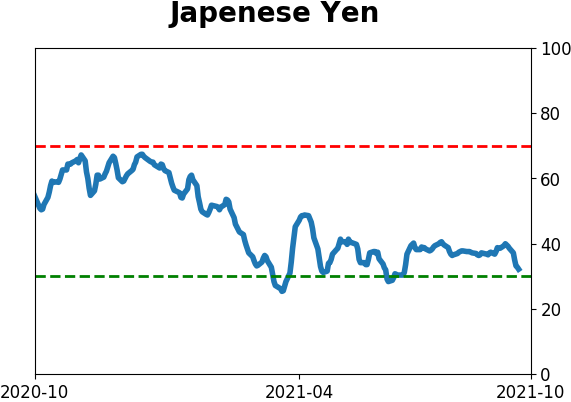
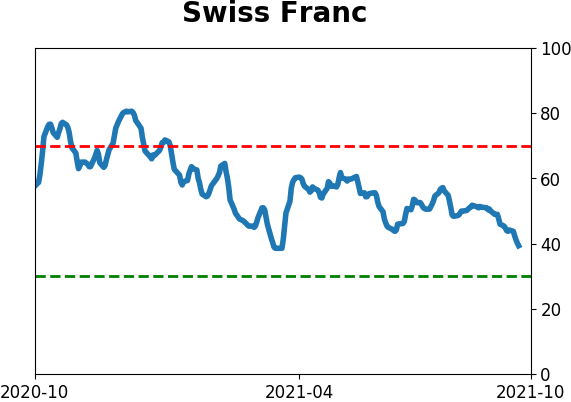
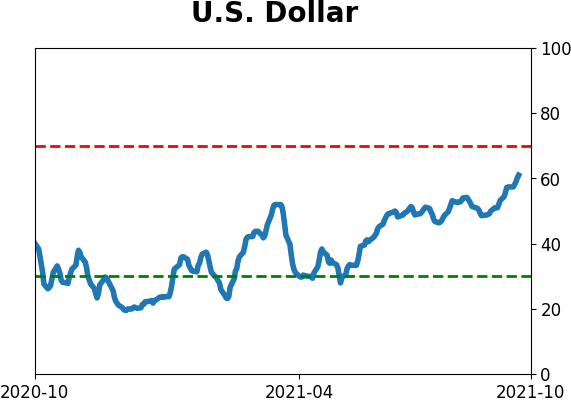
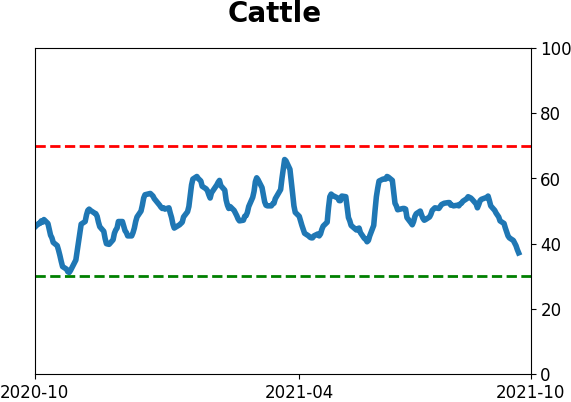
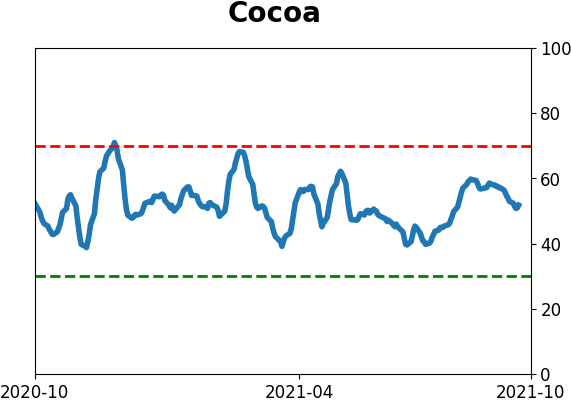
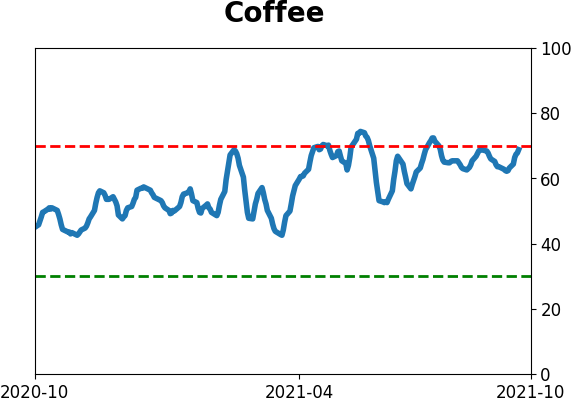
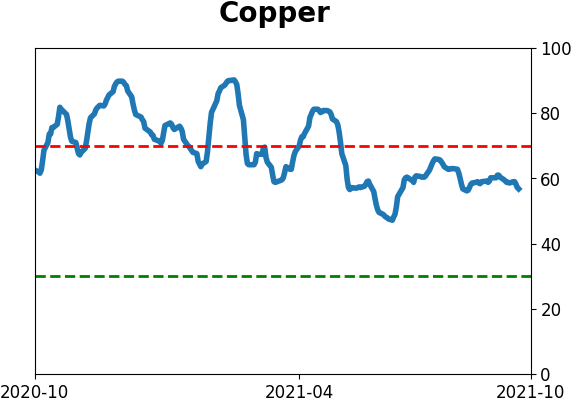
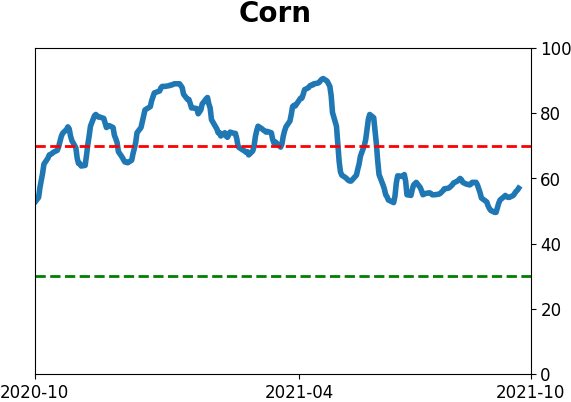
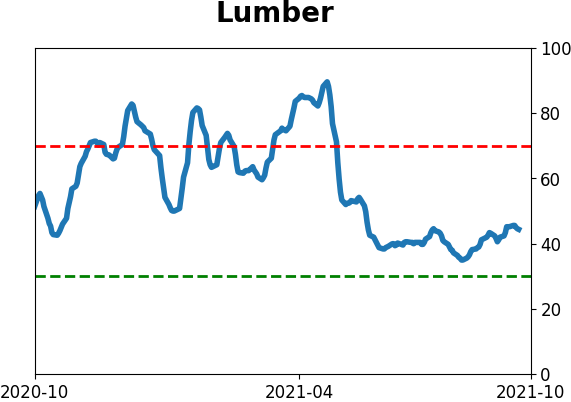
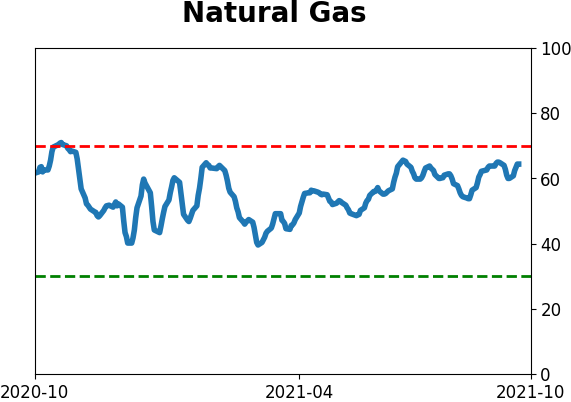
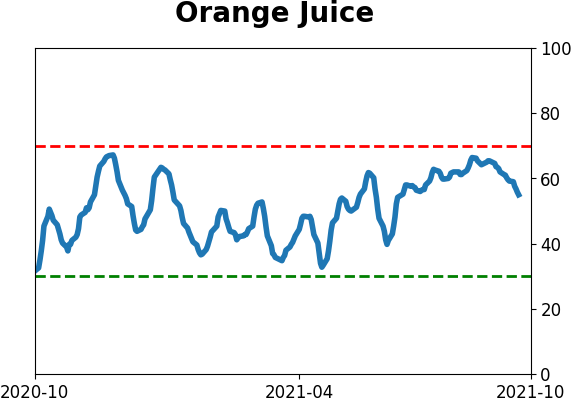
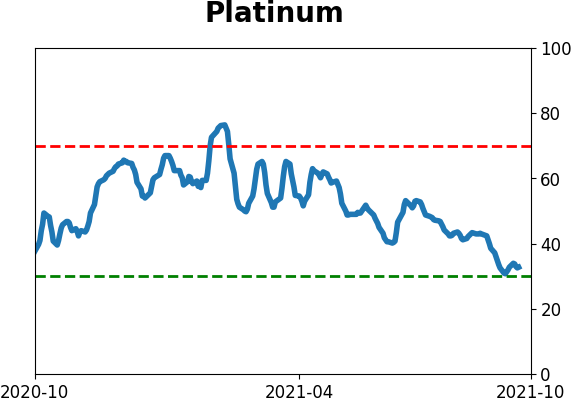
Optimism Index Thumbnails
|
|
|
|
|
|
|
|
|
|
|
|
|
|
|
|
|
|
|
|
|