Headlines
|
|
A Couple of Historic Streaks Screech to a Halt:
The S&P 500 finally ended a couple of long streaks of positive price momentum. It suffered its first close more than 5% from its previous 52-week high, and ended 7 straight months of gains.
When to Take a Week Off(?):
Finding an "edge" in the market is one thing. Figuring out how to use it to your advantage is another. In this piece, we highlight the month-by-month performance of a stock market anomaly that "hides in plain sight."
Chinese Tech Stocks Are Washed Out:
Chinese technology stocks have suffered heavy selling pressure over the summer. Breadth metrics are showing few uptrends, many new lows, and huge drawdowns. At the same time, companies like Tencent are aggressively buying back their shares.
Bottom Line:
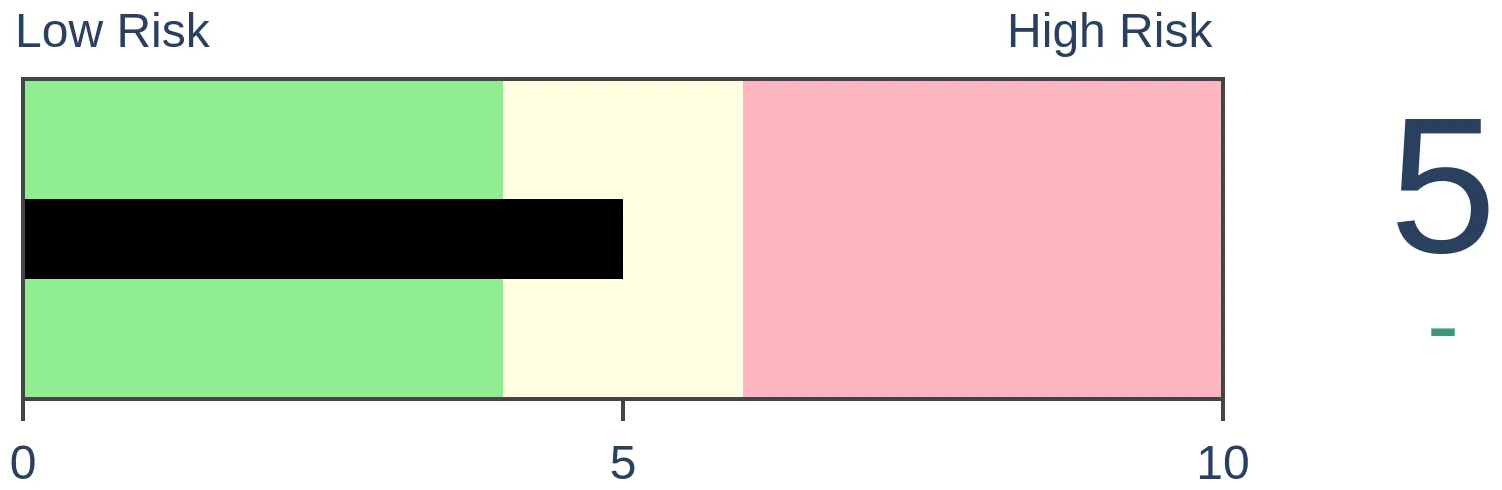
STOCKS: Hold
Sentiment continues to decline from the speculative February peak. With deteriorating breadth, this raises the risk of poor short- to medium-term returns until optimism and better breadth returns. See the Outlook & Allocations page for more. BONDS: Hold
Various parts of the market got hit in March, with the lowest Bond Optimism Index we usually see during healthy environments. Bond prices have modest recovered and there is no edge among the data we follow. GOLD: Hold
Gold and miners were rejected after trying to recover above their 200-day averages in May. Lately, some medium-term (not long-term) oversold extremes in breadth measures among miners have triggered.
|
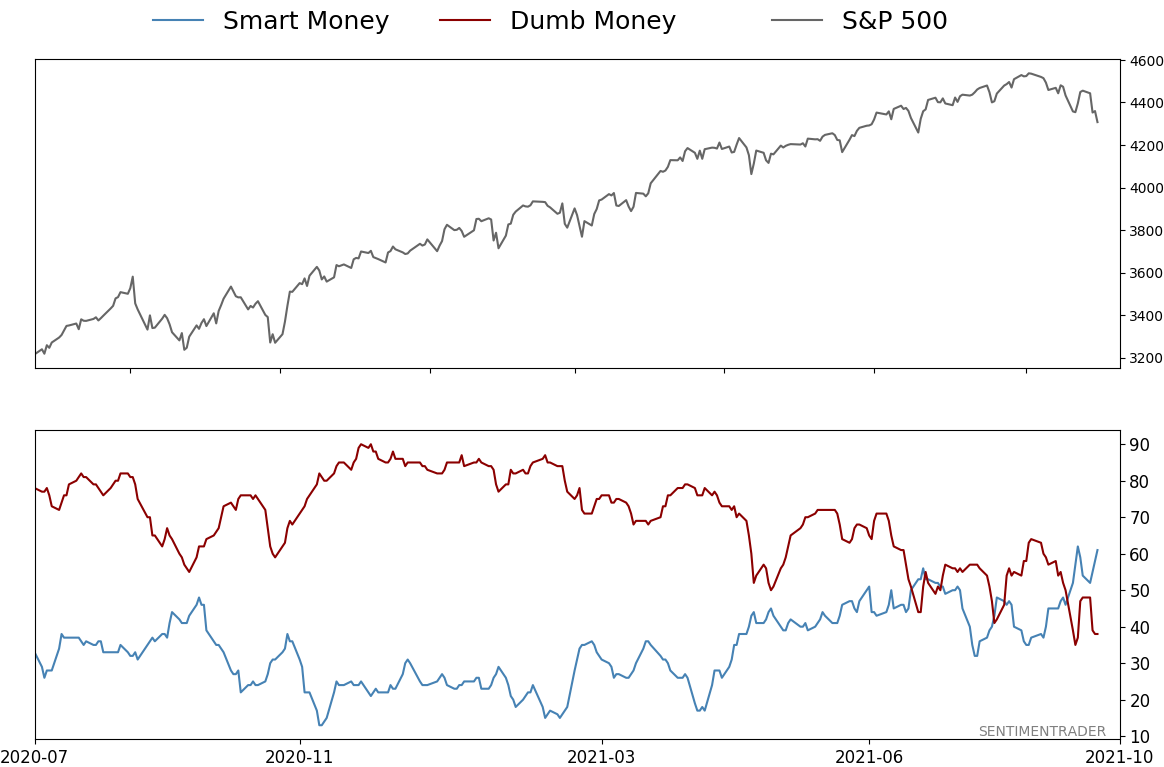
Smart / Dumb Money Confidence
|
Smart Money Confidence: 61%
Dumb Money Confidence: 38%
|
|
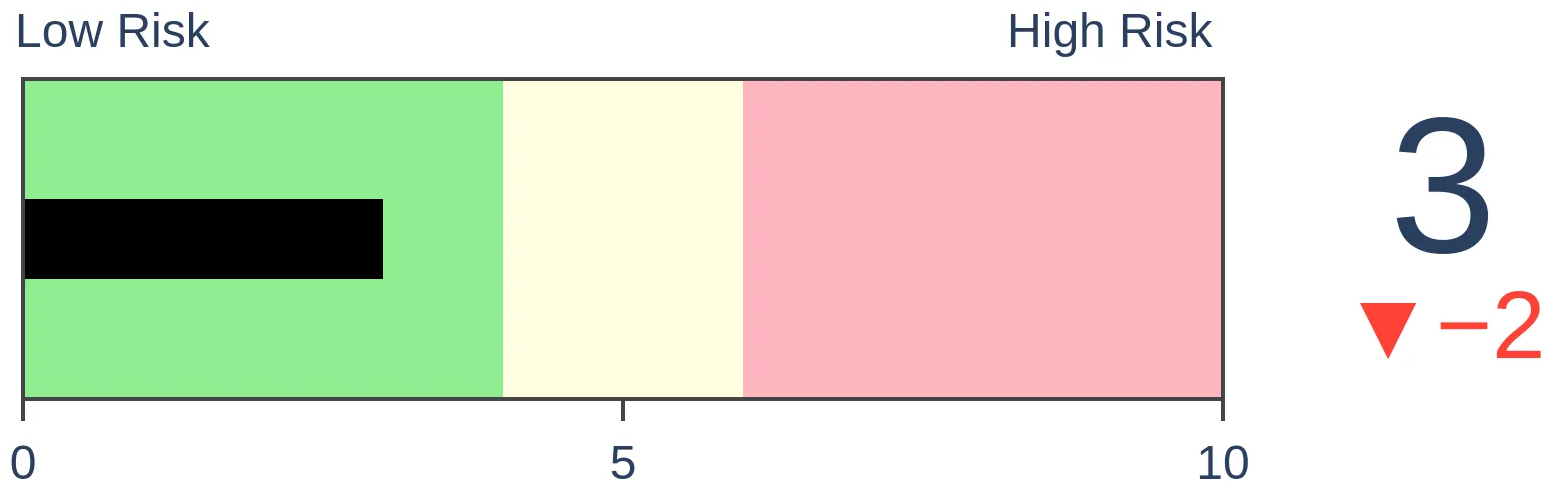
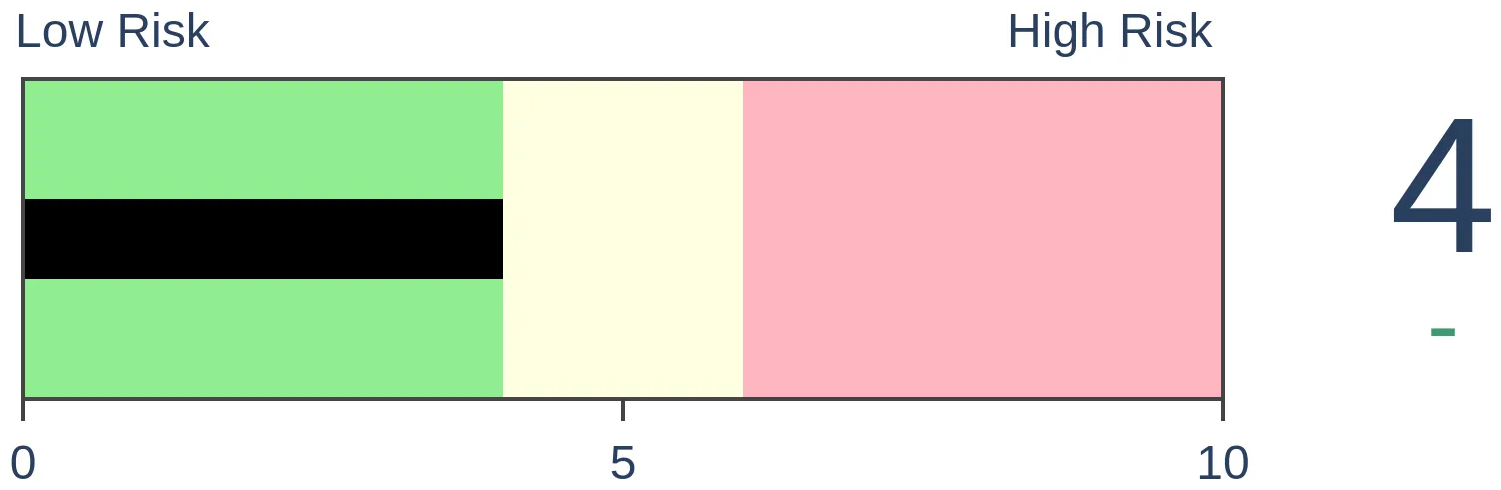
Risk Levels
Stocks Short-Term
|
Stocks Medium-Term
|
|
Bonds

|
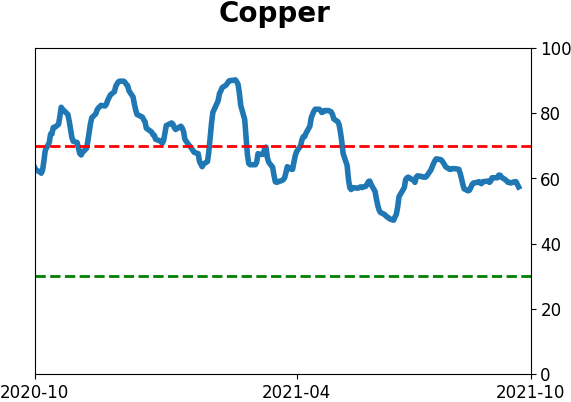
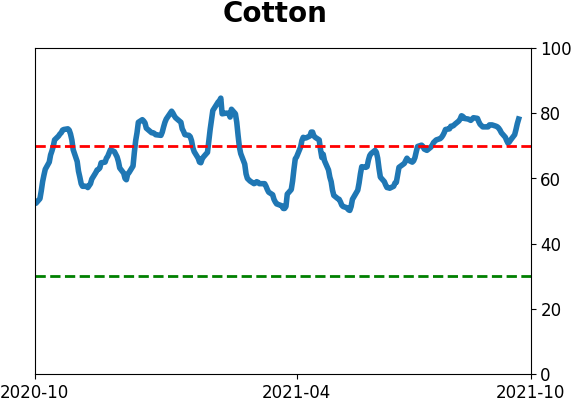
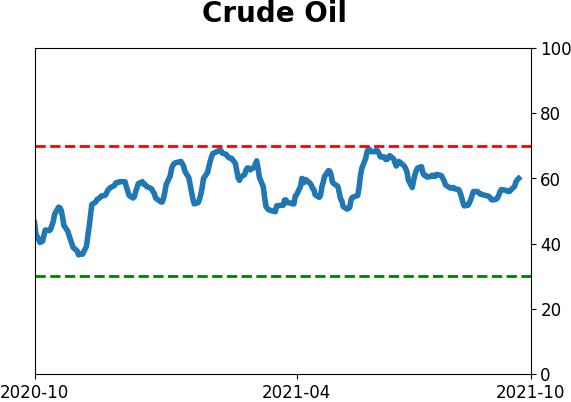
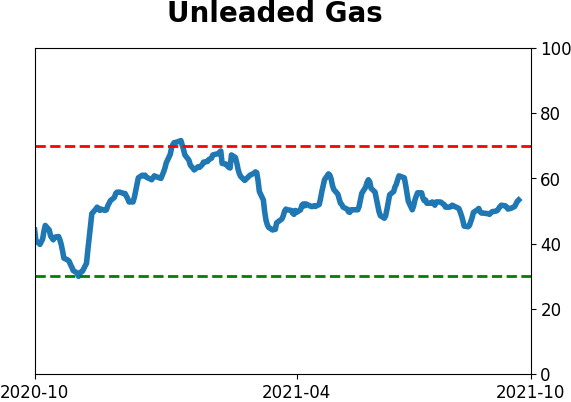
Crude Oil

|
|
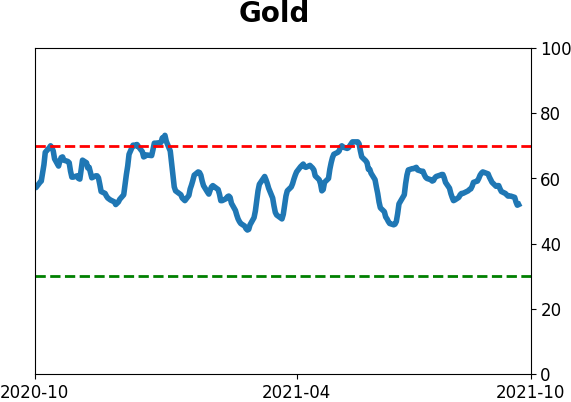
Gold
|
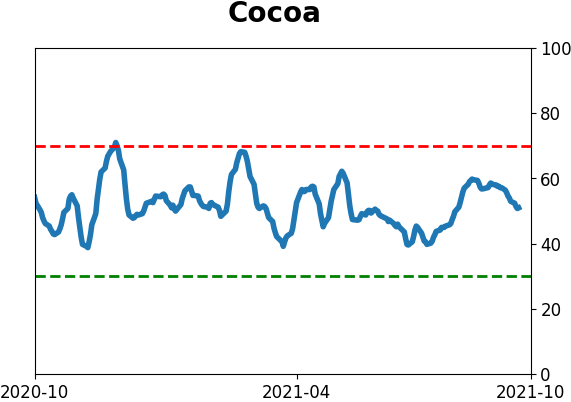
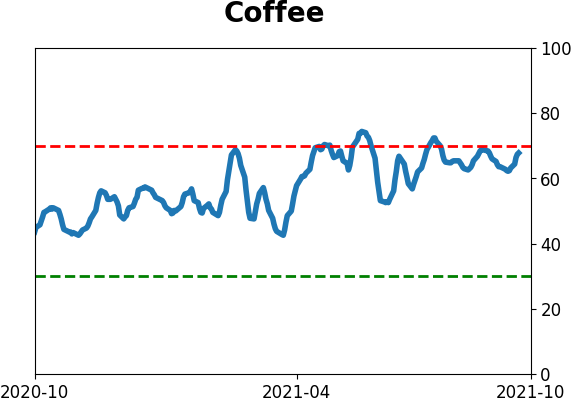
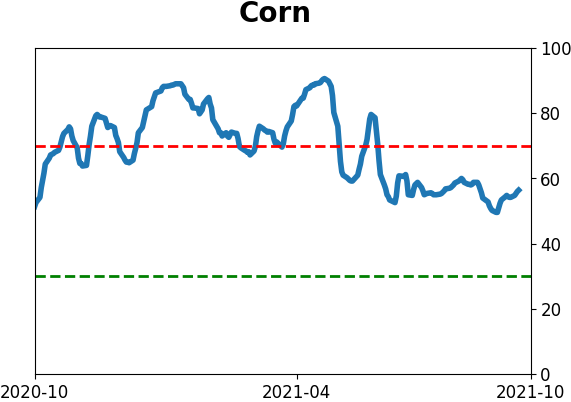
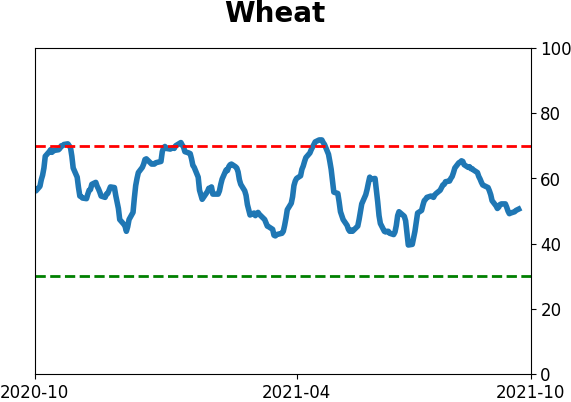
Agriculture

|
|
Research
By Jason Goepfert
BOTTOM LINE
The S&P 500 finally ended a couple of long streaks of positive price momentum. It suffered its first close more than 5% from its previous 52-week high, and ended 7 straight months of gains.
FORECAST / TIMEFRAME
SPY -- Up, Medium-Term
|
Investors had a tough month as September worked its usual spell of being difficult to navigate for bulls.
With a loss to end the month, the S&P 500 finally ended its streak of 227 days of being within 5% of a 52-week high. That was the 8th-longest streak of being within 5% of a high since 1928.
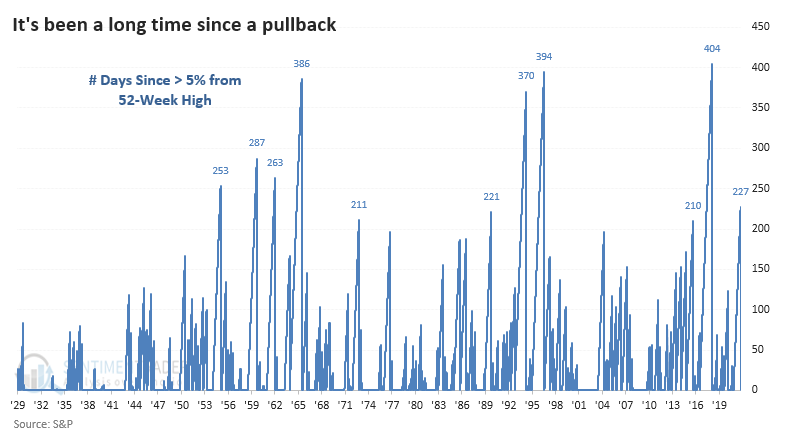
There were 10 total instances of it going more than 200 days without much of a pullback, and the ends of those streaks were not a good reason to sell. Over the next two months, the index rebounded 9 of the 10 times, with the only loss being less than 2%.
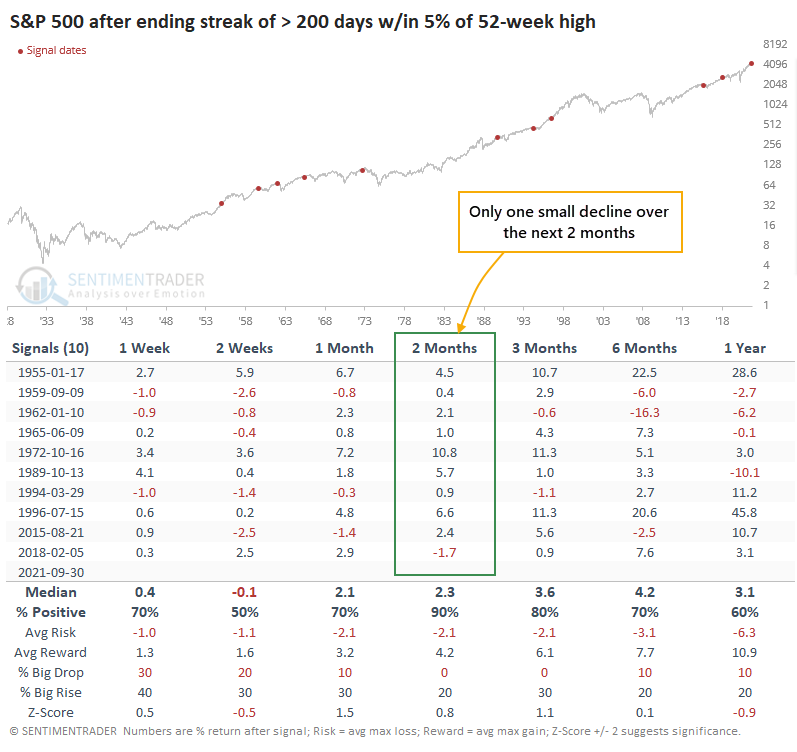
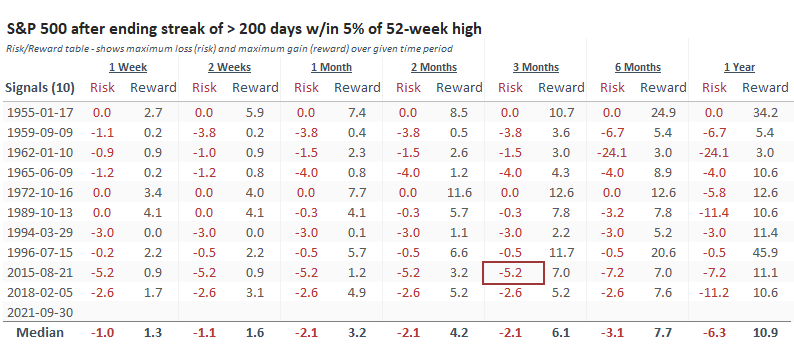
At its worst point over the next 3 months, the S&P lost a further 5% or more only once, which was -5.2%. That was also the only drawdown of more than -4%. Momentum does not die easily, as investors see their first real opportunity to get in after avoiding chasing stocks higher.
The S&P also ended its long streak of positive months. It was the first lower monthly close in 7 months. That's not its longest streak but is one of the longer ones when trading at an all-time high.
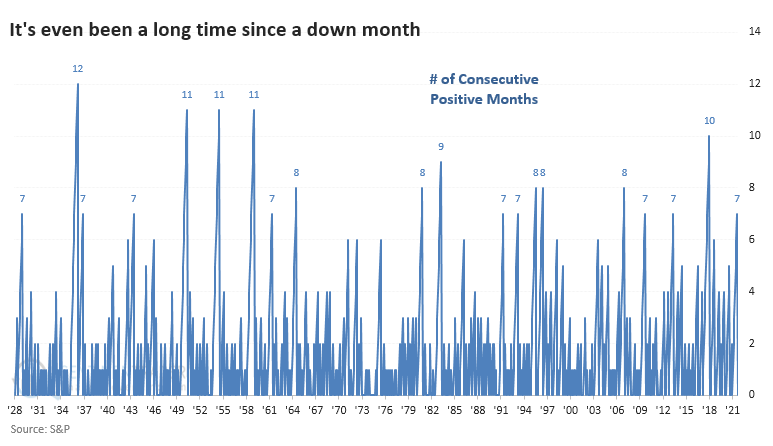 After the ends of other long streaks of up months, the S&P did even better than it did after not suffering even a 5% pullback. Its returns across almost all time frames were well above random, with a highly positive risk to reward ratio.
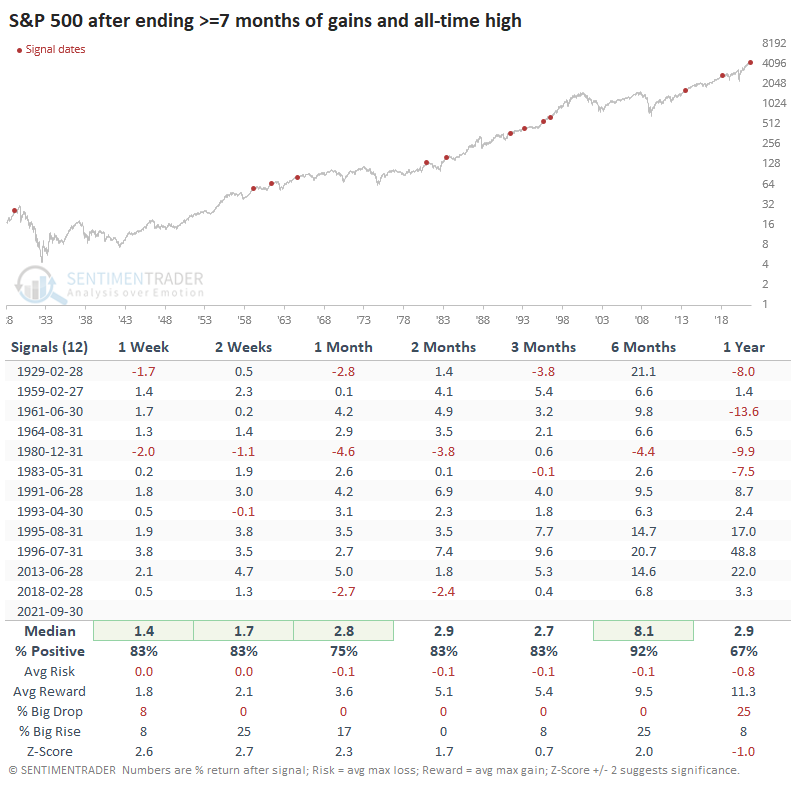
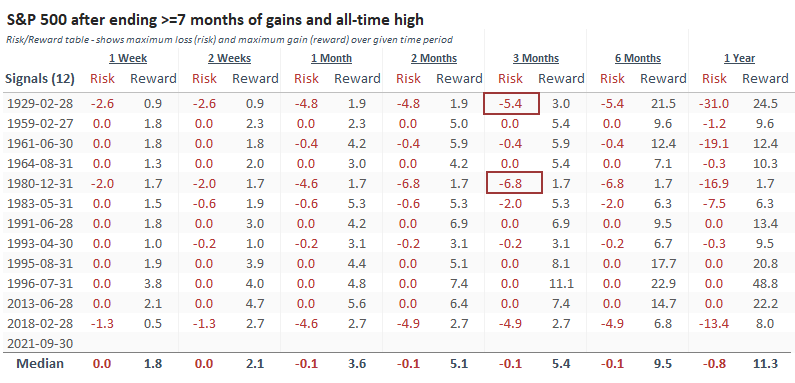
Once again, the signals showed limited risk in the months ahead. Only 2 of the 12 signals showed a maximum loss of more than 5% at any point up to three months later, though several ended up seeing more selling over the longer term.
When we see a long calm stretch like we just did, and it finally ends, then investors kind of freak out. Nobody is used to the volatility, and newer investors - of which there are plenty right now - tend to panic a little bit. It's the first realization that markets do, indeed, oscillate. Based on typical behavior, we could reasonably expect week(s) more of back-and-forth action. Still, any further short-term selling pressure should be a strong pull for investors who have been waiting patiently, rightly or wrongly, for just such a pullback.
By Jay Kaeppel
BOTTOM LINE
Finding an "edge" in the market is one thing. Figuring out how to use it to your advantage is another. In this piece, we highlight the month-by-month performance of a stock market anomaly that "hides in plain sight."
FORECAST / TIMEFRAME
None
|
In this recent article, I wrote about a little-known seasonal anomaly that "hides in plain sight." In this piece, we focused solely on this anomaly during September.
Here we will look at historical results on a month-by-month basis.
THE DAYS
As a quick review:
- The last trading day of the month is designated as TDM -1
- The next to last trading day is TDM -2
- The day before that is TM -3
- Etc.
The test period:
- Includes TDM -10 through TDM -5
- On a month-by-month basis
- From January 1931
- Through December 2020
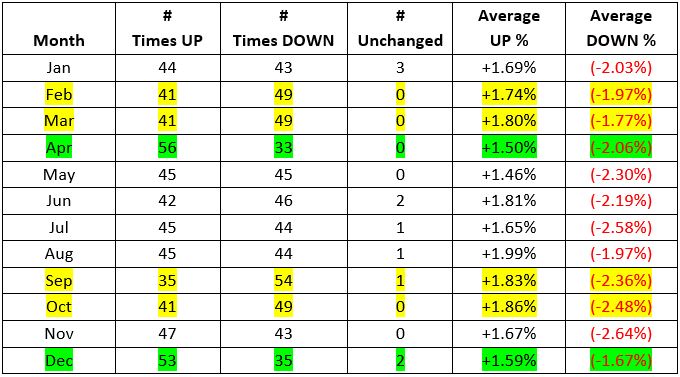
CUMULATIVE RESULTS MONTH-BY-MONTH
The table below displays the:
- Cumulative % price change for the S&P 500
- During this 6-trading day period
- For each month individually
- From 1931 through 2020
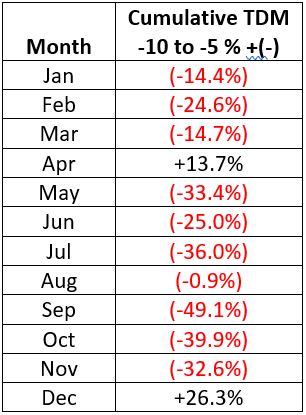
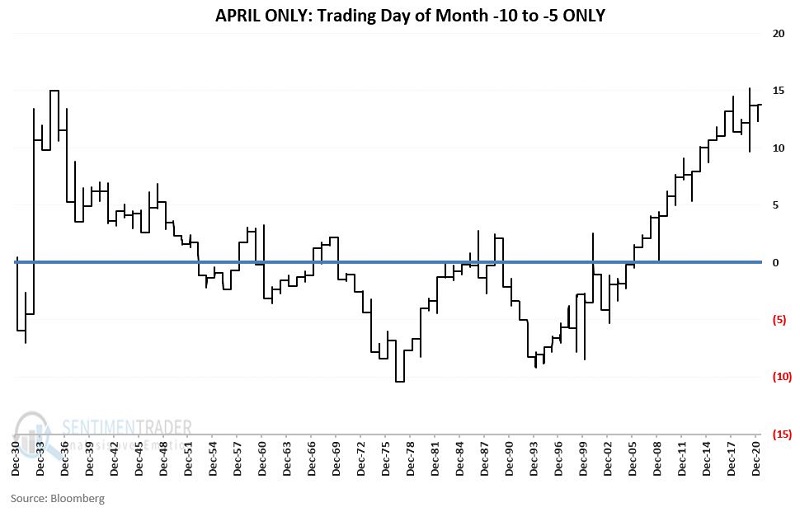
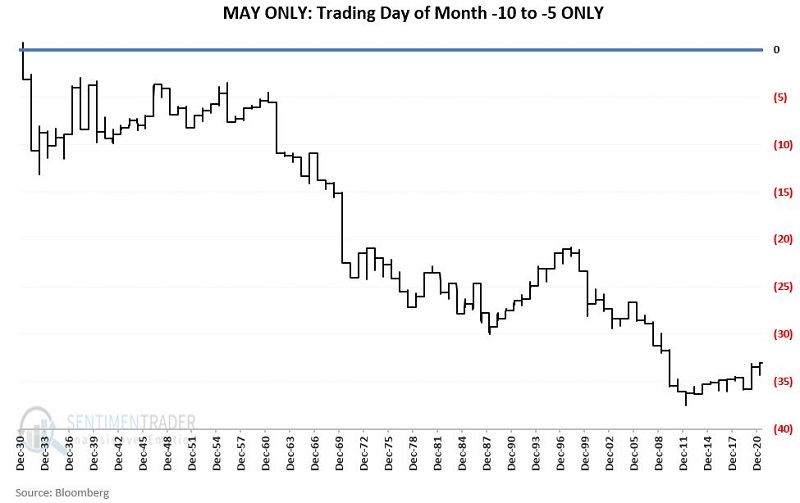
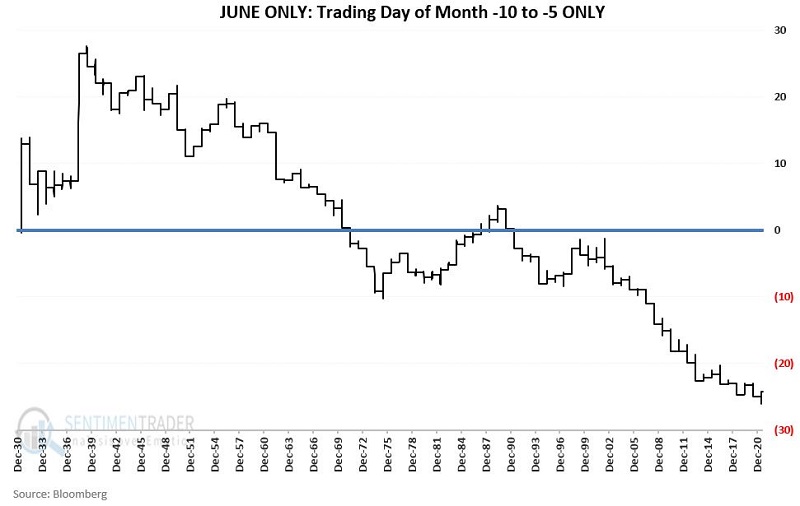
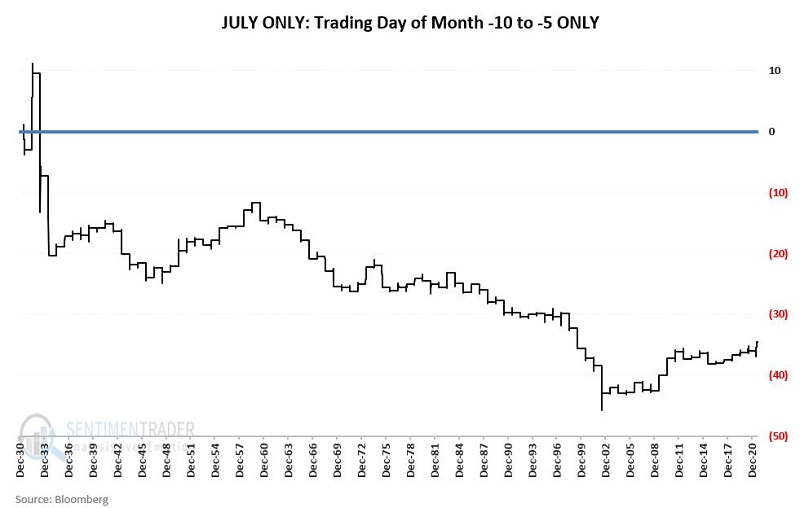
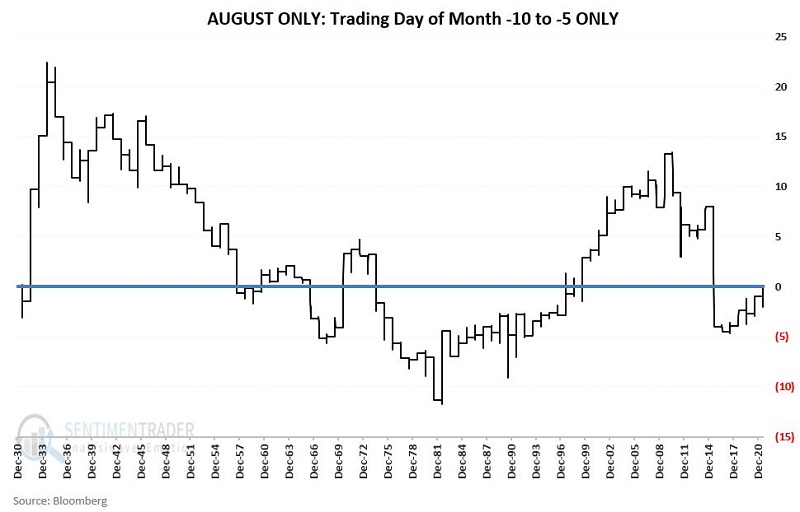
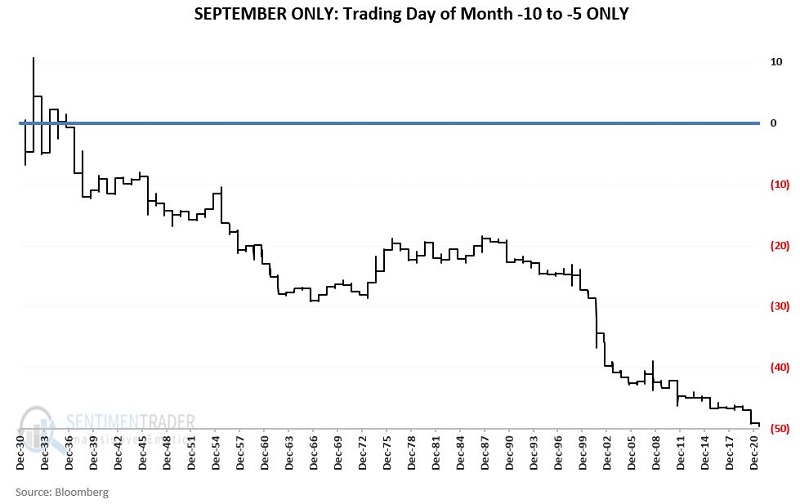
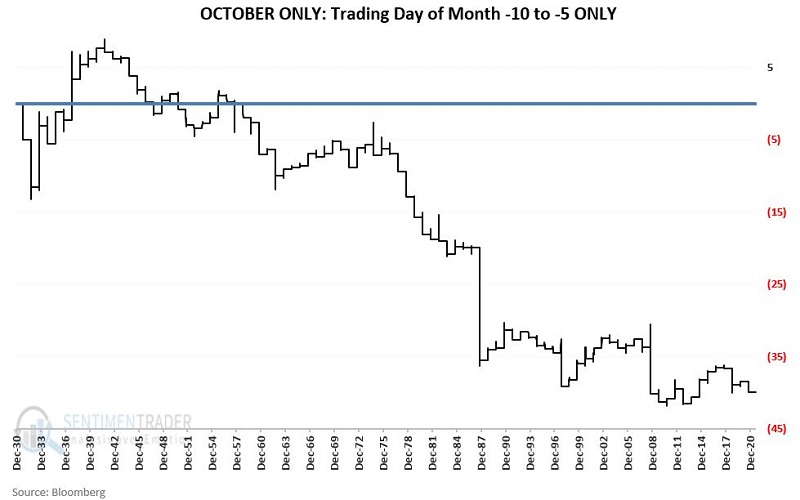
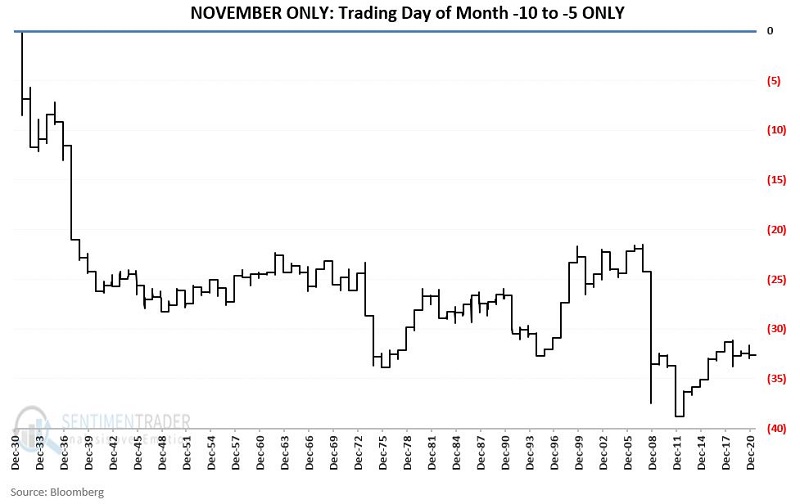
Things to Note (From 1931 through 2020):
- The only two months to show a gain are December and April
- The weakest months overall have been September, October, July, May, and November
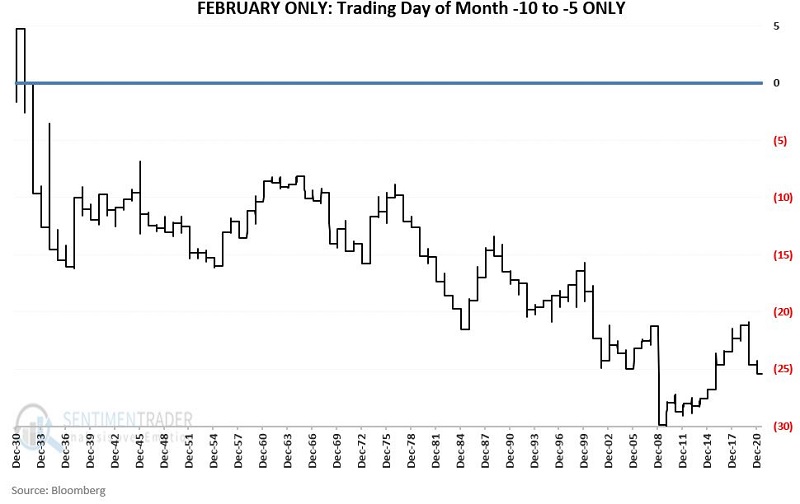
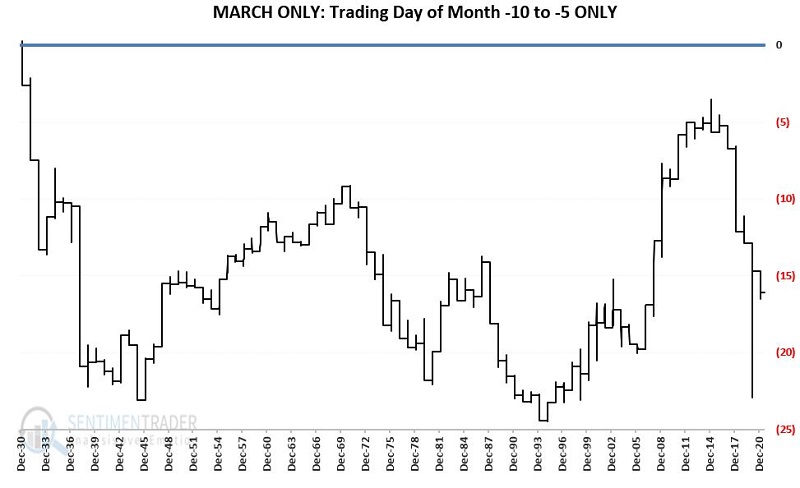
MONTH-BY-MONTH
The table below displays the performance of the TDM -10 through TDM -5 period on a month-by-month basis.
When we look at the frequency of UP months versus DOWN months, what we find is that:
- The -10 to -5 edge is slight, even in the best and worst months
- The "best" -10 to -5 months have been December and April
- The "worst" -10 to -5 months were September, October, February, and March, and June
The following charts display the cumulative price return for our "seasonally weak" 6-trading day period on a month-by-month basis through the end of 2020.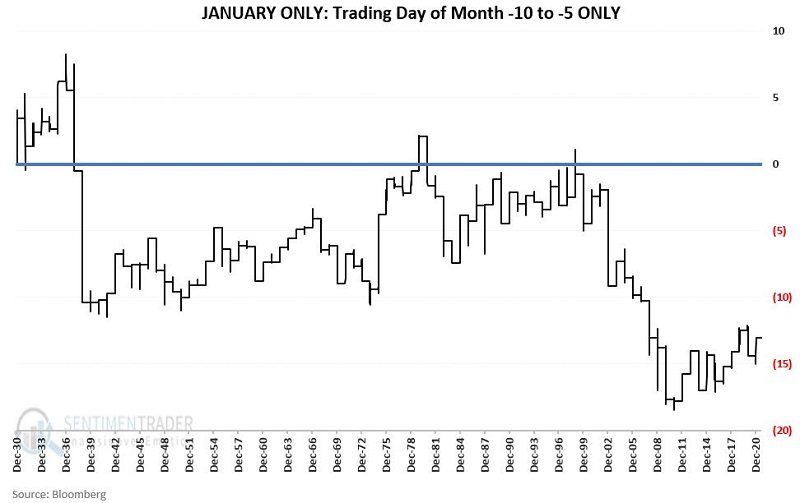
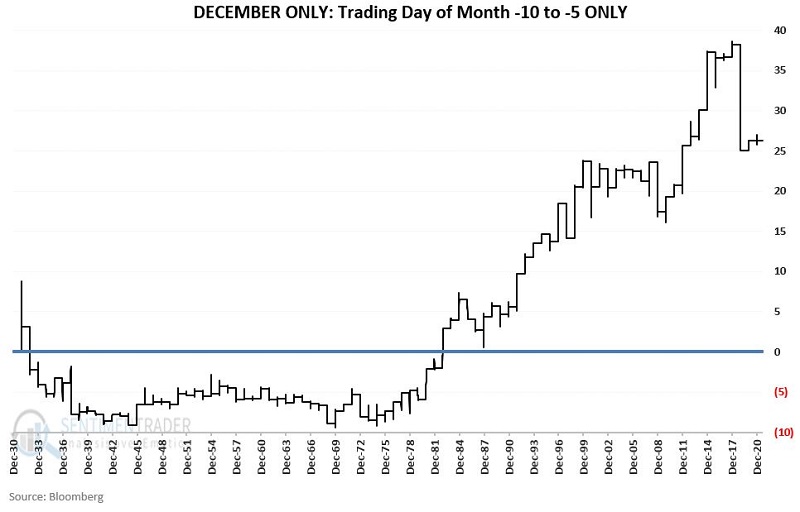
REAL-WORLD TRADING APPLICATIONS
There does not appear to be any real rhyme or reason to the gyrations of the individual charts above. Nevertheless - except for April and December - there is an undeniable downside tendency for the stock market during the particular time of the month.
In terms of real-world trading:
- It probably does not make sense for long-term investors to unload their entire portfolio and then repurchase it six trading days later each month. Potential tax implications, slippage, commissions, and the sheer logistics of doing so can make this an unwieldy approach.
- That said, if an investor is looking to put money to work in the market, it can make a great deal of sense to wait until TDM -5 to do so.
- If an investor is looking to sell (whether a large or small part of their portfolio), selling before the close of TDM -10 would seem to be a good idea. The same goes for investors looking to hedge their portfolio or individual holdings within their portfolio.
- This anomaly can be a terrific "weight of the evidence" input for shorter-term traders. I.e., if the preponderance of the evidence is bearish heading into this period, a short position may look much more attractive and should be pursued aggressively.
By Jason Goepfert
BOTTOM LINE
Chinese technology stocks have suffered heavy selling pressure over the summer. Breadth metrics are showing few uptrends, many new lows, and huge drawdowns. At the same time, companies like Tencent are aggressively buying back their shares.
FORECAST / TIMEFRAME
KWEB -- Up, Long-Term
|
Few markets have suffered more of a barrage of uncertainty and negativity this summer than Chinese stocks. Technology-related issues have been hit particularly hard from all sides.
Based on the last 15 years of history, they've reached a point of maximum pessimism.
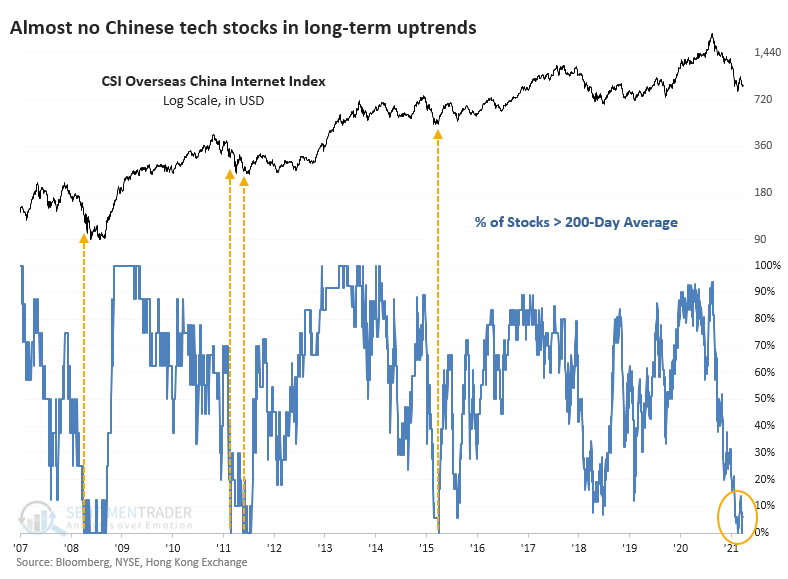
The most popular domestic fund for trading Chinese internet stocks is KWEB, based on the CSI Overseas China Internet Index. The index has just over 50 member stocks, and it's hard to find an uptrend among them.
FEW UPTRENDS, MANY NEW LOWS
During mid-August, precisely 0% of these stocks were trading above their 50-day moving averages. That spiked to around 40% during a relief bounce and has since slid back under 10% as recently as last week.

It's an even uglier picture when looking at the percentage of these stocks in long-term uptrends. In recent days, only 4% of them have closed above their 200-day moving averages, ranking among the very worst readings in available history.
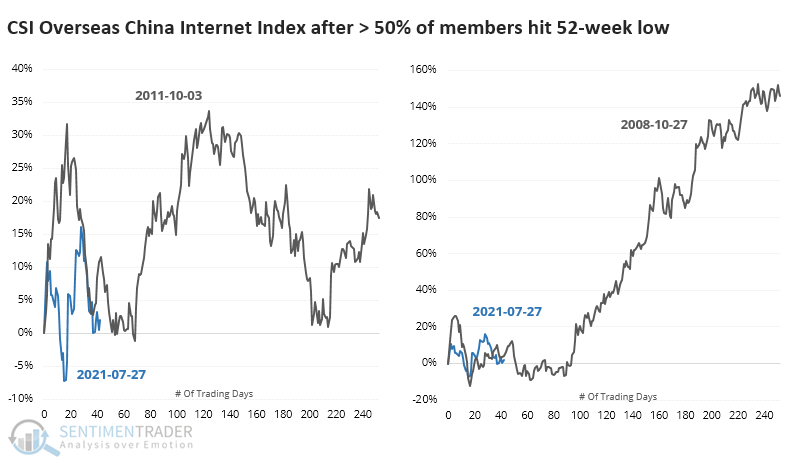
The plunge in late July caused more than 50% of Chinese 'net stocks to fall to a 52-week low, only the third time in 15 years that so many have done so at the same time. Many are gyrating around those low prices, and on any given day, between 10% - 25% of stocks have been setting fresh 52-week lows.
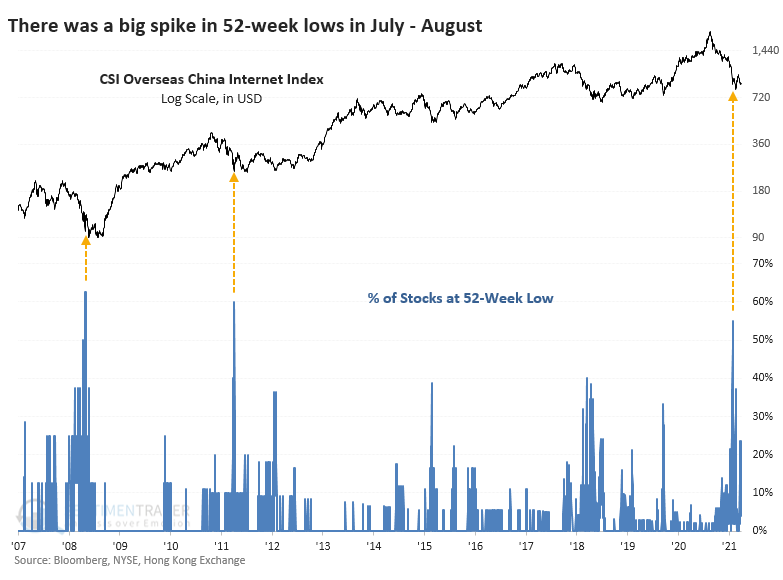
The other two times when more than 50% of them fell to a new low, the China Internet Index rebounded quickly, then fell back in the months ahead to test the low during a bottoming process. That's very similar to what it's been doing in recent weeks. If it continues to follow that pattern, then it should bottom within the next 20-40 sessions without undercutting its August low by much.
Not only have these tech stocks been falling to new lows, but they've also suffered huge drawdowns. Across the 53 companies in the index, the average stock is down nearly 60% from its 52-week high. The only period that exceeded this washout was the puke phase of the global financial crisis. During other waves of panic since then, the average drawdown stopped at about 45%.
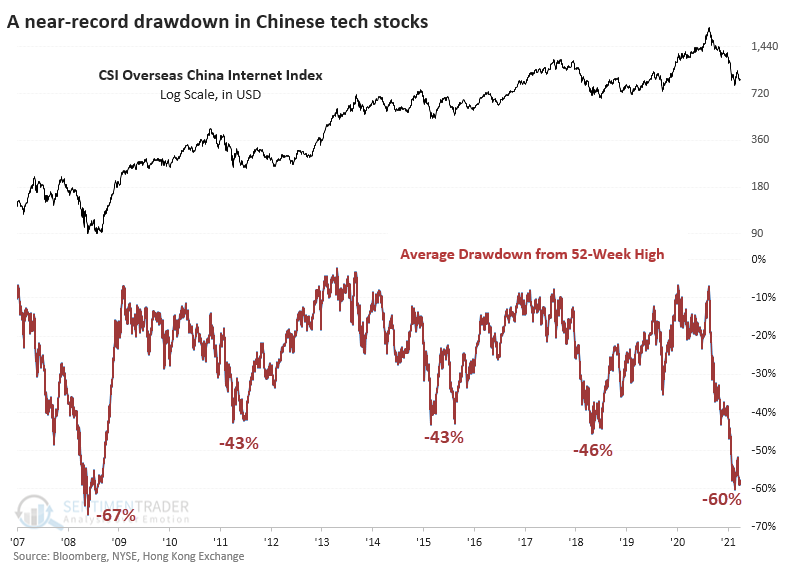
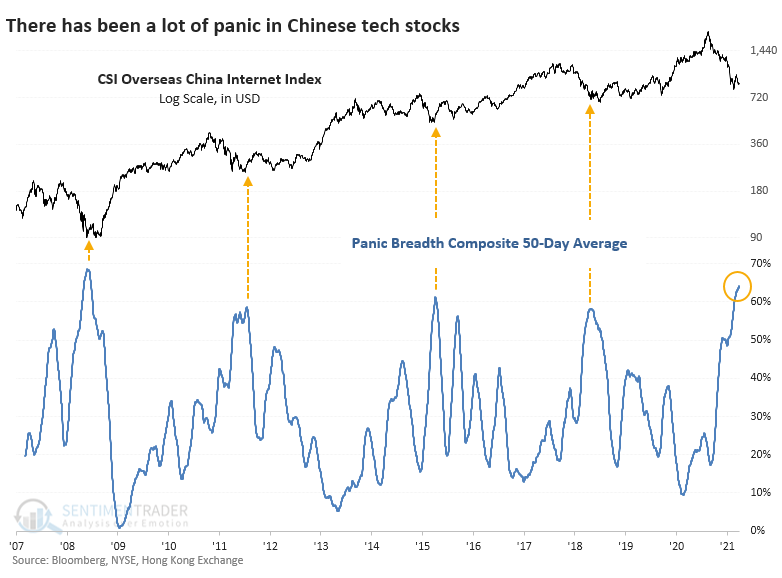
If we use a similar methodology to what we've used with several other sectors in the last couple of weeks and compute a kind of panic breadth composite from these measures, the past 50 days are on par with the financial crisis. No other period saw so many stocks suffering such significant losses for so protracted a period.
CORPORATE BUYING, RETAIL SELLING
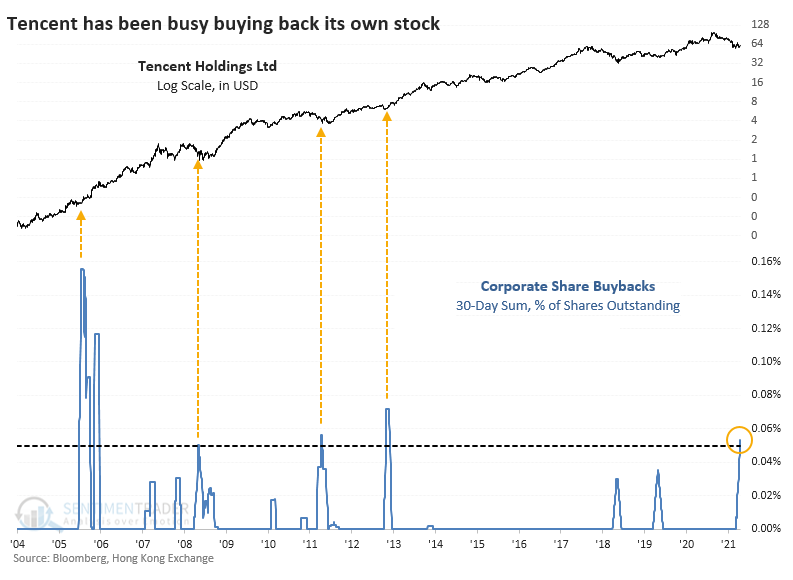
At least one of these firms - the most important one, carrying the most weight - is sensing a bargain in their shares. Tencent Holdings has authorized and executed stock buybacks almost every day since August 19. While it's not a significant percentage of its outstanding shares, it's still the largest in nearly a decade and ranks 4th since 2004. They're on pace to exceed their buyback binges from 2011 and 2013.
The company has had an exceptional record of buying its own stock at opportune moments. When Tencent repurchased 0.025% of its shares within a 30-day window, the stock rallied a median of 84% over the next year, with no losses either 6 or 12 months later.
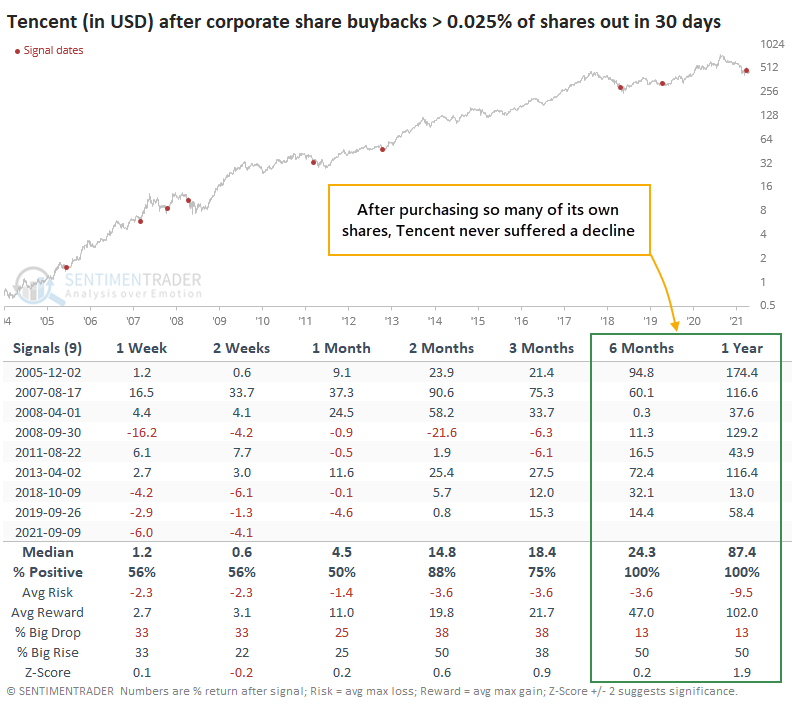
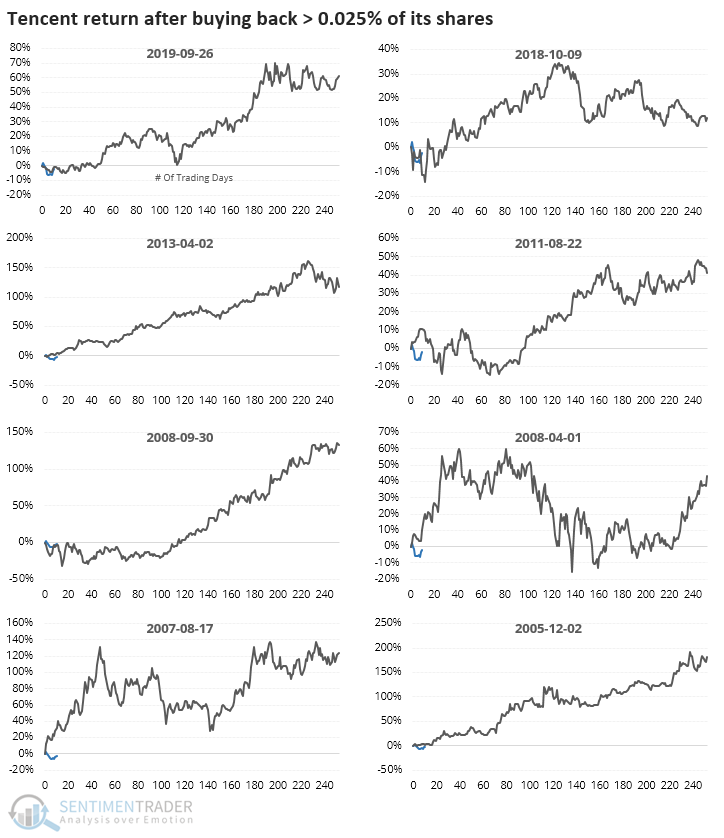
Tencent stock, priced in dollars, has already declined more than 6% since their buybacks crossed the study threshold, exceeding most other drawdowns. In 2008, 2011, and 2018, there were large losses all occurring within the first two months. After that, the stock enjoyed spectacular gains.
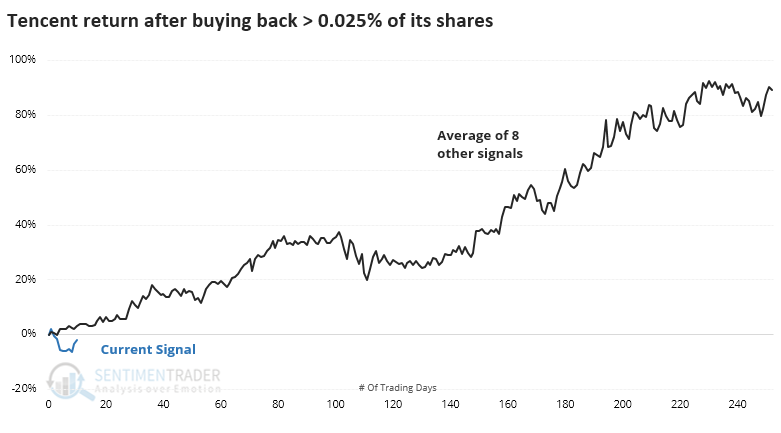
The individual thumbnails show that there were several times when the stock chopped around in a volatile manner for weeks or months, however, so it wasn't an immediate buy signal every time.
Who's not buying? The retail traders who rely on margin. The volume of shares bought on margin has plunged in recent sessions, down more than 50% from the peak. It hasn't reached the depths of apathy seen at other lows in speculative behavior, but it's getting close quickly.
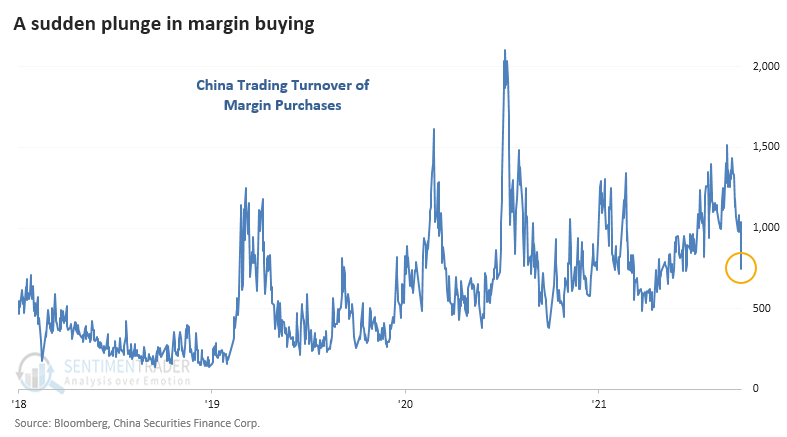
If we assume that speculative shares like tech stocks see much of this margin buying, we can see if drops in activity were a contrary sign. The table below shows returns in the China tech index after margin buying activity cycles from a 12-month high to a 3-month low.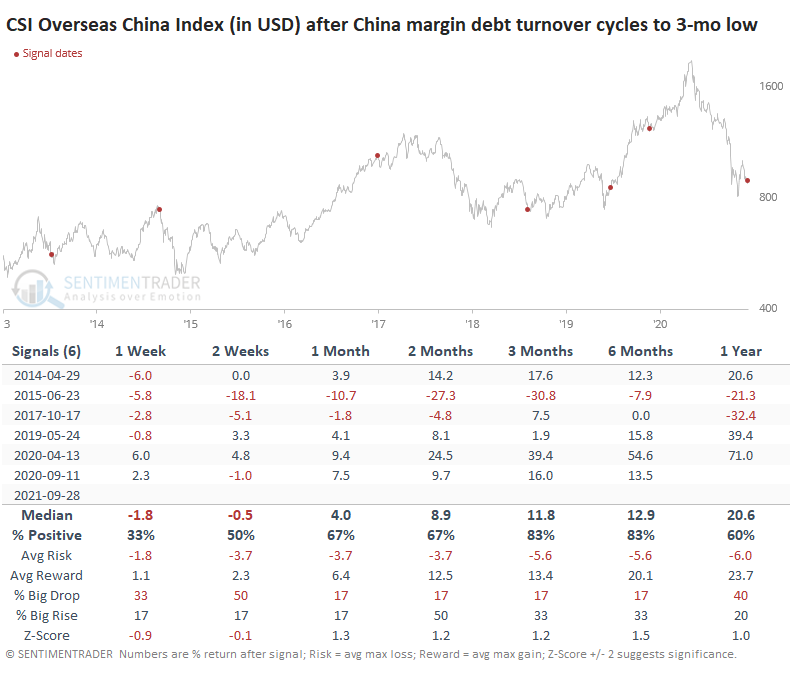
It was mostly a good sign, though it triggered at the peak in 2015 and ultimately led to a loss in 2018. The others began near bottoms and preceded significant gains for these stocks as speculative behavior returned.
Media headlines and analyst comments have cycled from euphoric in January to apathetic in March to concerned in June to hysterical in the past month. Lately, we've been seeing comments that China will dissolve capital markets altogether, reminiscent of the fear that authorities would close U.S. stock markets in March 2020.
There is a clear danger, both known and unknown, in these stocks. Nobody knows what government regulators will say or do (granted, that's becoming an increasing risk in every country), what impact that will have on trader sentiment, and whether the worst of the news has already been priced in. Companies like Tencent seem to believe so, or they wouldn't be buying back their shares.
Who knows where the selling pressure will stop if the regulatory environment has radically shifted from the past 15 years. Maybe these stocks can go down another 20%, 50%, or 90%. Anything is possible. We generally believe that probabilities favor long-term trends staying in place and investors more or less behaving as they have in the past until evidence strongly suggests the opposite. Based on that, it looks likely that Chinese tech stocks are well on their way to forming another long-term bottom.
Active Studies
| Time Frame | Bullish | Bearish | | Short-Term | 0 | 6 | | Medium-Term | 9 | 3 | | Long-Term | 11 | 5 |
|
Indicators at Extremes
Portfolio
| Position | Description | Weight % | Added / Reduced | Date | | Stocks | RSP | 4.1 | Added 4.1% | 2021-05-19 | | Bonds | 23.9% BND, 6.9% SCHP | 31.5 | Reduced 7.1% | 2021-05-19 | | Commodities | GCC | 2.6 | Reduced 2.1%
| 2020-09-04 | | Precious Metals | GDX | 4.2 | Reduced 4.2% | 2021-05-19 | | Special Situations | KWEB | 9.8 | Added 9.78% | 2021-09-30 | | Cash | | 40.3 | | |
|
Updates (Changes made today are underlined)
Much of our momentum and trend work has remained positive for several months, with some scattered exceptions. Almost all sentiment-related work has shown a poor risk/reward ratio for stocks, especially as speculation drove to record highs in exuberance in February. Much of that has worn off, and most of our models are back toward neutral levels. There isn't much to be excited about here. The same goes for bonds and even gold. Gold has been performing well lately and is back above long-term trend lines. The issue is that it has a poor record of holding onto gains when attempting a long-term trend change like this, so we'll take a wait-and-see approach. Momentum has ebbed quickly in recent weeks, and nearing oversold levels in some indicators. This can be a dangerous area, with a lot of short-term volatility, but we'd be more inclined to add medium- to long-term exposure rather than sell on much more of a decline, thanks to already rock-bottom exposure. Other areas look more attractive, including some overseas markets. RETURN YTD: 8.7% 2020: 8.1%, 2019: 12.6%, 2018: 0.6%, 2017: 3.8%, 2016: 17.1%, 2015: 9.2%, 2014: 14.5%, 2013: 2.2%, 2012: 10.8%, 2011: 16.5%, 2010: 15.3%, 2009: 23.9%, 2008: 16.2%, 2007: 7.8%
|
|
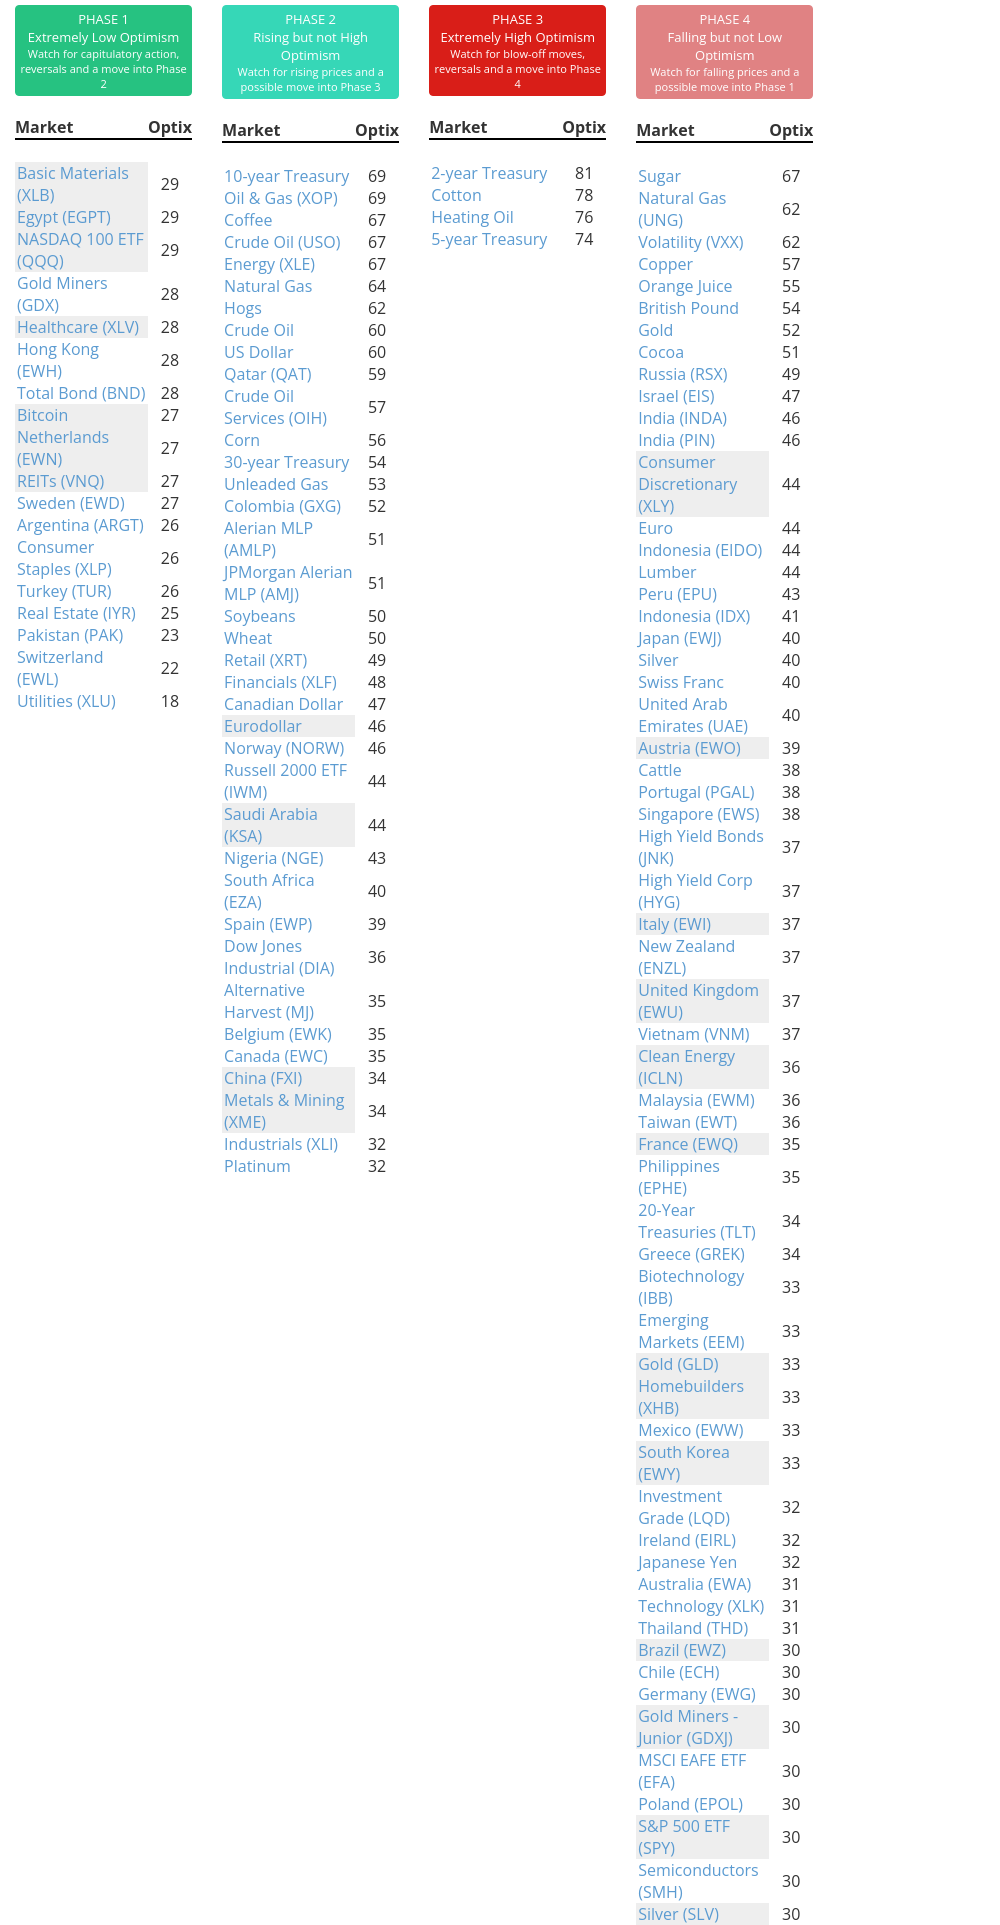
Phase Table
Ranks
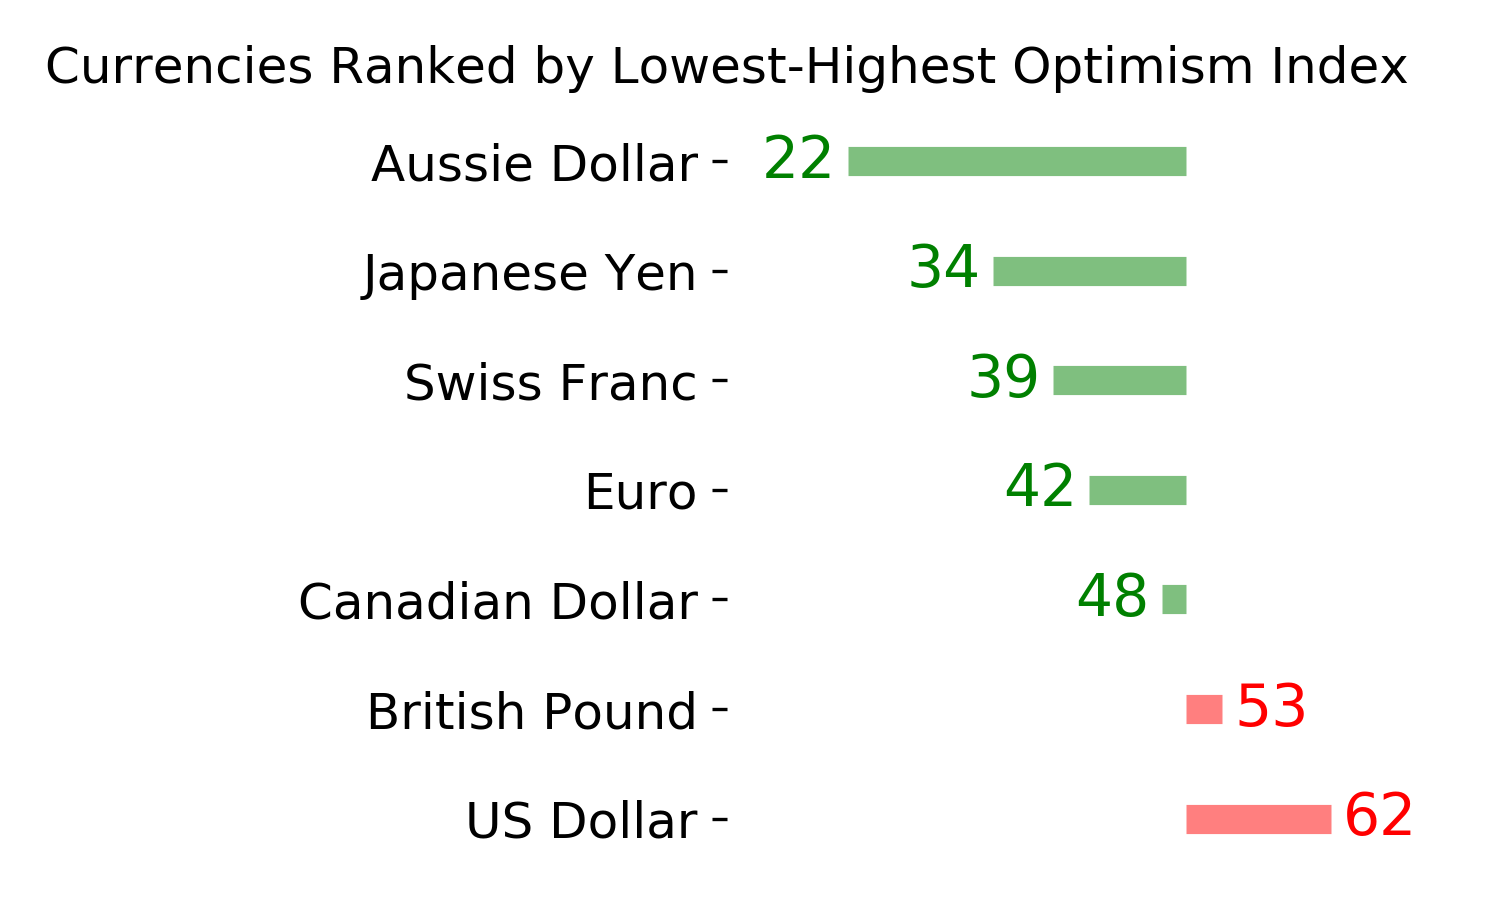
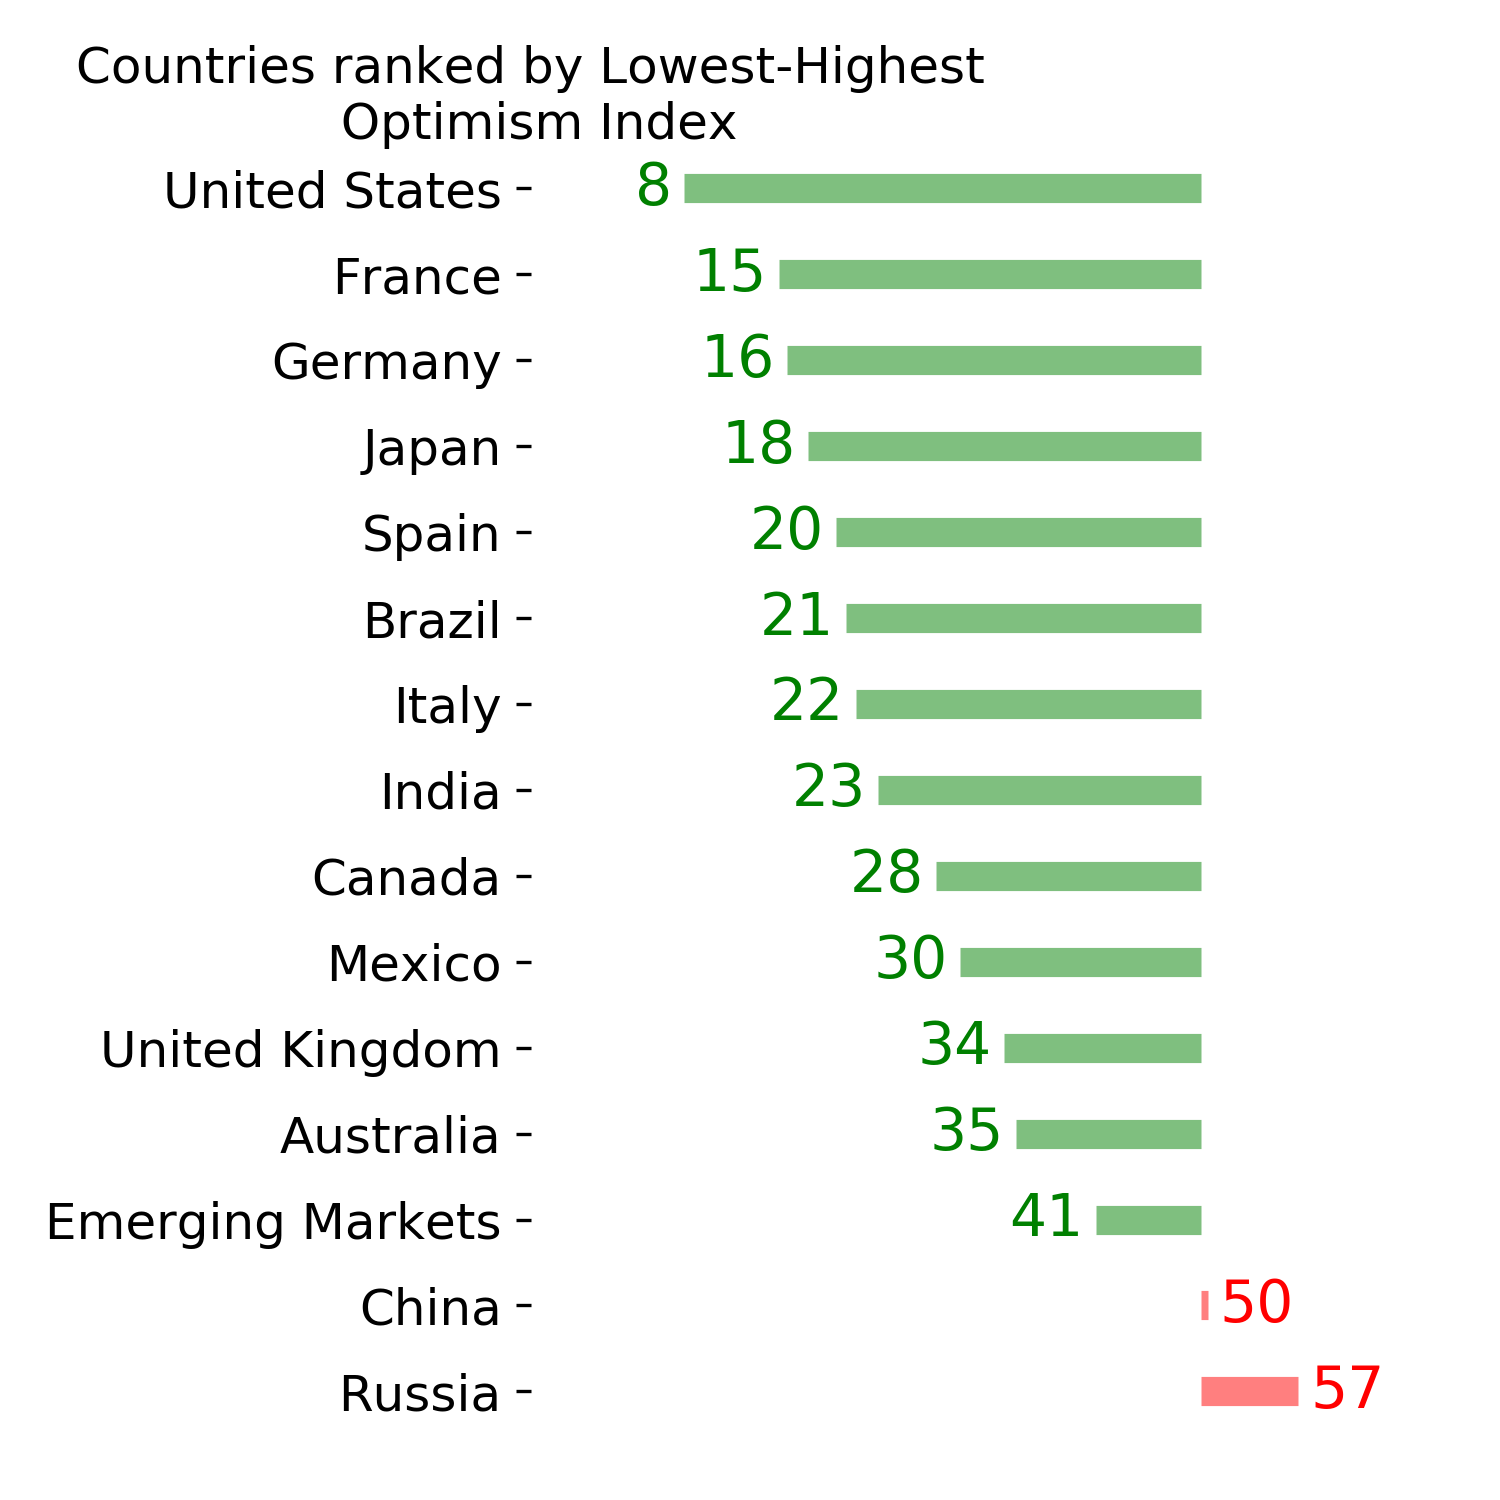
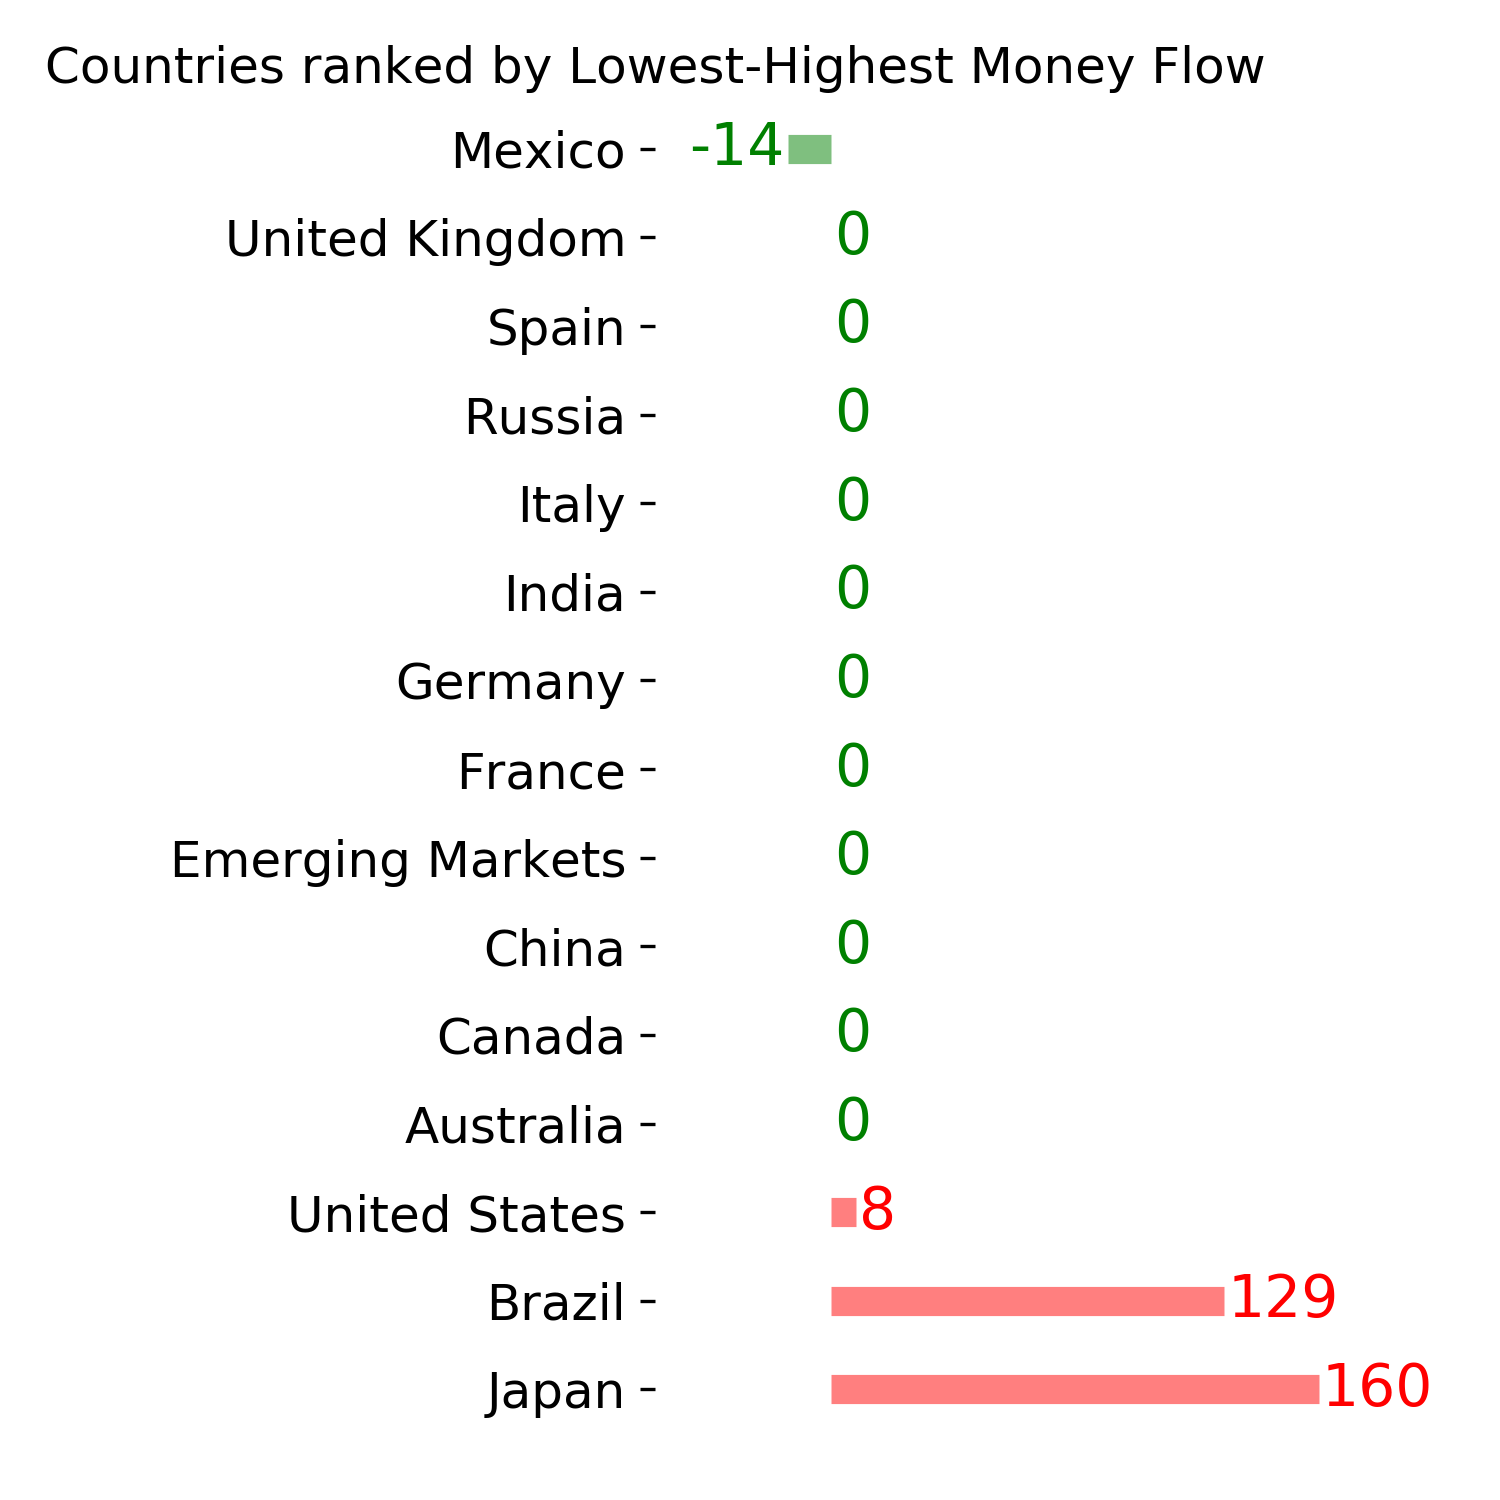
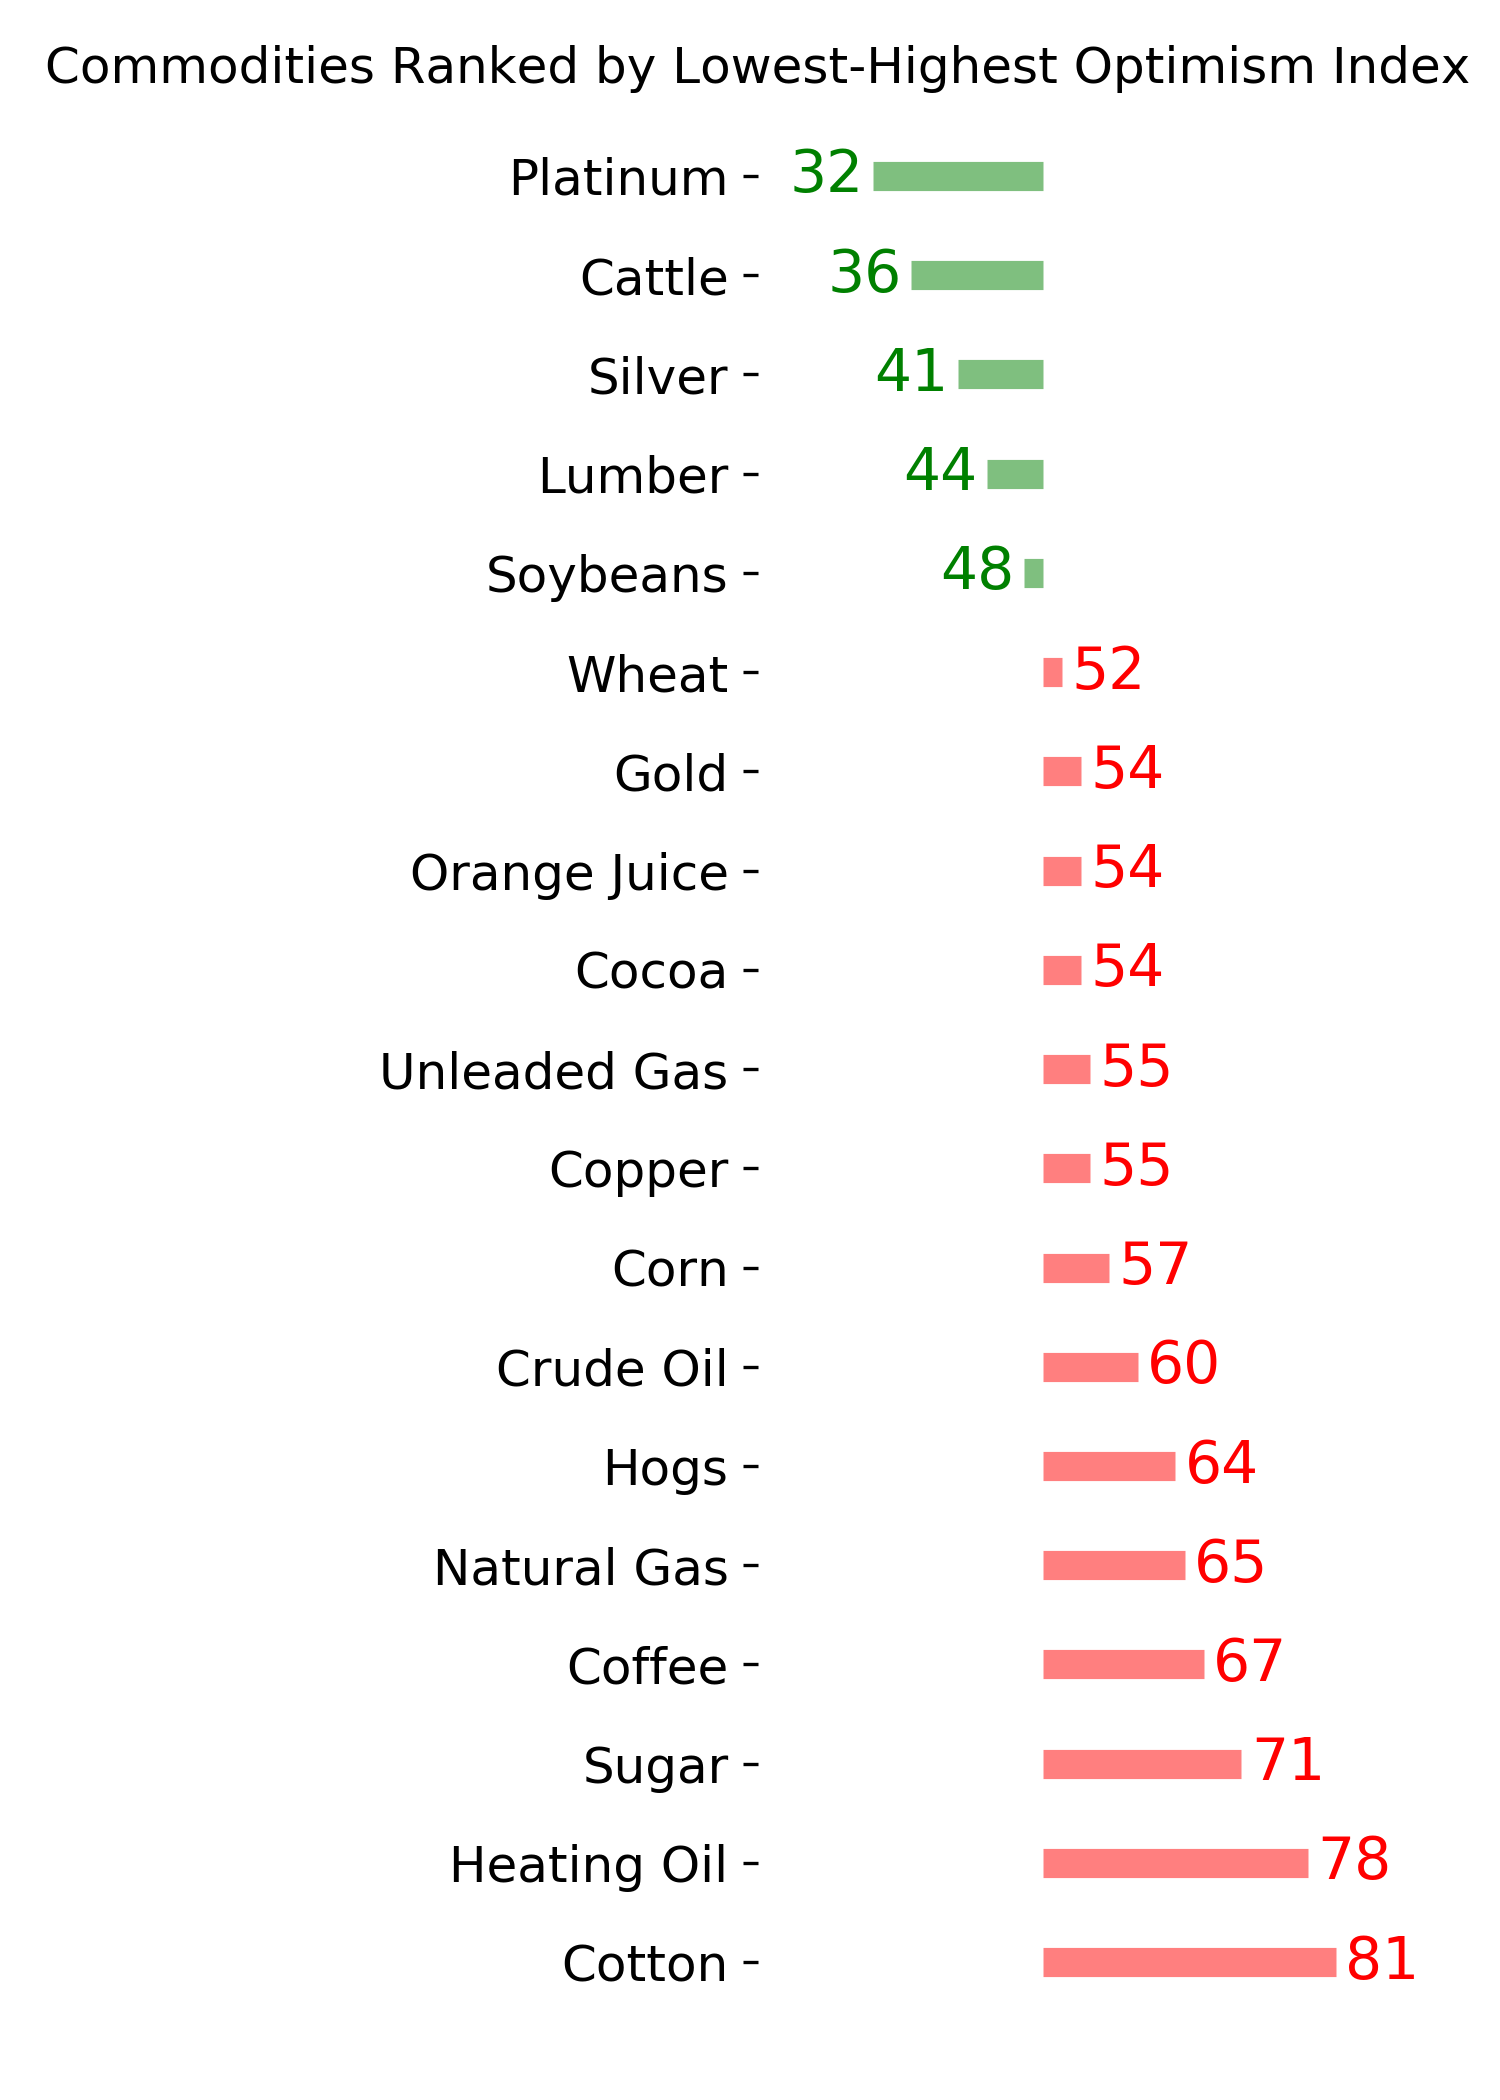
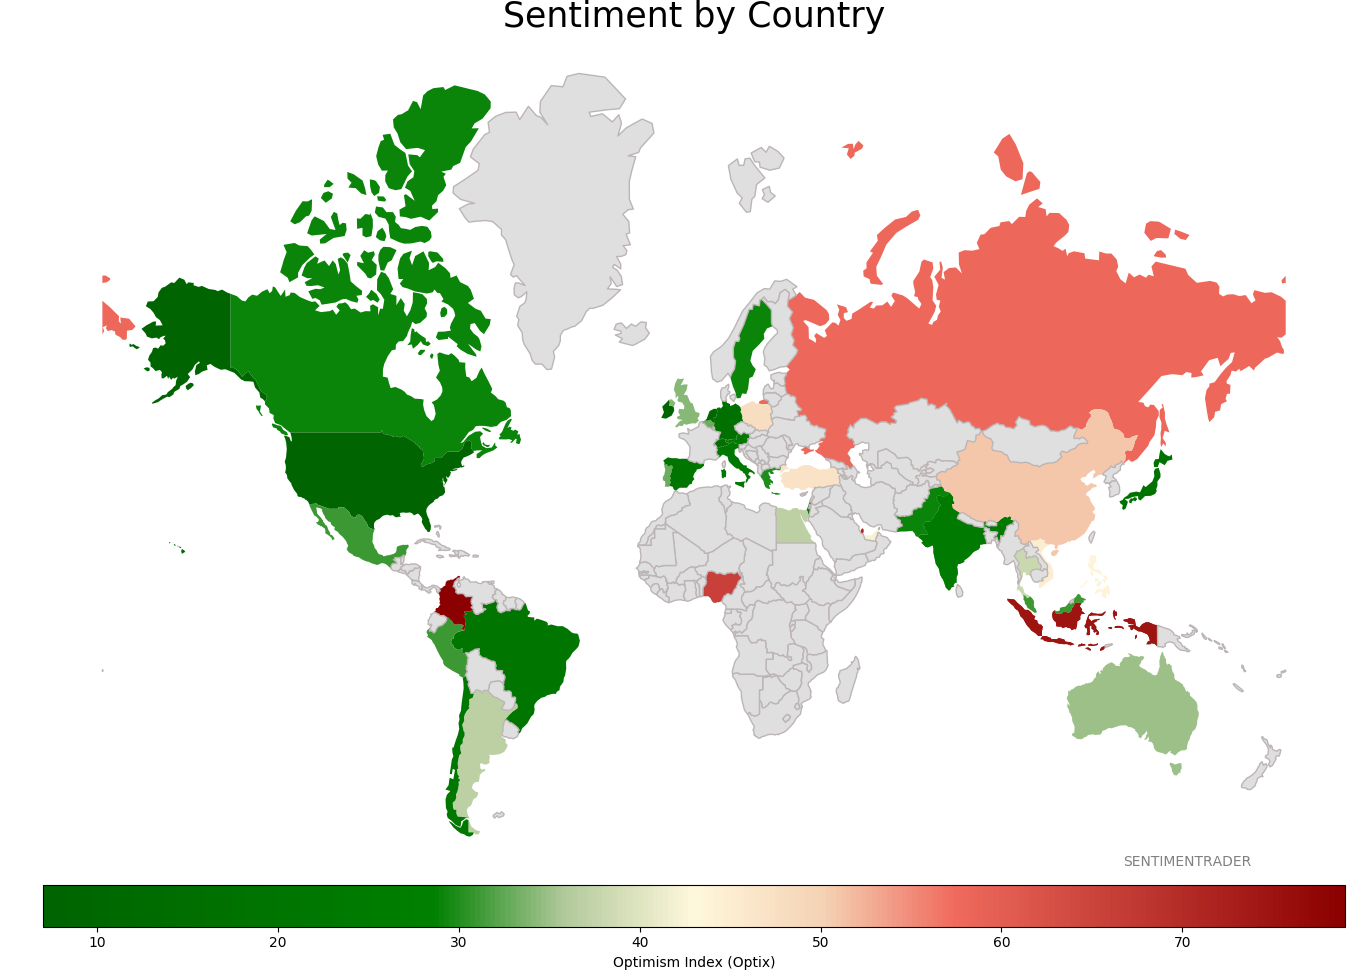
Sentiment Around The World
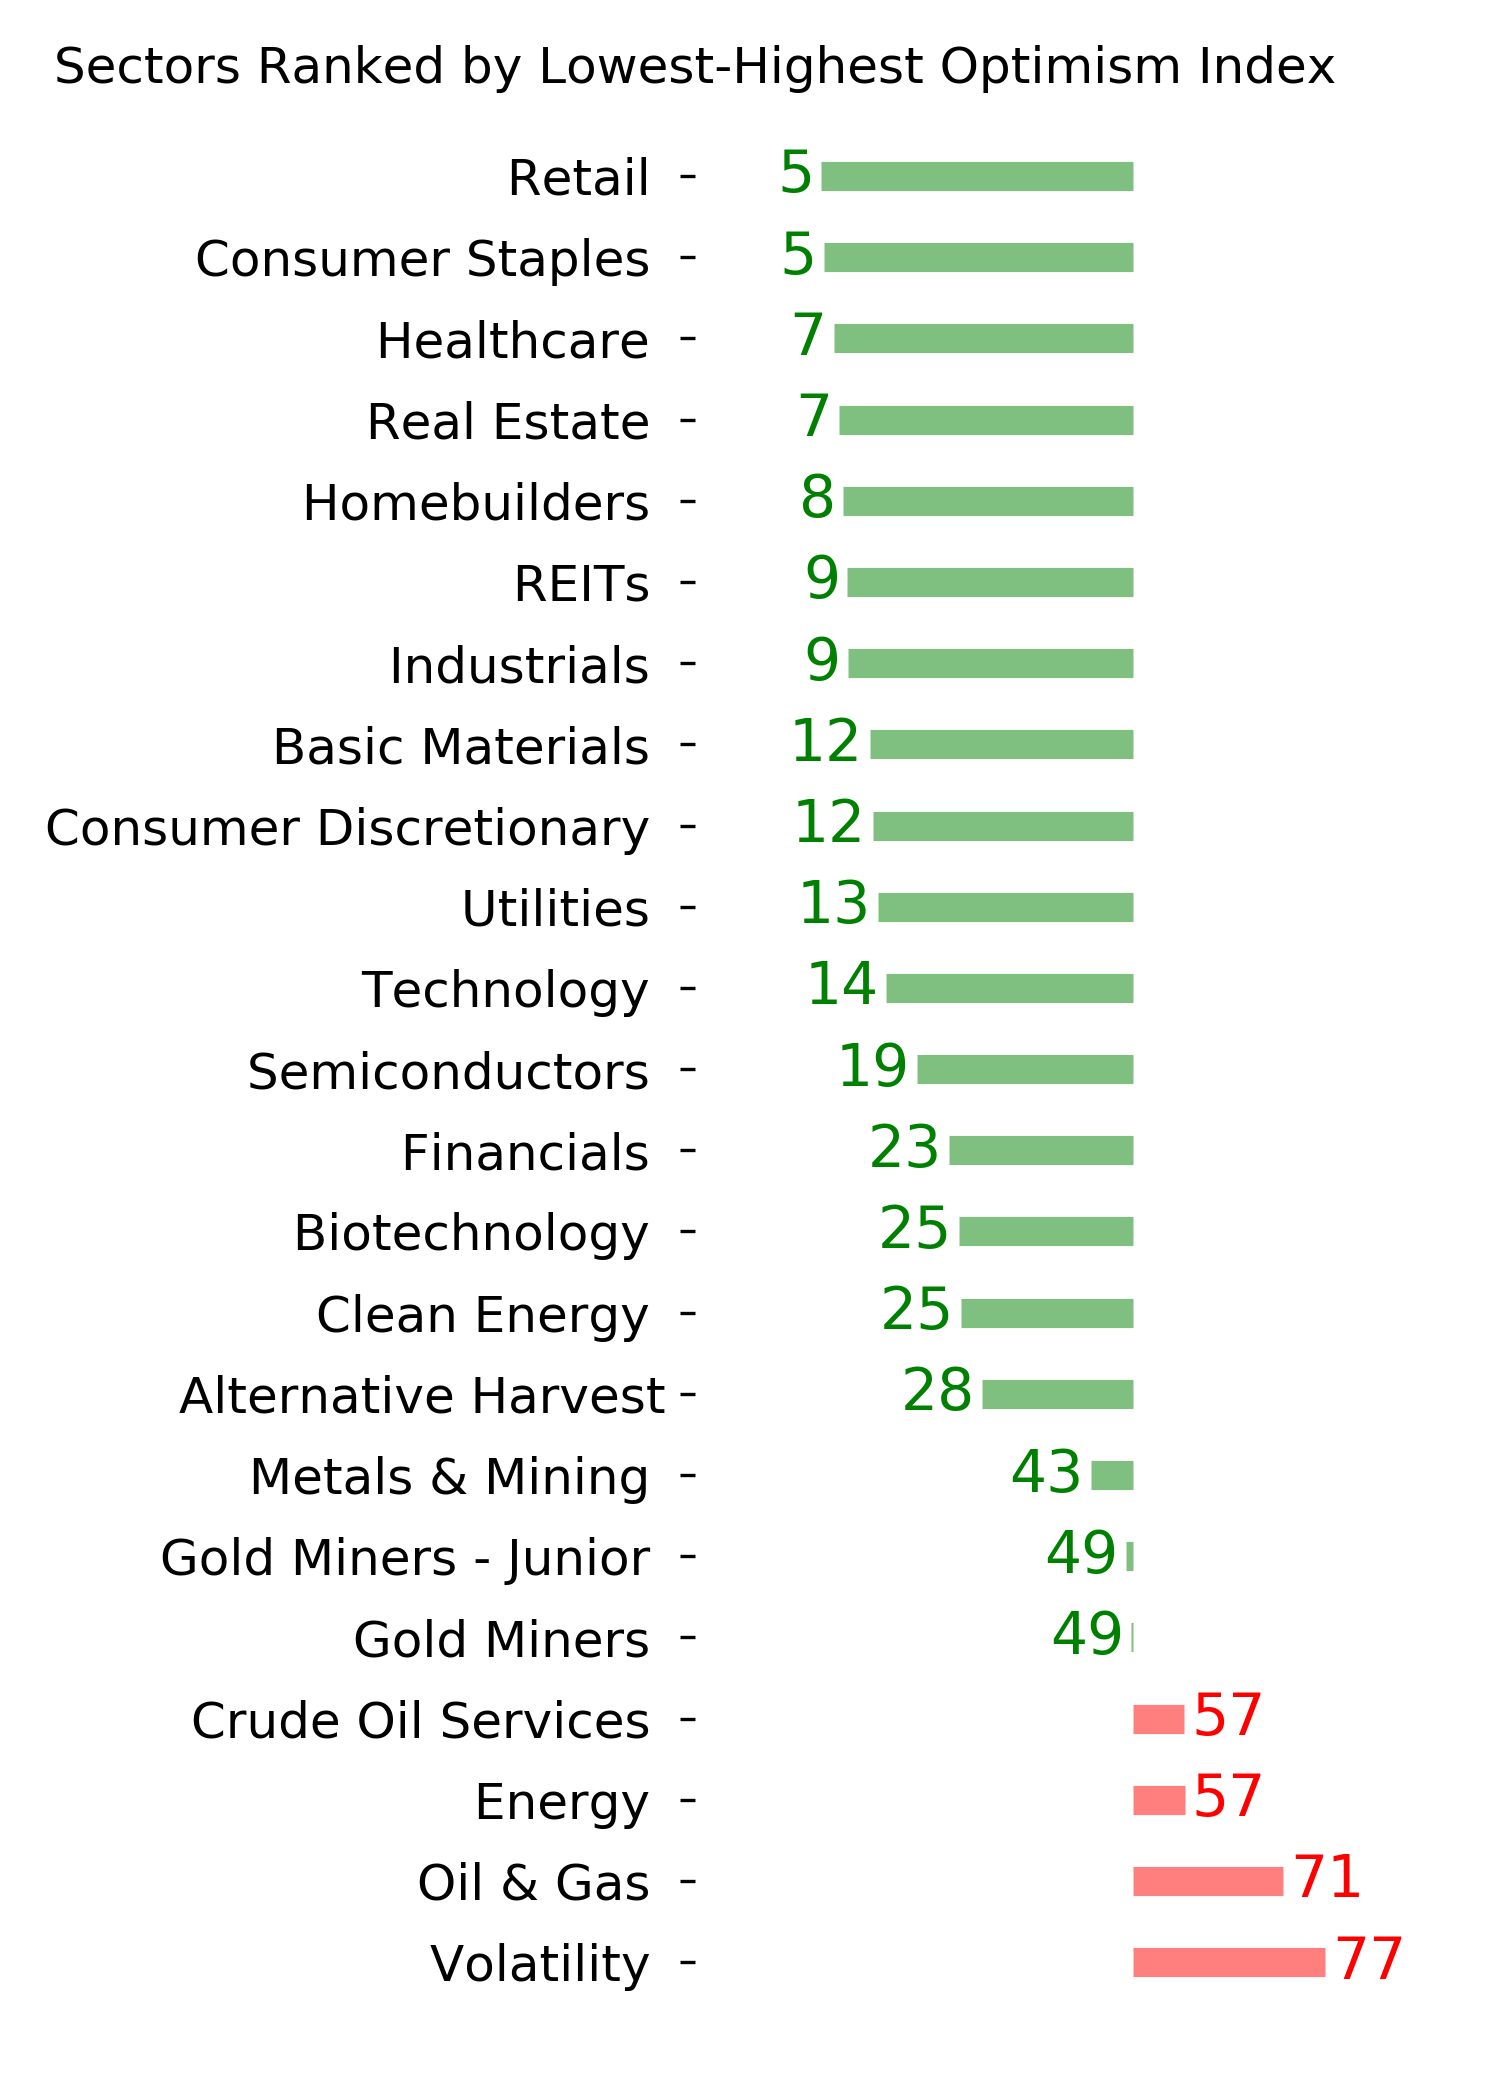
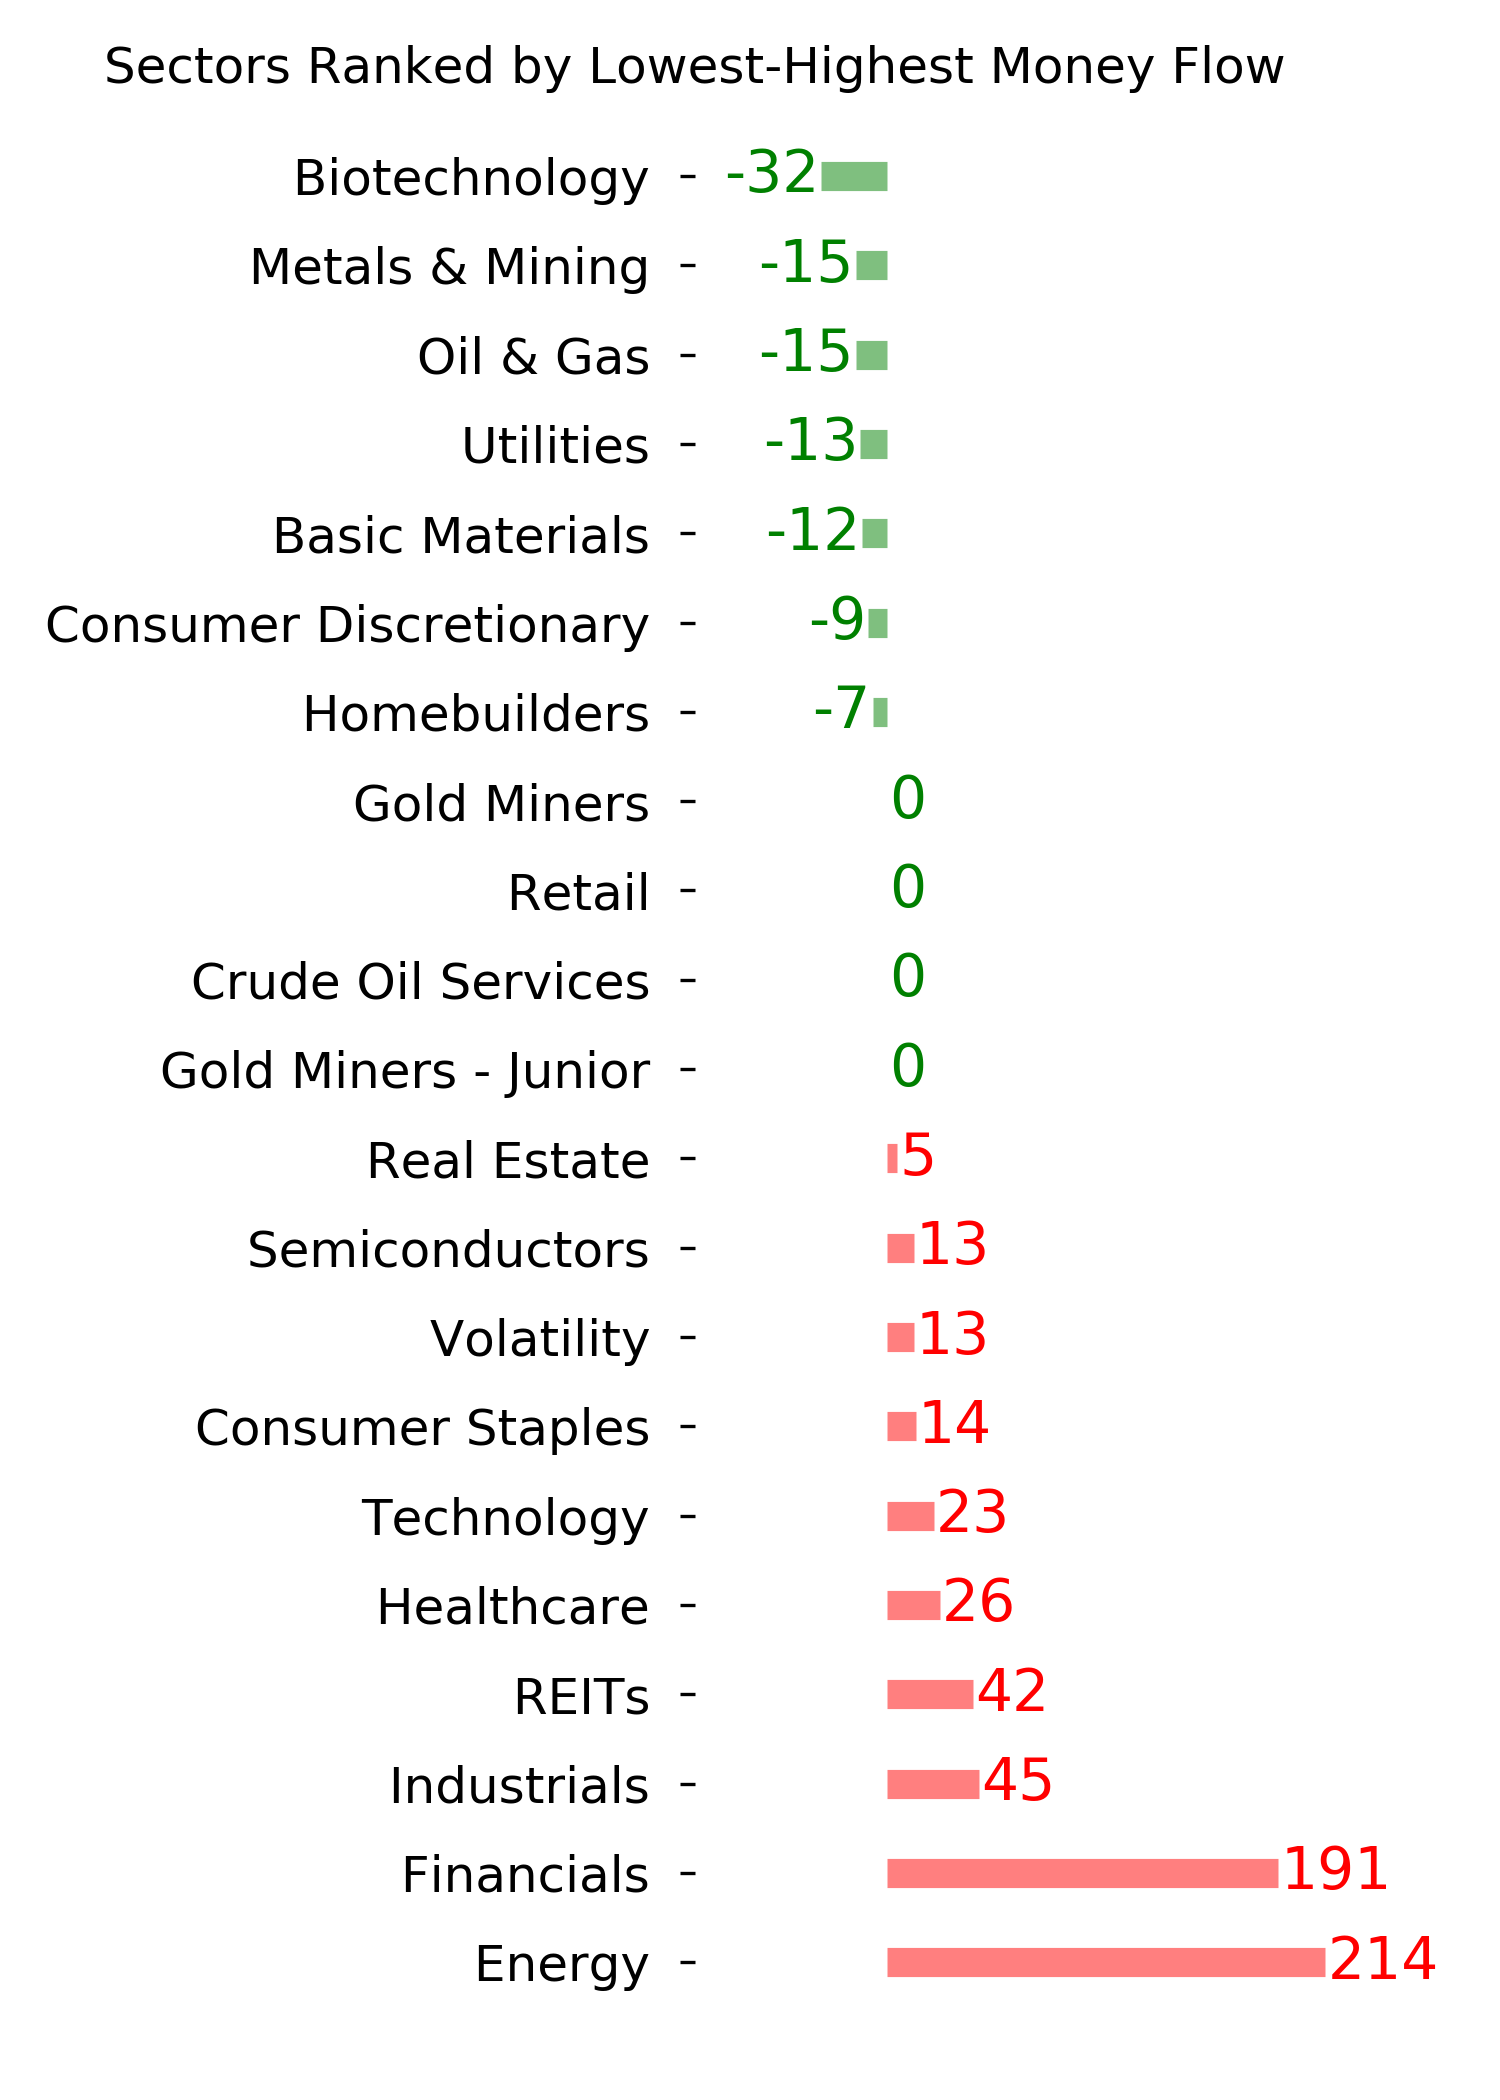
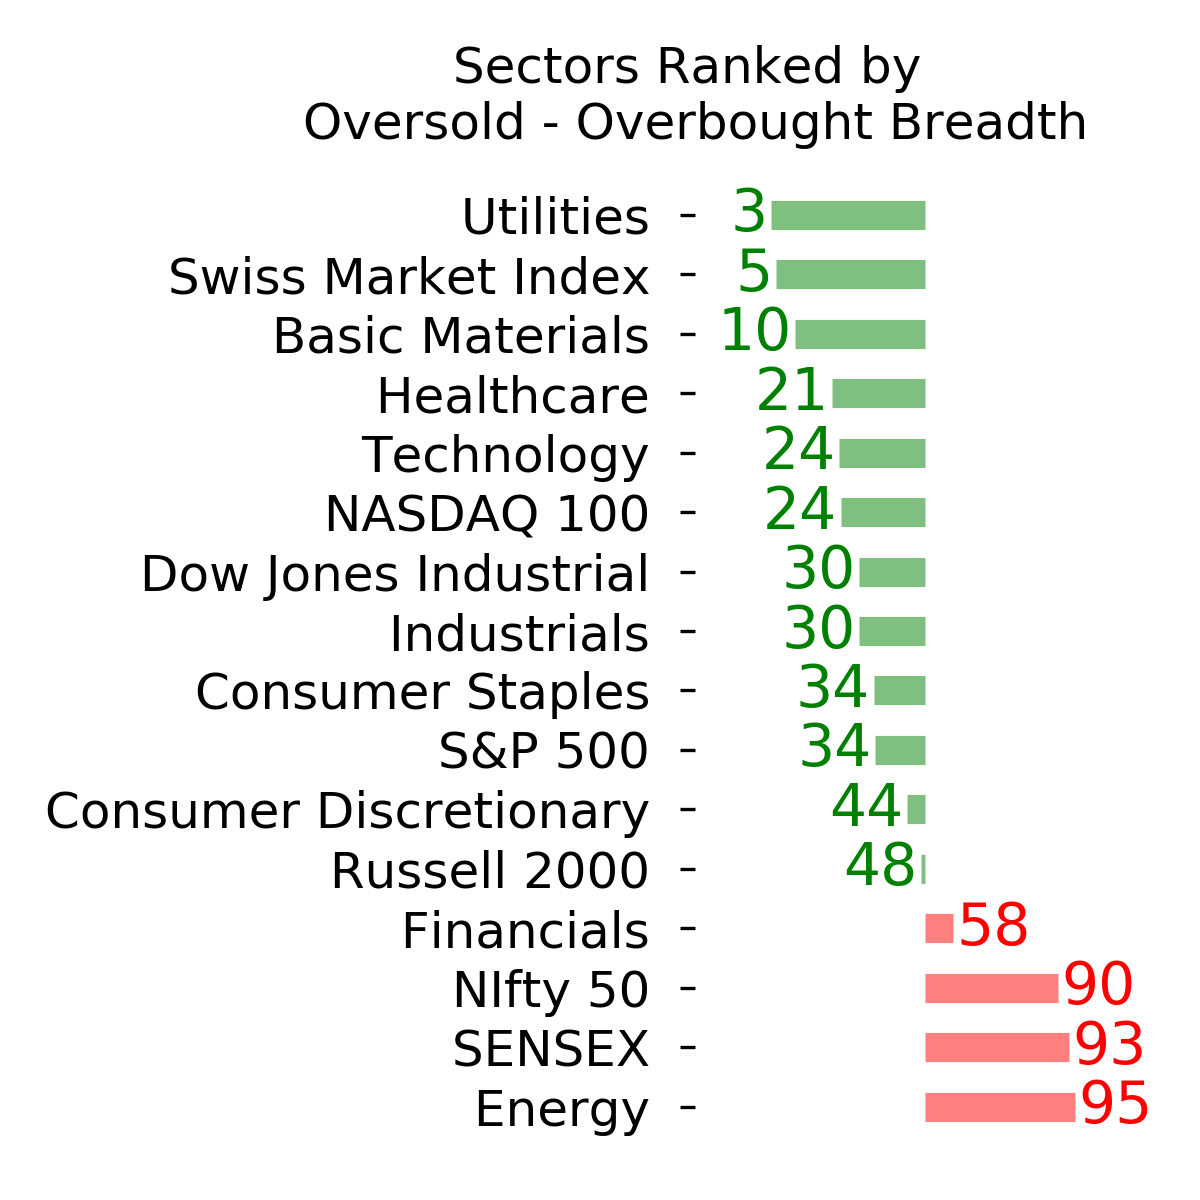
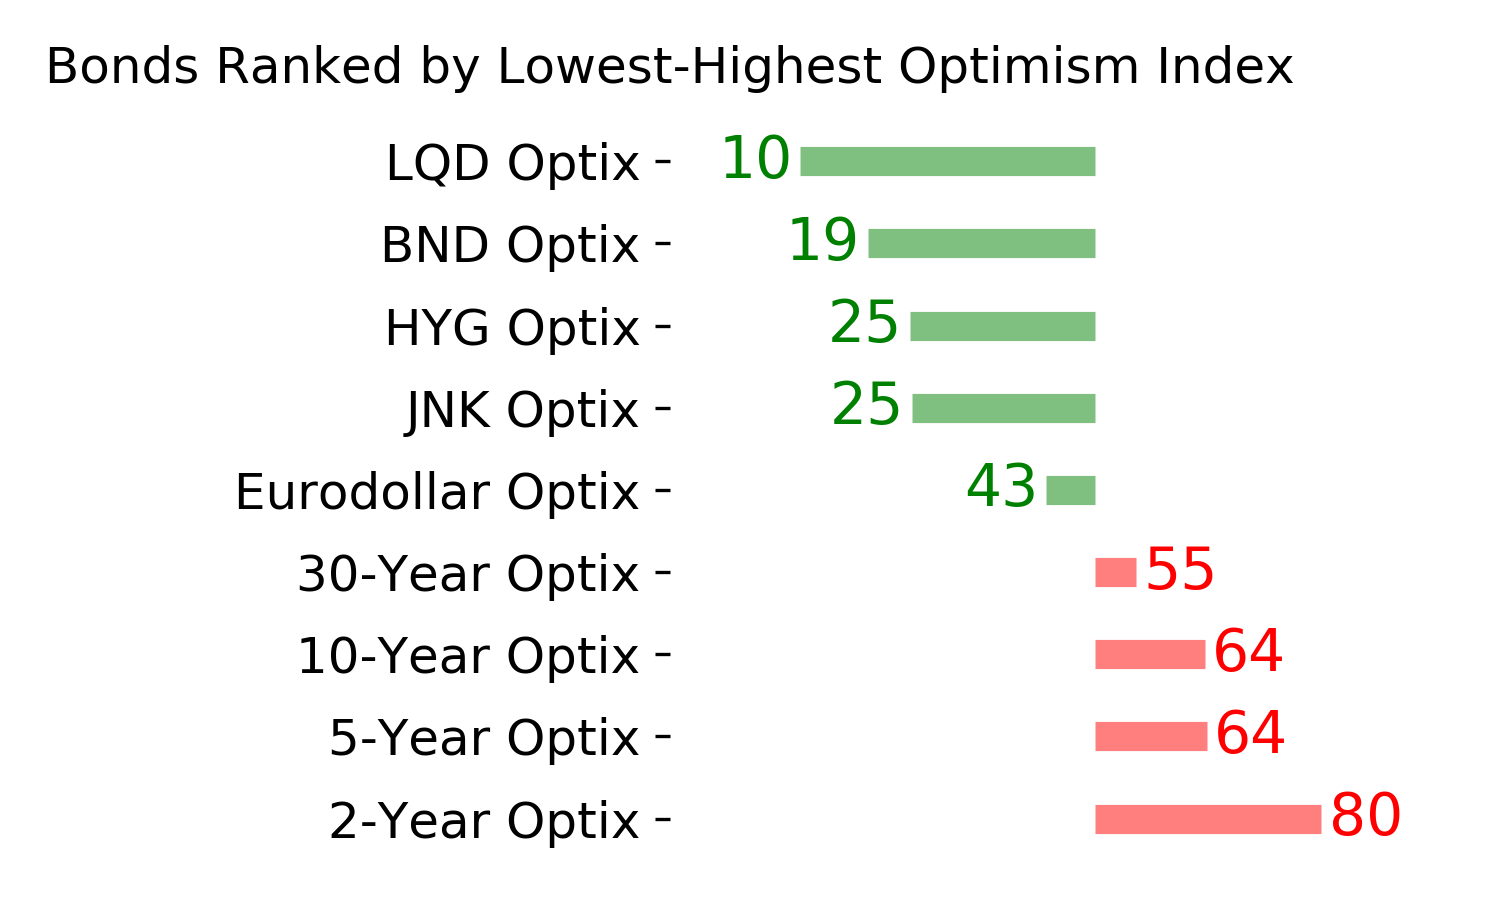
Optimism Index Thumbnails
|
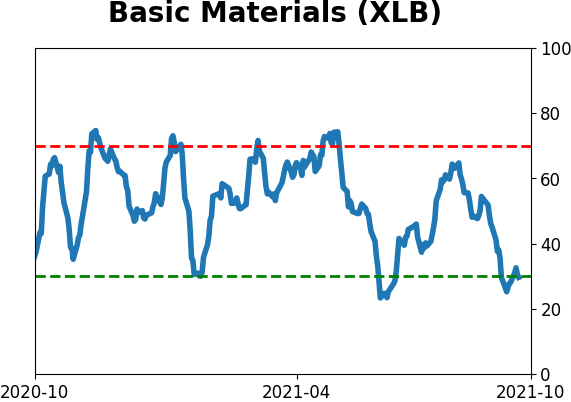
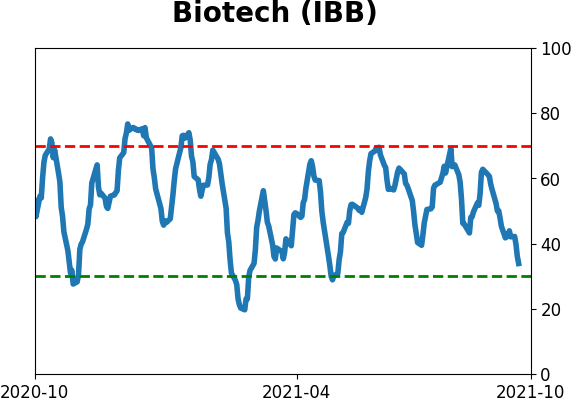
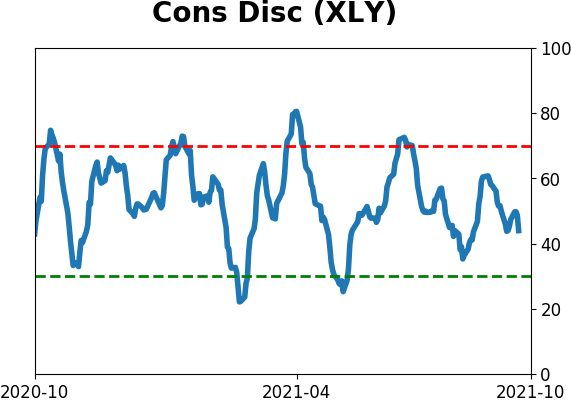
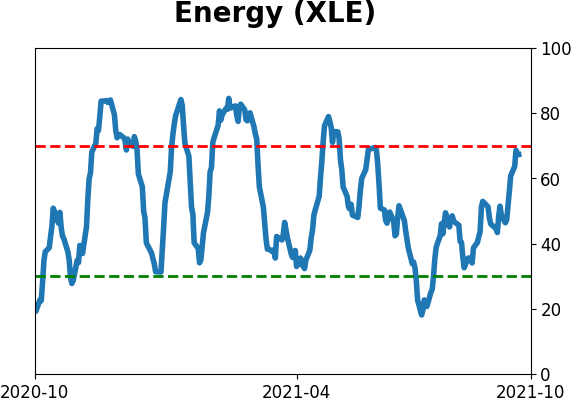
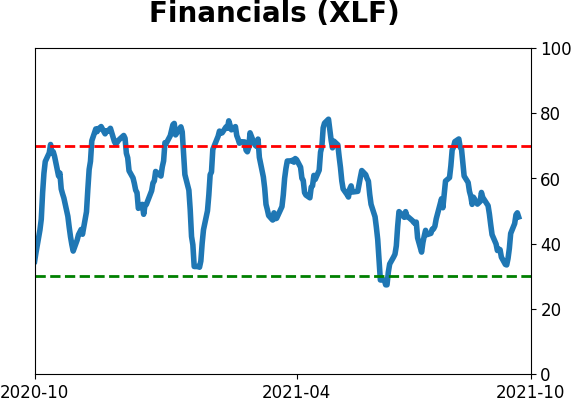
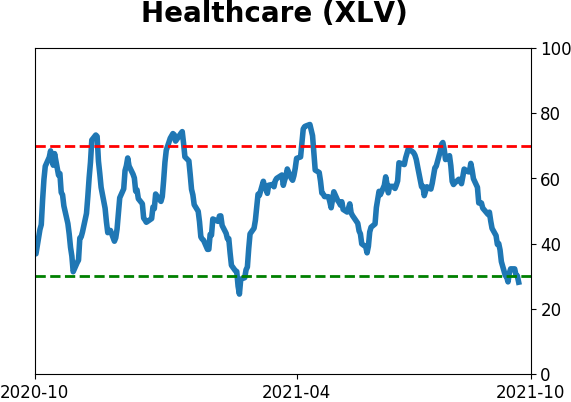
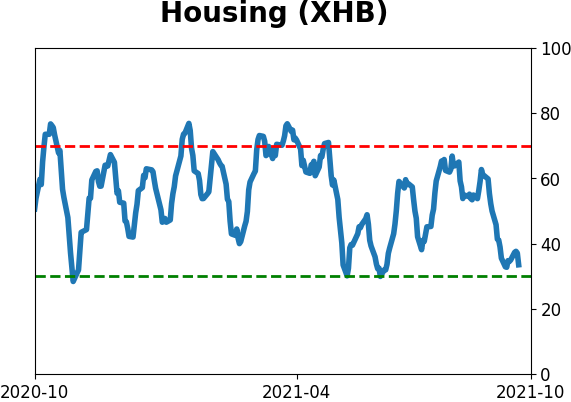
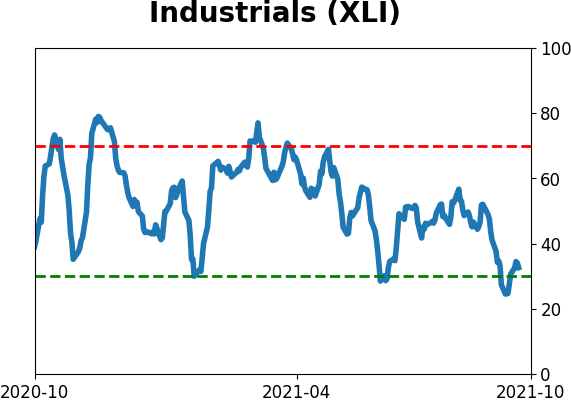
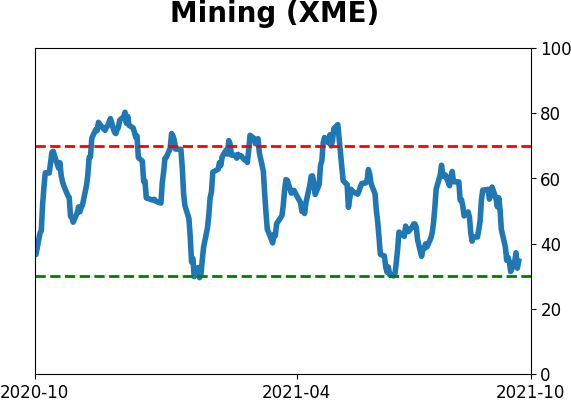
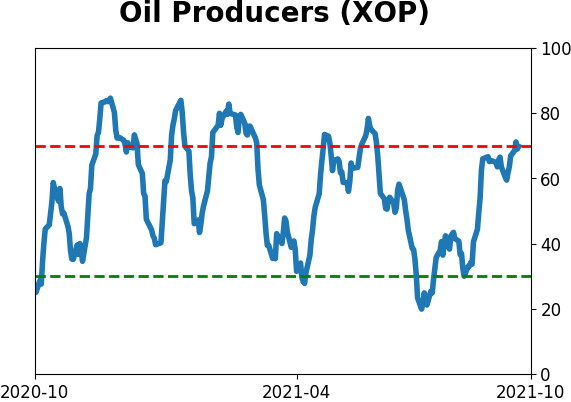
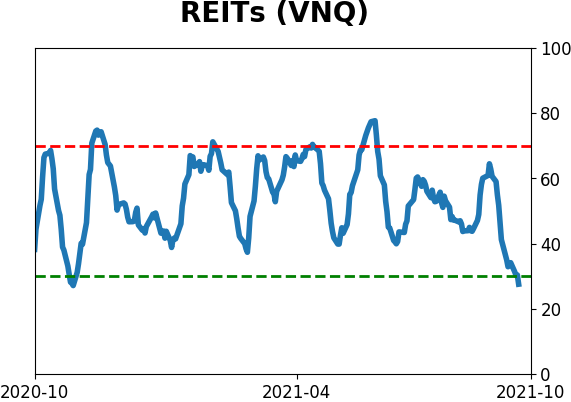
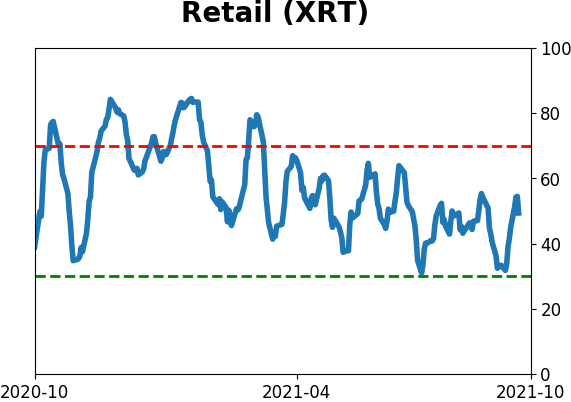
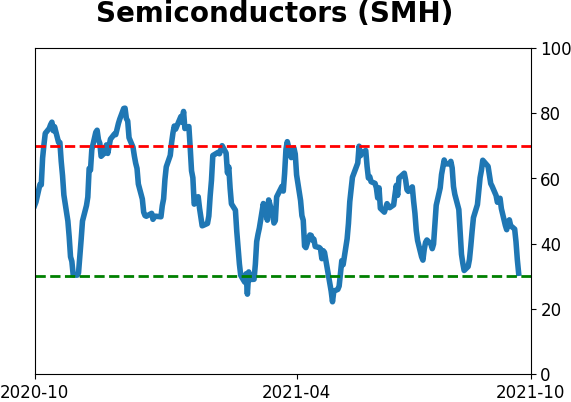
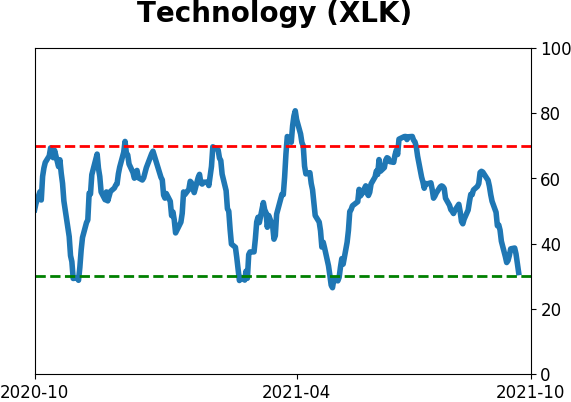
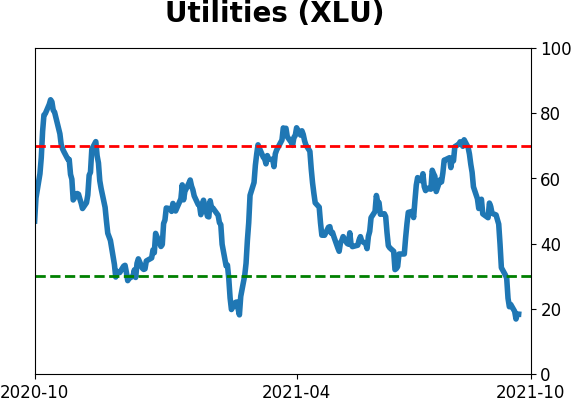
Sector ETF's - 10-Day Moving Average
|
|
|
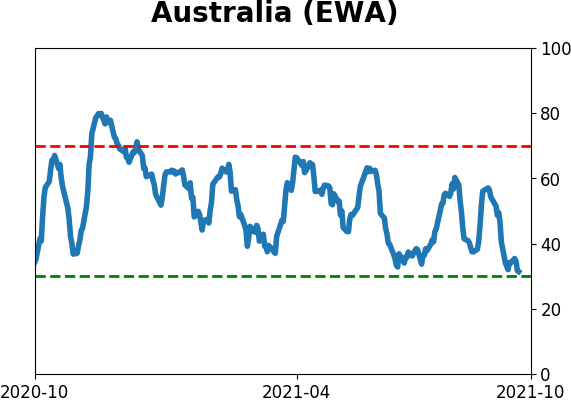
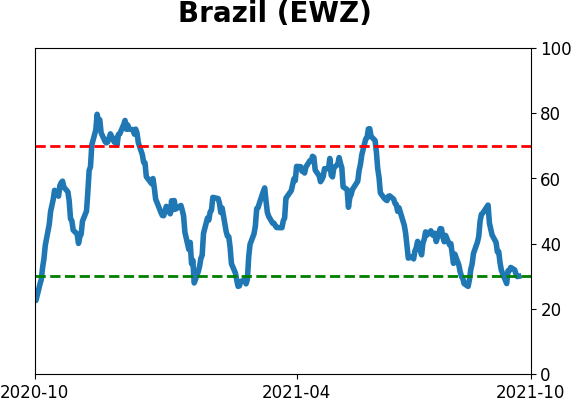
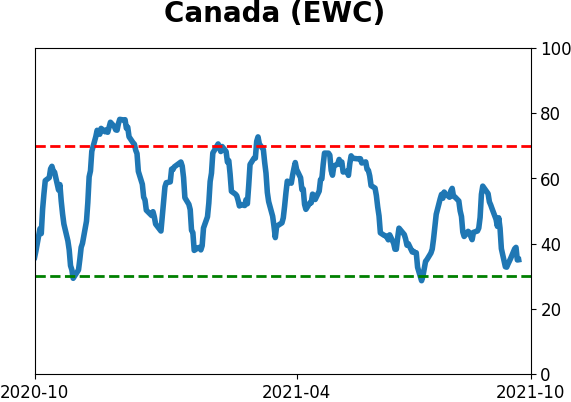
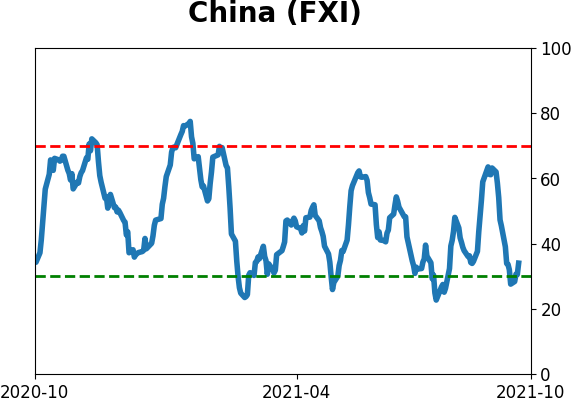
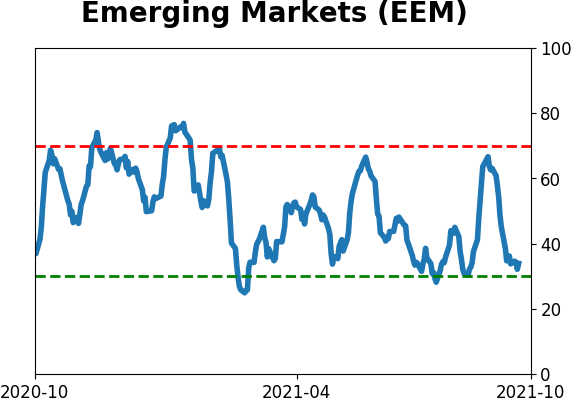
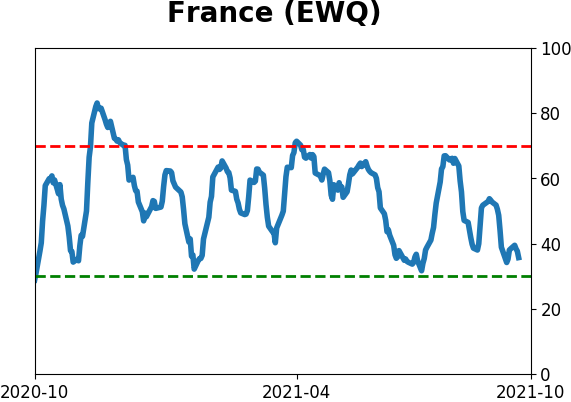
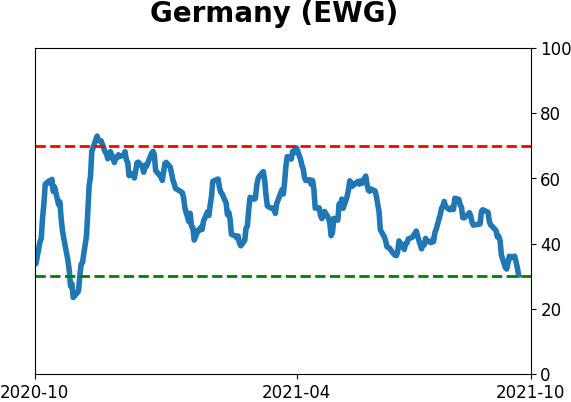
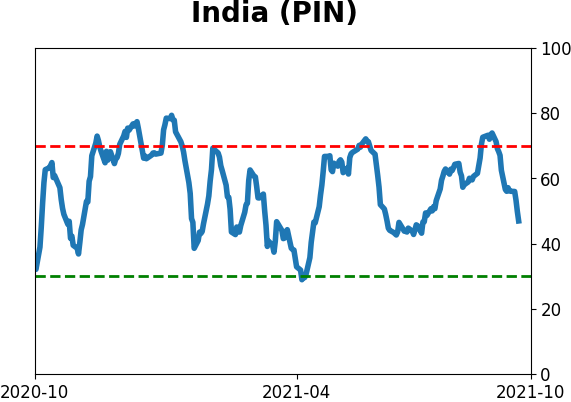
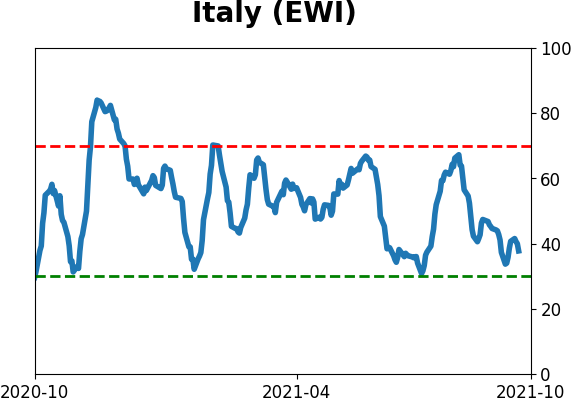
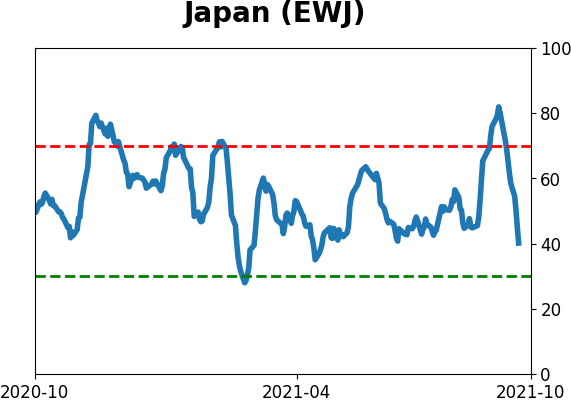
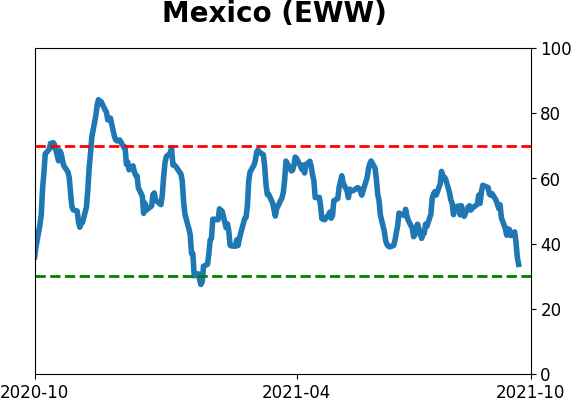
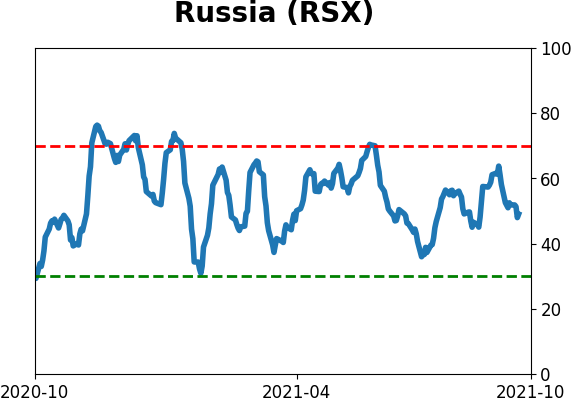
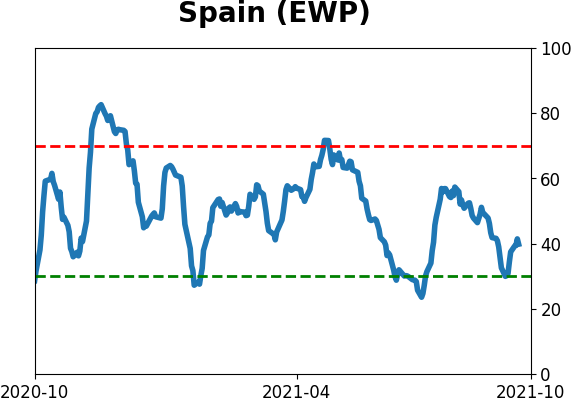
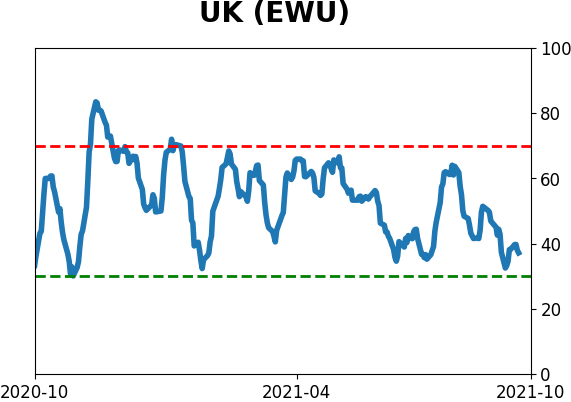
Country ETF's - 10-Day Moving Average
|
|
|
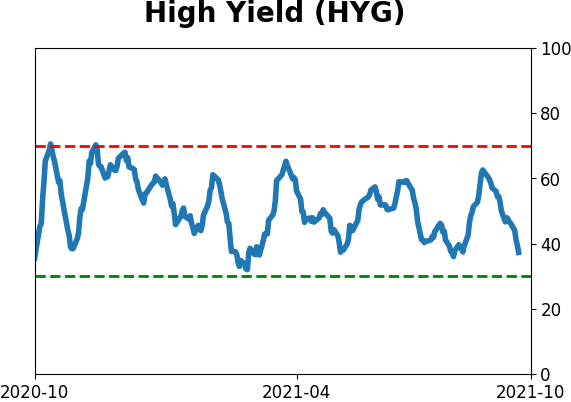
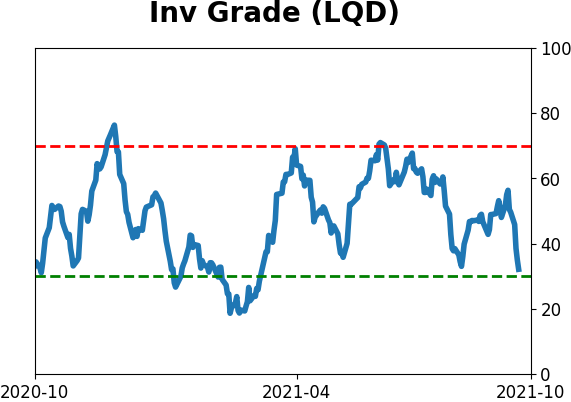
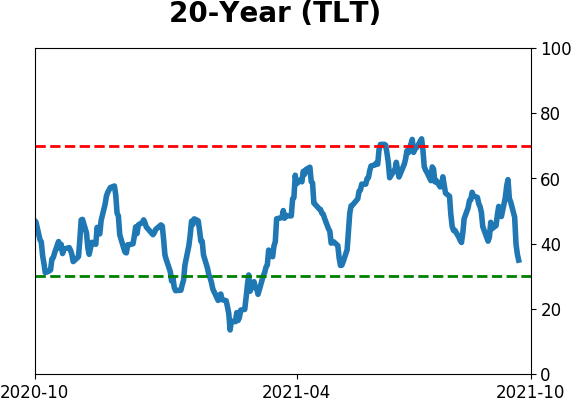
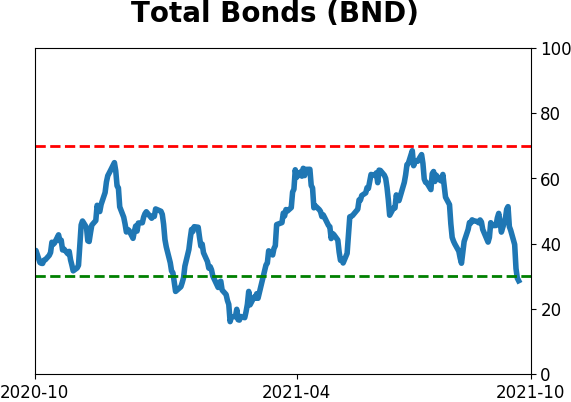
Bond ETF's - 10-Day Moving Average
|
|
|
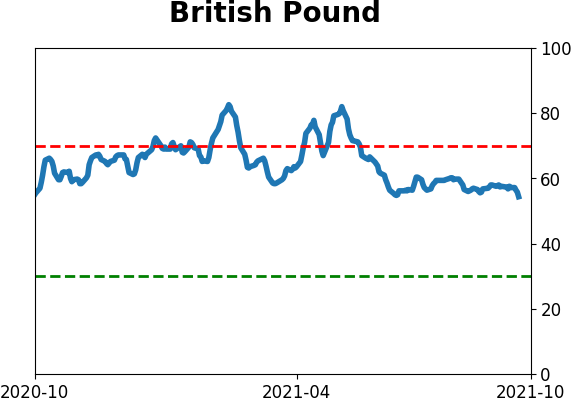
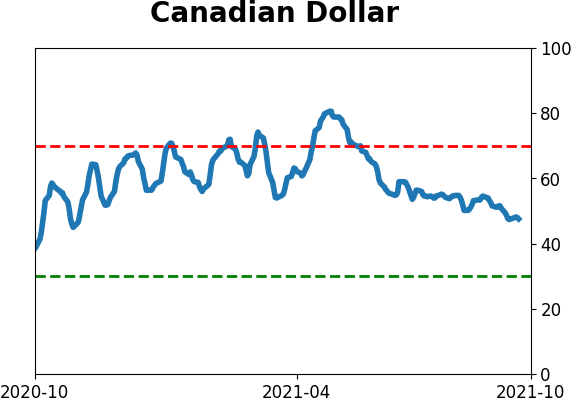
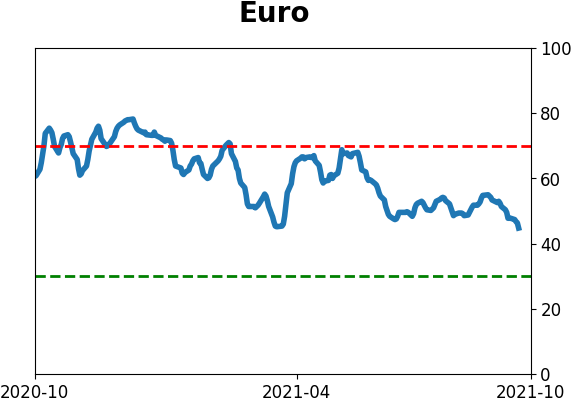
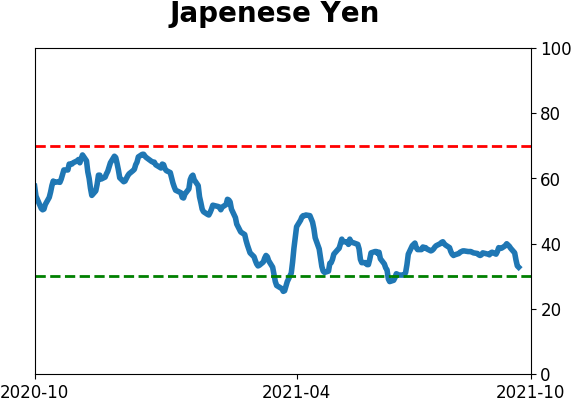
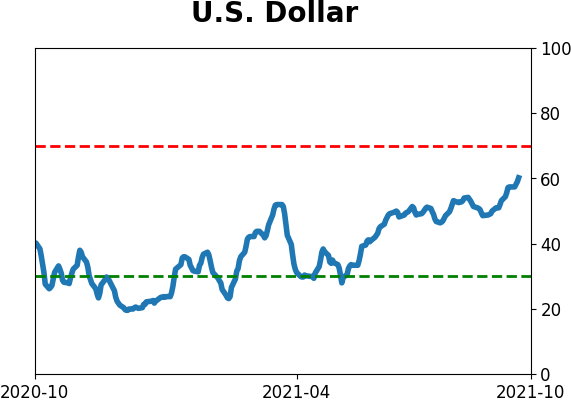
Currency ETF's - 5-Day Moving Average
|
|
|
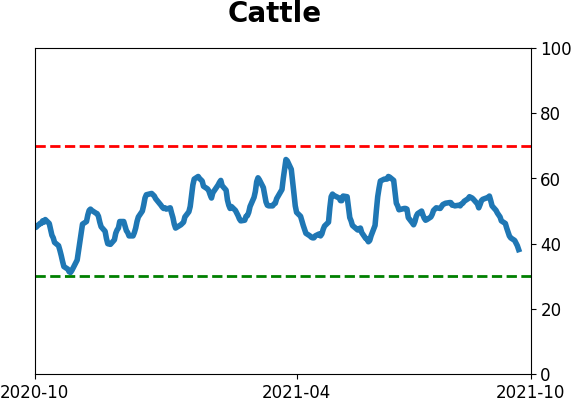
Commodity ETF's - 5-Day Moving Average
|
|