Headlines
|
|
The Energy Sector's Panic Breadth Reversal:
Energy stocks saw an internal breadth panic in mid-August. Since then, they've recovered strongly and a composite breadth measure completely reversed course. Now the sector has something to prove if it's going to continue in a bull market environment.
Bottom Line:
STOCKS: Hold
Sentiment continues to decline from the speculative February peak. With deteriorating breadth, this raises the risk of poor short- to medium-term returns until optimism and better breadth returns. See the Outlook & Allocations page for more. BONDS: Hold
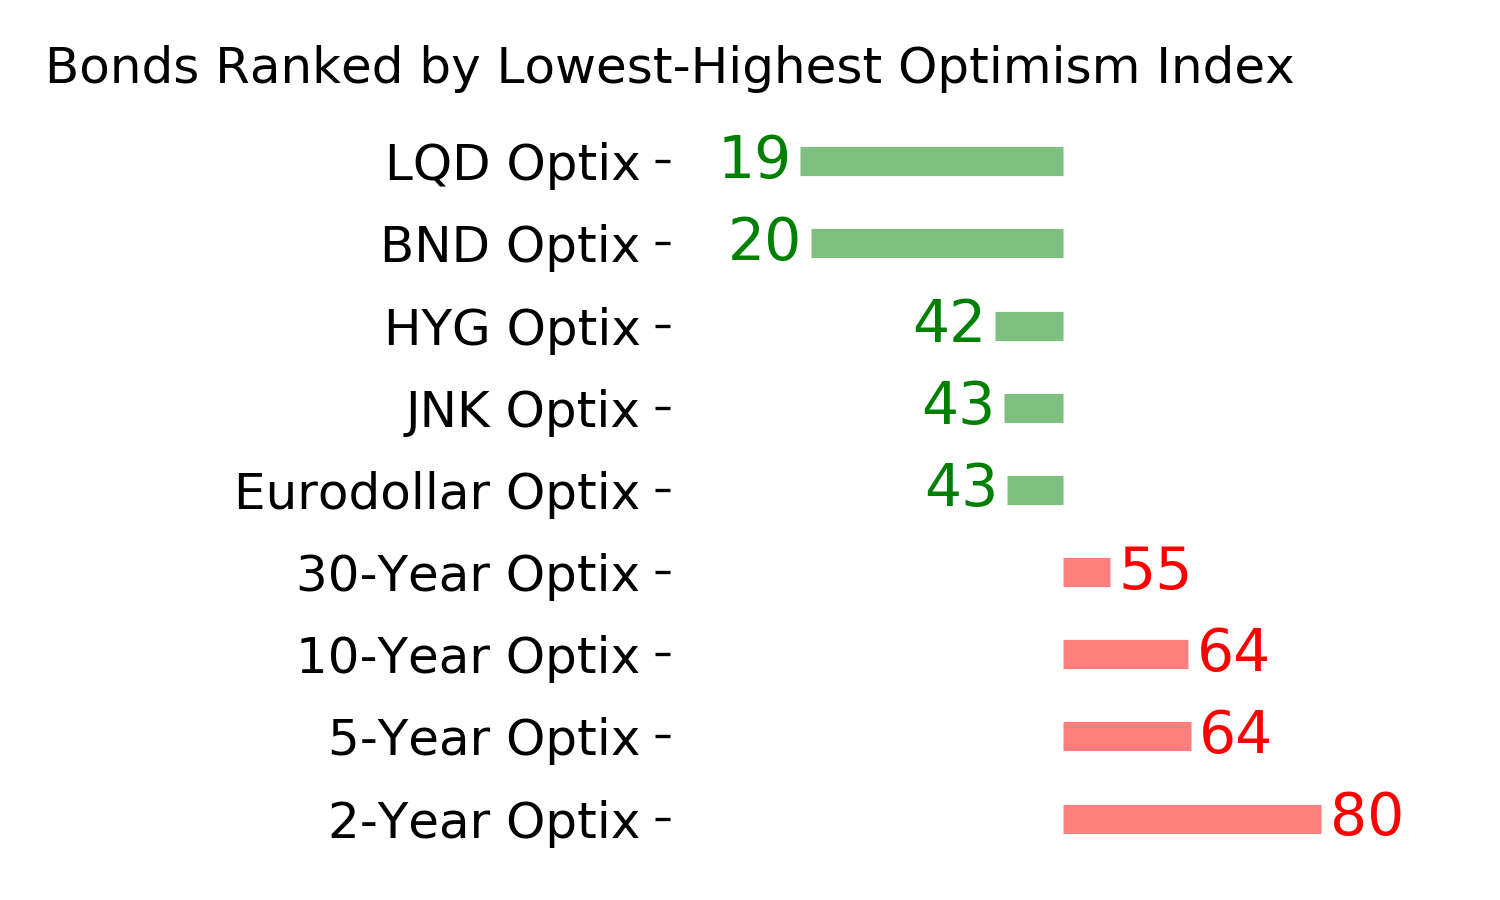
Various parts of the market got hit in March, with the lowest Bond Optimism Index we usually see during healthy environments. Bond prices have modest recovered and there is no edge among the data we follow. GOLD: Hold
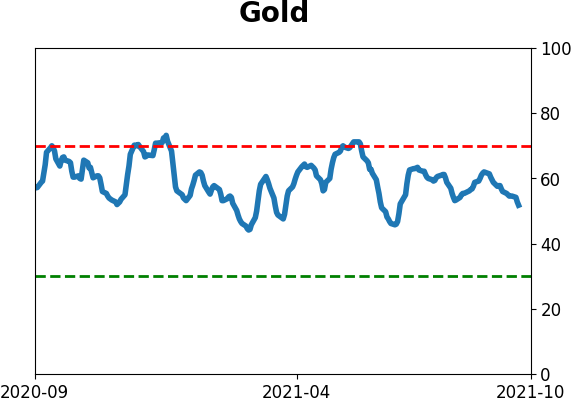
Gold and miners were rejected after trying to recover above their 200-day averages in May. Lately, some medium-term (not long-term) oversold extremes in breadth measures among miners have triggered.
|
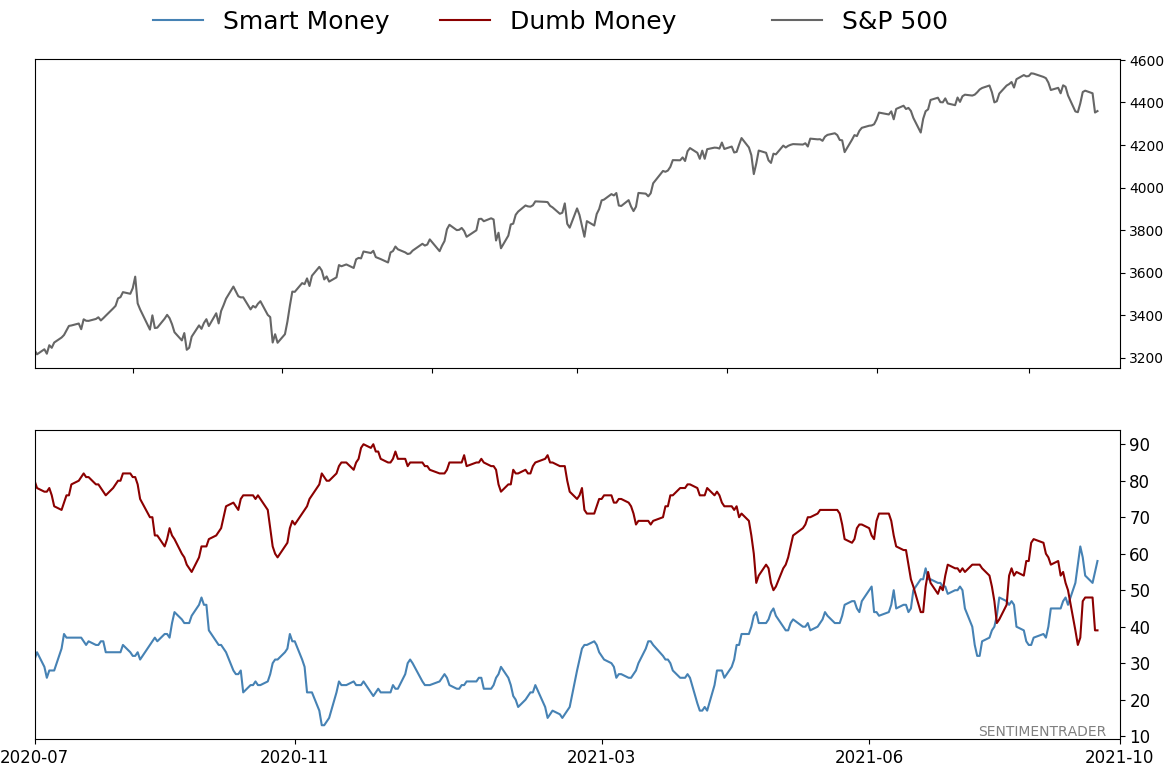
Smart / Dumb Money Confidence
|
Smart Money Confidence: 58%
Dumb Money Confidence: 39%
|
|
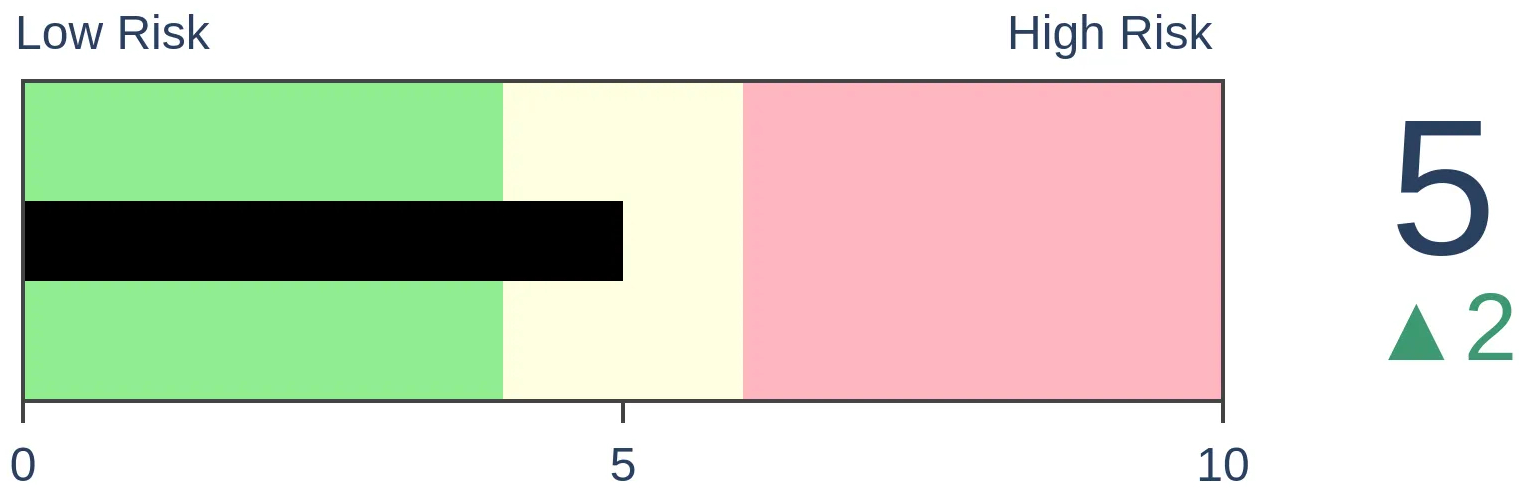
Risk Levels
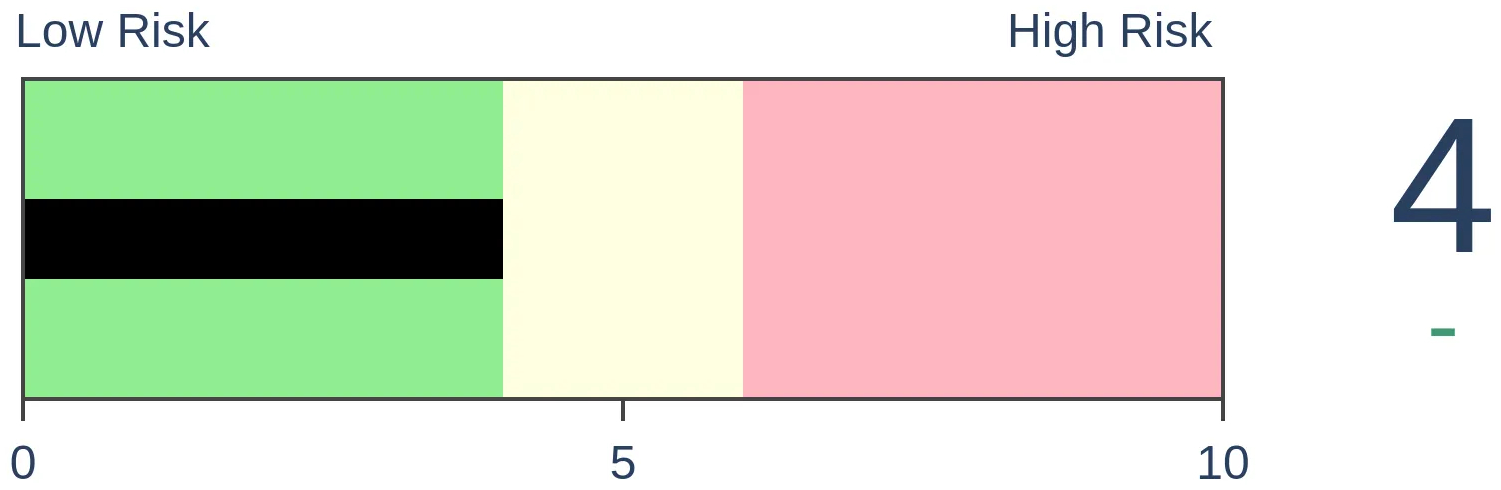
Stocks Short-Term
|
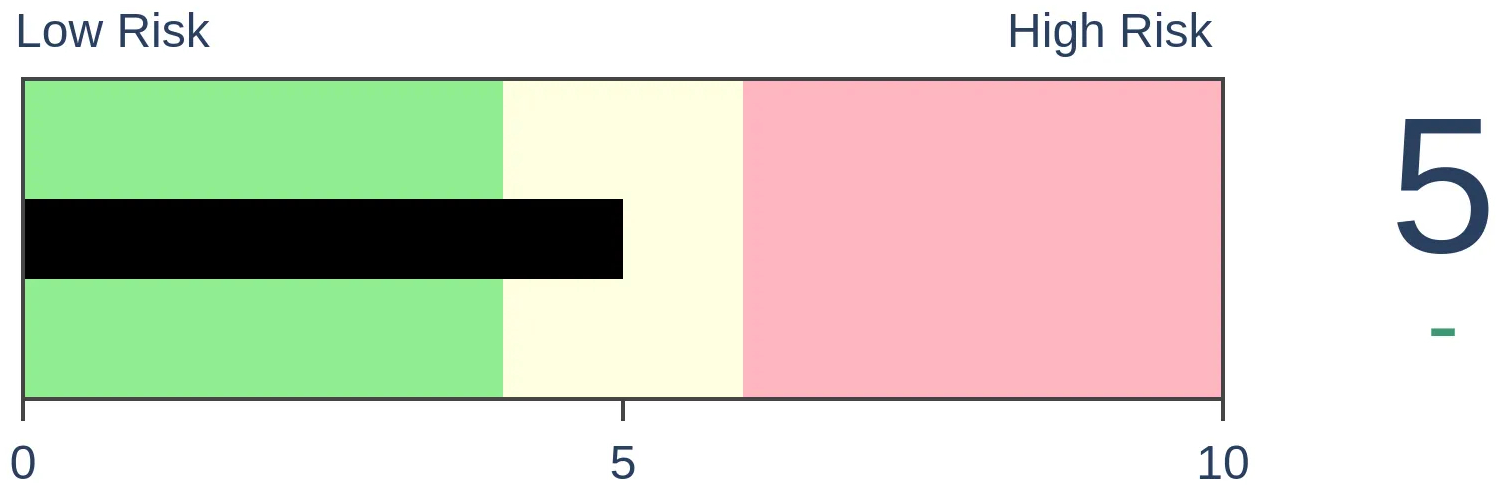
Stocks Medium-Term
|
|
Bonds
|
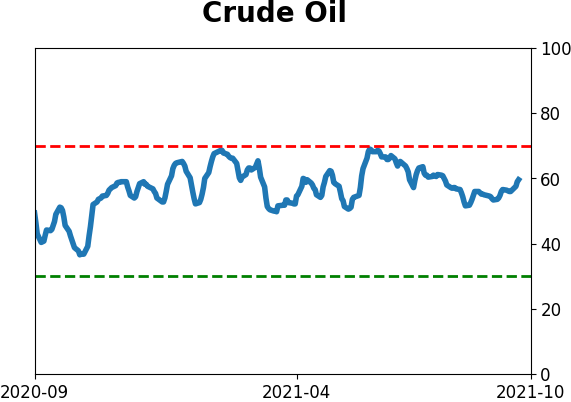
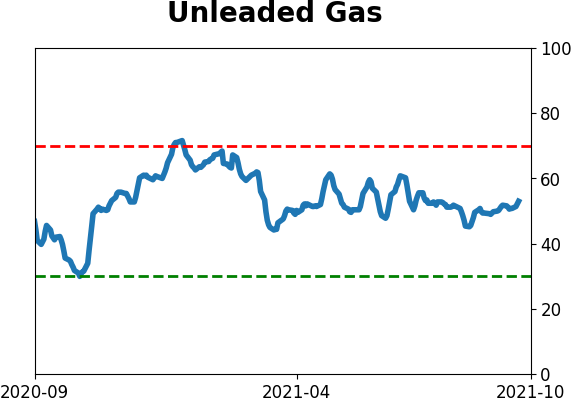
Crude Oil
|
|
Gold

|
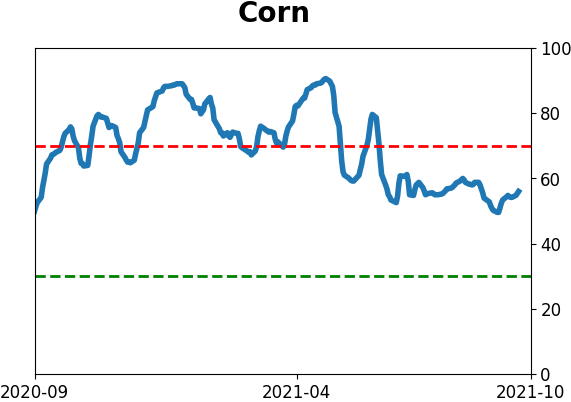
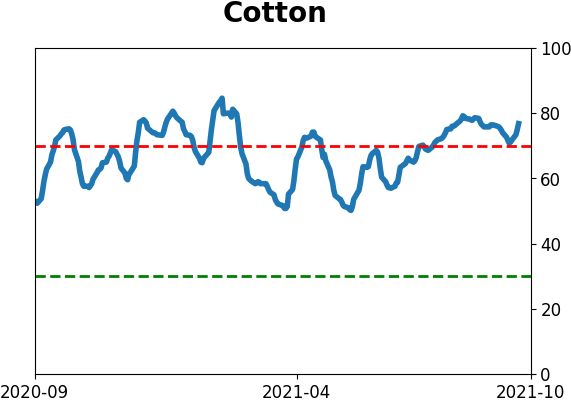
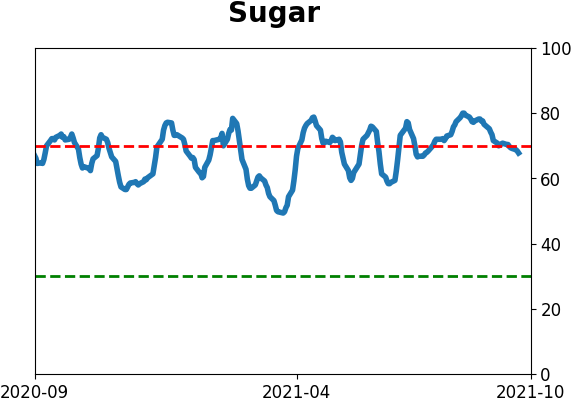
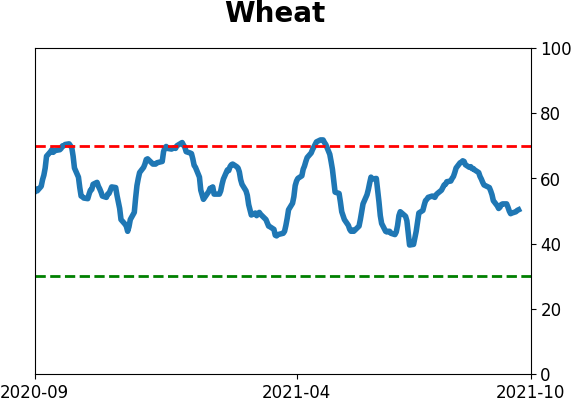
Agriculture

|
|
Research
By Jason Goepfert
BOTTOM LINE
Energy stocks saw an internal breadth panic in mid-August. Since then, they've recovered strongly and a composite breadth measure completely reversed course. Now the sector has something to prove if it's going to continue in a bull market environment.
FORECAST / TIMEFRAME
None
|
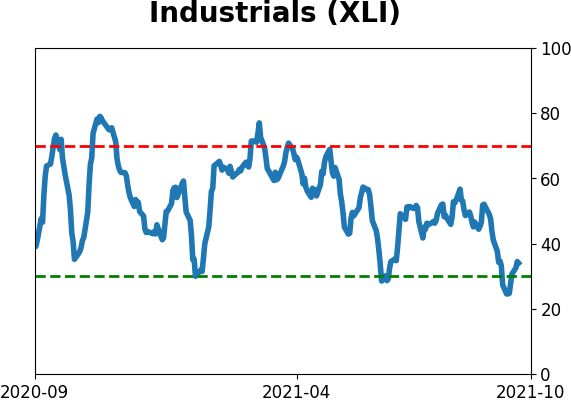
Like we saw with the Hang Seng and Industrials, Energy stocks have seen something of a panic. But unlike the other two, these stocks have also seen a quick about-face.
Using the same concept as the other two, and computing a composite breadth measure that aggregates nine different breadth metrics to detect hints of panic, Energy stocks suffered a panic spike in mid-August. But within a 30-day window, the panic completely reversed and went into negative territory. It's been relatively rare to see "negative panic" in recent years.
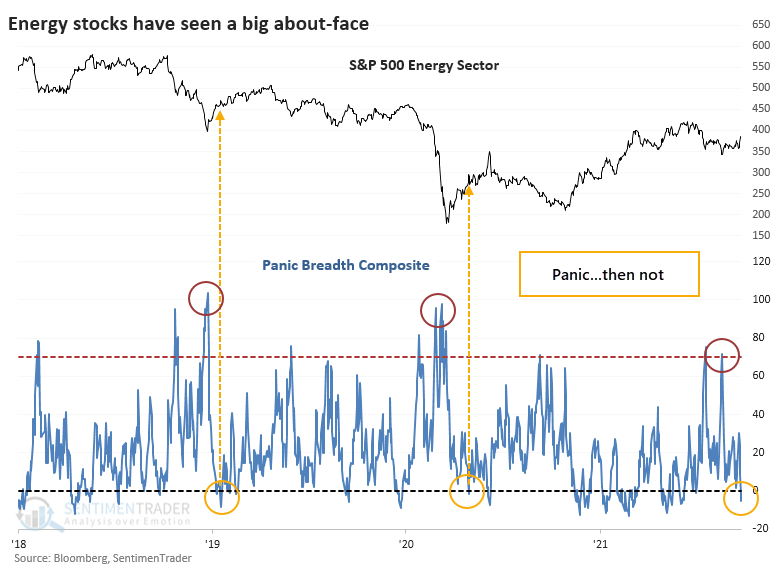
There have been two recent times when the Panic Breadth Composite reversed from above 70% to below zero within 30 days, in January 2019 and April 2020. Volatility was extremely high following the initial pandemic rebound but the sector did work higher both times for a couple of months before giving back those gains.
A LONG-TERM LOOK AT PANIC REVERSALS
Other times when investors in Energy stocks panicked by selling almost everything and then did a complete about-face, the sector tended to struggle in the months ahead. Over the next three months, only 40% of the signals saw the sector trade higher. The risk/reward was poor, and there was more of a tendency to see a big drop than a big rise.
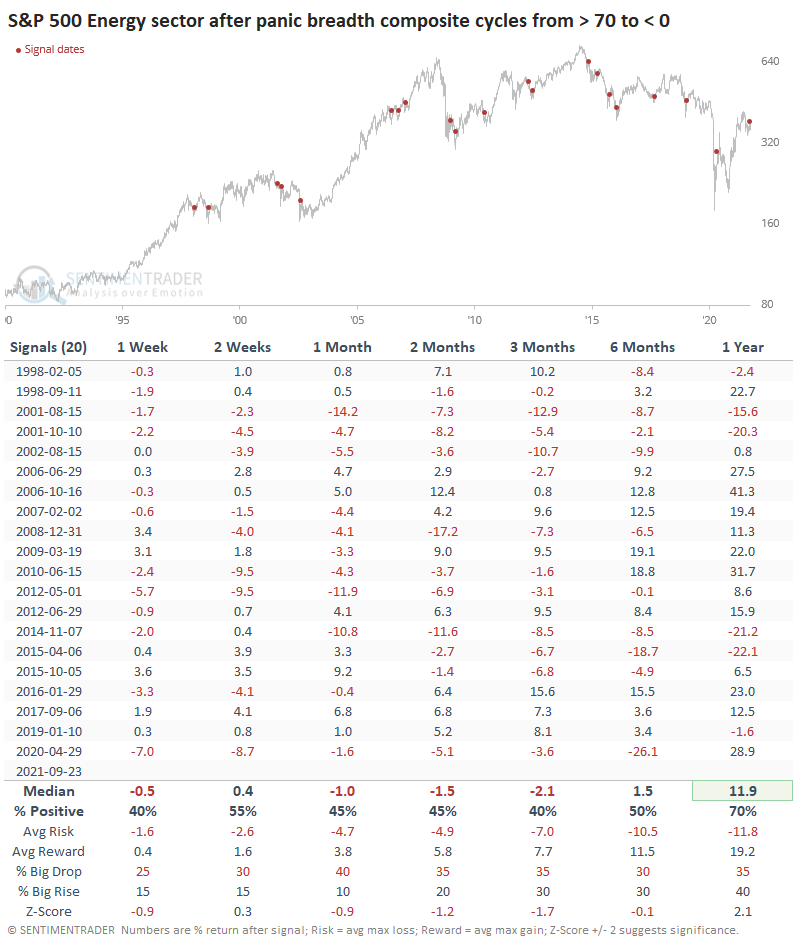
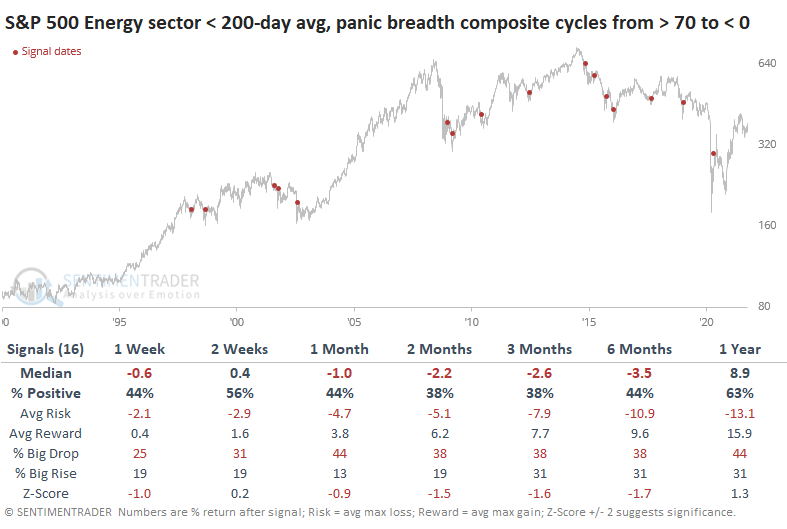
Volatility tends to be higher during bear markets, and the overwhelming majority of signals occurred when the S&P 500 Energy sector was below its 200-day moving average. Out of 20 breath reversals, 16 of them triggered during bear markets. And so it makes sense that rallies during bear markets tended to see below-average returns going forward.
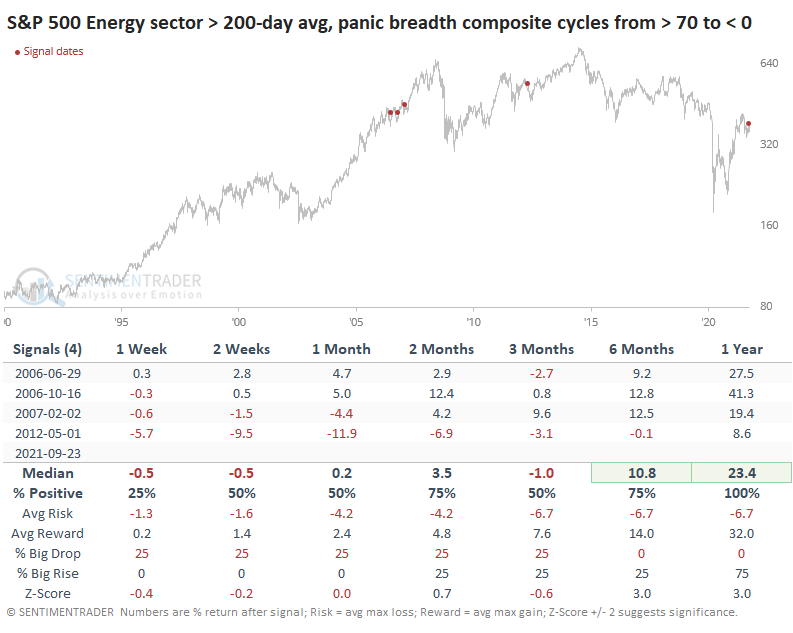
PANIC REVERSALS IN BULL MARKETS
There were only four other times it triggered when above the 200-day, like it did this time. The success rate was higher (as much as we can read into a sample size of four), but not without volatility. Over the next year, Energy stocks rallied each time, but three of the four instances were clustered in an 8-month window.
The Risk/Reward Table shows quite a bit of risk among the four. Three of them suffered more than a 5% loss at some point during the next few months, and one was more than 10%.
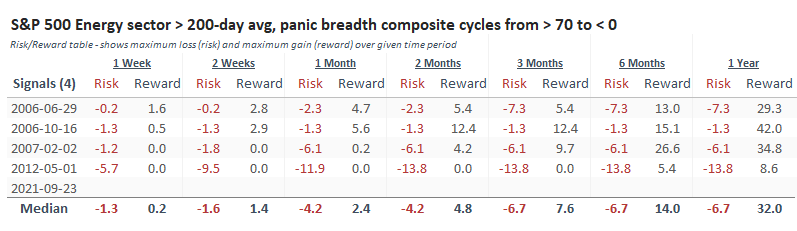
With signals like this, losers tend to start losing right away as sellers see their first real opportunity to get out at a good price. While that can happen with winning signals, too, the selling tends to be milder and briefer. Overbought conditions are seen as less of a barrier and perhaps even a sign of unusual and persistent strength, which attracts even more buyers. The sector has a lot to prove, and this will be a good test. If the stocks can hold together in the weeks ahead, this reversal in panic should prove to be a lasting sign of a change in character.
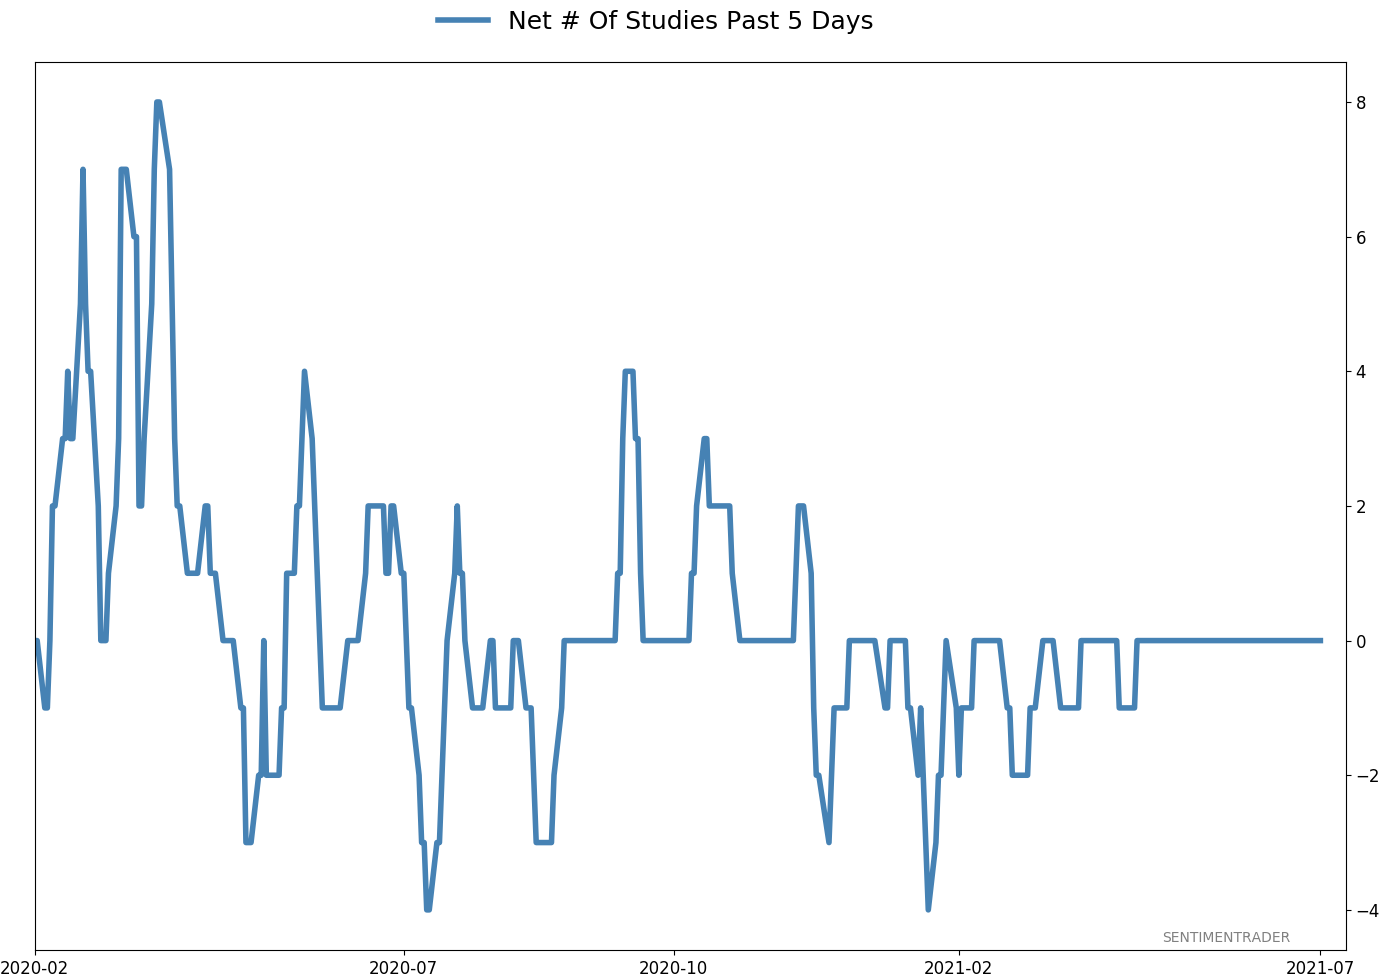
Active Studies
| Time Frame | Bullish | Bearish | | Short-Term | 0 | 6 | | Medium-Term | 8 | 3 | | Long-Term | 11 | 5 |
|
Indicators at Extremes
Portfolio
| Position | Description | Weight % | Added / Reduced | Date | | Stocks | RSP | 4.1 | Added 4.1% | 2021-05-19 | | Bonds | 23.9% BND, 6.9% SCHP | 30.7 | Reduced 7.1% | 2021-05-19 | | Commodities | GCC | 2.6 | Reduced 2.1%
| 2020-09-04 | | Precious Metals | GDX | 5.6 | Reduced 4.2% | 2021-05-19 | | Special Situations | 4.3% XLE, 2.2% PSCE | 7.6 | Reduced 5.6% | 2021-04-22 | | Cash | | 49.4 | | |
|
Updates (Changes made today are underlined)
Much of our momentum and trend work has remained positive for several months, with some scattered exceptions. Almost all sentiment-related work has shown a poor risk/reward ratio for stocks, especially as speculation drove to record highs in exuberance in February. Much of that has worn off, and most of our models are back toward neutral levels. There isn't much to be excited about here. The same goes for bonds and even gold. Gold has been performing well lately and is back above long-term trend lines. The issue is that it has a poor record of holding onto gains when attempting a long-term trend change like this, so we'll take a wait-and-see approach. RETURN YTD: 8.6% 2020: 8.1%, 2019: 12.6%, 2018: 0.6%, 2017: 3.8%, 2016: 17.1%, 2015: 9.2%, 2014: 14.5%, 2013: 2.2%, 2012: 10.8%, 2011: 16.5%, 2010: 15.3%, 2009: 23.9%, 2008: 16.2%, 2007: 7.8%
|
|
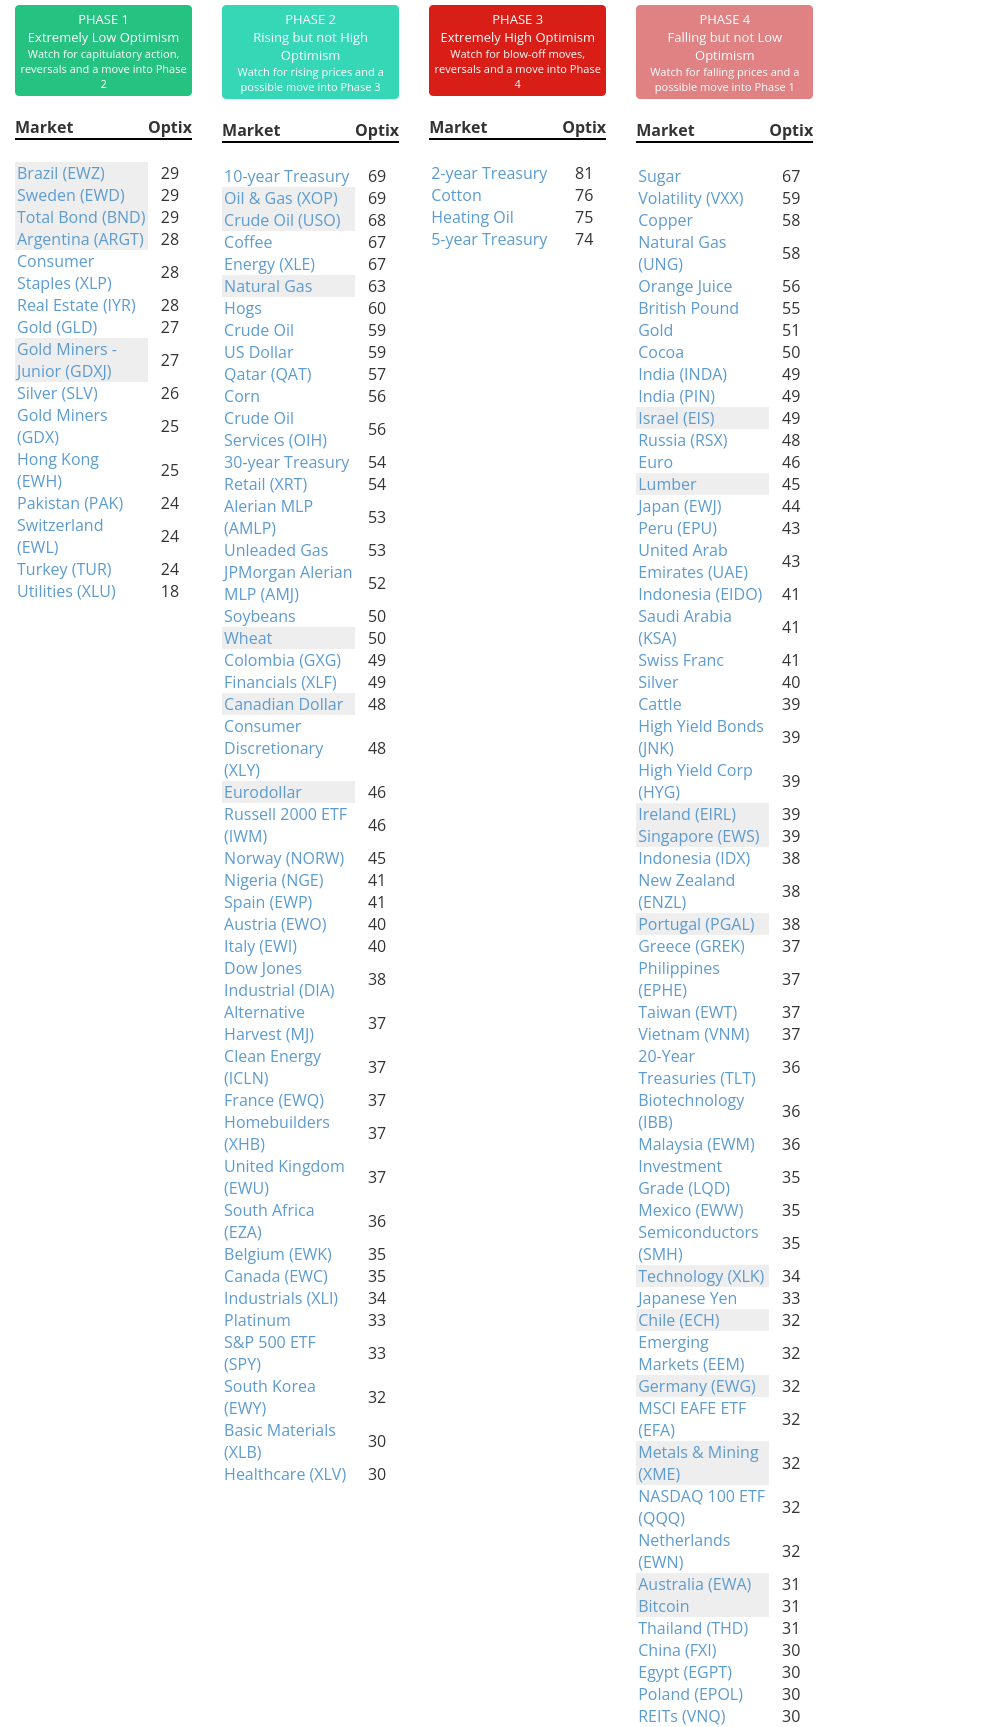
Phase Table
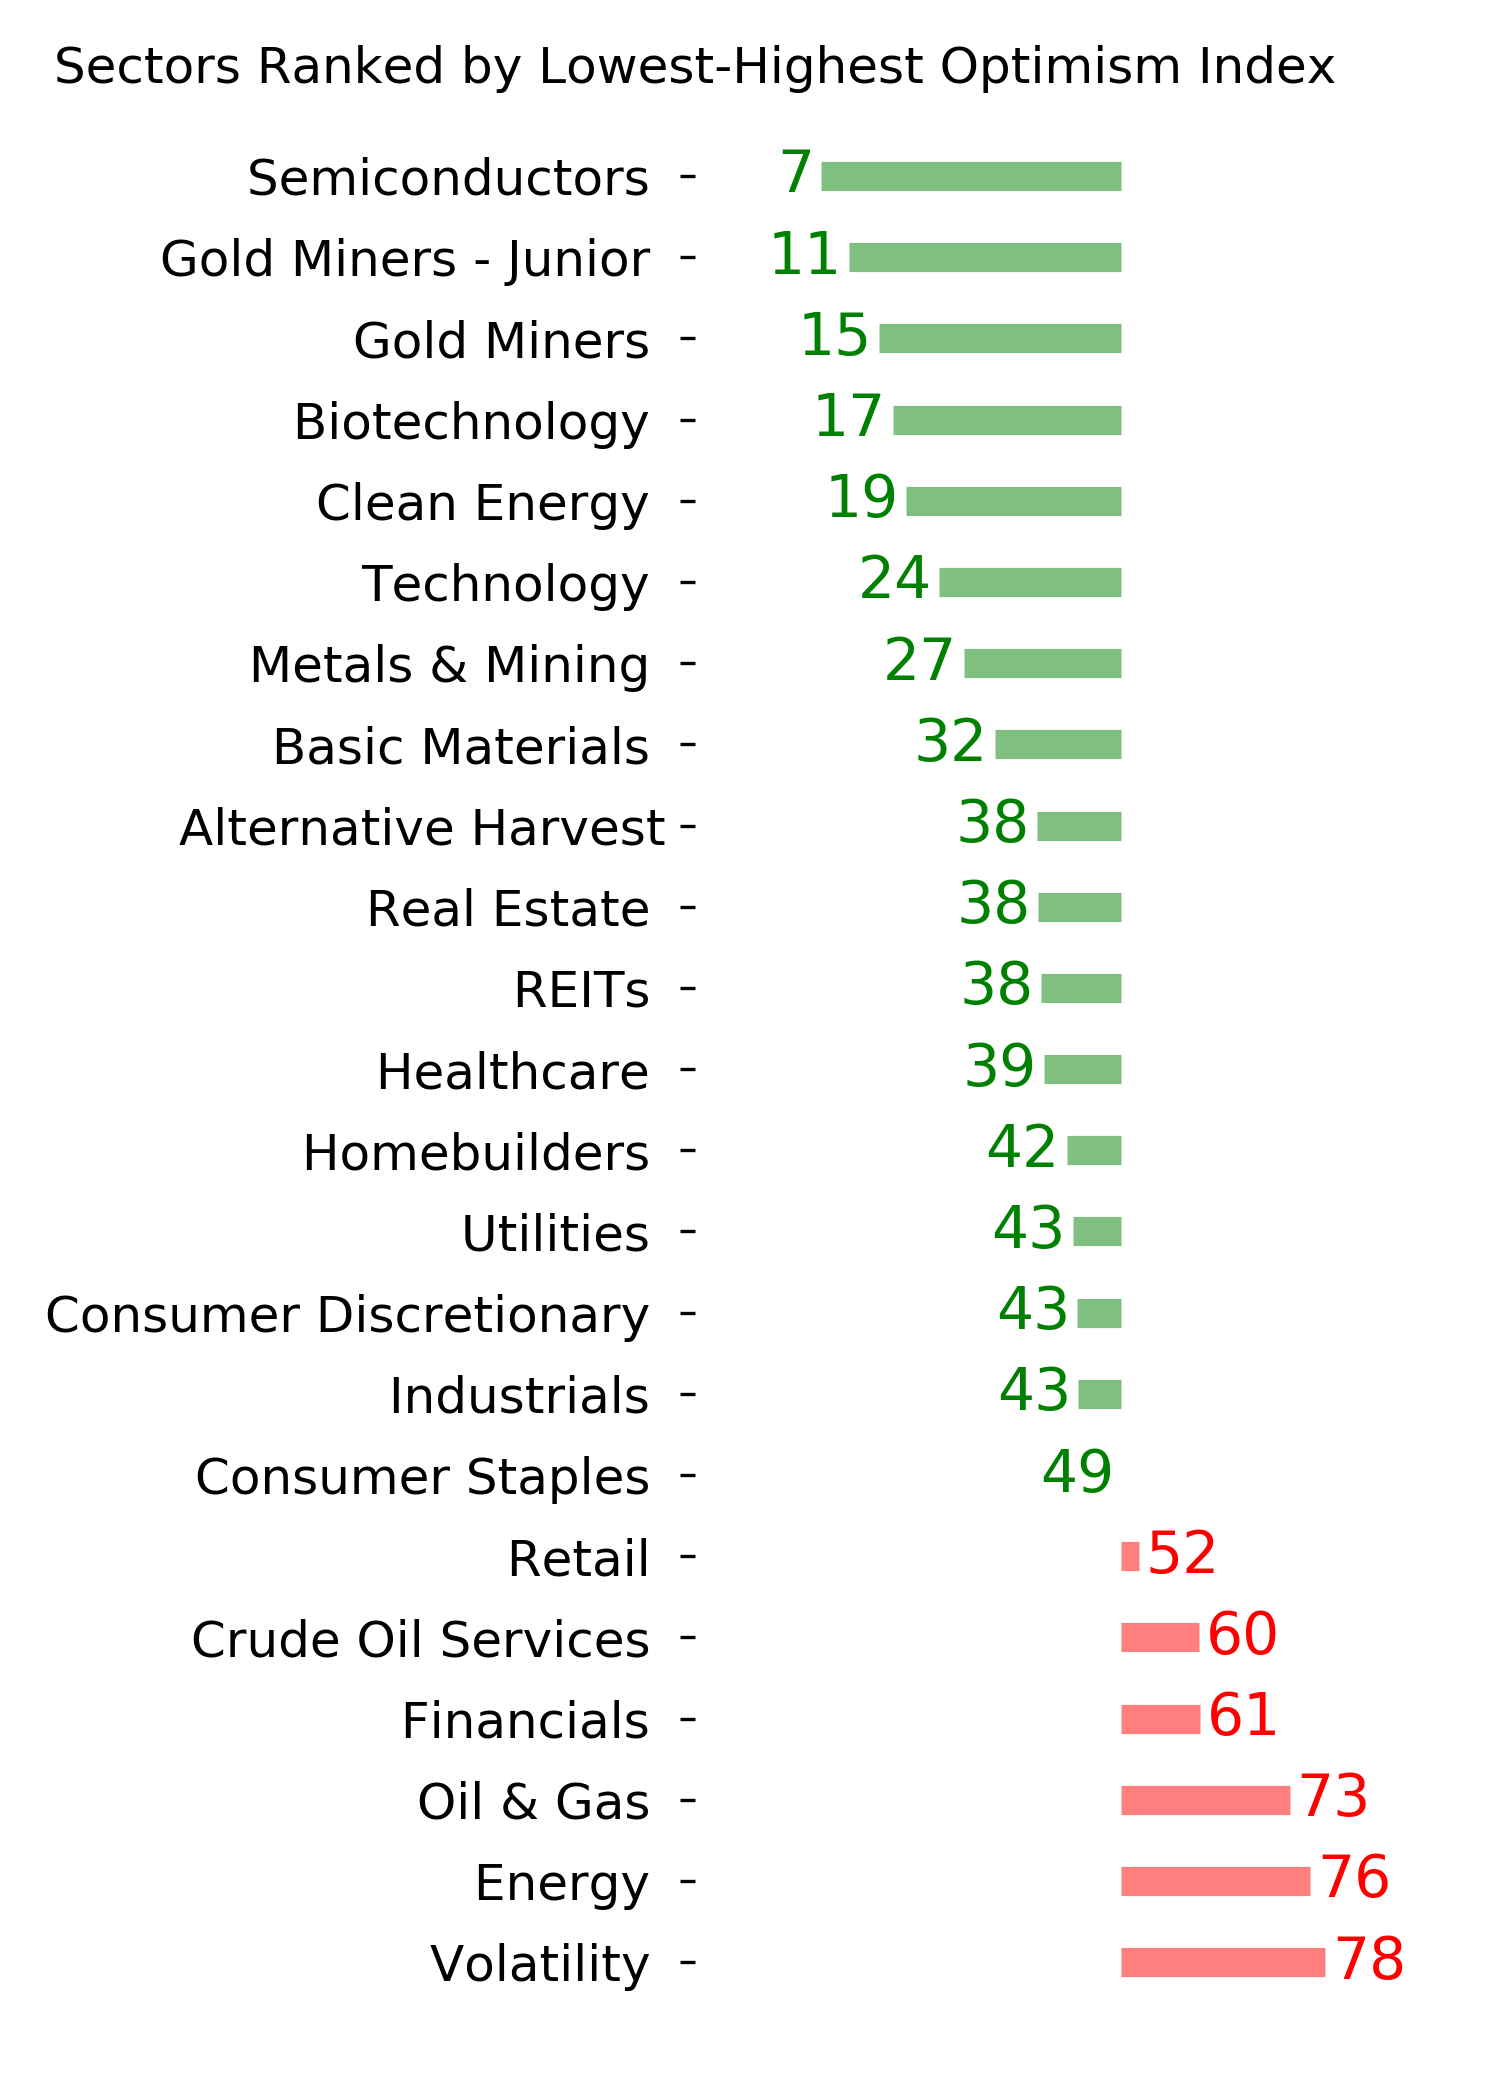
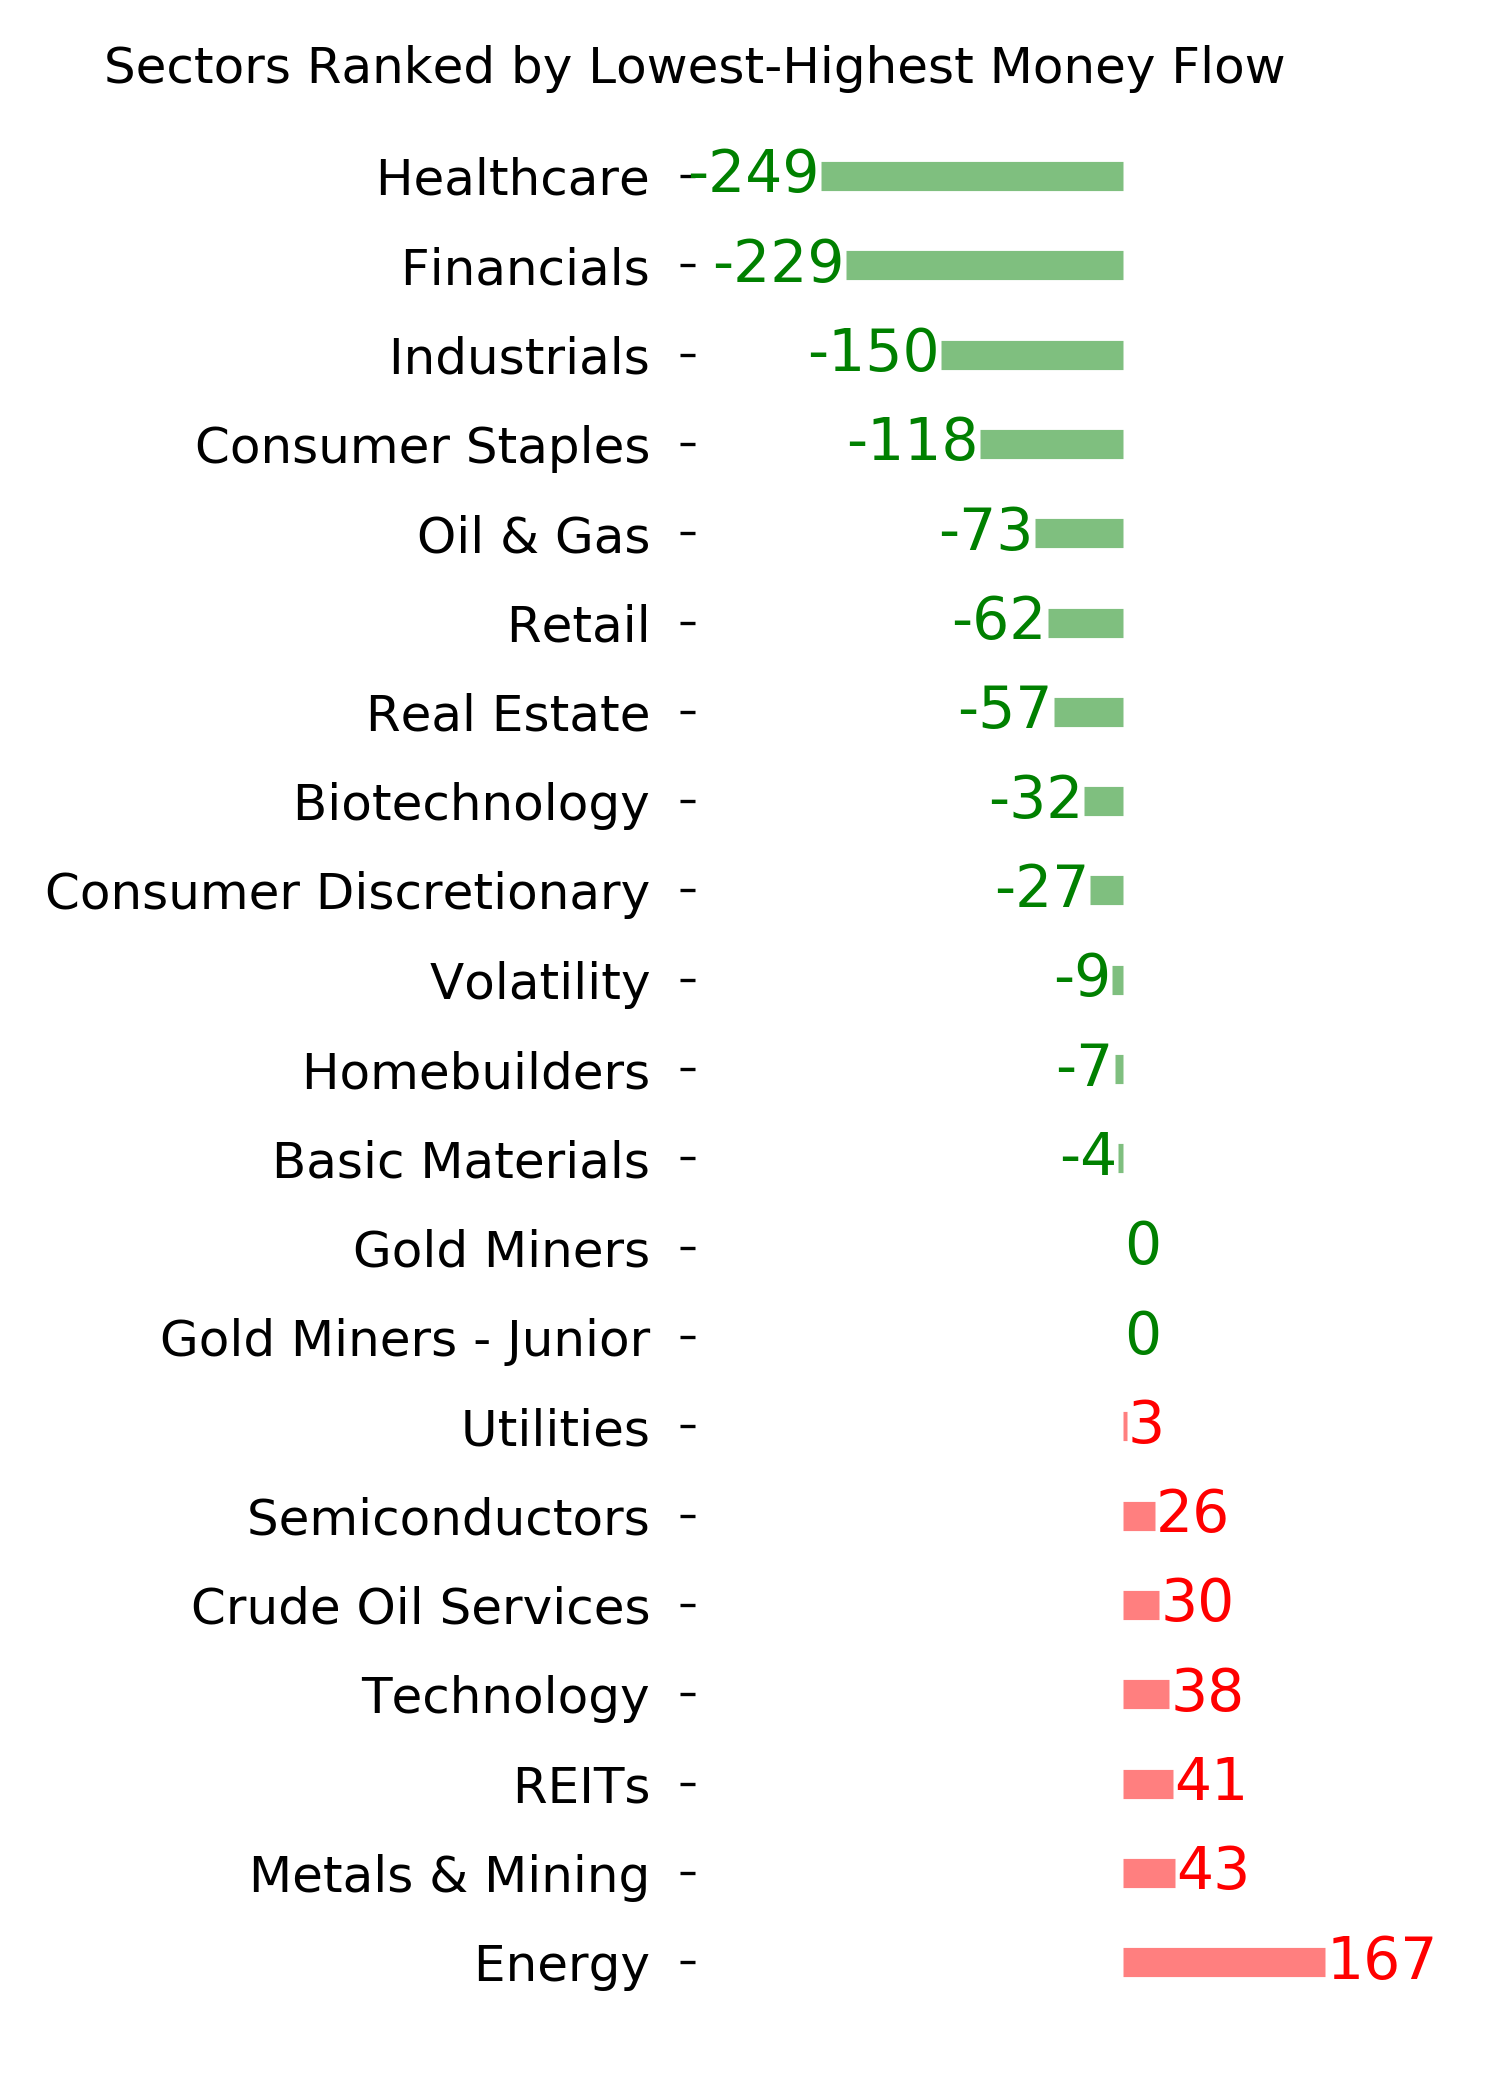
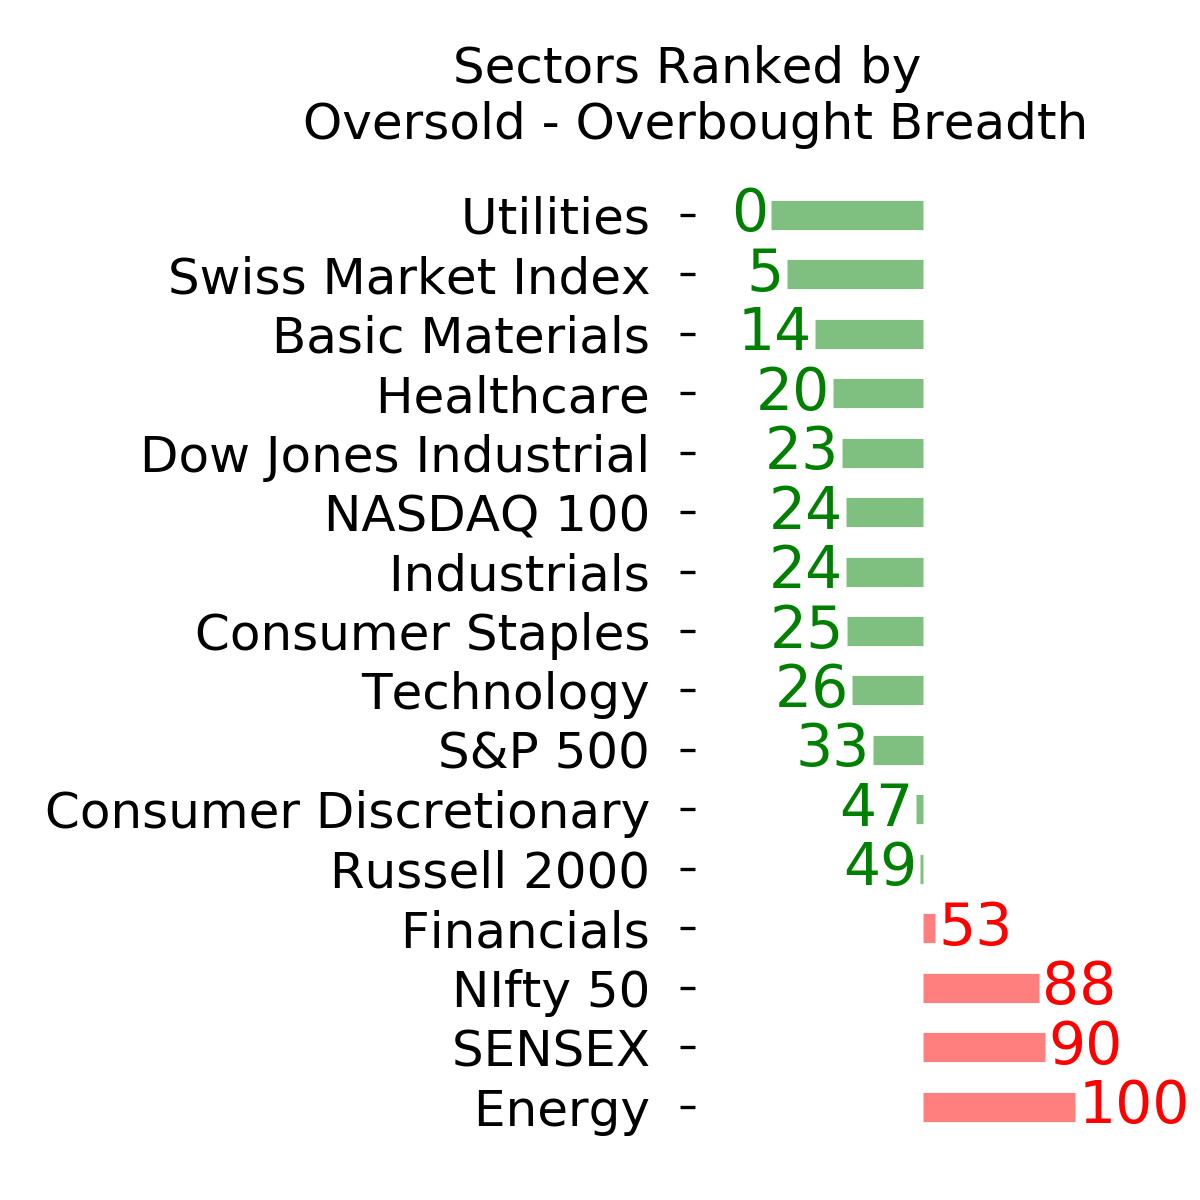
Ranks
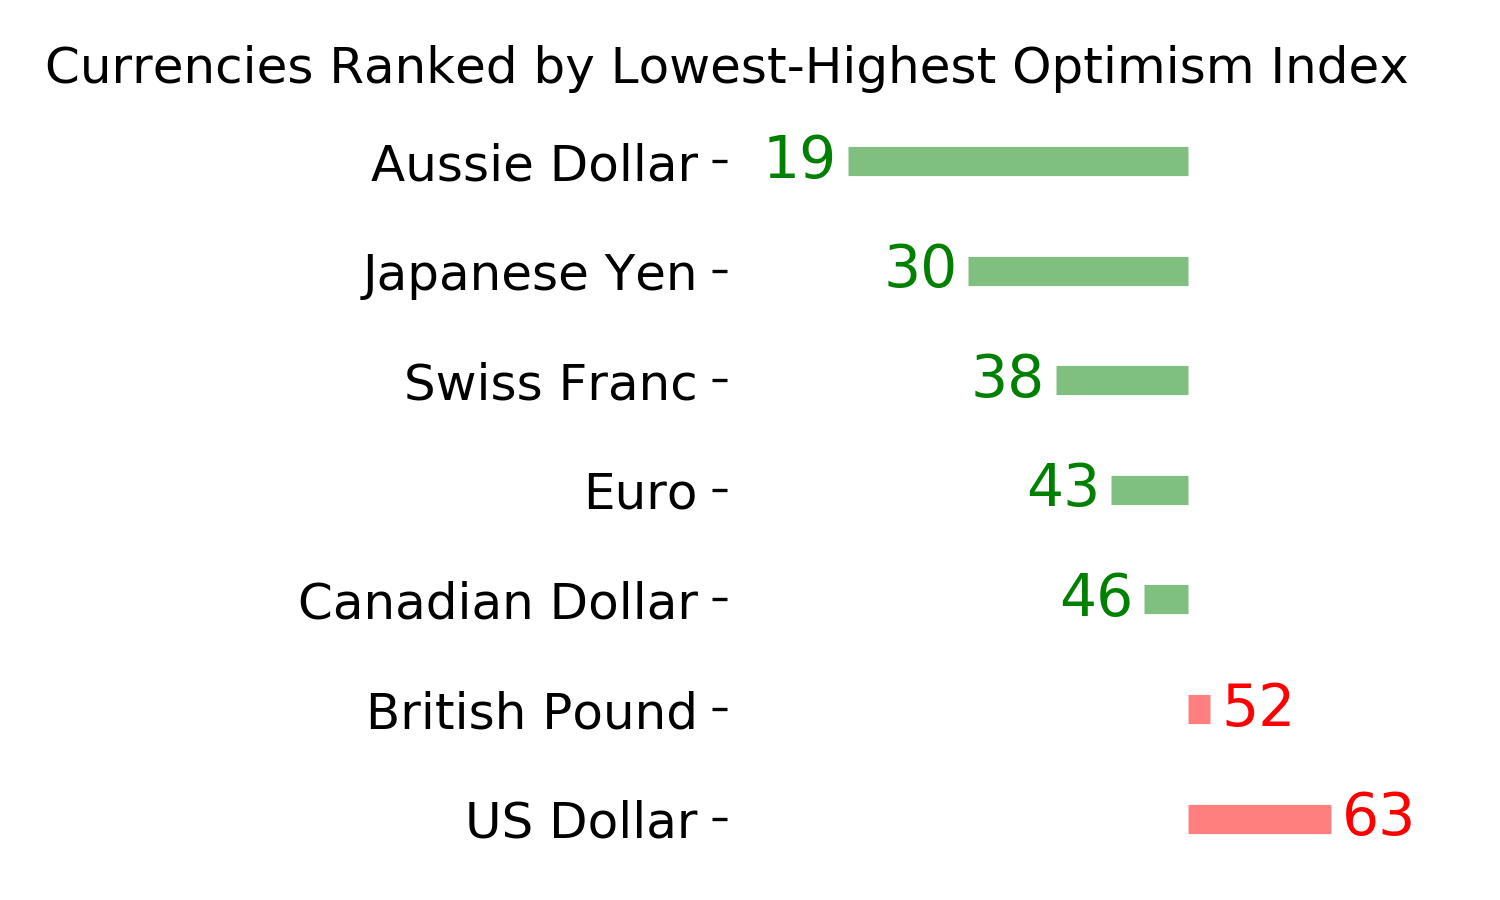
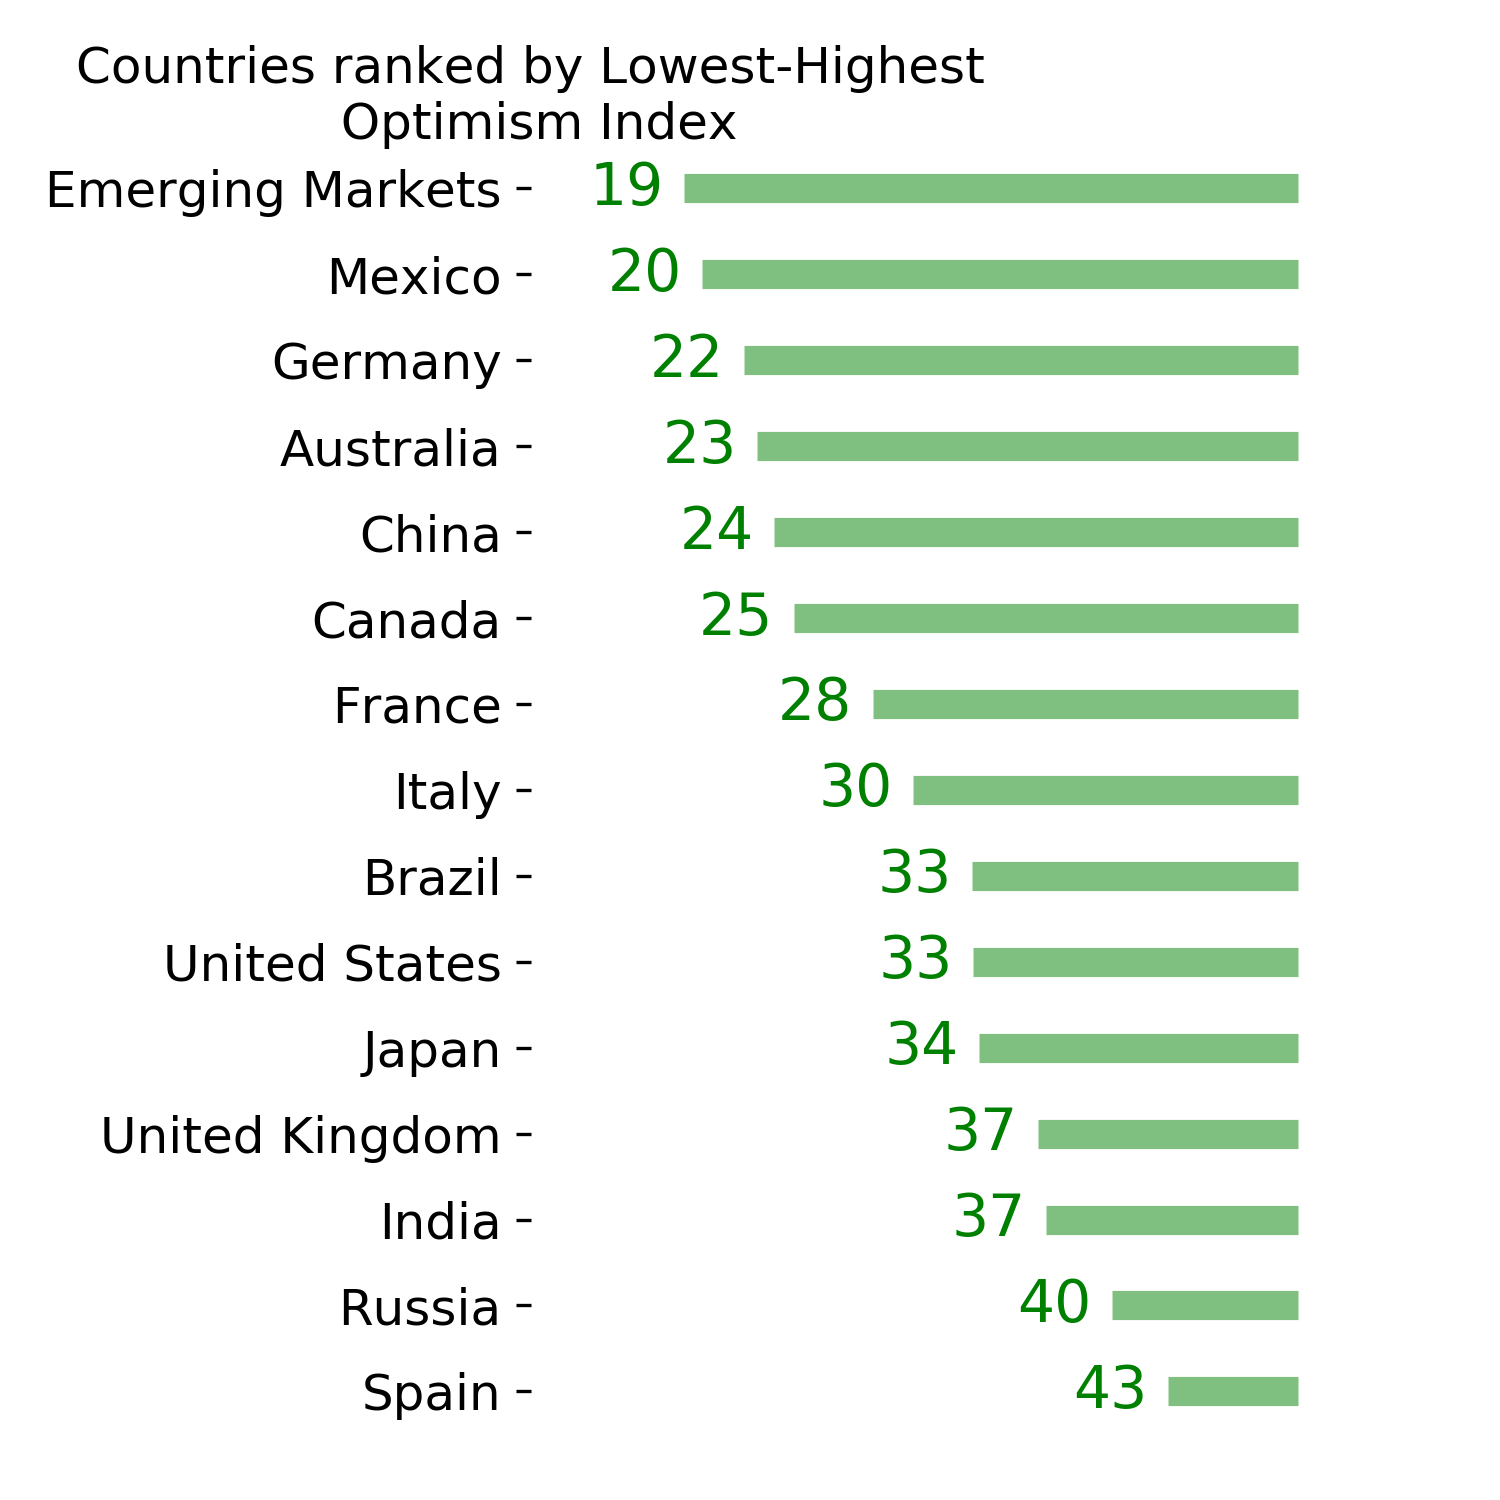
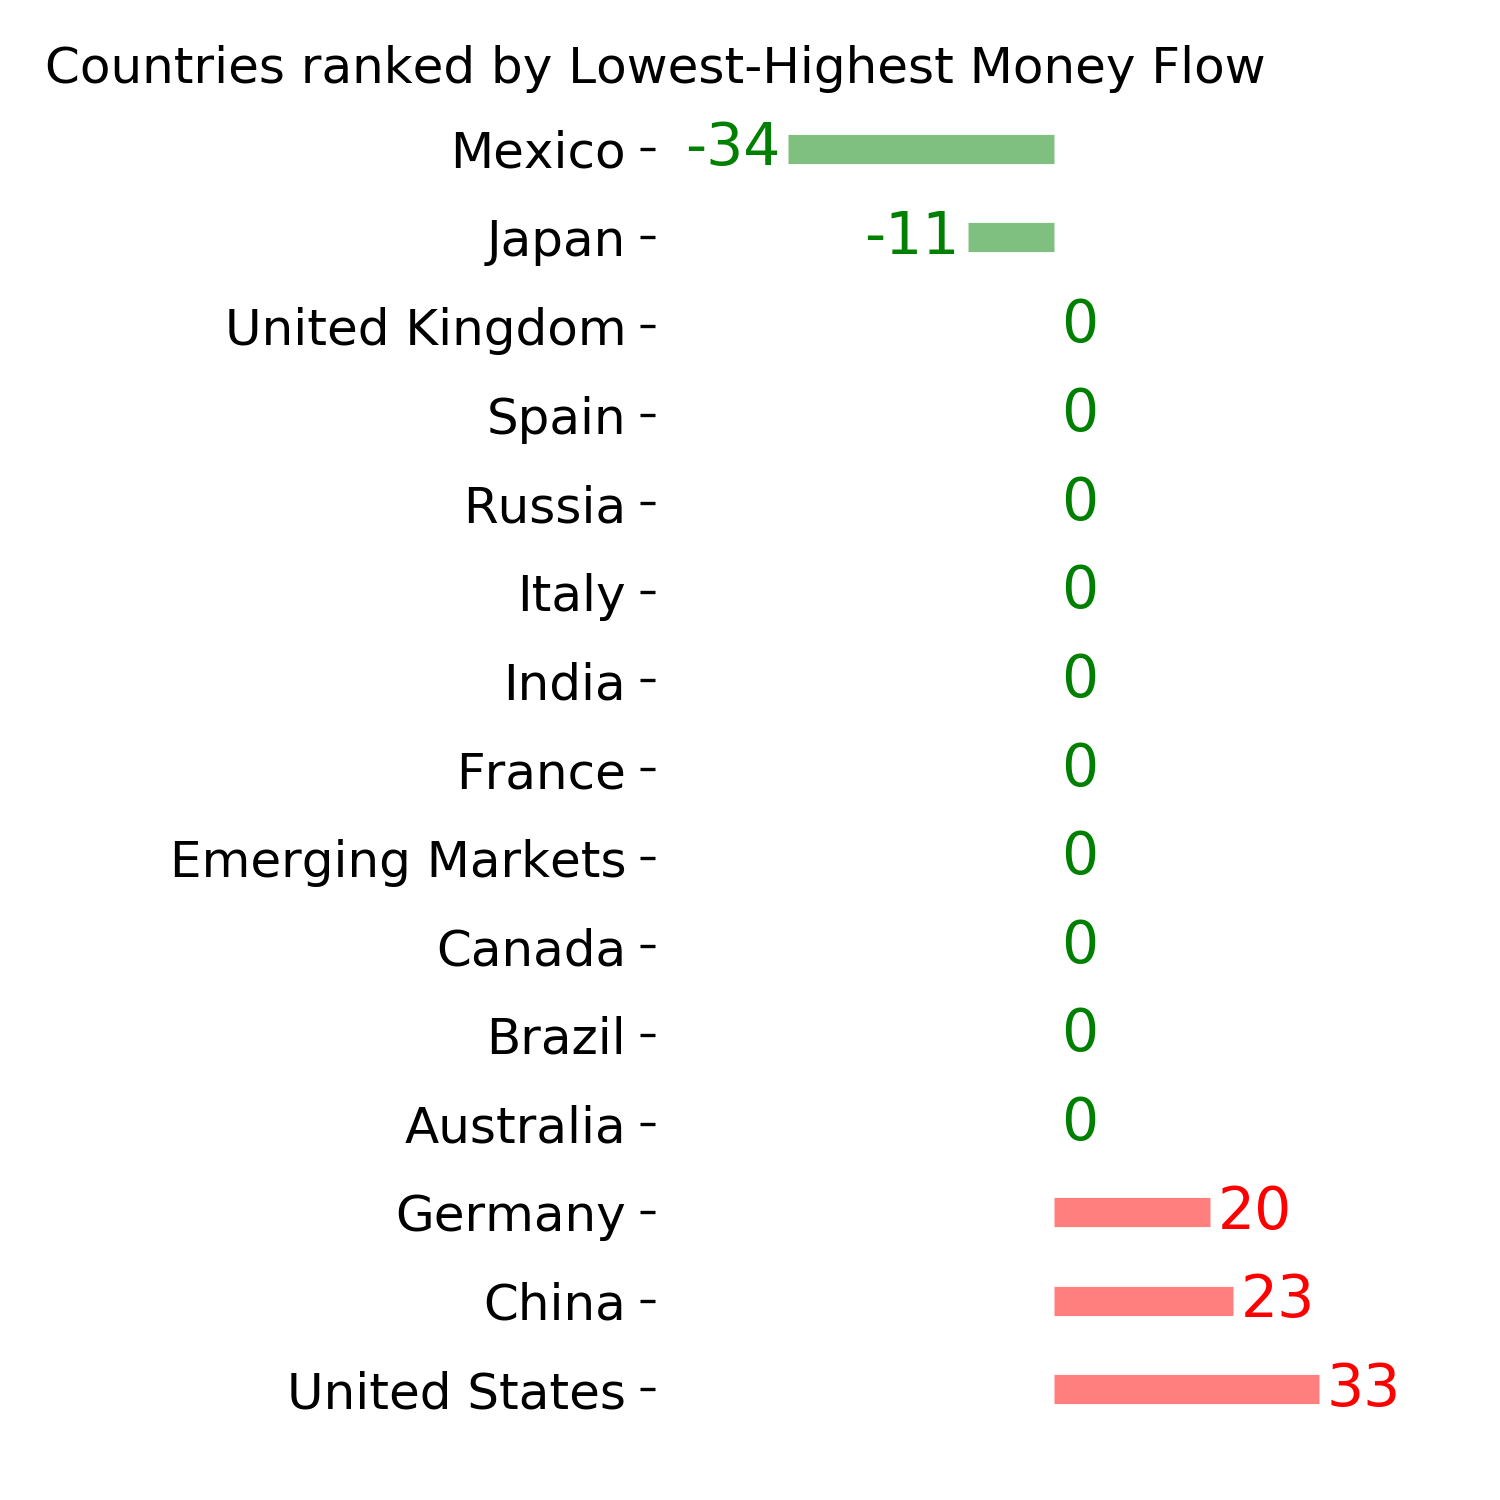
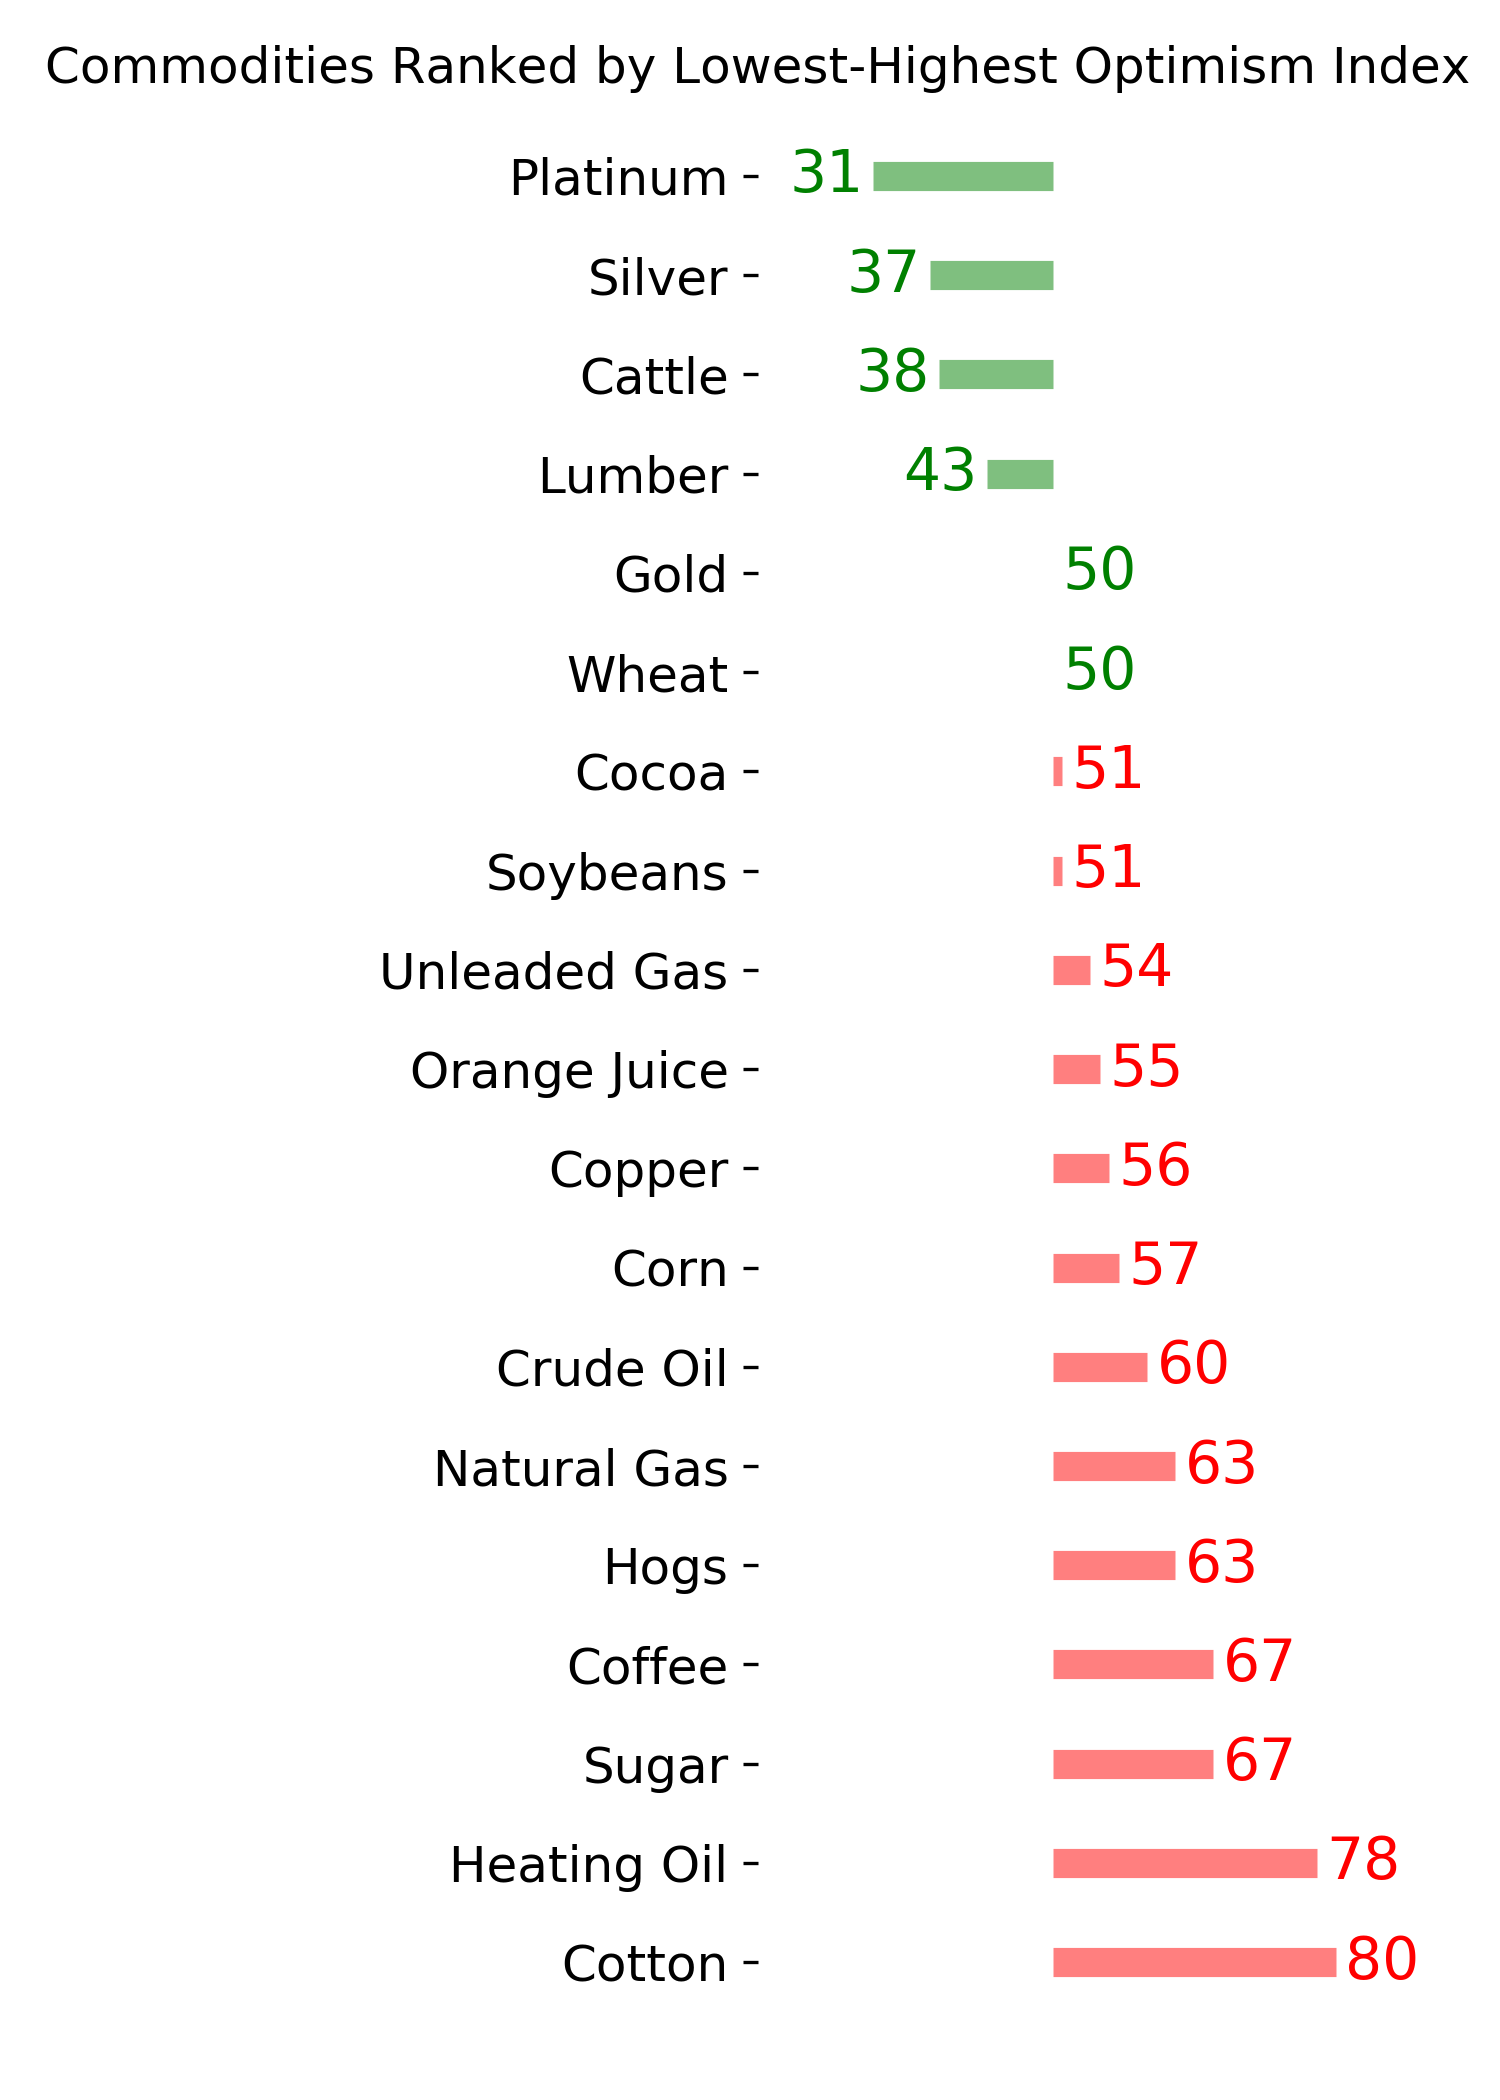
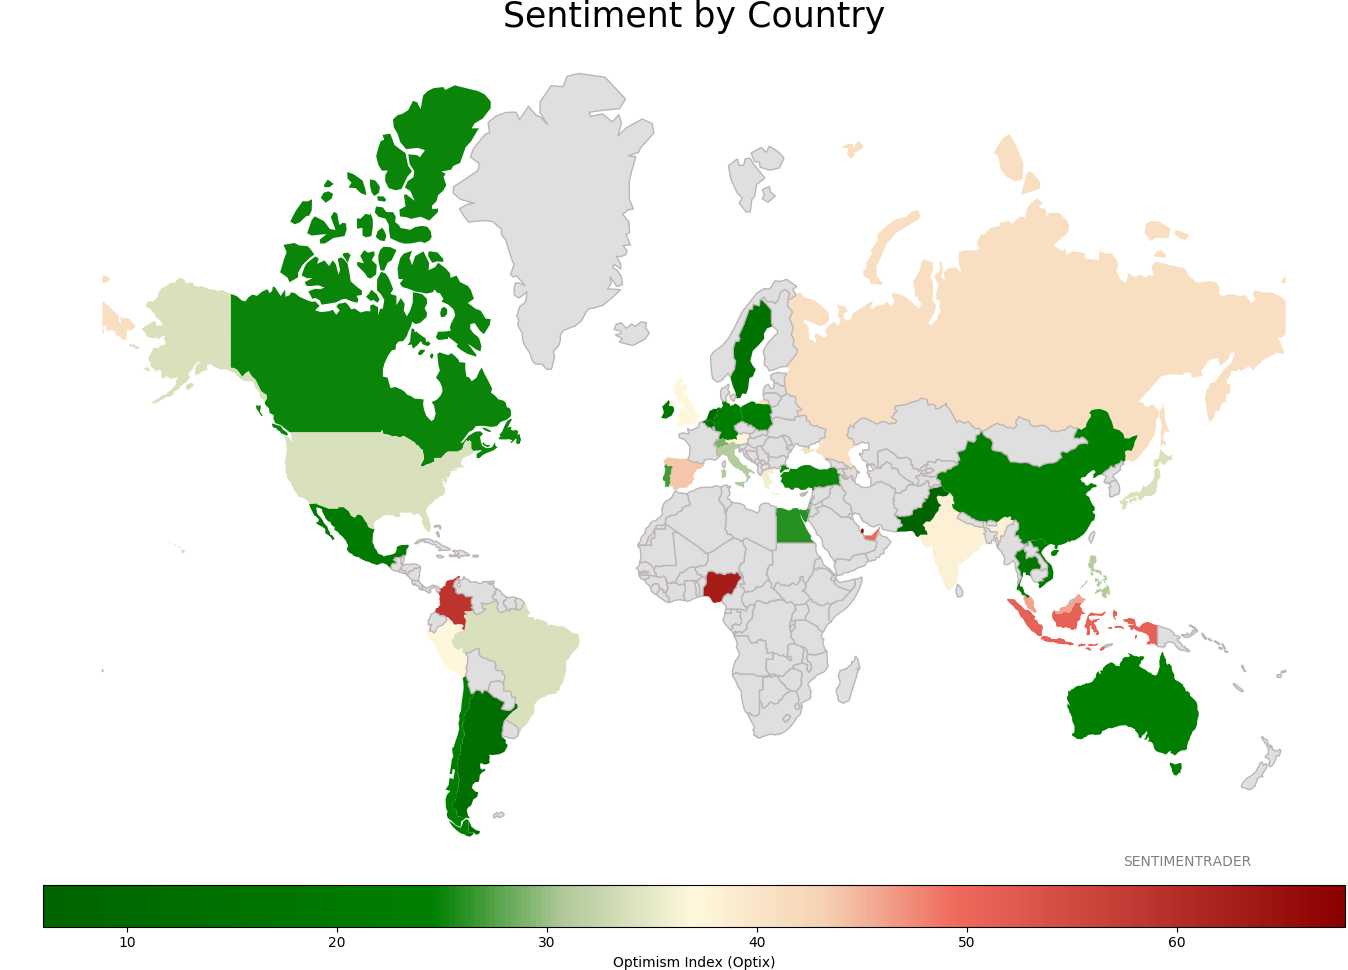
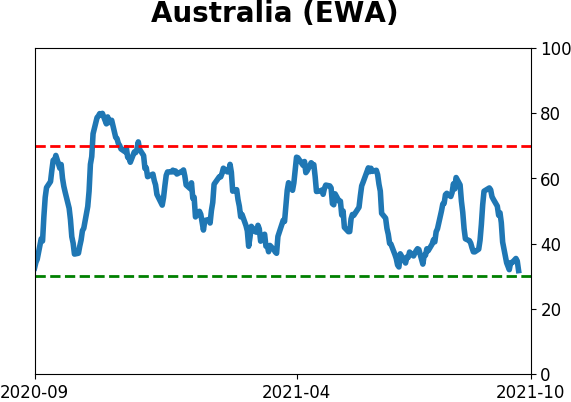
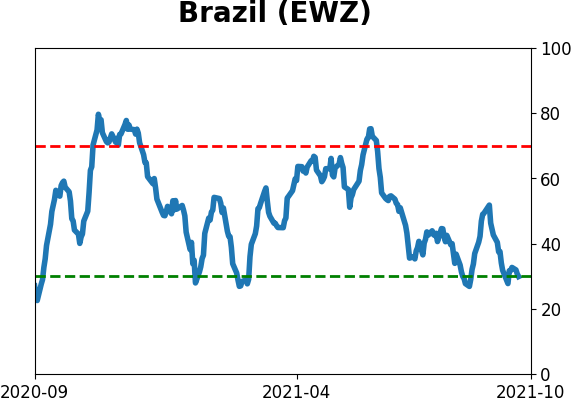
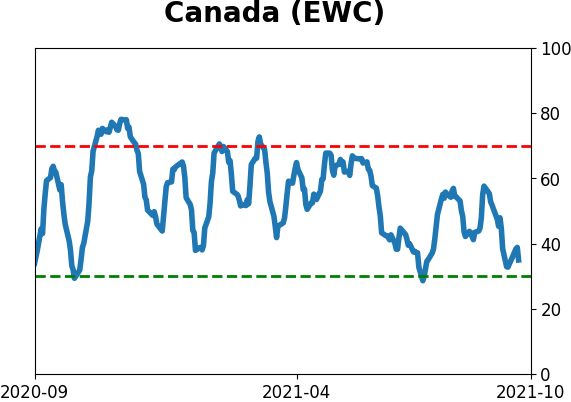
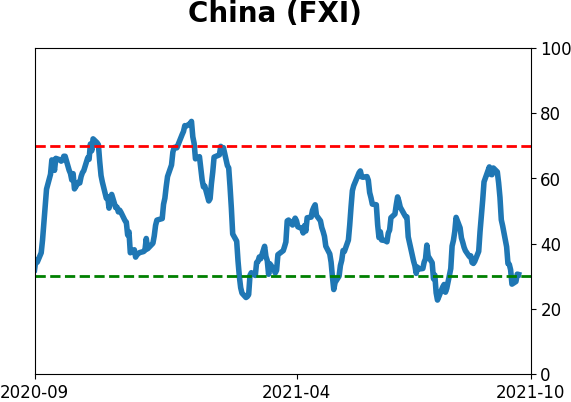
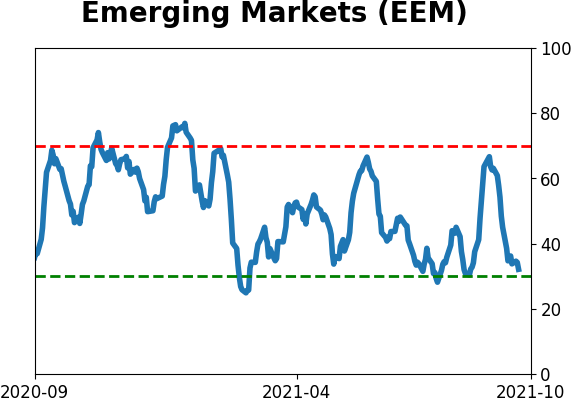
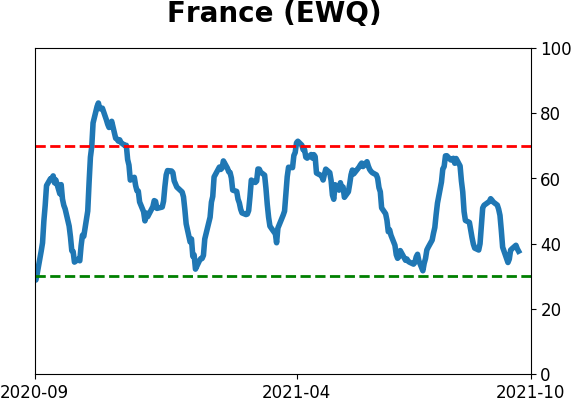
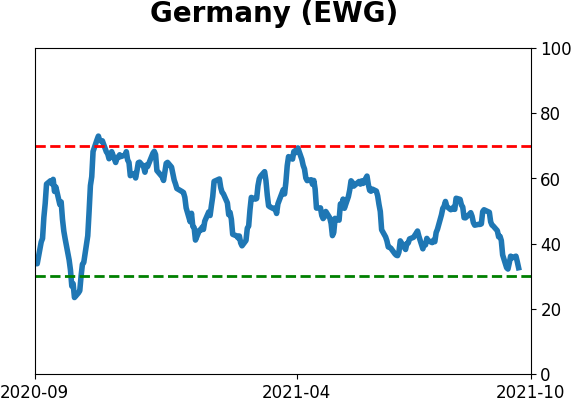
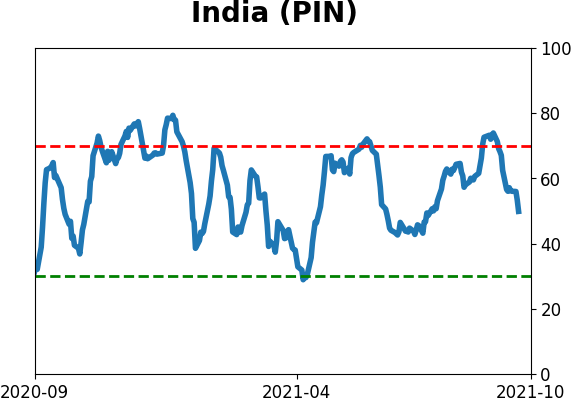
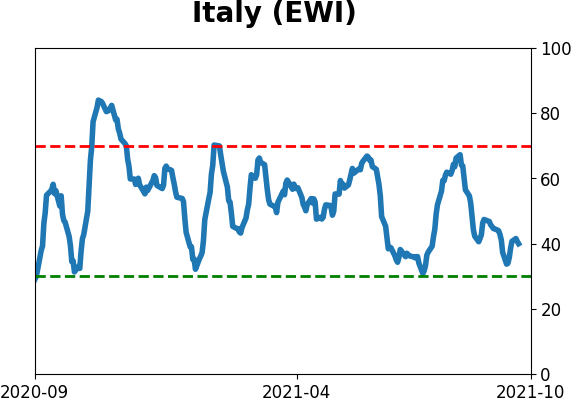
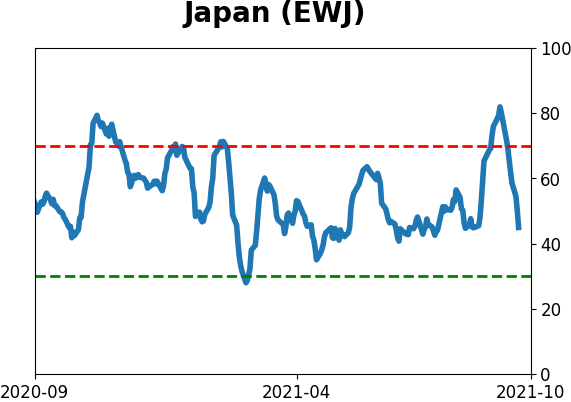
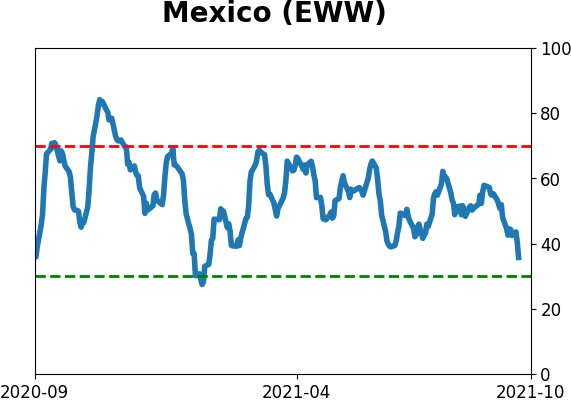
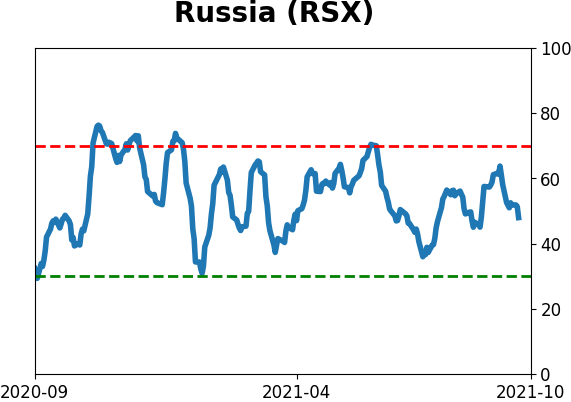
Sentiment Around The World
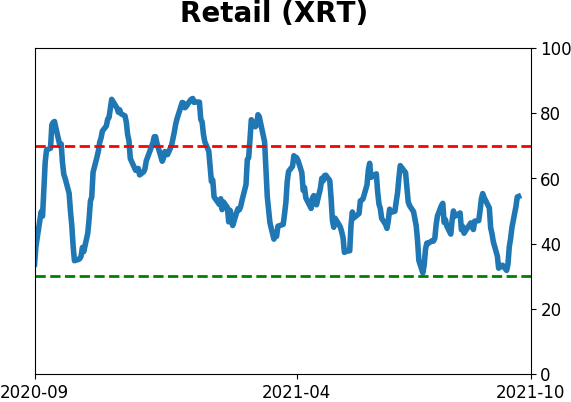
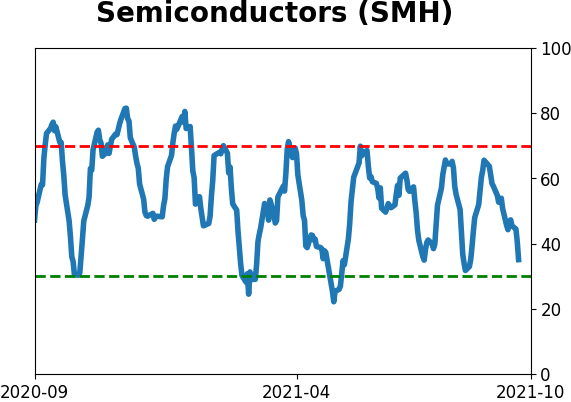
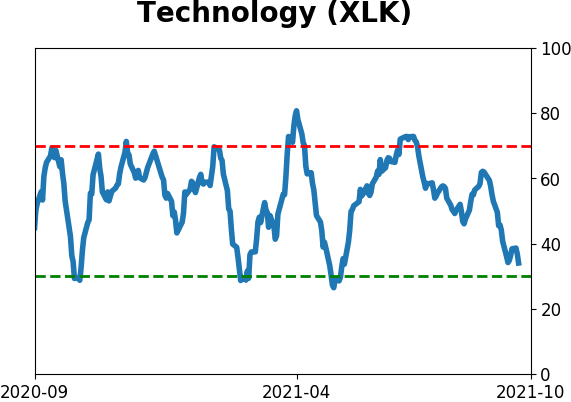
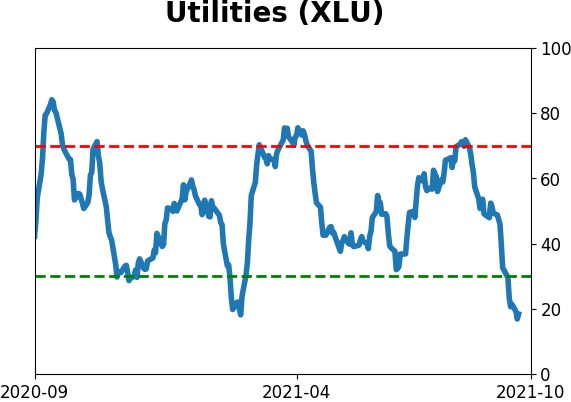
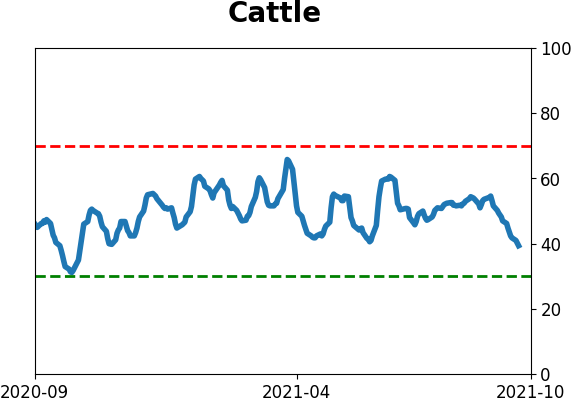
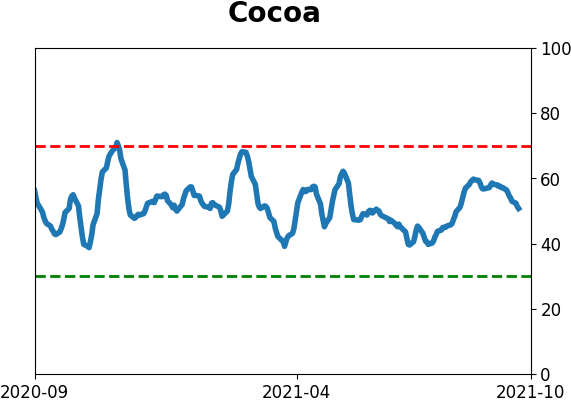
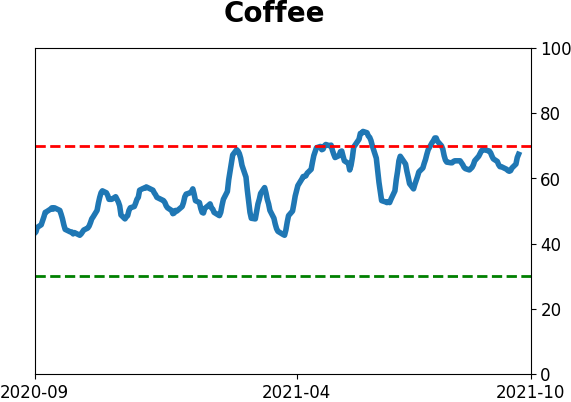
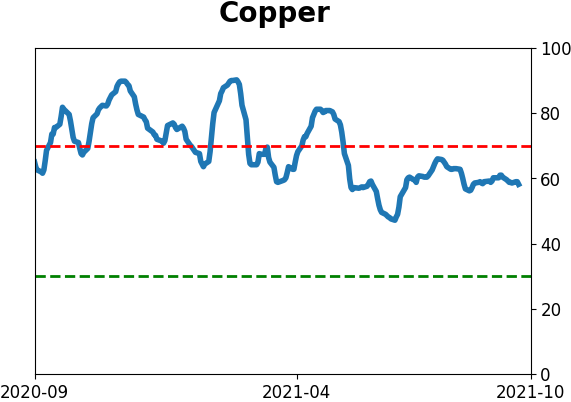
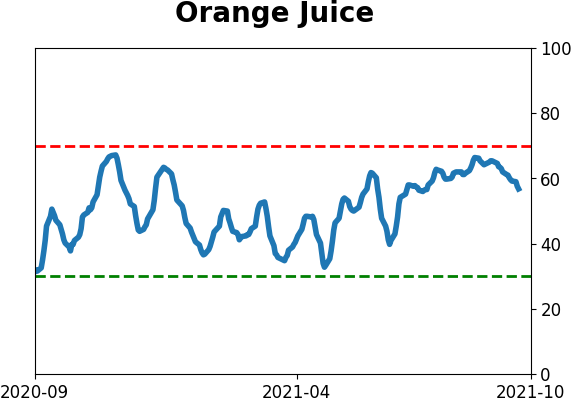
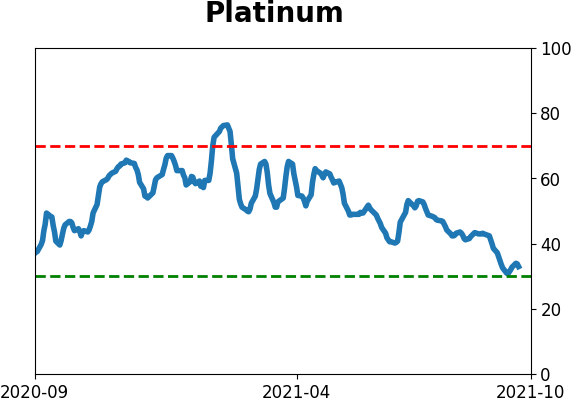
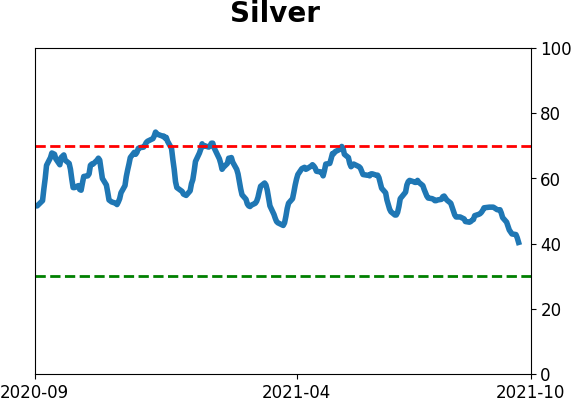
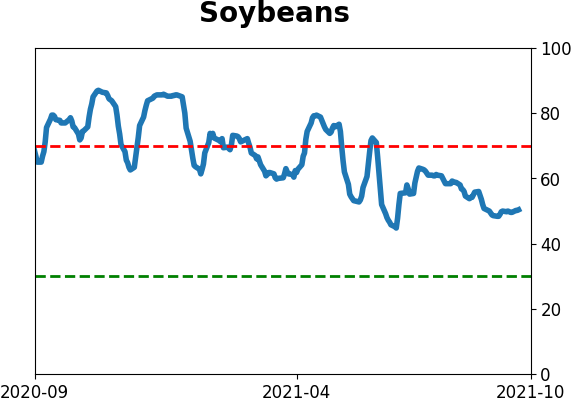
Optimism Index Thumbnails
|
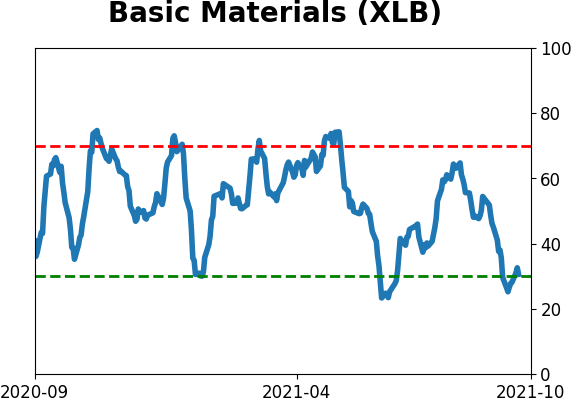
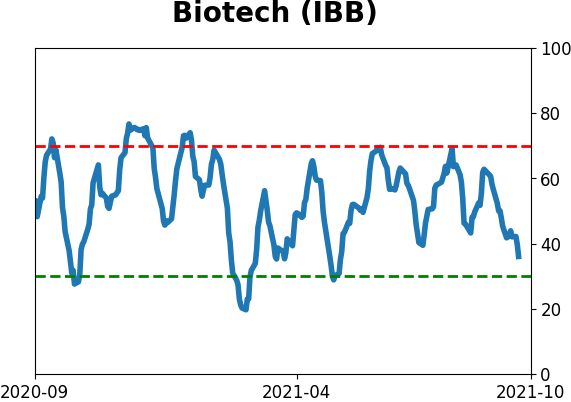
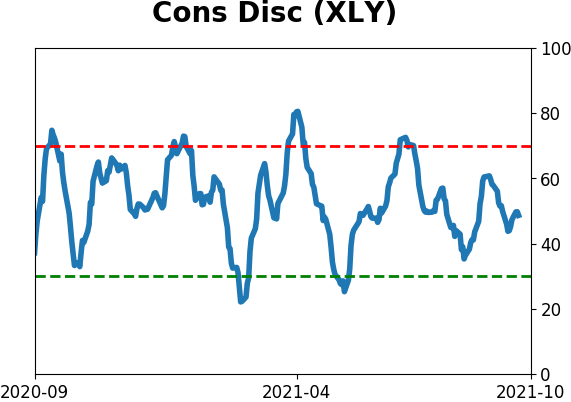
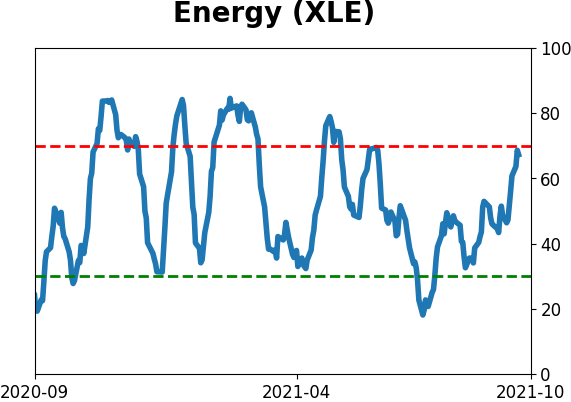
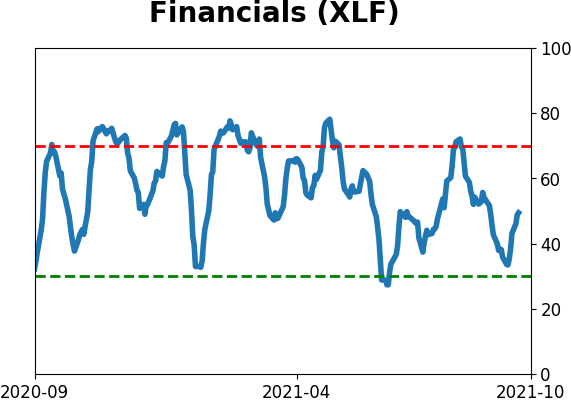
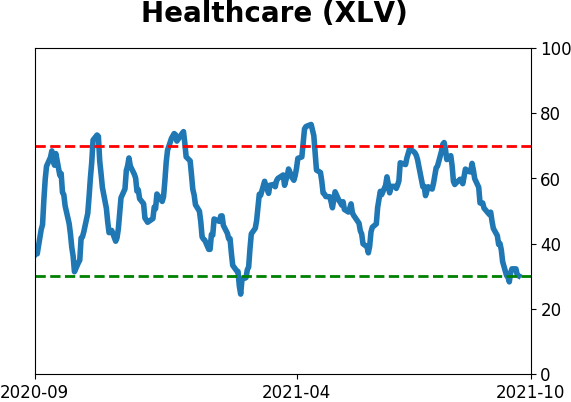
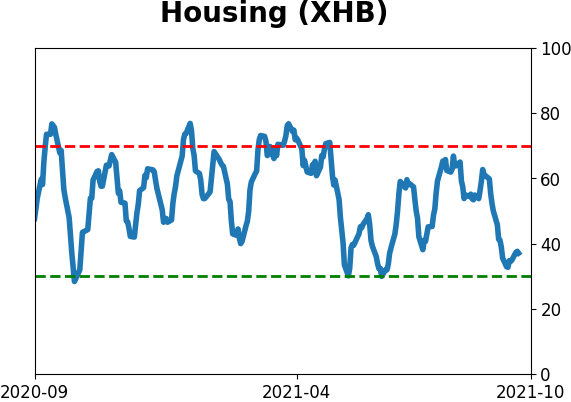
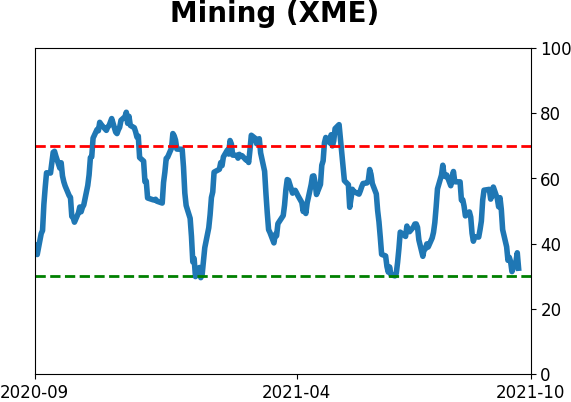
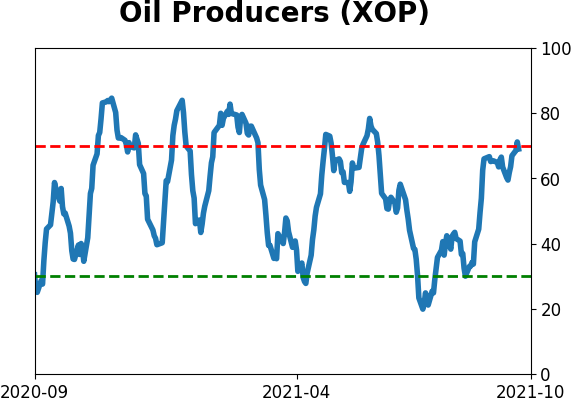
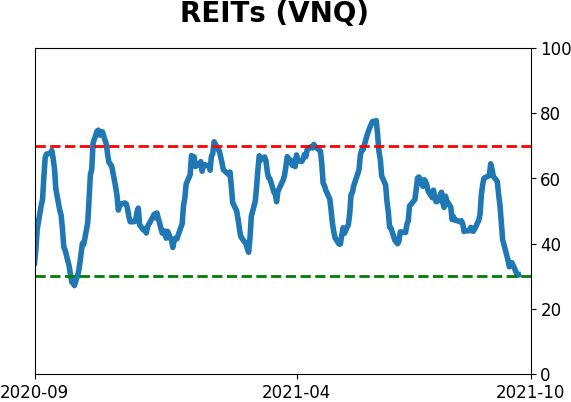
Sector ETF's - 10-Day Moving Average
|
|
|
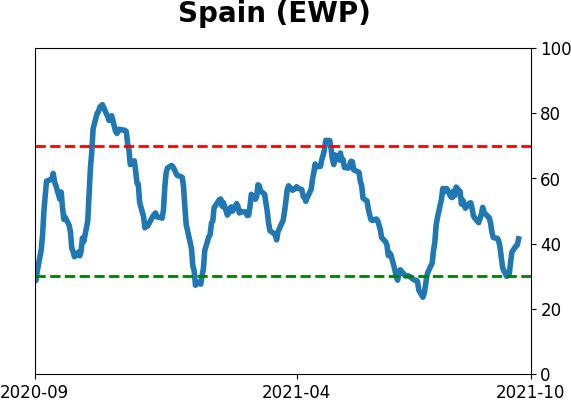
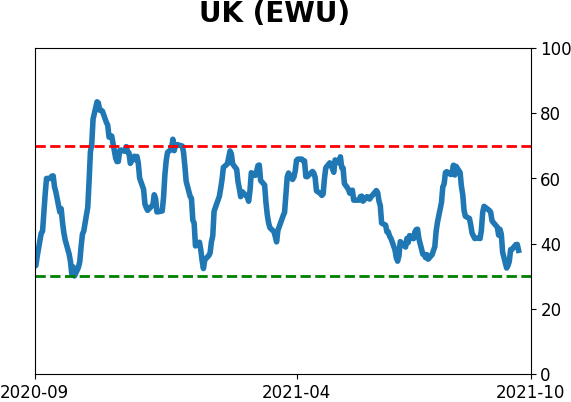
Country ETF's - 10-Day Moving Average
|
|
|
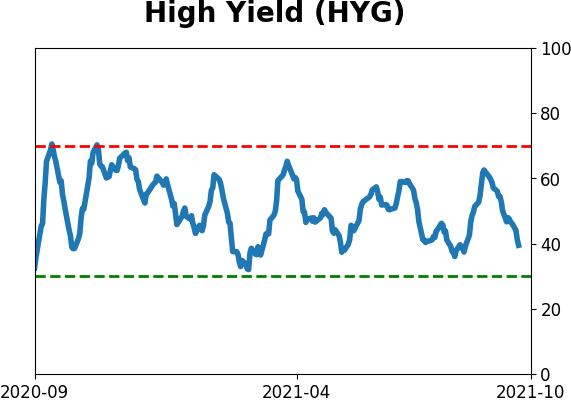
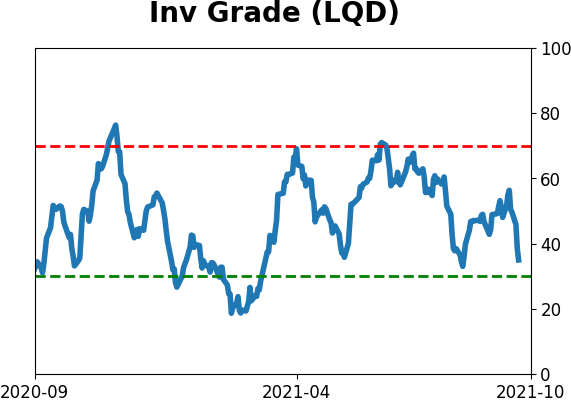
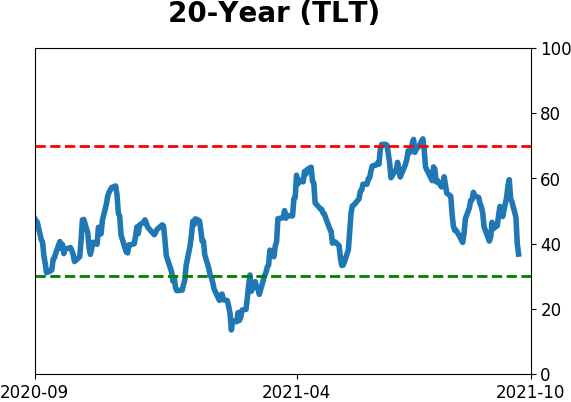
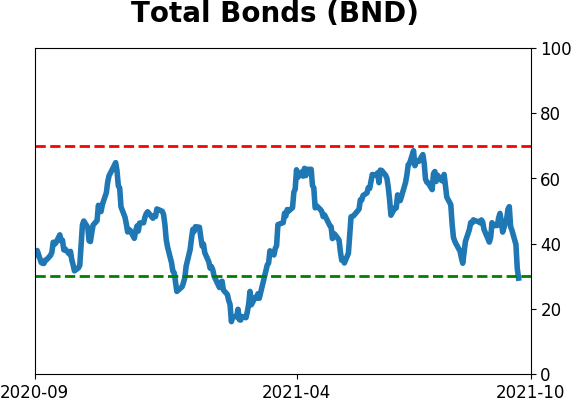
Bond ETF's - 10-Day Moving Average
|
|
|
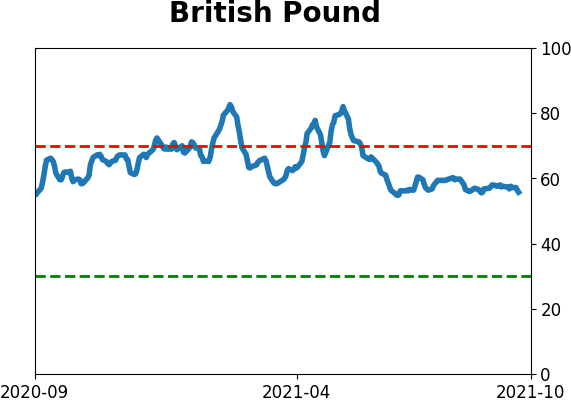
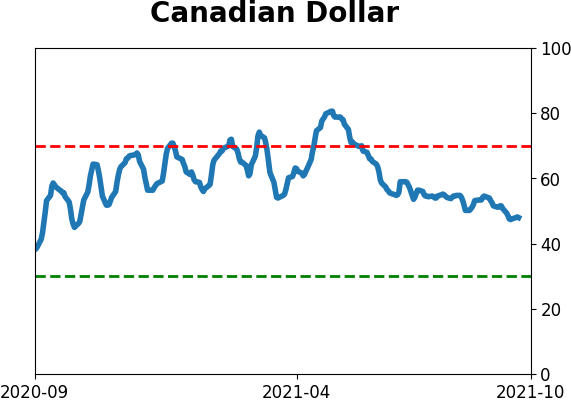
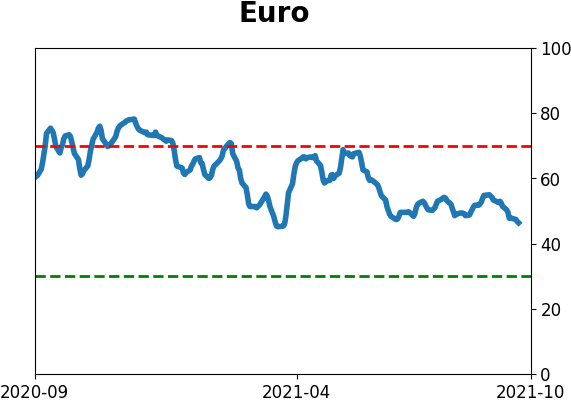
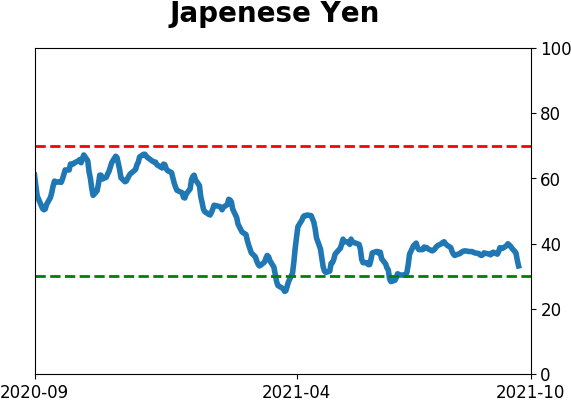
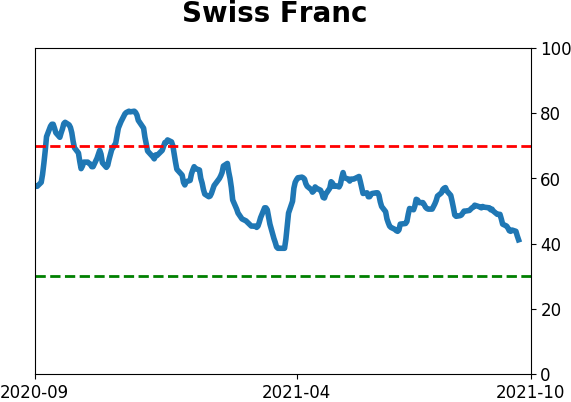
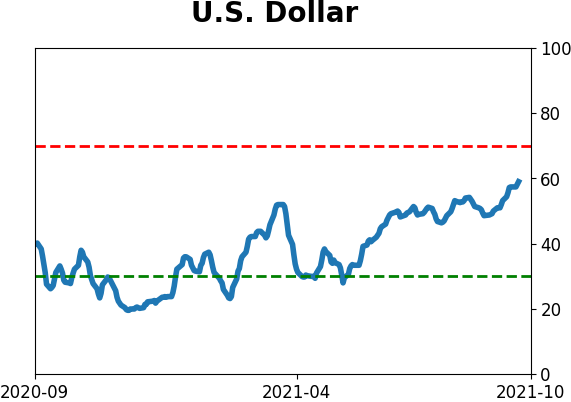
Currency ETF's - 5-Day Moving Average
|
|
|
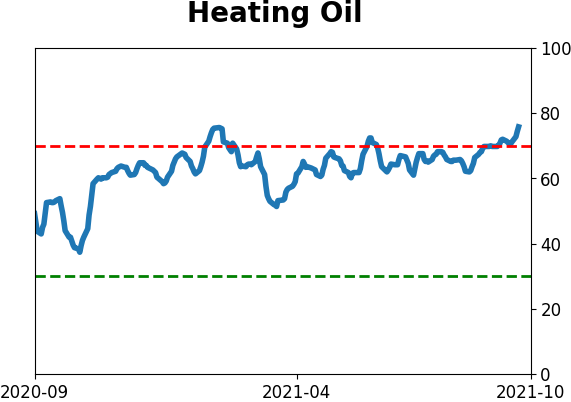
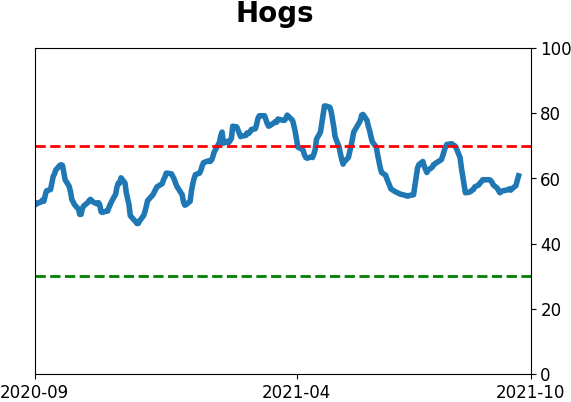
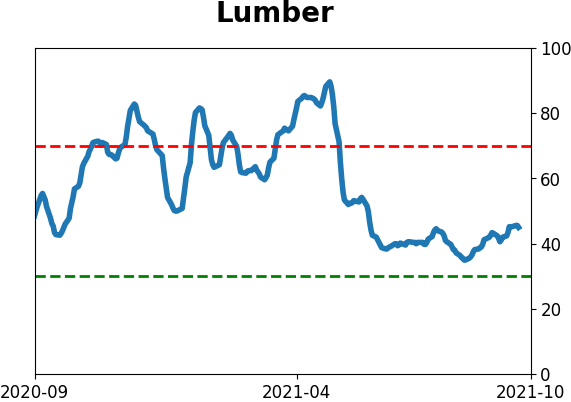
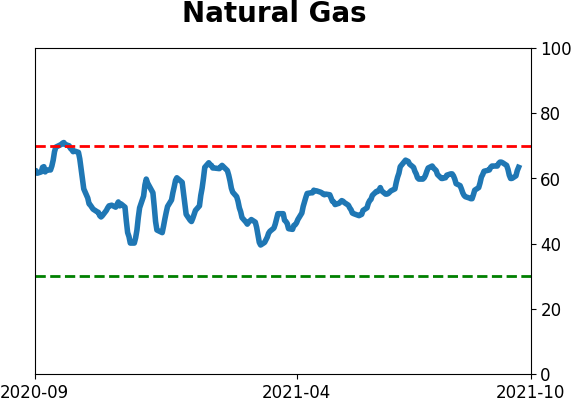
Commodity ETF's - 5-Day Moving Average
|
|