Headlines
|
|
Industrials Are Nearing a Historic Washout, Too:
There has been a lot of internal pressure in the Dow Industrials over the past week. Some of its breadth metrics are triggering severe oversold readings, with a few hitting panic levels. In recent years, that has preceded choppy conditions.
Bottom Line:
STOCKS: Hold
Sentiment continues to decline from the speculative February peak. With deteriorating breadth, this raises the risk of poor short- to medium-term returns until optimism and better breadth returns. See the Outlook & Allocations page for more. BONDS: Hold
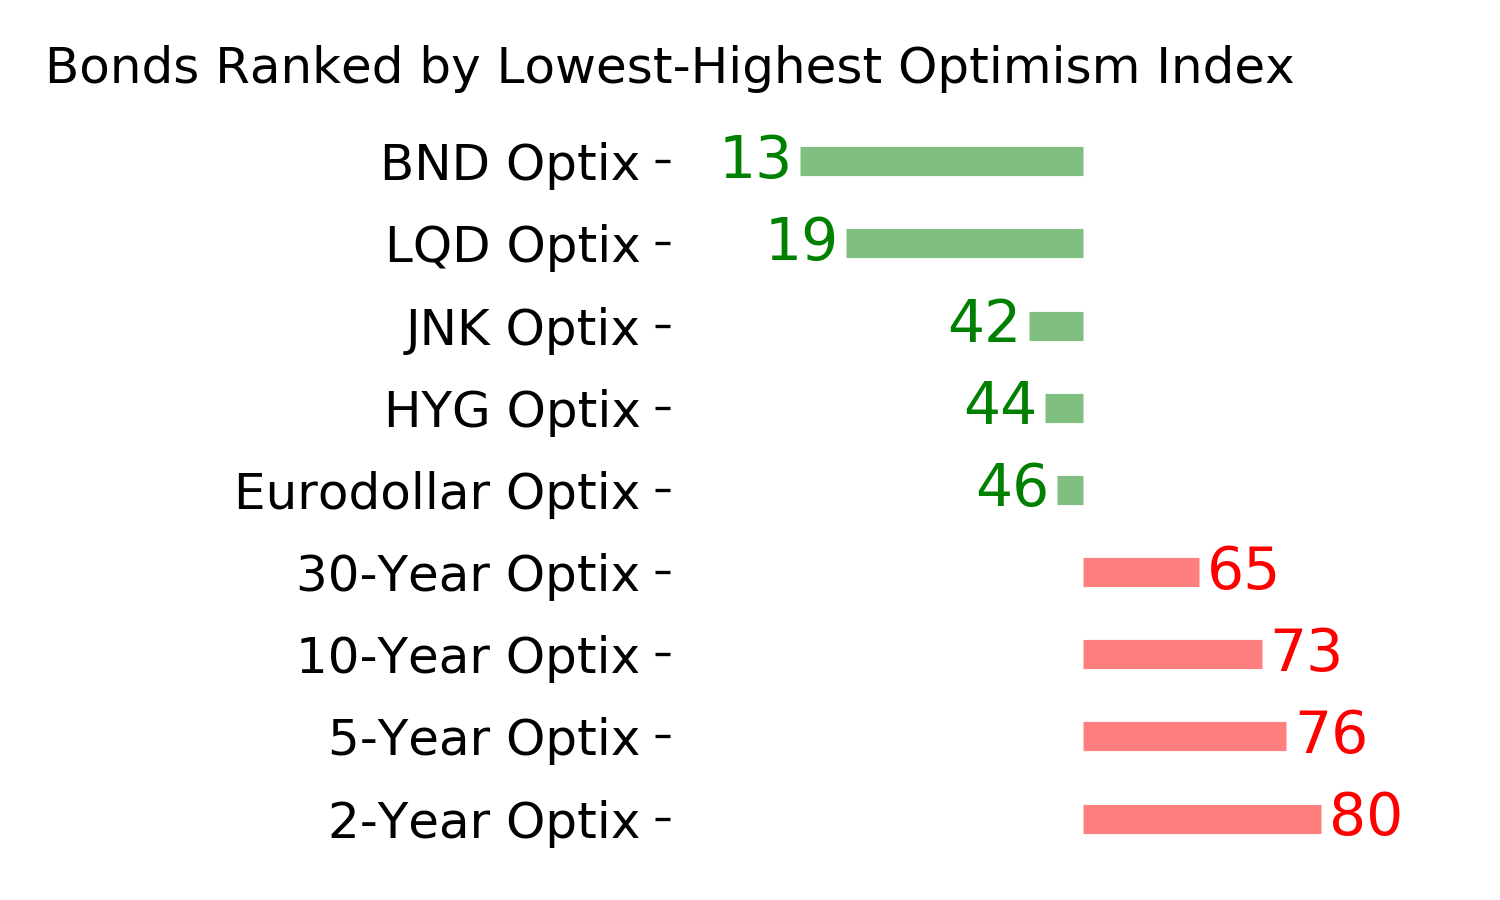
Various parts of the market got hit in March, with the lowest Bond Optimism Index we usually see during healthy environments. Bond prices have modest recovered and there is no edge among the data we follow. GOLD: Hold
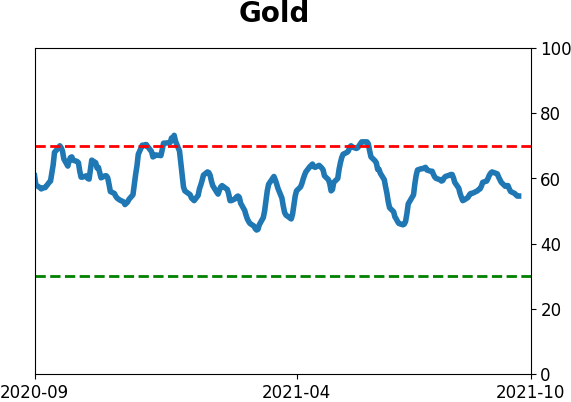
Gold and miners were rejected after trying to recover above their 200-day averages in May. Lately, some medium-term (not long-term) oversold extremes in breadth measures among miners have triggered.
|
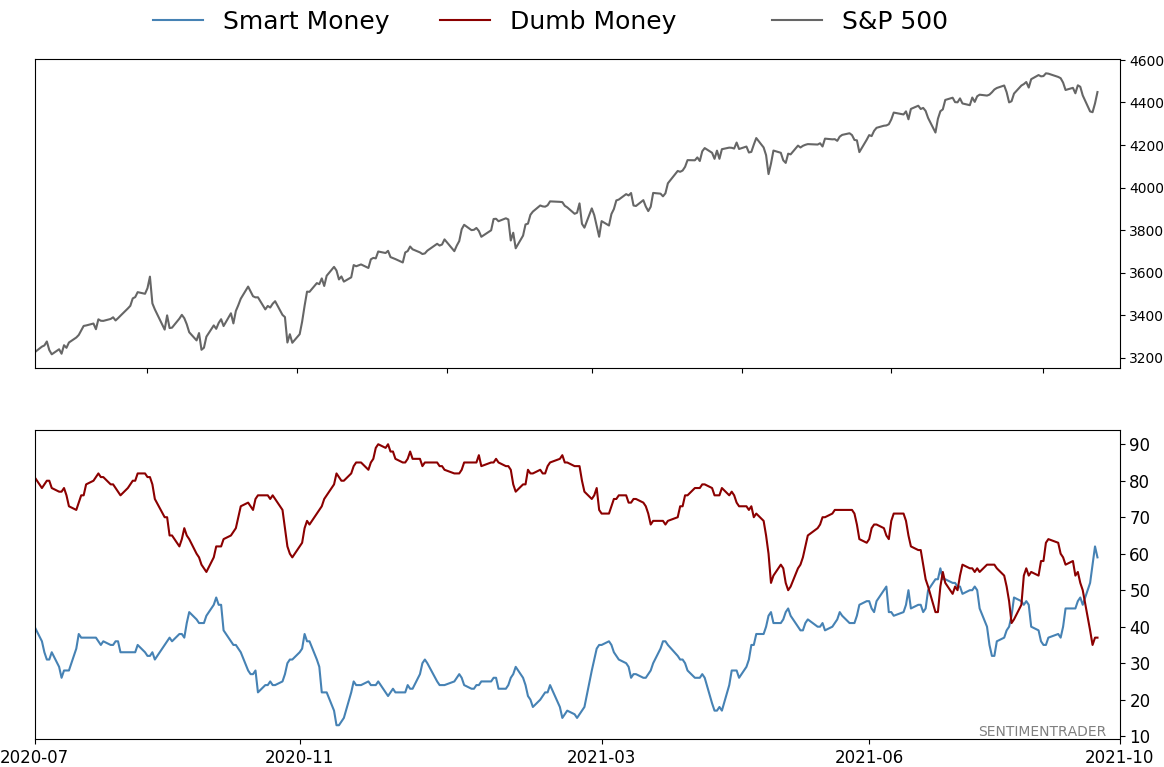
Smart / Dumb Money Confidence
|
Smart Money Confidence: 59%
Dumb Money Confidence: 37%
|
|
Risk Levels
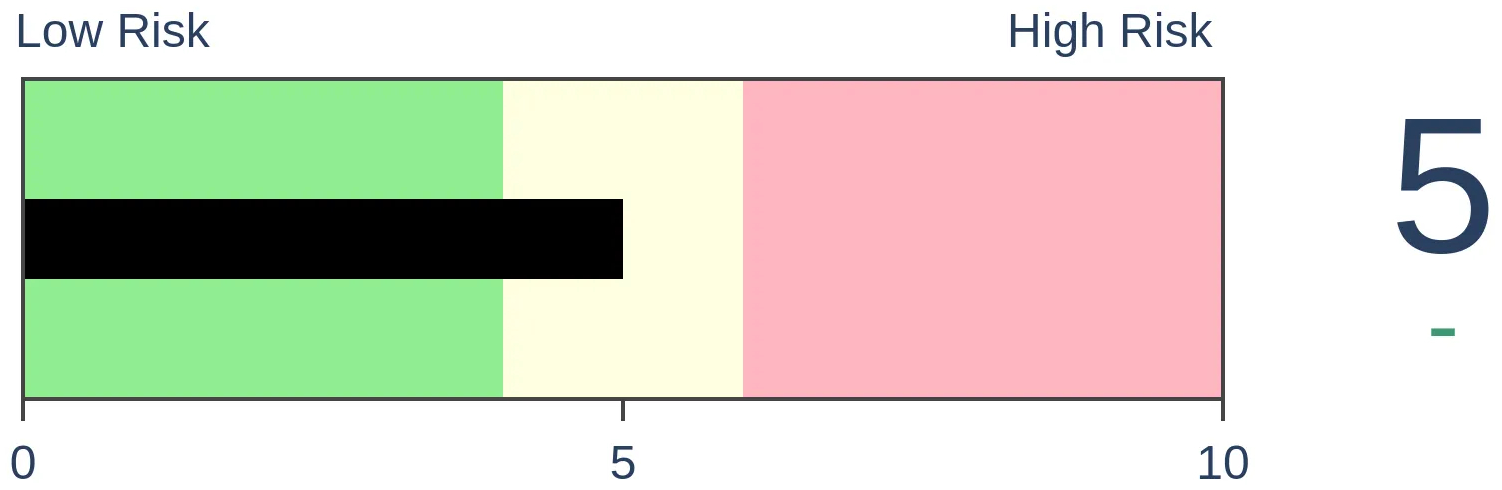
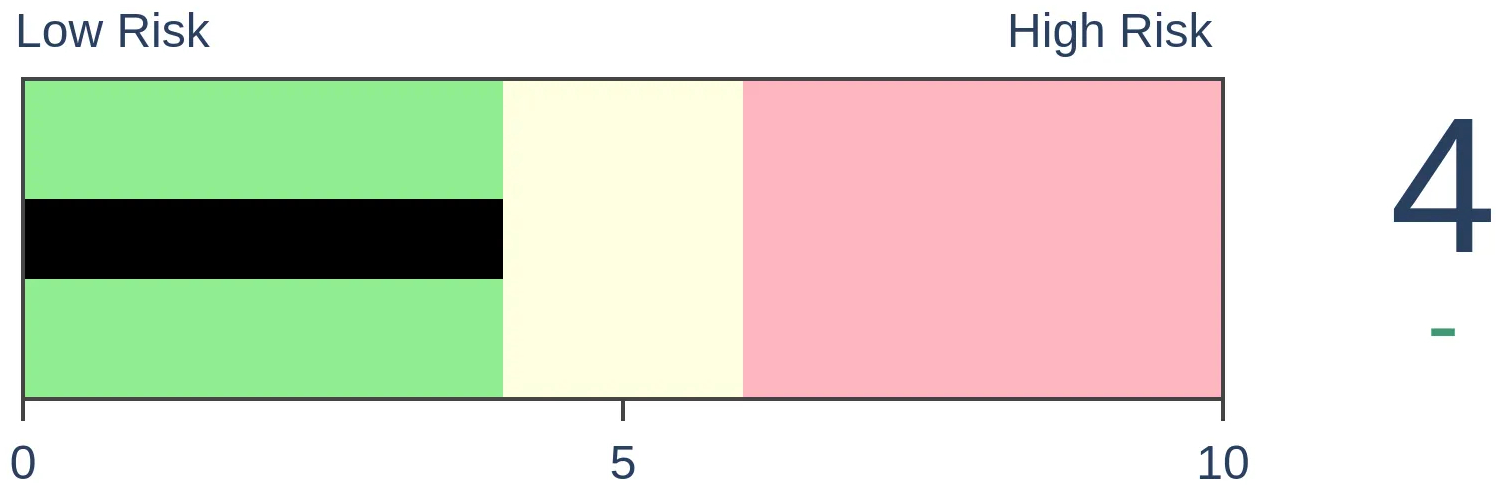
Stocks Short-Term
|
Stocks Medium-Term

|
|
Bonds
|
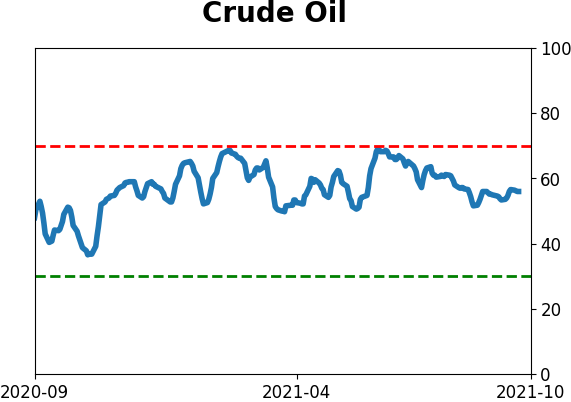
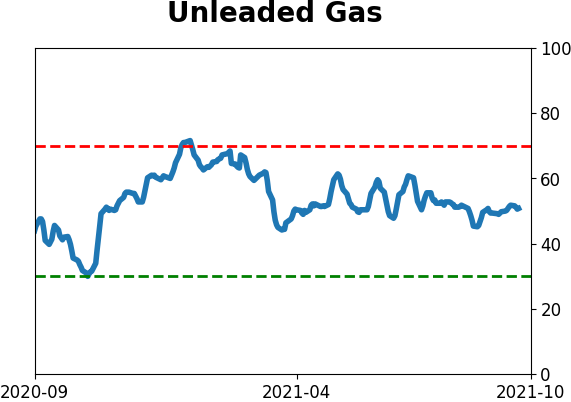
Crude Oil

|
|
Gold

|
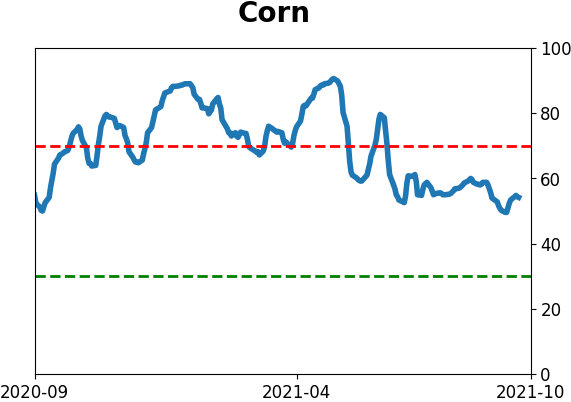
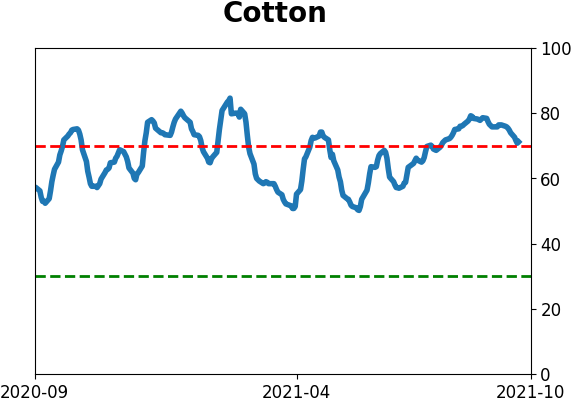
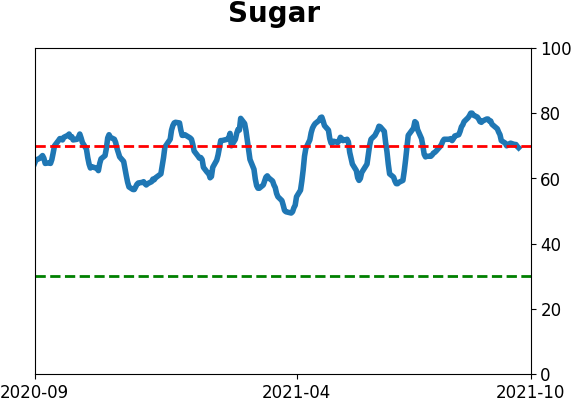
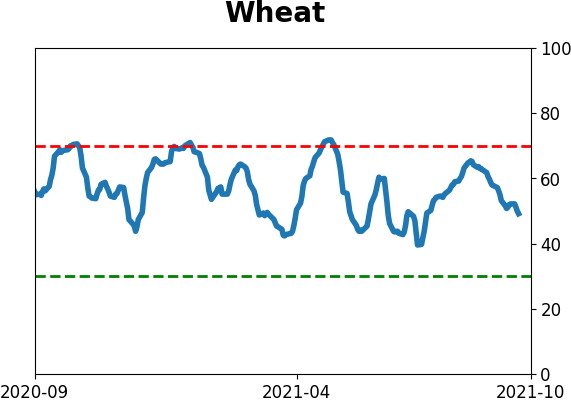
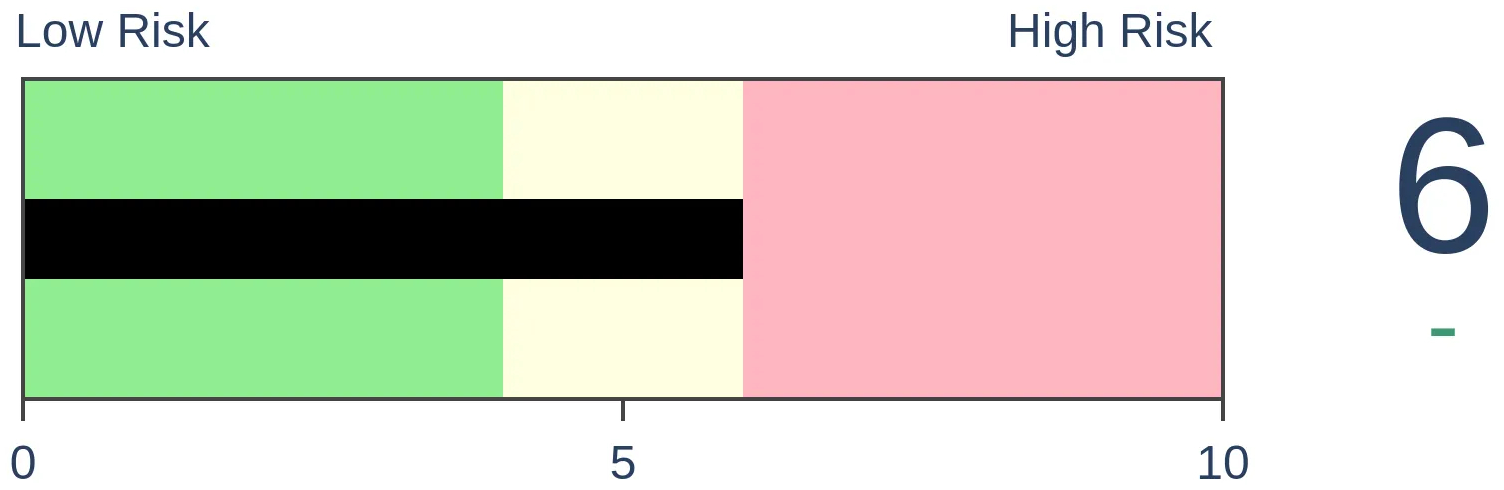
Agriculture
|
|
Research
By Jason Goepfert
BOTTOM LINE
There has been a lot of internal pressure in the Dow Industrials over the past week. Some of its breadth metrics are triggering severe oversold readings, with a few hitting panic levels. In recent years, that has preceded choppy conditions.
FORECAST / TIMEFRAME
None
|
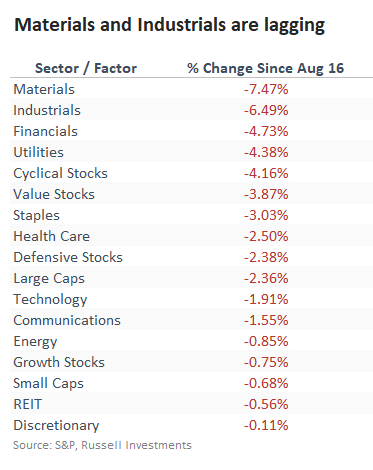
Industrial stocks have had a tough month. Out of the S&P 500's major sectors, Industrials are lagging near the bottom since mid-August in total return. Only Materials stocks have suffered more, and both sectors have lost quite a bit more than even the other laggards.
BREADTH HAS HIT MAKE-OR-BREAK LEVELS
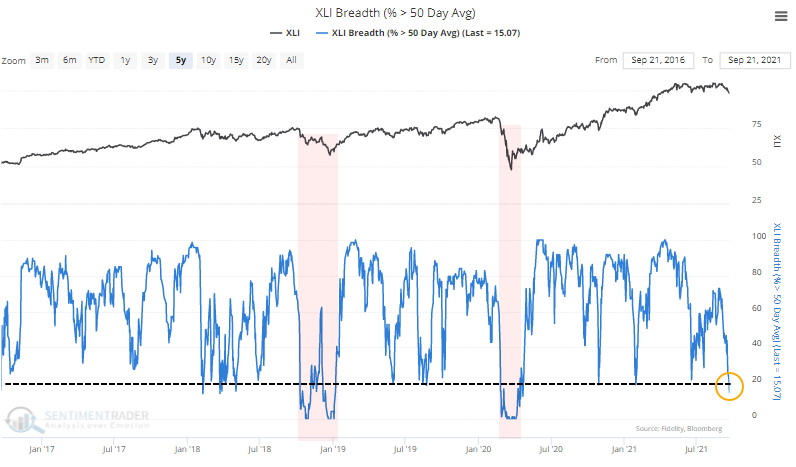
The selling pressure is getting extreme. The percentage of Industrial stocks holding above their 50-day moving averages has plunged below 20%. Other forays toward that threshold preceded bounces...except when it didn't. The two times when Industrials did not bounce after hitting this threshold, it ushered in weeks or months more of selling.
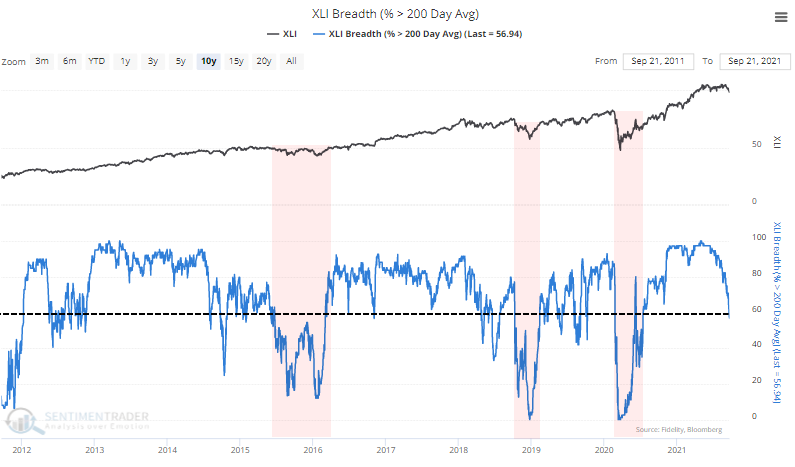
Longer-term trends are suffering, too. Fewer than 60% of Industrials closed above their 200-day moving averages earlier this week. As we've referenced in the past, healthy markets (and sectors) typically hold above that threshold. It might quickly drop below 60% during uptrends, but it's usually a spike pattern that quickly recovers. When it doesn't, beware.
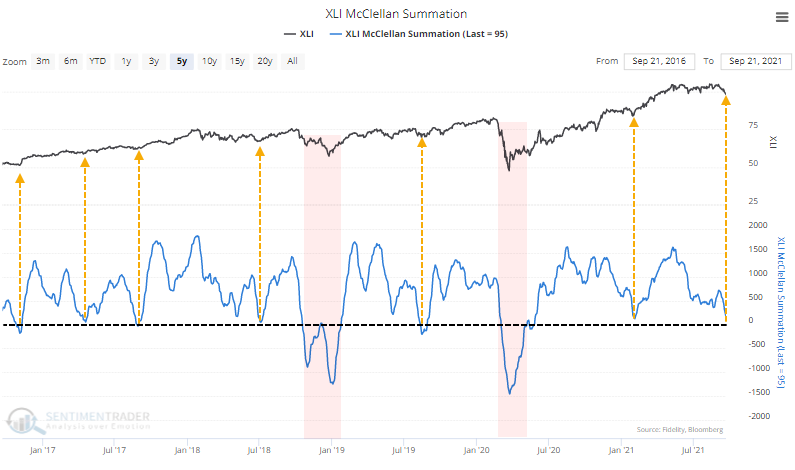
This longer-term selling pressure has pushed the McClellan Summation Index for Industrials close to zero. Over the past five years, this has been a good buying opportunity...again, except when it wasn't. When the Summation Index sliced through zero and kept moving, it highlighted harsh environments for buyers until the indicator fell to -1000 and started to curl higher.
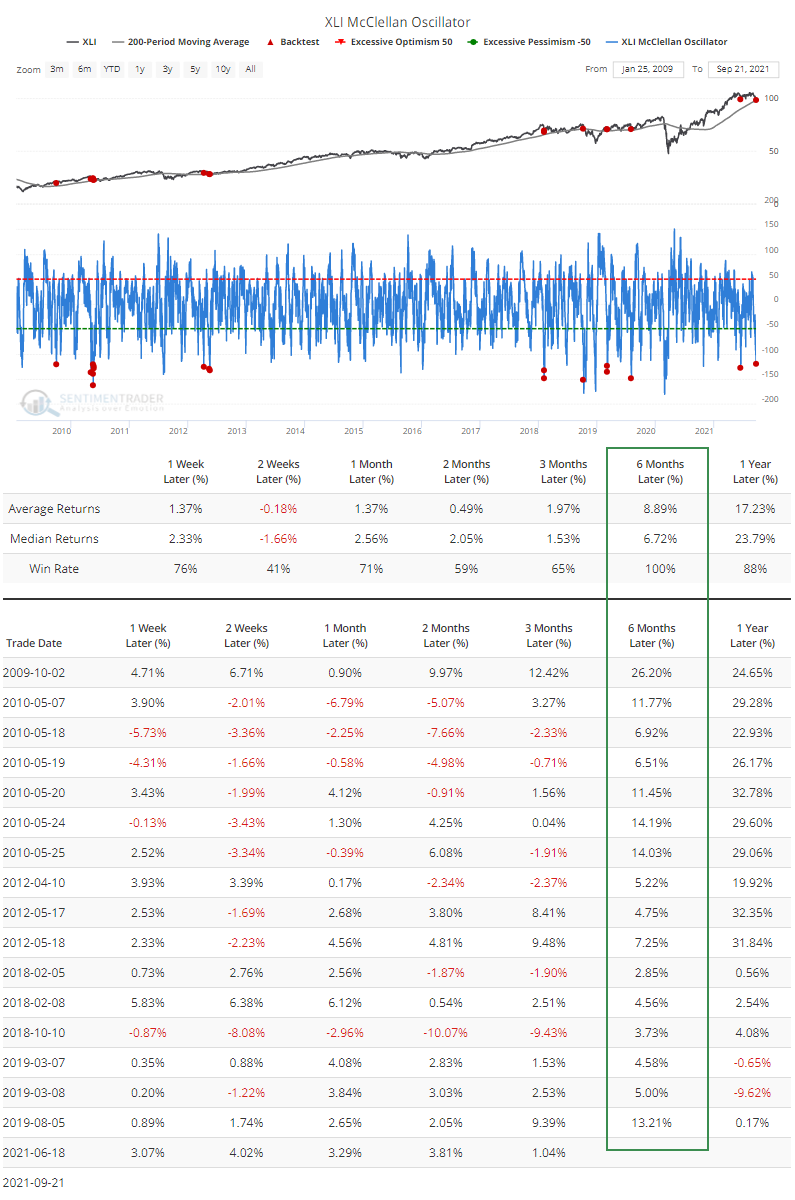
Pressure on the Summation Index is due to the shorter-term McClellan Oscillator plunging to -120. According to the Backtest Engine, a reading this low is truly extreme when the XLI fund was still above a rising 200-day moving average. The others preceded a choppy couple of weeks, but each of them worked higher over the next six months (a roaring bull market as a background doesn't hurt).
IN AGGREGATE, SOME PANIC
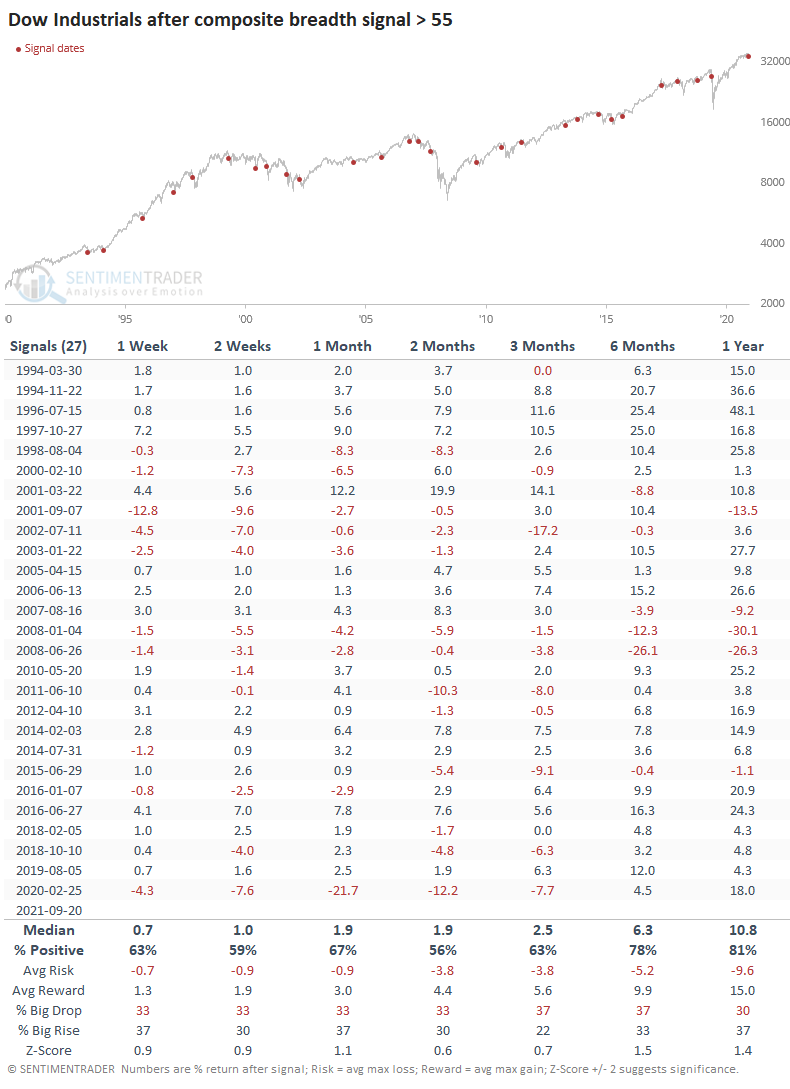
Like we did with the Hang Seng, a panic breadth composite has spiked into extreme territory and just crossed above 55%. We're working on adding a composite similar to this for each of the indexes and sectors we cover to the daily updates on the site.
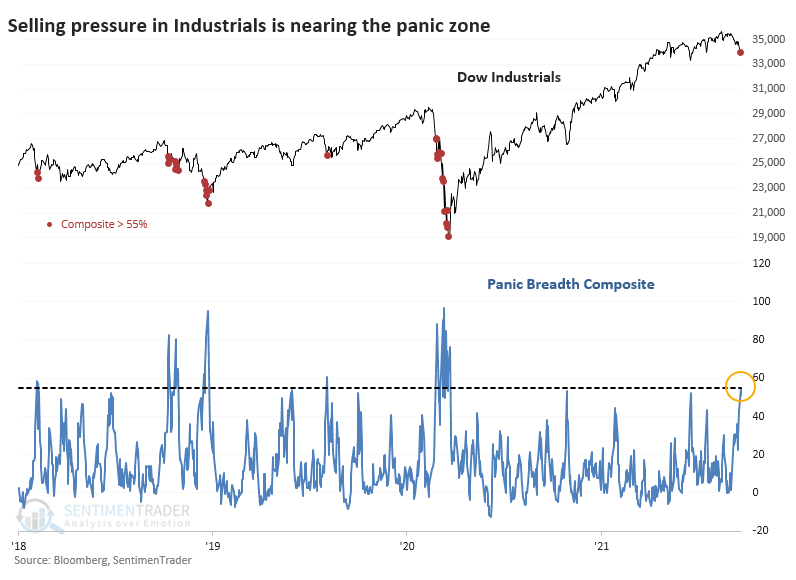
Panic became even more panicky during the pandemic, but otherwise, it presented a good risk/reward for investors, or at least for traders. Over the past 30 years, its record has been good - not great - when it reached this level. Like most oscillators, more extreme readings tend to lead to more consistent results.
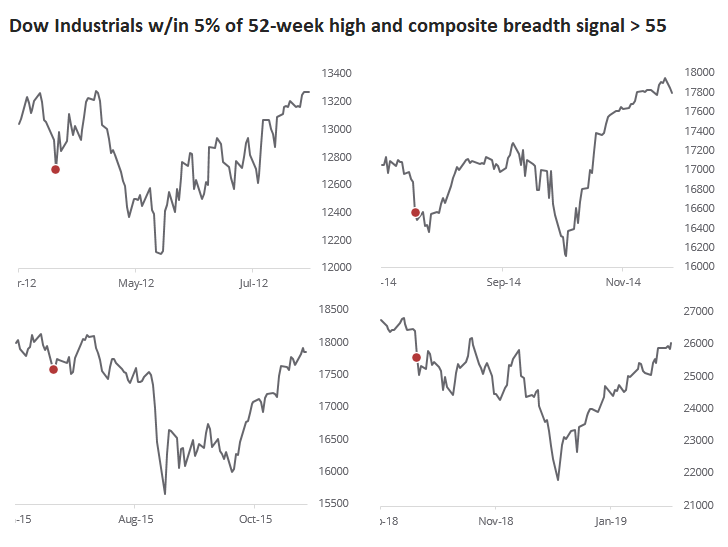
The unusual thing about the current signal is that it triggered when the Dow Industrials were so close to a 52-week high, within 5% of it. Only four other signals have done this.
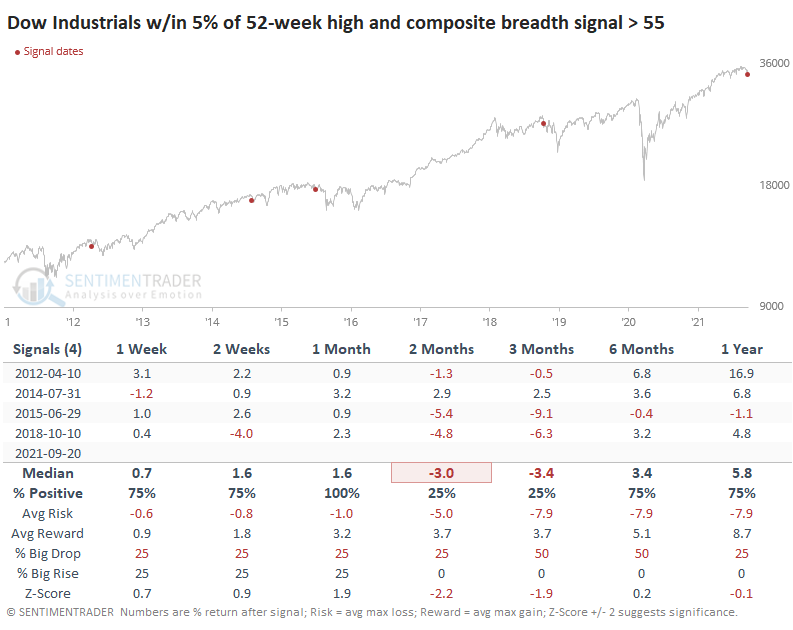
Interestingly, each of them rebounded over the next couple of weeks...and then rolled over to a lower low.
This sector is nearing a critical inflection point, or maybe it's already there. Investors have puked about as much as they ever do during healthy market environments, at least when measured by internal breadth and momentum.
Suppose we're in a similar environment to the past decade. In that case, we should see a relief rally in the coming weeks that alleviates the oversold conditions and allows longer-term indicators like the McClellan Summation Index to remain in (mostly) positive territory. A test of the low would typically be a higher probability for investors. Maybe it's too cute to expect markets to follow a precise playbook like that. Still, the overall suggestion is that buying conditions like this in Industrials might work longer-term as long as one is willing to suffer potentially high uncertainty in the weeks ahead.
Active Studies
| Time Frame | Bullish | Bearish | | Short-Term | 0 | 6 | | Medium-Term | 6 | 3 | | Long-Term | 11 | 5 |
|
Indicators at Extremes
Portfolio
| Position | Description | Weight % | Added / Reduced | Date | | Stocks | RSP | 4.1 | Added 4.1% | 2021-05-19 | | Bonds | 23.9% BND, 6.9% SCHP | 30.7 | Reduced 7.1% | 2021-05-19 | | Commodities | GCC | 2.6 | Reduced 2.1%
| 2020-09-04 | | Precious Metals | GDX | 5.6 | Reduced 4.2% | 2021-05-19 | | Special Situations | 4.3% XLE, 2.2% PSCE | 7.6 | Reduced 5.6% | 2021-04-22 | | Cash | | 49.4 | | |
|
Updates (Changes made today are underlined)
Much of our momentum and trend work has remained positive for several months, with some scattered exceptions. Almost all sentiment-related work has shown a poor risk/reward ratio for stocks, especially as speculation drove to record highs in exuberance in February. Much of that has worn off, and most of our models are back toward neutral levels. There isn't much to be excited about here. The same goes for bonds and even gold. Gold has been performing well lately and is back above long-term trend lines. The issue is that it has a poor record of holding onto gains when attempting a long-term trend change like this, so we'll take a wait-and-see approach. RETURN YTD: 8.2% 2020: 8.1%, 2019: 12.6%, 2018: 0.6%, 2017: 3.8%, 2016: 17.1%, 2015: 9.2%, 2014: 14.5%, 2013: 2.2%, 2012: 10.8%, 2011: 16.5%, 2010: 15.3%, 2009: 23.9%, 2008: 16.2%, 2007: 7.8%
|
|
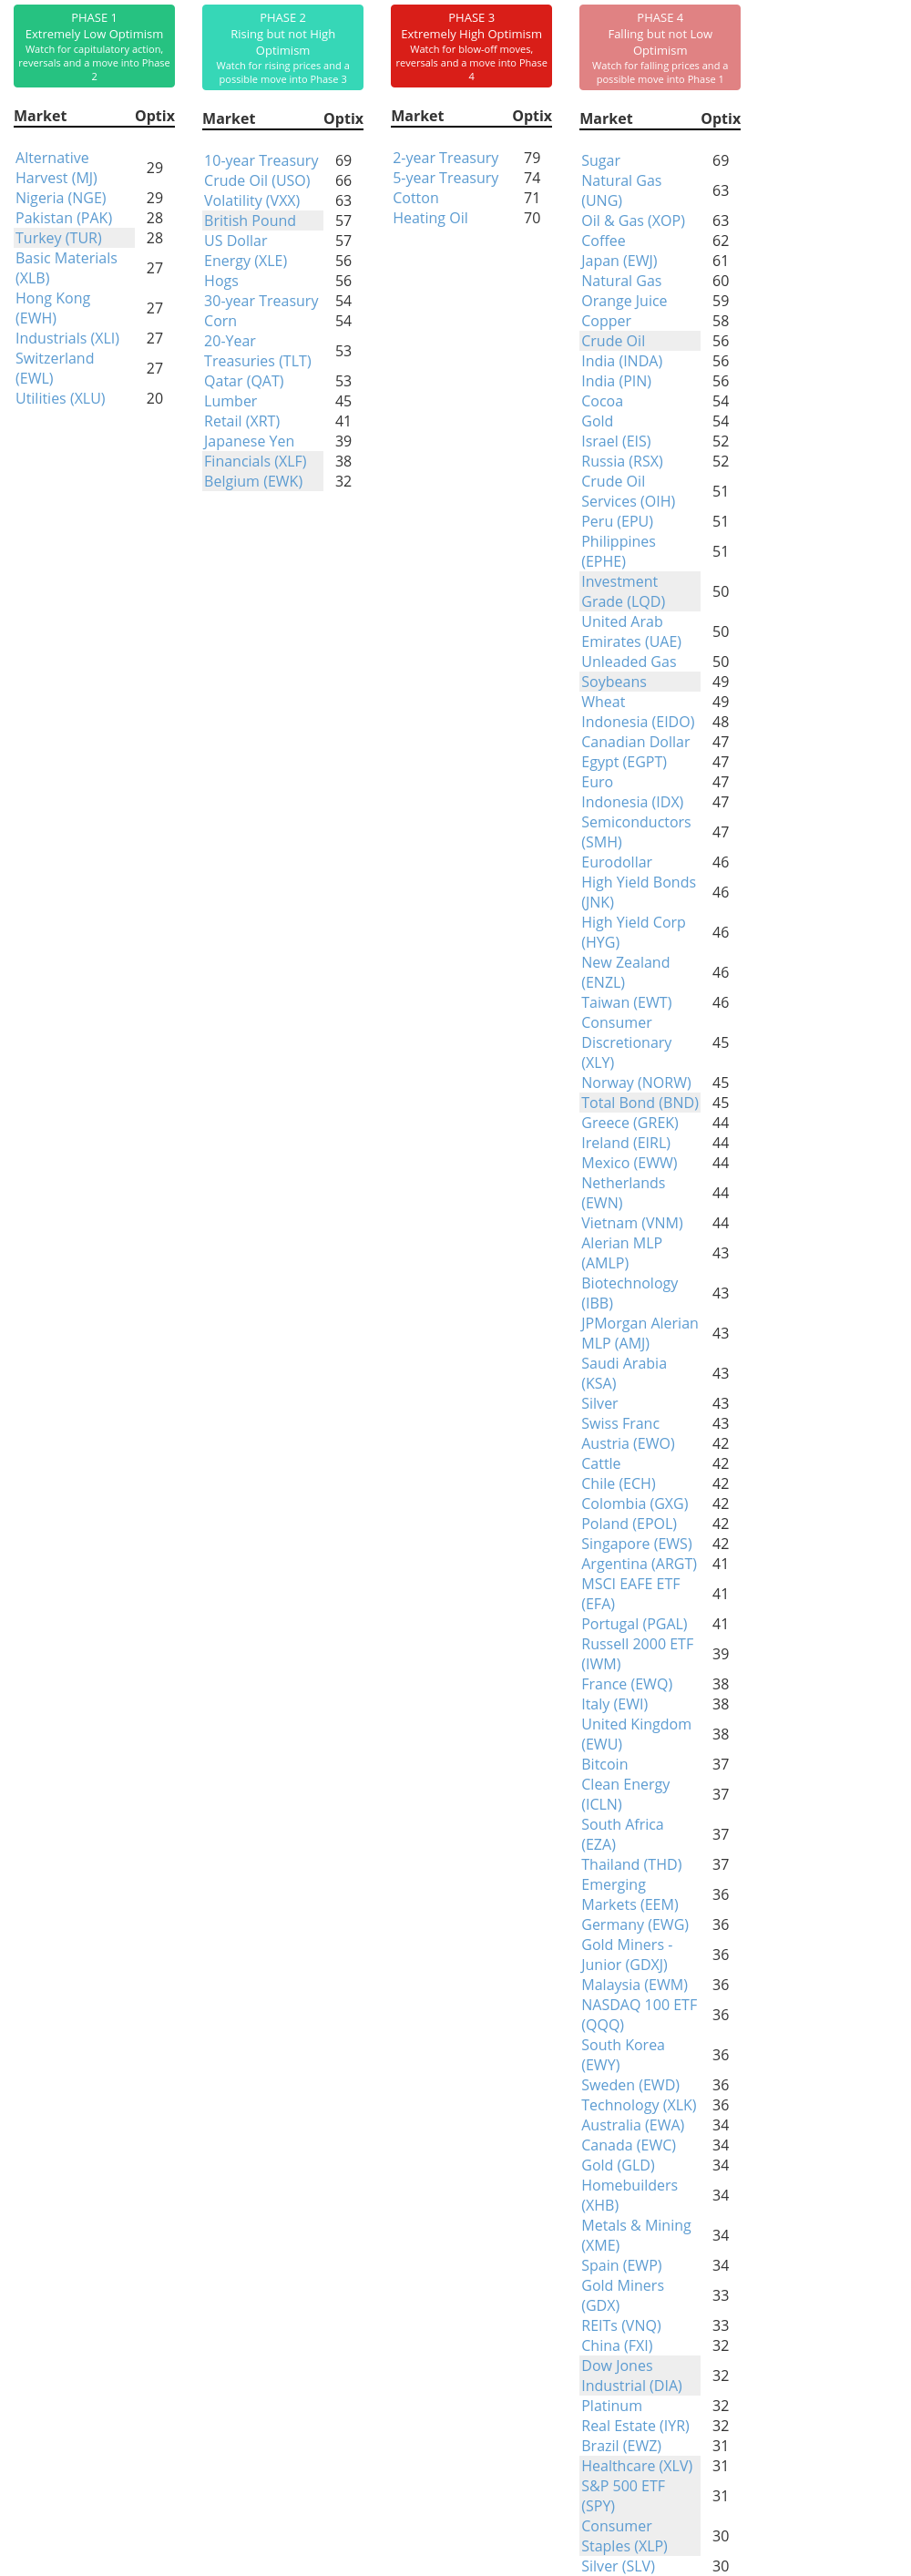
Phase Table
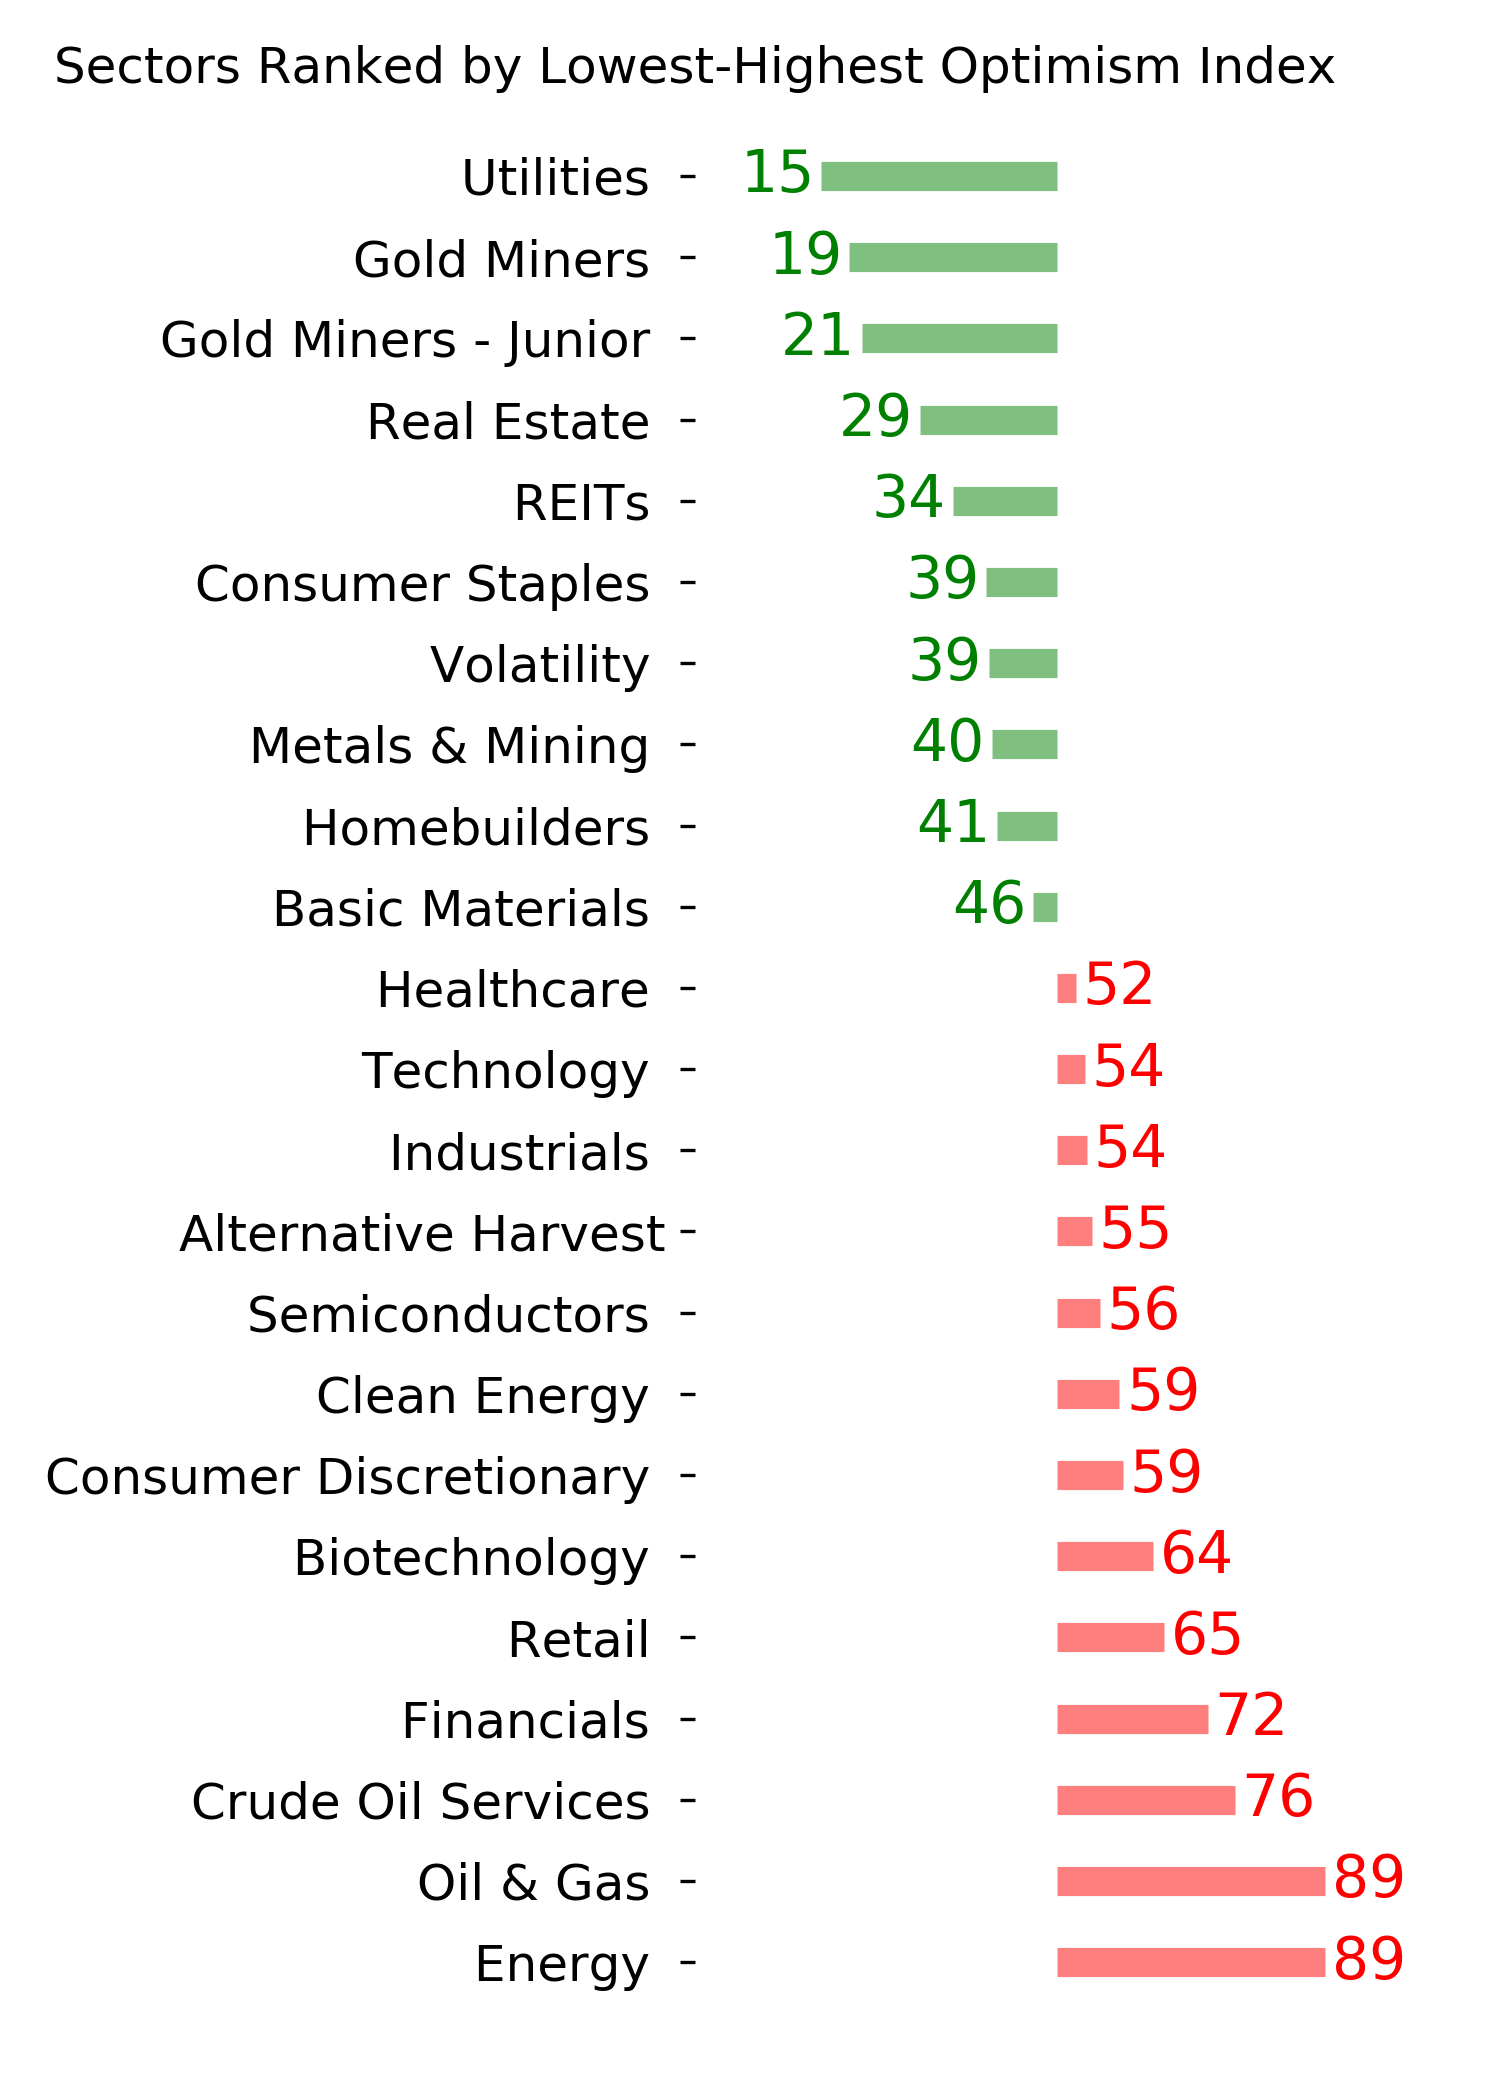
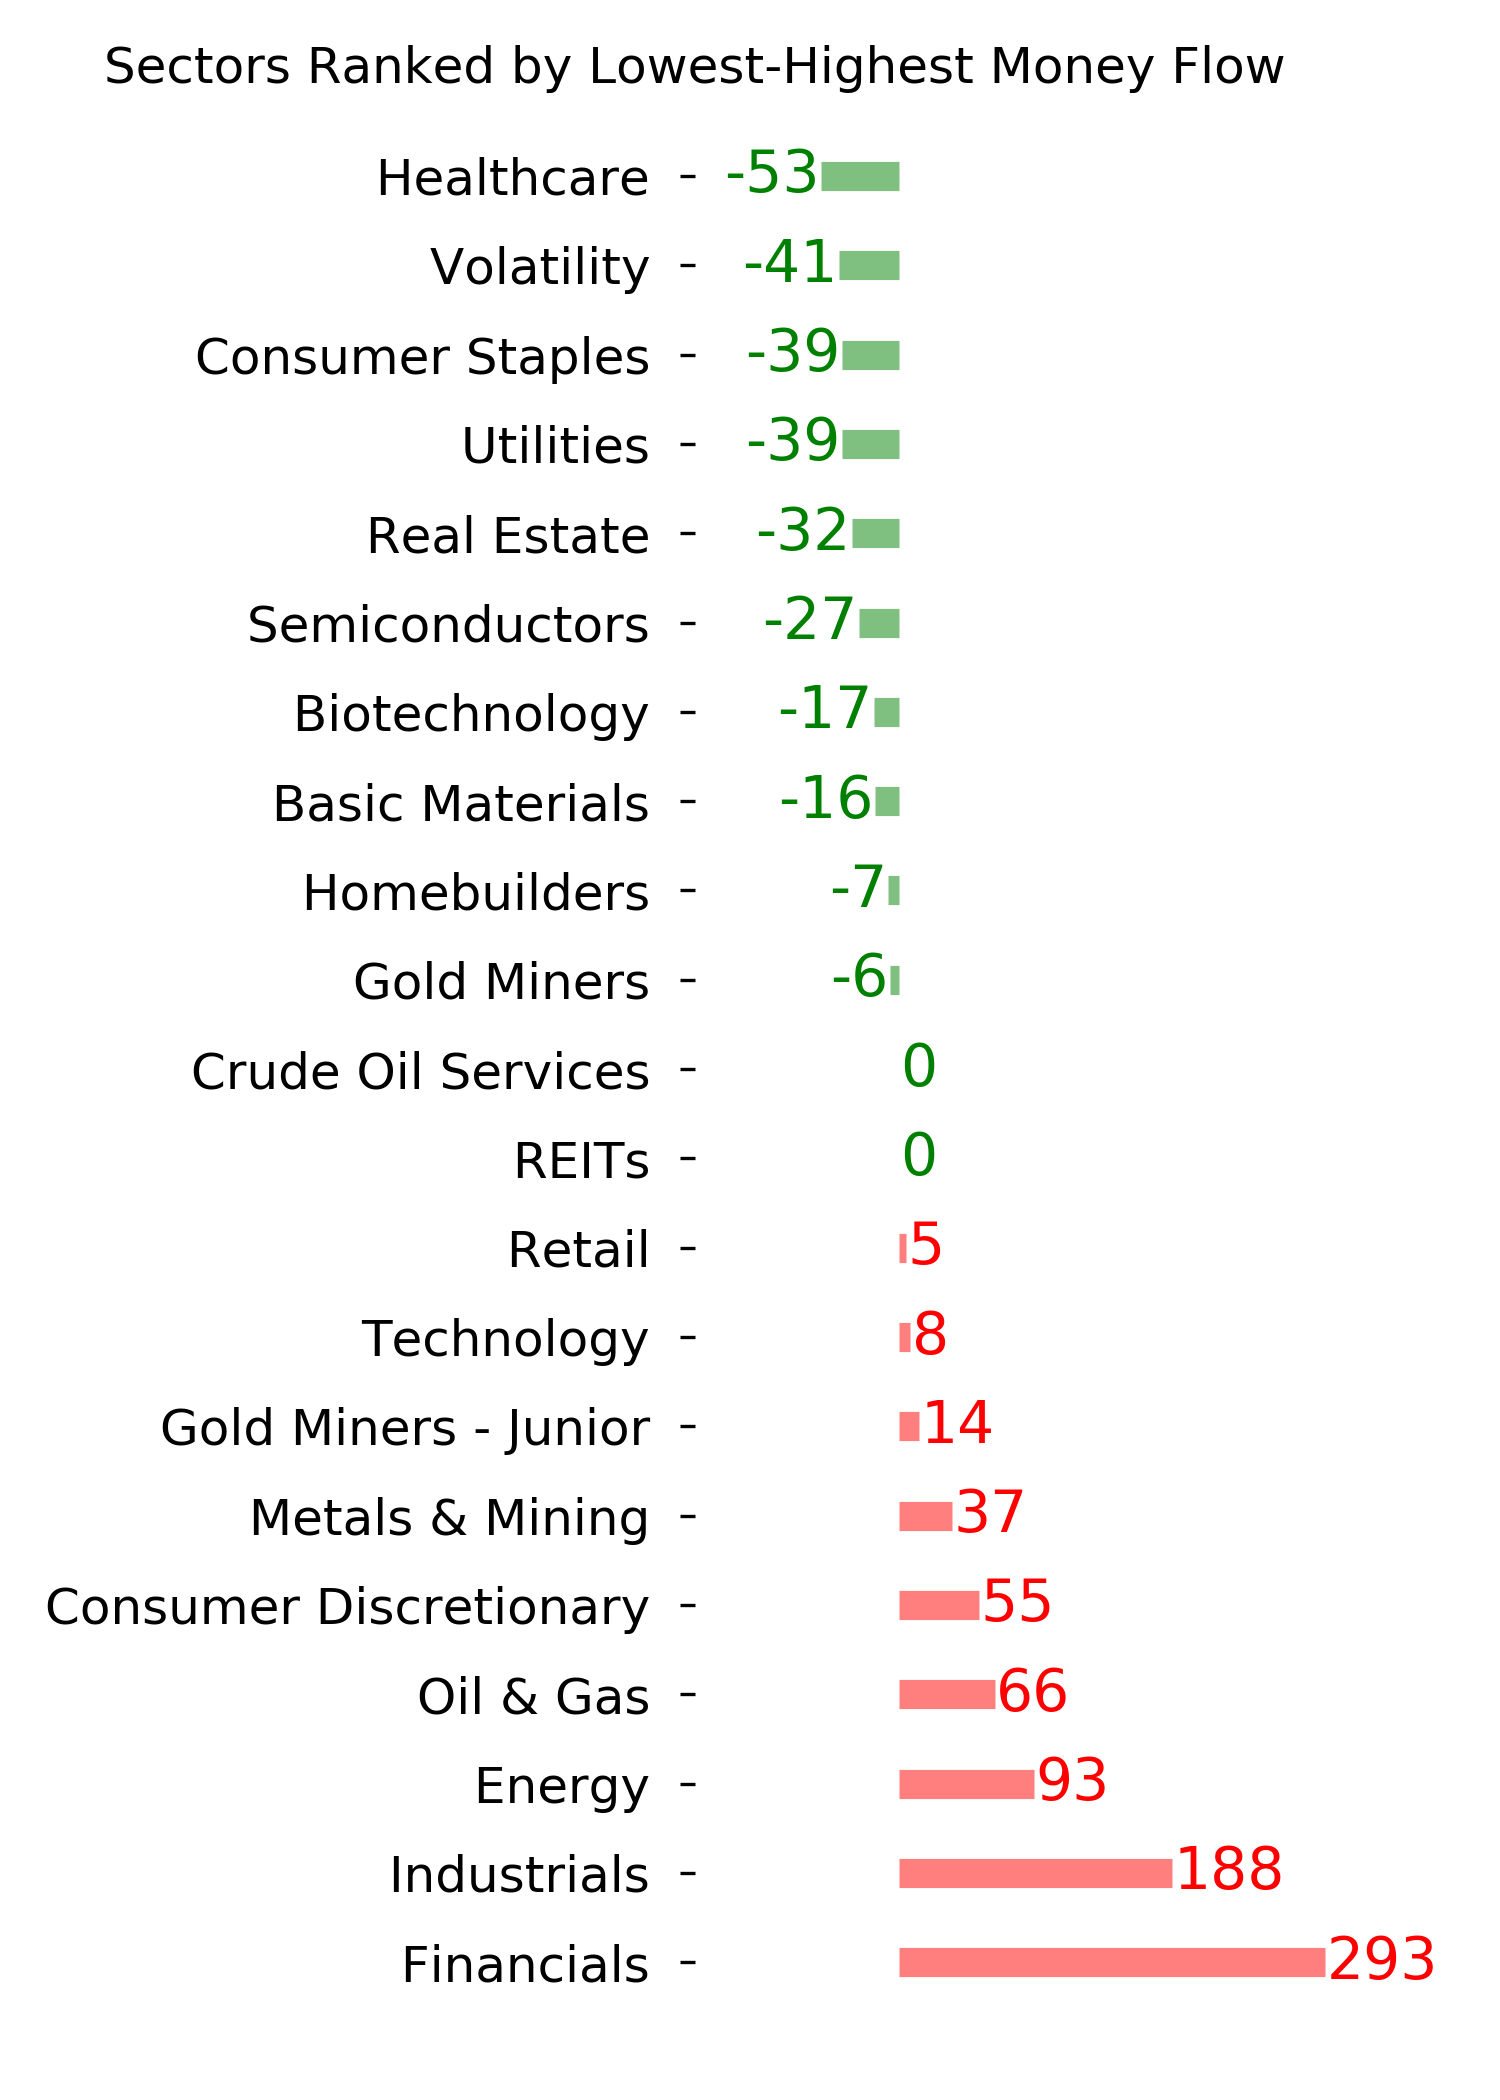
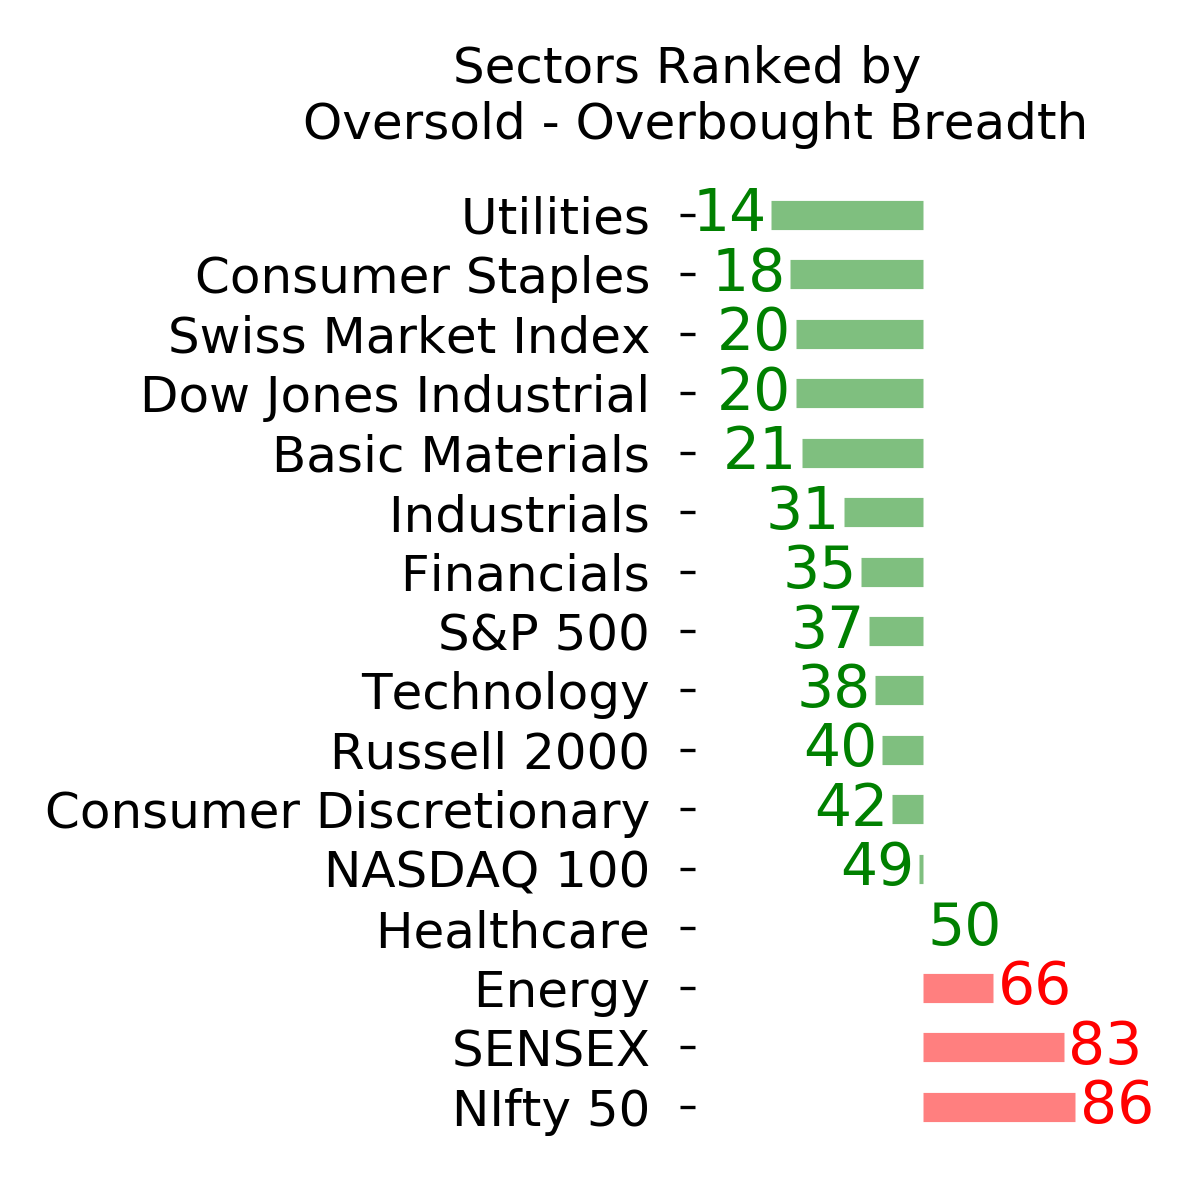
Ranks
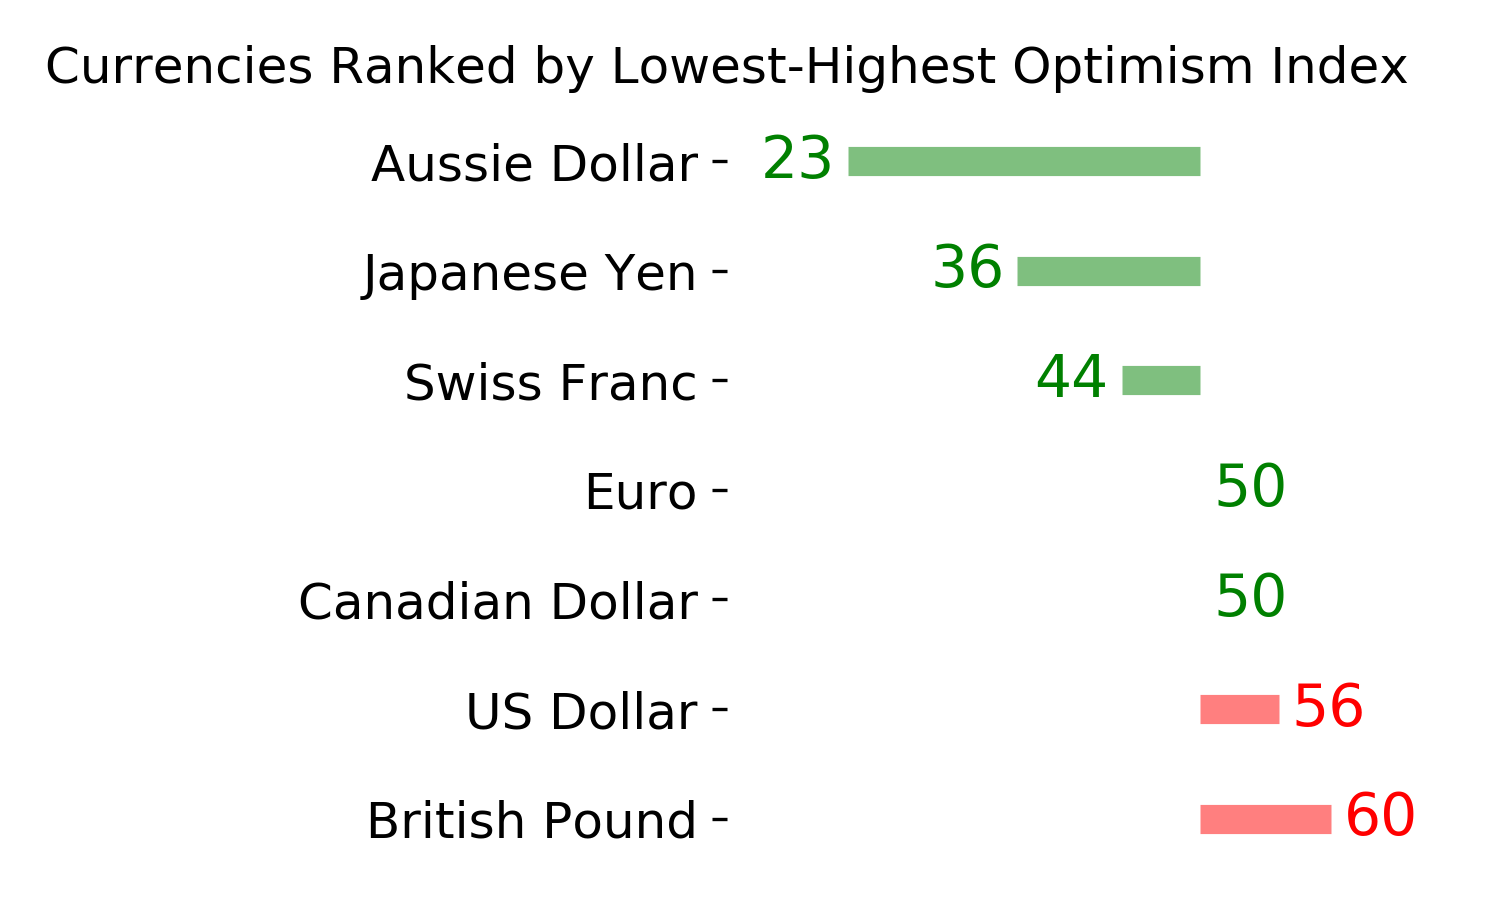
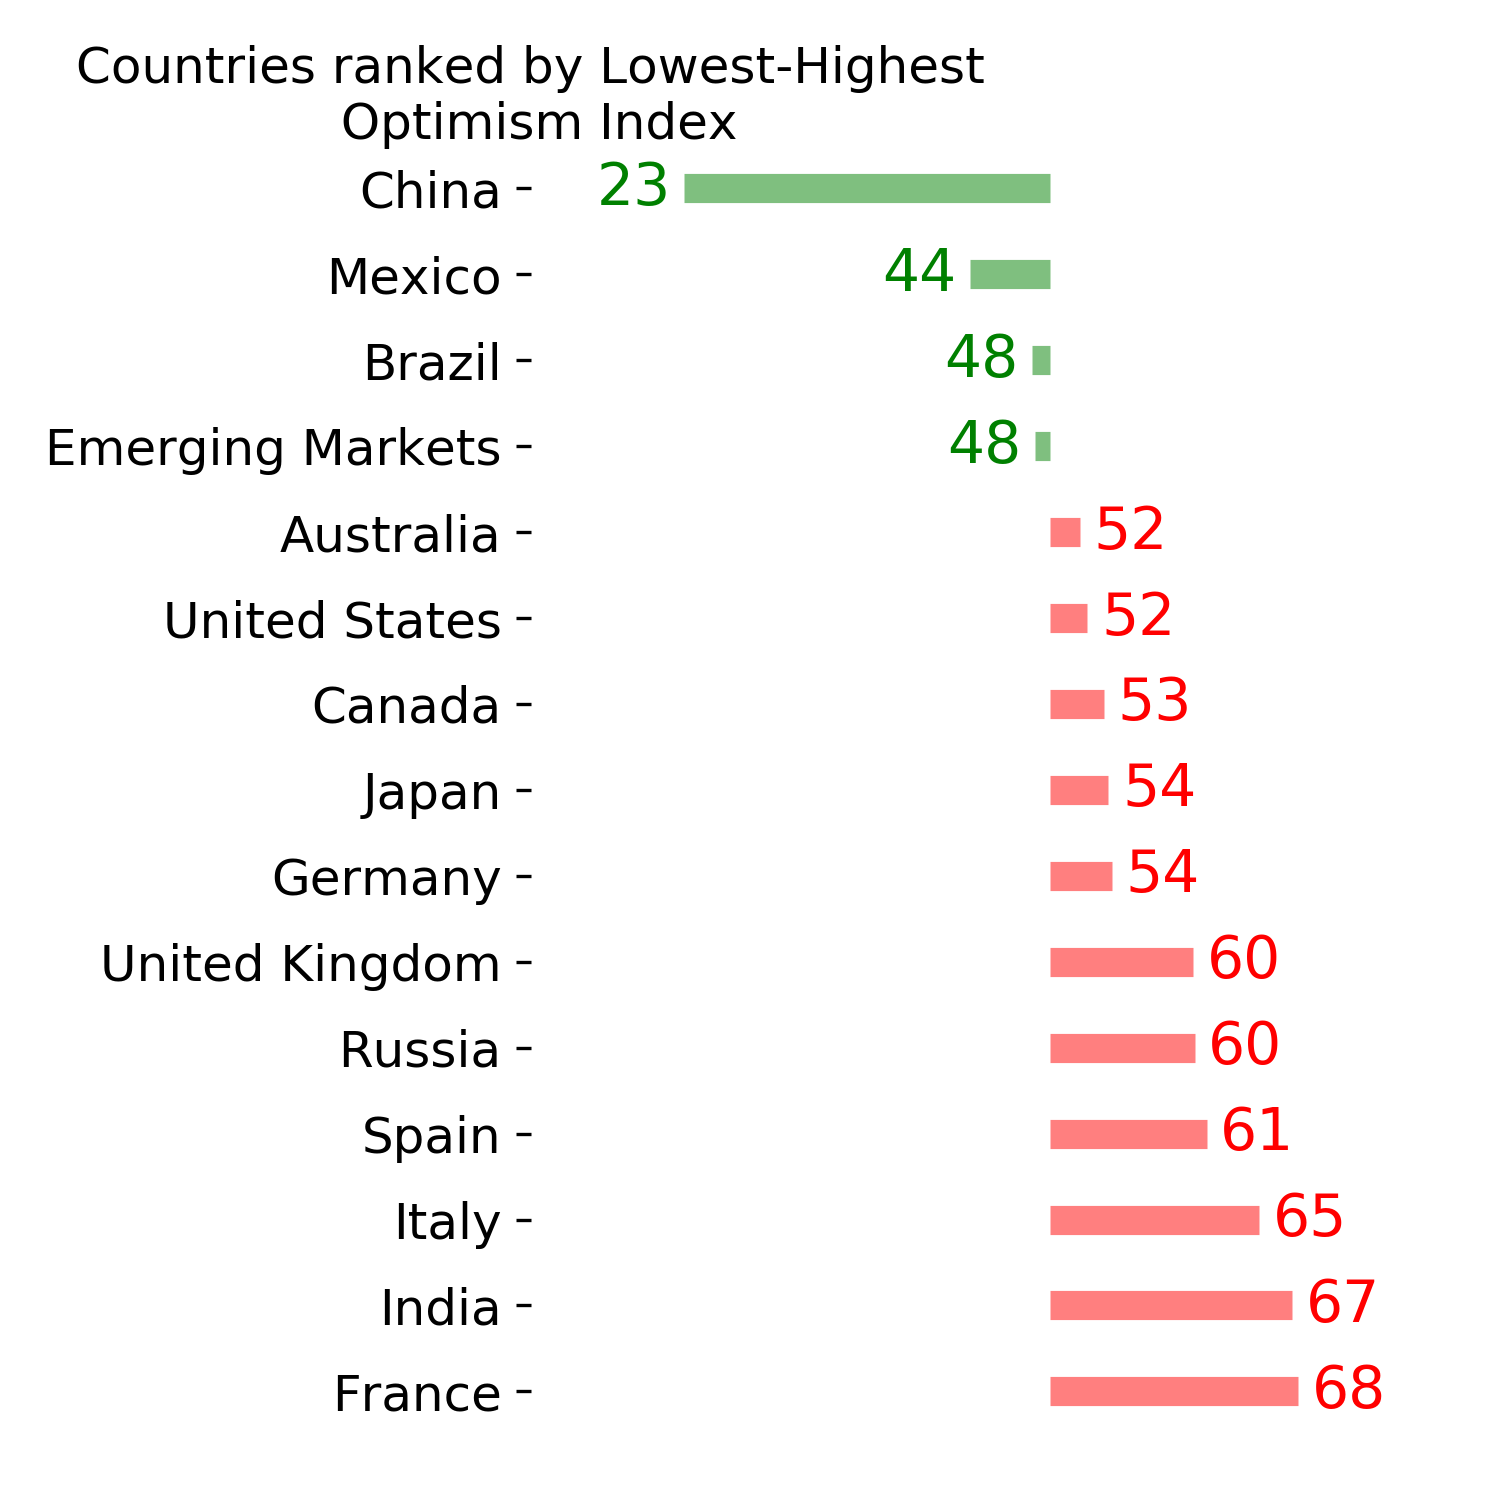
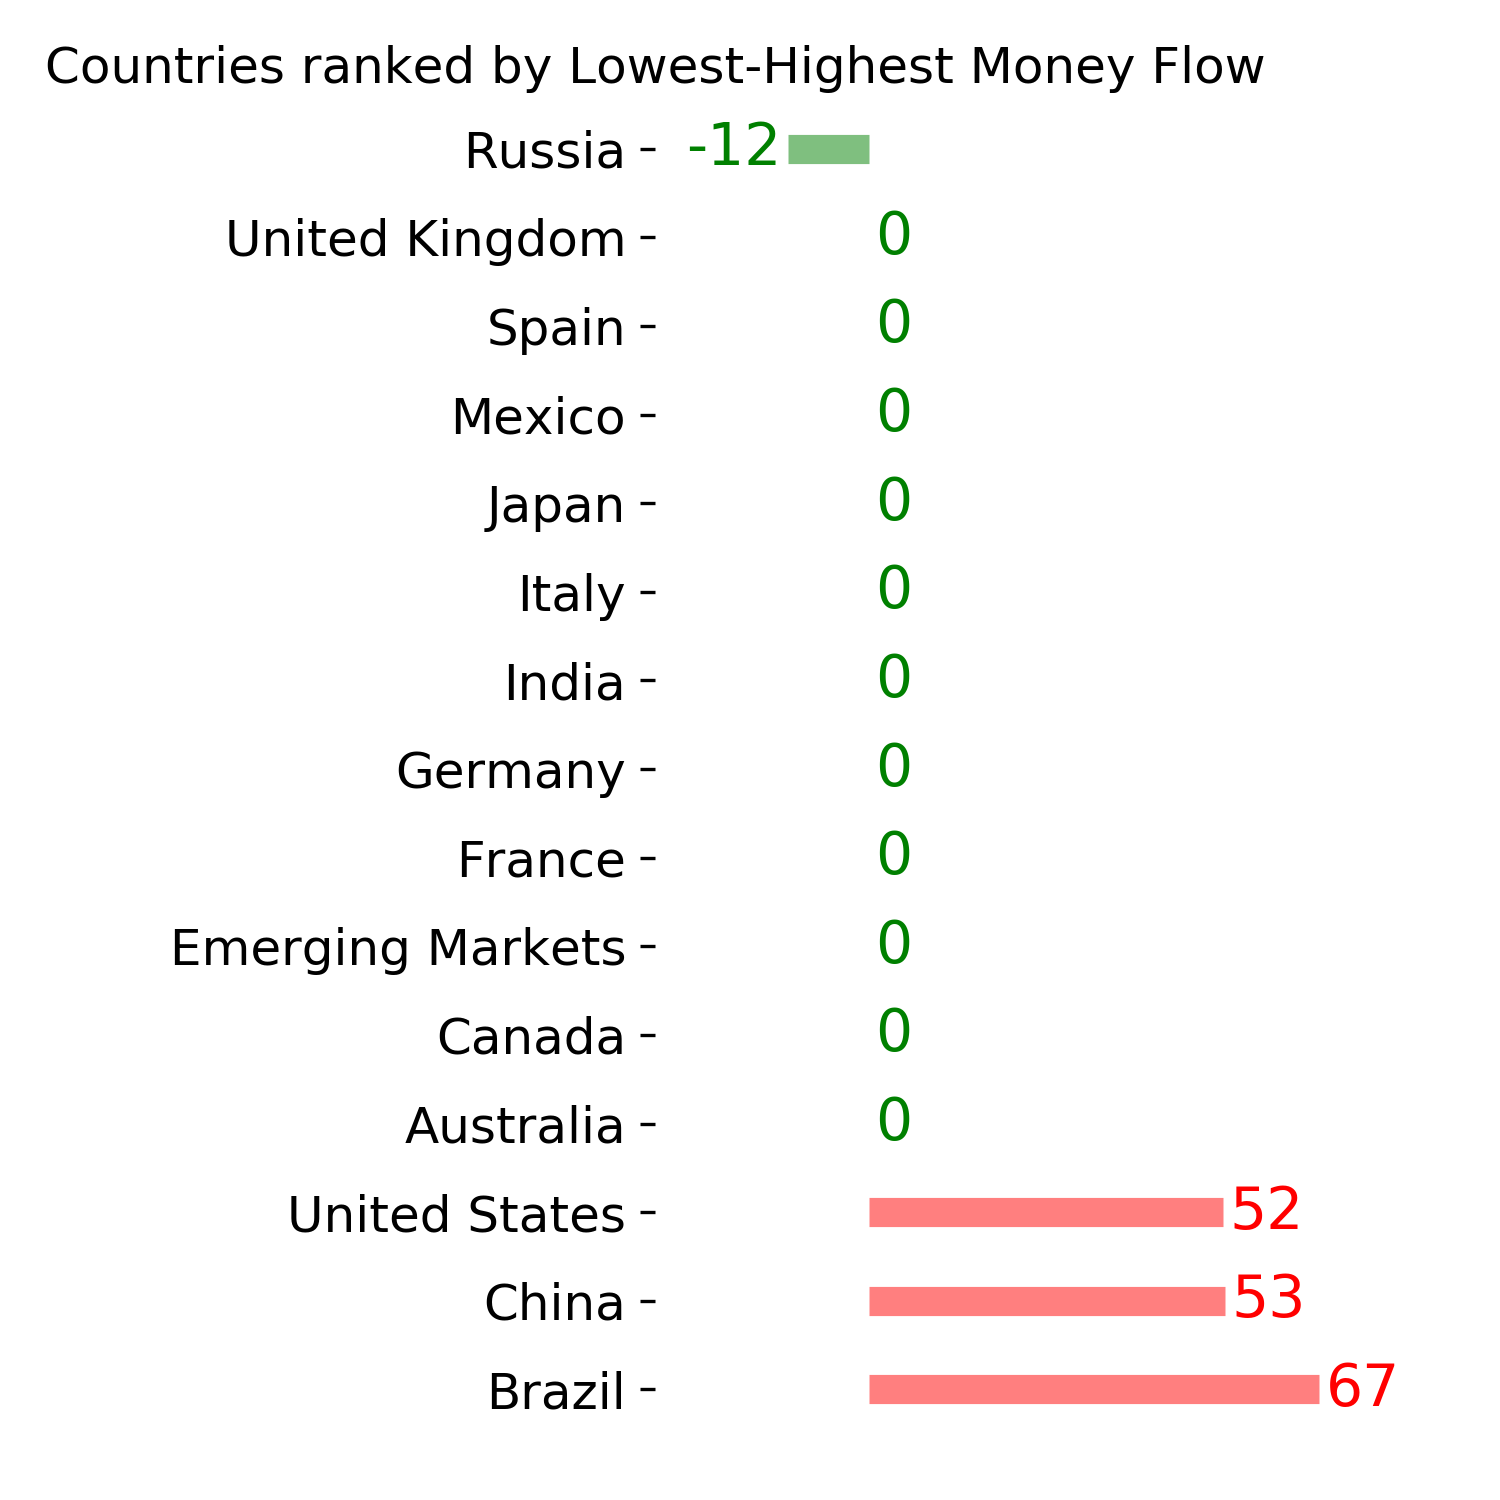
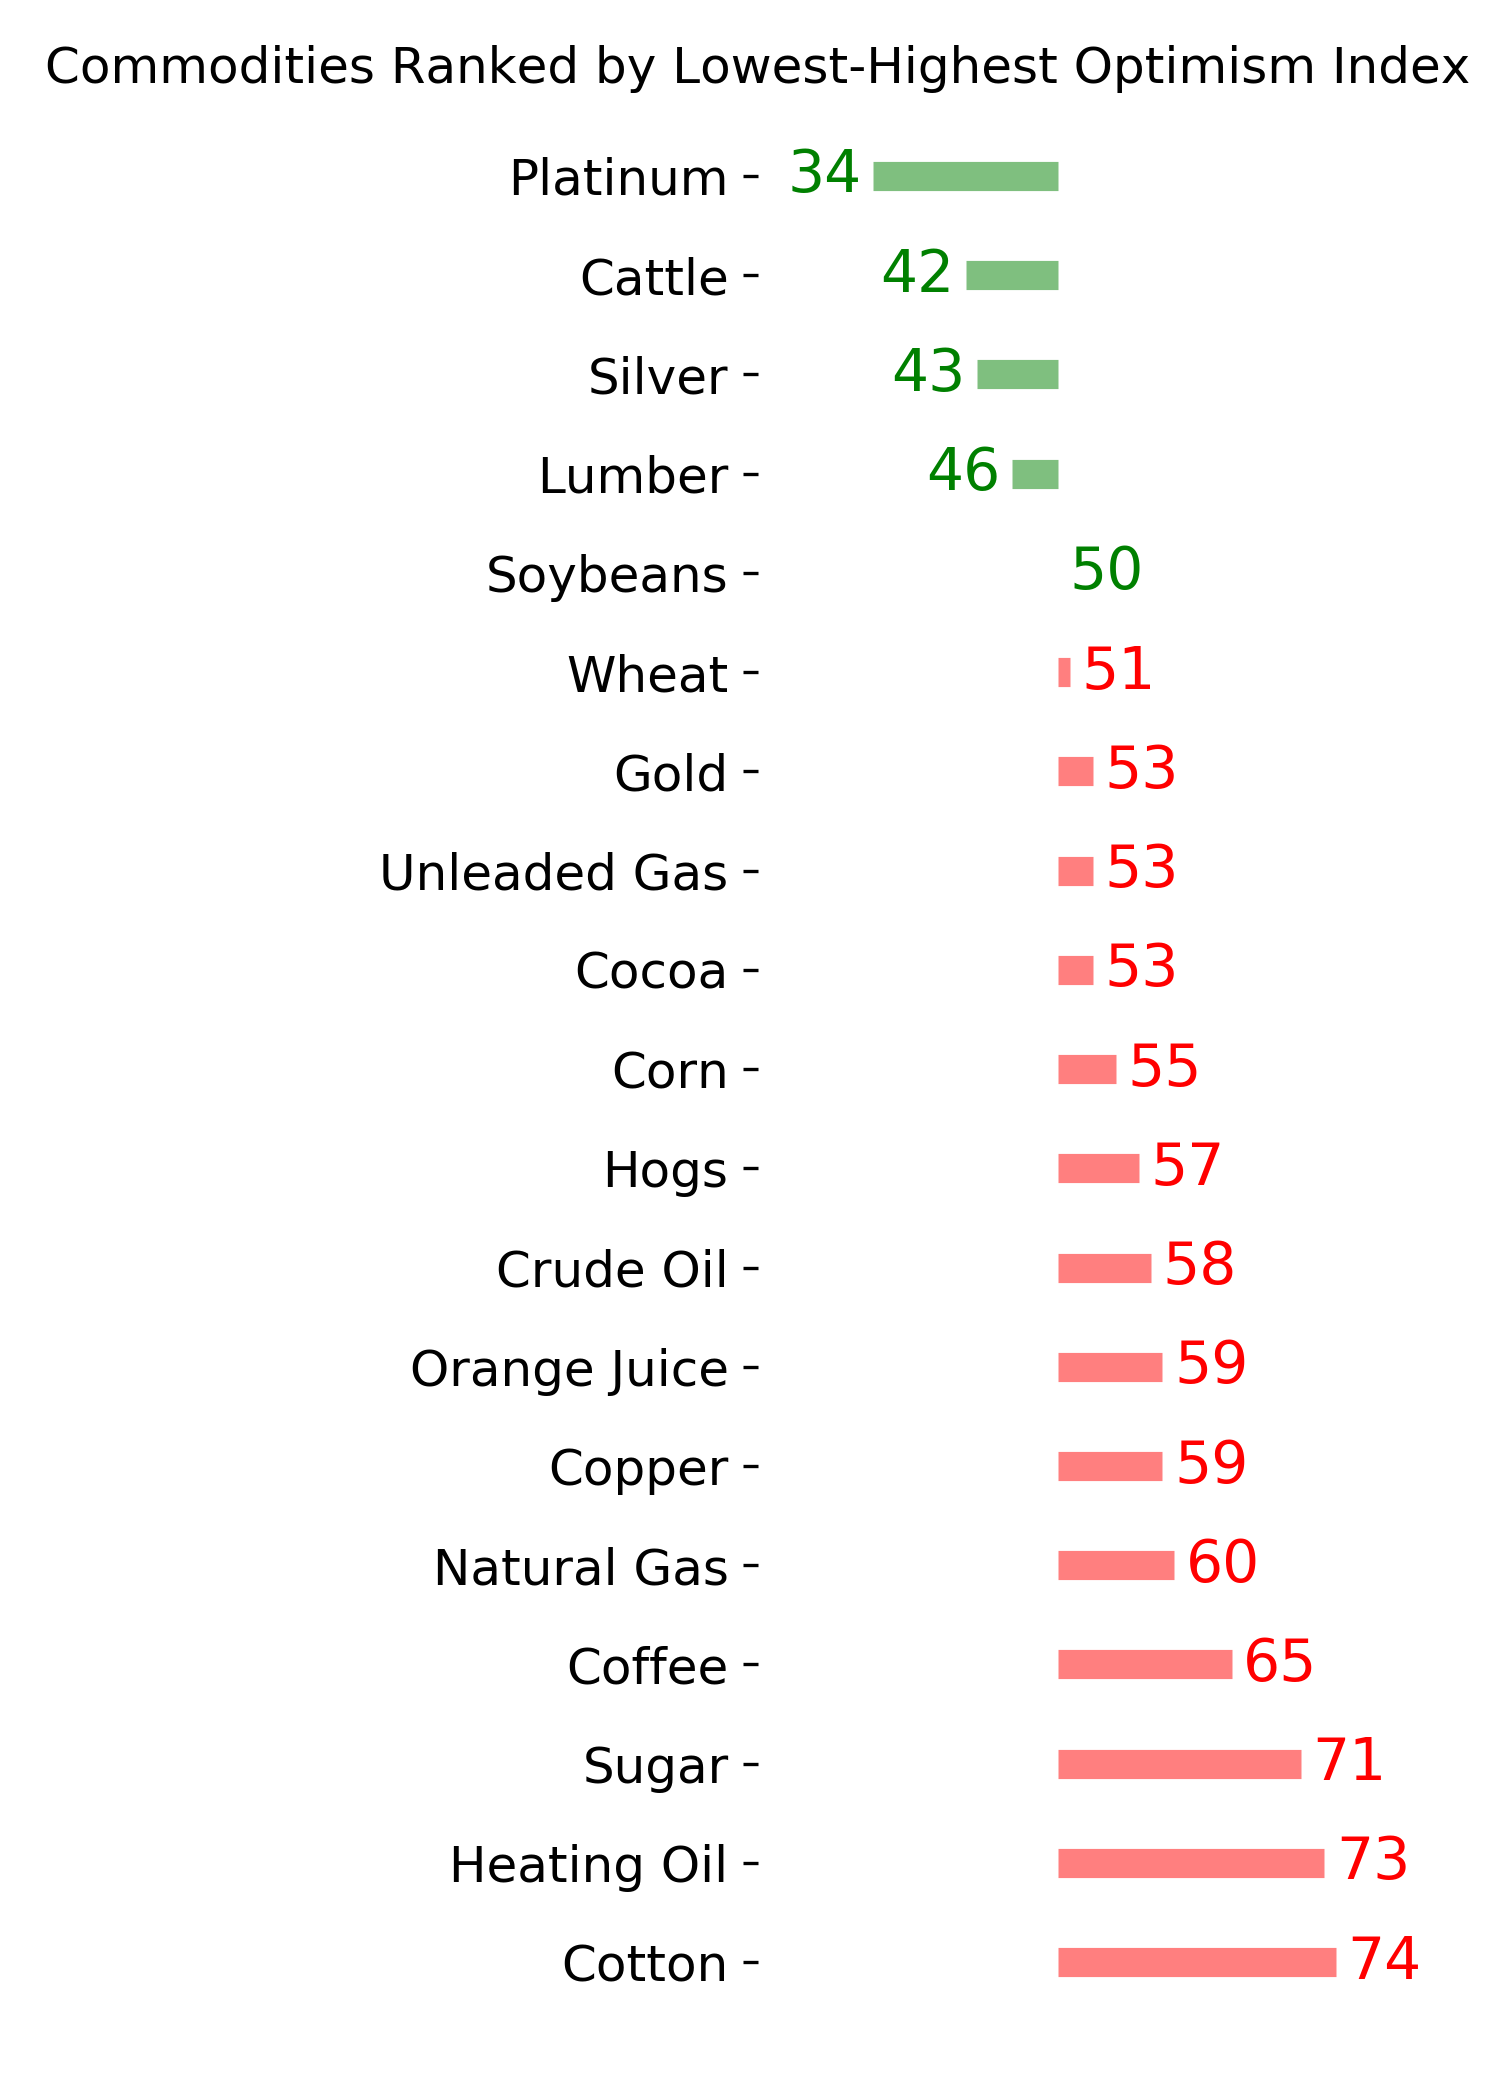
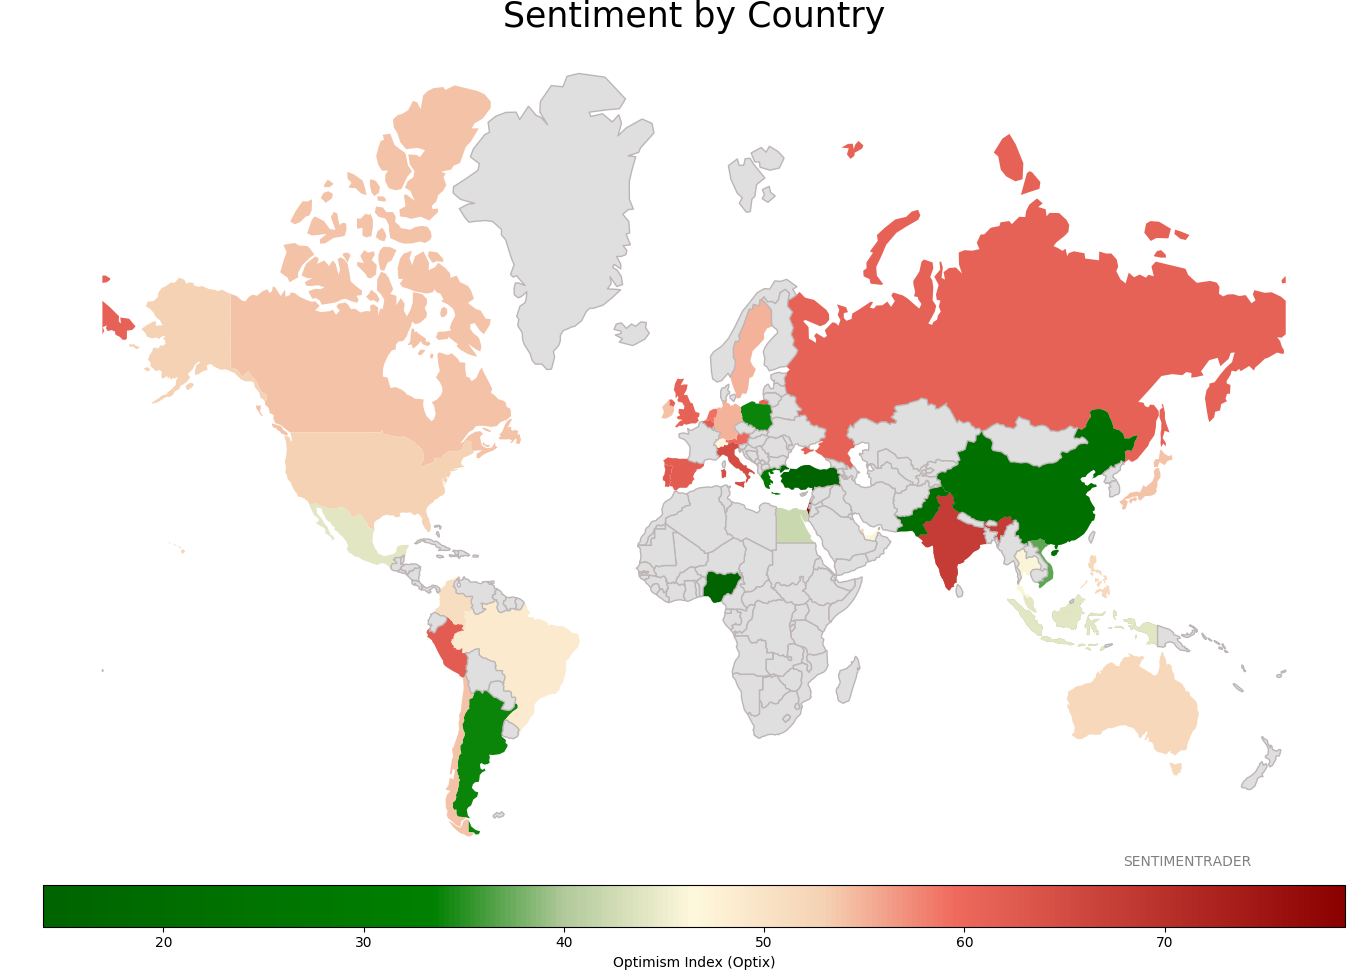
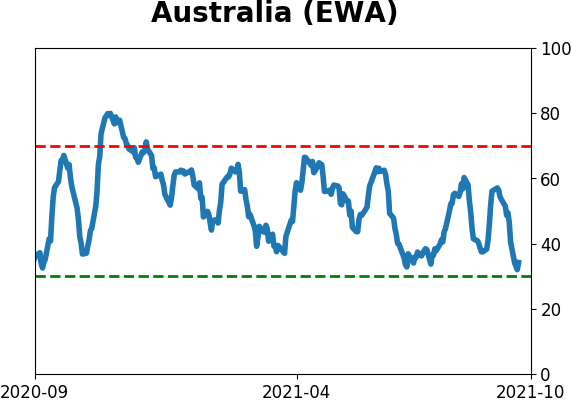
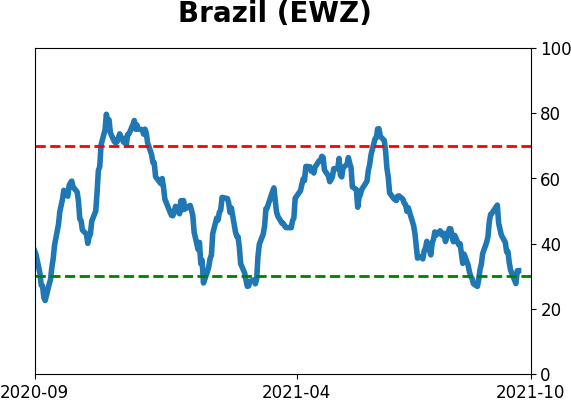
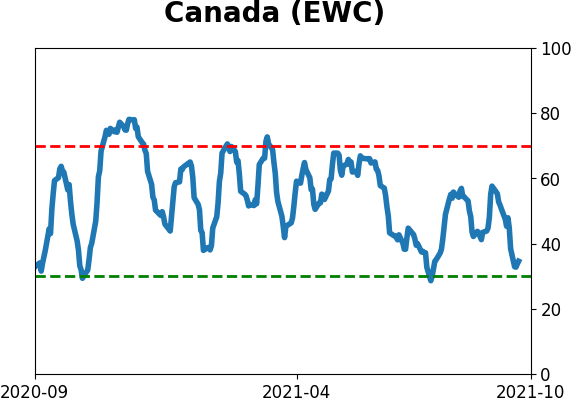
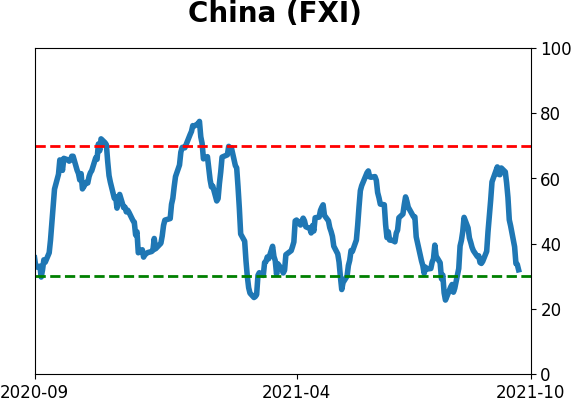
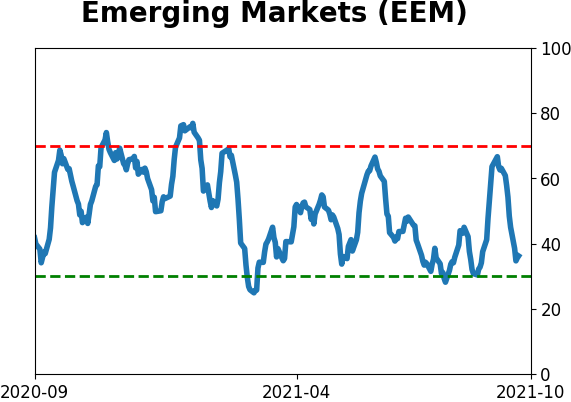
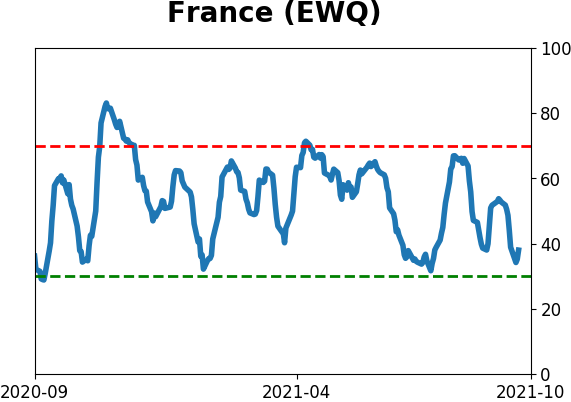
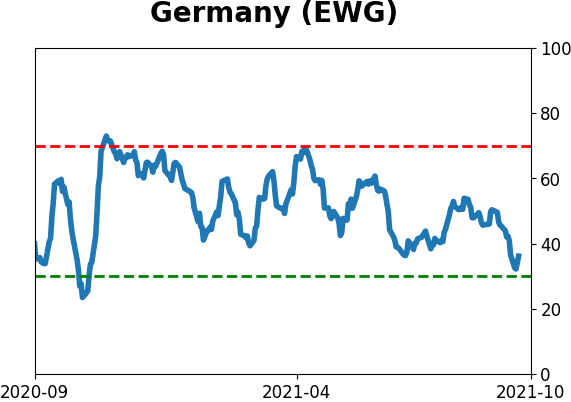
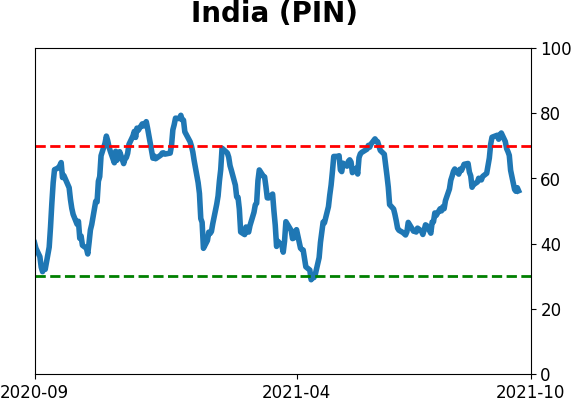
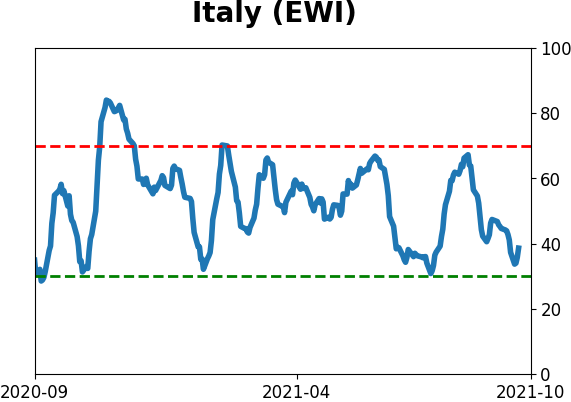
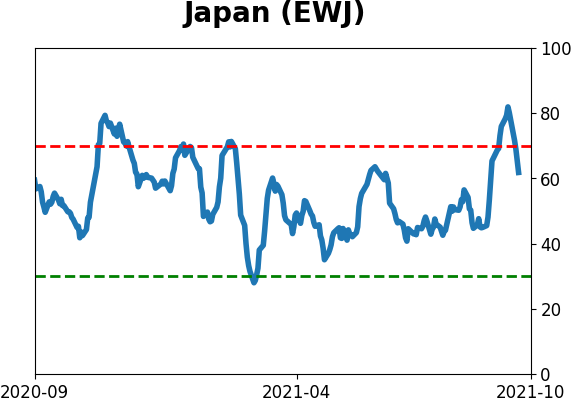
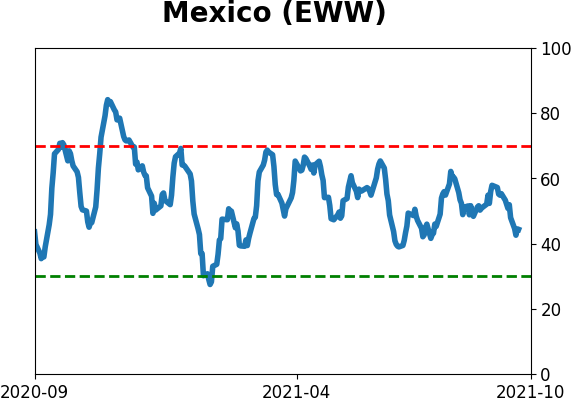
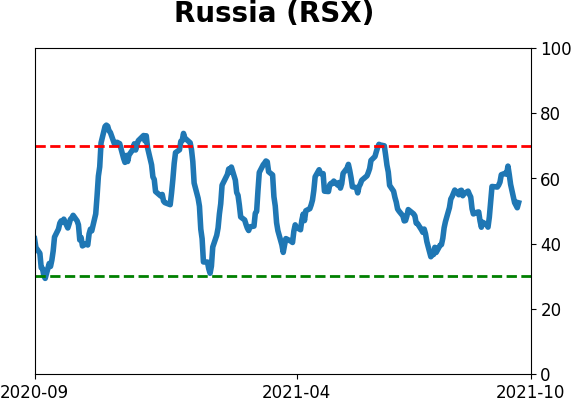
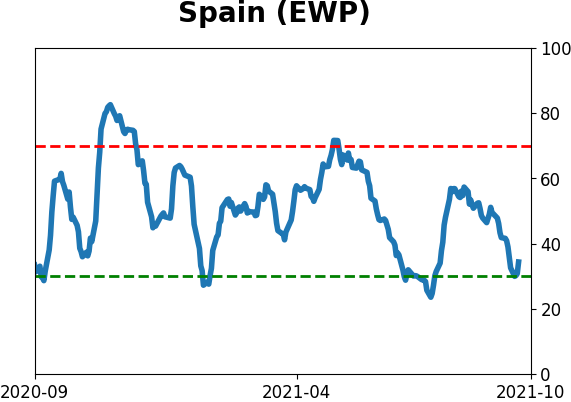
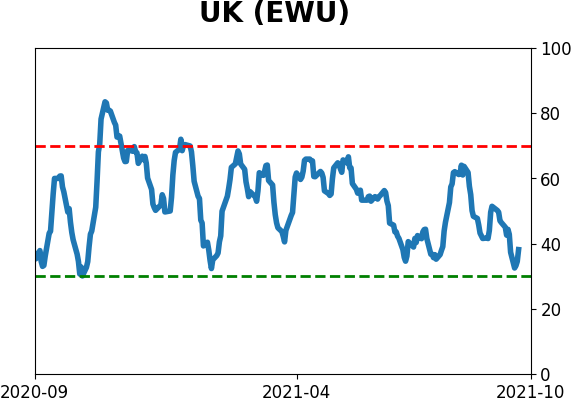
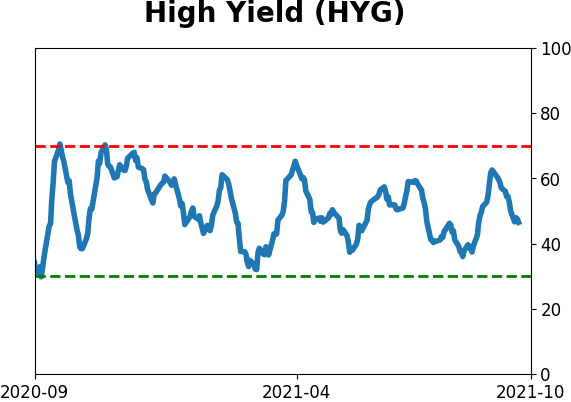
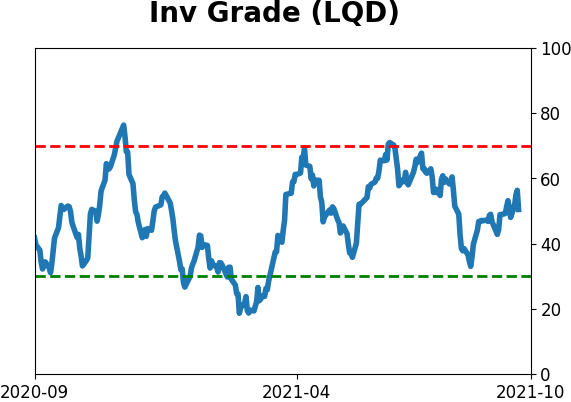
Sentiment Around The World
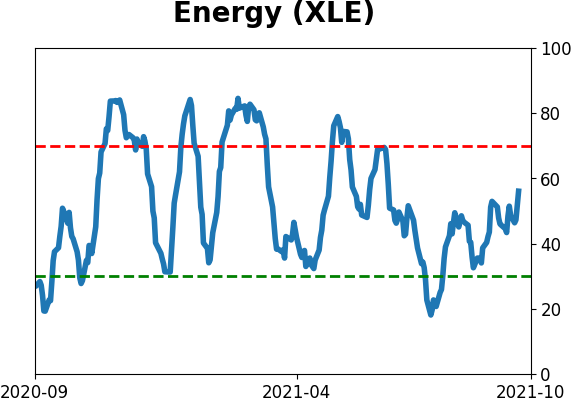
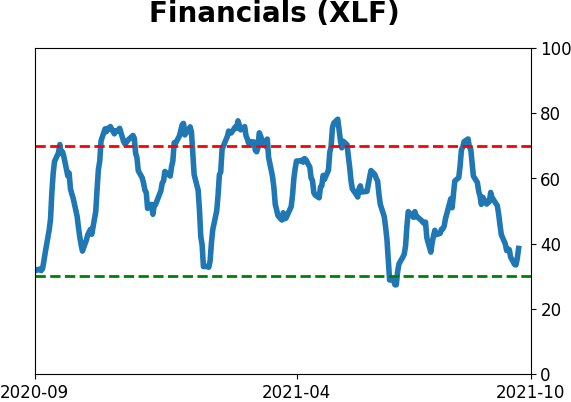
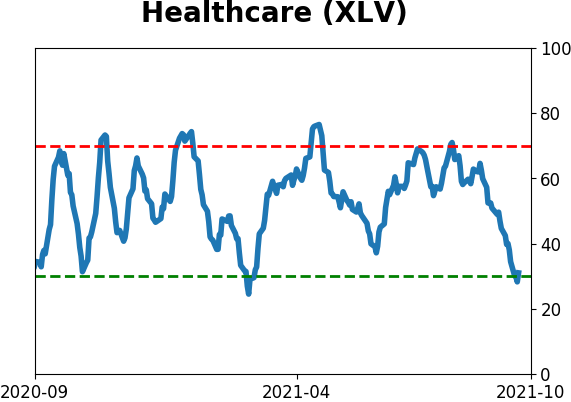
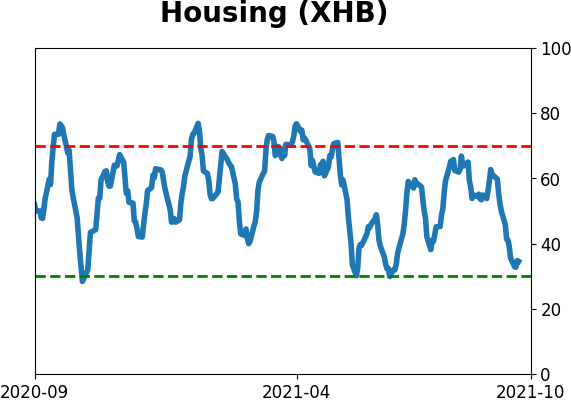
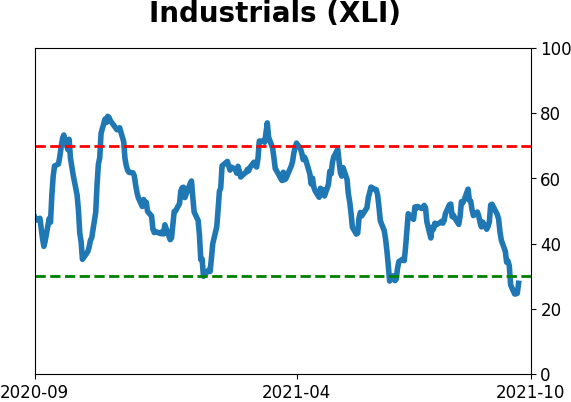
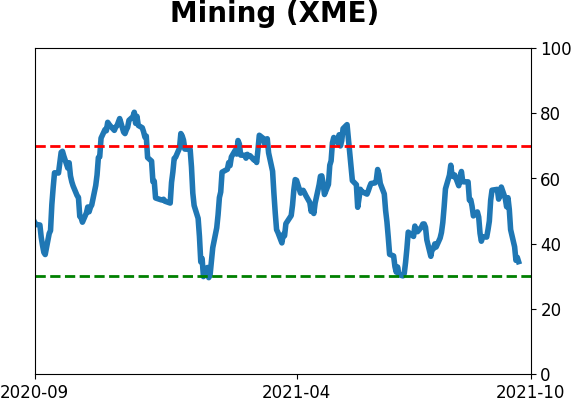
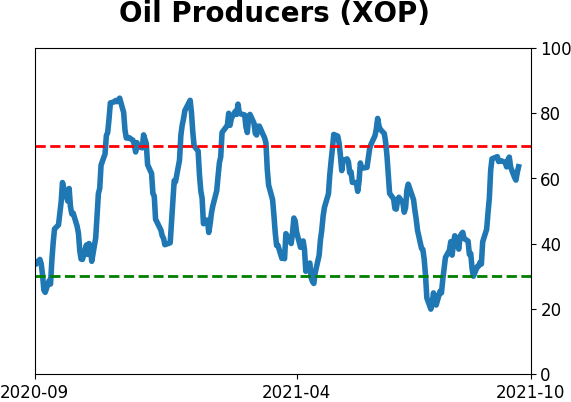
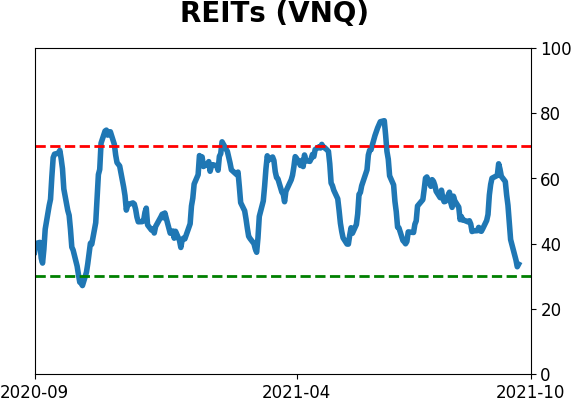
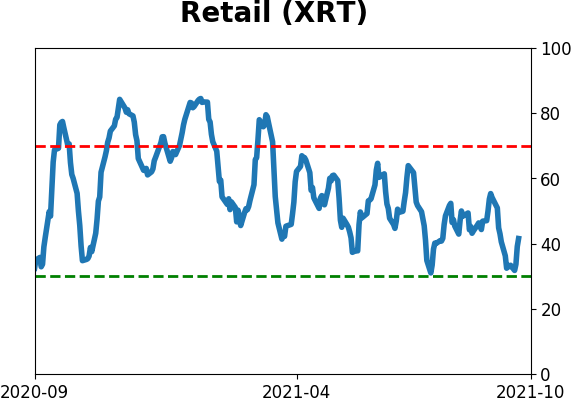
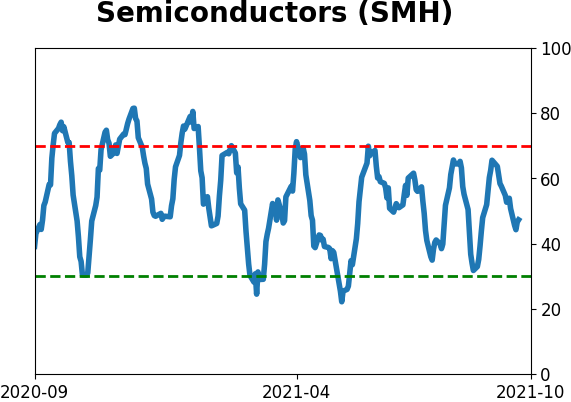
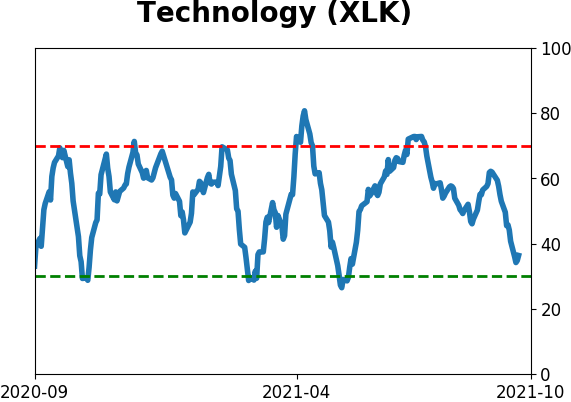
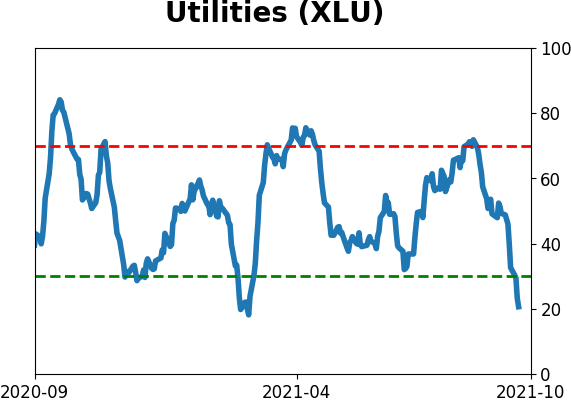
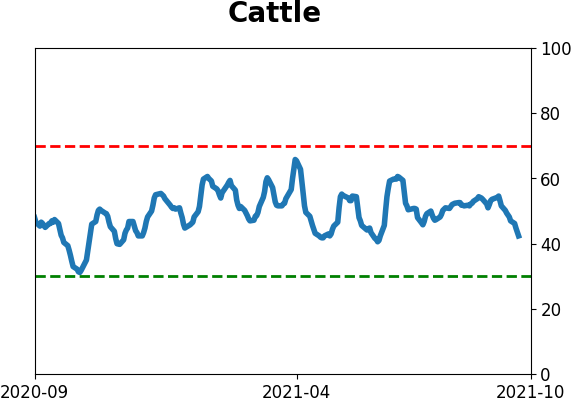
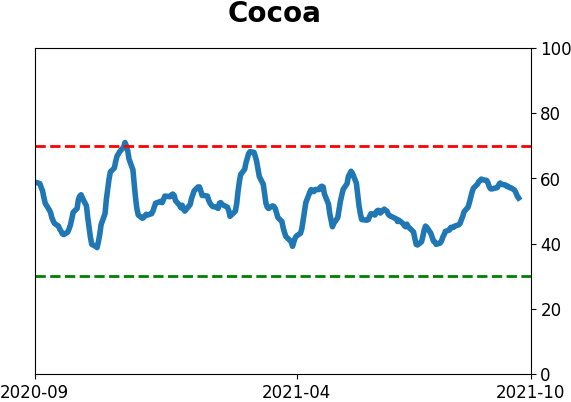
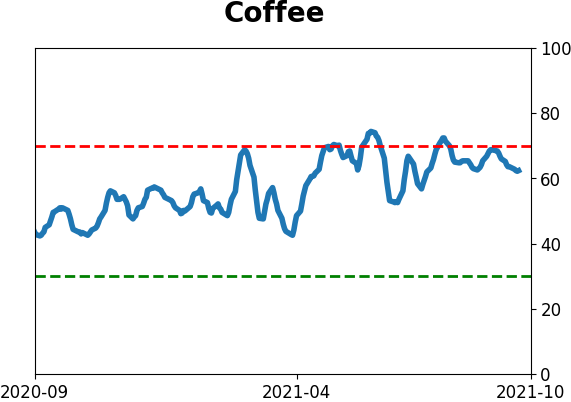
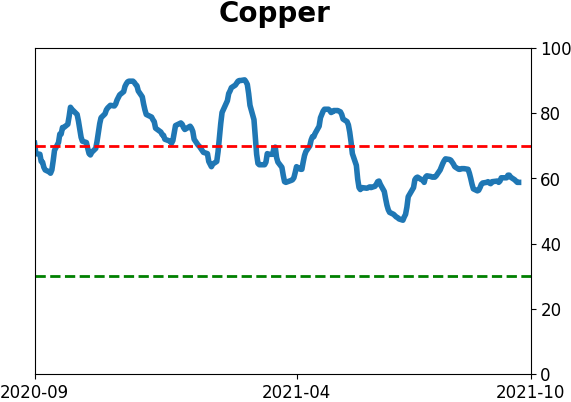
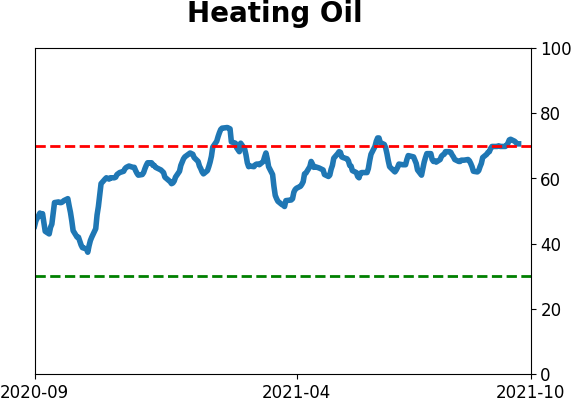
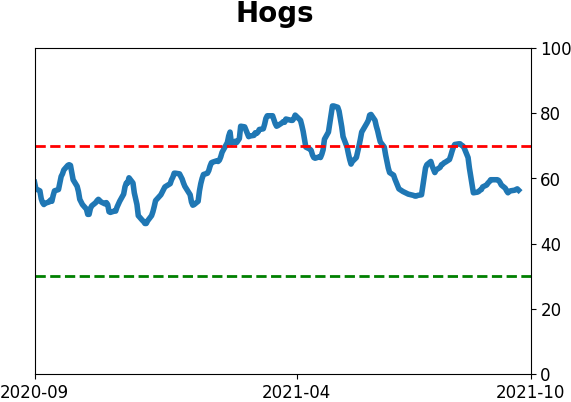
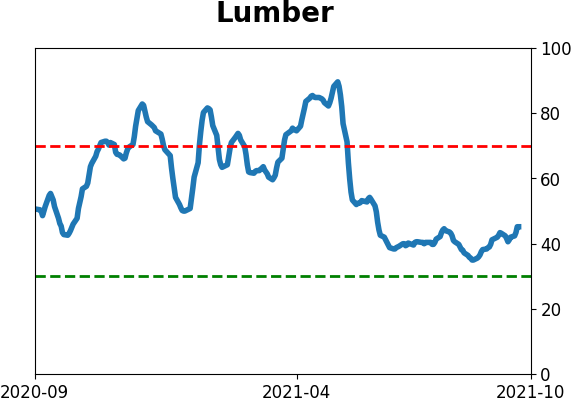
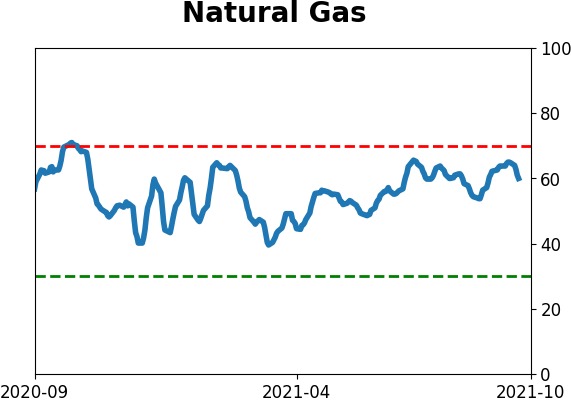
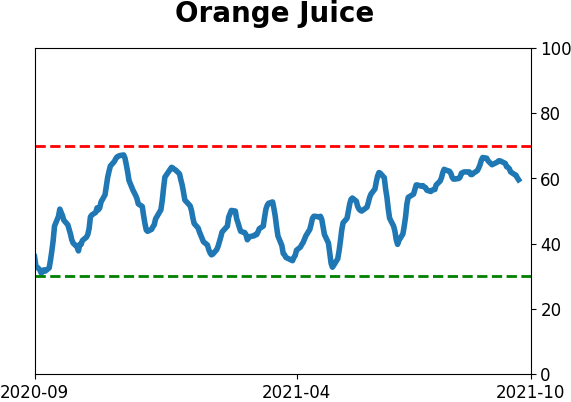
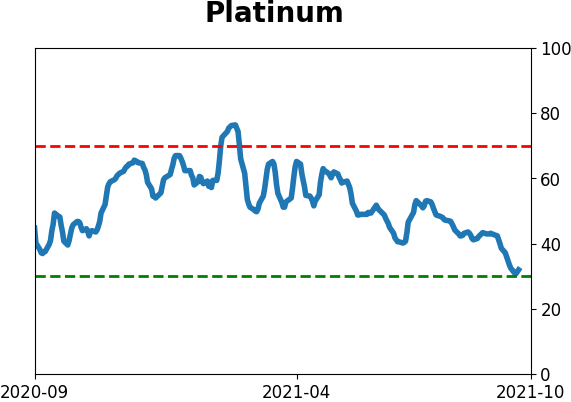
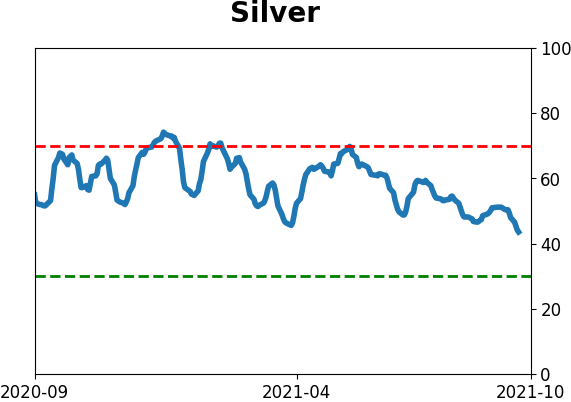
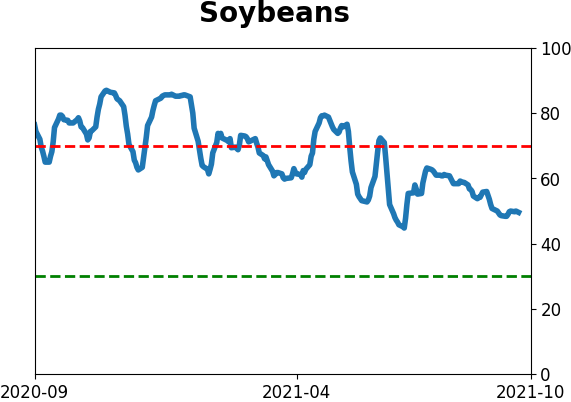
Optimism Index Thumbnails
|
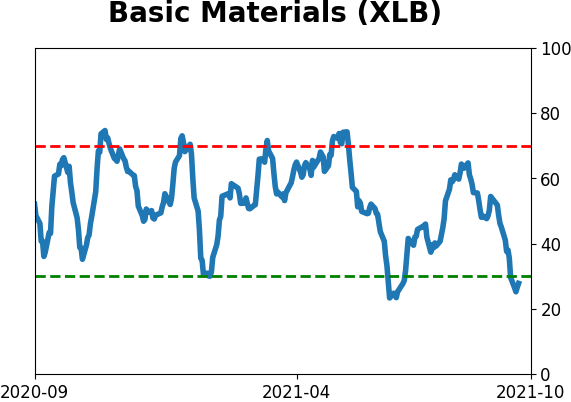
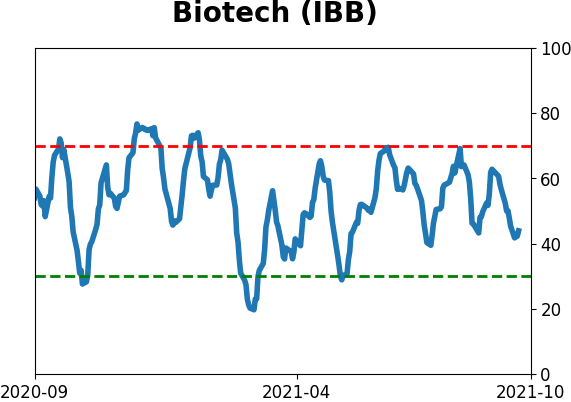
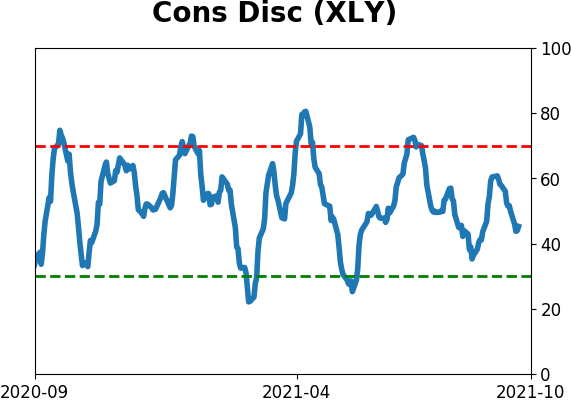
Sector ETF's - 10-Day Moving Average
|
|
|
Country ETF's - 10-Day Moving Average
|
|
|
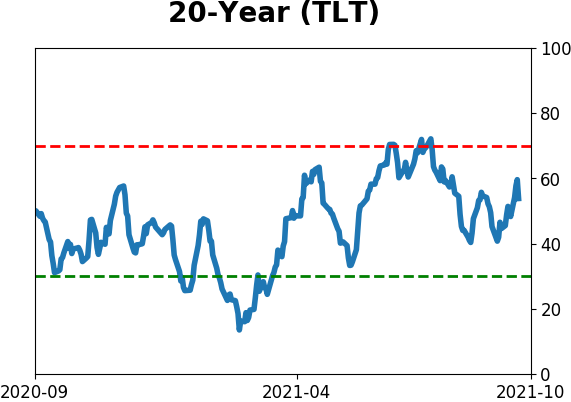
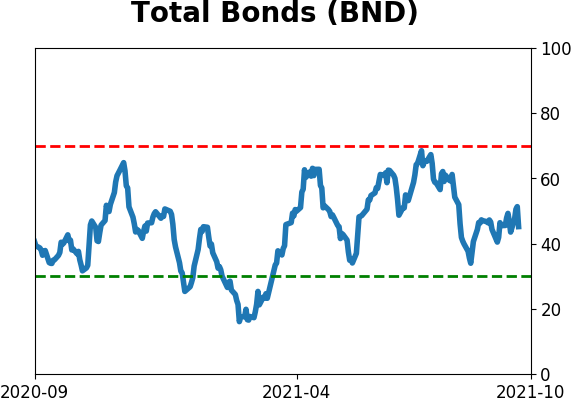
Bond ETF's - 10-Day Moving Average
|
|
|
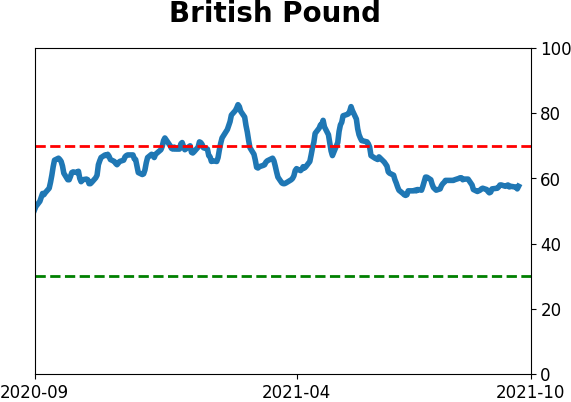
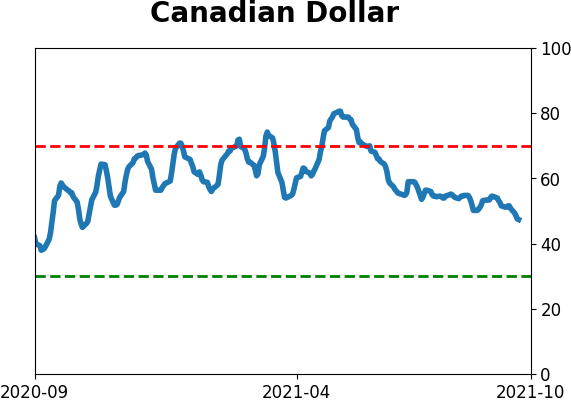
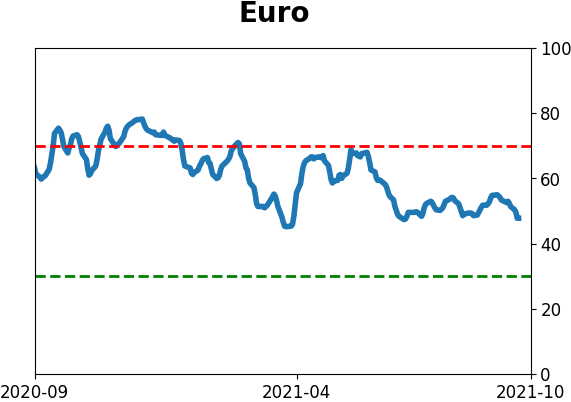
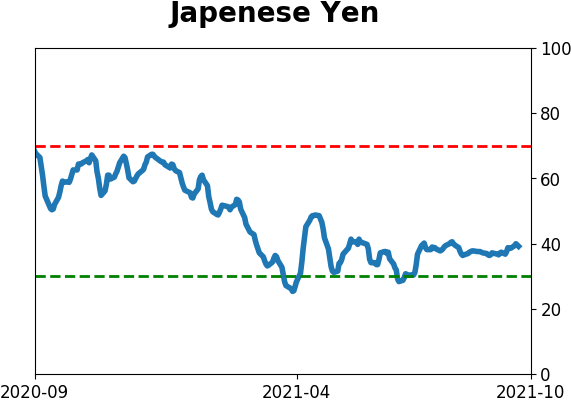
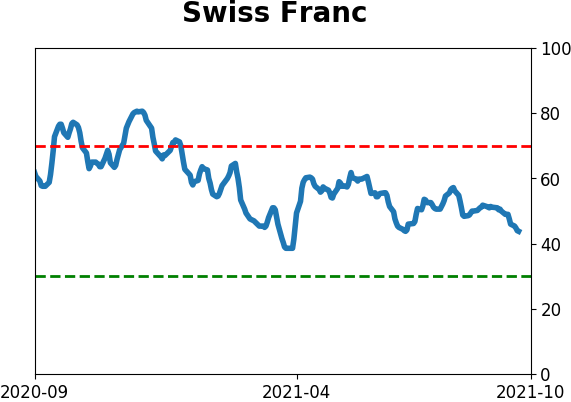
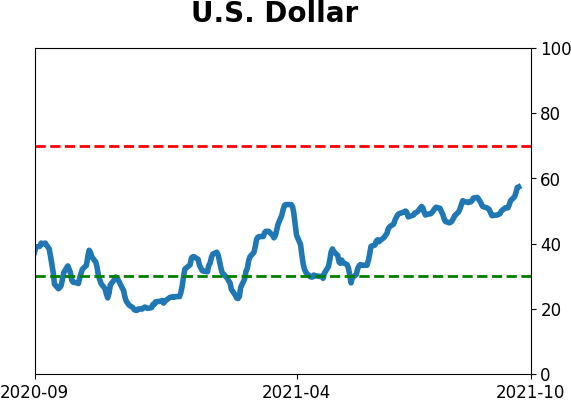
Currency ETF's - 5-Day Moving Average
|
|
|
Commodity ETF's - 5-Day Moving Average
|
|