Headlines
|
|
The S&P 500 Finally Cracks its 50-Day Average as NYSE Securities Weaken Further:
For the first time in many months, the S&P has suffered consecutive closes below its 50-day average. At the same time, fewer than 60% of securities on the NYSE have held above their 200-day averages, ending one of the longest streaks in history.
Have a Nice Week(?):
Last week we highlighted a monthly stock market anomaly that "hides in plain sight." In this piece, we focus solely on performance within a particular period during the month of September.
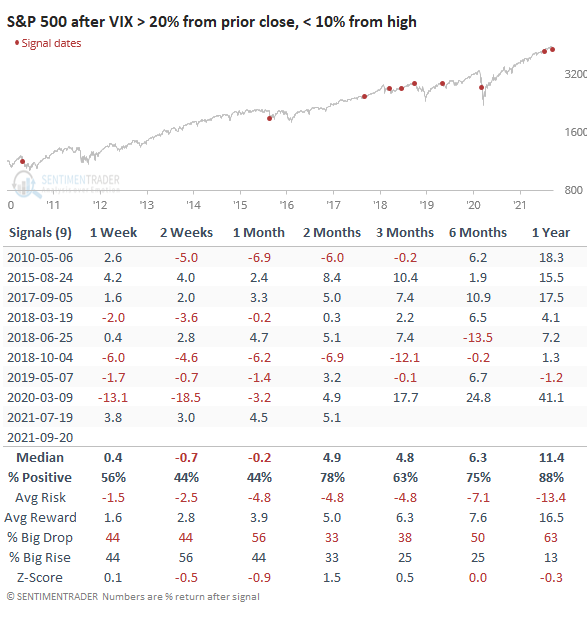
Peak in fear: Traders like to use the VIX as a substitute for fear, and if that's the case then Monday showed a spike and retreat. The VIX ended up rising more than 20% from Friday's close but was down more than 10% from its high during the day. This kind of volatility is surprisingly rare and has only occurred since 2010 (it never triggered from 1990 - 2009).
Bottom Line:
STOCKS: Hold
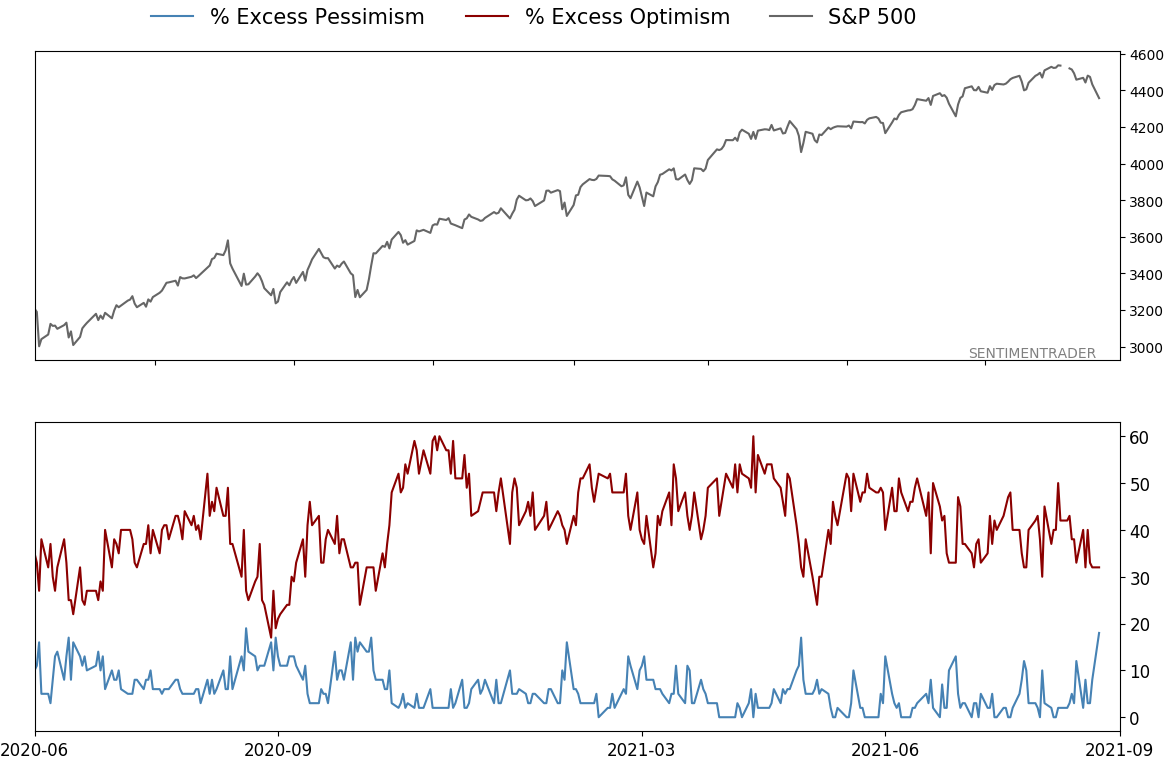
Sentiment continues to decline from the speculative February peak. With deteriorating breadth, this raises the risk of poor short- to medium-term returns until optimism and better breadth returns. See the Outlook & Allocations page for more. BONDS: Hold
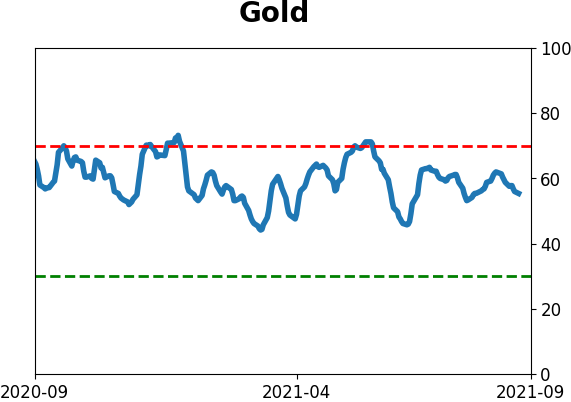
Various parts of the market got hit in March, with the lowest Bond Optimism Index we usually see during healthy environments. Bond prices have modest recovered and there is no edge among the data we follow. GOLD: Hold
Gold and miners were rejected after trying to recover above their 200-day averages in May. Lately, some medium-term (not long-term) oversold extremes in breadth measures among miners have triggered.
|
Smart / Dumb Money Confidence
|
Smart Money Confidence: 52%
Dumb Money Confidence: 50%
|
|
Risk Levels
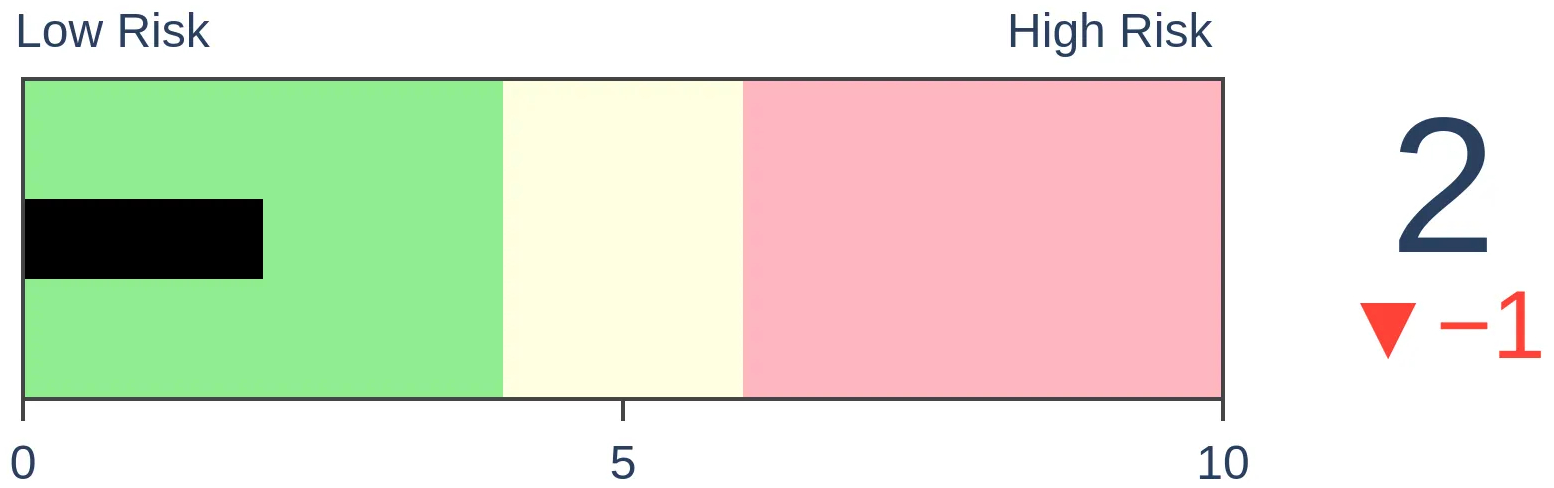
Stocks Short-Term
|
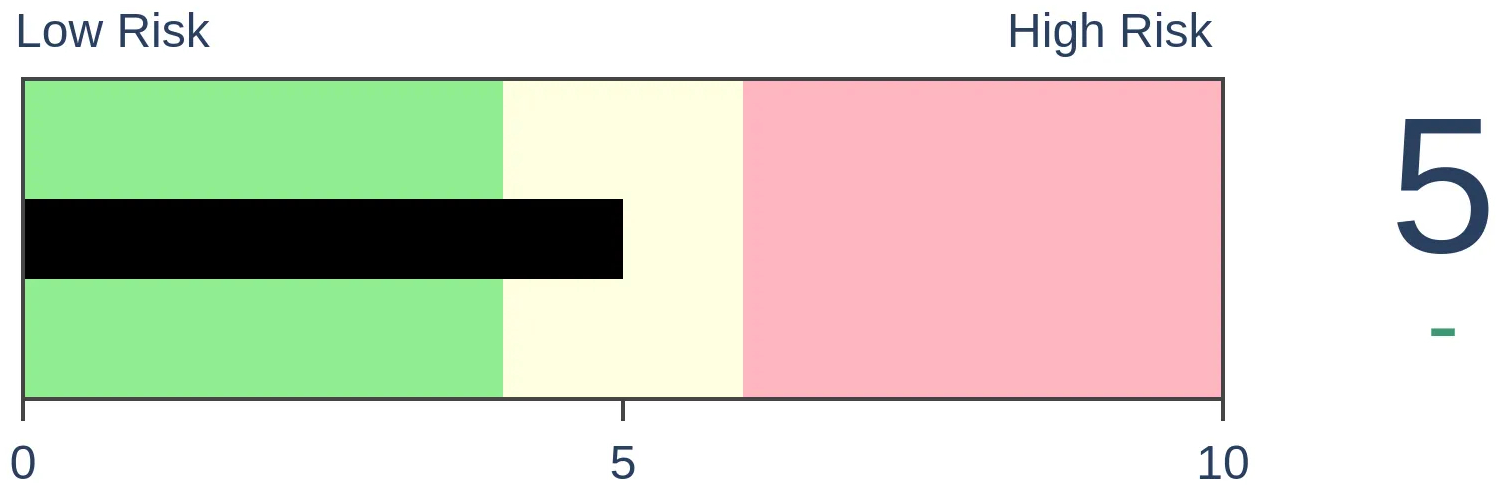
Stocks Medium-Term
|
|
Bonds

|
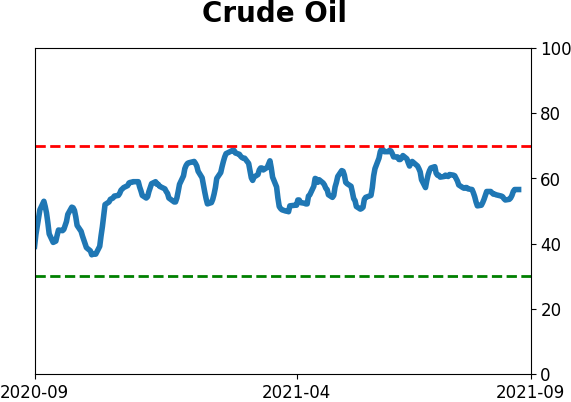
Crude Oil

|
|
Gold

|
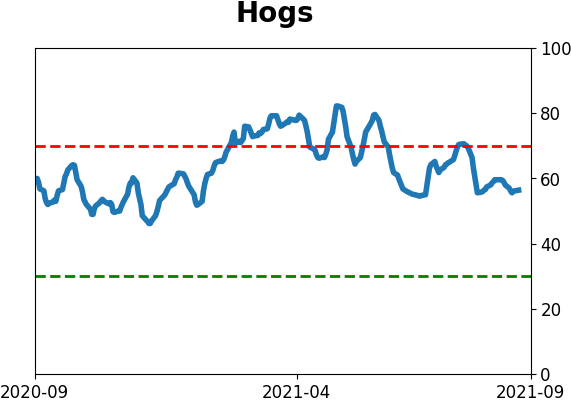
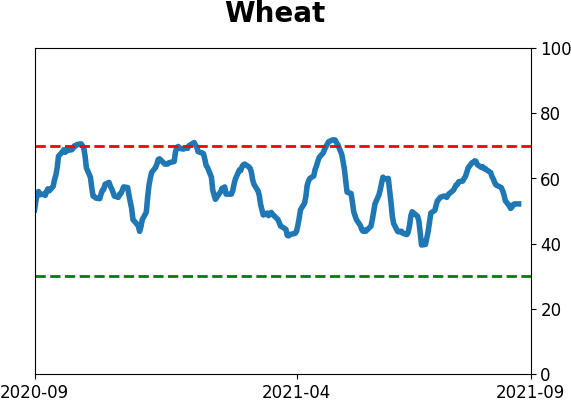
Agriculture
|
|
Research
By Jason Goepfert
BOTTOM LINE
For the first time in many months, the S&P has suffered consecutive closes below its 50-day average. At the same time, fewer than 60% of securities on the NYSE have held above their 200-day averages, ending one of the longest streaks in history.
FORECAST / TIMEFRAME
None
|
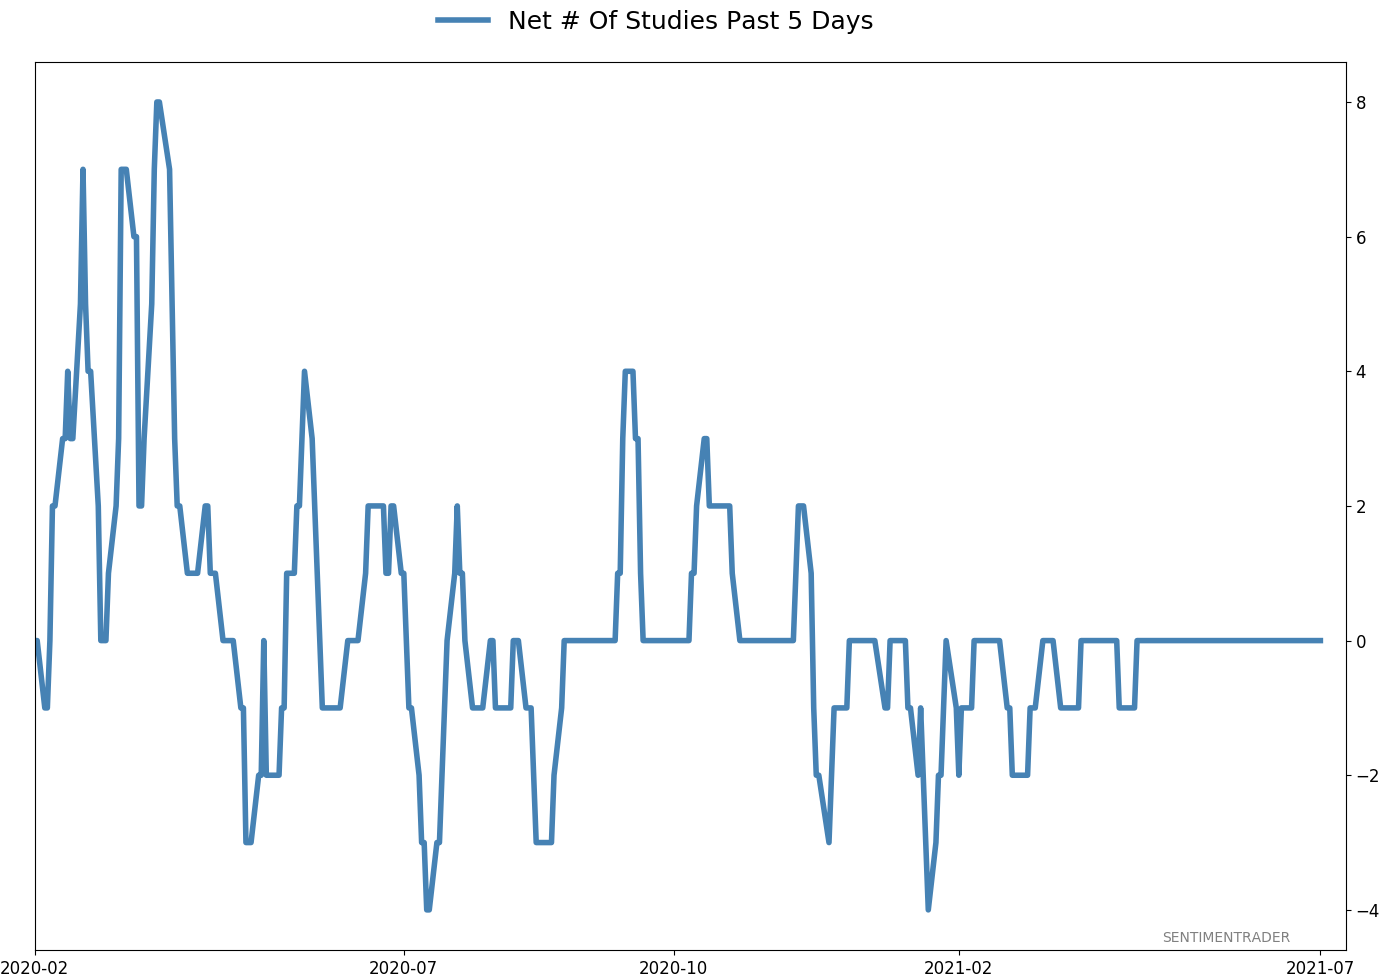
We've looked at a lot of momentum and breadth studies in recent months, with the conclusion that 2021 has been a year for the record books. The few precedents often witnessed some short-term soft spots but consistently good longer-term returns.
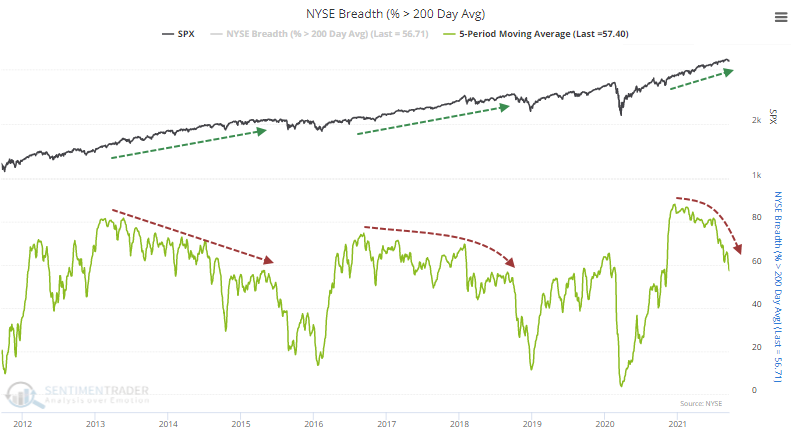
Broader market breadth has been weakening for months, but major indexes shrugged that off with ease. Among stocks traded on the NYSE, fewer and fewer have been holding above their 200-day moving averages. That happened in 2014 and 2017 as well, but it persisted for a very long time.
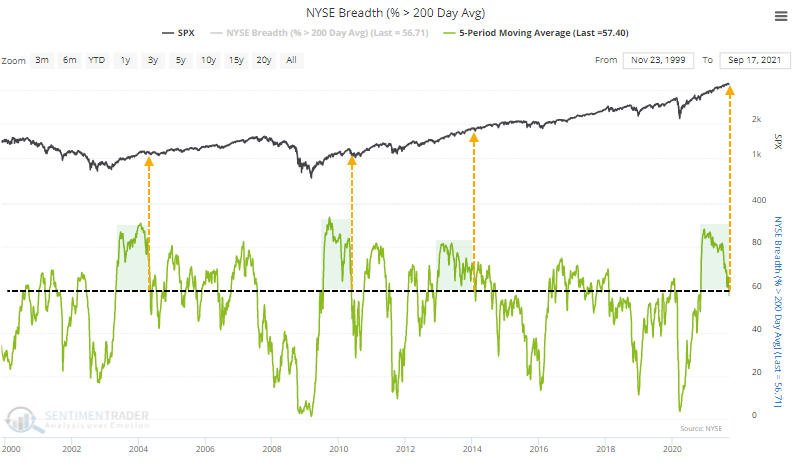
The 5-day average of this figure dropped below 60% for the first time in over 200 sessions. The only other streaks like this in the past 25 years occurred in 2004 and 2010 following the initial recoveries after bear markets, and in 2014 following the remarkable momentum market of 2013.
Going back to 1928, last week ended the 13th-longest streak since 1928.
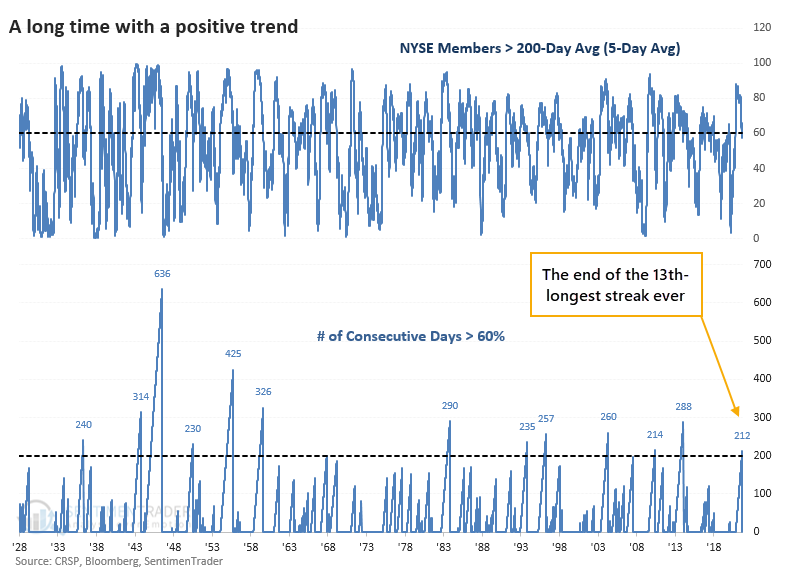
Like we've seen with most of the other studies that looked at long-term momentum and positive breadth, the ends of streaks like this typically did not morph into something more serious. Out of the 12 precedents, only one preceded a double-digit decline over any time frame.
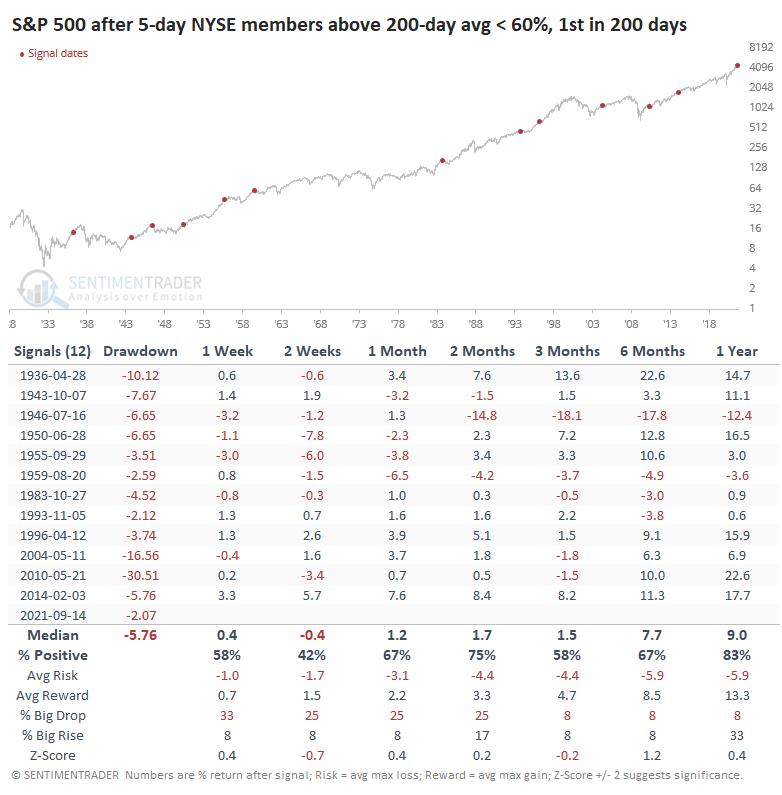
When the other long streaks ended, the S&P 500 was an average of 5.8% below a multi-year high at the time (the "Drawdown" column in the above table). When the streak ended last week, the S&P was only 2.1% from its peak, the shallowest pullback of all.
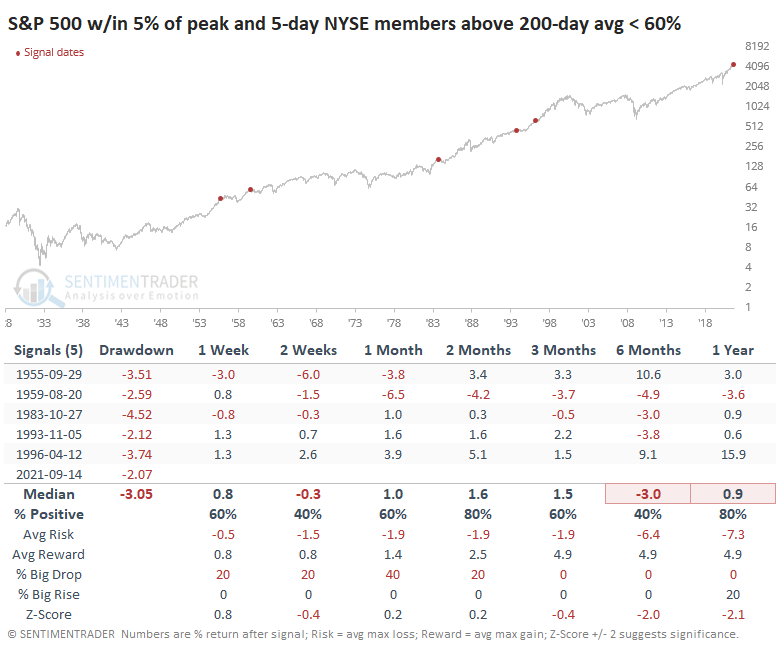
The others saw some back-and-forth trading activity in the weeks ahead but with primarily positive resolutions. With such a tiny sample size, it's hard to draw any solid conclusions, but again, none of them augured bear markets or even corrections.
While many securities have been pulling back, indexes like the S&P 500 have held firm. But barring a remarkable turnaround, today will mark the S&P's first back-to-back closes below its 50-day moving average in over 200 sessions. That ends the 4th-longest streak since 1928.
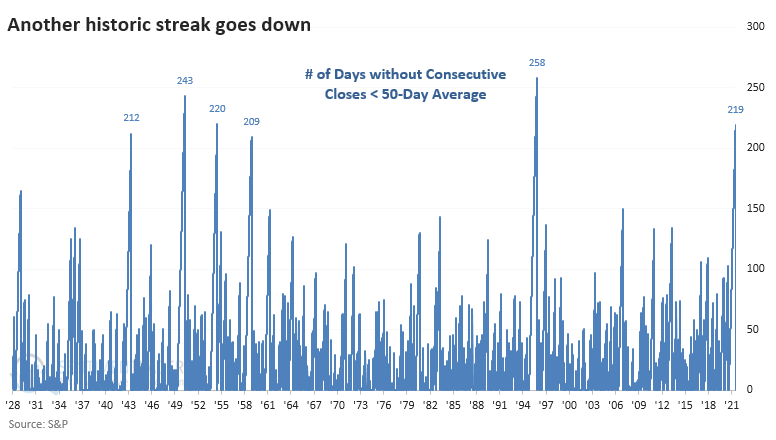
The ends of the other longer streaks showed that the dip was just that - a temporary dip.
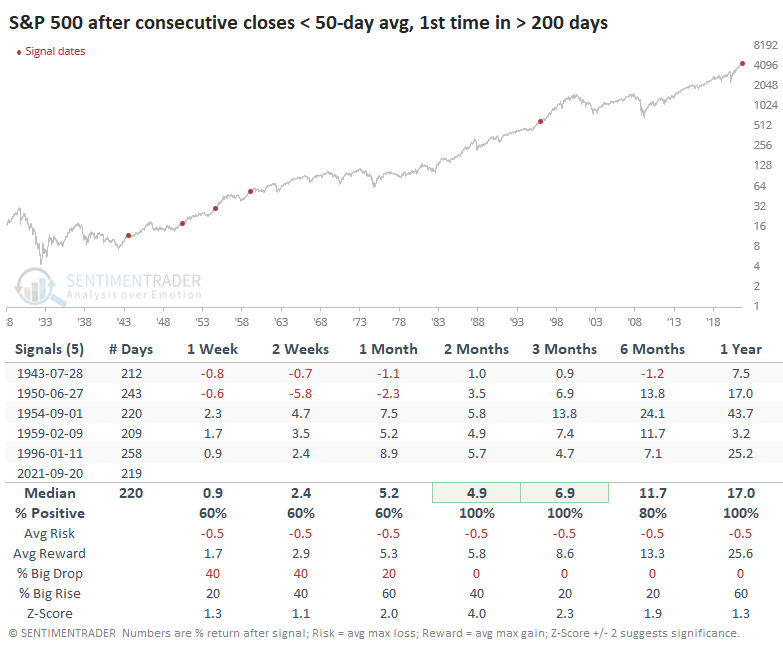
Even if we relax the parameters to look at "only" six months without consecutive closes below the 50-day, the S&P showed no losses over the next 2-3 months.
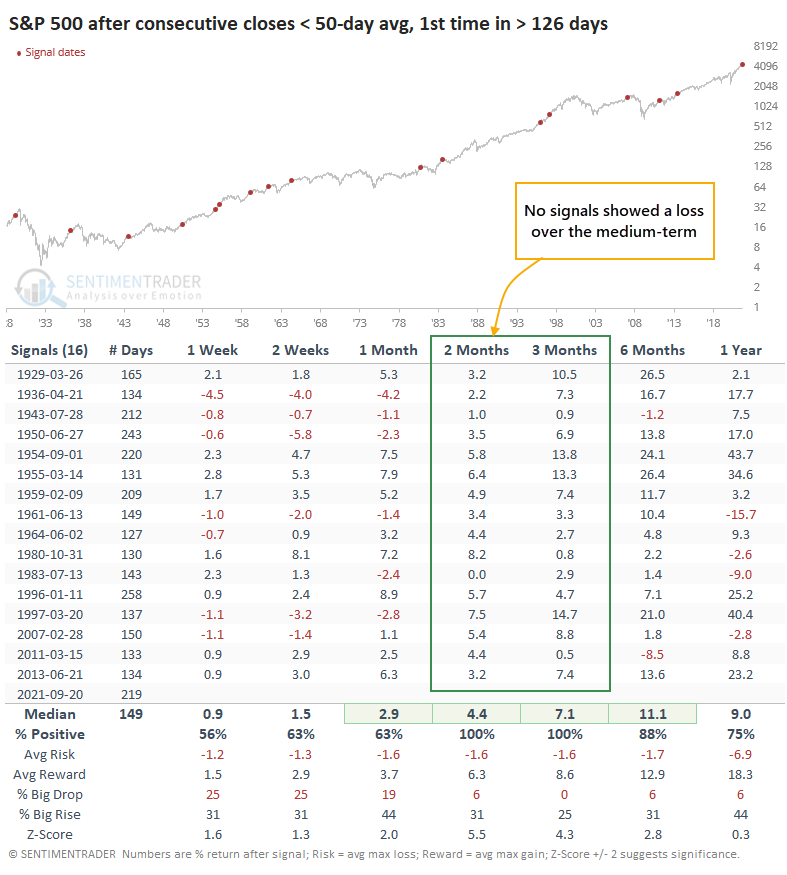
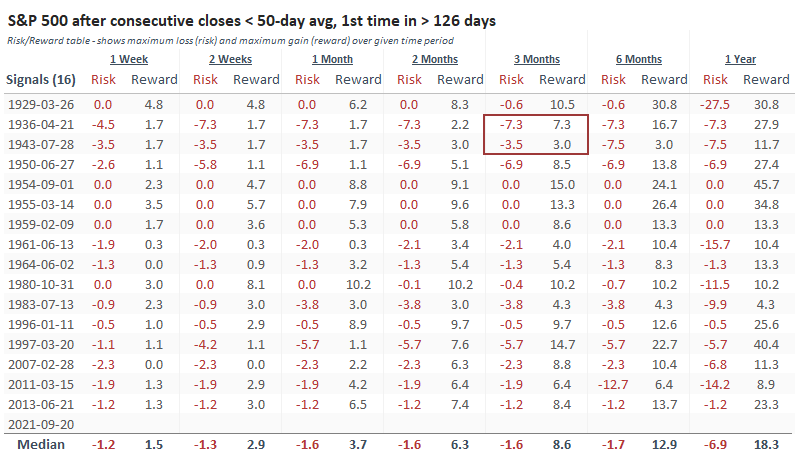
The Risk/Reward Table shows that 14 out of 16 signals offered more reward (maximum gain) than risk (maximum decline) over the next three months, and both of those losers were *just barely*.
The deterioration in breadth in recent months has contributed to a sense of unease. Still, some of those conditions were evident earlier in the year and resolved to the upside. Now that we finally see some cracks in the more widely-followed indexes, it seems to be weighing on sentiment more than some of the obscure declines did.
That raises the risks in the short-term, but we've seen time and again that the ends of vast gobs of momentum and positive trends rarely, if ever, precede significant and sustained declines. That would support the idea that whatever selling pressure hits now and in the coming weeks, for whatever fundamental reason given as an excuse, will be met with latent buying interest as investors sense their first potential bargains in a year.
By Jay Kaeppel
BOTTOM LINE
Last week we highlighted a monthly stock market anomaly that "hides in plain sight." In this piece, we focus solely on performance within a particular period during the month of September.
FORECAST / TIMEFRAME
None
|
In this article last week, I wrote about a little know seasonal anomaly that "hides in plain sight." In this piece, we will focus solely on this anomaly during the month of September.
THE DAYS
As I detailed last week:
- The last trading day of the month is designated as TDM -1
- The next to last trading day is TDM -2
- The day before that is TM -3
- Etc.
The period we are focusing on includes TDM -10 through TDM -5. The chart below displays:
- The percentage + (-) price change for the S&P 500
- During this 6-trading day period
- ONLY during the month of September
- Since 1931
Things to Note:
- # of times UP = 35
- # of times DOWN = 54
- # times Unchanged = 1
- Ave UP = +1.83%
- Ave DOWN = (-2.36%)
- # of UPs +4% or more = 3
- # of DOWN -4% or more = 10
If your first inkling is that these results are not too good, you are correct. The chart below displays the cumulative % price gain/loss for the S&P 500 Index if held long ONLY during this 6-trading day period every year since 1931.
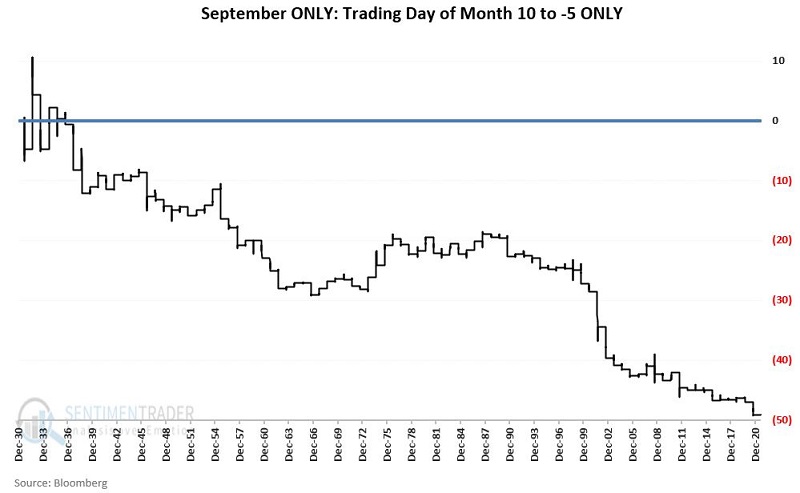
The cumulative loss through 2020 is -49.2%.
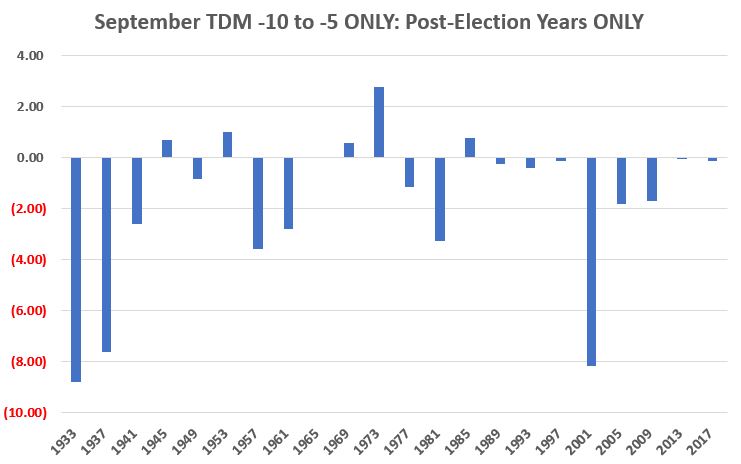
SEPTEMBER OF POST-ELECTION YEARS ONLY
Let's now focus solely on performance during post-election years (1933, 1937, 1941, etc.) to drill a little deeper.
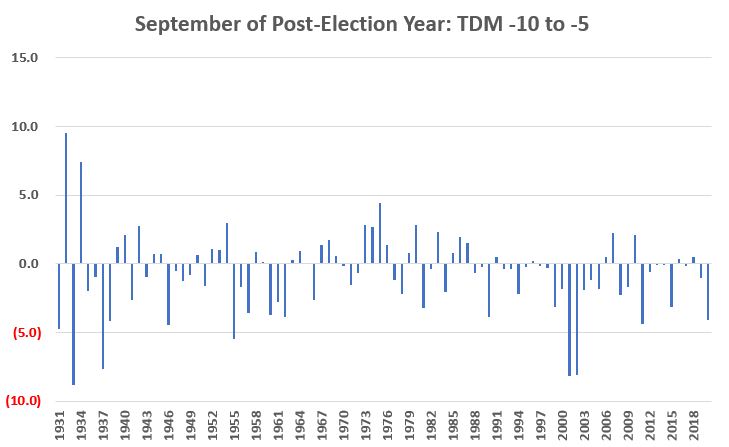
The chart below displays:
- The percentage + (-) price change for the S&P 500
- During this 6-trading day period
- ONLY during September within Post Presidential Election years
- Since 1931
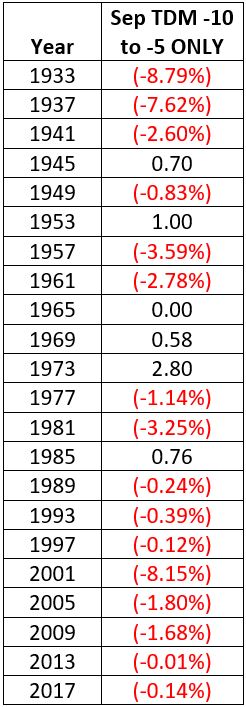
The table below displays the results from the chart above in numerical format.
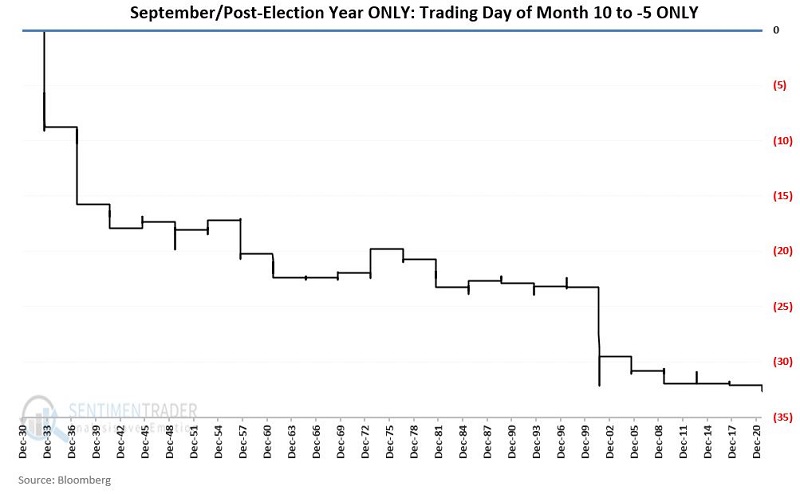
Finally, the chart below displays the cumulative % price gain/loss for the S&P 500 Index if held long:
- ONLY during this 6-trading day period
- ONLY during September
- ONLY within post-election years
Things to Note:
- # of times UP = 5
- # of times DOWN = 16
- # times Unchanged
- Ave UP = +1.17%
- Ave DOWN = (-2.70%)
- Max % UP = +2.80% (1973)
- Max % DOWN = (-8.79%) (1933)
2021
2021 is a post-election year. During September of 2021, this seasonally unfavorable period extends:
- From the close on Thursday 9/16
- Through the close on Friday 9/24
SUMMARY
Since 1931 there have been 22 post-elections years. During our 6-day unfavorable period within the month of September during those 22 years, the S&P 500 Index has managed a gain only five times (23%).
Does this mean that the stock market is doomed to decline this week? Not at all. The stock market has shown historical resilience in 2021, and the most recent dip could easily be just another "buy the dip" opportunity.
That said, it is interesting to note that a period of seasonal weakness on the Annual Seasonal Trend chart for the S&P 500 Index below is just beginning.
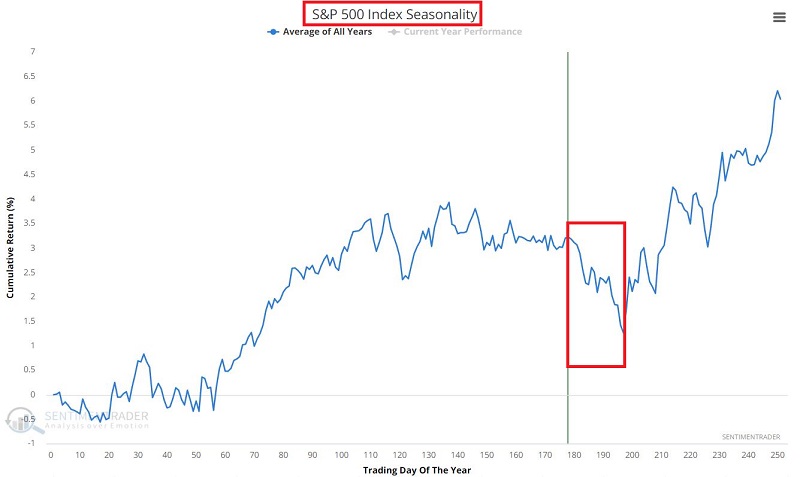
All-in-all, traders ought to be prepared for anything in the near term.
Active Studies
| Time Frame | Bullish | Bearish | | Short-Term | 0 | 6 | | Medium-Term | 5 | 3 | | Long-Term | 11 | 5 |
|
Indicators at Extremes
Portfolio
| Position | Description | Weight % | Added / Reduced | Date | | Stocks | RSP | 4.1 | Added 4.1% | 2021-05-19 | | Bonds | 23.9% BND, 6.9% SCHP | 30.7 | Reduced 7.1% | 2021-05-19 | | Commodities | GCC | 2.6 | Reduced 2.1%
| 2020-09-04 | | Precious Metals | GDX | 5.6 | Reduced 4.2% | 2021-05-19 | | Special Situations | 4.3% XLE, 2.2% PSCE | 7.6 | Reduced 5.6% | 2021-04-22 | | Cash | | 49.4 | | |
|
Updates (Changes made today are underlined)
Much of our momentum and trend work has remained positive for several months, with some scattered exceptions. Almost all sentiment-related work has shown a poor risk/reward ratio for stocks, especially as speculation drove to record highs in exuberance in February. Much of that has worn off, and most of our models are back toward neutral levels. There isn't much to be excited about here. The same goes for bonds and even gold. Gold has been performing well lately and is back above long-term trend lines. The issue is that it has a poor record of holding onto gains when attempting a long-term trend change like this, so we'll take a wait-and-see approach. RETURN YTD: 8.1% 2020: 8.1%, 2019: 12.6%, 2018: 0.6%, 2017: 3.8%, 2016: 17.1%, 2015: 9.2%, 2014: 14.5%, 2013: 2.2%, 2012: 10.8%, 2011: 16.5%, 2010: 15.3%, 2009: 23.9%, 2008: 16.2%, 2007: 7.8%
|
|
Phase Table
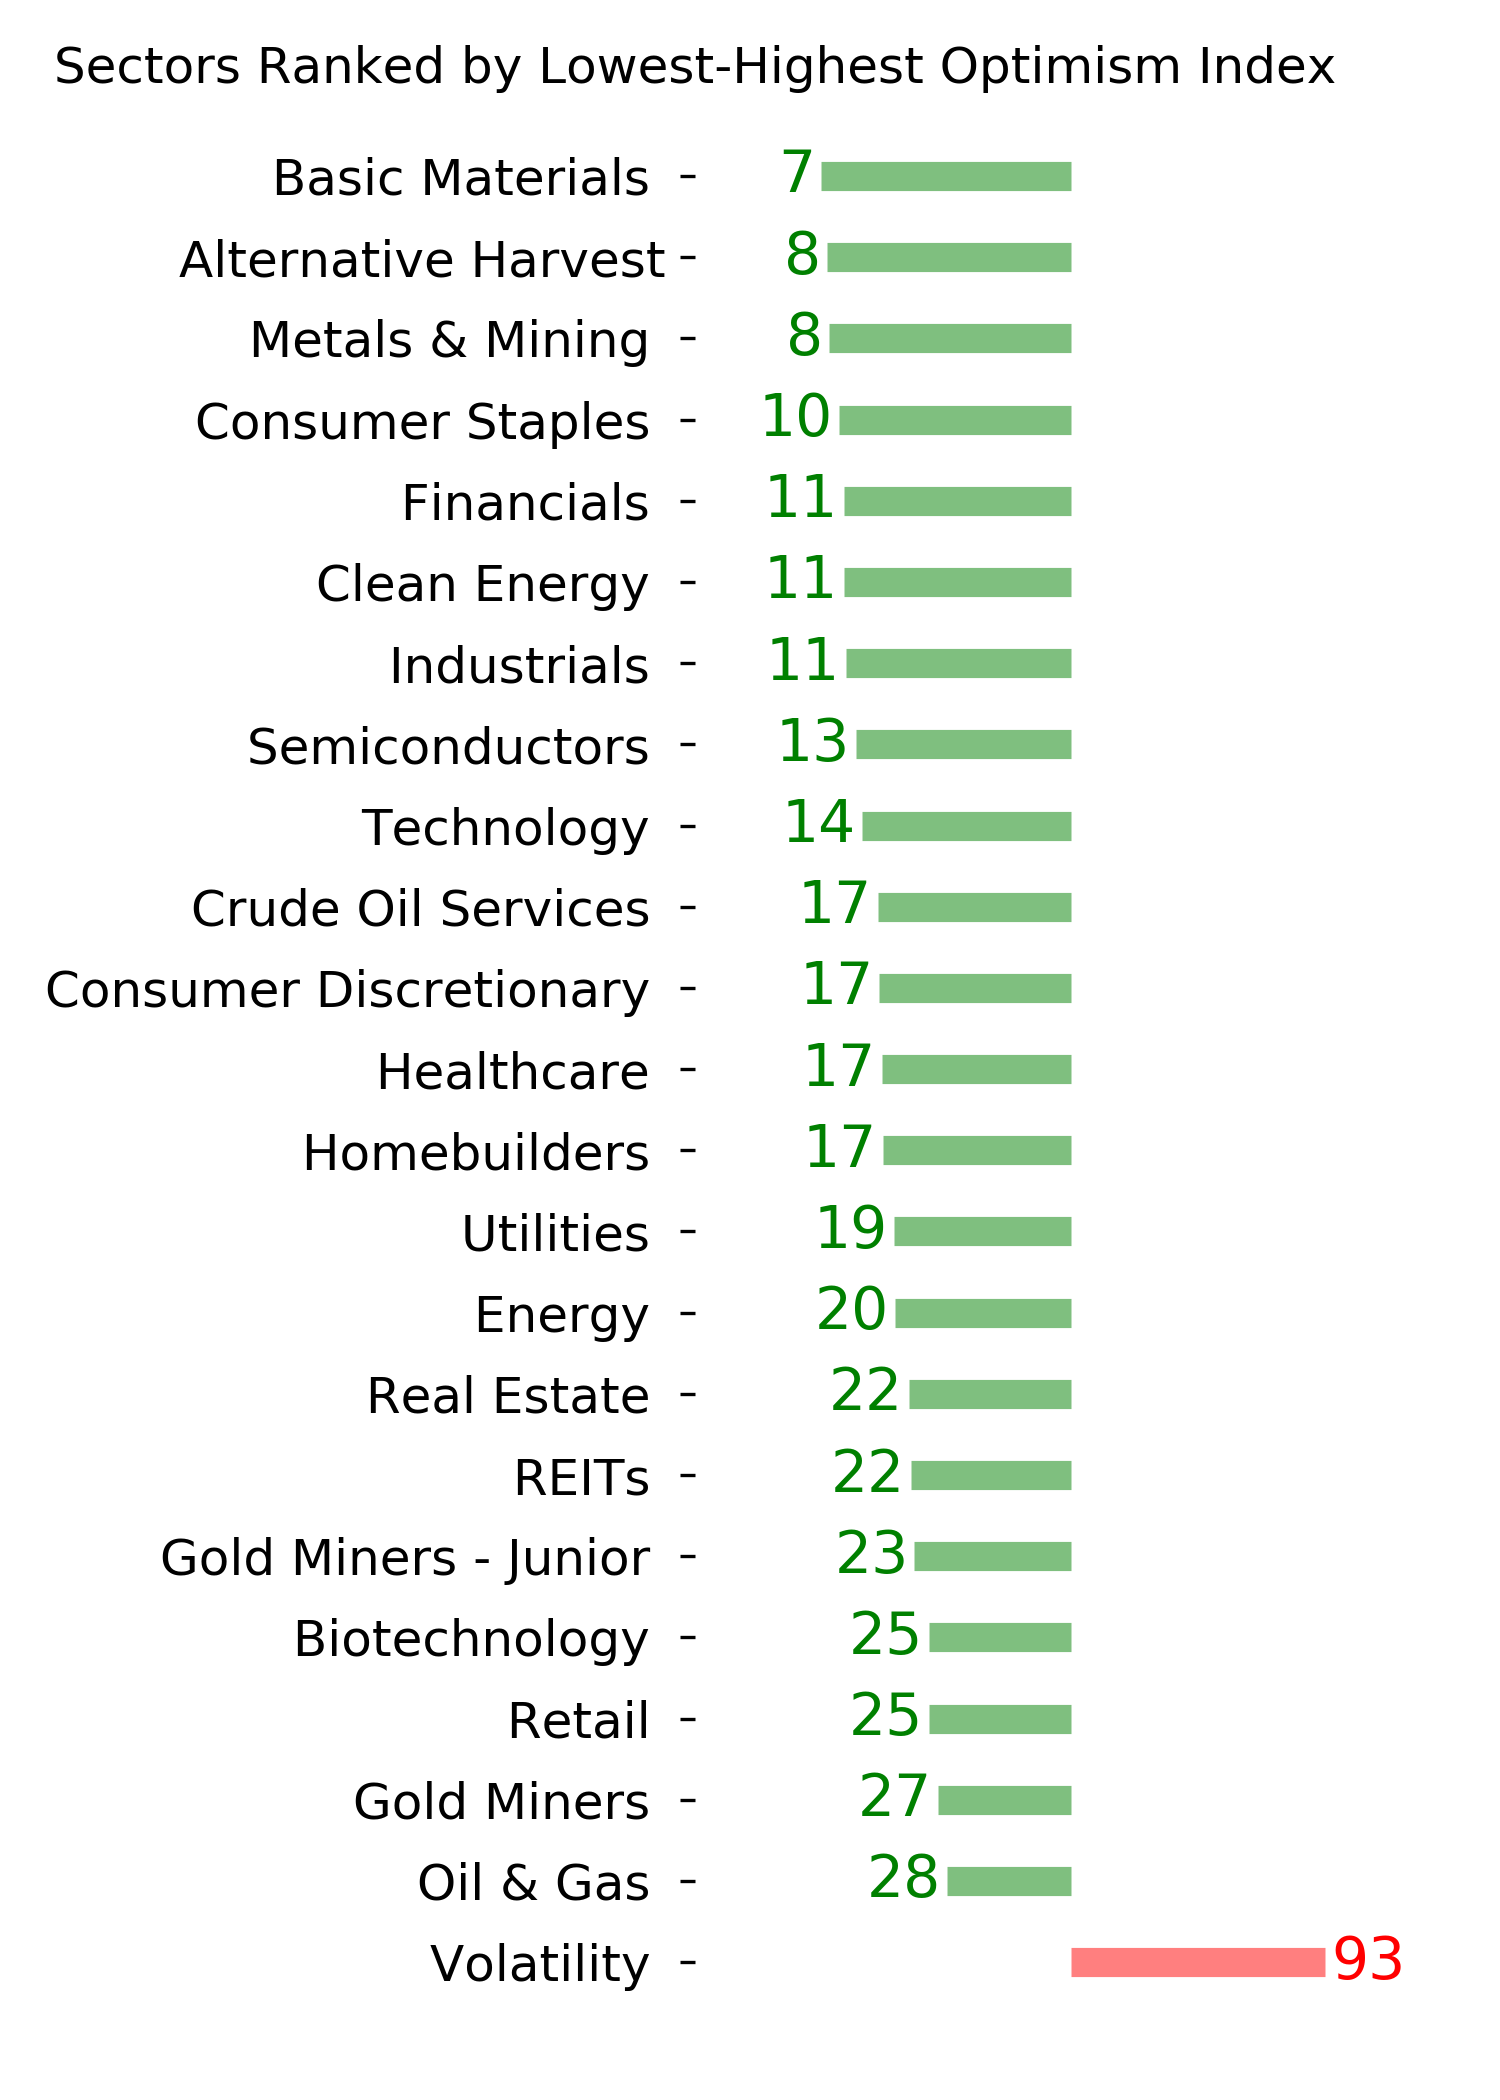
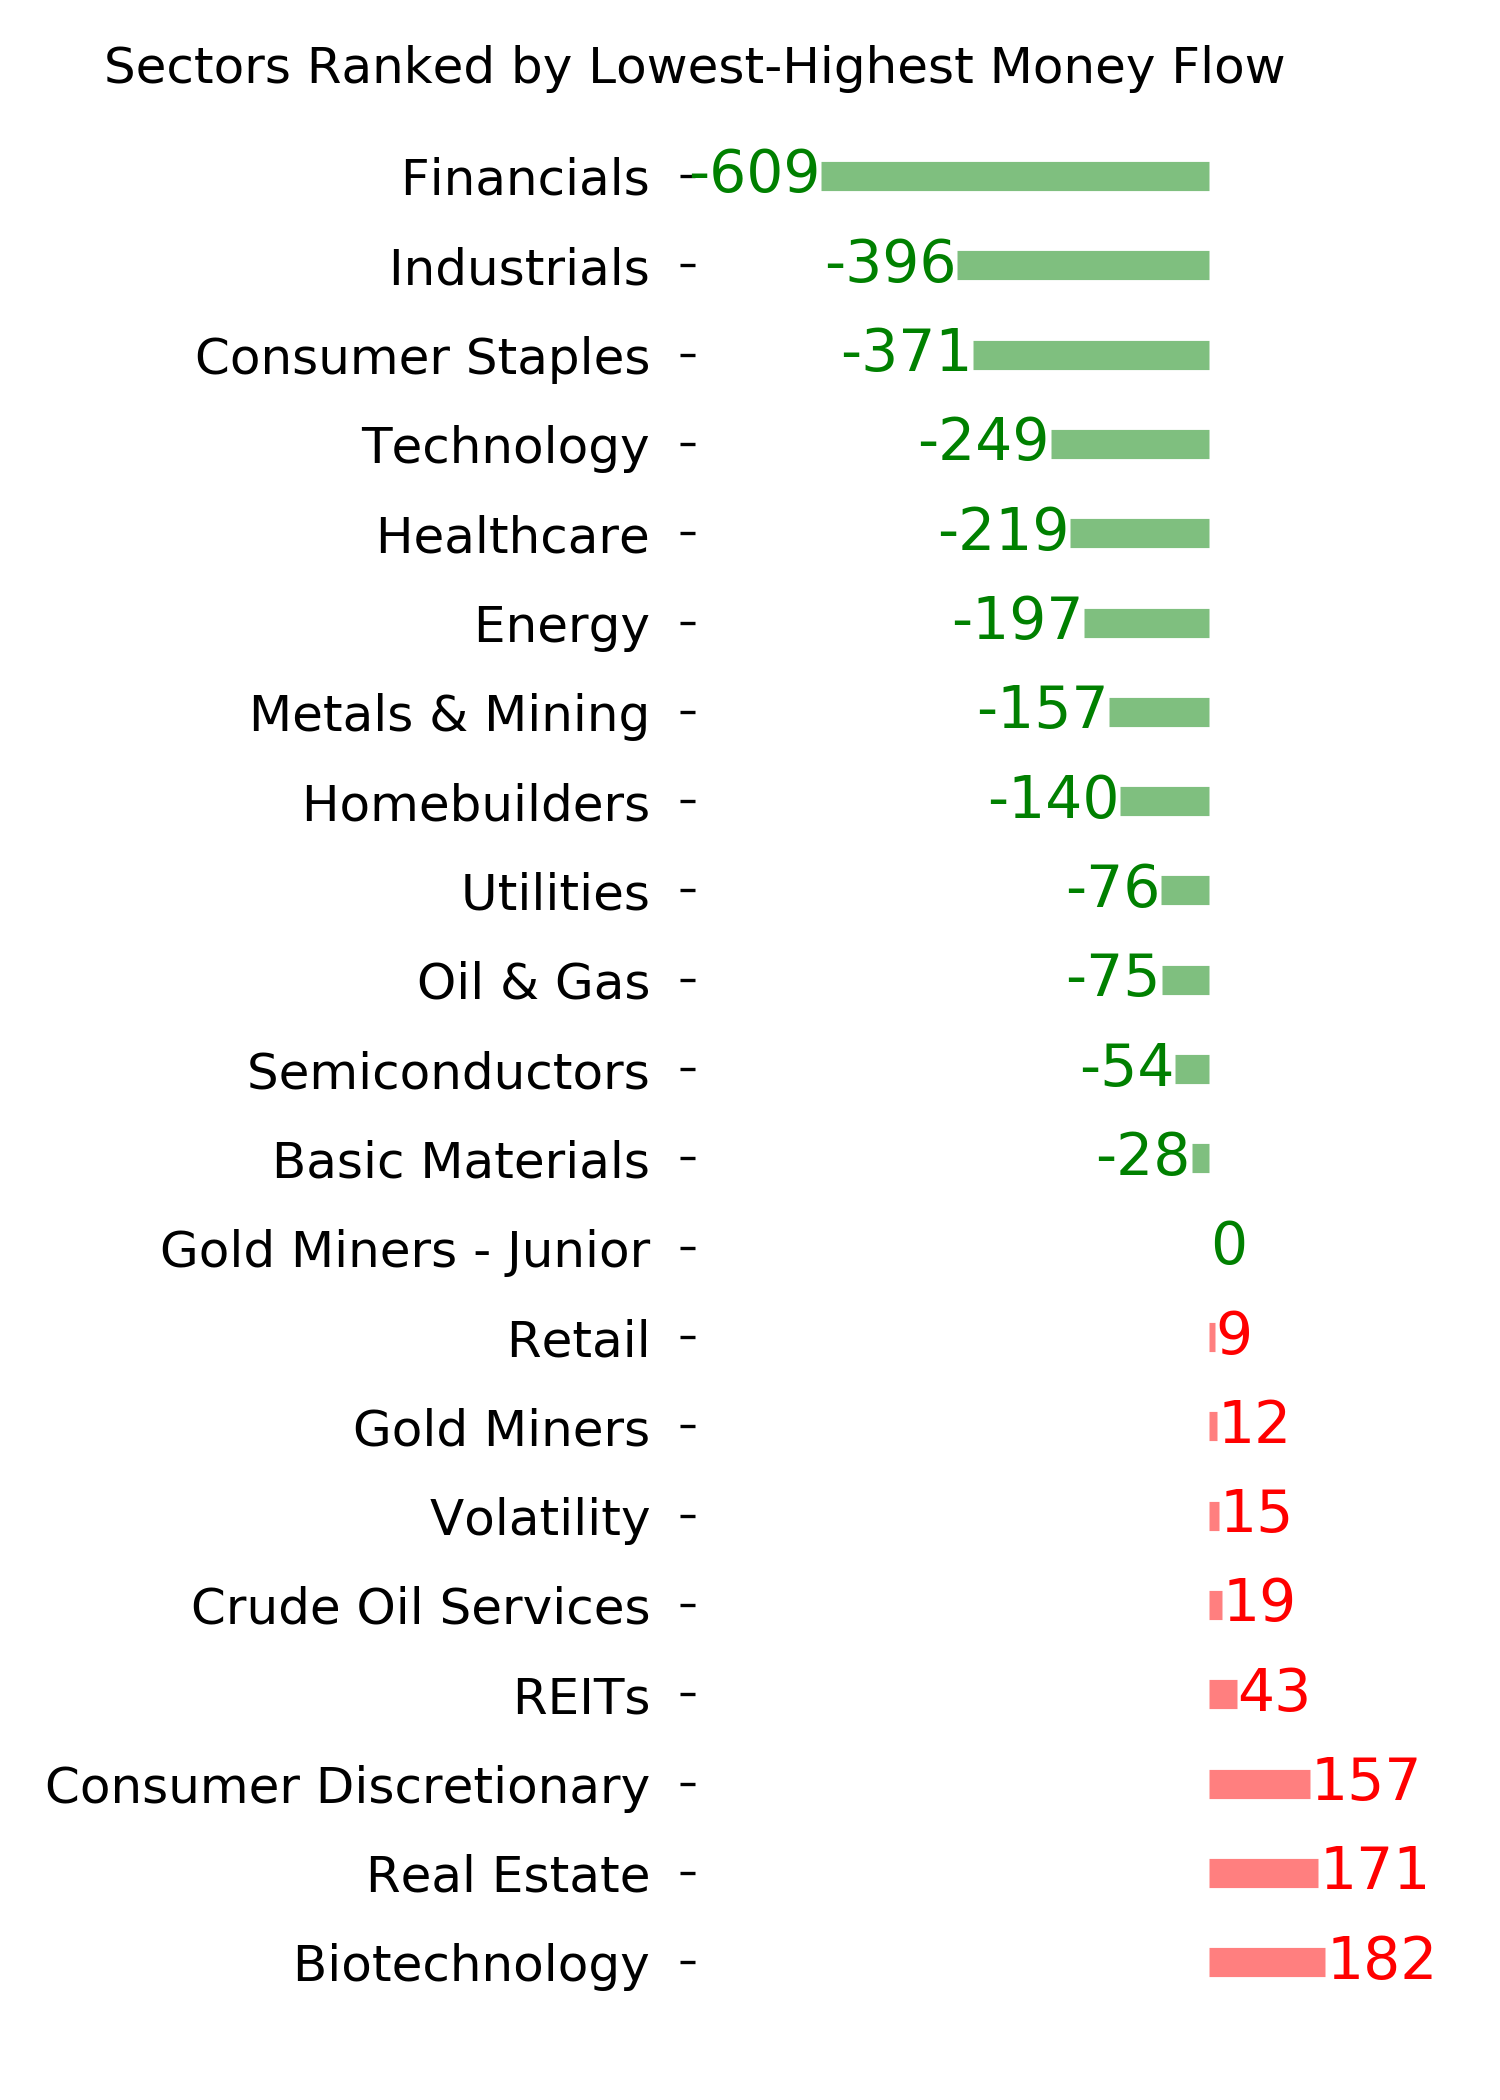
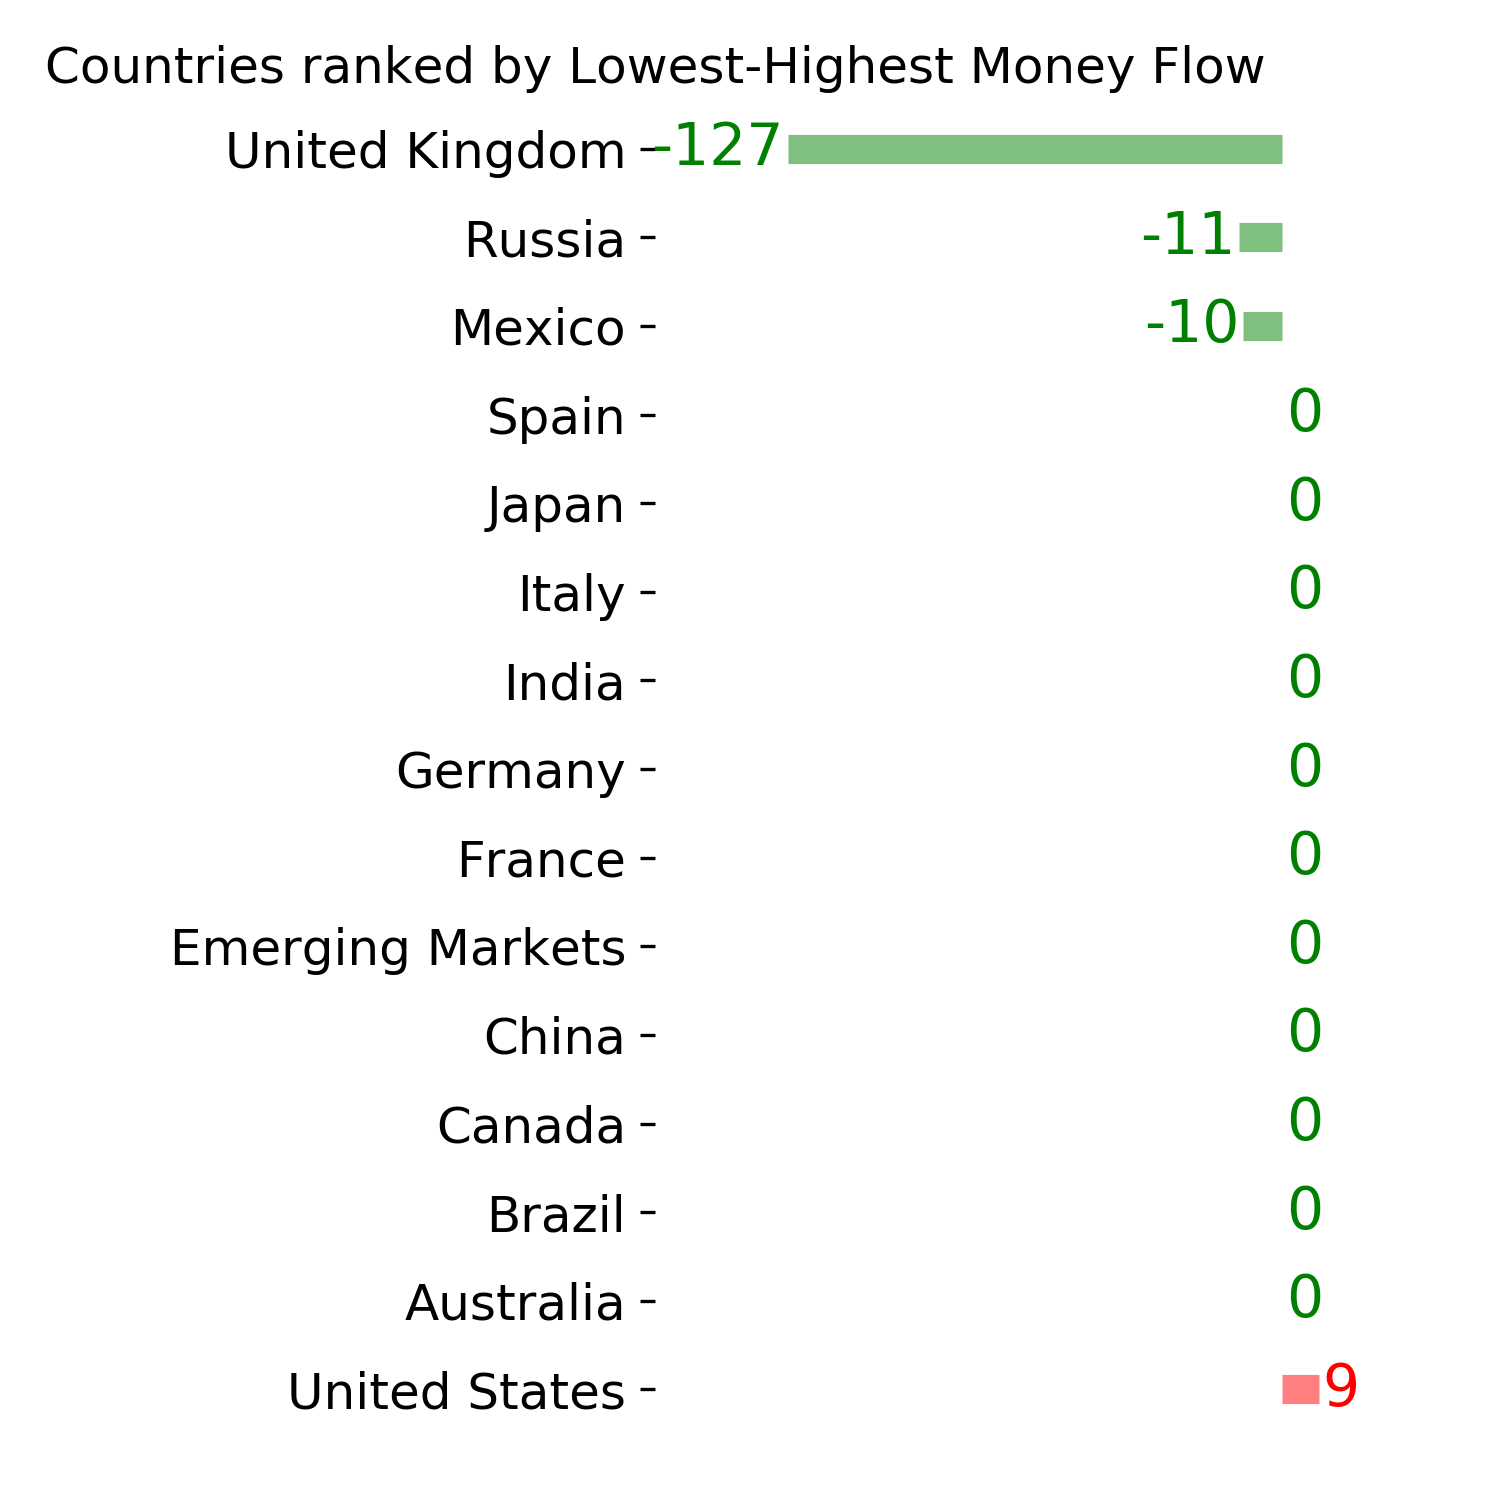
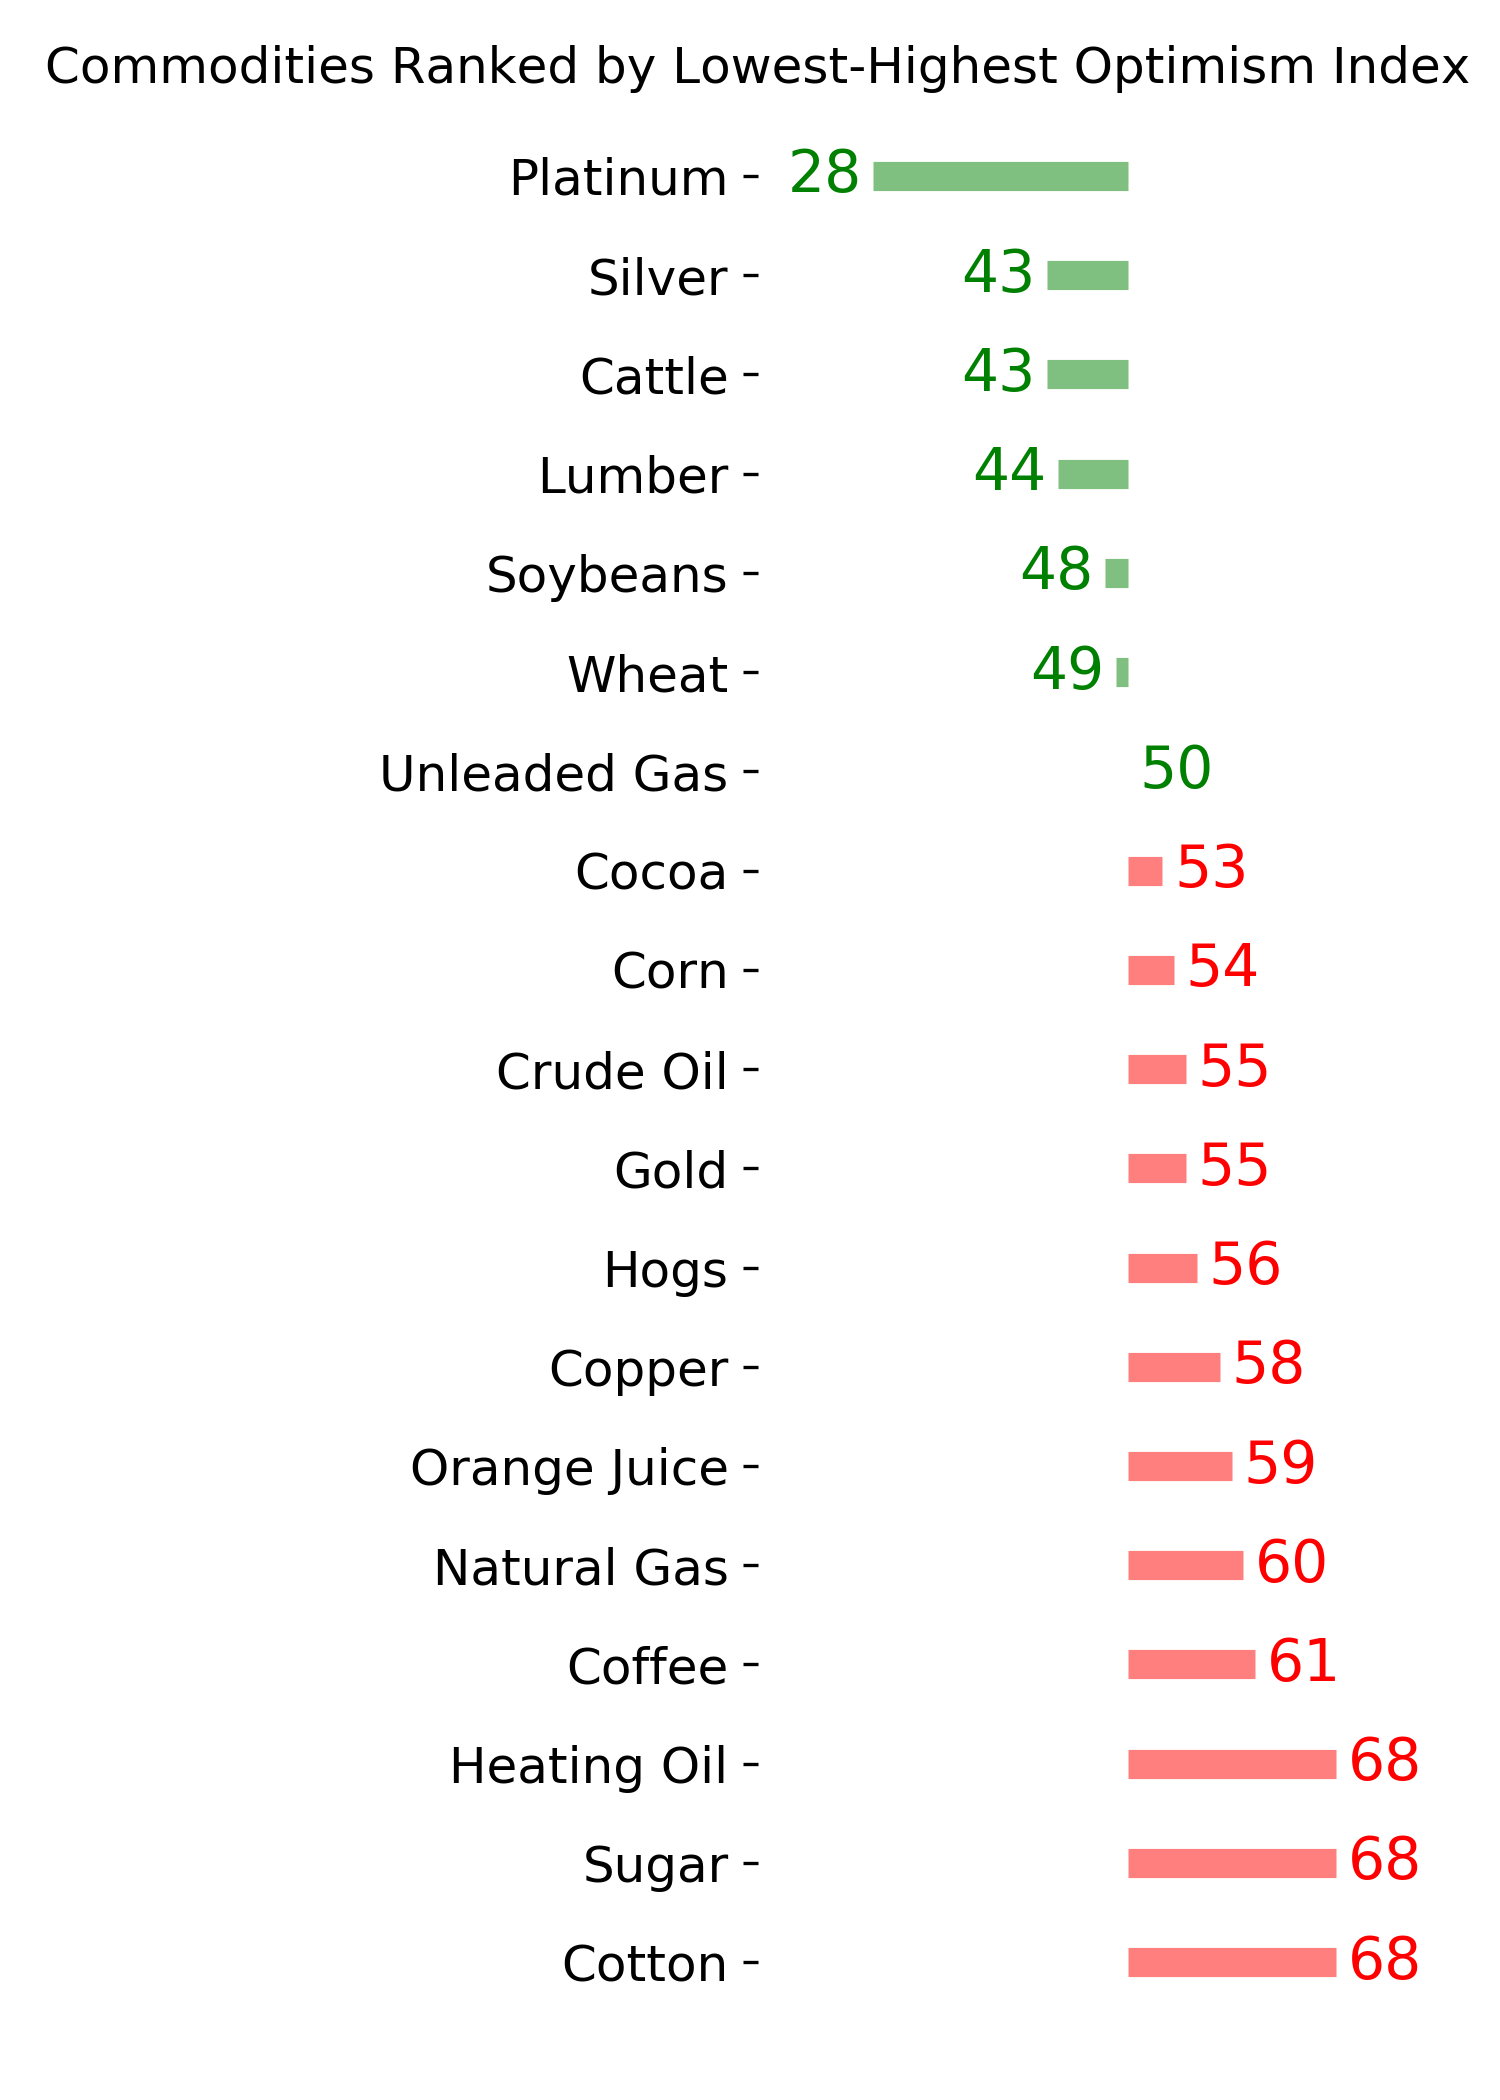
Ranks
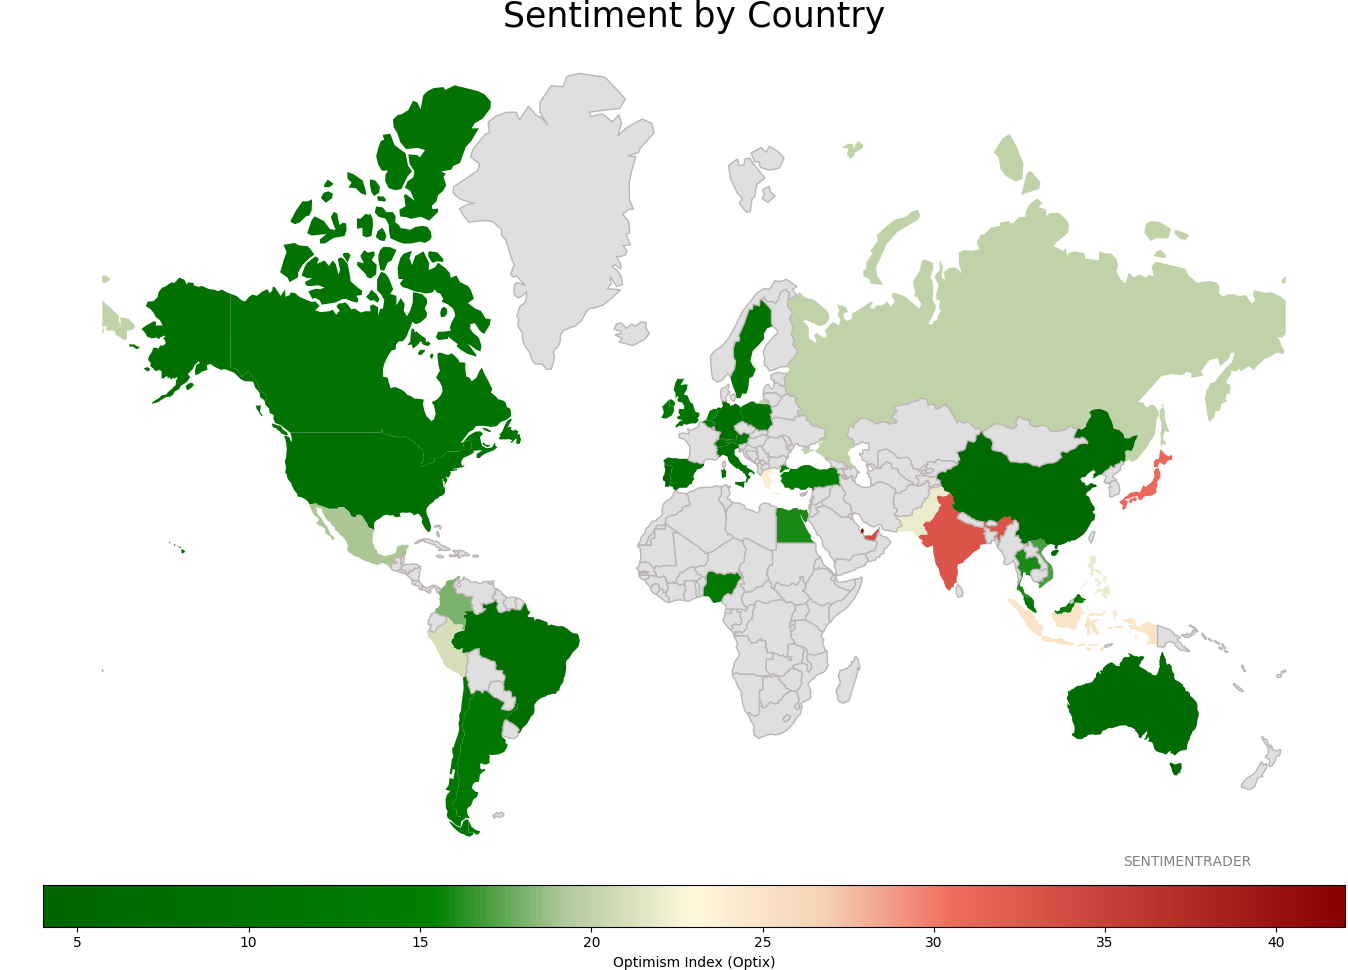
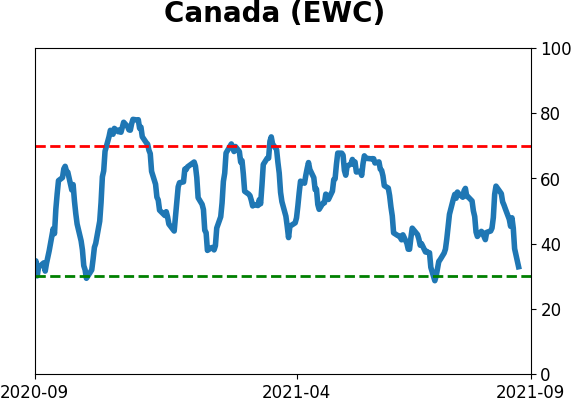
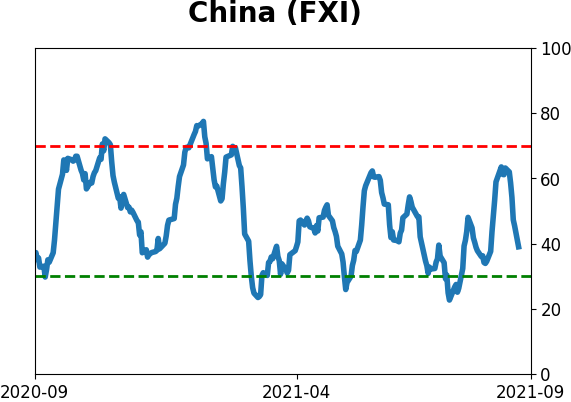
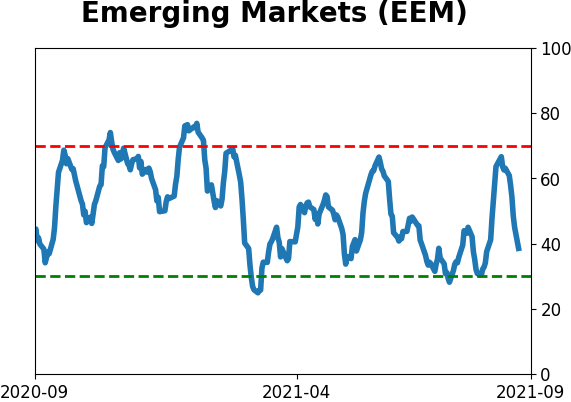
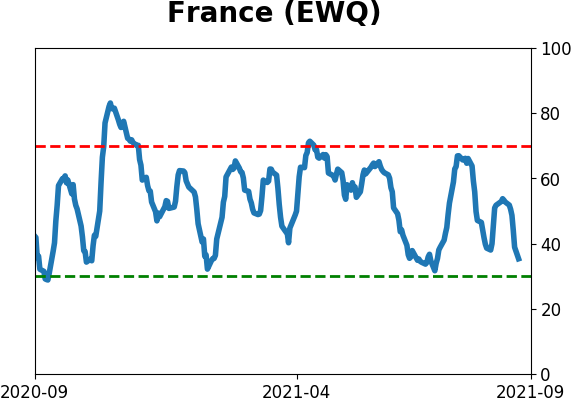
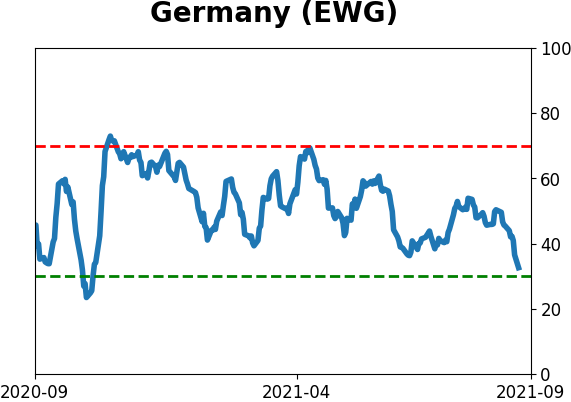
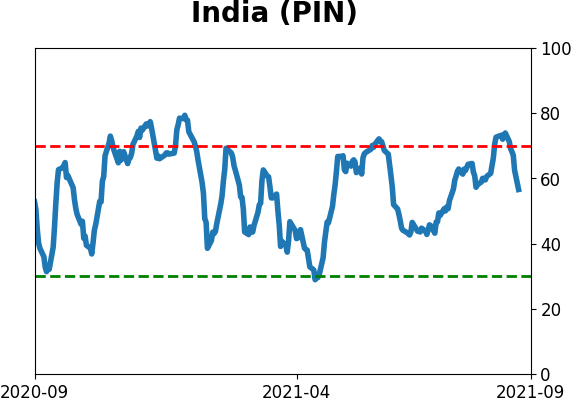
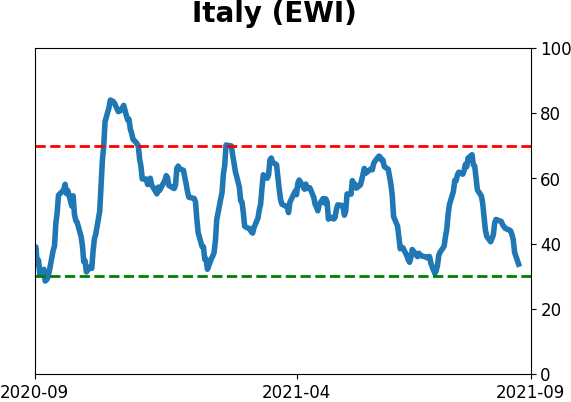
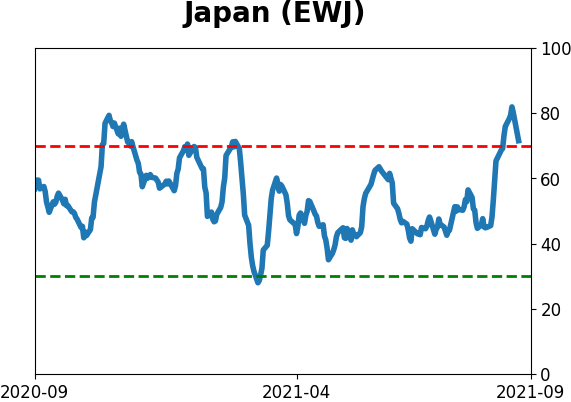
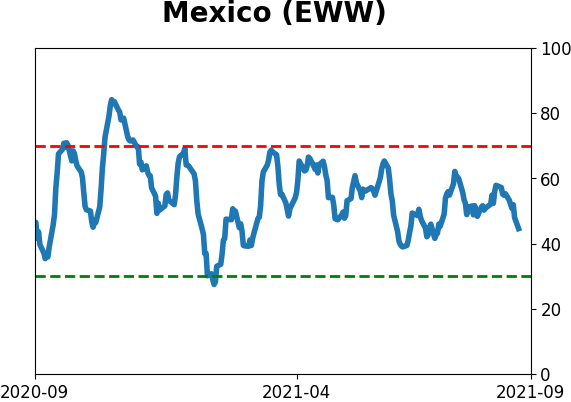
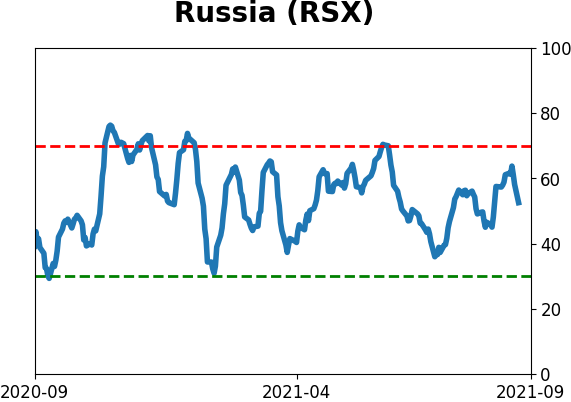
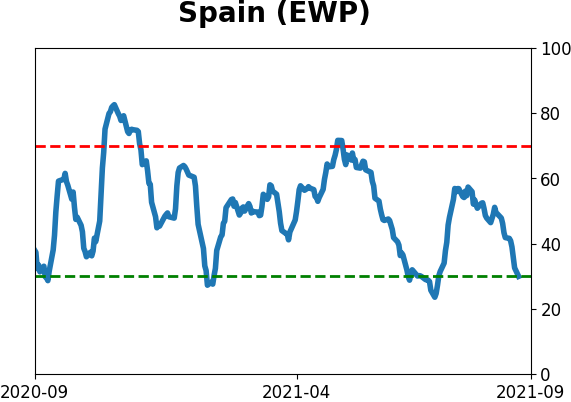
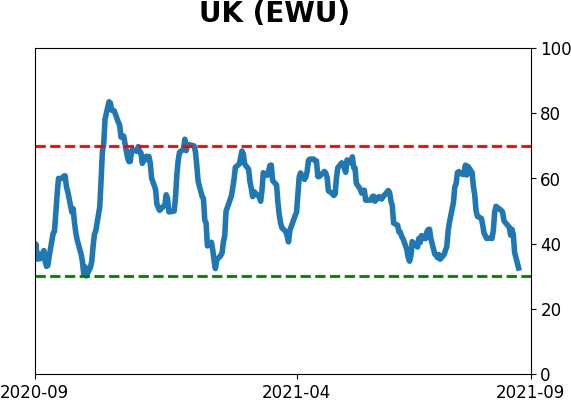
Sentiment Around The World
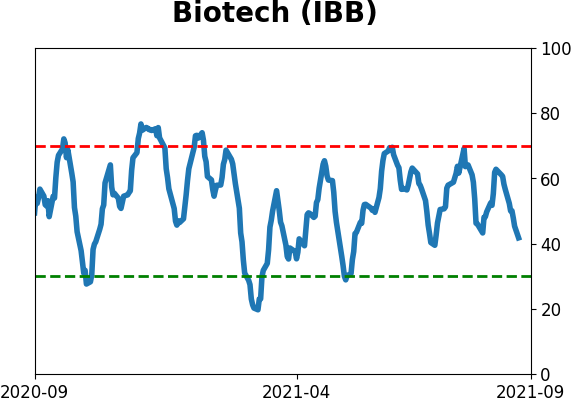
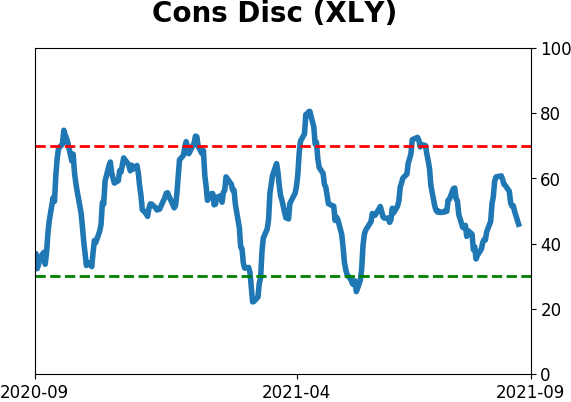
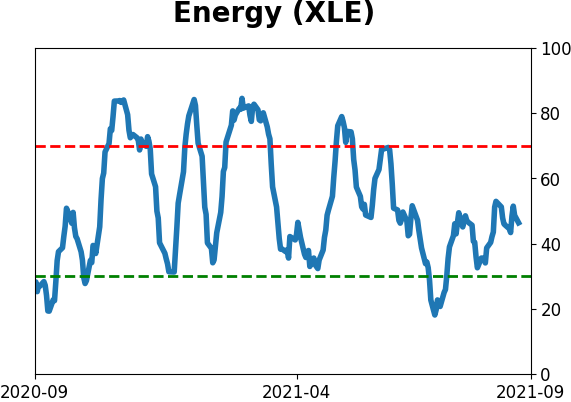
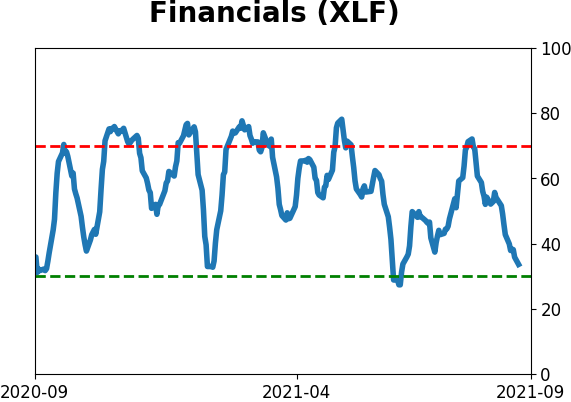
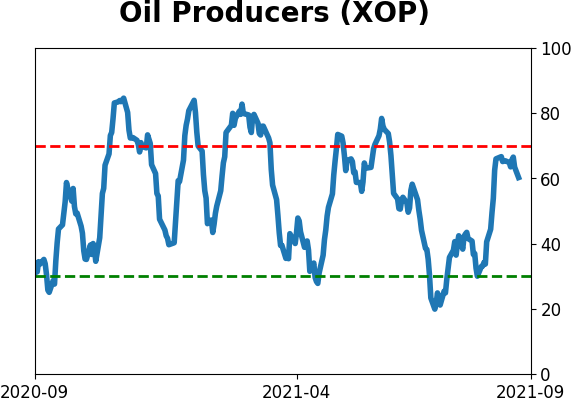
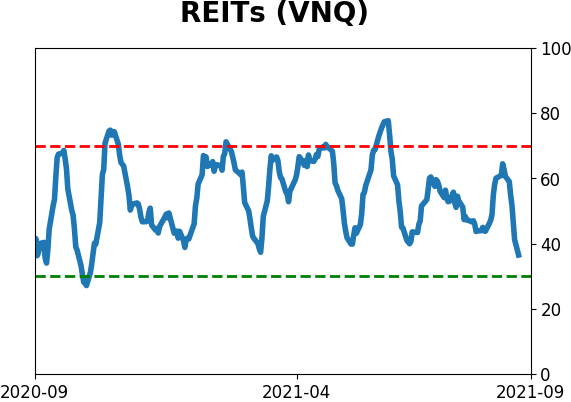
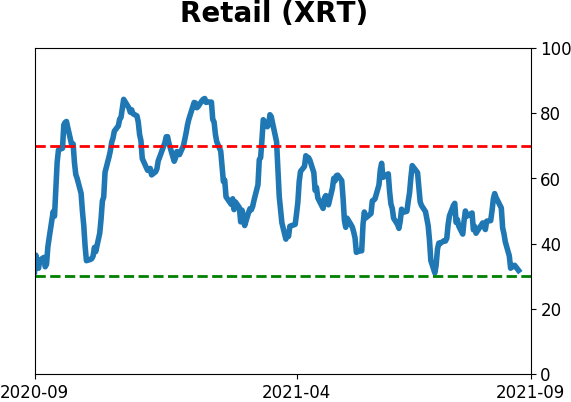
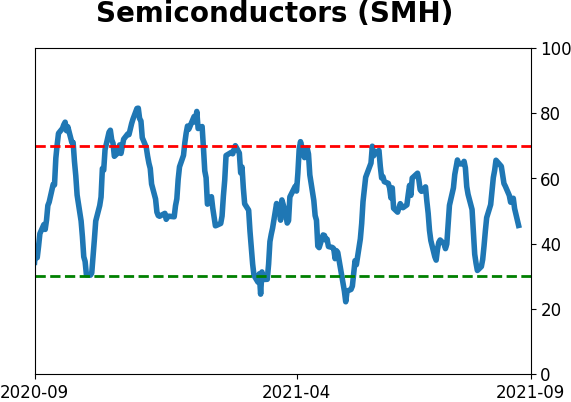
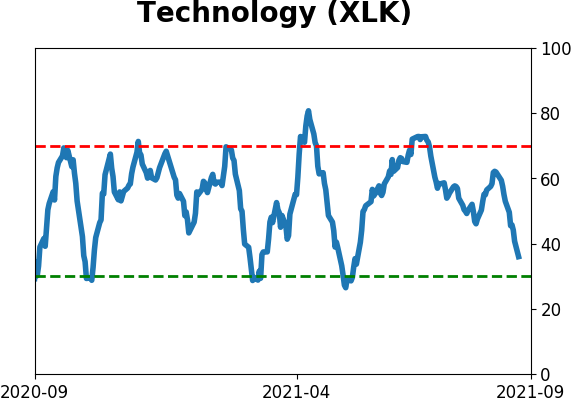
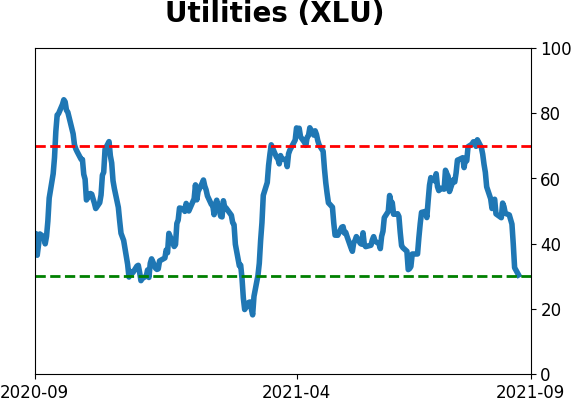
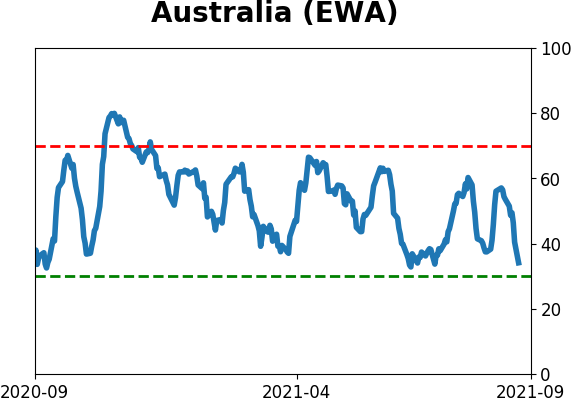
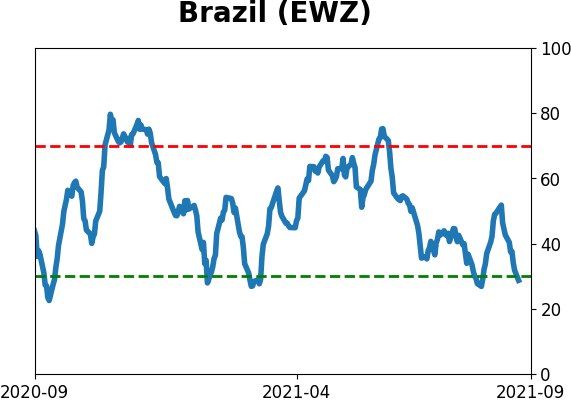
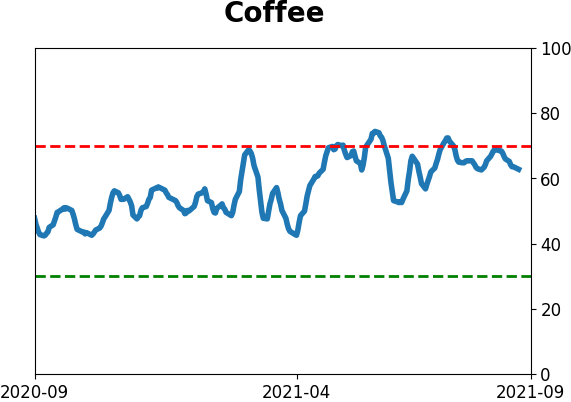
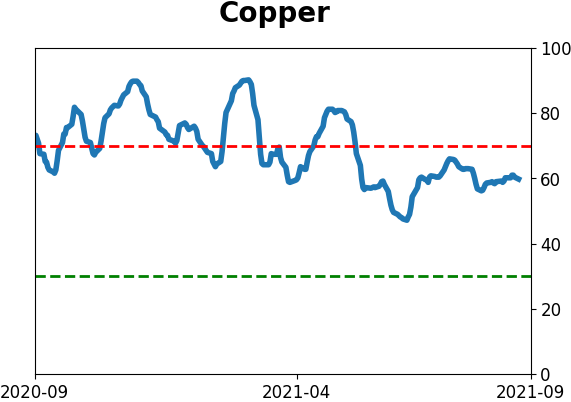
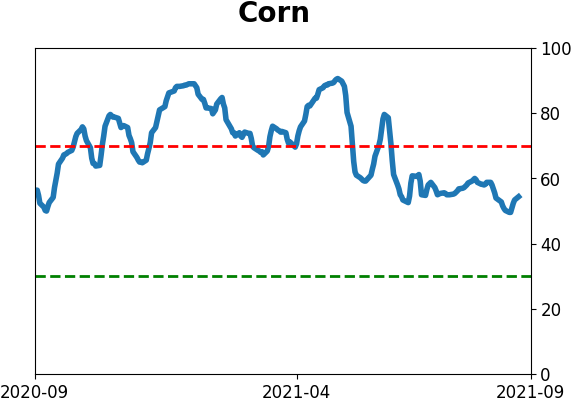
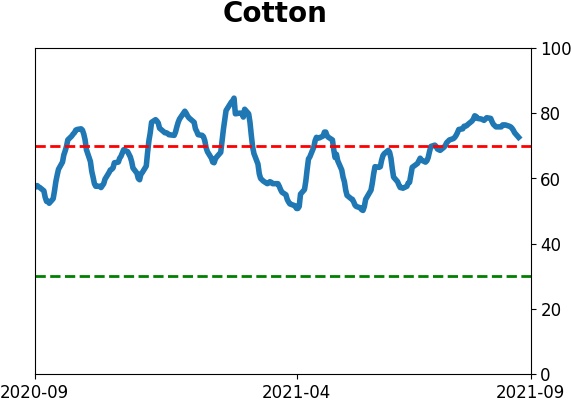
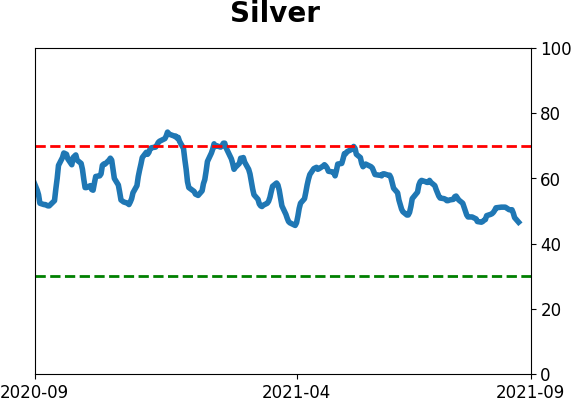
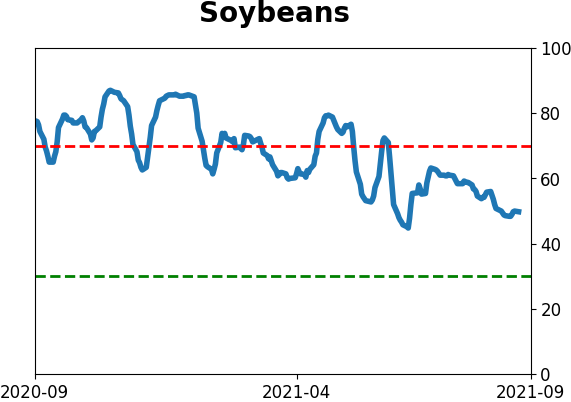
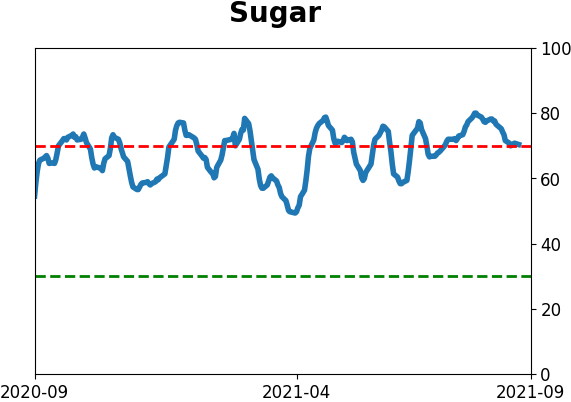
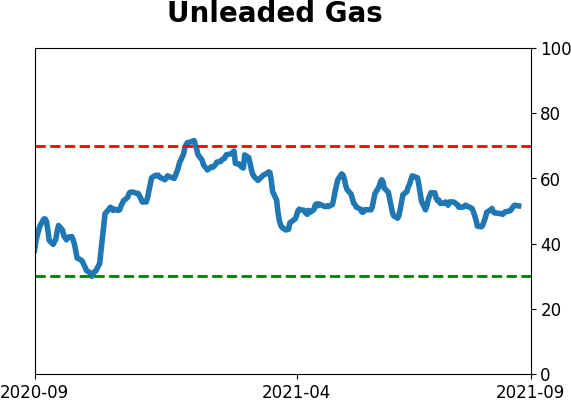
Optimism Index Thumbnails
|
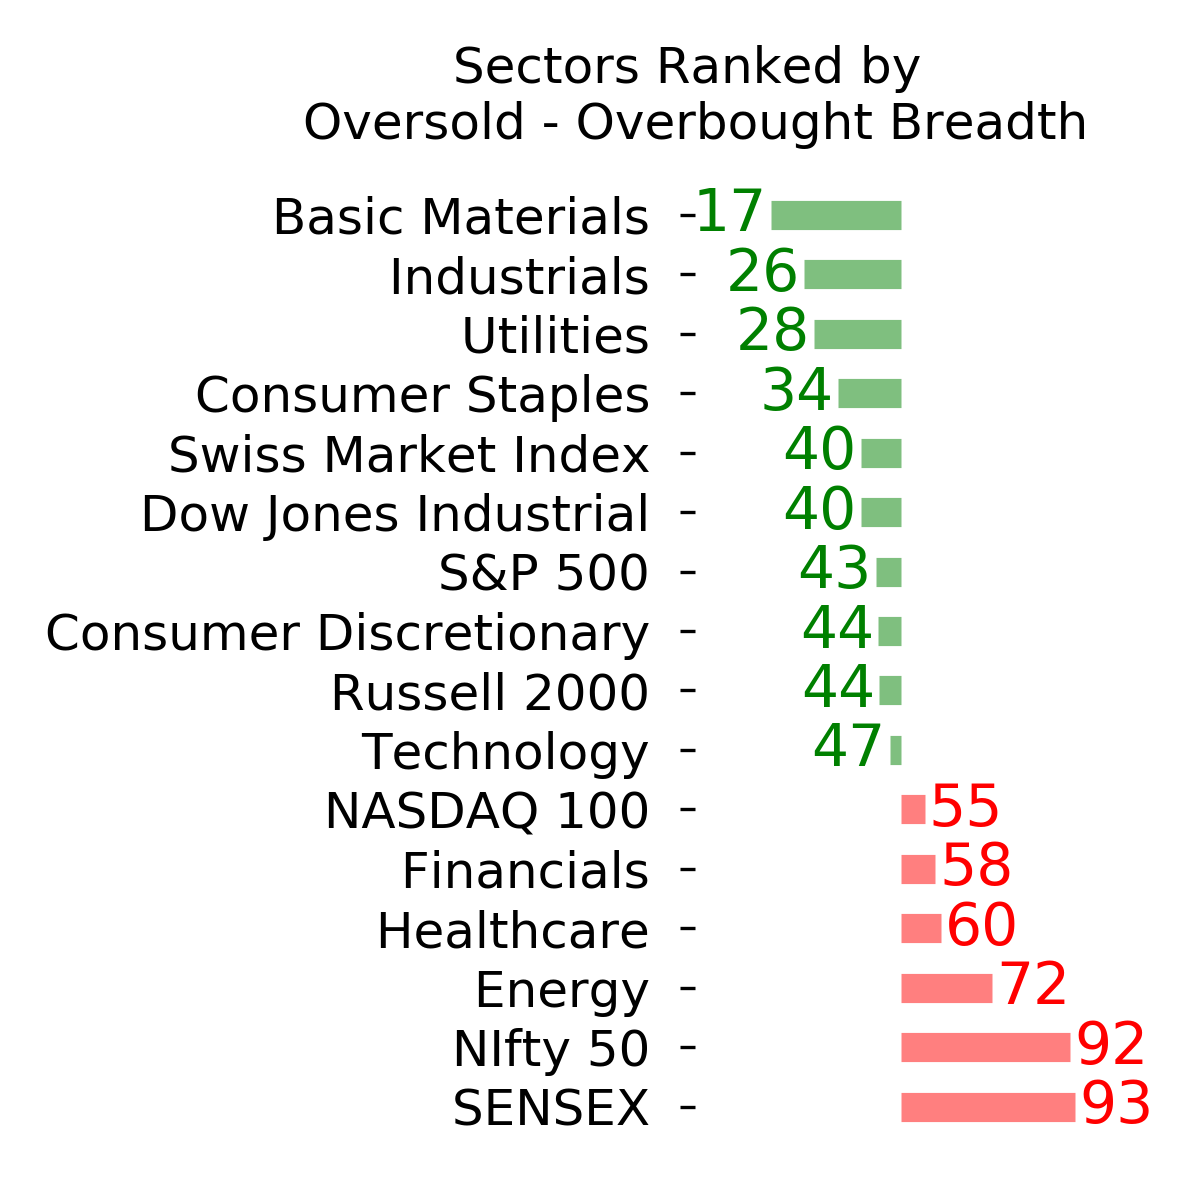
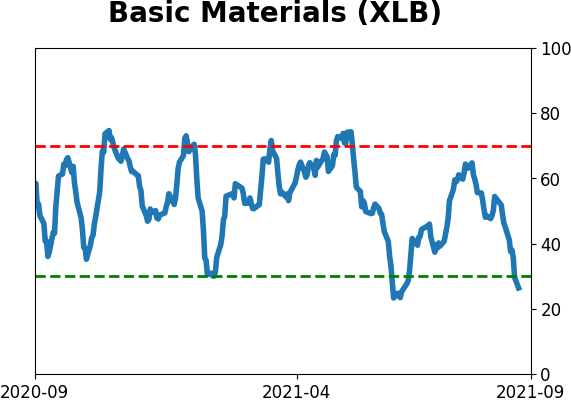
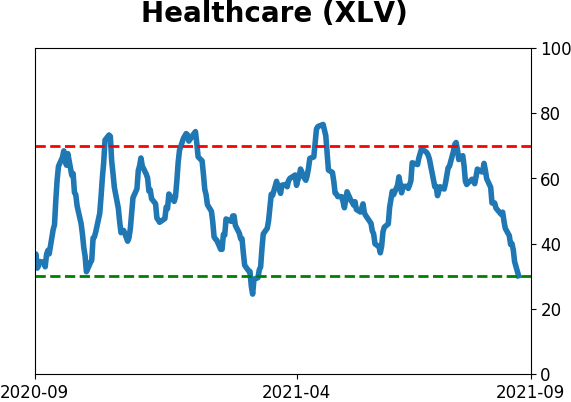
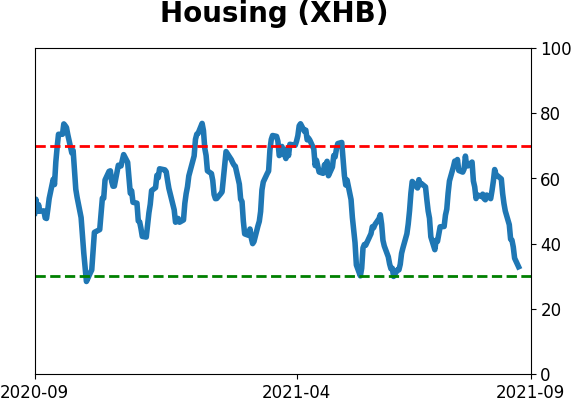
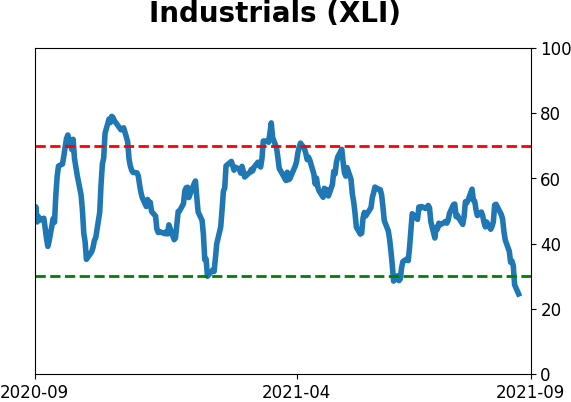
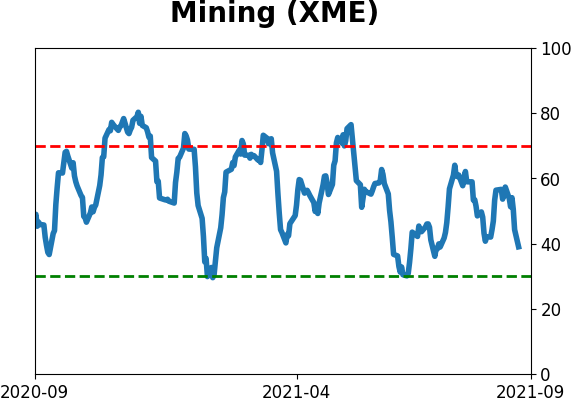
Sector ETF's - 10-Day Moving Average
|
|
|
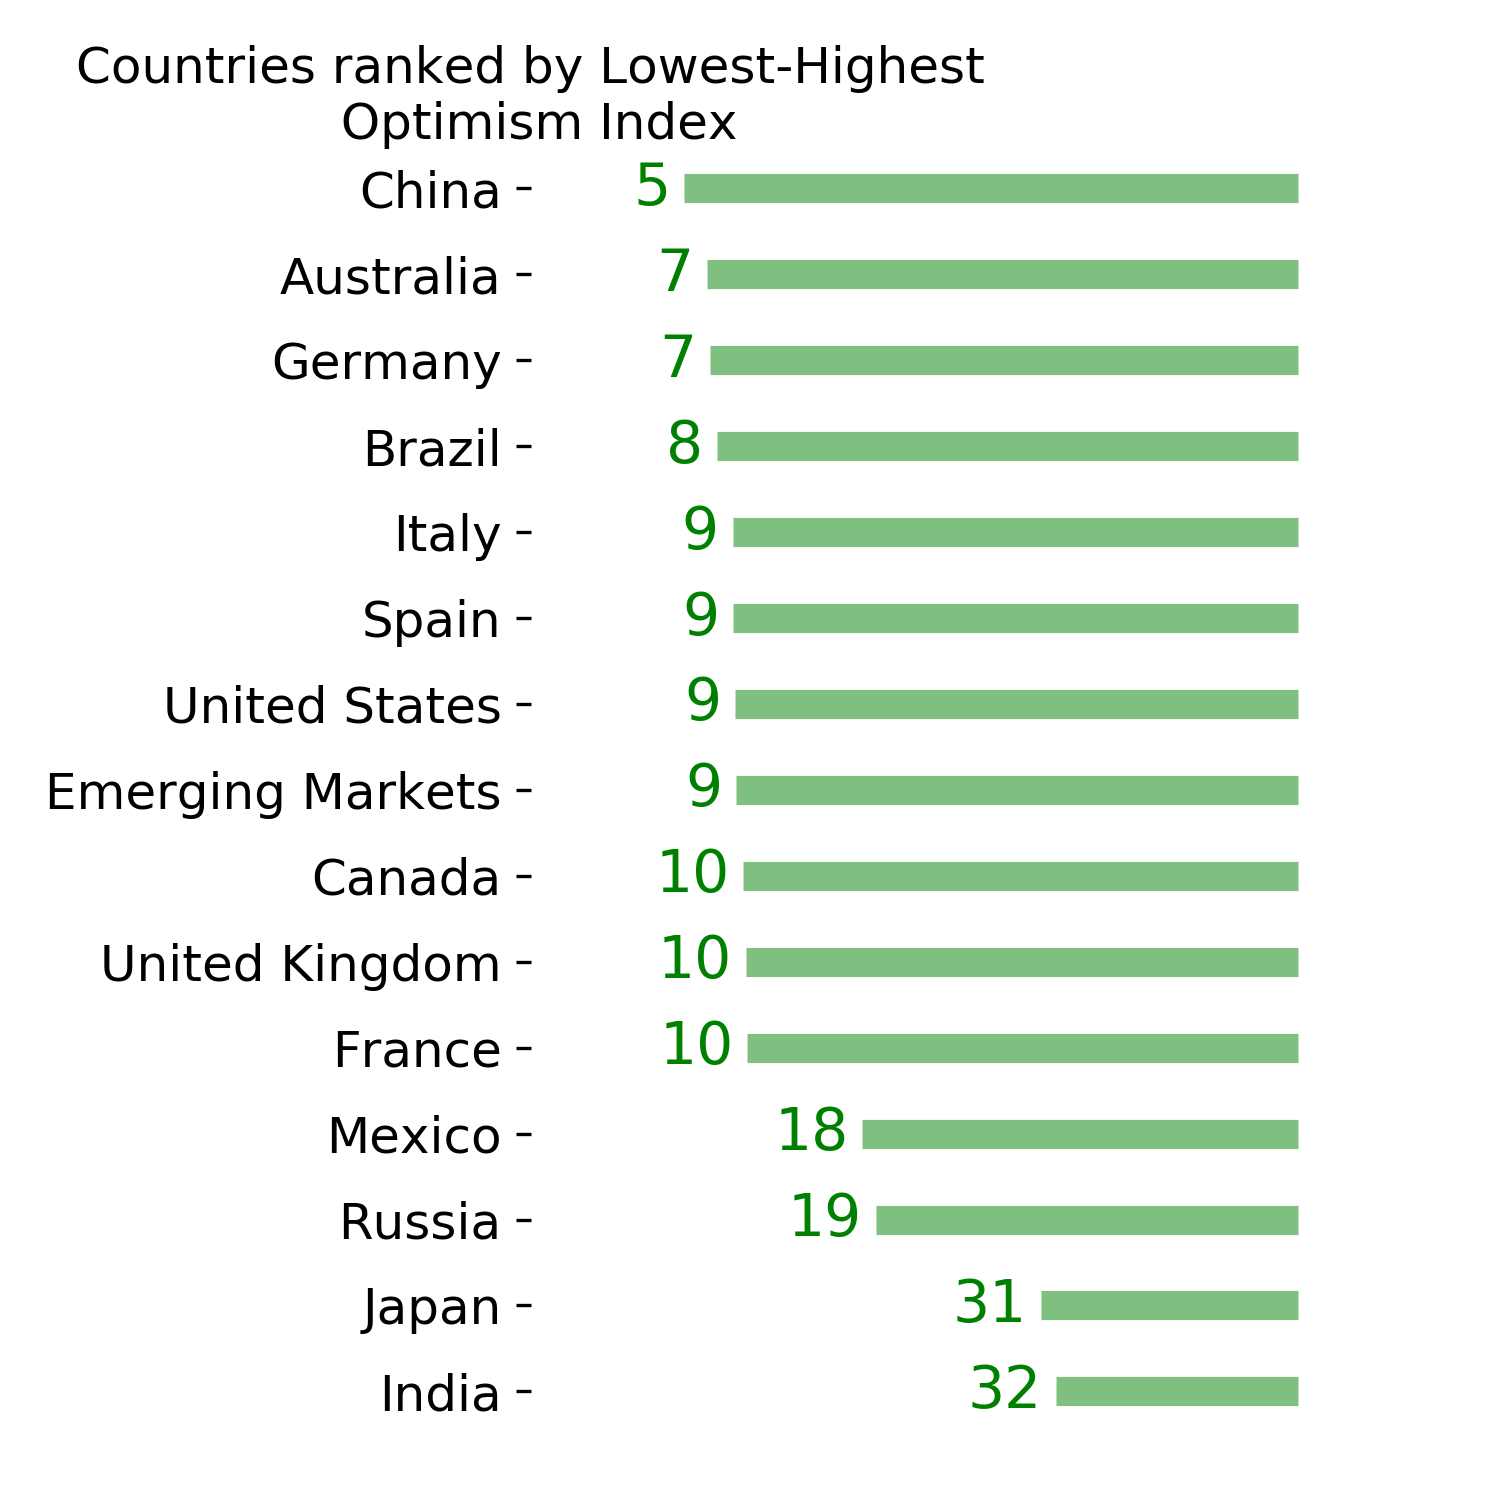
Country ETF's - 10-Day Moving Average
|
|
|
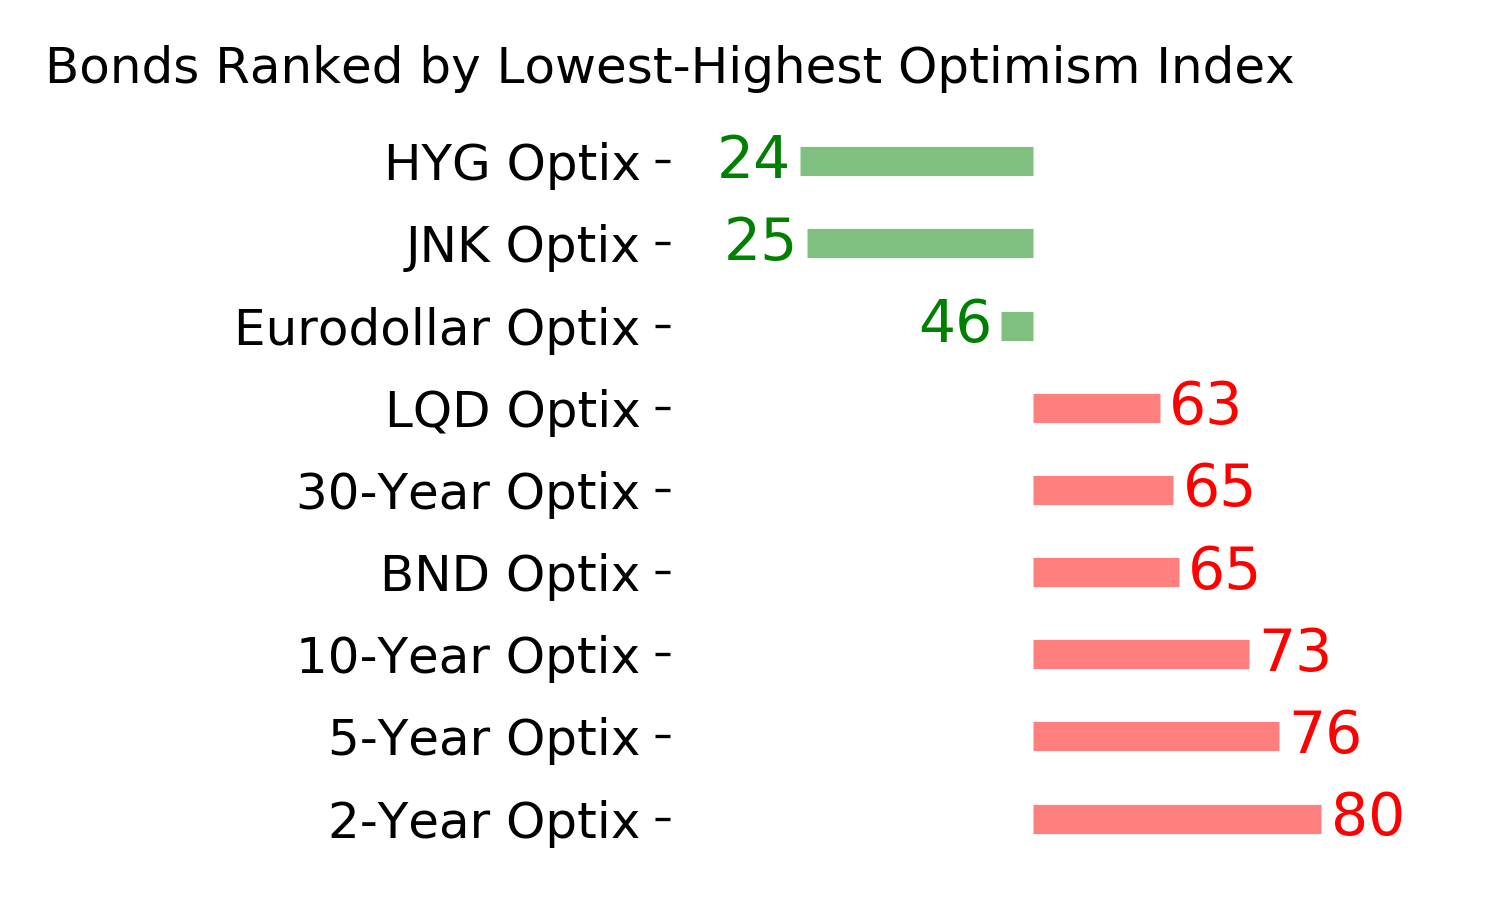
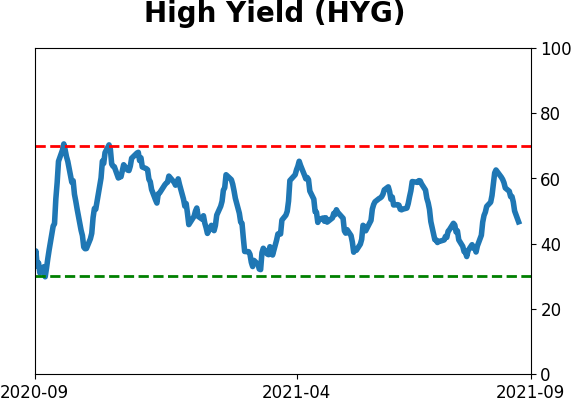
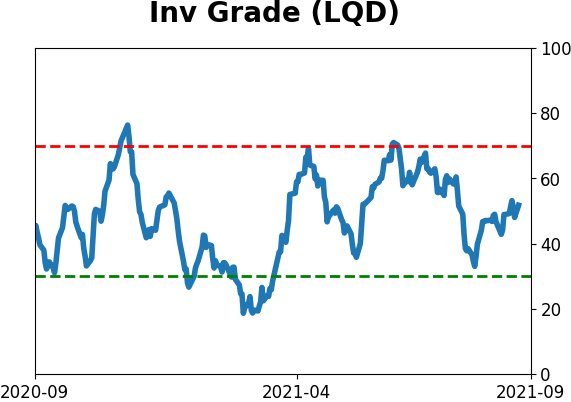
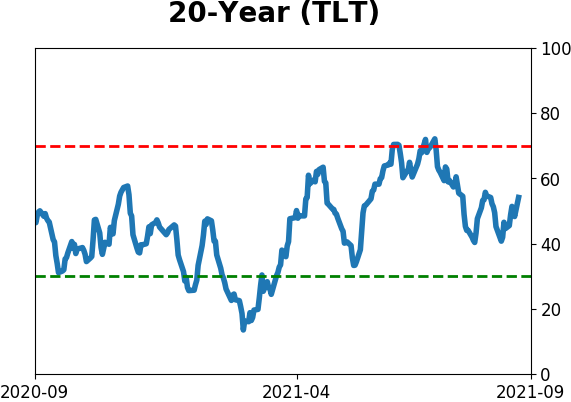
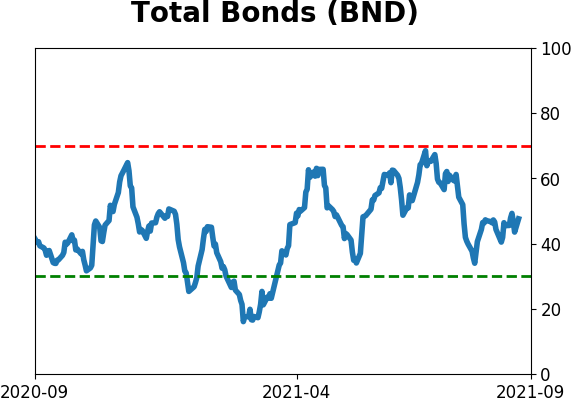
Bond ETF's - 10-Day Moving Average
|
|
|
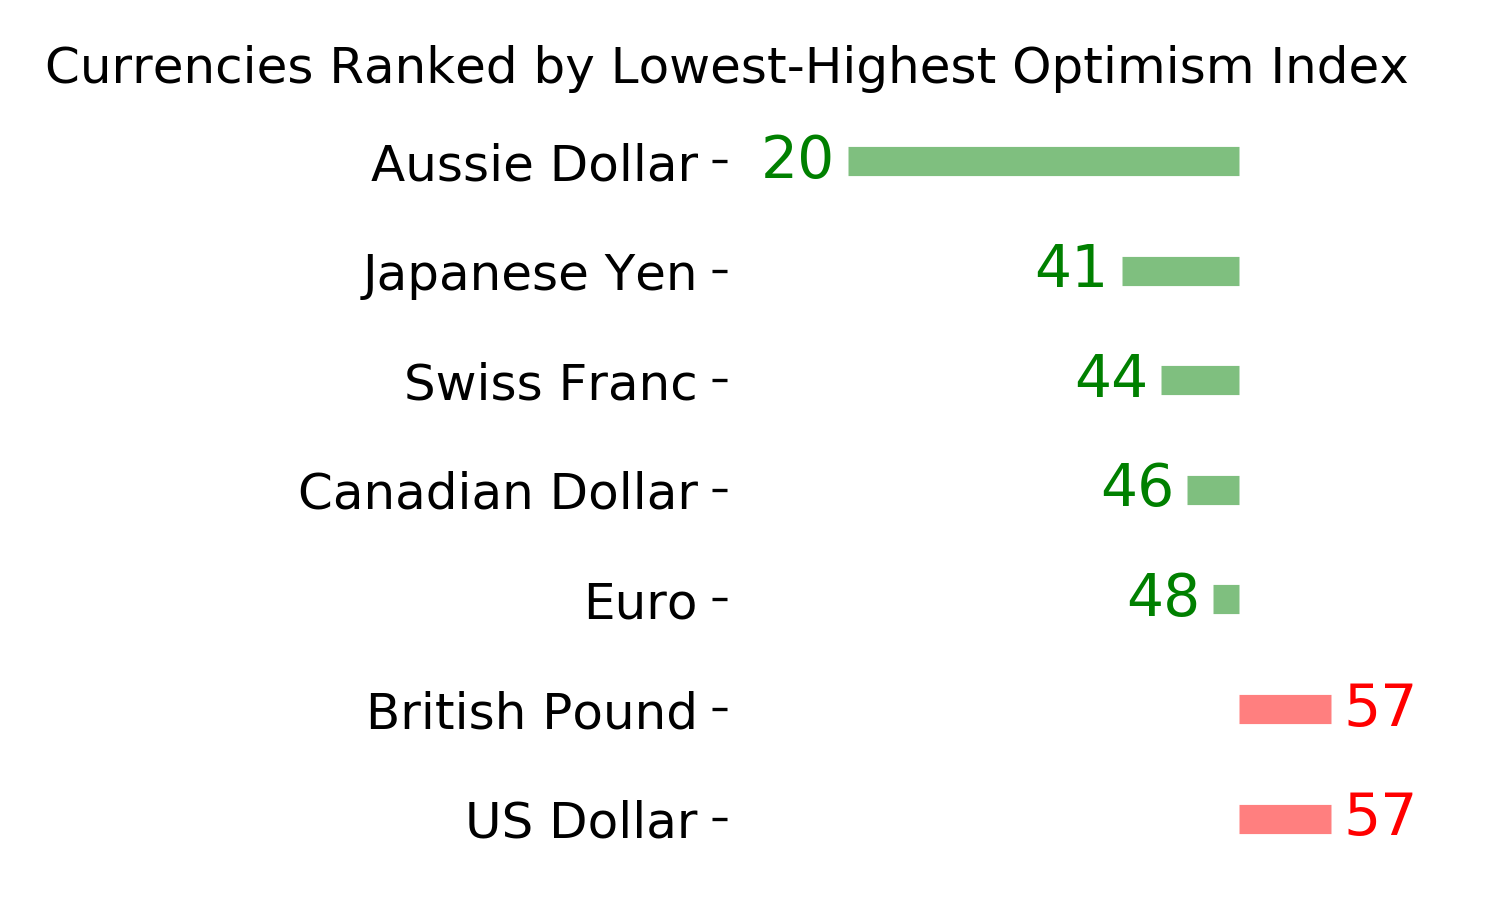
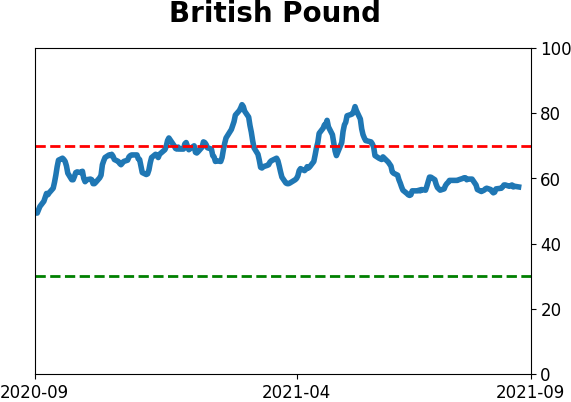
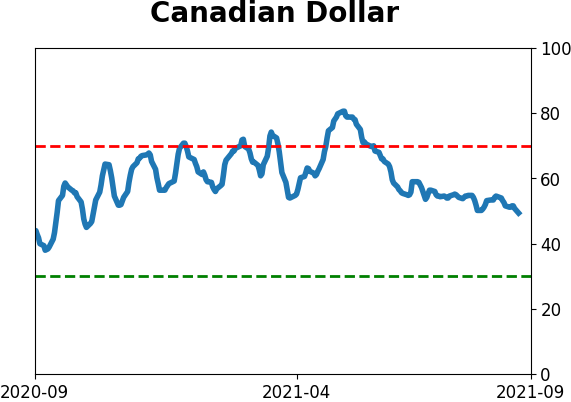
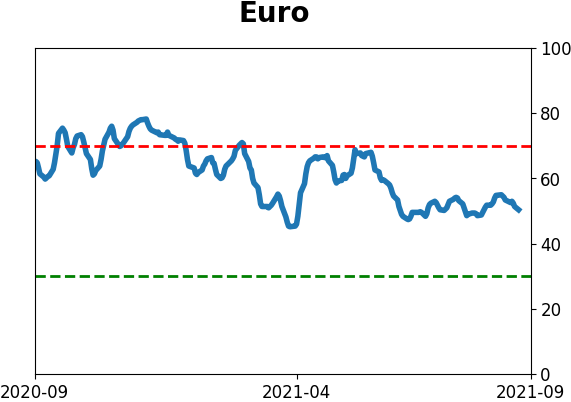
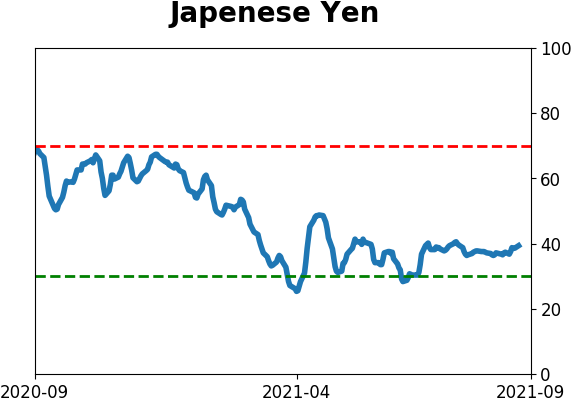
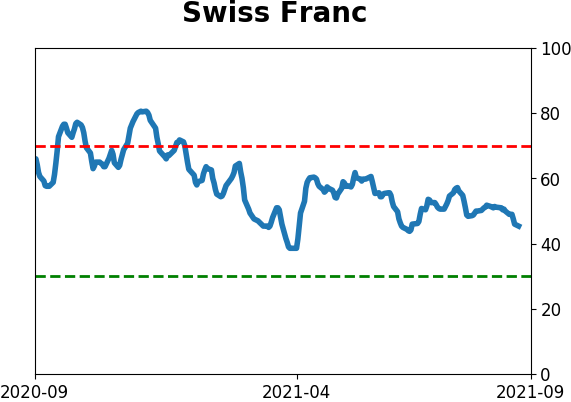
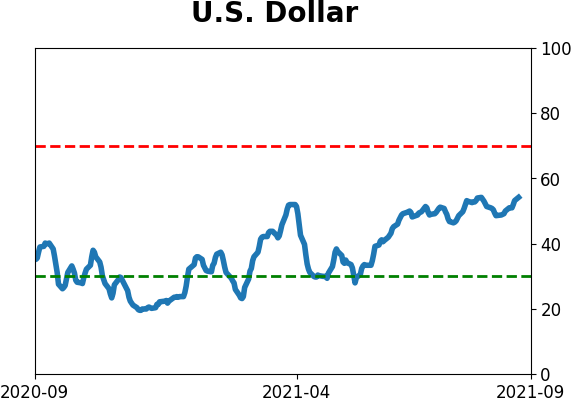
Currency ETF's - 5-Day Moving Average
|
|
|
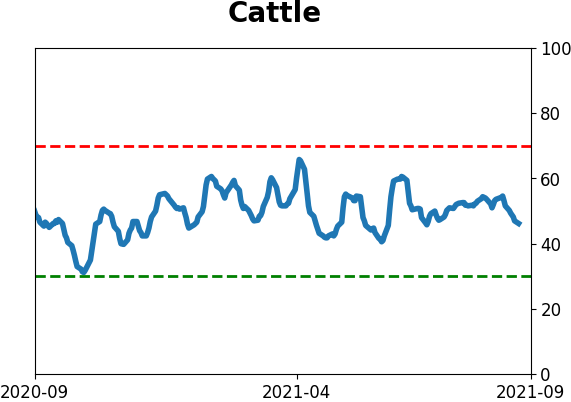
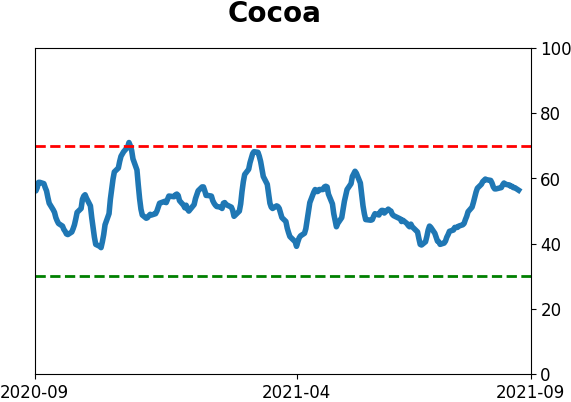
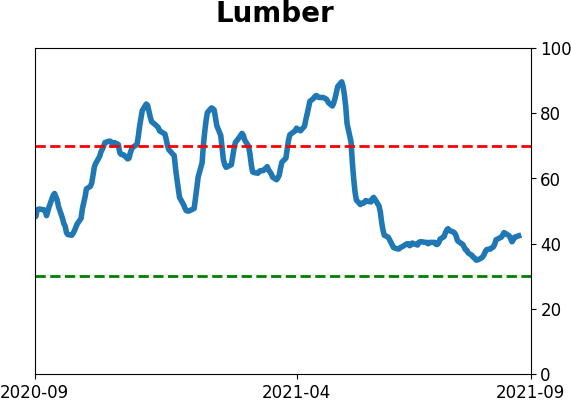
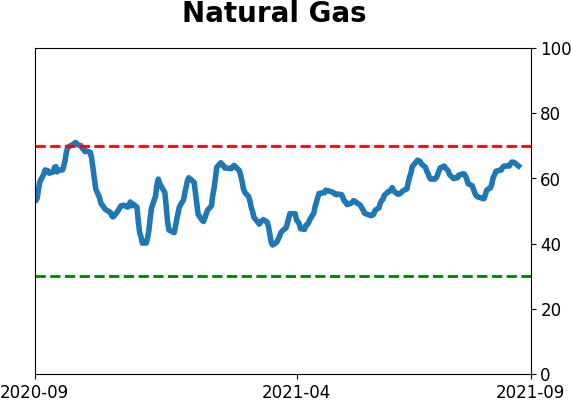
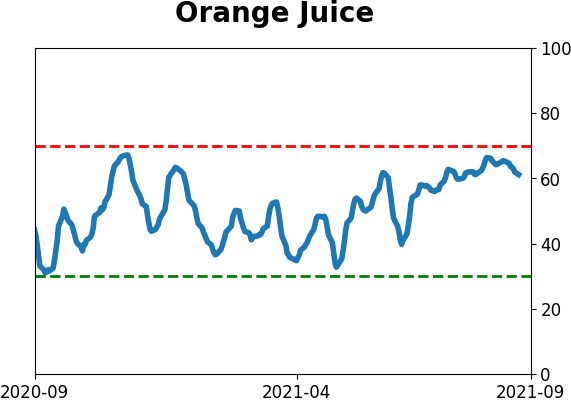
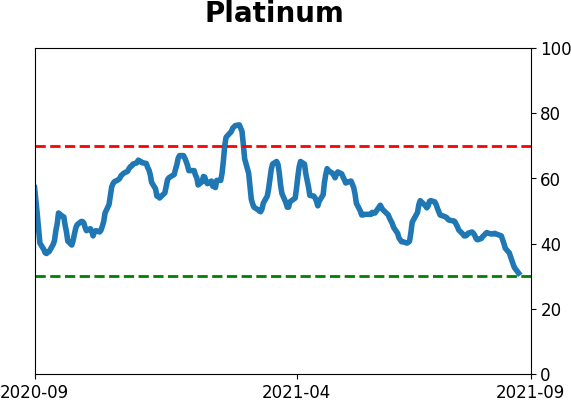
Commodity ETF's - 5-Day Moving Average
|
|